

Assessment of Surface Water Quality in the Baia Mare Area, Romania

1
Department of Environment Engineering and Entrepreneurship of Sustainable Development, Faculty of Materials and Environmental Engineering, Technical University of Cluj-Napoca, 103-105 Muncii Avenue, 400641 Cluj-Napoca, Romania
2
INCDO-INOE 2000, Research Institute for Analytical Instrumentation, 67 Donath Street, 400293 Cluj-Napoca, Romania
*
Authors to whom correspondence should be addressed.
Water 2022, 14(19), 3118; https://doi.org/10.3390/w14193118
Submission received: 26 August 2022
/
Revised: 29 September 2022
/
Accepted: 29 September 2022
/
Published: 3 October 2022
(This article belongs to the Special Issue Water Quality Management and Pollution Control under the Impact of Human Actions and Climate Change)
Abstract
:Baia Mare area represents one of the most important mining areas of Romania. Although the mining activities carried out here are currently inactive (since 2012), they generated residual pollution that negatively influences all the environmental factors. The aim of the study is to evaluation of the quality of surface water from the vicinity of the city of Baia Mare, Romania. The surface water samples, collected in two distinct years (2021 and 2022), were analyzed to determine the concentration of heavy metals (Cd, Cr, Cu, Ni, Zn, Pb, Fe, Mn, and As) in order to establish the degree of contamination and the water quality through heavy metal evaluation index (HEI), heavy metal pollution index (HPI), and water quality index (WQI). The pH and the content of cations (Ca, Mg, Na, K) and anions (HCO3−, SO42−, Cl−) were also determined for complex characterization. The results showed that the water in the area had a high degree of pollution with high concentrations of Cr: 0.165–1.57 mgL−1, Ni: 0.01–0.718 mgL−1, and Cu: 0.036–0.195 mgL−1. The pollution indices showed an average level of heavy metal pollution for the collected surface water samples. The quality index demonstrated that all surface water samples in the study area were unfit for irrigation and drinking due to poor and very poor water quality.
1. Introduction
Water is an essential compound for life and natural processes, being an important climatic factor in supporting ecosystem development and a key component in the exchange of substances and energy in the hydrologic cycle. Water is a limited resource, which requires addressing water quality issues in order to ensure high-quality water resources for future generations [1]. Romania’s water resources consist of surface waters–rivers, lakes (≈90%), and groundwater (≈10%) [2].
Baia Mare region is known not only for its underground riches but also for being one of the most polluted areas in Romania due to the mining activities for the extraction and processing of ores with high content of Cd, Cu, Pb, Zn, and precious metals [3,4]. The soil in the Baia Mare mining area is contaminated mainly with Pb, Cu, Zn, and Cd, due to emissions and dispersion of pollutants resulting from mining and post-mining activities, as well as the ore processing industry or improper storage of tailings [3,4,5,6,7,8,9,10,11,12,13].
Previous studies have highlighted that there are many polluted areas in the Baia Mare area as a result of these activities, and the groundwater flowing through the existing mine drifts comes polluted to the surface [4,14,15].
In 2008, Levei et al. reported high concentrations of heavy metals in the water bodies nearby the tailing impoundments from Baia Mare, revealing the high impact of mining activities on Lapus River and its tributary water quality [4]. Moreover, during research conducted between 1999 and 2011, Smical et al. reported concentration of heavy metals in the waterbodies way above the guideline established by the Romanian legislation, with concentration of metals ranging between 0.022 and 0.175 mgL−1 for Cu, 0.58 and 1.3 mgL−1 for Zn, 0.02 and 0.14 mgL−1 for Pb, 0.022 and 0.043 mgL−1 for Ni, 0.022 and 0.045 mgL−1 for Cd, respectively [16].
All the previous studies indicate a high degree of pollution in the water bodies nearby Baia Mare. Moreover, there was no indication of water quality improvement over time, despite industrial activities gradually stopping from 2006 (2006–gold ore exploitation, 2008–copper production, 2012–lead production) [17,18].
Various studies carried out worldwide in countries such as Turkey, South Africa, and Cameroon have shown that surface waters with upstream mining or mining-specific activities had high concentrations of metals and poor or very poor water quality [19,20,21,22]. Mining activities have negative impacts on the environment, sometimes hundreds of kilometers away from the mining site.
Mining activities can cause negative effects on the quality of the environment and ecosystems (aquatic and terrestrial), thus affecting the sustainable development of the respective area [22,23,24].
Water quality can be assessed through water indices. The Heavy Metal Pollution Index (HPI) and the Heavy Metal Evaluation Index (HEI) are the most widely used indices when monitoring the metal content of water to determine the pollution status of ecosystems [25,26,27]. Horton proposed to apply the Water Quality Index (WQI) to assess water quality from a physico-chemical point of view [28]. WQI is a complex index for all water body types characterization and a useful tool for determining water quality, indicating the overall impact of chemical composition on water quality [29,30,31,32,33,34,35,36].
At the present time, the research on the impact of mining activities on environment quality is still relatively insufficient and lacks systematic development, although this subject has been receiving more attention recently. There are no recent data regarding the surface water nearby the Baia Mare mining area. Considering the pollution history of the area and the color of water bodies, it is highly important to monitor the environmental evolution of this area in order to find a trend in the surface water quality and to observe the influence of industrial activities. Thus, the objectives of this study were (i) to determine the spatial and temporal distributions of heavy metals in the surface waters near Baia Mare, (ii) to improve the understanding of potential pollution sources for representative industrial settlements in the study area, (iii) to explore the degree of heavy metal contamination in the stream using contamination indices (HPI, HEI) and the water quality index (WQI).
2. Materials and Methods
2.1. Study Area
The present study was conducted in the Baia Marea area, an important mining area in Romania. The city of Baia Mare is part of Maramureş County, located in NW Romania. With a total surface area of 6304.4 km2 and a varied relief, Baia Mare occupies part of the Eastern Carpathians and part of the Transylvanian Plateau. The hydrographic network is rich and belongs to the Somes and Tisa rivers basins, disposing of numerous lakes. The agricultural area is around 309,325 ha and the forestry area comprises 288,572 ha of the forest [37,38].
The most important mining centers of NV Romania are located in the territories surrounding Baia Mare. The county region disposes of many natural resources, such polymetallic ores, auriferous and copper ferrous mineralization, iron and manganese ore accumulations, bentonite deposits, shale ore accumulations, rocks or gravel, and sand [37,38].
For a long period, Maramureş County was known as a mono-industry one, the non-ferrous ore exploitation and processing representing the core activity [37,38].
The main mining facilities developed in the area consisted of extraction and processing of non-ferrous sulfidic ore in order to obtain Pb, Cu, Zn, and precious metals concentrates. Since 2006, the metallurgical industry in the Baia Mare area has considerably reduced its ore extraction and processing activity by reducing production capacity or closing them. Even so, there is no record of attempts to reduce or limit the diffusion of pollution [37,38].
Due to economic reasons and non-compliance with European environmental requirements, the activity of extraction and processing units stopped permanently in the first decade of the XXI century. Even after that, many of the inactive sites are still sources of environmental pollution [37,38].
The main sources of soil and water pollution are represented by the affected improudments left destabilized or unrestored, the tailing dumps, tailing ponds, and the mine waters loaded with metals and non-metals [14,15,38].
Compared to the situation before 2012, air quality in Baia Mare has significantly improved, following the industrial enterprises’ closure trend, but also because of the investments in transport infrastructure, landscaping, and rehabilitation of the green area, as well as improvement of street sanitation. However, Baia Mare has considerable historical pollution, heavy metals being present in all environmental factors affecting ecosystems and population health [38].
2.2. Water Sampling and Analysis
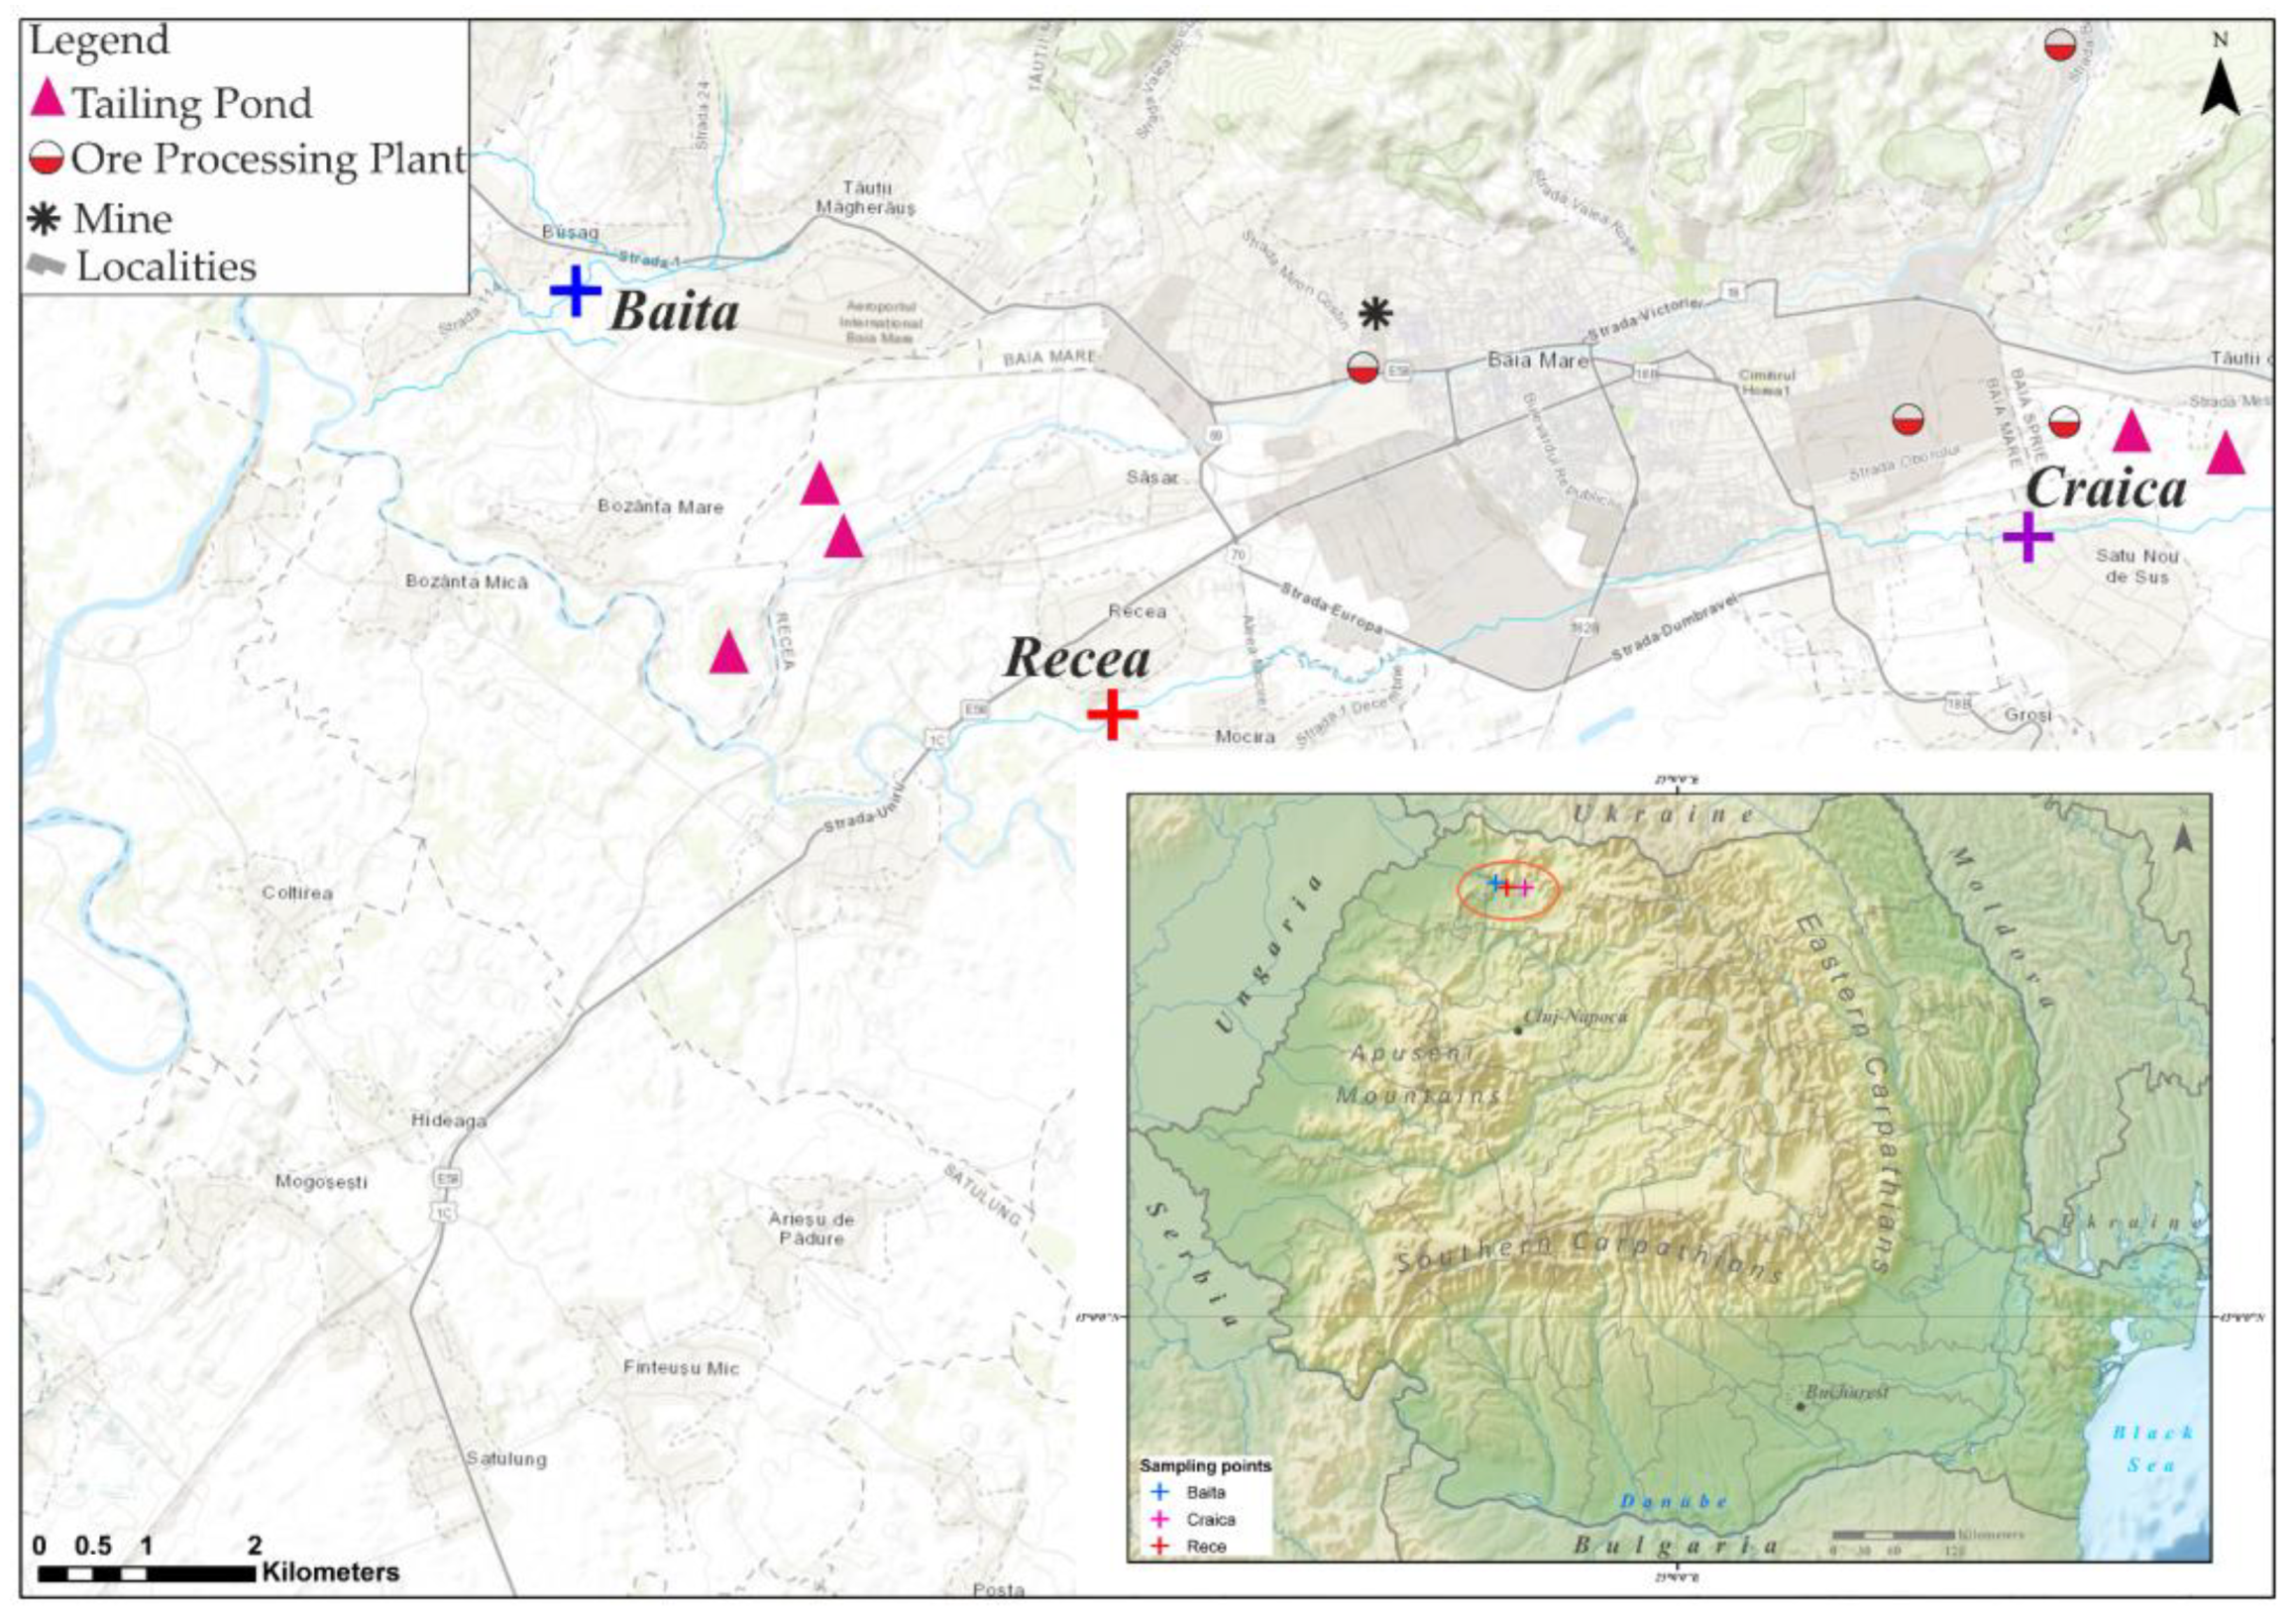
In order to assess the surface water quality and the impact of the previous mining activities on it, surface water samples were collected in June 2021 and 2022 from 3 sampling locations (Figure 1), in polyethylene bottles pre-washed with 0.1 N HNO3 from river streams: Recea (P1-47°37′40.14″ N, 23°30′35.36″ E), Baita (P2-47°38′59.36″ N, 23°25′35.05″ E), and Craica (P3-47°38′38.22″ N, 23°37′18.73″ E), according to SR EN ISO 5667/2017 [39]. Three samples were collected with a “Grab” device submerged at 20 cm from an area of 10 m2 in the study locations and immediately afterwards, they were transported in a refrigerated bag to the laboratory where they were put in the refrigerator (4 °C) and analyzed within 24 h. Each sample was analyzed separately, and for the interpretation of the results, the mean was presented. Over the years, the 3 sampling points showed visible signs of pollution, which was investigated by researchers to see the degree of pollution and the evolution of water quality over time. Starting from their results and being limited by material expenses, fewer samples were taken to highlight the historical pollution of the investigated area.
The pH was determined using a multiparameter (Hanna Instruments, Woonsocket, Rhode Island, United States). For the heavy metal determination, the samples were filtered with 0.45 µm cellulose acetate membrane and acidified with 65% HNO3. Cd, Cr, Cu, Ni, Zn, Pb, Fe, Mn, and As were determined through Atomic Absorption Spectrometry (AAS) using an AA-6800 Spectrometer (Shimadzu, Tokyo, Japan), while Ca, Mg, K, and Na, using an Optima 5300 DV inductively coupled plasma atomic emission spectrometer (ICP-OES, Perkin Elmer, Waltham, MA, USA). NO3−, NO2−, Cl−, SO42−, F−, PO43− concentrations were measured by ion chromatography using IC 761 Compact equipment (Metrohm, Herisau, Switzerland). Anions from the samples are separated through the anions exchange column and detected with the help of a conductivity detector. Samples were directly injected into the equipment, characterized by a flow of 0.7 mL/min, 7.5 mPa pressure and electrical conductivity of 15.0 μS/cm electrical conductivity. Anions are separated through the anions exchange column and detected with the help of a conductivity detector. Bicarbonates (HCO3−) were determined by titration with 0.1 N HCl in the presence of a bromocresol green indicator. The limit of detection (LOD) was calculated as the ratio between 3 times the standard deviation resulting from 10 measurements of the reagent blank and the slope of the calibration curve (Table 1).
For the quality of the results, calibration standards and procedural blank measurements were used. Standard solutions containing 1000 mgL−1 Cl−, 1000 mgL−1 NO3−, and 1000 mgL−1 SO42− (Certipur, Merck, Darmstadt, Germany) and nitrite standard solution (1000 mgL−1 NO2−, Certipur, Merck, Darmstadt, Germany) were used for the calibration of the ion chromatograph and multi-element standard solution (ICP multi-element Merck, Darmstadt, Germany) was in the case of the spectrometer calibration. The accuracy of the determination was tested by analyzing the metal concentration of the European Reference Material (ERM-CC018) Standard concentrations (BAM Division I.1, Berlin, Germany), in the case of metals and IC1 Multi-element standard (CertiPUR Merck, Darmstadt, Germany), for anion determination. The mean recoveries ranged between 97% and 104% for the metals and between 98% and 102% for the anions. All analyses were executed in triplicate, and the data are expressed as average ± standard deviation (SD).
2.3. Water Pollution Assessment
The heavy metal pollution index (HPI) and heavy metal evaluation index (HEI) were applied to determine the pollution status of dissolved heavy metals in the surface water bodies. The HPI is an assessment model that provides the aggregate influence of individual heavy metals on the overall quality of different types of water [42,43]. Six heavy metals (Cd, Cr, Cu, Ni, Pb, and Zn) were used to calculate the HPI, according to Equations (1) and (2) [44]:
where, Qi is the sub-index of the ith parameter, Wi is the unit weight of the ith parameter, n is the number of chemical parameters considered, Mi and Si are the concentration of the monitored parameter and the standard maximum values allowed (mgL−1), according to the Romanian Regulation and the European Directive on water quality [45,46].
The HEI is another water quality assessment tool, providing insight into the overall quality of water sources in relation to heavy metal content, which is consistent with the HPI method. HEI is calculated based on Equation (3) [47,48].
where, Mi is the determined concentration of the ith parameter (mgL−1), Si is the maximum allowable concentration of the parameters (mgL−1).
2.4. Water Quality Index (WQI)
In this method, the quality of water is evaluated by the calculation of Water Quality Index (WQI). Adimalla et al. proposed a methodology of computing WQI in four steps [28,29]:
- (a)
- the assignment of the weights (wi) for each physico-chemical parameter based on its importance for the quality of the surface water;
- (b)
- the calculation of the relative weight (Wi) using Equation (4);
- (c)
- establishing the quality rating (qi) according to Equation (5);
- (d)
The results obtained from the calculations of indices were interpreted according to the values of the indices presented in Table 2.
3. Results and Discussions
3.1. General Characteristics of the Surface Water
The spatio-temporal variability of surface waters around the globe, regarding the physical, chemical, and biological parameters, has been investigated in several studies. The quality of the surface water is given by the interaction of the pollutants existing in the water and their solubility capacity [52,53,54,55]. The monitoring study was conducted in the warm seasons (June 2021 and 2022). The sampling campaign periods were not characterized by high precipitation amounts, therefore, the low concentrations of the chemicals due to dissolution and washing by precipitations were avoided.
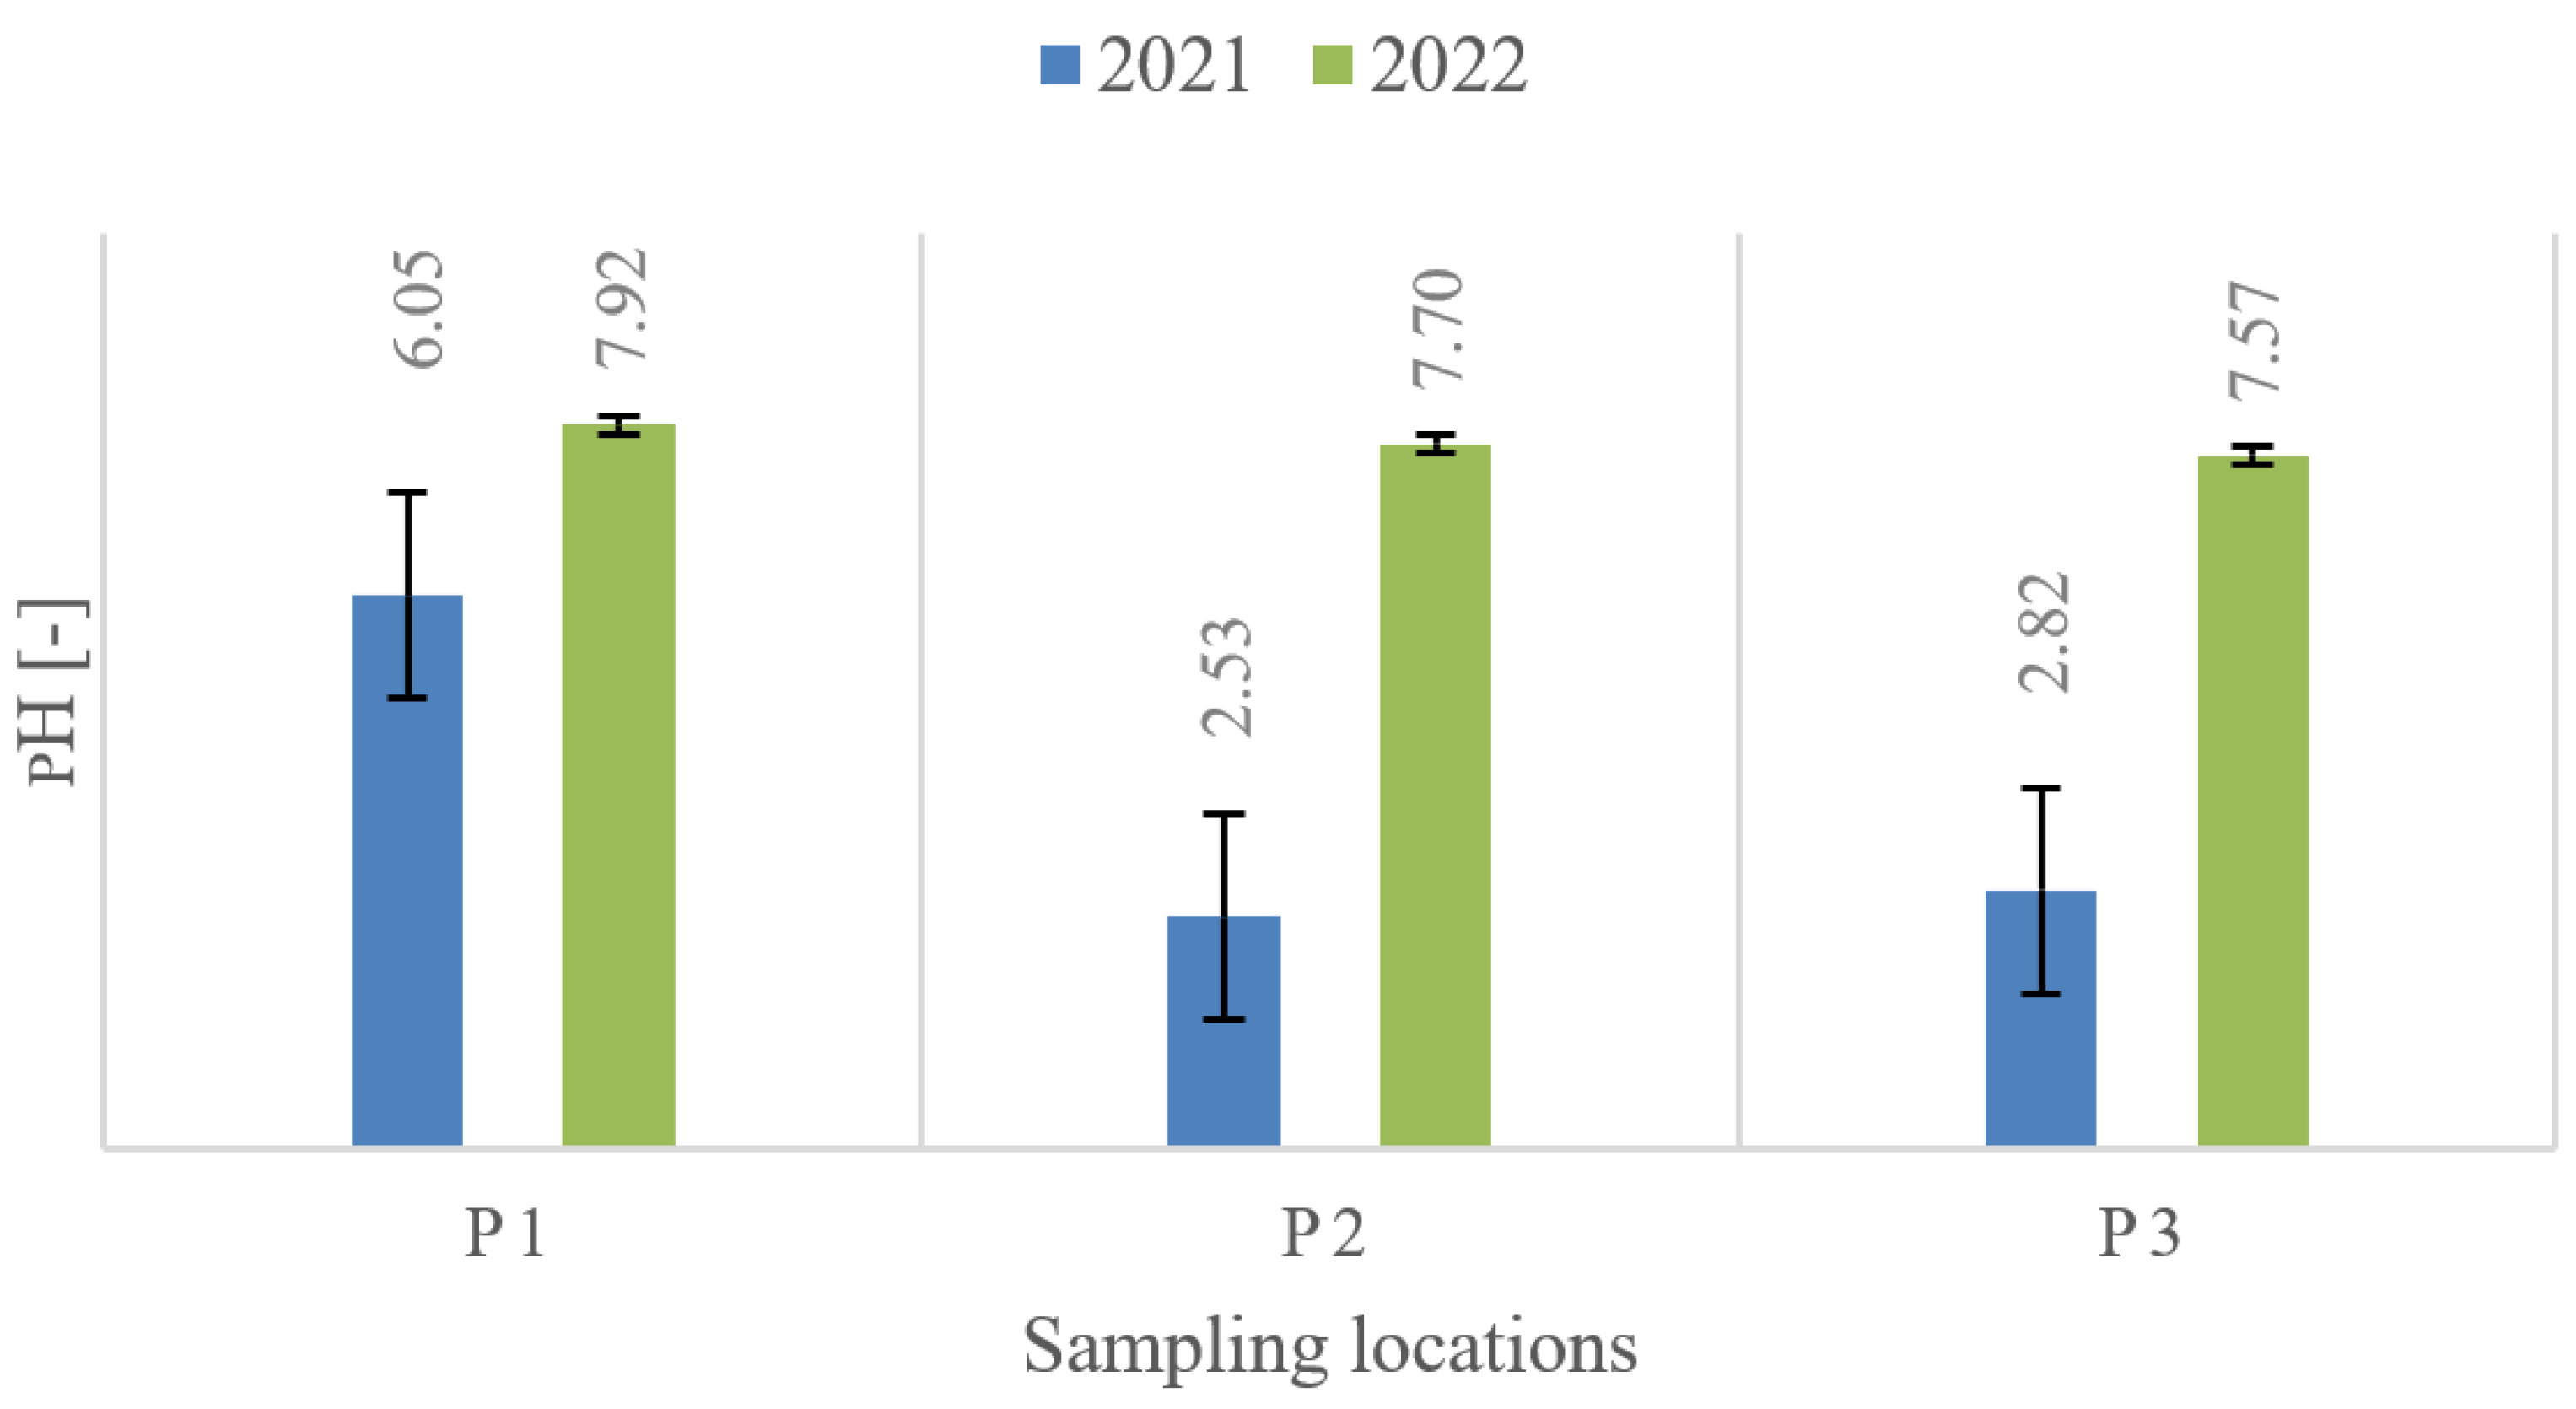
The pH of the surface water samples had high spatial variation in the case of the first sampling campaign (Figure 2). While P1 presented a slightly neutral pH (6.05), P2 and P3 showed a very acid character, 2.53 and 2.82, respectively. Similar results were obtained in the studies carried out by Coman et al. on samples taken from the Baia Mare area [14,15]. The slightly neutral pH of P1 could be due to the proximity of the sampling location to the spring point and to moderate anthropic interference, while the acid range of pH was obtained due to the intense anthropic activities carried out in the proximity of the water bodies. In the case of samples collected in 2022, the pH was constant, ranging between 7.57 and 7.92. The distinction of pH values noticed in the two years could be due to a higher river flow rate in the case of 2022, a flow rate difference able to neutralize the surface water pH and combat the acidification capacity of the pollutants. In the research carried out in other mining areas of the world, similar pH values were obtained: Rakotondrabe et al., (6.6–9.4) in the samples taken from the Lom River, which drains the vast majority of the Bétaré-Oya mining sites in East Cameroon [20] and Molekoa et al., (5.42–8.84) from the Mokopane mining area sites in Limpopo, South Africa [21].
The heavy metal concentrations from the surface water samples are presented in Table 3. This table also shows the values obtained by other researchers from samples taken from the investigated area in the period 1999–2011. For each of the sampled areas, a minimum of 3 samples were studied in order to assess the heavy metal concentration. The results were compared to the water quality guidelines established by Minister Order 161/2006/OD and Directive 2008/32/CE [45,46].
The distribution of heavy metals showed element-specific features and drastic temporal variation. Ni, Cu, and Zn presented a noticeable temporal variation, with higher values detected in 2022, while Cr showed higher values in the case of 2021 sampling campaign. The analyzed surface water samples showed a low spatial variation for Pb and Cd, in both years.
Average contents of Ni, Cr, and Cu in surface water samples were 0.577 ± 0.122 mgL−1, 0.572 ± 0.359 mgL−1, and 0.129 ± 0.068 mgL−1, in the case of samples collected in 2022 and 1.40 ± 0.163 mgL−1 and 0.048 ± 0.010 mgL−1 for Cr and Cu, in the case of 2021 sampling campaign respectively. Cd, Pb, and As were in a non-significant or a not detectable level in all studied surface water samples (every sample had their concentration lower than the LOD of the ith parameter), while Zn presented a concentration of 3.10 mgL−1 and 3.398 mgL−1, respectively, only in the case of P2. In the case of samples collected in 2022, Fe and Mn were also analyzed. The surface water samples had small amounts of Fe (0.07 mgL−1) in sample P2 and Mn (3.903 mgL−1) in sampling point P3, being below the limit values. The amount of Fe (0.07 mgL−1) in the water samples taken in 2022 is much lower compared to the samples analyzed by Smical et al. (0.55 mgL−1) in 2011 [16]. Instead, the amount of Mn (3.903 mgL−1) is almost four times higher than the value obtained by Smical et al., (1.18 mgL−1) [16].
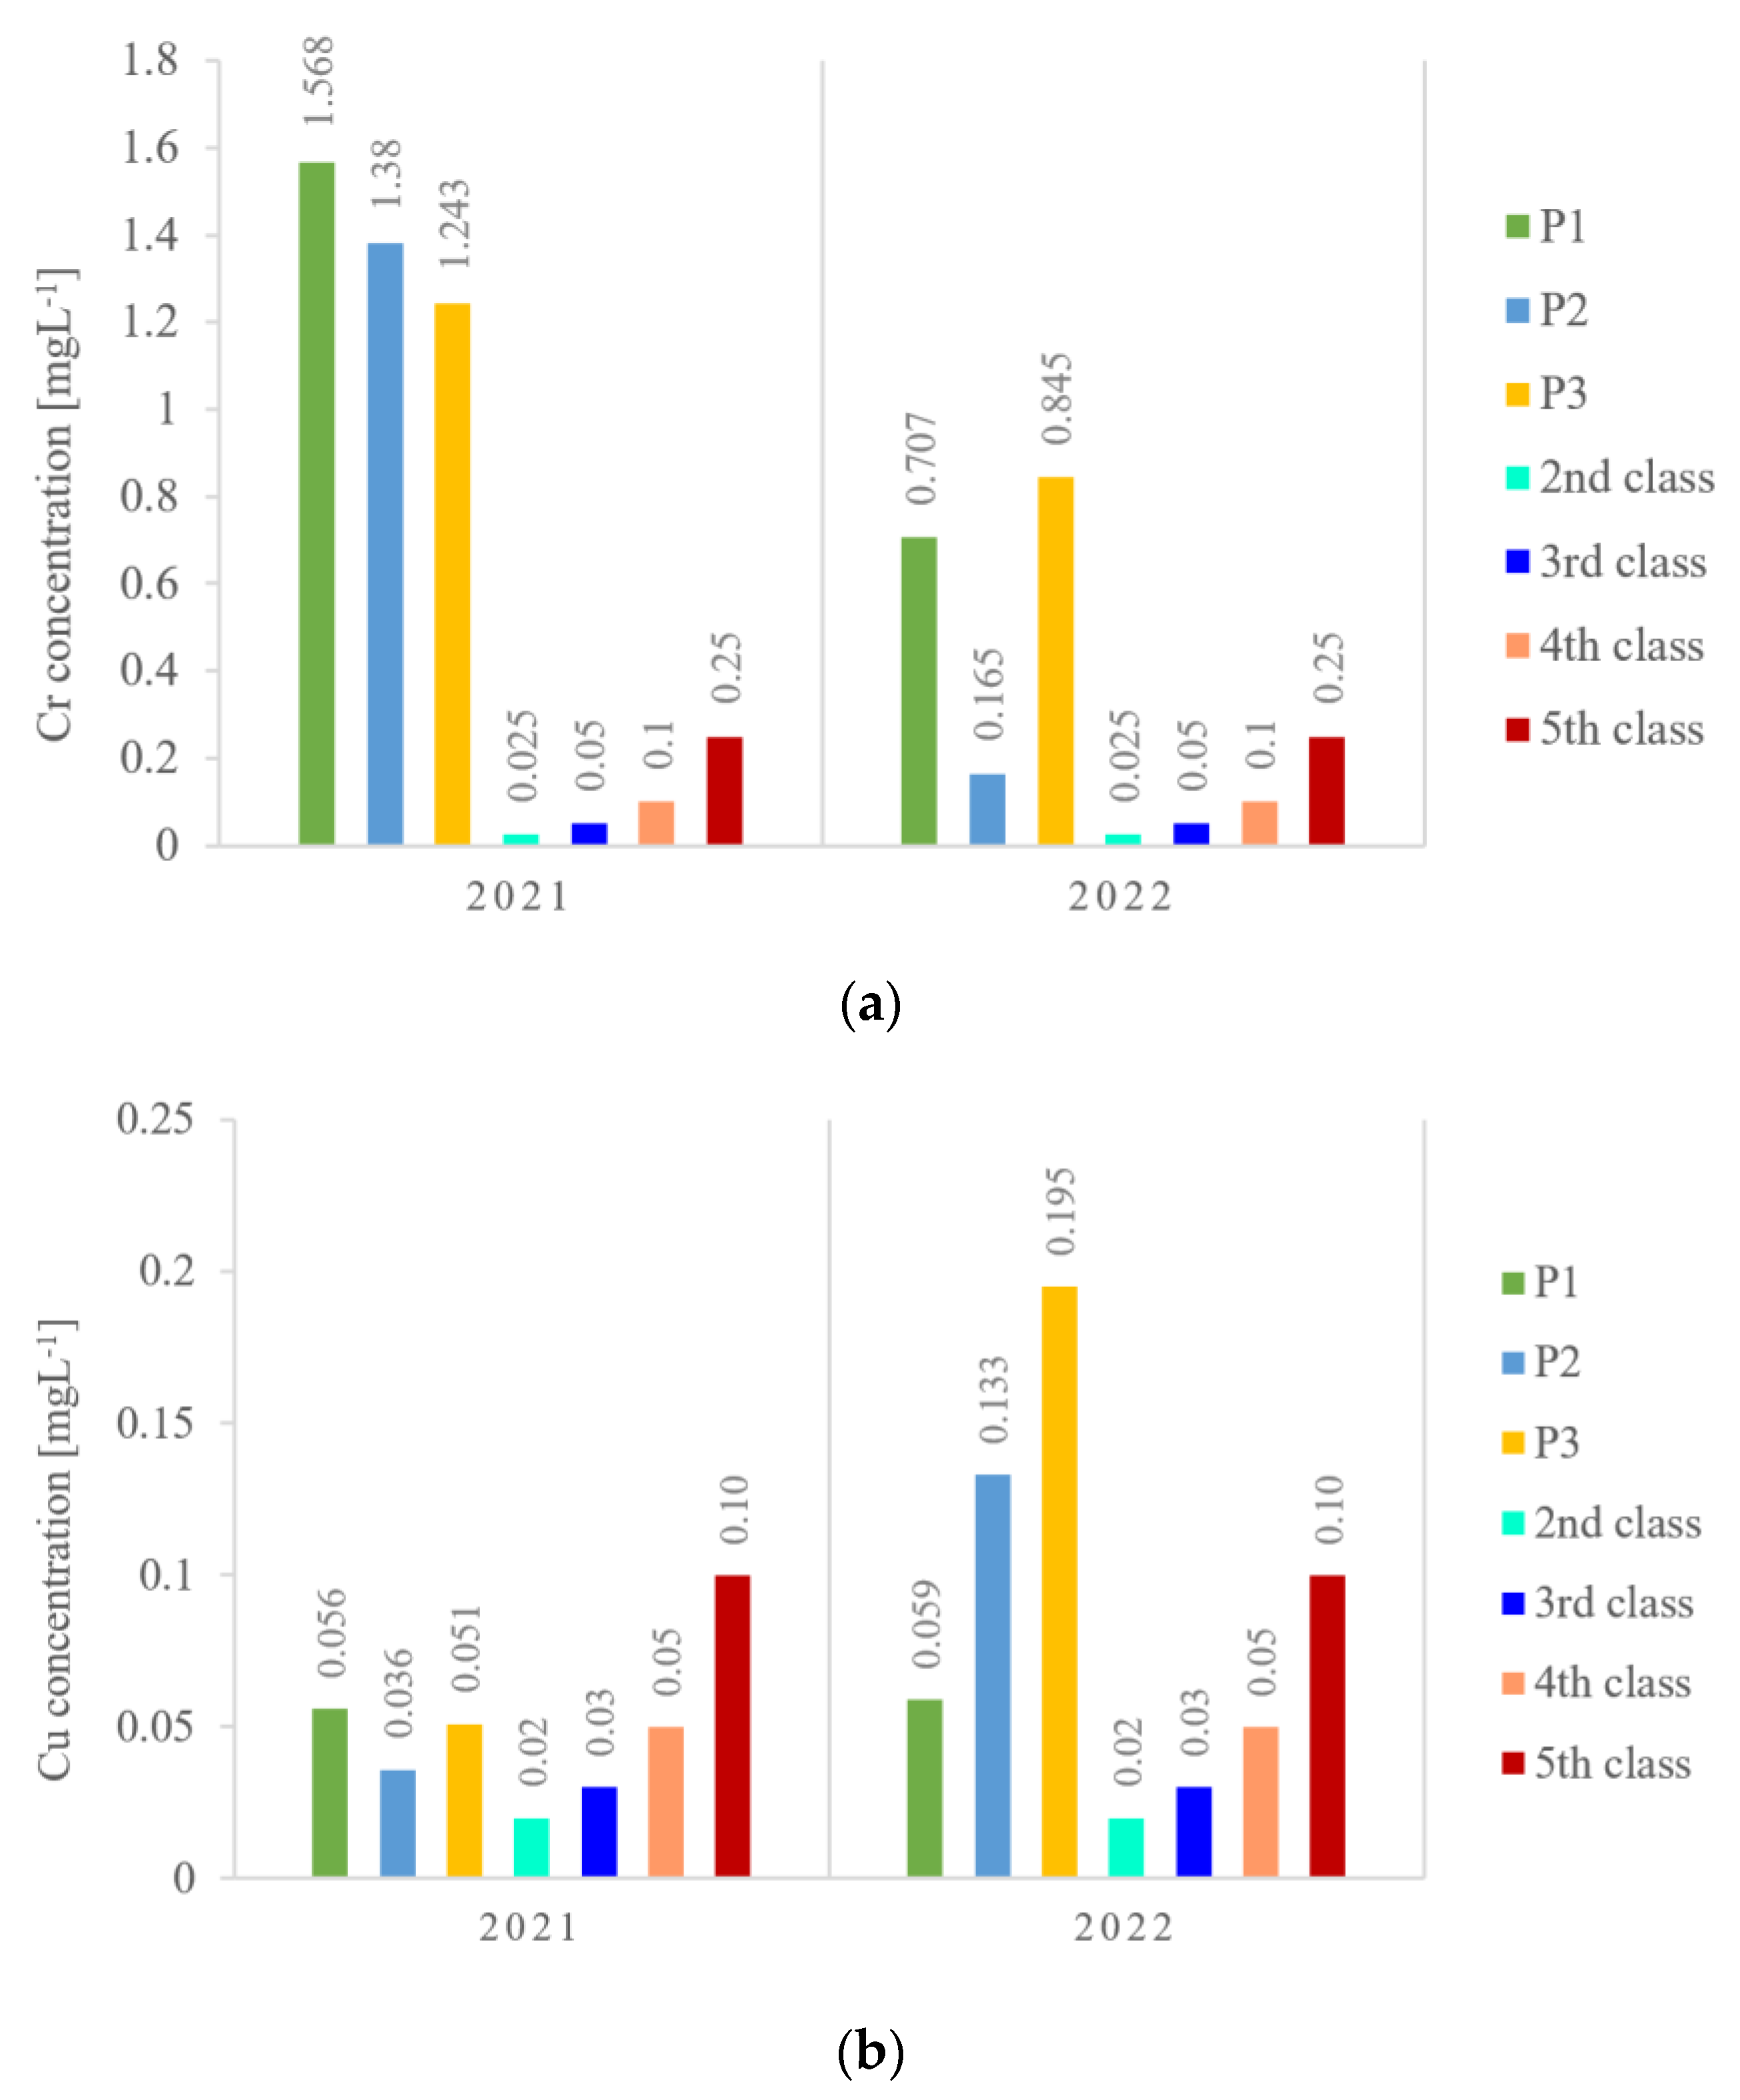
As it can be seen from Figure 3, the contents of heavy metals in surface water were higher than surface water quality guidelines established by Minister Order 161/2006/OD for the poorest quality class (Class V), which might be due to anthropogenic contamination load to the surface water. In 2022, the level of Cr was higher than the 5th quality class for P1 and P3, respectively, P2 and P3, in the case of Cu, while, for the 2021 sampling campaign, Cr indicated the 5th quality class for all sampling station, and Cu indicated 4th quality class for P1 and P2 and 3rd quality class for P3.
Analyzing the concentrations of metals in the surface water sampled over the years from the Baia Mare area, an increase was found between 1999 and 2009, followed by a sharp decrease in 2011 (Table 4) [16], while in the analysis of this study (2021, 2022), an increase in Ni, Cu, and Zn concentrations was found again. This may be due to the fact that the activity of one of the combined companies continued until 2012. In the case of Ni, much higher concentrations were observed (0.49–0.718 mgL−1) than those reported in 2011 (0.022 mgL−1) [16]. The same decreasing trend was observed in the case of Cu concentrations (0.059–0.18 mg L−1) from the samples from the year 2022 compared to those obtained by Smical et al. in 2011 (0.026 mgL−1) [16]. The greatest increase was observed in the case of Zn at P2 (3.39 mgL−1), increasing from 0.58−1 [16]. The concentration of Pb and Cd decreased (< 0.01 mgL−1) compared to 2011 (Pb: 0.02 gL−1 and Cd 0.022 mgL−1) [16].
The order of metals in the present study Cr > Ni > Cu > Zn > Mn > Fe > As > Pb > Cd is slightly different from that obtained by Rakotondrabe: Fe > Mn > Pb > Cr > Cu > Zn > Cd > As [20]. This is also due to the composition of the investigated mine as well as the investigated metals.
3.2. Cations and Anions Characteristics
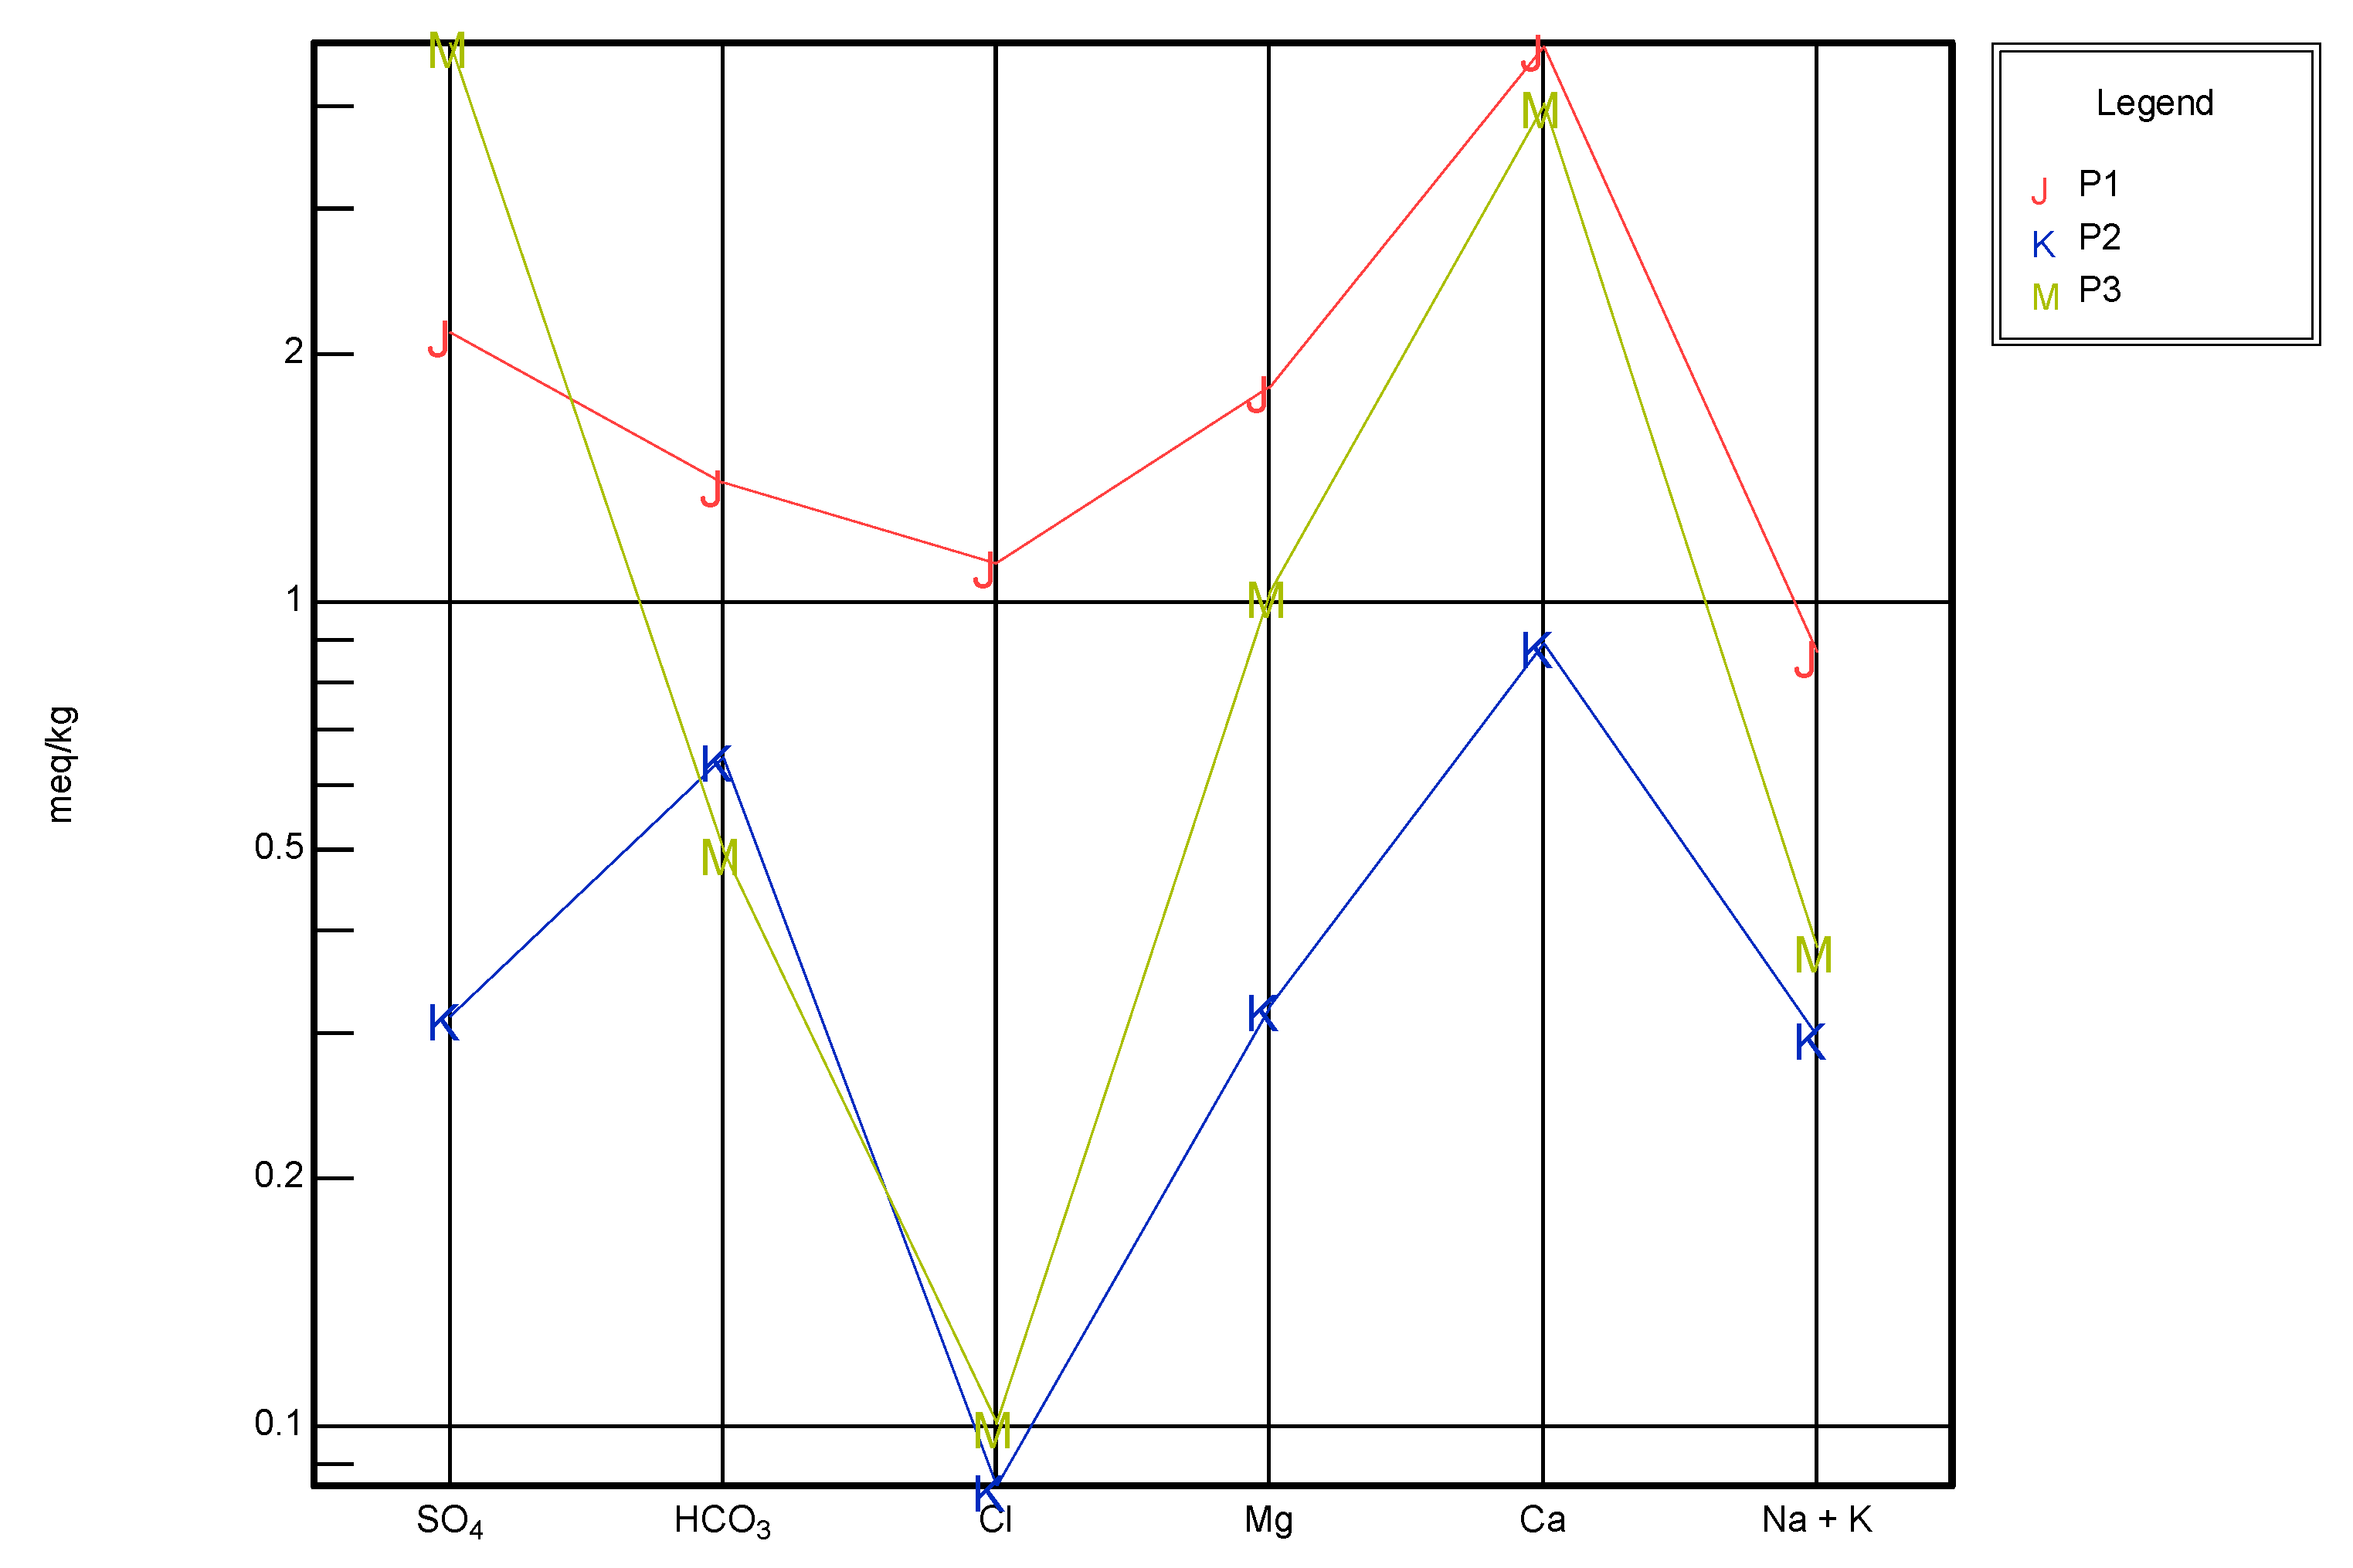
Surface water chemistry is mainly associated with human activities and atmospheric inputs: Rock and soil weathering, evaporation, and crystallization [56]. Regarding the cations and anion characteristics, all three samples collected in 2022 showed different typology. As it can be noticed from Figure 4 and Table 4, Ca (64.5 ± 40.9 mgL−1) was the dominant major cation, being followed by Mg (12.9 ± 9.14 mgL−1), Na (9.57 ± 5.79 mgL−1), and K (3.89 ± 2.18 mgL−1), while, in the case of anions, P1 and P3 showed similar trends, the dominant anion was SO42−, followed by HCO3−, NO3− and Cl−, while in the case of P2, the majority of the anions were in the order: HCO3− > SO42− > Cl− > NO3−.
F−, PO43−, and NO2− were found in a non-significant or a non-detectable level in the studied surface-water samples.
If the series of cations from the present study Ca > Mg > Na > K is analyzed and compared with the one obtained by Rakotondrabe et al.: Na > Mg > Ca > K [20] it can be observed that Na and Ca are exchanged with each other, while the series of anions is the same in both investigated areas: HCO3− > SO42− > Cl−, indicating similar trends of dissolution of HCO3−.
The low spatial variation and standard deviation of Mg, K, and Na indicated homogeneity and a low level of the interfering anthropogenic processes, while, in the case of anions, the high value of standard deviations indicated possible anthropogenic impacts. The main sources of HCO3− are represented by the weathering and dissolution processes of different rocks, such as calcite, carbonate, silicate, and dolomite, while the variation of SO42−, could not be attributed to natural phenomena and fluctuations but to the industrial and agricultural activities conducted in the study area. Moreover, based on the Piper diagram, the analyzed samples showed different typologies: P1 and P3–calcium-chloride type, calcium magnesium bicarbonate type, for P2, respectively. In the cation plot, all samples were situated in the left corner, indicating Ca dominance. Oppositely, the anion diagram showed that P3 was distributed in the upper corner, characterized by the dominance of SO42− over HCO3− and Cl−, while the high concentration of HCO3− situated P2 in the bicarbonate type. However, two samples were situated in the upper corner and dominated by SO42− over Cl− and HCO3−.
The chemical characteristic of the studied surface water, according to the Piper diagram, is the dominance of the alkaline earth elements (Ca and Mg) over the alkaline elements (Na and K) and the strong acids (SO42− + Cl−) over the weak acids (HCO3−) in two out of three samples.
3.3. Surface Water Pollution Indices
The HPI and HEI were calculated to evaluate the overall quality of surface water samples as regards their heavy metal contents (Table 5). The indices identified and quantified metallic contamination trends in surface water [57]. The selection of HPI depends upon the importance of individual heavy metals [58], while HEI was calculated based on the integration of upper and maximum admissible concentrations of the parameters [48].
In 2021, the value of HPI showed no heavy metal pollution, indicating an improvement in the surface water quality, while, in the second year, the application of the HPI showed that two out of the three river streams (Băiţa (P2) and Craina (P3)) were unsuitable, with values of HPI way higher than the critical value of 100 [51]. The conclusion extracted from the computation of HPI indicated that the study area is highly susceptible to heavy metal pollution and also has a heavy metal accumulation potential. The observed increase of the HPI in the second year could be mainly due to the increase of the specific inputs of the mining activities and the accumulation of all the anthropogenic impacts on the surface water quality.
For a better understanding of metal concentrations in surface water samples, HEI was calculated with an average value of 10.2, varying from 7.89 to 12.5. Analyzing the values of the HEI index, the water in the investigated area is not safe, presenting a moderate risk for most of the investigated samples. Therefore, a value higher than 20 for HEI is a threshold of warning, while a value between 10 and 20 suggests a state of high alert [47]. According to the pollution levels in the study, HEI values indicated a medium heavy metal pollution level or the surface water sample collected in 2022. Similar to HPI, HEI showed a deterioration of water quality, in the case of sample collected in 2022, with higher values, but also indicated a medium level of heavy metal pollution.
3.4. Water Quality Assessment
The assessment of the suitability of surface water sources was done using the Water Quality Index method, which leads to a friendly interpretation of water quality by assembling different parameters into a single number. The WQI was calculated using five subindices, using the measured concentration of Ni, Cu, Pb, Cr, and Cd, and their permissible limits of water Class V according to the Romanian and International Regulations, namely the Minister Order 161/2006/OD and Directive 2008/32/CE, regarding the quality of surface water resources [45,46].
The most important sub-indices were Cr and Ni, which control the study area’s water quality and WQI value. The sequence of heavy metals in the calculated unit weights was in the order of Cr > Ni > Cu > Zn > Pb > Cd. The value of WQI during the studied period ranged from 141 to 230, with an average value of 164. The WQI value indicated that water quality was very poor (P2 and P3–2022) and poor (for P1–2022 and P1, P2, P3–2021) and totally unsuitable for drinking purposes (Table 4). The high WQI might be derived from the intensive anthropogenic activities (industrial, agricultural, and domestic) and economic developments along the study region, such as the extensive mining activities and various power plants [59]. The slight variation of WQI between the two years could be due to different river flow rates based on different meteorologic conditions. Similar results were obtained by Mokarram et al., when various indices concluded that the surface water from Kor River (Iran), located nearby an industrial settlement, was unsuitable for domestic usage due to the high content of Cr [60].
Comparing the results with studies regarding surface water in areas with mining activity, it can be seen that the WQI was much lower (141–230) compared to the mining area in South Africa (120–4643) [21] or Cameroon (12.5–5137) [20].
The remediation of the water quality will be the subject of further studies, in this sense, remedial measures will be taken into account in order to reduce the acidity of the waters and the extraction of metals through bioleaching and washing.
4. Conclusions
The industrial activities carried out over the years in the Baia Mare area have had a negative impact on environmental factors, including surface waters.
The present study on the analysis of surface waters of Baia Mare allowed us to know the contents of heavy metal concentrations and the values of certain descriptive parameters of water quality, such as pH. Our results revealed that the surface water from Baia Mare area is characterized by a high variation of the pH, and it is contaminated by a number of trace metal elements.
The analysis of the surface water collected from three different water bodies in two distinct years revealed a variable pH (2.53–7.92), lower values being influenced by the reduced water flow, indicating a possible acidic character of the sediments of the Băiţa and Craica rivers.
The concentrations of heavy metals revealed high values of Cr (0.165–1.57 mgL−1) and Cu (0.036–0.195 mgL−1), exceeding the values of quality Class V in most of the samples. The order regarding the polluting character of the metals in the present study was: Cr > Ni > Cu > Zn > Mn > Fe > As > Pb > Cd. All three samples collected in 2022 showed a different typology. The dominant cation was Ca (64.5 ± 40.9 mgL−1), followed by Mg (12.9 ± 9.14 mgL−1), Na (9.57 ± 5.79 mgL−1), and K (3.89 ±2.18 mgL−1). P1 and P3 showed similar trends in the case of anions (SO42− > HCO3− > Cl−), while in the case of P2, the order of anions was HCO3− > SO42− > Cl−. The results are evidence of the poor quality of the surface and underground water sources and reflection of the influence of wastewater discharges on the chemical quality of water.
In addition, HPI (96.1–142) and HEI (11.1–12.5) values indicated an average level of heavy metal pollution in surface water samples collected in 2022. Moreover, HEI and HPI showed a deterioration in water quality in 2022 compared to 2021 (HPI: 15.7–18.4 and HEI: 6.62–10.0). The value of WQI during the studied period ranged from 141 to 230, with an average value of 164. The WQI value indicated that water quality was very poor (P2 and P3–2022) and poor (P1–2022 and P1, P2, P3–2021). Thus, the consumption of these waters will result in human exposure to high health risks of intoxication with studied metals.
The results of this study have demonstrated that water samples from the rivers in the Baia Mare area (Craica, Baita, and Recea) are not suitable for irrigation and drinking purposes, thus some pollution control measures are required. Furthermore, the results indicated the necessity of carrying out further investigations and remediation in this zone.
Author Contributions
Conceptualization: I.M.S., A.M., V.M., E.T.P.; methodology: I.M.S., A.M., V.M., E.T.P.; investigation: I.M.S., A.M., E.T.P.; resources: I.M.S., V.M., A.M.; validation: I.M.S., V.M., A.M.; visualization: I.M.S., V.M., A.M., E.T.P.; writing—original draft preparation: I.M.S., V.M., A.M.; writing—review and editing: I.M.S., V.M., A.M. All authors have read and agreed to the published version of the manuscript.
Funding
This work was supported by the Ministry of Research, Innovation and Digitization through Program 1- Development of the national research &development system, Subprogram 1.2—Institutional performance—Projects that finance the RDI excellence, Contract no. 18PFE/30.12.2021.
Institutional Review Board Statement
Not applicable.
Informed Consent Statement
Not applicable.
Data Availability Statement
Not applicable.
Conflicts of Interest
The authors declare no conflict of interest.
References
- Crișan, O.A.; Bîrleanu, C.; Crișan, H.G.; Pustan, M.; Merie, V.; Șerdean, F. Eco-Innovation Analyses in the Management of Drinking Water Provided by the Main Suppliers in Romania. Int. J. Environ. Res. Public Health 2021, 18, 6232. [Google Scholar] [CrossRef] [PubMed]
- Romanian National Environmental Protection Agency. Annual Report on the State of the Environment in Romania for 2017. Environment Ministry: Bucuresti, Romania, 2018. Available online: http://www-old.anpm.ro/files2/Capitolul%203%20-%20Ap%C4%83_20071121453746.pdf (accessed on 15 February 2022). (In Romanian).
- Filip, S. Depresiunea și Munceii Băii Mari. Studiu de Geomorfologie Environmentală; Presa Universitară Clujeană: Cluj-Napoca, Romania, 2008. (In Romanian) [Google Scholar]
- Levei, E.A.; Şenilă, M.; Miclean, M.; Roman, C.; Abraham, B.; Cordoş, E. Surface water pollution with heavy metals in Baia Mare mining basin. In Proceedings of the 15th International Congress of the International Soil Conservation Organization, Soil and Water Conservation, Climate Change and Environmental Sensitivity, Budapest, Hungary, 18–23 May 2008. [Google Scholar]
- Big, C.L.; Lăcătuşu, R.; Damian, F. Heavy Metals In Soil-Plant System Around Baia Mare City, Romania. Carpth J. Earth Environ. Sci. 2012, 7, 219–230. [Google Scholar]
- Cordos, E.A.; Roman, C.; Ponta, M.; Frentiu, T.; Rautiu, R. Evaluation of soil pollution with copper, lead, zinc and cadmium in the mining area Baia Mare. Rev. Chim. 2007, 58, 470–474. [Google Scholar]
- Damian, F.; Damian, G.; Lacatusu, R.; Macovei, G.; Iepure, G. Soils from the Baia Mare zone and the heavy metals pollution. Carpth J. Earth Environ. Sci. 2008, 3, 85–98. [Google Scholar]
- Damian, F.; Damian, G.; Macovei, G.; Iepure, G.; Nasui, D.; Napradean, I.; Chira, R.; Kollar, L. Spatial distribution and mobility of the heavy metals in soils from Baia Mare area. Studia UBB Ambient. 2008, LIII, 65–72. [Google Scholar]
- Bird, G.; Macklin, M.G.; Brewer, P.A.; Zaharia, S.; Bălteanu, D.; Driga, B.; Serban, M. Heavy metals in potable groundwater of mining-affected river catchments, northwestern Romania. Environ. Geochem. Health 2009, 31, 741–758. [Google Scholar] [CrossRef]
- Frentiu, T.; Ponta, M.; Levei, E.; Cordos, E.A. Study of partitioning and dynamics of metals in contaminated soil using modified four-step BCR sequential extraction procedure. Chem. Paper 2009, 63, 239–248. [Google Scholar] [CrossRef]
- Gurzău, E.S.; Baciu, C.; Gurzău, A.E.; Surdu, S.; Damian, G. Impact of the tailing’s impoundments on groundwater quality in Bozânta area (Baia Mare–NW Romania) and human exposure. Carpth. J. Earth Environ. Sci. 2012, 7, 231–240. [Google Scholar]
- Lăcătuşu, R.; Kovacsovics, B.; Bretan, A.; Lungu, M. Heavy metals in the soil after the ecological accident in the Baia Mare area. In Proceedings of the 5th Inter. Symp. On Metal Elements in Environment, Medicine and Biology, Timișoara, Romania, 4–6 November 2002. [Google Scholar]
- Roba, C.; Roşu, C.; Ozunu, A.; Baciu, C. The intake of nickel, cadmium and manganese through the ingestion of groundwater from several private wells from Baia Mare (Romania) metropolitan area. Studia Ubb Ambient. 2015, LX, 109–116. [Google Scholar]
- Coman, M.; Oros, V.; Fălăuş, B.; Pop, R. Soil pollution with heavy metals-specific issues for Baia Mare area. ProEnvironment 2010, 3, 29–32. [Google Scholar]
- Coman, M.; Oros, V.; Miloiu, E.; Taro, G.; Pop, R. Phytoremediation possibilities for contaminated mining areas from Romania. ProEnvironment Promediu 2009, 2, 203–207. [Google Scholar]
- Smical, I.; Muntean, A.; Nour, E. Research on the Surface Water Quality in Mining Influenced Area in North-Western part of Romania. Geogr. Pannonica 2015, 20, 13–43. [Google Scholar] [CrossRef] [Green Version]
- Banabic, D. History of Romanian Technique and Industry, Vol. I. Mechanics, Processing Techniques and Constructions; Banabic, D., Ed.; Romanian Academy Publishing House: Bucharest, Romania, 2019. (In Romanian) [Google Scholar]
- Pencea, R.; Brădățan, T.; Simion, Ș. Baia Mare-Preview of the Disaster Caused by the Mining Industry, Mining Watch Romania. 2013. Available online: www.miningwatch.ro (accessed on 10 August 2022). (In Romanian).
- Bilgin, A. Evaluation of surface water quality by using Canadian Council of Ministers of the EnvironmentWater Quality Index (CCME WQI) method and discriminant analysis method: A case study Coruh River Basin. Environ. Monit. Assess. 2018, 190, 554. [Google Scholar] [CrossRef] [PubMed]
- Rakotondrabe, F.; Remy, J.; Ngoupayou, N.; Mfonka, Z.; Harilala Rasolomanana, E.; Nyangono Abolo, A.J.; Asone, B.L.; Ako, A.A.; Rakotondrabe, M.H. Assessment of Surface Water Quality of Bétaré-Oya Gold Mining Area (East-Cameroon). J. Water Resour. Prot. 2017, 9, 960–984. Available online: http://www.scirp.org/journal/jwarp (accessed on 10 August 2022). [CrossRef] [Green Version]
- Molekoa, M.D.; Avtar, R.; Kumar, P.; Thu Minh, H.V.; Dasgupta, R.; Johnson, B.A.; Sahu, N.; Verma, R.L.; Yunus, A.P. Spatio-TemporalAnalysis of SurfaceWater Quality in Mokopane Area, Limpopo, South Africa. Water 2021, 13, 220. [Google Scholar] [CrossRef]
- Wolkersdorfer, C.; Mugov, E.; Dagad, V.S.; Charvet, P.; Vituleless, J. Effects of Mining on Surface Water-Case Studies. Encycl. Inland Waters 2022, 4, 170–188. [Google Scholar] [CrossRef]
- Pistea, I.C.; Rosu, C.; Roba, C.; Ozunu, A. Evaluation of groundwater quality for drinking and irrigation by calculating specific quality indexes. case study: Baia Mare mining area, Romania. Studia UBB Ambient. 2020, LXV, 43–57. [Google Scholar] [CrossRef]
- Modoi, O.C.; Roba, C.; Török, Z.; Ozunu, A. Environmental risks due to heavy metal pollution of water resulted from mining wastes in NW Romania. Environ. Eng. Manag. J. 2014, 13, 2325–2336. [Google Scholar]
- Prasad, B.; Bose, J. Evaluation of the heavy metal pollution index for surface and spring water near a limestone mining area of the lower Himalayas. Environ. Geol. 2001, 41, 183–188. [Google Scholar] [CrossRef]
- Milivojevic, J.; Krstic, D.; Šmit, B.; Djekic, V. Assessment of Heavy Metal Contamination and Calculation of Its Pollution Index for Uglješnica River, Serbia. Bull. Environ. Contam. Toxicol. 2016, 97, 737–742. [Google Scholar] [CrossRef]
- Tiwari, A.K.; De Maio, M.; Singh, P.K.; Mahato, M.K. Evaluation of Surface Water Quality by Using GIS and a Heavy Metal Pollution Index (HPI) Model in a Coal Mining Area, India. Bull. Environ. Contam. Toxicol. 2015, 95, 304–310. [Google Scholar] [CrossRef] [PubMed]
- Horton, R.K. An index-number system for rating water quality. J. Water Pollut. Control Fed. 1965, 37, 300–306. [Google Scholar]
- Adimalla, N.; Qian, H. Groundwater quality evaluation using water quality index (WQI) for drinking purposes and human health risk (HHR) assessment in an agricultural region of Nanganur, south India. Ecotox. Environ. Saf. 2019, 176, 153–161. [Google Scholar] [CrossRef] [PubMed]
- Wang, J.; Fu, Z.; Qiao, H.; Liu, F. Assessment of eutrophication and water quality in the estuarine area of Lake Wuli, Lake Taihu, China. Sci. Total Environ. 2019, 650, 1392–1402. [Google Scholar] [CrossRef] [PubMed]
- Sener, S.; Sener, E.; Davraz, A. Evaluation of water quality using water quality index (WQI) method and GIS in Aksu River (SW-Turkey). Sci. Total Environ. 2017, 584–585, 131–144. [Google Scholar] [CrossRef] [PubMed]
- Hoaghia, M.A.; Moldovan, A.; Kovacs, E.; Mirea, I.C.; Kenesz, M.; Brad, T.; Cadar, O.; Micle, V.; Levei, E.A.; Moldovan, O.T. Water Quality and Hydrogeochemical Characteristics of Some Karst Water Sources in Apuseni Mountains, Romania. Water 2021, 13, 857. [Google Scholar] [CrossRef]
- Moldovan, A.; Hoaghia, M.-A.; Török, A.I.; Roman, M.; Mirea, I.C.; Barabas, R.; Micle, V.; Cadar, O. Spatial Variation ofWater Chemistry in Aries River Catchment, Western Romania. Appl. Sci. 2021, 11, 6592. [Google Scholar] [CrossRef]
- Moldovan, A.; Hoaghia, M.-A.; Kovacs, E.; Mirea, I.C.; Kenesz, M.; Arghir, R.A.; Petculescu, A.; Levei, E.A.; Moldovan, O.T. Quality and Health Risk Assessment Associated with Water Consumption—A Case Study on Karstic Springs. Water 2020, 12, 3510. [Google Scholar] [CrossRef]
- Adimalla, N.; Qian, H.; Nandan, M.J. Groundwater chemistry integrating the pollution index of groundwater and evaluationof potential human health risk: A case study from hard rock terrain of south India. Ecotoxicol. Environ. Saf. 2020, 206, 111217. [Google Scholar] [CrossRef]
- Towfiqul Islam, A.R.; Siddiqua, M.T.; Zahid, A.; Tasnim, S.S.; Rahman, M. Drinking appraisal of coastal groundwater in Bangladesh: An approach of multi-hazards towards water security and health safety. Chemosphere 2020, 255, 126933. [Google Scholar] [CrossRef]
- Plan de Mediu in Orasul Baia Mare. 2020. Available online: http://www.baiamare.ro/Baiamare/Proiecte/plam%20mediu/Partea%20II_PROFIL%20DE%20MEDIU.pdf (accessed on 10 August 2022). (In Romanian).
- Annual Report on the State of the Environment in Maramures County. 2020. Available online: http://apmmm.anpm.ro/rapoarte-anuale1 (accessed on 10 August 2022). (In Romanian).
- SR EN ISO 5667/2017. Water Quality. Sampling. Guide to Sampling Rivers and Streams. Available online: https://www.iso.org/standard/59903.html (accessed on 10 August 2022). (In Romanian).
- Esri, DeLorme, HERE, TomTom, Intermap, increment P Corp., GEBCO, USGS, FAO, NPS, NRCAN, GeoBase, IGN, Kadaster NL, Ordnance Survey, Esri Japan, METI, Esri China (Hong Kong), swisstopo, MapmyIndia, and the GIS User Community. Available online: https://www.dpi.nsw.gov.au/__data/assets/pdf_file/0017/670220/Eastern-Freshwater-Cod.pdf (accessed on 28 September 2022).
- Google Maps. Available online: https://www.google.ro/maps/place/Baia+Mare/@47.6234878,23.464441,9.66z/data=!4m5!3m4!1s0x4737dc70b4206f37:0x30914e534fa9d1dd!8m2!3d47.6567387!4d23.5849881 (accessed on 10 August 2022).
- Rosca, O.M.; Dippong, T.; Marian, M.; Mihali, C.; Mihalescu, L.; Hoaghia, M.A.; Jelea, M. Impact of anthropogenic activities on water quality parameters of glacial lakes from Rodnei mountains, Romania. Environ. Res. 2020, 182, 109136. [Google Scholar] [CrossRef] [PubMed]
- Qu, L.; Huang, H.; Xia, F.; Liu, Y.; Dahlgren, R.A.; Zhang, M.; Mei, K. Risk analysis of heavy metal concentration in surface waters across the rural-urban interface of the Wen-Rui Tang River, China. Environ. Pollut. 2018, 237, 639–649. [Google Scholar] [CrossRef] [PubMed] [Green Version]
- Appiah-Opong, R.; Ofori, A.; Ofosuhene, M.; Ofori-Attah, E.; Nunoo, F.K.E.; Tuffour, I.; Gordon, C.; Arhinful, D.K.; Nyarko, A.K.; Fosu-Mensah, B.Y. Heavy metals concentration and pollution index (HPI) in drinking water along the southwest coast of Ghana. Appl. Water Sci. 2021, 11, 57. [Google Scholar] [CrossRef]
- ORDER no. 161 for the Approval of the Norm Regarding the Classification of Surface Water Quality in Order to Establish the Ecological Status of Water Bodies. Available online: http://www.monitoruljuridic.ro/monitorul-oficial/161/2006-02-21 (accessed on 10 August 2022). (In Romanian).
- Directive 2008/32/EC of the European Parliament and of the Council of 11 March 2008 Amending Directive 2000/60/EC Establishing a Framework for Community action in the field of water policy, as regards the implementing powers conferred on the Commission. 2008, pp. 60–61. Available online: https://eur-lex.europa.eu/legal-content/EN/ALL/?uri=celex:32008L0032 (accessed on 10 August 2022).
- Bhuiyan, M.A.; Islam, M.A.; Dampare, S.B.; Parvez, L.; Suzuki, S. Evaluation of hazardous metal pollution in irrigation and drinking water systems in the vicinity of a coal mine area of northwestern Bangladesh. J. Hazard. Mater. 2010, 179, 1065–1077. [Google Scholar] [CrossRef] [PubMed]
- Edet, A.E.; Offiong, O.E. Evaluation of water quality pollution indices for heavy metal contamination monitoring. A study case from Akpabuyo-Odukpani area, Lower Cross River Basin (southeastern Nigeria). GeoJournal 2002, 57, 295–304. [Google Scholar] [CrossRef]
- Directive 98/83/EC of the European Parliament and of the Council of 3 November 1998 on the Quality of Water Intended for Human Consumption. Available online: https://eur-lex.europa.eu/legal-content/EN/TXT/PDF/?uri=CELEX:31998L0083&from=EN (accessed on 10 August 2022).
- WHO. Guidelines for Drinking-Water Quality, 4th ed.; Incorporating first addendum; World Health Organization: Geneva, Switzerland, 2017; Available online: https://www.who.int/publications/i/item/9789241549950 (accessed on 10 August 2022).
- Wątor, K.; Zdechlik, R. Application of water quality indices to the assessment of the effect of geothermal water discharge on river water quality-Case study from the Podhale region (Southern Poland). Ecol. Indic. 2021, 121, 107098. [Google Scholar] [CrossRef]
- Singh, A.P.; Dhadse, K.; Ahalawat, J. Managing water quality of a river using an integrated geographically weighted regression technique with fuzzy decision-making model, Environ. Monit. Assess. 2019, 191, 378. [Google Scholar] [CrossRef]
- Chen, J.; Gao, Y.; Qian, H.; Jia, H.; Zhang, Q. Insights into water sustainability from a grey water footprint perspective in an irrigated region of the Yellow River Basin. J. Clean. Prod. 2021, 316, 128329. [Google Scholar] [CrossRef]
- Rao, Q.; Sun, Z.; Tian, L.; Li, J.; Sun, W.; Sun, W. Assessment of arsenic and heavy metal pollution and ecological risk in inshore sediments of the Yellow River estuary, China. Stoch. Environ. Res. Risk Assess. 2018, 32, 2889–2902. [Google Scholar] [CrossRef]
- Cordos, E.; Rautiu, R.; Roman, R.; Ponta, M.; Frentiu, T.; Sarkany, A.; Fodorpataki, L.; Macalik, K.; McCormick, C.; Weiss, D. Characterization of the rivers system in the mining and industrial area of Baia Mare, Romania. Eur. J. Min. Process. 2003, 3, 1303–1868. [Google Scholar]
- Levei, E.; Frentiu, T.; Ponta, M. Characterization and assessment of potential environmental risk of tailings stored in seven impoundments in the Aries River basin, Western Romania. Chem. Cent. J. 2013, 7, 5. [Google Scholar] [CrossRef] [PubMed]
- Singh, R.; Venkatesh, A.S.; Syed, T.H.; Reddy, A.G.S.; Kumar, M.; Kurakalva, R.M. Assessment of potentially toxic trace elements contamination in groundwater resources of the coal mining area of the Korba coalfield, Central India. Environ. Earth Sci. 2017, 76, 566. [Google Scholar] [CrossRef]
- Mohan, S.V.; Nithila, P.; Reddy, S.J. Estimation of heavy metal in drinking water and development of heavy metal pollution index. J. Environ. Sci. Health A 1996, 31, 283–289. [Google Scholar] [CrossRef]
- Bora, F.D.; Bunea, C.I.; Chira, R.; Bunea, A. Assessment of the Quality of Polluted Areas in Northwest Romania Based on the Content of Elements in Different Organs of Grapevine (Vitis vinifera L.). Molecules 2020, 25, 750. [Google Scholar] [CrossRef] [PubMed] [Green Version]
- Mokarram, M.; Saber, A.; Sheykhi, V. Effects of heavy metal contamination on river water quality due to release of industrial effluents. J. Clean. Prod. 2020, 277, 123380. [Google Scholar] [CrossRef]
Figure 1.
Locations of the investigated areas with the sampling points and the pollution sources in Baia Mare city [40,41].

Figure 2.
The pH of the surface water samples collected in 2021 and 2022 in the study area.

Figure 3.
Heavy metal in studies surface water samples compared quality classes established by the Minister Order 161/2006/OD: (a) Cr concentration, (b) Cu concentration.
Figure 3.
Heavy metal in studies surface water samples compared quality classes established by the Minister Order 161/2006/OD: (a) Cr concentration, (b) Cu concentration.

Figure 4.
Schoeller diagram of chemical parameters concentrations (SO42−, HCO3−, Cl−, Mg, Ca, K, Na) among the sampling points.
Figure 4.
Schoeller diagram of chemical parameters concentrations (SO42−, HCO3−, Cl−, Mg, Ca, K, Na) among the sampling points.


Table 1.
The limit of detection (LOD) of the studied parameters in surface water.
| Parameter | LOD | Parameter | LOD | Parameter | LOD |
|---|---|---|---|---|---|
| Cd (µgL−1) | 0.110 | Mn (µgL−1) | 0.090 | NO2−(mgL−1) | 0.050 |
| Cr (µgL−1) | 0.020 | As (µgL−1) | 0.026 | Cl− (mgL−1) | 0.020 |
| Cu (µgL−1) | 0.200 | Ca (mgL−1) | 0.004 | SO42− (mgL−1) | 0.030 |
| Ni (µgL−1) | 0.026 | Mg (mgL−1) | 0.009 | F− (mgL−1) | 0.010 |
| Zn (µgL−1) | 0.330 | Na (mgL−1) | 0.010 | PO43− (mgL−1) | 0.080 |
| Pb (µgL−1) | 0.270 | K (mgL−1) | 0.012 | HCO3− (mgL−1) | 20 |
| Fe (µgL−1) | 0.190 | NO3− (mgL−1) | 0.010 |
Table 2.
Pollution indices used for water quality assessment.
| Indices | Water Quality | |||
|---|---|---|---|---|
| HPI [25,51] | HPI < 100 | low pollution | ||
| HPI ≥ 100 | critical pollution | |||
| HEI [48] | HEI < 10 | low pollution | ||
| 10 ≤ HEI < 20 | moderate pollution | |||
| HEI ≥ 20 | high pollution | |||
| WQI [28] | WQI < 25 | excellent quality | ||
| 25 ≤ WQI < 50 | good quality | |||
| 50 ≤ WQI < 75 | medium quality | |||
| 75 ≤ WQI < 100 | poor quality | |||
| WQI ≥ 100 | extremely poor quality | |||
Table 3.
The heavy metal concentration in the surface water in comparison with the results of other authors [mgL−1].
Table 3.
The heavy metal concentration in the surface water in comparison with the results of other authors [mgL−1].
| Sample/ References | Years | Ni | Cr | Cu | Zn | Pb | Cd | Fe | Mn | As | |
|---|---|---|---|---|---|---|---|---|---|---|---|
| mgL−1 | |||||||||||
| P1 | 2021 | Average | -* | 1.57 | 0.056 | -* | -* | -* | - | - | - |
| SD | - | 0.010 | 0.001 | - | - | - | - | - | - | ||
| 2022 | Average | 0.496 | 0.707 | 0.059 | -* | -* | -* | -* | -* | -* | |
| SD | 0.018 | 0.014 | 0.004 | - | - | - | - | - | - | ||
| P2 | 2021 | Average | -* | 1.380 | 0.036 | 3.10 | -* | -* | - | - | - |
| SD | - | 0.121 | 0.010 | 0.435 | - | - | - | - | - | ||
| 2022 | Average | 0.718 | 0.165 | 0.133 | 3.398 | -* | -* | 0.070 | -* | -* | |
| SD | 0.007 | 0.007 | 0.004 | 0.028 | - | - | 0.005 | - | - | ||
| P3 | 2021 | Average | -* | 1.243 | 0.051 | -* | -* | -* | - | - | - |
| SD | - | 0.078 | 0.010 | - | - | - | - | - | - | ||
| 2022 | Average | 0.518 | 0.845 | 0.195 | -* | -* | -* | -* | 3.903 | -* | |
| SD | 0.010 | 0.019 | 0.005 | - | - | - | - | 0.012 | - | ||
| Smical et al. [16] | 1999 | Average | 0.022 | - | 0.050 | 0.680 | 0.020 | 0.045 | 0.50 | 2.520 | - |
| 2007 | Average | 0.040 | - | 0.110 | 0.990 | 0.140 | 0.048 | 1.80 | 2.310 | - | |
| 2009 | Average | 0.043 | - | 0.175 | 1.300 | 0.090 | 0.054 | 1.20 | 2.320 | - | |
| 2011 | Average | 0.031 | - | 0.022 | 0.580 | 0.020 | 0.020 | 0.55 | 1.180 | - | |
| Cordos et al. [6] | 2001 | Average | - | - | 0.060 | 1.010 | 0.045 | 0.005 | - | - | - |
Note(s): * All three samples had their concentration of the ith parameter lower than LOD.
Table 4.
The cations and anions concentration in the surface water samples in the year 2022.
| Sample | Ca | Mg | Na | K | NO3− | NO2− | Cl− | SO42− | F− | PO43− | HCO3− | |
|---|---|---|---|---|---|---|---|---|---|---|---|---|
| mgL−1 | ||||||||||||
| P1 | Average | 94.6 | 22.2 | 16.2 | 6.38 | 46.7 | -* | 39.6 | 102 | 0.09 | -* | 85.4 |
| SD | 1.277 | 2.536 | 1.308 | 0.244 | 1.929 | - | 1.136 | 1.732 | 0.006 | - | 0.794 | |
| P2 | Average | 17.9 | 3.94 | 5.49 | 2.35 | 1.25 | -* | 3.00 | 15.1 | 0.11 | -* | 39.6 |
| SD | 1.300 | 0.440 | 0.503 | 0.157 | 0.207 | - | 0.197 | 0.700 | 0.003 | - | 0.985 | |
| P3 | Average | 80.9 | 12.5 | 7.03 | 2.95 | 24.8 | -* | 35.8 | 229 | 0.06 | -* | 30.5 |
| SD | 0.700 | 1.229 | 0.313 | 0.238 | 0.265 | - | 0.954 | 16.523 | 0.002 | - | 1.473 | |
* All three samples had their concentration of the ith parameter lower than LOD.
Table 5.
The heavy metals pollution assessment through pollution indices.
| Sample | HPI | HEI | WQI | |||
|---|---|---|---|---|---|---|
| 2021 | 2022 | 2021 | 2022 | 2021 | 2022 | |
| P1 | 16.6 | 96.1 | 7.89 | 11.1 | 167 | 195 |
| P2 | 18.4 | 142 | 10.0 | 12.2 | 183 | 211 |
| P3 | 15.7 | 118 | 6.62 | 12.5 | 141 | 230 |
Publisher’s Note: MDPI stays neutral with regard to jurisdictional claims in published maps and institutional affiliations. |
© 2022 by the authors. Licensee MDPI, Basel, Switzerland. This article is an open access article distributed under the terms and conditions of the Creative Commons Attribution (CC BY) license (https://creativecommons.org/licenses/by/4.0/).
Share and Cite
MDPI and ACS Style
Sur, I.M.; Moldovan, A.; Micle, V.; Polyak, E.T. Assessment of Surface Water Quality in the Baia Mare Area, Romania. Water 2022, 14, 3118. https://doi.org/10.3390/w14193118
AMA Style
Sur IM, Moldovan A, Micle V, Polyak ET. Assessment of Surface Water Quality in the Baia Mare Area, Romania. Water. 2022; 14(19):3118. https://doi.org/10.3390/w14193118
Chicago/Turabian StyleSur, Ioana Monica, Ana Moldovan, Valer Micle, and Evelyn Terez Polyak. 2022. "Assessment of Surface Water Quality in the Baia Mare Area, Romania" Water 14, no. 19: 3118. https://doi.org/10.3390/w14193118
Note that from the first issue of 2016, this journal uses article numbers instead of page numbers. See further details here.