
A Study on the Possibility of Early Warning for Cochlodinium polykrikoides Blooms, Using Molecular Methods
by
 and
and
Hye-Eun Kang
1, 
Tae-Ho Yoon
2,
Jong-Woo Park
3,
Weol-Ae Lim
3,
Chang-Keun Kang
4 and
Hyun-Woo Kim
5,* 1
Institute of Marine Life Science, Pukyong National University, Busan 48513, Korea
2
Interdisciplinary Program of Biomedical, Mechanical and Electrical Engineering, Pukyong National University, Busan 48513, Korea
3
National Institute of Fisheries Science, Busan 46083, Korea
4
School of Earth Sciences and Environmental Engineering, Gwangju Institute of Science and Technology, Gwangju 61005, Korea
5
Department of Marine Biology, Pukyong National University, Busan 48513, Korea
*
Author to whom correspondence should be addressed.
Water 2022, 14(19), 3115; https://doi.org/10.3390/w14193115
Submission received: 31 August 2022
/
Revised: 25 September 2022
/
Accepted: 27 September 2022
/
Published: 2 October 2022
(This article belongs to the Special Issue Eutrophication Management in Coastal Zones for Better Water Quality)
Abstract
:The occurrence of HABs is known to be affected by multiple environmental factors such as temperature, salinity, nutrients, light, water chemistry, and biological activity. This study aimed to study the possibility of early warning for Cochlodinium polykrikoides blooms in southern Korean waters using qPCR and metabarcoding analysis. We were able to detect C. polykrikoides via a sensitive technique, and confirmed the early warning potential of C. polykrikoides by quantitative PCR. To identify the microbial organisms related to the bloom caused by C. polykrikoides, metabarcoding analysis was conducted using 18 water samples collected from bloom sites in southern Korean waters between 2018 and 2019. Although there was no single group that could explain the successive blooms of C. polykrikoides, four taxa, including Gamma proteobacteria (0.588, p < 0.01), Verrucomicrobia (0.874, p < 0.01), Cyanobacteria (0.975, p < 0.01), and Cryptophyta, were related to C. polykrikoides blooms. When the HABs that occurred were caused by C. polykrikoides, although there were sites where the cells of C. polykrikoides were not detected, similar functions of the microbial communities operated in all southern Korean coastal waters. We identified that the phytoplankton community structure was divided into three or four, using metabarcoding analysis by sampling years.
1. Introduction
Phytoplankton plays an essential role in the marine ecosystem by creating organic compounds from carbon dioxide dissolved in water, which supports biological and geochemical processes [1,2,3]. However, several phytoplankton taxa are responsible for harmful algal blooms (HABs), with severe impacts on human health and marine ecosystems in many countries and also economic hardship in affected regions. Cochlodinium polykrikoides (C. polykrikoides), for example, is one of the major dinoflagellates responsible for HABs in Korean coastal waters [4], where massive aquaculture farms are located. The most intense C. polykrikoides blooms occur in the southern coastal waters adjacent to the cities of Geoje, Tongyeong, and Yeosu in Korea. C. polykrikoides has been introduced to these areas, and large-scale damage to aquaculture has occurred. Since the 2000s, annual losses in the Korean aquaculture industry caused by C. polykrikoides blooms have ranged from USD 4 to 18.6 million [3]. It is of great necessity to forecast the outbreaks of blooms, in order to take appropriate measures. To forecast the outbreak of HABs, the National Institute of Fisheries Sciences (NIFS) has conducted regular monitoring of cell counts at designated stations along the coastal waters in the Korean peninsula every March to November since 1981 [5]. However, the traditional counting method has often lacked sensitivity; it has missed HABs in cases where abundance is low, and at times been inaccurate due to the morphological similarity of HABs to other species, and/or changes in morphology by the addition of fixatives [6,7]. Molecular detection of HABs including the quantitative PCR (qPCR) method, is an alternative to traditional methods and provides rapid, sensitive, and accurate detection and quantification of HABs and toxic microalgae [8,9].
The occurrence of HABs is known to be affected by multiple environmental variables, such as temperature, salinity, nutrient, light, water chemistry, and biological factors [10,11]. However, there is still no clear understanding of the mechanism between those abiotic factors and the onset and explosive multiplication of the blooms [12]. In addition to abiotic factors, bacterial compositions are also known to be involved in the dynamics of HABs caused by particular algal species [13,14]. Bacteria support the growth of HABs by the recycling of nutrients, and phytoplankton produces various algal-derived products, which affect bacterial growth rate and community composition [15,16]. Since there are complicated interactions among microorganisms and algal growth [17,18,19], toxin production [20], algicidal activity [21,22,23], and bloom termination [24,25], study of these interactions between them can provide useful information about the dynamics of algal blooms.
Molecular-based methods have been demonstrated capable of identifying the community structures and diversity of microbial organisms. Their development has made possible DNA metabarcoding analysis based on massive sequencing of the amplicon, which is related to the occurrence of HABs [26,27,28]. Several previous studies have shown that bacterial communities appear to be associated with HABs. The relative abundances of bacteria changed in response to the different phases of C. polykrikoides growth in culture [26]. Alphaproteobacteria and Flavobacteria, which exist in high proportions and are present from the early bloom stage to the late bloom stage, correlated positively with C. polykrikoides, but gamma proteobacteria were negatively correlated with C. polykrikoides [11]. However, Shin et al. [27] reported that Gammaproteobacteria and Alphaproteobacteria were the main components of the bacterial community associated with C. polykrikoides in culture. The interaction between bacteria and phytoplankton can be analyzed through metabarcoding analysis with multiple simultaneous markers [29].
In this study, we performed qPCR and metabarcoding to analyze 16S rDNA and p23S rDNA sequenced from 18 samples collected from southern Korean coastal waters. Our objectives included: (i) comparing cell counting (traditional method) and copy number of C. polykrikoides rDNA (molecular method) for the detection and quantification of C.polykrikoides; (ii) identifying specific and repetitive microbial (particularly bacterial) and phytoplankton communities in C. polykrikoides bloomed waters in 2018 and 2019, and (iii) identifying microbial species potentially related with C. polykrikoides, which could be utilized for early warning.
2. Materials and Methods
2.1. Sample Collection and Genomic DNA Extraction
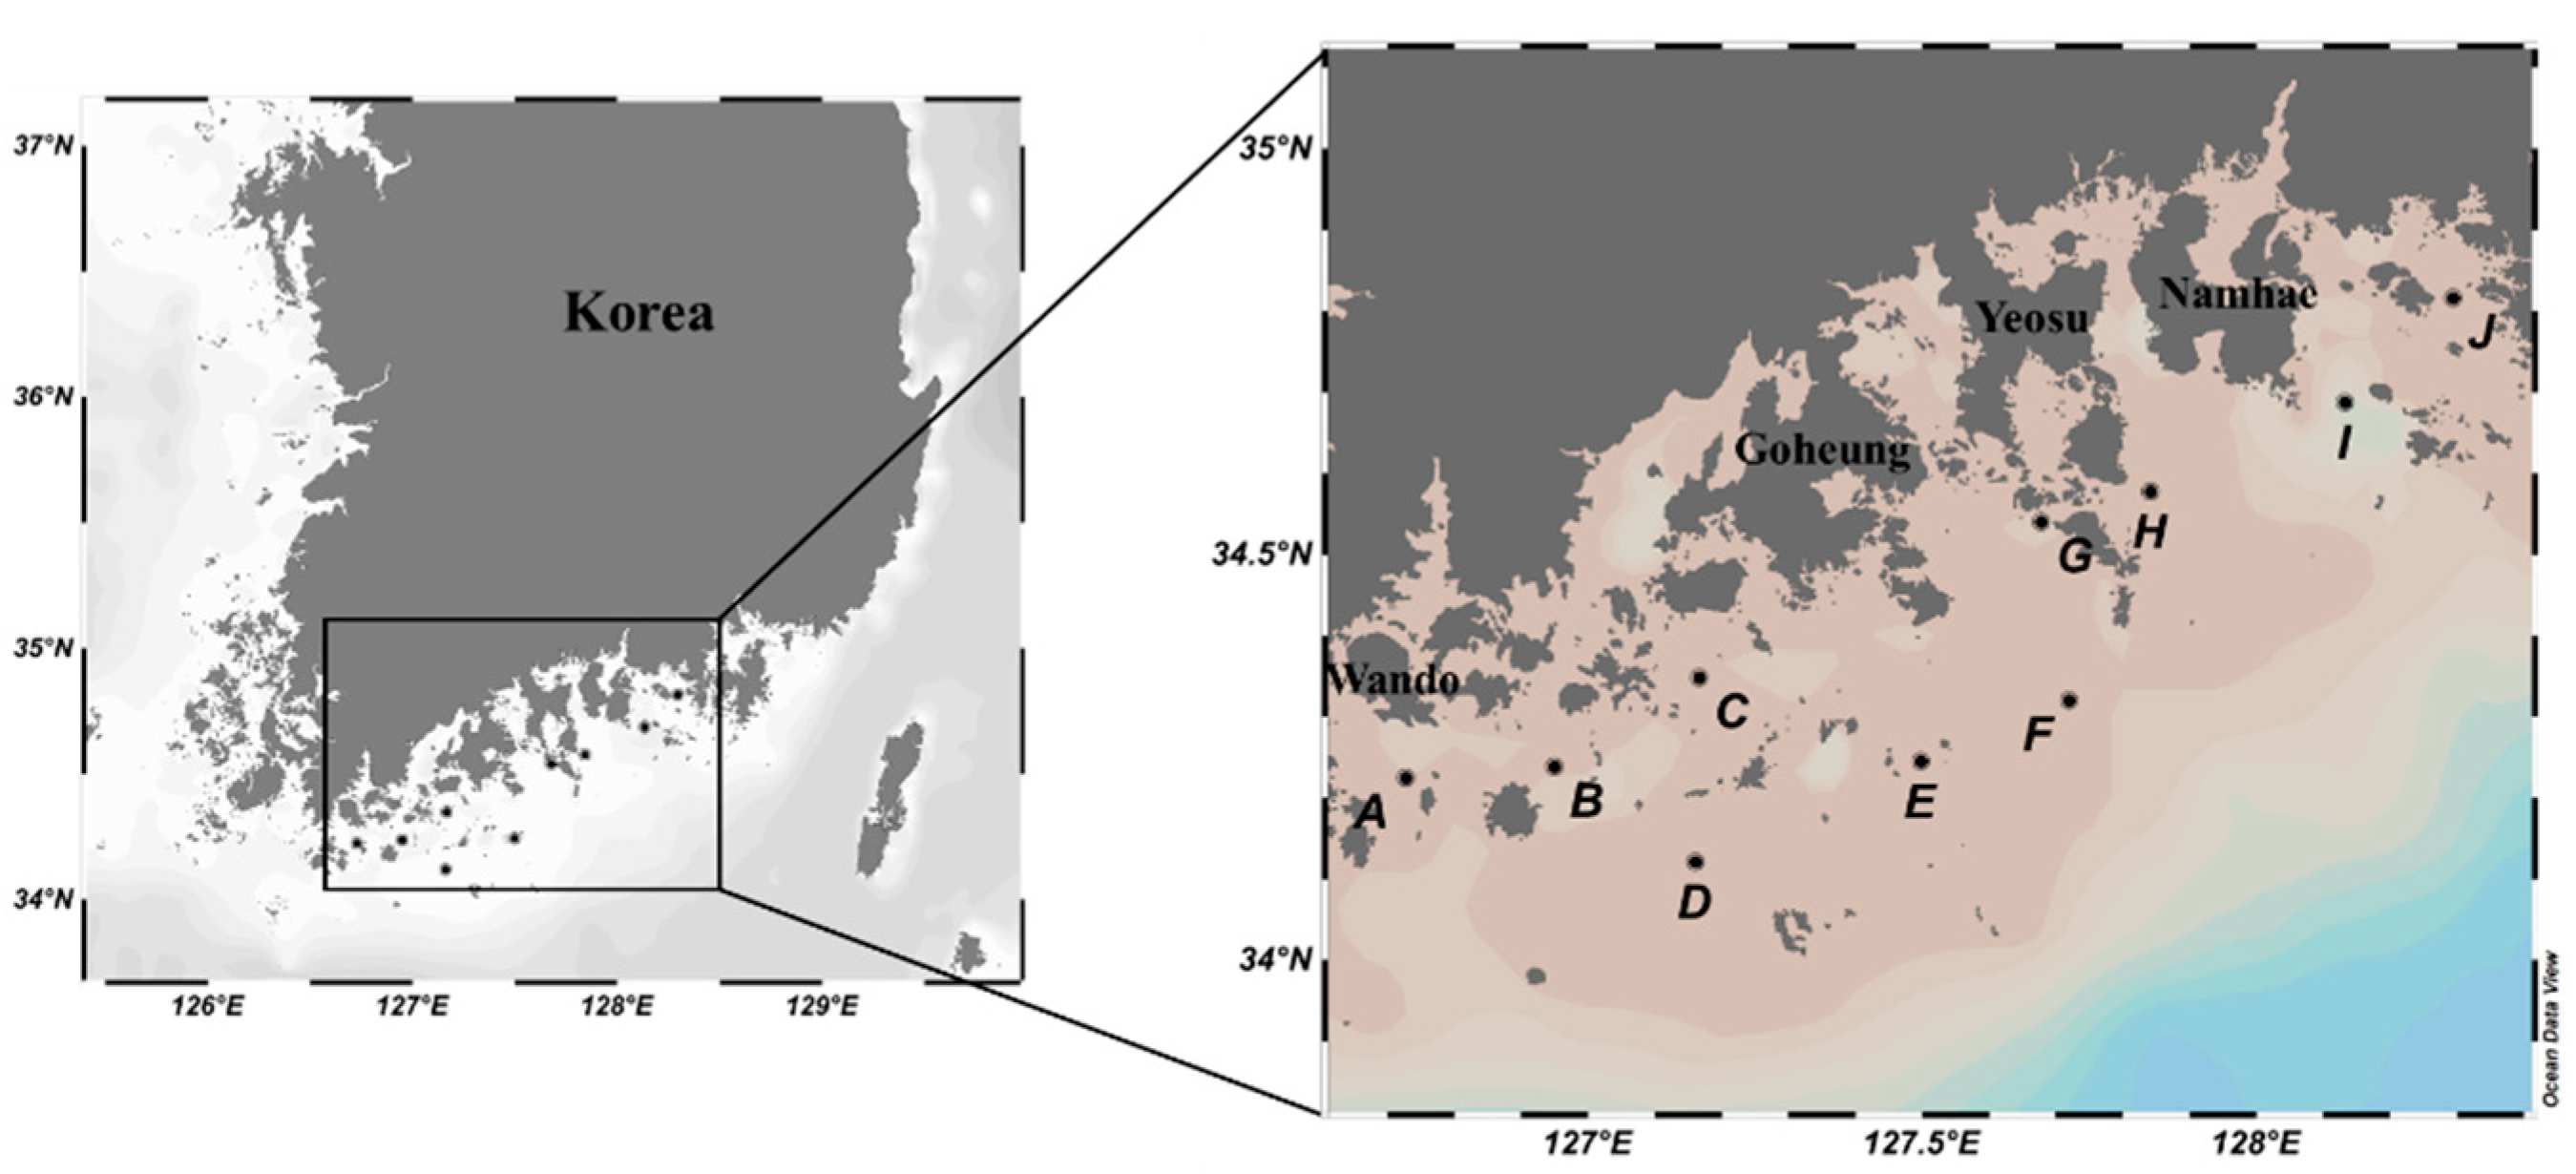
Sea water samples were collected from nine sites in southern Korean coastal waters during harmful algal blooms (HABs) that occurred from 31 July to 2 August 2018 and from 27 August to 30 August 2019 (Figure 1). Two surface water samples (100 mL × 2) were collected in each site, each of which was further filtered through a GH membrane with 0.45 μm pore size (Pall Corporation, New York, NY, USA). Filtered membranes were directly stored at −70 °C until used for genomic DNA extraction. Genomic DNA was extracted from the membrane using a DNeasy® plant mini kit (Qiagen, Hilden, Germany), following the manufacturer’s instructions. Isolated DNA was quantified using an ND-1000 nanodrop spectrophotometer (Thermo Scientific, Waltham, MA, USA) and stored at −70 °C until used for library construction.
2.2. Quantitative PCR for Microbial Communities, Phytoplankton Communities, and C. polykrikoides
qPCR was adopted for the quantitative analysis of bacterial and phytoplankton abundance. The standard curve for each taxon was constructed using the partial insulin-like growth factor 1 (Igf1) sequences from Mus musculus, flanking 16S universal primers or p23S universal primers, respectively [30,31] (Table 1). The amplified products stained with Dyne Loading STAR (Dynebio, Seongnam, Korea) were confirmed by 1% agarose gel electrophoresis. The amplicons with the expected size ranges (444 bp for 16S and 410 bp for p23S) were purified DNA fragments, and were cloned into a pGEM®-T easy vector (Promega, Madison, WI, USA) then transformed into Escherichia coli DH5α competent cells. The plasmids were then extracted using an AccuPrep® Plasmid Mini Extraction Kit (Bioneer, Daejeon, Korea) according to the manufacturer’s instructions. The concentrations of the plasmids were measured using a Quantus TM Fluorometer (E6150, Promega, Madison, WI, USA), and were sequenced (Macrogen, Daejeon, Korea). The standard curve for the quantitative PCR (qPCR) was constructed using the serially diluted plasmid harboring the target gene (from 10−1 ng/uL to 10−9 ng/uL). The relative copy numbers of microorganisms and phytoplankton were measured by qPCR, with two different universal primer sets; 16S universal primers for total microorganisms and p23S universal primers for phytoplankton [30,31]. Thermal cycling was performed with a DNA Engine Chromo 4 Real-Time PCR Detection System (Bio-Rad, Hercules, CA, USA) under the following conditions: initial template denaturation (94 °C for 3 min); 35 amplification cycles (94 °C for 30 s, 55 °C for 30 s and 72 °C for 30 s) and a final extension step at 72 °C for 3 min. Each PCR mixture (20 μL) contained 10 μL of 2 X SYBR Green premix Ex Taq II (Takara Bio Inc., Shiga, Japan), 4 μL of template, 1 μL of forward and reverse primers (10 pmol), and 4 μL of PCR-grade water.
Cochlodinium polykrikoides was detected in water samples, using quantitative PCR.
qPCR was performed using the MIC Real-Time PCR (MIC, Bio Molecular Systems, Upper Coomera, Australia). The following reagents were added for a 20 μL reaction mixture: 10 μL of Premix Ex Taq for real-time PCR (Takara Bio), forward and reverse primers at a final concentration of 200 nM, TaqMan probe at a final concentration of 150 nM, 2 μL of template DNA, and PCR-grade water to a final volume of 20 μL. The thermal cycling conditions consisted of 2 min at 95 °C followed by 40 cycles of 10 s at 95 °C and 45 s at 60 °C. Fluorescence data were collected at the end of each cycle, and the cycle threshold line was determined automatically by the instrument. Ten-fold serial dilutions of each plasmid containing C. polykrikoides rDNA were used to construct standard curves. These standard curves showed a strong linear correlation between log (plasmid DNA copy number) and CT values (correlation coefficient, R2 of 0.998) for C. polykrikoides.
2.3. Library Preparation and Sequencing
The library for MiSeq sequencing was constructed by the Nextera XT kit (Illumina, San Diego, CA, USA) indexing the amplicons generated by the universal primers: 16S universal primers for the microbial community [30], p23S universal primers for phytoplankton community [31] (Table 1). The expected amplicon size for each universal primer set was 580 bp for microbial communities (16S universal primers), and 540 bp for phytoplankton communities (p23S universal primers). PCR conditions for each universal primer set were the same as in the previous respective studies [30,31]. Amplicons were purified using an AccuPrep® gel purification Kit (Bioneer, Daejeon, Republic of Korea), and indexing of each amplicon was conducted according to the manufacturer’s instructions. The quality and quantity of the constructed libraries were measured using a 2100 Bioanalyzer (Agilent Technologies, Santa Clara, CA, USA), and MiSeq sequencing was conducted with the MiSeq 600-cycle Reagent Kit v3 (Illumina, San Diego, CA, USA).
2.4. Bioinformatics Analysis of Metabarcoding Data
The raw reads with low quality (QV < 20) and those shorter than 100 nucleotides were removed using the CLC Genomic Workbench v.8.0 (CLC Bio, Arahus, CA, USA). The reads longer than 7 bp overlapping sequences without any mismatches were pair-assembled. The merged reads with the expected size ranges (400~500 bp for 16S and 350~450 bp for p23S) were selected and their primer sequences were trimmed using Mothur software v.1.35.0 [33]. The obtained merged reads were clustered into operational taxonomic units (OTUs) at 99% similarities, and chimeras were removed using UCHIME software v.8.1 [34]. OTUs with lower than 10 read numbers and below 0.1% of the total read numbers were eliminated from further analysis. The species name for each OTU was assigned by a similarity search using a blast search with BLAST +2.2.30 on the NCBI non-redundant nucleotide database (ftp://ftp.ncbi.nlm.nih.gov/blast/db/; accessed on 21 May 2020) [35]. For each OTU with higher than 98% sequence identity in the database, the top-scored species name was assigned. The OTUs with 90–98% identities in the database were described as “Genus name with highest score” followed by “sp.” OTUs with less than 90% identity were classified as “Unknown”.
2.5. Statistical Analysis
Non-metric multidimensional scaling (nMDS) analysis was performed based on the Bray–Curtis similarity with group average on square-root transformed abundance data, to compare the microbial and phytoplankton communities among different samples, using the PRIMER-E software v. 6 (Primer-E Ltd., Plymouth, UK). Canonical correspondence analysis (CCA) was used to link variations in microbial communities to environmental factors, using Canoco 5 software(Microcomputer Power, Ithaca, NY, USA). Functional analysis was performed in which bacterial gene functions were predicted from 16S rRNA gene-based microbial compositions, using the PICRUSt algorithm to make inferences from KEGG pathways. Normalized values were calculated using Mothur software v.1.35.0 [36], as the measured abundance divided by the number of each copy number predicted for each OTU. The diversity indices for each sample were calculated using Mothur software and PRIMER version 5 (PRIMER-E Ltd., Lutton, United Kingdom), based on the normalized values. Analysis of similarity (ANOSIM), and permutational multivariate analysis of variance (PERMANOVA) were performed to determine differences in microbial and phytoplankton communities among samples and sampling years. These analyses were conducted on transformed data by using the Bray–Curtis similarity. The correlations of C. polykrikoides copy numbers to environmental parameters were analyzed using the Pearson correlation coefficient. Correlation analysis was performed based on the copy numbers of the C. polykrikoides rDNA with microbial OTUs and phytoplankton OTU, generated by metabarcoding analysis.
3. Results
3.1. Environmental Parameters
The temperature, salinity, nutrient concentration, and chlorophyll-a (Chl-a) content were measured at each sample site (Table 2). In 2018, the surface water temperature ranged from 22.78 to 27.52 °C, with an average of 25.78 ± 1.78 °C, which was 3.26 °C lower than in 2019 (26.04 ± 4.32 °C). A slightly higher average salinity (32.60 PSU ± 0.41) was identified in 2018, compared to its value (31.94 PSU ± 0.50) in 2019. The average ammonium (NH4+) concentration in 2019 was 0.70 ± 0.46 (μΜ), which was approximately 4.6 times higher than its value in 2018 (0.15 ± 0.16 μΜ). The mean nitrate (NO3−) concentrations were 0.49 ± 0.29 μΜ in 2018 and 0.94 ± 0.66 μΜ in 2019, respectively. The average DIN in 2019 (14.19 ± 11.47) was 15-fold that in 2018 (0.92 ± 0.54), while the average chlorophyll a concentration was higher in 2018 (10.26 ± 23.17) than in 2019 (5.44 ± 6.11 ug/L).
3.2. Quantitative Analysis of Microorganisms, Phytoplankton, and C. polykrikoides
The quantitative analysis of the total microorganisms, phytoplankton, and C. polykrikoides was conducted by qPCR (Table 3). The average copy number of the total microorganisms in 2019 was 899,913.23 ± 331,554.94 copies/mL, which was 1.76-fold higher than in 2018 (512,004.86 ± 336,315.44 copies/mL). The highest copy number of microorganisms was identified at J in 2018 (1,179,845.14 copies/mL) and J in 2019 (1,556,795.40 copies/mL), while the lowest numbers were detected at D in 2018 (214,395.14 copies/mL) and at G in 2019 (463,332.43 copies/mL), respectively. The average copy number of phytoplankton in 2019 (93,034.61 ± 30,967.44 copies/mL) was 1.08-fold higher than in 2018 (86,089.62 ± 50,155.64 copies/mL). Compared to the ratio in 2018 (5.95), the average ratio of total microorganisms to phytoplankton was 9.67 in 2019, which was approximately 1.63-fold higher than in 2018 (Table 3). The average copy numbers of C. polykrikoides were 2,102,482.86 ± 2,590,794.70 copies/mL and 30,342,731.76 ± 81,746,202.15 copies/mL in 2018 and 2019, respectively—14.43-fold higher in 2018 than in 2019. However, high degrees of regional differences in copy numbers were observed.
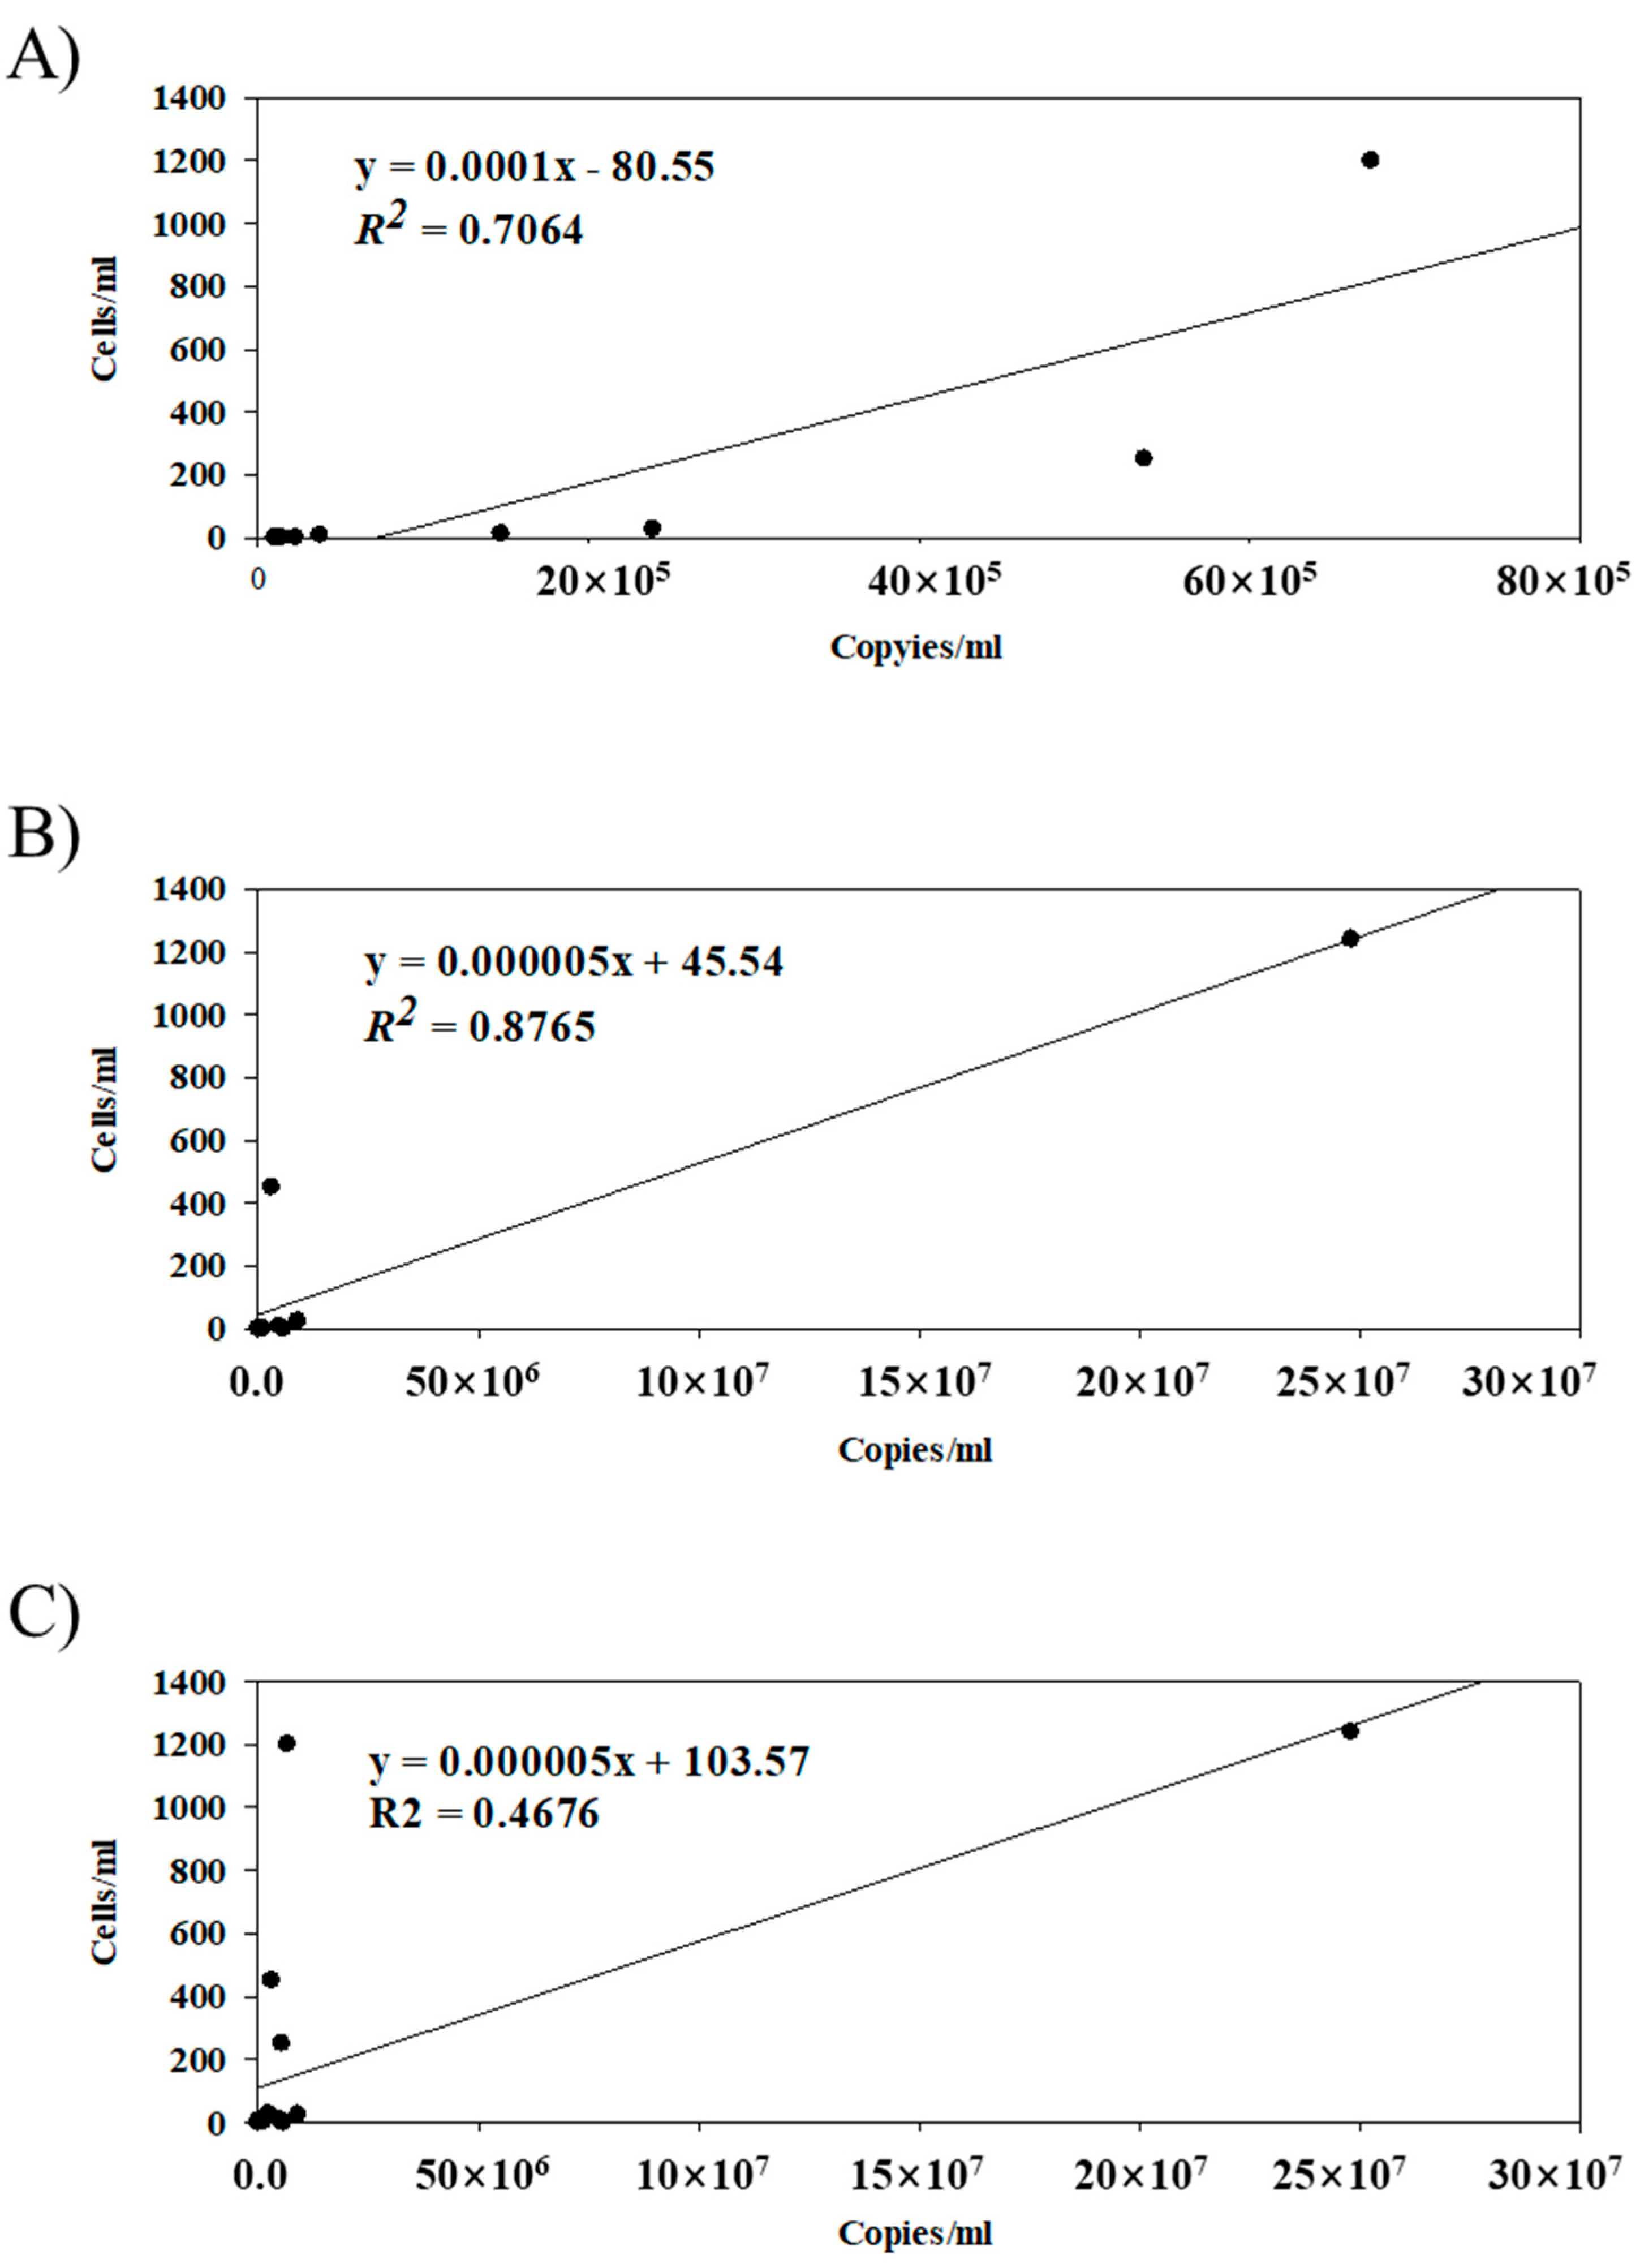
In 2018, the copy numbers of C. polykrikoies ranged from 5538.65 copies/mL at D to 6,740,167.32 copies/mL at H (Table 3). Regional differences in the copy numbers in 2019 were higher than in 2018, ranging from zero at J to 248,181,801.83 copies/mL at E (Table 3). The copy numbers of C. polykrikoides obtained by qPCR were further compared with the direct cell counts (Figure 2).
The qPCR results exhibited a much higher sensitivity in quantification as well as qualification. The microscopic observation failed to detect C. polykrikoides cells at six sites, while qPCR detected them at all the examined sites except one, at which microscopic observation also found no cells (Table 3). In addition, the cell-counting methods failed to detect any cells even at sites where millions of rDNA copies were identified. The number of copies per cell varied from 5616.81 to 1,031,426.90 copies/cell in 2018 and from 6865.22 to 3,811,608,27 copies/cell in 2019. The average copy numbers per cell were 11,246.93 ± 6368.82 copies/cell (2018) and 947,759.84 ± 1,425,071.09 copies/cell (2019). There was a low degree of correlation (r2 = 0.4676) between the direct cell counts and copy numbers according to qPCR (Figure 2C). When those values for 2018 and 2019 were separately analyzed, a much higher degree of correlation was identified in each year (r2 = 0.7065 in 2018 and r2 = 0.8765 in 2019, respectively), suggesting different ribosomal DNA copy numbers among two C. polykrikoides strains (Figure 2A,B). The correlations of the copy numbers of C. polykrikoides to the environmental parameters were analyzed using the Pearson correlation coefficient (Table 4). The abundance of C. polykrikoides copies showed a positive correlation to the temperature (correlation coefficient = 0.605, p < 0.01), DIN (correlation coefficient = 0.646, p < 0.01), and Chl-a (correlation coefficient = 0.752, p < 0.01). Phytoplankton was also positively correlated with the total microorganisms and Chl-a (Table 4).
3.3. Microbial Community Structure during the Cochlodinium Bloom
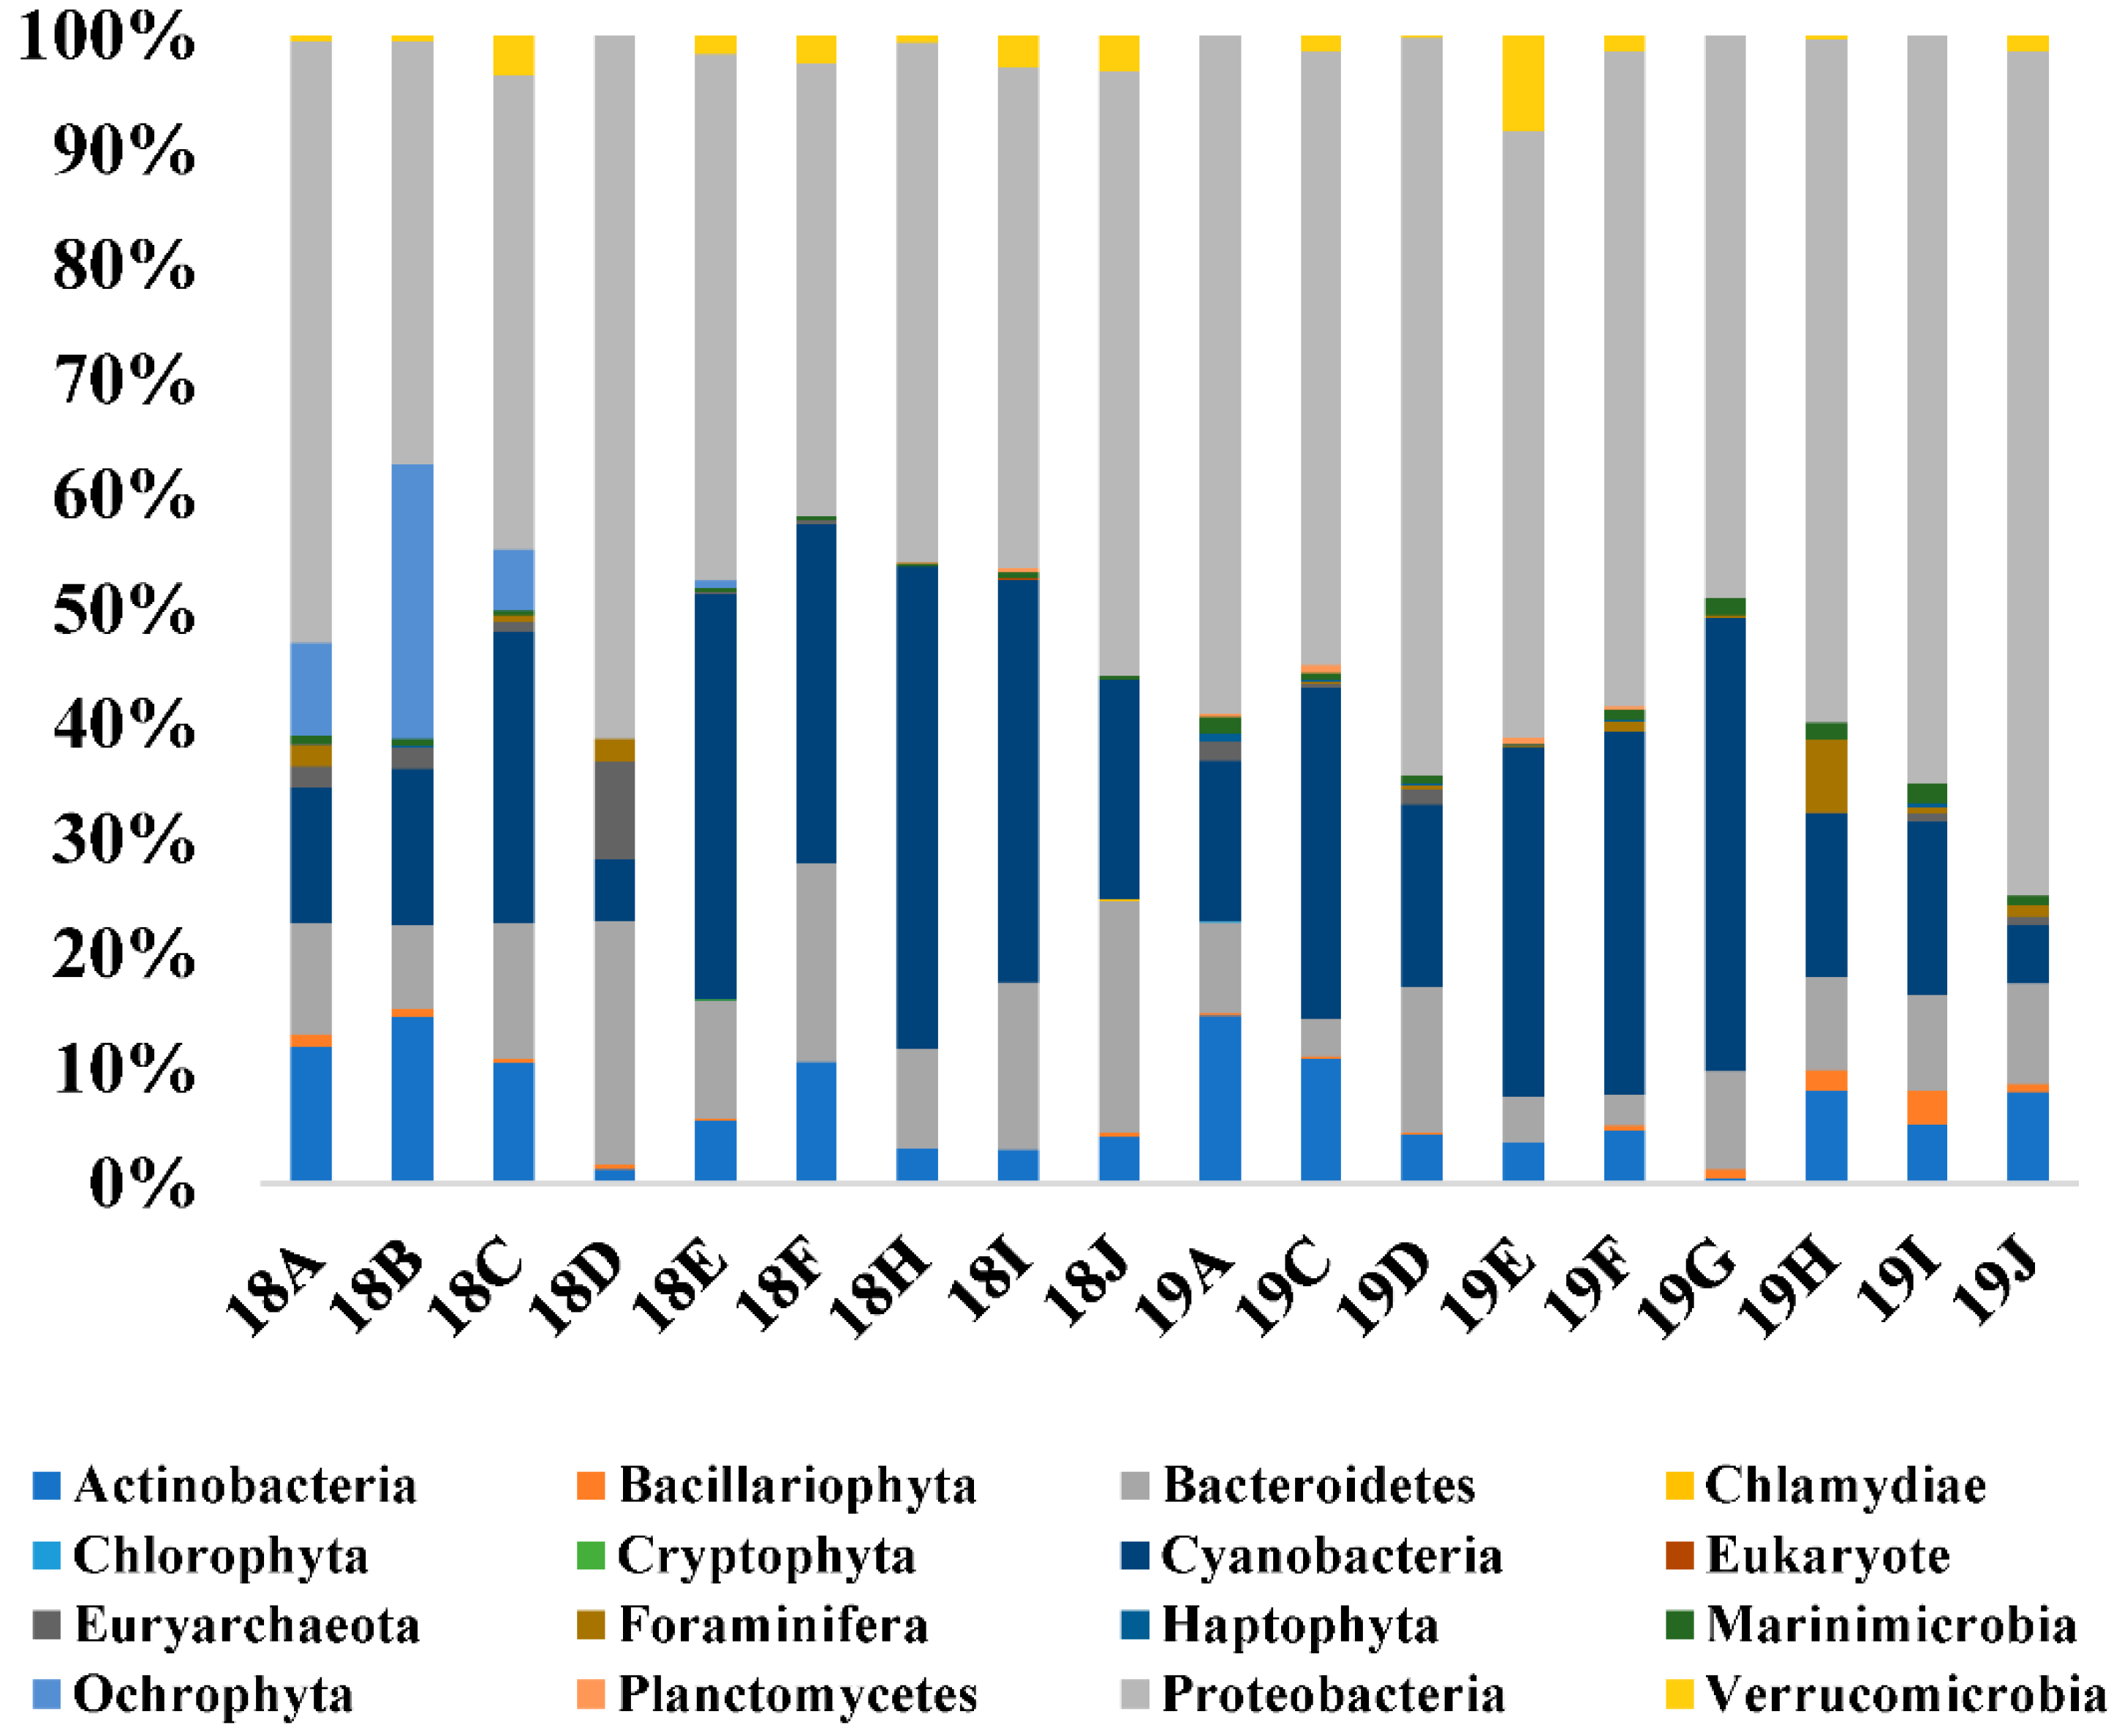
The microbial communities during blooms caused by C. polykrikoides were compared (Supplementary Tables S1 and S2). After trimming and clustering the raw reads, a total of 1,206,825 merged reads were obtained using 16S universal primer, with numbers at each site ranging from 25,282 to 129,715 (Supplementary Tables S1 and S2). A total of 367 microbial OTUs were identified from 18 seawater samples, with 99% as the cut-off identity, and were further classified into 15 phyla, including Actinobacteria, Bacillariophyta, Bacteroidetes, Chlamydiae, Chlorophyta, Crytophyta, Cyanobacteria, Euryarchaeota, Foraminifera, Haptophyta, Marinimicrobia, Ochrophyta, Planctomycetes, Proteobacteria, and Verrucomicrobia. The composition and relative abundance of the microbial community at the different 18 sampling sites were compared at the phylum level (Supplementary Tables S1 and S2 and Figure 3). Proteobacteria, Bacteroidetes, Actinobacteria, and Cyanobacteria were the major dominant phyla, with proportions ranging from 72.23 (18B) to 99.03% (18J) in the southern Korean coastal waters in this study. Proteobacteria exhibited an inverse pattern compared to Cyanobacteria (Figure 3). The Chao1, Pielou’s evenness (J’), Shannon index (H’), and Simpson index (1-λ) in Korean coastal waters during blooms caused by C. polykrikoides ranged from 22.71 to 50.20, from 0.47 to 0.70, from 2.85 to 4.19, and from 0.69 to 0.94, respectively (Table 5). These diversity indices were not significantly different at each sample (F = 0.03, p > 0.05).
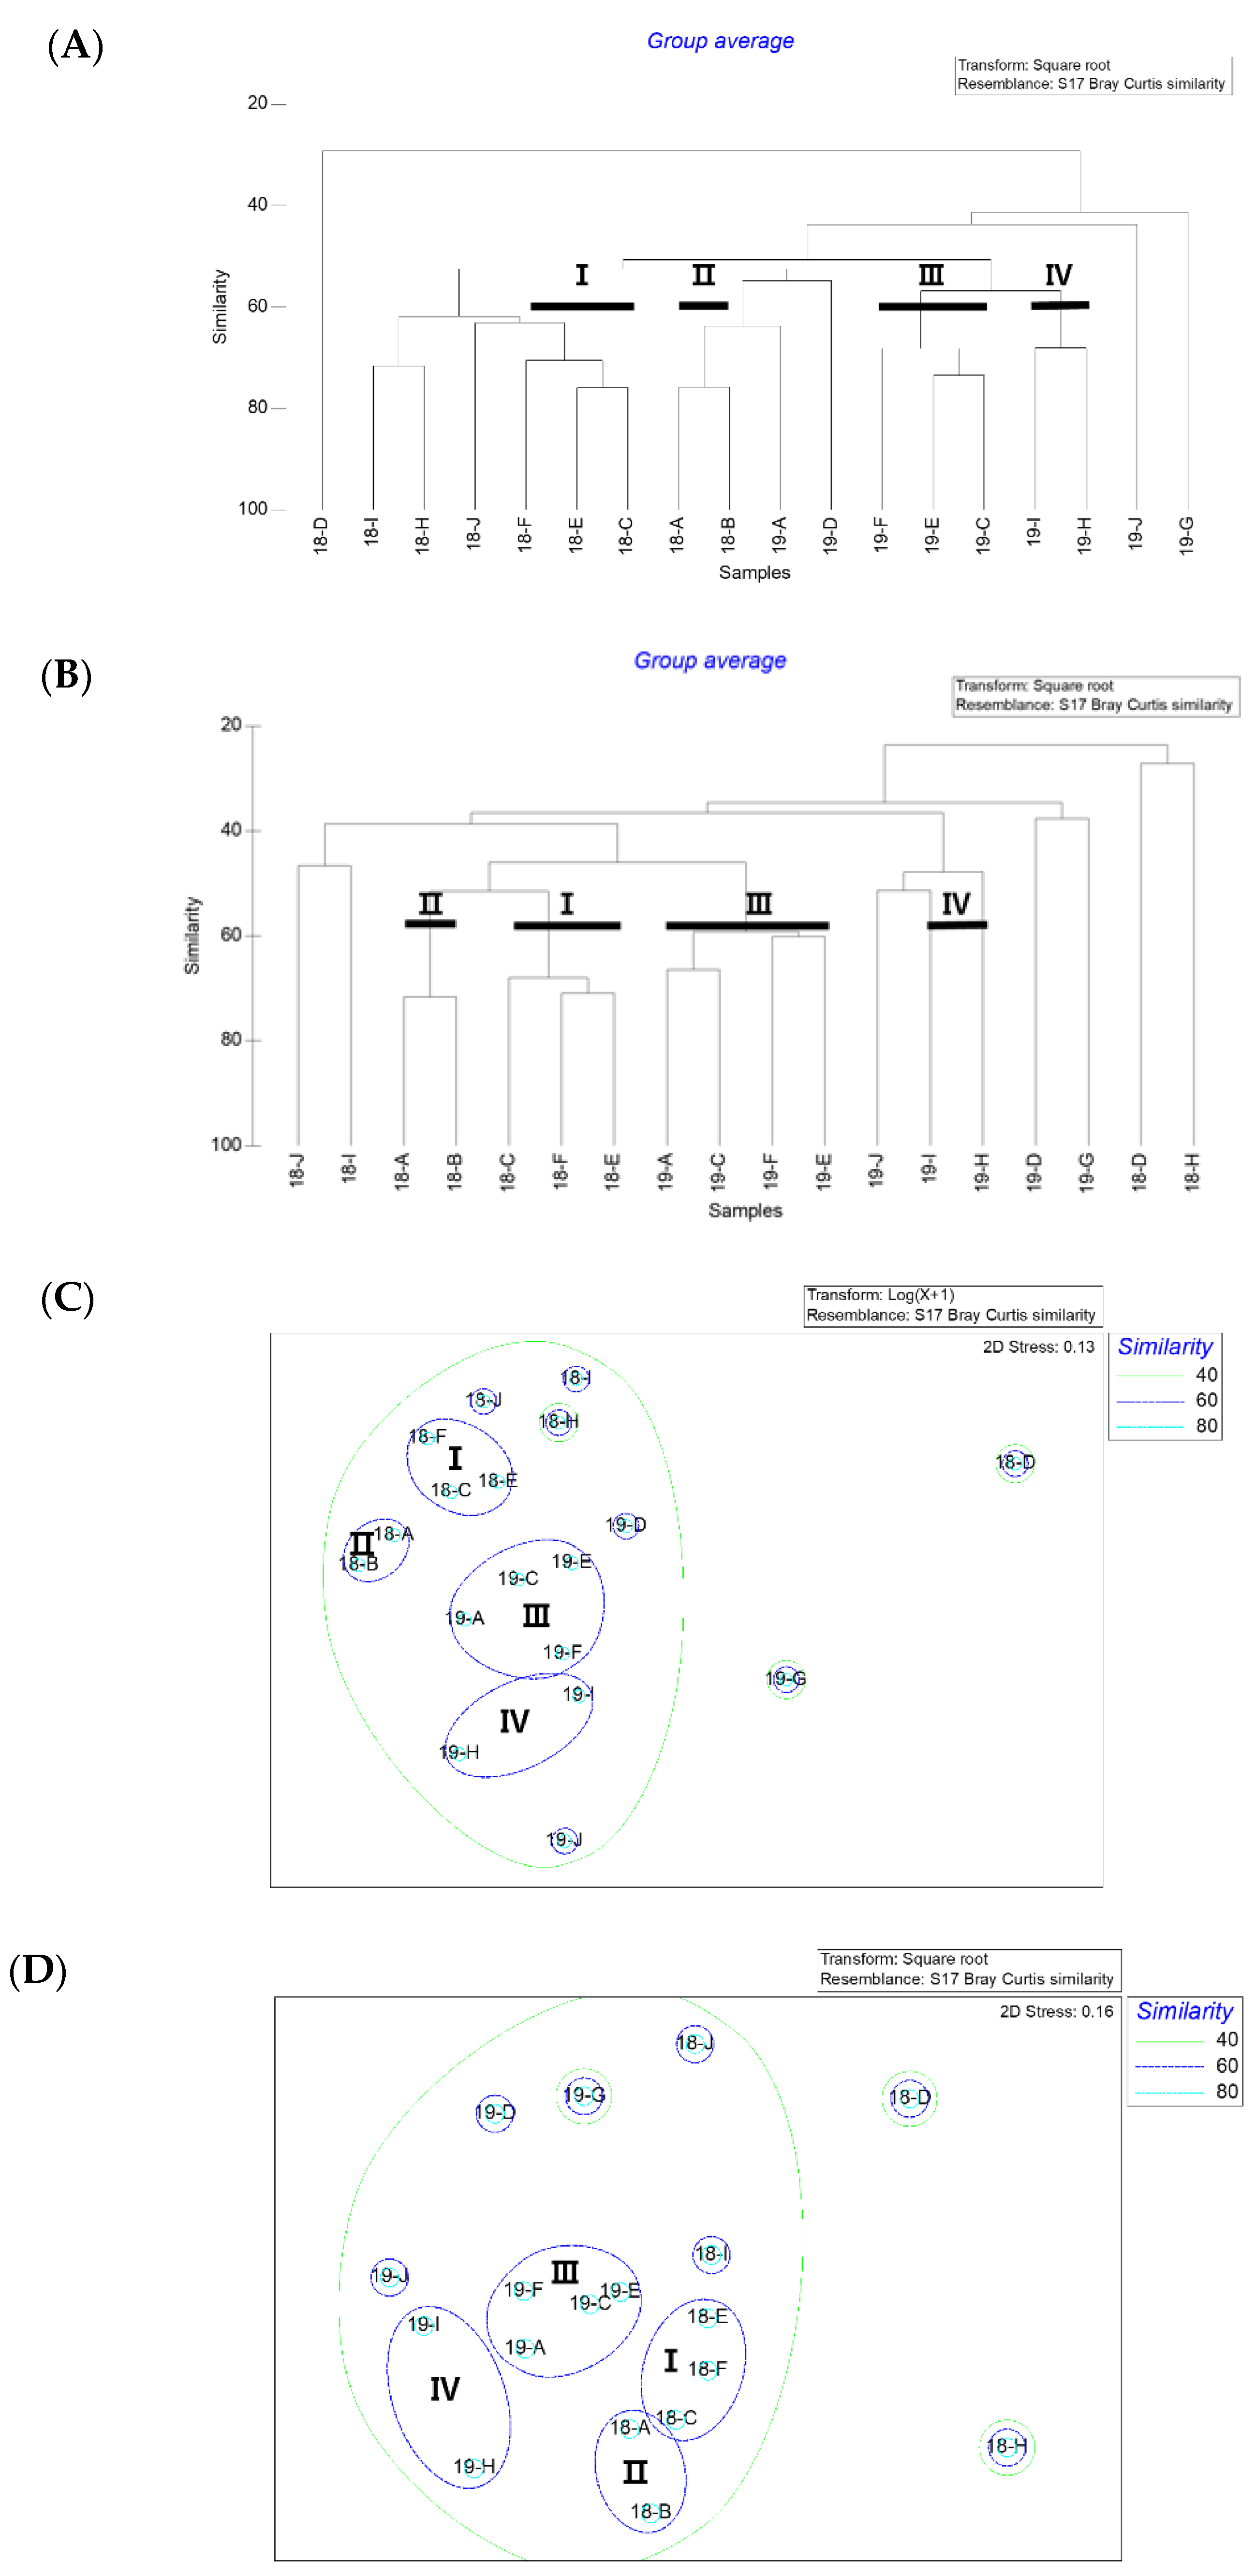
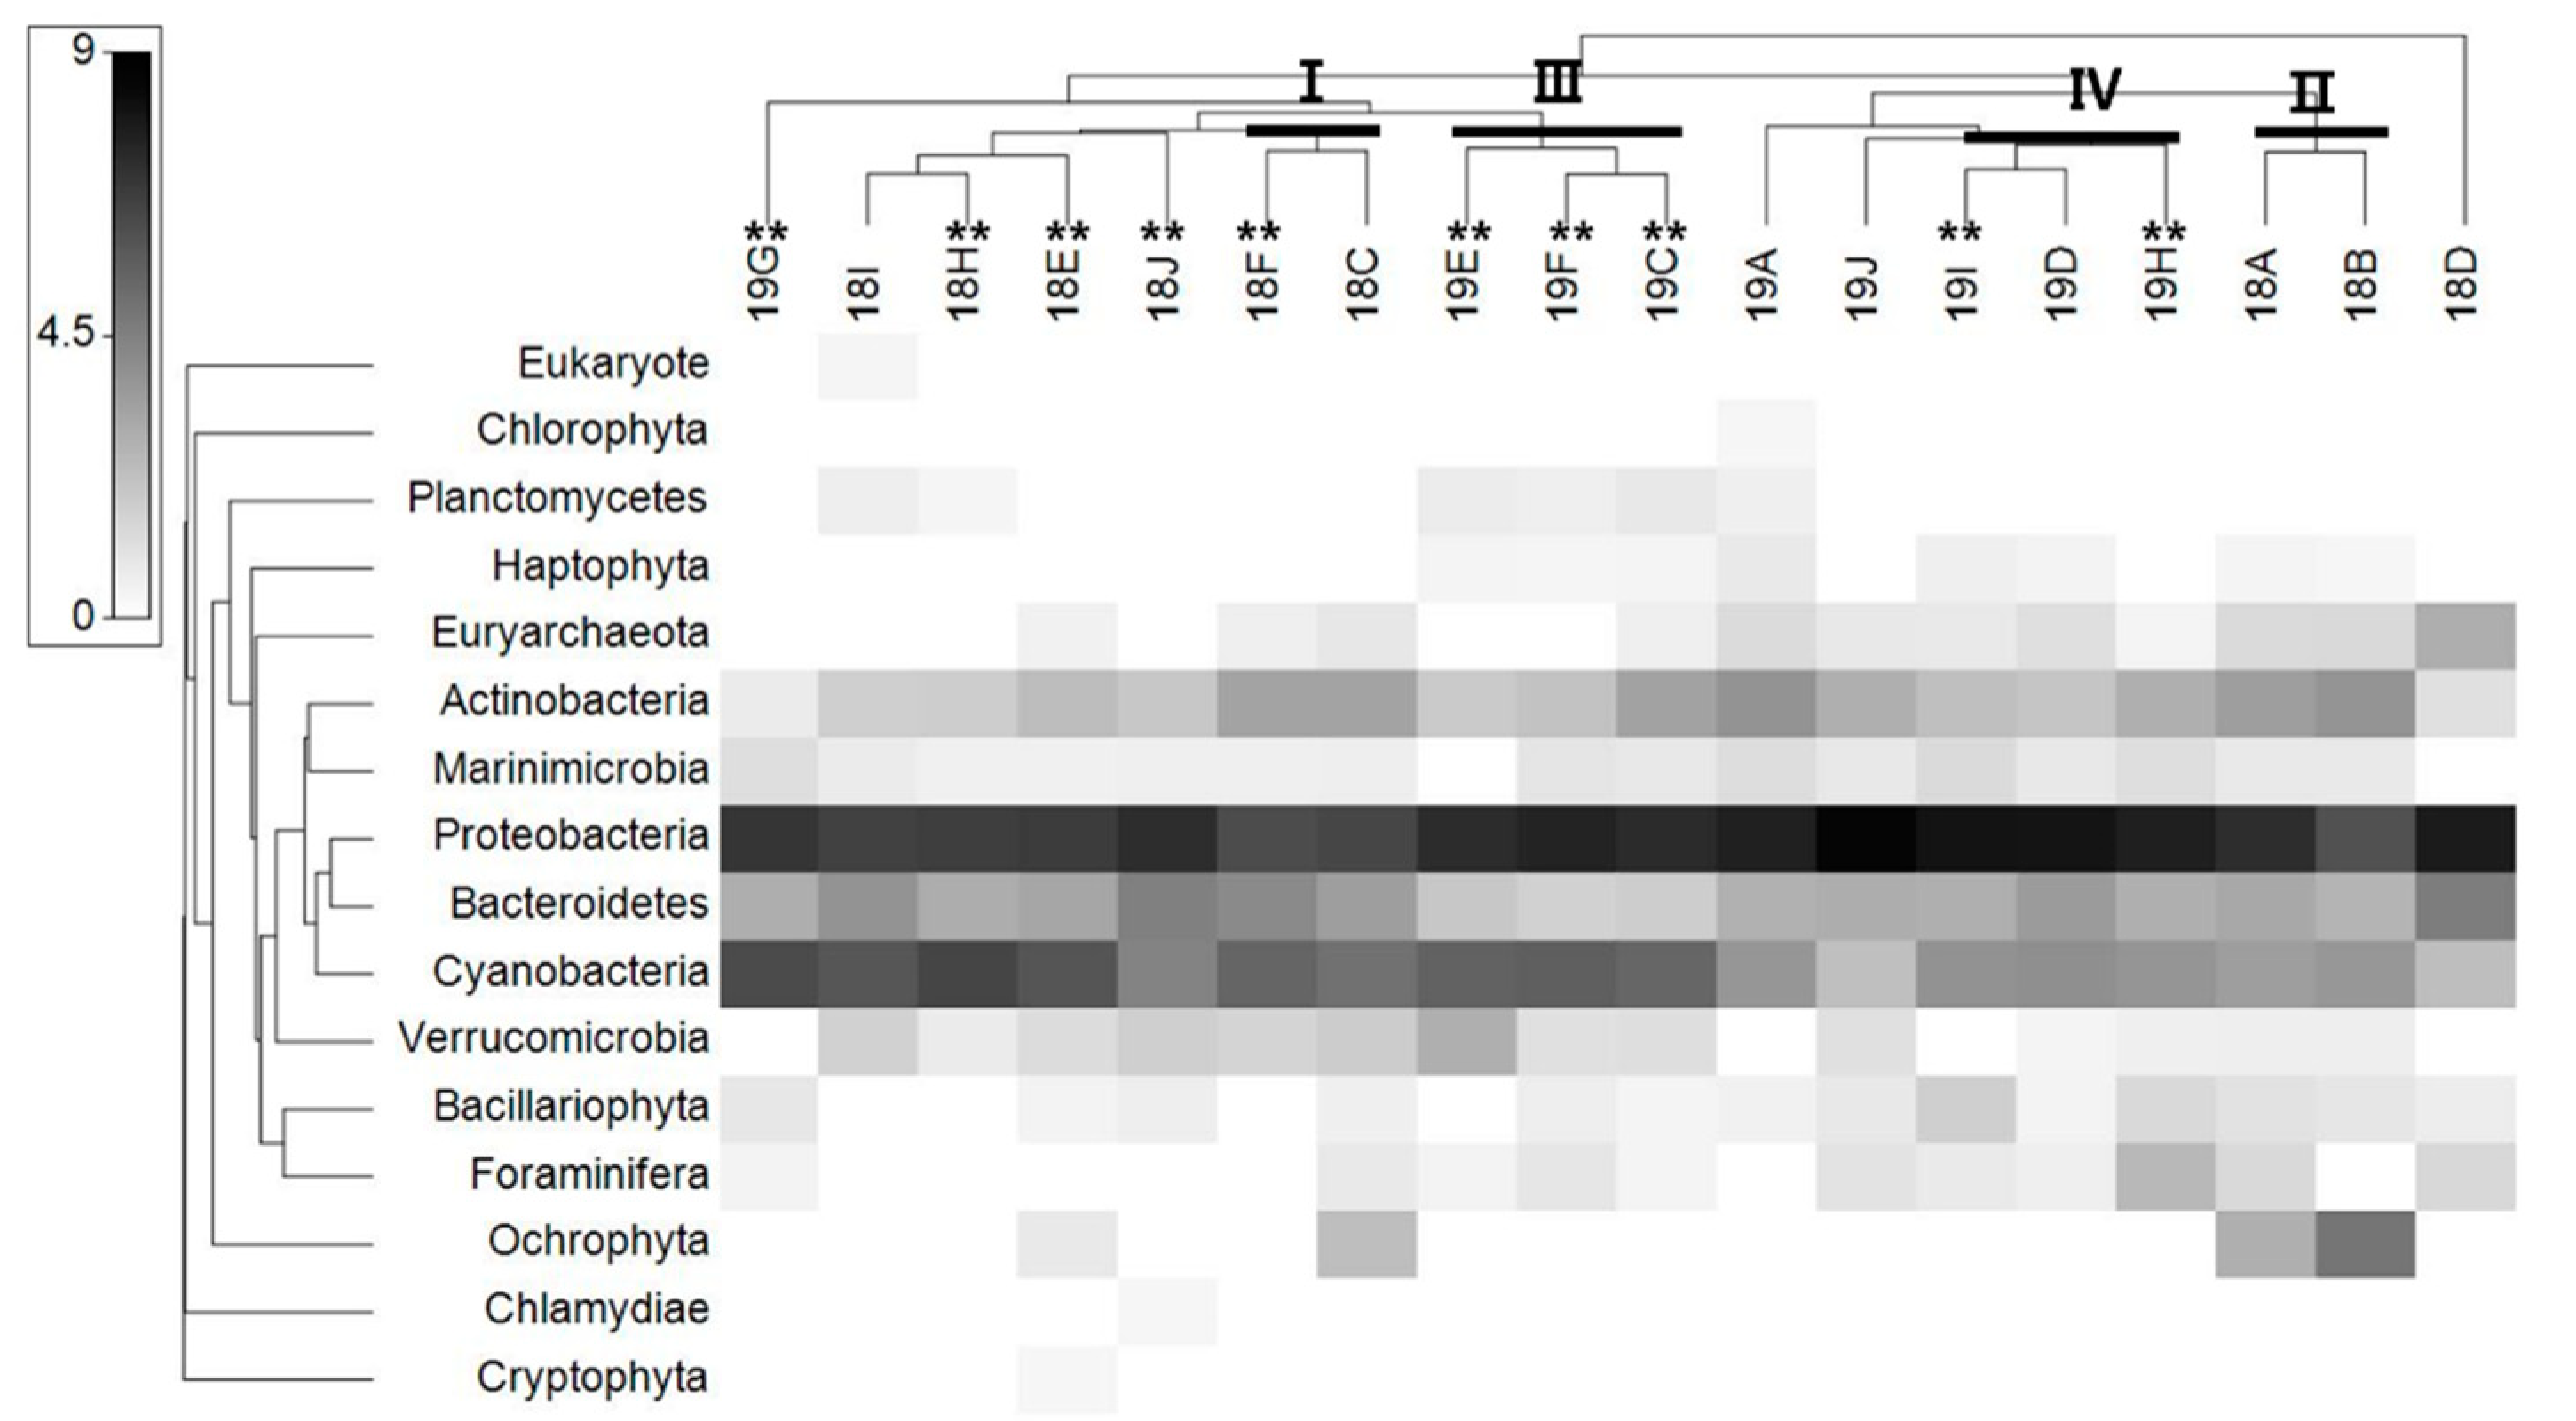
Bray–Curtis cluster analyses of the microbial communities were performed to determine whether there were differences in their structures (Figure 4A). The cluster analysis of the microbial communities showed four main clusters at a similarity level of 60%. Clusters Ι and ΙΙ grouped the samples that were collected from the Yoesu coastal waters in 2018 and 2019, respectively. The second cluster (Cluster ΙI) grouped the samples from the two stations located at the leftmost side among the sampling sites (18A, 18B), from 2018. Finally, the fourth cluster (Cluster ΙV) grouped samples collected in 2019 from the Tongyeong coastal waters. Heatmap plots were constructed to determine significantly different taxa in the microbial communities of the 18 samples. The heatmap analysis of the phyla showed distinct differences among the samples (Figure 5). The samples (except for 18C and 18I) in which millions of copies of C. polykrikoides rDNA were detected, including Clusters Ι and ΙΙΙ, showed that the phyla Cyanobacteria were the most significantly different from the other communities (Figure 5). The phyla Verrucomicrobia and Planctomycetes characterized these clusters. The ANOSIM and PERMANOVA analyses of the microbial communities, using the Bray–Curtis dissimilarity measure on the square root-transformed data, indicate that the differences in microbial community structure were dependent on factors associated with the sampling year (Table 6).
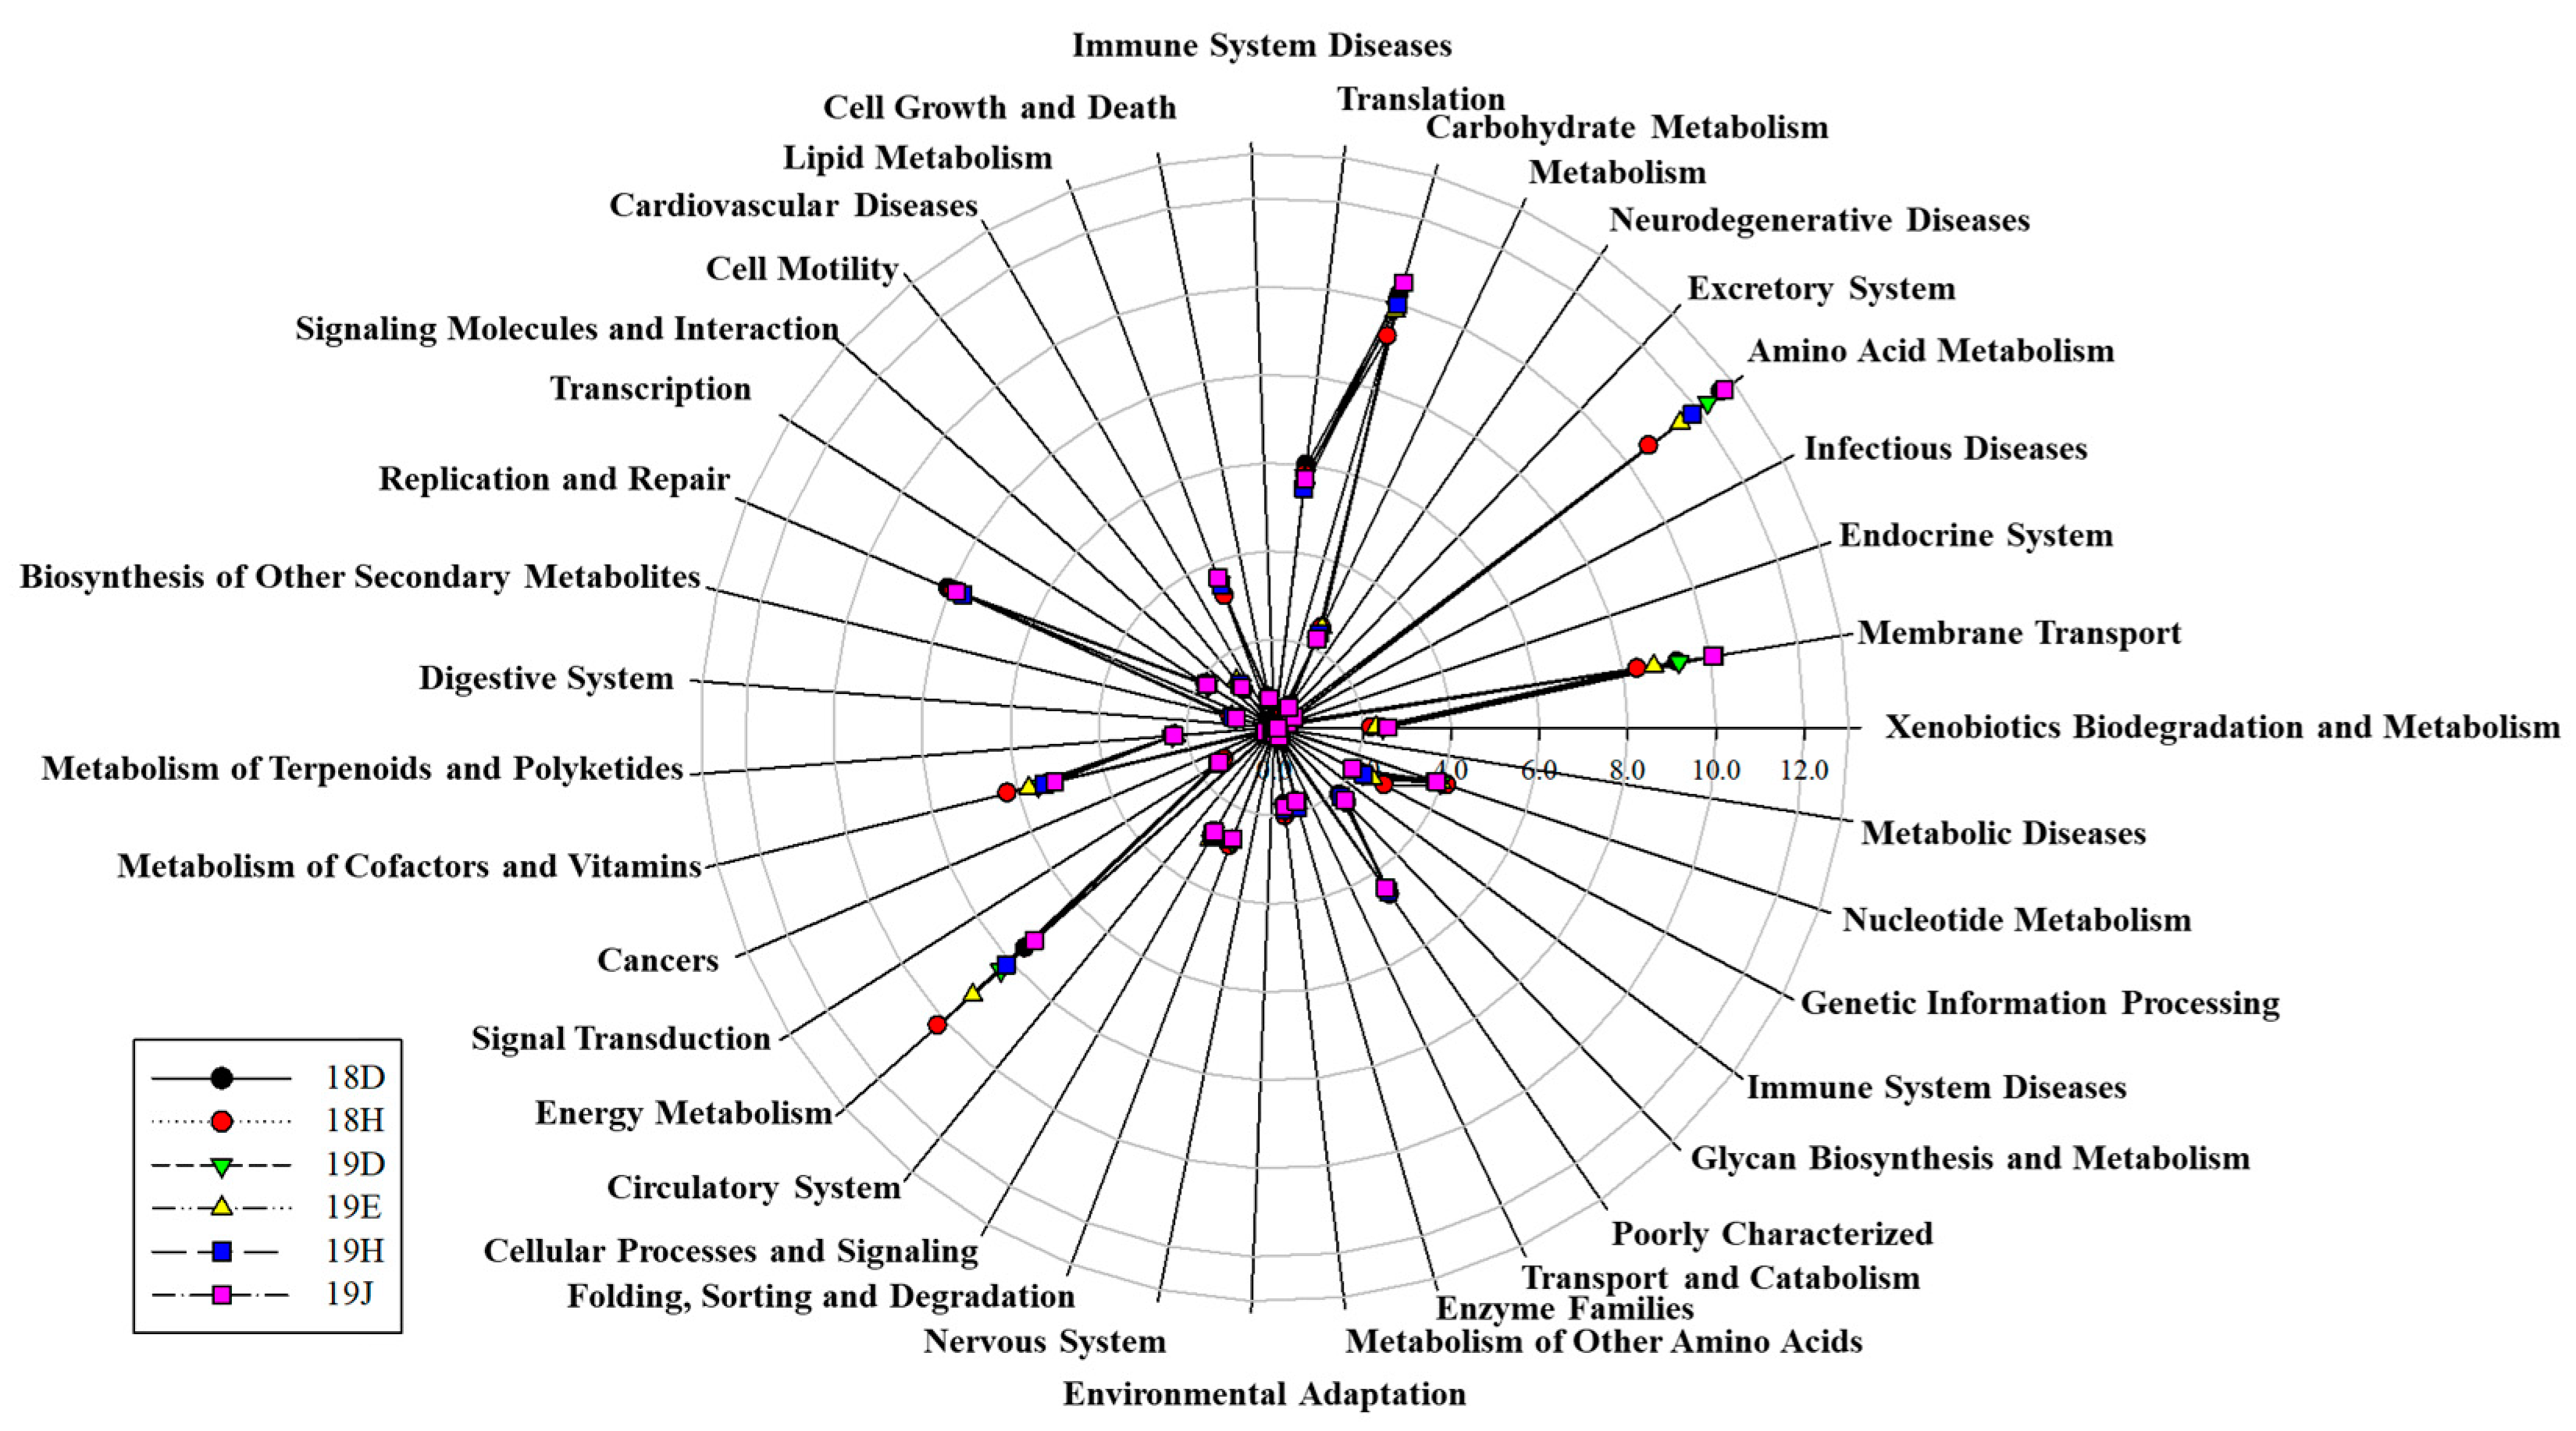
To identify the significant microorganism for C. polykrikoides blooms, correlation analysis was performed based on the copy numbers of the C. polykrikoides rDNA and microbial OTUs generated by the metabarcoding analysis. In 2018, three microbial OTUs (correlation coefficient ≥ 0.5 and p < 0.05), i.e., Cyanobacterium (16SOTU19), Gamma proteobacterium (16SOTU29), and Rhodobacteraceae bacterium (16SOTU92) showed significant correlation with the abundance of C. polykrikodes. Additionally, in 2019, five Gamma proteobacteria OTUs (16SOTU29, 70, 211, 265, 274), four Alpha proteobacterium OTUs (16SOTU102, 146, 153, 351), two Flavobacterium OTUs (16SOTU123, 338), Verrucomicrobia bacterium (16SOTU125), Pelagibacteraceae bacterium (16SOTU308), and Planctomycete sp. (16SOTU350) had strong positive correlations with C. polykrikodes. However, only four microbial OTUs—Gamma proteobacterium (16SOTU70), Flavobacteriales bacterium (16SOTU123), Verrucomicrobia bacterium (16SOTU125), and Alpha proteobacterium (16SOTU153)—had strong positive correlations with C. polykrikoides from among the total microbial OTUs (2018, 2019) (Table 7). Meanwhile, energy metabolism was the main pathway at station H (Figure 6). Neurodegenerative disease-related functions showed higher levels (about 1.5 times higher) at stations where the numbers of C. polykrikoides were comparatively lower. Functions related to the circulatory system and cardiovascular disease showed similar trends. In contrast, the functions of signaling molecules and interactions, the immune system, and the digestive system showed higher levels (about 1.5 times) in samples where C. polykrikoides was more abundant (Figure 6).
3.4. Phytoplanktkonl Community Structure during the Cochlodinium Bloom
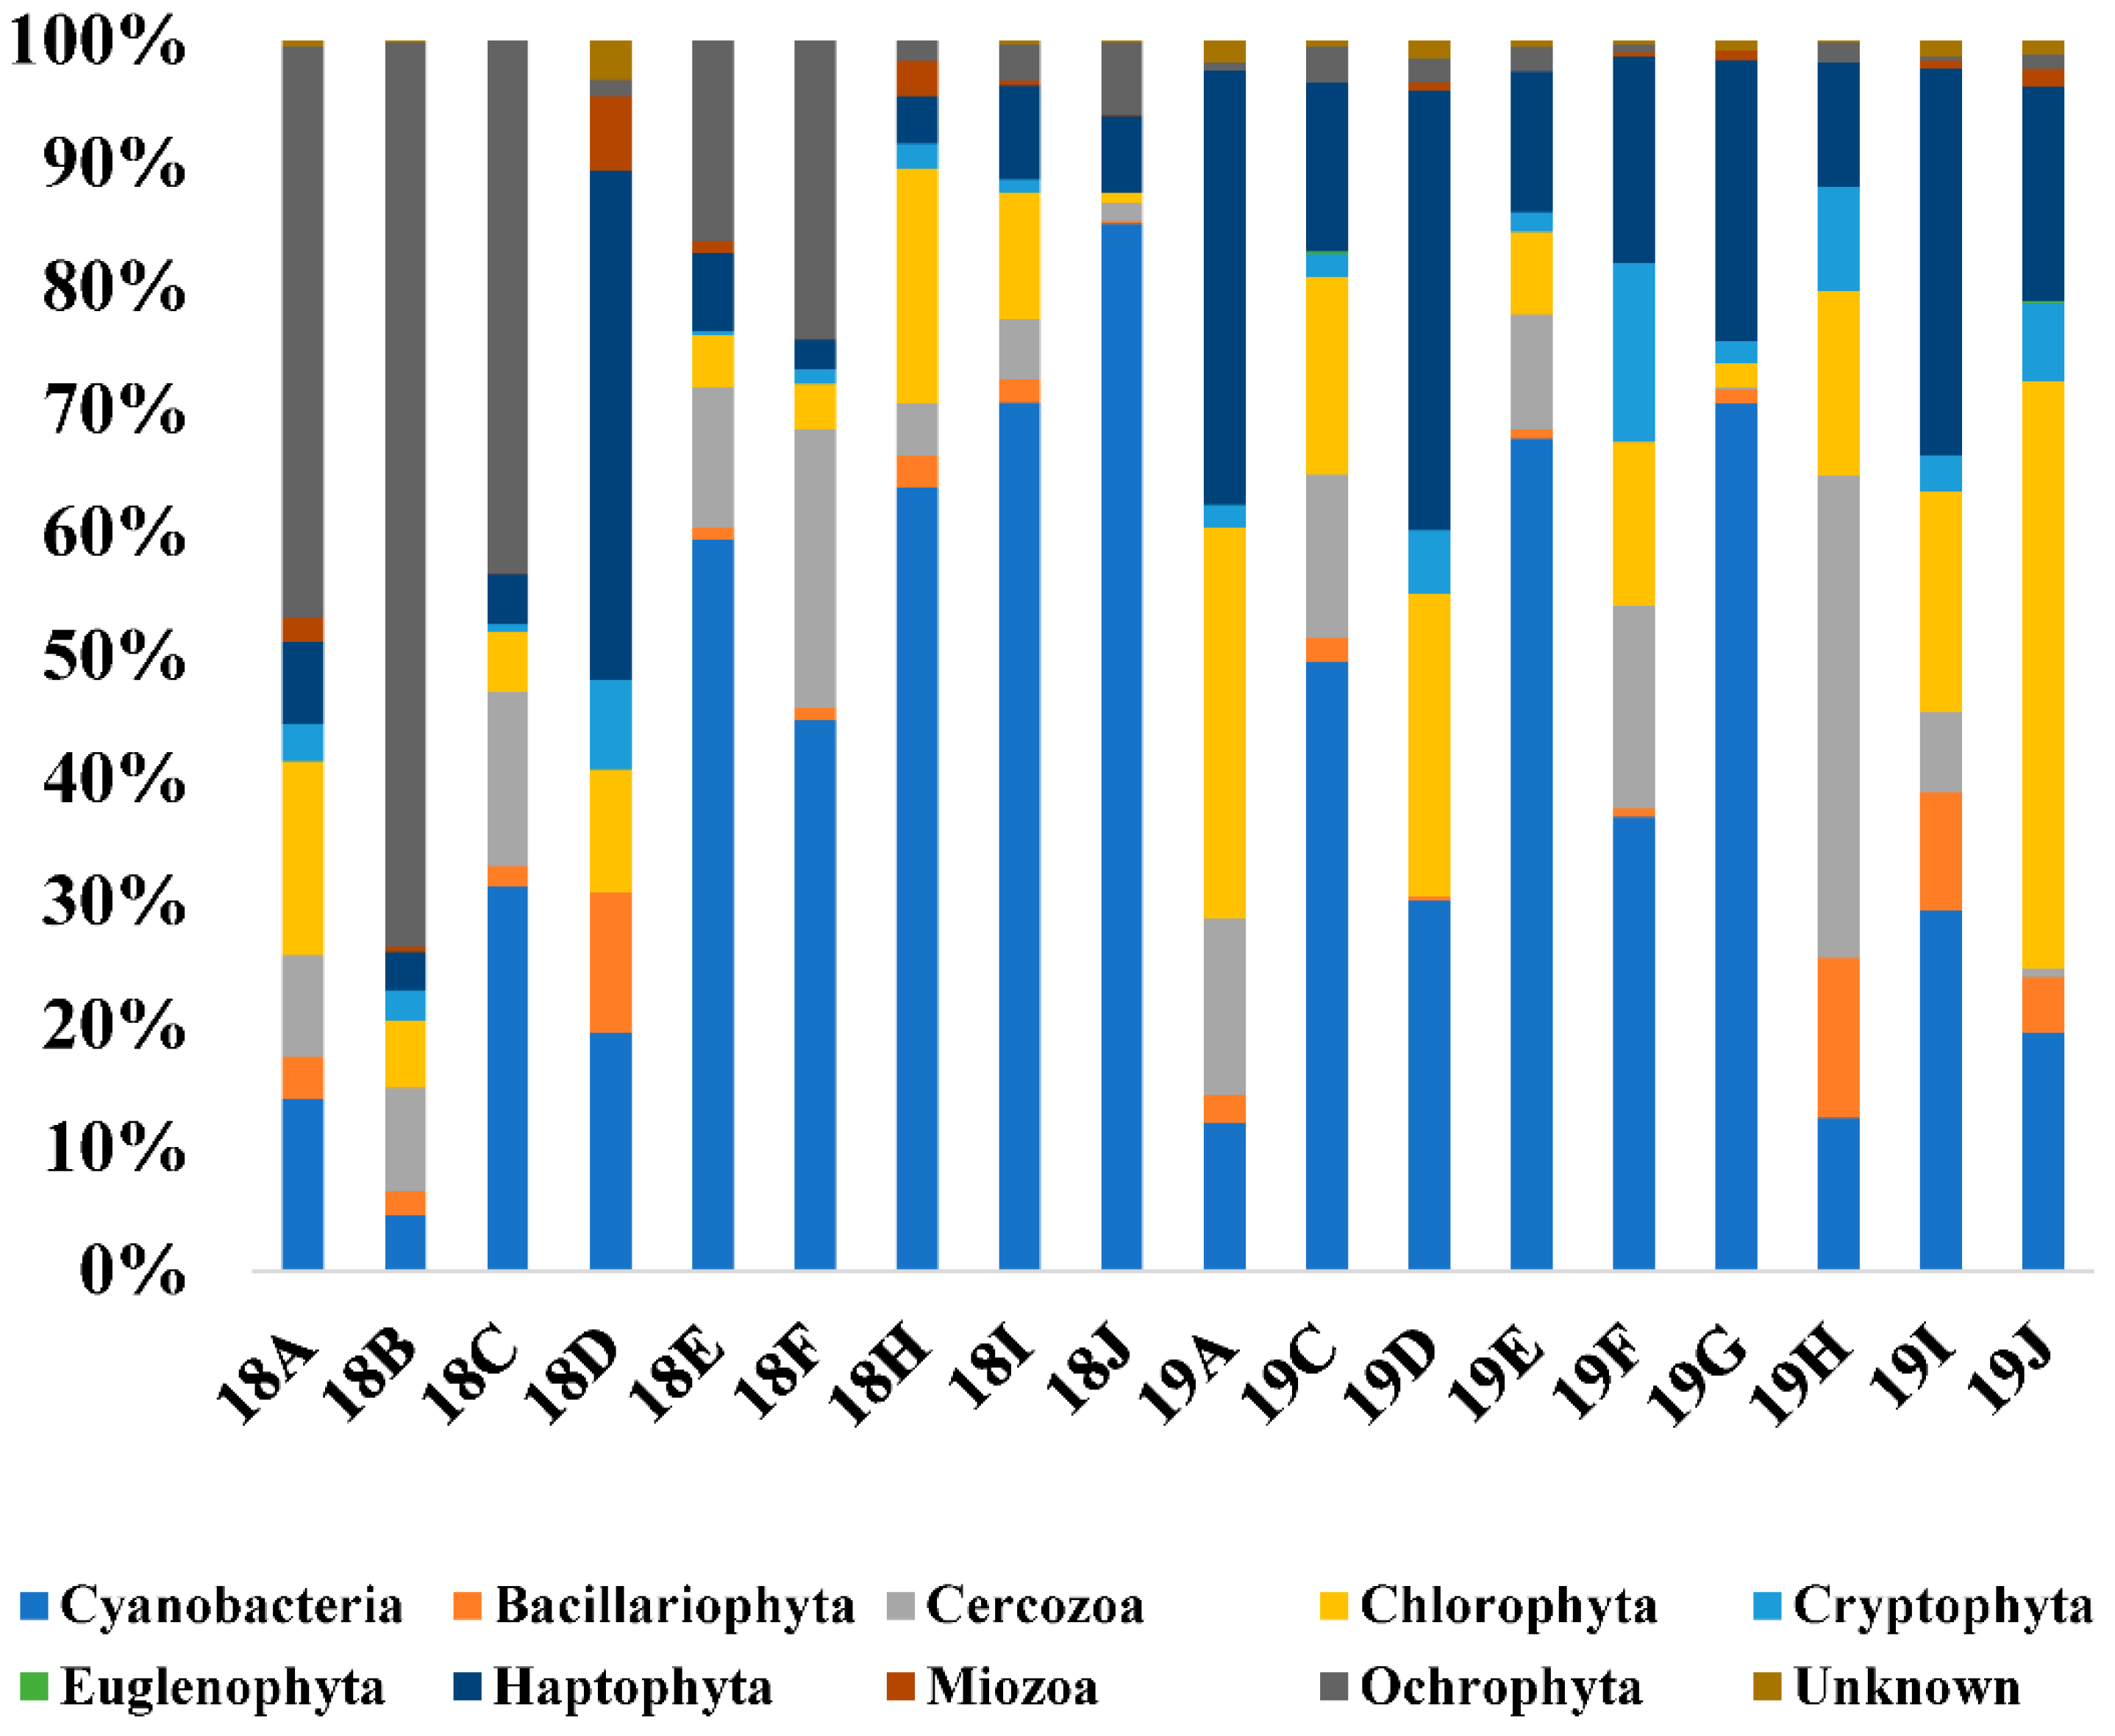
Amplified sequences from p23S universal primer sets were subjected to a series of bioinformatics and quality processes, resulting in 21,417 to 84,125 merged contigs (Supplementary Tables S3 and S4). Clustered with a 99% similarity cut-off, 261 phytoplankton OTUs were identified from 18 water samples taken from southern Korean coastal waters in 2018 and 2019. The numbers of OTUs in each sample ranged from 31 (18F) to 52 (18D, 19C, and 19D). A total of 261 OTUs were classified into the unknown group with less than 90% sequence identity, and including nine phyla, i.e., Cyanobacteria, Bacillariophyta, Cerocozoa, Chlorophyta, Cryptophyta, Euglenophyta, Haptophyta, Miozoa, and Ochrophyta (Supplementary Tables S3 and S4, Figure 7). The diversity indices of the phytoplankton communities of the 18 water samples are shown in Table 5. Values for Chao1, Pielou’s evenness (J’), Shannon index (H’), and Simpson index (1-λ) in Korean coastal waters during blooms caused by C. polykrikoides ranged from 7.45 to 11.89, 0.38 to 0.73, 1.68 to 3.47, and 0.59 to 0.94, respectively (Table 5). The minimum values of the four diversity indices occurred at 18J and 19G, but these diversity indices were not significantly different in each sample (F = 0.04, p > 0.05).
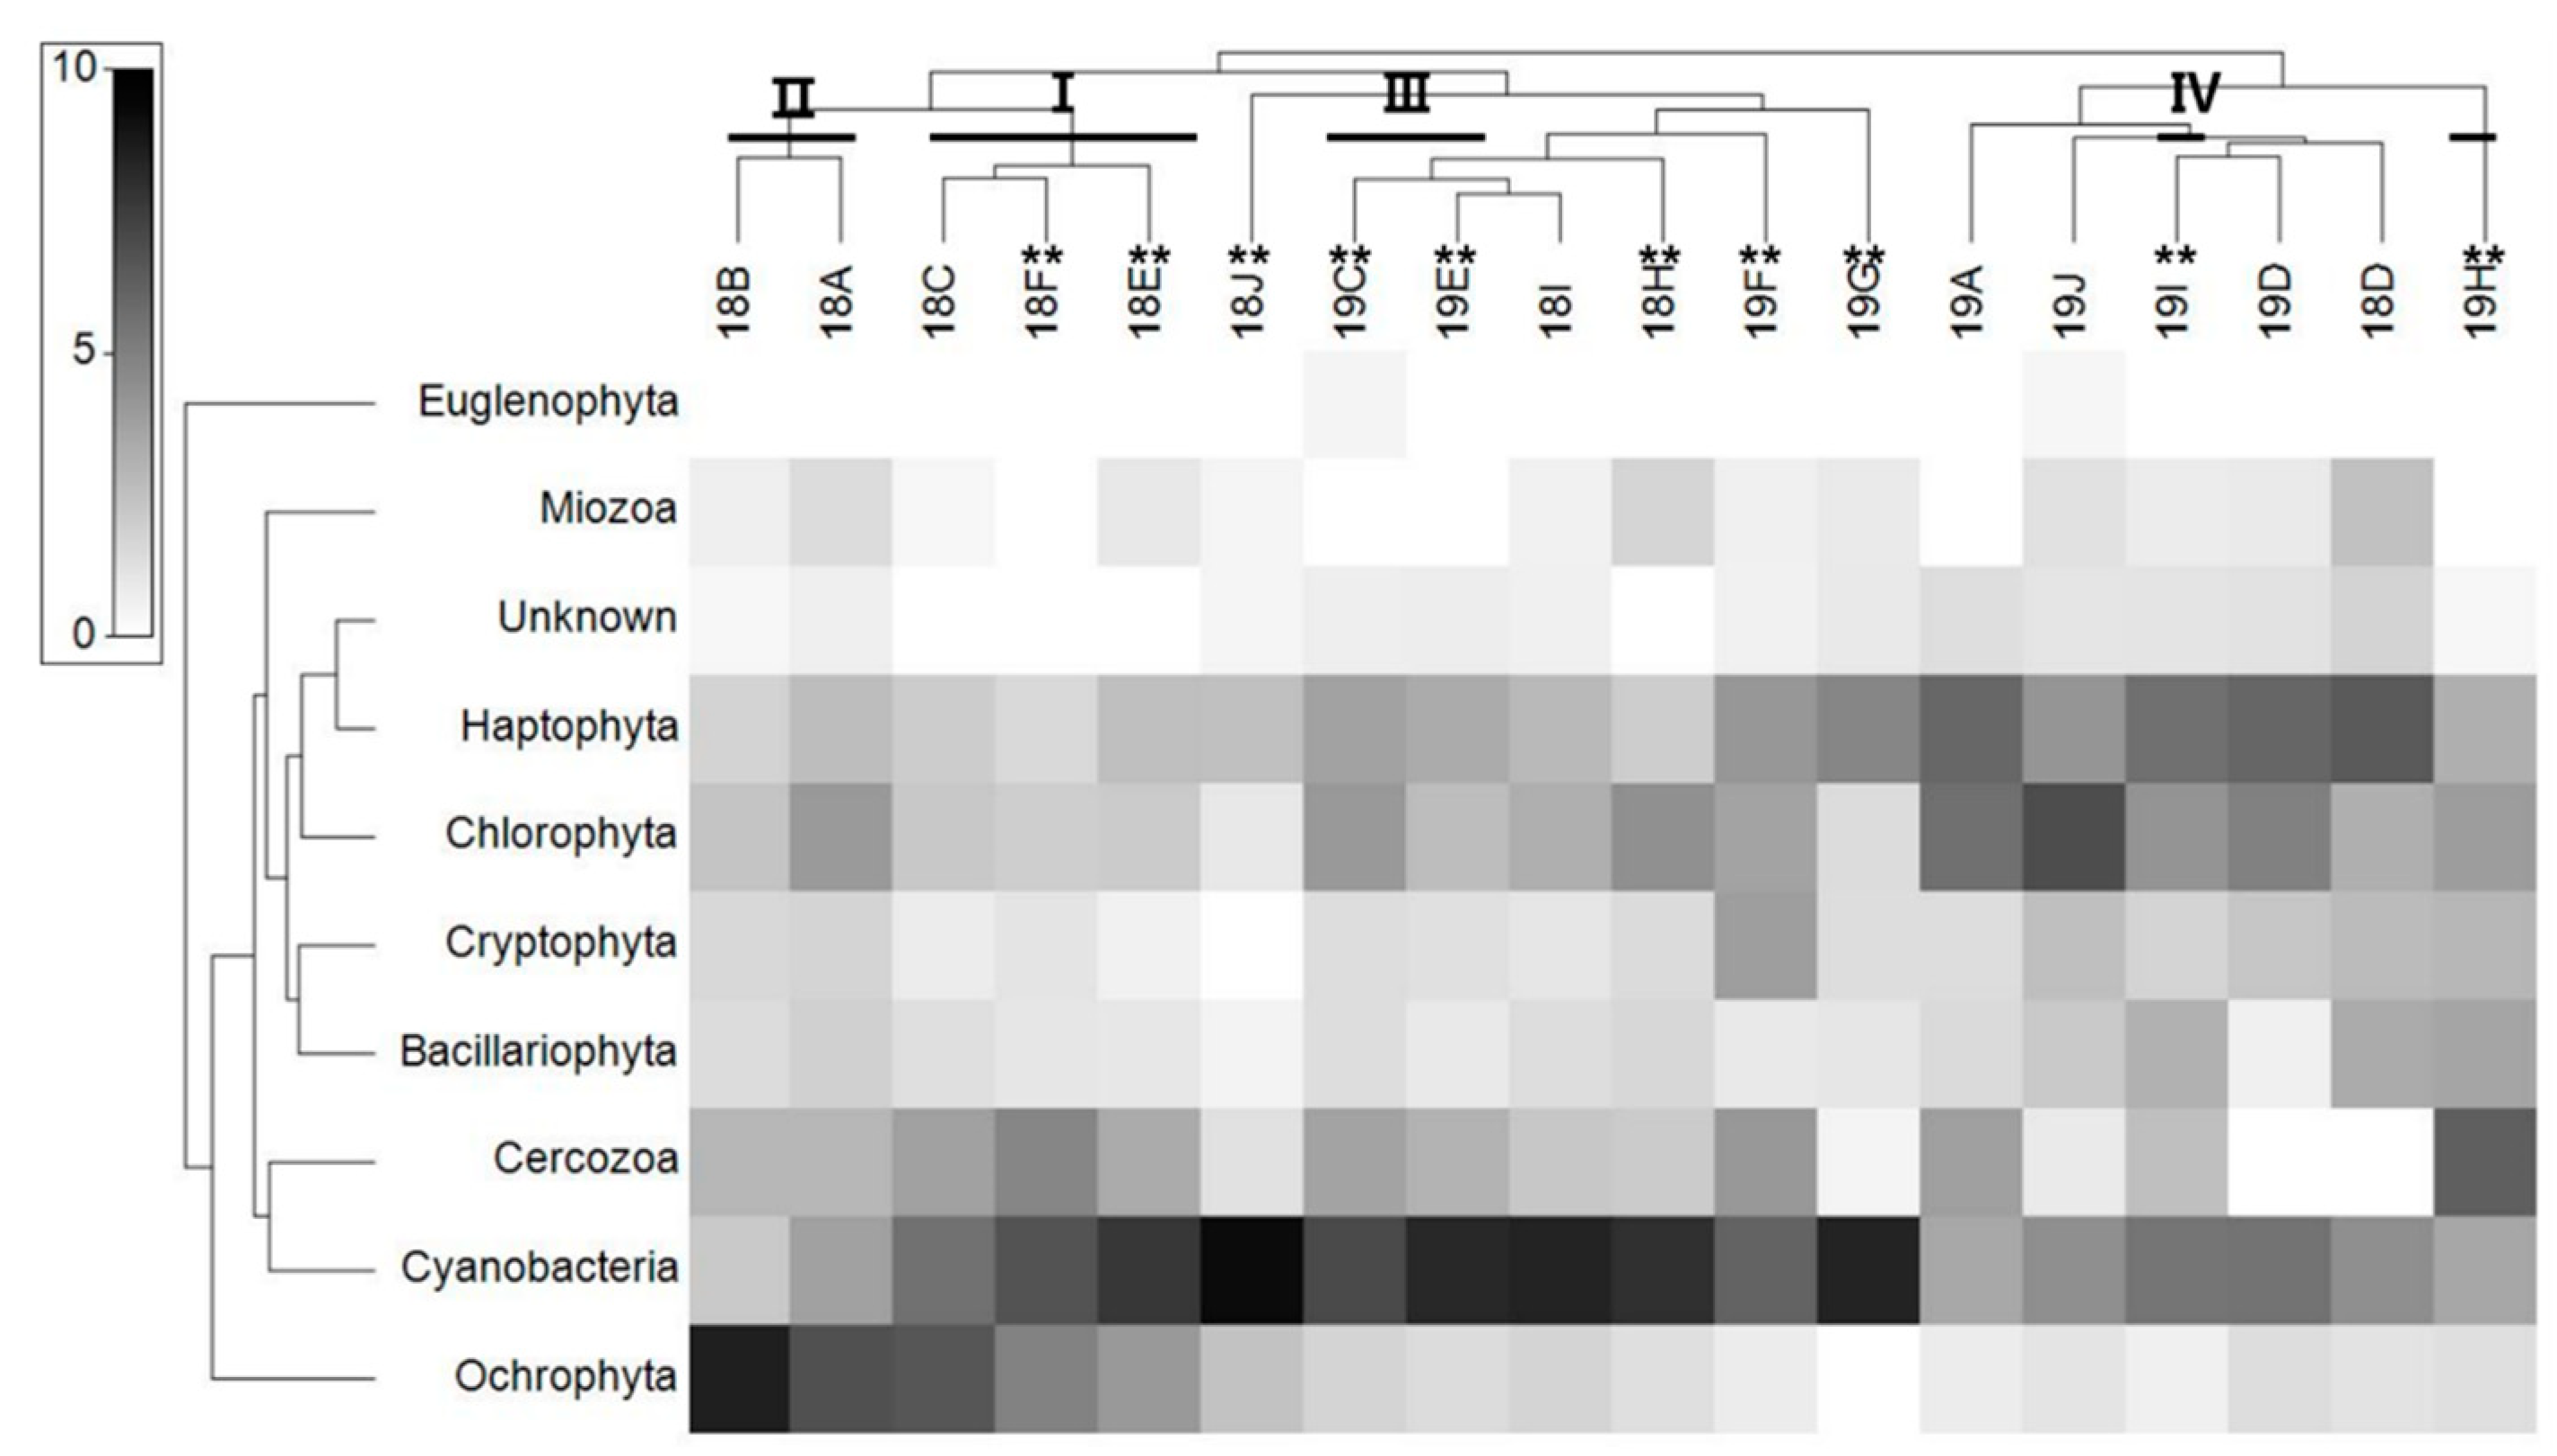
There was a significant positive correlation between the copy number of C. polykrikoides rDNA and the Cyanobacteria taxa (0.468, p < 0.05) which ranged from 4.59% (18B) to 85.12% (18J). However, Haptophyta, which is composed mainly of Chrysochromulina parva (MG520331) and Phaeocystis globosa (KC900889), was the dominant group at station D. In 2018, a relatively high proportion of the Ochrophyta group accounted for up to 73.49% (B) at relatively neritic sites, and was identified as the Heterosigma akashiwo species. Overall, the proportion of Haptophyta was higher in the 2019 samples than in those from 2018, excluding station D, and the proportion of Ochrophyta was higher in 2018 than in 2019. Similar to the microbial communities, cluster analysis based on the phytoplankton communities showed four main clusters (Clusters Ι to ΙV) at a similarity level of 60% (Figure 4B,D). Cyanobacteria were the most significant phyla in the phytoplankton communities with C. polykrikoides. The ANOSIM and PERMANOVA analyses based on the phytoplankton community using the Bray–Curtis dissimilarity measure on the square root-transformed data indicated that the differences in the microbial community structure were dependent on factors associated with the sampling year (Table 6).
In order to identify the significant phytoplankton for C. polykrikoides blooms, a correlation analysis was performed to assess the relation between the abundance of C. polykrikoides and phytoplankton OTUs generated by metabarcoding analysis. Teleaulax minuta (23SOTU11), which is a phytoplankton OTU, had a strong negative correlation, and eleven phytoplankton OTUs—Bathycoccus sp. (23SOTU16), Micromonas pusilla (23SOTU26), Attheya sp. (23SOTU58), Actinocyclus subtilis (23SOTU59), Kryptoperidinium foliaceum (23SOTU72), Emiliania huxleyi (23SOTU107), Mallomonas sp. (23SOTU116), Thalassiosira oceanica (23SOTU160), and Synechococcus sp. (23SOTU193, 211, 212) had strong positive correlations with C. polykrikoides in 2018. However, in 2019 Teleaulax minuta (23SOTU11) showed a strong negative correlation, and Mallomonas sp. (23SOTU116, 150), Synechococcus sp. (23SOTU125, 215), and Ochromonas sp. (23SOTU171) each had a strong positive correlation. Only four OTUs—Prymnesiophyte sp.(23SOTU25), Mallomonas sp. (23SOTU150), Ochromonas sp. (23SOTU171), Synechococcus sp. (23SOTU215)—had a strong positive correlation with C. polykrikoides in the phytoplankton communities (Table 8). Findings showed showed that the pattern of species correlated with C. polykrikoides differed from year to year, and the Cyanobacteria group was closely related to the blooms of C. polykrkikoides (Table 8).
3.5. Correlation of C. polykrikoides with Environmental Factors
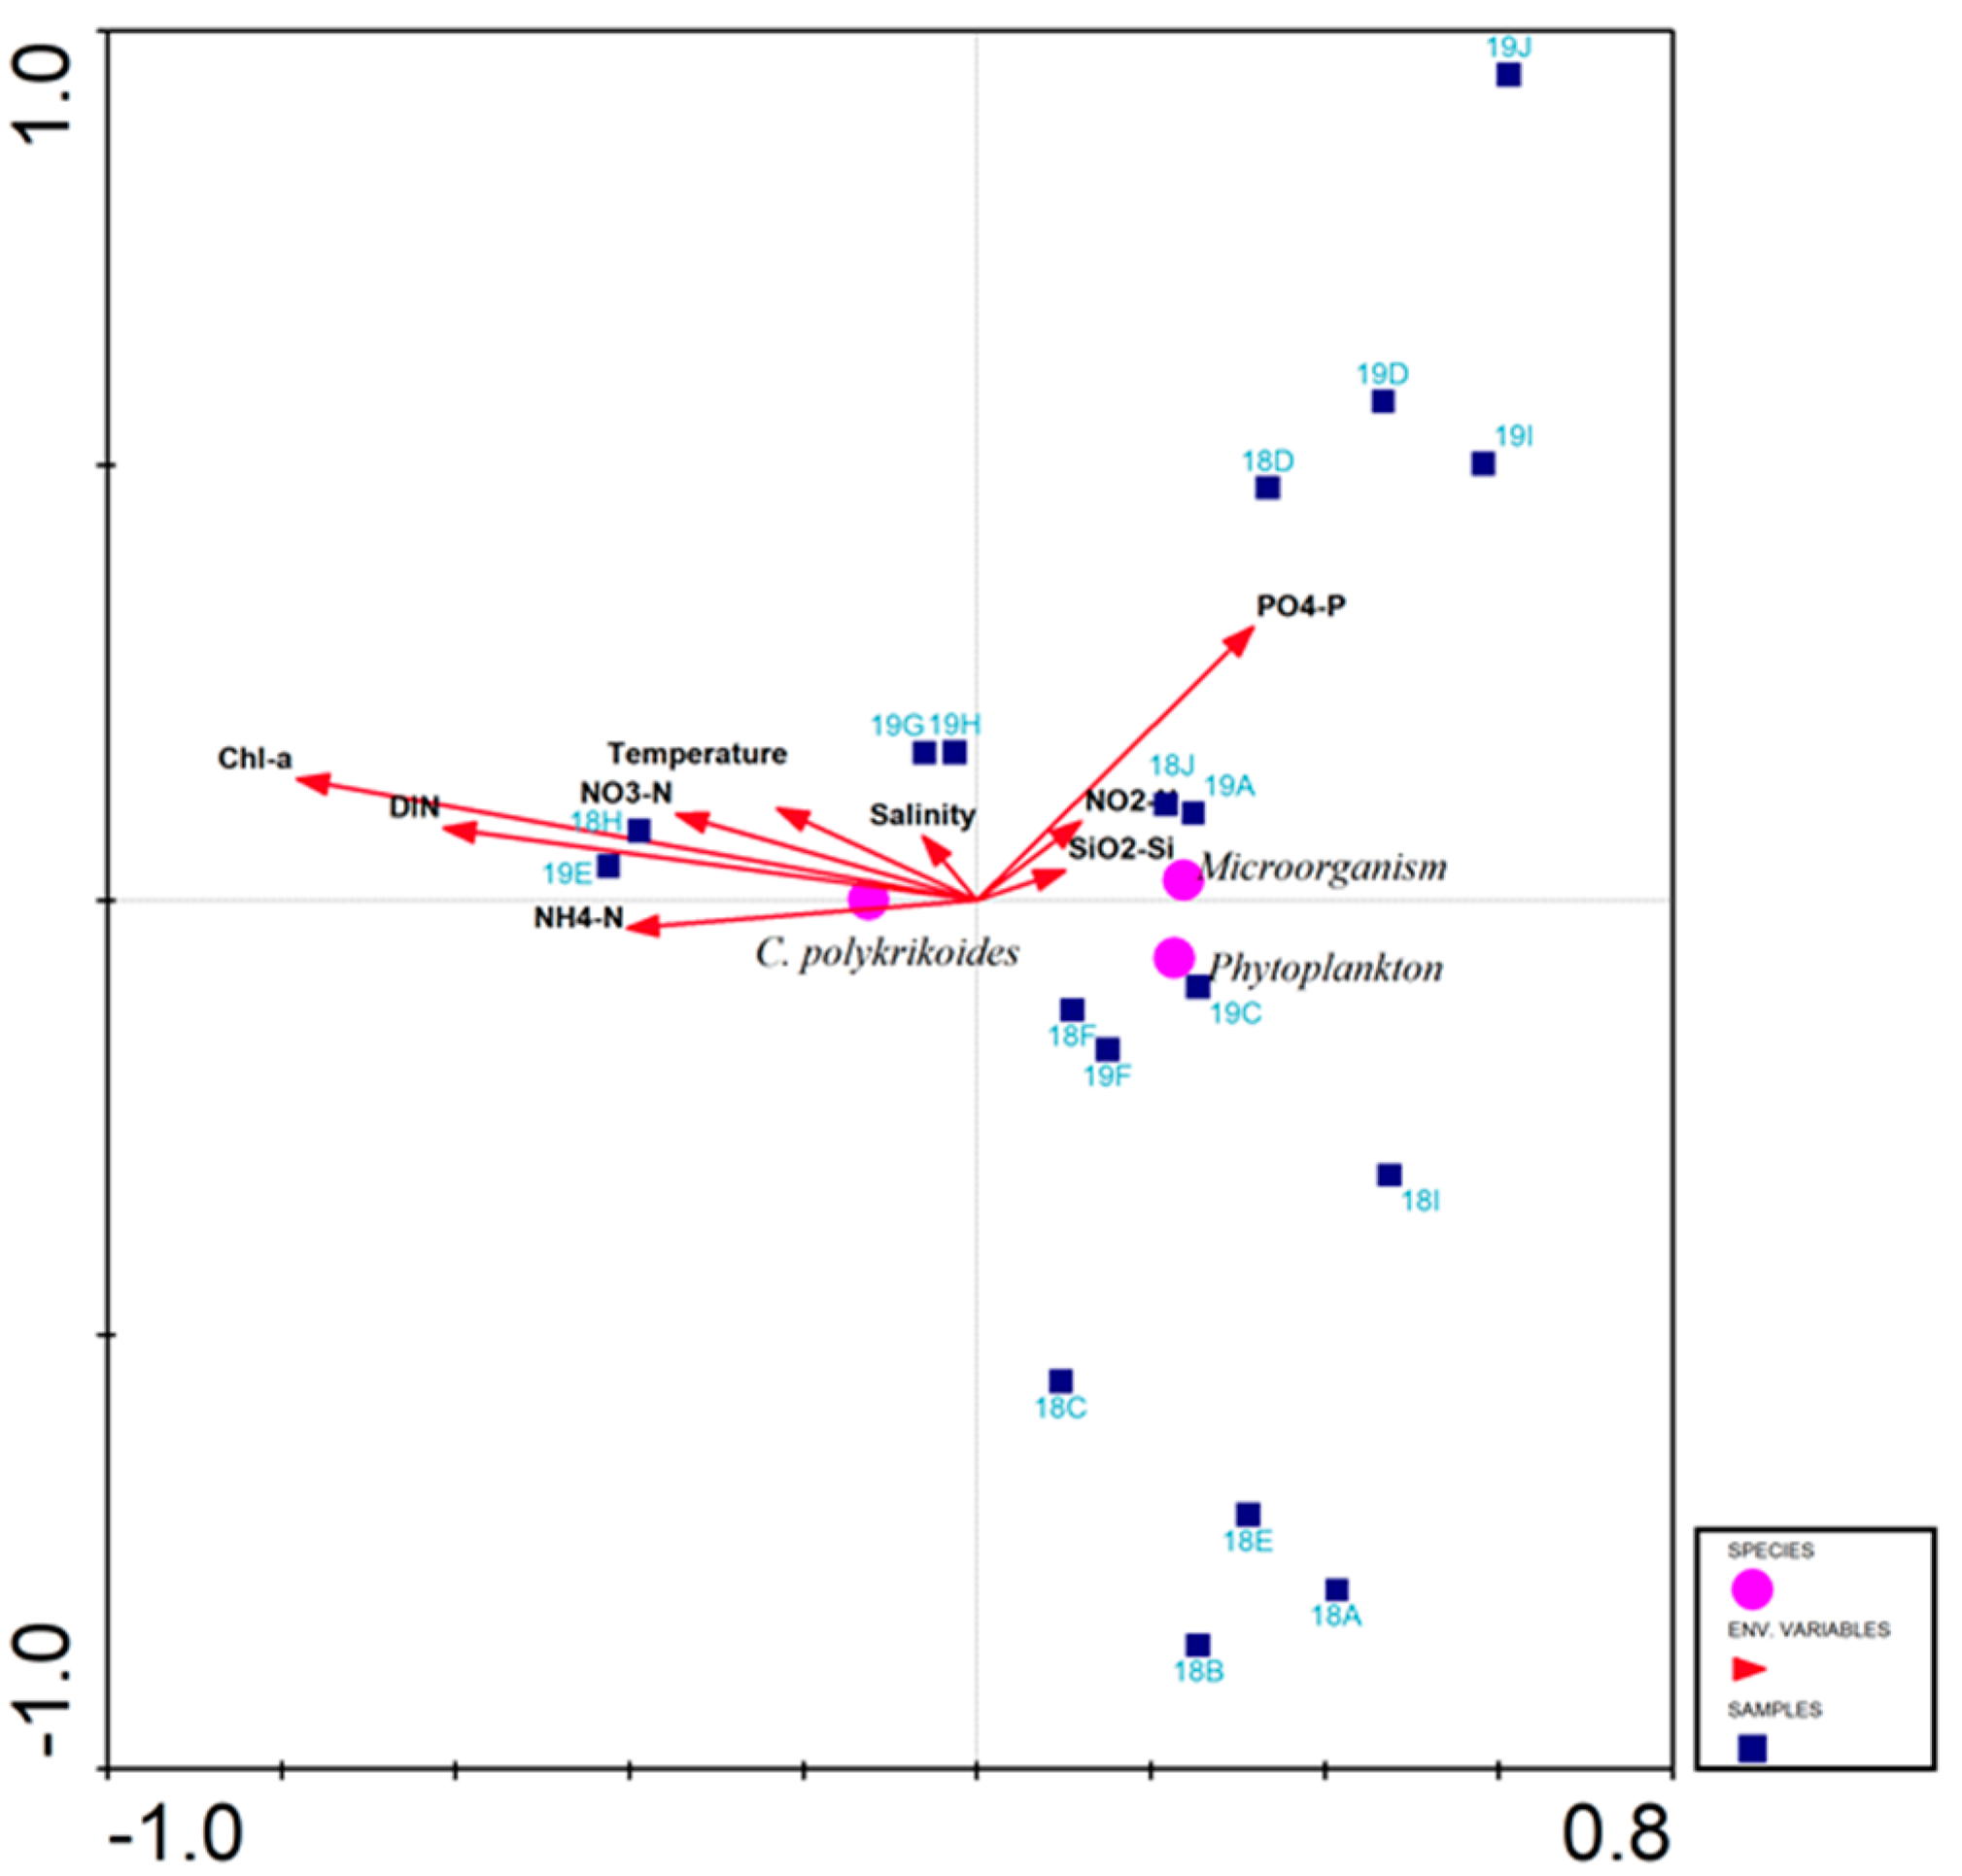
To analyze the responses of C. polykrikoides in Korean coastal waters to environmental factors, CCA analysis was conducted on the relationship between C. polykrikoides abundance and environmental parameters (i.e., temperature, salinity, nutrients, chlorophyll a). The first two ordination axes of CCA explain 100% of the variance in rDNA copies of C. polykrikoides, relative to the environmental factors. The eigenvalues for axis 1 (horizontal) and axes 2 (vertical) were 0.249 and 0.005, respectively, and they explain the C. polykrikoides rDNA copies’ variance of 82.7%. Samples H in 2018 and E in 2019 were significantly affected by NH4N, DIN, and chlorophyll a, and were positively correlated (Figure 8).
4. Discussion
Recently, molecular methods such as quantitative PCR have been applied for the detection of various species of phytoplankton. Quantitative PCR methods that can reliably and accurately quantify the number of cells, even if only one cell of the target species is included in the sample, have been developed for a variety of HAB species, including Alexandrium, Aureococcus [37], Cochlodinium [32], Chattenella, Hetersigma [36], Gambierdiscus, Karenia [38,39], Lingulodinium [40], Ostreopsis [41], and Pfiesteria. This method has been shown to be powerful for the quantitative detection of HAB species in environmental samples [32,42,43].
In this study, cell-counting methods failed to detect any single cells even in sites where millions of rDNA copies were identified (at least 5538.65 at D in 2018, to up to 5,726,129.65 copies/mL at G in 2019) (Table 3). C. polykrikoides exist in various forms in environmental samples, from single cells up to 16 cells that form chains. Since DNA dissolves in water as environmental DNA, many more copies than the number of cells can be detected. As a simple and sensitive technique, several previous qPCR studies have reported a strong correlation between the dinoflagellate cell number and the copy number of the rDNA [38,44,45]. However, we found that there was a low degree of correlation (r2 = 0.4676) between the direct cell counts and the copy numbers obtained by qPCR (Figure 2C). When those values were separately analyzed for 2018 and 2019, a much higher degree of correlation was identified within each year (r2 = 0.7065 in 2018 and r2 = 0.8765 in 2019, respectively), suggesting different ribosomal DNA copy numbers between the two C. polykrikoides strains (Figure 2A,B). These results may suggest that several things should be considered by researchers before applying qPCR to estimate cell numbers of Cochlodinium species. First, rDNA copy numbers may vary even in the same species depending on the growth stage or strain [42,46]. Few data are available in the literature concerning rDNA gene copies in dinoflagellates: approximate values of 65, 350, 600, 1000, and more than 12,000 have been reported, respectively, for Prorocentrum nux, Amphidinium carterae, Prorocentrum minimum, Alexandrium minutum, and Akashiwo sanguinea [47,48]. However, in the case of C. polykrikoides, exact rDNA copies per cell are not yet known. Second, when the density of C. polykrikoides cells was low, qPCR values showed large fluctuations [43]. Based on forecast-breaking news from the National Institute of Fisheries Science (NIFS), red tides caused by C. polykrikoides began on 23 July 2018, and remained for 18 days, and the maximum number of C. polykrikoides cells was 4500 cells/mL (NIFS, 2018). In 2019, C. polykrikoides blooms started on August 20 and ended on September 28, with a reported maximum concentration of 15,120 cells/mL (NIFS, 2019). During the survey period, we detected zero to 1250 C. polykrikoides cells/mL, and the rDNA copies of C. polykrikoides showed more fluctuation. Nevertheless, we were able to detect C. polykrikoides with a sensitive technique. Because of its sensitivity, there have been attempts to use qPCR for early warning of HABs [43,49,50].
Water temperature is one of the most important factors for C. polykrikoides blooms [51,52]. Kim et al.’s [52] study showed that C. polykrikoides exhibited its maximum specific growth rate of 0.41 day−1 at a combination of 25 °C and a salinity of 34 psu, and in the laboratory experiment optimum growth rates of >0.3 day−1 were observed at temperatures ranging from 21 to 26 °C at salinities from 30 to 36 psu. Among the environmental parameters in this study, we found that the water temperature (correlation coefficient, 0.605; p < 0.01) was strongly correlated with C. polykrikoides (Table 4). The average water temperatures were 25.78 ± 1.78 and 26.04 ± 4.32 °C in each sampling year, respectively, within the optimal temperature range (21~27.5 °C) for the growth of C. polykrikoides, and the salinity also appeared to be in the optimum range (Table 2). Ecological research has suggested the presence of specific algal–microbial interactions based on their co-occurrence in marine ecosystems, which have the potential to affect biogeochemical cycles and their community structures [2,53]. Bacteria support the growth of HABs from the recycling of nutrients, and phytoplankton produce various algal-derived products that affect bacterial growth rates and community composition [15,16]. The interactions between bacteria and phytoplankton can be analyzed through metabarcoding analysis with multiple markers simultaneously [29]. Several previous studies using molecular methods have shown that bacterial communities appear to be associated with HABs. Previous studies have shown that universal primer sets (16S and p23S) provide useful information about algal blooms by metabarcoding analysis [31,54]. In order to identify specific microbial and phytoplankton communities in C. polykrikoides blooms, we compared each community within the blooms of C. polykrikoides in two years. Microbial OTUs that showed significant correlations differed according to the sampling year. Among the physical factors, N is a key chemical element that influences microbial communities [55]. Specifically, we found that inorganic nutrients, such as DIN, NO3, and NH4 were higher in 2019 than in 2018, and these factors had effects on the microbial community structure. We confirmed that there was a difference in the microbial community structure by year (Figure 3 and Figure 4A,B).
Studies have shown that the Gamma proteobacteria are the most abundant group in HABs [2,11,27]. Park et al. [11] reported that the C. polykrikoides bloom that occurred in Korean coastal waters in 2012 had a negative relationship with Gamma proteobacteria [11]. Two genera within the Gamma proteobacteria group, i.e., Alteromonas and Pseudomonas, are considered algicidal bacteria and seem to be related to the termination of blooms [56,57]. However, a strong positive correlation between the abundance of C. polykrikoides and Gamma proteobacteria (p < 0.05) was found in this study (Table 7). Shin et al. [27] reported that Gamma proteobacteria was one of the major bacteria communities associated with C. polykrikoides in culture. As in the case of Alexandrium blooms [2], Gamma proteobacteria act as a buffer, and are thought to enhance the stability of the microbial community structure in C. polykrikoides blooms. Thus, types of Gamma proteobacteria may be different depending on the development of the C. polykrikoides bloom. Verrucomicrobia are known to grow preferentially on phytoplankton-derived high molecular organic compounds [58]. For this reason, Verrucomicrobia dominated areas where red tide species bloomed in water samples [31,59]. This study also showed that C. polykrikoides blooms had a strong positive correlation with Verrucomicrobia. We found in a previous study that the Verrucomicrobia group had a strong positive correlation with red tide species during a Heterosigma akashiwo bloom. We hypothesized that the Verrucomicrobia group is closely related to the blooms of red tide species that are found in southern Korean coastal waters. However, we did not find specific or repeated microbial communities that may be associated with C. polykrikoides blooms in these waters. We found a pattern of decreasing proteobacteria as Cyanobacteria in C. polykrikoides blooms increased. C. polykrikoides can feed on foods such as bacteria, cryptophyta, and diatoms, which are common in Korean coastal waters. In particular, they are able to consume up to 928 Synecochoccus individuals and up to 9.4 Teleaulax sp. individuals daily, and with feeding, the growth rate can double [60,61]. When the nutritional conditions of C. polykrikoides blooms were limited, they were able to obtain nutrients by consuming food source species such as Synechococcus sp., Teleaulax sp., and Heterosigma akashiwo. Thus, we suggest that Synecochoccus sp. and some haptophyta species, such as Teleaulax sp., may affect the nutrition of C. polykrikoides and potentially the C and N cycles of the microbial community in a red tide. The results of the heatmap analysis also support the above suggestion (Figure 5 and Figure 9).
Interestingly, although the microbial community at D in 2018 was distinct from other samples, the functional study (PICRUSt) results show only a slight difference in the ratio, and the genetic functions expressed were similar in all samples. Even if HAB species are not found in the coastal waters where HABs have already occurred, it is thought that differences are only in the structure of the microbial communities while they play similar functional roles. Predictive tools (PICRUSt algorithm) [62] to determine the functional potential of microbial communities have revealed different abundances of C. polykrikoides. From the functional pathway analysis, we found that genes related to carbohydrate metabolism, amino acid metabolism, and energy metabolism were very abundant during C. polykrikoides blooms (Figure 6). Energy metabolism gene expression was maintained at relatively high levels with Cochlodinim abundance. Similar results were observed for Akashiwo sanguinea and Alexandrium sp., through the promotion of nitrogen (ammonium) accumulation, organic acid utilization, and carbon assimilation [2,63], which indicates that S and P availability are important for blooms. These results show that bacterial functions affect algal blooms’ metabolic activity. We determined the structure of the microbial community and performed a functional study. To understand functional information gained from the study of HABs, additional analyses are required, including applying “Omics” methods to microbial structure and function, and a time-series investigations from before the outbreak of HABs until they disappear.
5. Conclusions
This work analyzed the microbial and phytoplankton communities from environmental samples during C. polykrikoides bloom events, using metabarcoding analysis. We were able to detect C. polykrikoides via a sensitive technique, and confirmed potential for early warning of C. polykrikoides using quantitative PCR. No single group could explain successive blooms of C. polykrikoides; four taxa, including Gamma proteobacteria (0.588, p < 0.01), Verrucomicrobia (0.874, p < 0.01), Cyanobacteria (0.975, p < 0.01), and Cryptophyta were related to C. polykrikoides blooms. When the C. polykrikoides bloom events occurred, though there were differences in the relative abundance of C. polykrikoides, the value levels differed only in the potential function of the microbial community, and the overall function was similar. The phytoplankton community structure was divided into three or four by sampling years, using metabarcoding analysis. The phytoplankton community structure provided information on the water bodies, using metabarcoding analysis by amplifying the plastid 23S region.
Supplementary Materials
The following supporting information can be downloaded at: https://www.mdpi.com/article/10.3390/w14193115/s1, Table S1: Summary of microbial OTUs produced by 16S universal primer set in C. polykrikoides bloomed water samples in 2018, Table S2: Summary of microbial OTUs produced by 16S universal primer set in C. polykrikoides bloomed water samples in 2019, Table S3: Summary of phytoplankton OTUs produced by p23S universal primer set in C. polykrikoides bloomed water samples in 2018, Table S4: Summary of phytoplankton OTUs produced by p23S universal primer set in C. polykrikoides bloomed water samples in 2019.
Author Contributions
Conceptualization, H.-E.K. and H.-W.K.; methodology, H.-E.K., T.-H.Y., J.-W.P. and W.-A.L.; software, H.-W.K. and T.-H.Y.; validation, H.-E.K. and T.-H.Y.; formal analysis, H.-E.K., T.-H.Y., J.-W.P., W.-A.L. and C.-K.K. investigation, H.-E.K. and T.-H.Y.; resources, H.-E.K.; data curation, H.-E.K. and T.-H.Y.; writing—original draft preparation, H.-E.K. and H.-W.K.; writing—review and editing, H.-W.K.; visualization, H.-E.K. and T.-H.Y.; supervision, H.-W.K.; project administration, H.-E.K.; funding acquisition, H.-E.K. All authors have read and agreed to the published version of the manuscript.
Funding
This work was supported by the National Research Foundation of Korea (NRF) grant funded by the Korea government (MSIT) (No. NRF-2021R1A2C1014556) and was partially supported by the National Institute of Fisheries Science (NIFS) in Korea (No. R2022069; R2020056).
Data Availability Statement
The data presented in this study are available on request from the corresponding author.
Acknowledgments
We thank National Institute of Fisheries Science (NIFS) members (including Tae-Gyu Park and Moon Ho Son) for their assistance in field sampling and observations).
Conflicts of Interest
The authors declare no conflict of interest.
References
- Field, C.B.; Behrenfeld, M.J.; Randerson, J.T.; Falkowski, P. Primary production of the biosphere: Integrating terrestrial and oceanic components. Science 1998, 281, 237–240. [Google Scholar] [CrossRef] [PubMed] [Green Version]
- Zhou, J.; L Richlen, M.; R Sehein, T.; M Kulis, D.; Anderson, D.; Cai, Z. Microbial community structure and associations during a marine dinoflagellate bloom. Front. Microbiol. 2018, 9, 1201. [Google Scholar] [CrossRef] [PubMed]
- NFRDI. Monitoring, management and mitigation of red tide. In Annual Report of NFRDI on Red Tide of Korea (Written in Korean); NFRDI: Busan, Korea, 2012. [Google Scholar]
- Park, T.G.; Lim, W.A.; Park, Y.T.; Lee, C.K.; Jeong, H.J. Economic impact, management and mitigation of red tides in Korea. Harmful Algae 2013, 30, S131–S143. [Google Scholar] [CrossRef]
- Lee, S.G.; Kim, H.G.; Cho, E.S.; Lee, C.K. Harmful algal blooms (red tides): Management and mitigation in the Republic of Korea. Harmful Algal Bloom. PICES Reg. North Pac. 2002, 39. [Google Scholar]
- Eckford-Soper, L.K.; Daugbjerg, N. Examination of six commonly used laboratory fixatives in HAB monitoring programs for their use in quantitative PCR based on Taqman probe technology. Harmful Algae 2015, 42, 52–59. [Google Scholar] [CrossRef]
- Dolgin, A.; Adolf, J. Scanning electron microscopy of phytoplankton: Achieving high quality images through the use of safer alternative chemical fixatives. J. Young Investig. 2019, 37. [Google Scholar] [CrossRef]
- Engesmo, A.; Strand, D.; Gran-Stadniczeñko, S.; Edvardsen, B.; Medlin, L.K.; Eikrem, W. Development of a qPCR assay to detect and quantify ichthyotoxic flagellates along the Norwegian coast, and the first Norwegian record of Fibrocapsa japonica (Raphidophyceae). Harmful Algae 2018, 75, 105–117. [Google Scholar] [CrossRef]
- Hatfield, R.G.; Bean, T.; Turner, A.D.; Lees, D.N.; Lowther, J.; Lewis, A.; Baker-Austin, C. Development of a TaqMan qPCR assay for detection of Alexandrium spp and application to harmful algal bloom monitoring. Toxicon X 2019, 2, 100011. [Google Scholar] [CrossRef]
- Bidle, K.D.; Azam, F. Accelerated dissolution of diatom silica by marine bacterial assemblages. Nature 1999, 397, 508–512. [Google Scholar] [CrossRef]
- Park, B.S.; Kim, J.-H.; Kim, J.H.; Gobler, C.J.; Baek, S.H.; Han, M.-S. Dynamics of bacterial community structure during blooms of Cochlodinium polykrikoides (Gymnodiniales, Dinophyceae) in Korean coastal waters. Harmful Algae 2015, 48, 44–54. [Google Scholar] [CrossRef]
- Brand, L.E.; Campbell, L.; Bresnan, E. Karenia: The biology and ecology of a toxic genus. Harmful Algae 2012, 14, 156–178. [Google Scholar] [CrossRef]
- Hold, G.L.; Smith, E.A.; Rappë, M.S.; Maas, E.W.; Moore, E.R.; Stroempl, C.; Stephen, J.R.; Prosser, J.I.; Birkbeck, T.H.; Gallacher, S. Characterisation of bacterial communities associated with toxic and non-toxic dinoflagellates: Alexandrium spp. and Scrippsiella trochoidea. FEMS Microbiol. Ecol. 2001, 37, 161–173. [Google Scholar] [CrossRef]
- Jasti, S.B. Phylogenetic Diversity of Bacteria Associated with Alexandrium spp. and Other Phyloplankton from the Gulf of Maine; University of Massachusetts: Lowell, MA, USA, 2003. [Google Scholar]
- Buchan, A.; LeCleir, G.R.; Gulvik, C.A.; González, J.M. Master recyclers: Features and functions of bacteria associated with phytoplankton blooms. Nat. Rev. Microbiol. 2014, 12, 686–698. [Google Scholar] [CrossRef] [PubMed]
- Camarena-Gómez, M.T.; Lipsewers, T.; Piiparinen, J.; Eronen-Rasimus, E.; Perez-Quemaliños, D.; Hoikkala, L.; Sobrino, C.; Spilling, K. Shifts in phytoplankton community structure modify bacterial production, abundance and community composition. Aquat. Microb. Ecol. 2018, 81, 149–170. [Google Scholar] [CrossRef] [Green Version]
- Ferrier, M.; Martin, J.; Rooney-Varga, J. Stimulation of Alexandrium fundyense growth by bacterial assemblages from the Bay of Fundy. J. Appl. Microbiol. 2002, 92, 706–716. [Google Scholar] [CrossRef]
- Haines, K.C.; Guillard, R.R. Growth of vitamin B12-requiring marine diatoms in mixed laboratory cultures with vitamin B12-producing marine bacteria. J. Phycol. 1974, 10, 245–252. [Google Scholar]
- Sakami, T.; Nakahara, H.; Chinain, M.; Ishida, Y. Effects of epiphytic bacteria on the growth of the toxic dinoflagellate Gambierdiscus toxicus (Dinophyceae). J. Exp. Mar. Biol. Ecol. 1999, 233, 231–246. [Google Scholar] [CrossRef]
- Gallacher, S.; Flynn, K.J.; Franco, J.M.; Brueggemann, E.; Hines, H. Evidence for production of paralytic shellfish toxins by bacteria associated with Alexandrium spp.(Dinophyta) in culture. Appl. Environ. Microbiol. 1997, 63, 239–245. [Google Scholar] [CrossRef] [Green Version]
- Doucette, G.J.; McGovern, E.R.; Babinchak, J.A. Algicidal bacteria active against Gymnodinium breve (Dinophyceae). I. Bacterial isolation and characterization of killing activity. J. Phycol. 1999, 35, 1447–1454. [Google Scholar] [CrossRef]
- Imai, I.; Ishida, Y.; Hata, Y. Killing of marine phytoplankton by a gliding bacterium Cytophaga sp., isolated from the coastal sea of Japan. Mar. Biol. 1993, 116, 527–532. [Google Scholar] [CrossRef]
- Wang, X.; Li, Z.; Su, J.; Tian, Y.; Ning, X.; Hong, H.; Zheng, T. Lysis of a red-tide causing alga, Alexandrium tamarense, caused by bacteria from its phycosphere. Biol. Control 2010, 52, 123–130. [Google Scholar] [CrossRef]
- Doucette, G.J. Interactions between bacteria and harmful algae: A review. Nat. Toxins 1995, 3, 65–74. [Google Scholar] [CrossRef]
- Demuez, M.; Gonzalez-Fernandez, C.; Ballesteros, M. Algicidal microorganisms and secreted algicides: New tools to induce microalgal cell disruption. Biotechnol. Adv. 2015, 33, 1615–1625. [Google Scholar] [CrossRef] [PubMed]
- Park, B.S.; Guo, R.; Lim, W.A.; Ki, J.S. Pyrosequencing reveals specific associations of bacterial clades Roseobacter and Flavobacterium with the harmful dinoflagellate Cochlodinium polykrikoides growing in culture. Mar. Ecol. 2017, 38, e12474. [Google Scholar] [CrossRef]
- Shin, H.; Lee, E.; Shin, J.; Ko, S.R.; Oh, H.S.; Ahn, C.Y.; Oh, H.M.; Cho, B.K.; Cho, S. Elucidation of the bacterial communities associated with the harmful microalgae Alexandrium tamarense and Cochlodinium polykrikoides using nanopore sequencing. Sci. Rep. 2018, 8, 5323. [Google Scholar] [CrossRef] [PubMed] [Green Version]
- Cui, Y.; Chun, S.J.; Baek, S.S.; Baek, S.H.; Kim, P.J.; Son, M.; Cho, K.H.; Ahn, C.Y.; Oh, H.M. Unique microbial module regulates the harmful algal bloom (Cochlodinium polykrikoides) and shifts the microbial community along the Southern Coast of Korea. Sci. Total Environ. 2020, 721, 137725. [Google Scholar] [CrossRef]
- Sildever, S.; Laas, P.; Kolesova, N.; Lips, I.; Lips, U.; Nagai, S. Plankton biodiversity and species co-occurrence based on environmental DNA—A multiple marker study. Metabarcoding Metagenomics 2021, 5, e72371. [Google Scholar] [CrossRef]
- Herlemann, D.P.; Labrenz, M.; Jurgens, K.; Bertilsson, S.; Waniek, J.J.; Andersson, A.F. Transitions in bacterial communities along the 2000 km salinity gradient of the Baltic Sea. ISME J. 2011, 5, 1571–1579. [Google Scholar] [CrossRef] [Green Version]
- Kang, H.E.; Yoon, T.H.; Yoon, S.; Kim, H.J.; Park, H.; Kang, C.K.; Kim, H.W. Genomic analysis of red-tide water bloomed with Heterosigma akashiwo in Geoje. PeerJ 2018, 6, e4854. [Google Scholar] [CrossRef] [Green Version]
- Park, T.G.; Kim, J.J.; Kim, W.J.; Won, K.M. Development of real-time RT-PCR for detecting viable Cochlodinium polykrikoides (Dinophyceae) cysts in sediment. Harmful Algae 2016, 60, 36–44. [Google Scholar] [CrossRef]
- Schloss, P.D.; Westcott, S.L.; Ryabin, T.; Hall, J.R.; Hartmann, M.; Hollister, E.B.; Lesniewski, R.A.; Oakley, B.B.; Parks, D.H.; Robinson, C.J.; et al. Introducing mothur: Open-source, platform-independent, community-supported software for describing and comparing microbial communities. Appl. Envrion. Microbiol. 2009, 75, 7537–7541. [Google Scholar] [CrossRef] [PubMed] [Green Version]
- Edgar, R.C.; Haas, B.J.; Clemente, J.C.; Quince, C.; Knight, R. UCHIME improves sensitivity and speed of chimera detection. Bioinformatics 2011, 27, 2194–2200. [Google Scholar] [CrossRef] [PubMed]
- Camacho, C.; Coulouris, G.; Avagyan, V.; Ma, N.; Papadopoulos, J.; Bealer, K.; Madden, T.L. BLAST+: Architecture and applications. BMC Bioinform. 2009, 10, 421. [Google Scholar] [CrossRef] [Green Version]
- Kamikawa, R.; Asai, J.; Miyahara, T.; Murata, K.; Oyama, K.; Yoshimatsu, S.; Yoshida, T.; Sako, Y. Application of a real-time PCR assay to a comprehensive method of monitoring harmful algae. Microbes Environ. 2006, 21, 163–173. [Google Scholar] [CrossRef] [Green Version]
- Zhang, Q.C.; Chen, Z.F.; Zhao, J.Y.; Yu, R.C.; Qiu, L.M.; Kong, F.Z.; Wang, Y.F.; Yan, T.; Zhou, M.J. Development of a sensitive qPCR method for the detection of pelagophyte Aureococcus anophagefferens. Limnol. Oceanogr. Methods 2020, 18, 41–51. [Google Scholar] [CrossRef]
- Casper, E.T.; Paul, J.H.; Smith, M.C.; Gray, M. Detection and quantification of the red tide dinoflagellate Karenia brevis by real-time nucleic acid sequence-based amplification. Appl. Environ. Microbiol. 2004, 70, 4727–4732. [Google Scholar] [CrossRef] [PubMed] [Green Version]
- Yuan, J.; Mi, T.; Zhen, Y.; Yu, Z. Development of a rapid detection and quantification method of Karenia mikimotoi by real-time quantitative PCR. Harmful Algae 2012, 17, 83–91. [Google Scholar] [CrossRef]
- Moorthi, S.D.; Countway, P.D.; Stauffer, B.A.; Caron, D.A. Use of quantitative real-time PCR to investigate the dynamics of the red tide dinoflagellate Lingulodinium polyedrum. Microb. Ecol. 2006, 52, 136–150. [Google Scholar] [CrossRef] [PubMed]
- Hariganeya, N.; Tanimoto, Y.; Yamaguchi, H.; Nishimura, T.; Tawong, W.; Sakanari, H.; Yoshimatsu, T.; Sato, S.; Preston, C.M.; Adachi, M. Quantitative PCR method for enumeration of cells of cryptic species of the toxic marine dinoflagellate Ostreopsis spp. in coastal waters of Japan. PLoS ONE 2013, 8, e57627. [Google Scholar]
- Antonella, P.; Luca, G. The quantitative real-time PCR applications in the monitoring of marine harmful algal bloom (HAB) species. Environ. Sci. Pollut. Res. 2013, 20, 6851–6862. [Google Scholar] [CrossRef] [Green Version]
- Park, T.G.; Kim, J.J.; Song, S.Y. Distributions of East Asia and Philippines ribotypes of Cochlodinium polykrikoides (Dinophyceae) in the South Sea, Korea. The Sea 2019, 24, 422–428. [Google Scholar]
- Park, T.G.; Park, G.H.; Park, Y.T.; Kang, Y.S.; Bae, H.M.; Kim, C.H.; Jeong, H.J.; Lee, Y. Identification of the dinoflagellate community during Cochlodinium polykrikoides (Dinophyceae) blooms using amplified rDNA melting curve analysis and real-time PCR probes. Harmful Algae 2009, 8, 430–440. [Google Scholar] [CrossRef]
- Hosoi-Tanabe, S.; Sako, Y. Species-Specific Detection and Quantification of Toxic Marine Dinoflagellates Alexandrium tamarense and A. catenella byReal-Time PCR Assay. Mar. Biotechnol. 2005, 7, 506–514. [Google Scholar] [CrossRef] [PubMed]
- Galluzzi, L.; Bertozzini, E.; Penna, A.; Perini, F.; Garcés, E.; Magnani, M. Analysis of rRNA gene content in the Mediterranean dinoflagellate Alexandrium catenella and Alexandrium taylori: Implications for the quantitative real-time PCR-based monitoring methods. J. Appl. Phycol. 2010, 22, 1–9. [Google Scholar] [CrossRef]
- Galluzzi, L.; Penna, A.; Bertozzini, E.; Vila, M.; Garcés, E.; Magnani, M. Development of a real-time PCR assay for rapid detection and quantification of Alexandrium minutum (a dinoflagellate). Appl. Environ. Microbiol. 2004, 70, 1199–1206. [Google Scholar] [CrossRef] [PubMed] [Green Version]
- Zhu, F.; Massana, R.; Not, F.; Marie, D.; Vaulot, D. Mapping of picoeucaryotes in marine ecosystems with quantitative PCR of the 18S rRNA gene. FEMS Microbiol. Ecol. 2005, 52, 79–92. [Google Scholar] [CrossRef] [Green Version]
- Hu, J.; Guo, R.; Lu, D.; Dai, X.; Zhu, Y.; Park, B.S.; Wang, P. Detection and Quantification of the Harmful Dinoflagellate Margalefidinium polykrikoides (East Asian Ribotype) in the Coastal Waters of China. Toxins 2022, 14, 95. [Google Scholar] [CrossRef]
- Lu, J.; Struewing, I.; Wymer, L.; Tettenhorst, D.R.; Shoemaker, J.; Allen, J. Use of qPCR and RT-qPCR for monitoring variations of microcystin producers and as an early warning system to predict toxin production in an Ohio inland lake. Water Res. 2020, 170, 115262. [Google Scholar] [CrossRef]
- Suh, Y.-S.; Kim, J.-H.; Kim, H.-G. Relationship between sea surface temperature derived from NOAA satellites and Cochlodinium polykrikoides red tide occurrence in Korean coastal waters. J. Environ. Sci. Int. 2000, 9, 215–221. [Google Scholar]
- Kim, D.I.; Matsuyama, Y.; Nagasoe, S.; Yamaguchi, M.; Yoon, Y.H.; Oshima, Y.; Imada, N.; Honjo, T. Effects of temperature, salinity and irradiance on the growth of the harmful red tide dinoflagellate Cochlodinium polykrikoides Margalef (Dinophyceae). J. Plankton Res. 2004, 26, 61–66. [Google Scholar] [CrossRef]
- Kouzuma, A.; Watanabe, K. Exploring the potential of algae/bacteria interactions. Curr. Opin. Biotechnol. 2015, 33, 125–129. [Google Scholar] [CrossRef] [PubMed]
- Yoon, T.H.; Kang, H.E.; Kang, C.K.; Lee, S.H.; Ahn, D.H.; Park, H.; Kim, H.W. Development of a cost-effective metabarcoding strategy for analysis of the marine phytoplankton community. PeerJ 2016, 4, e2115. [Google Scholar] [CrossRef] [PubMed] [Green Version]
- Garcia, N.S.; Bonachela, J.A.; Martiny, A.C. Interactions between growth-dependent changes in cell size, nutrient supply and cellular elemental stoichiometry of marine Synechococcus. ISME J. 2016, 10, 2715–2724. [Google Scholar] [CrossRef] [PubMed] [Green Version]
- Hare, C.E.; Demir, E.; Coyne, K.J.; Cary, S.C.; Kirchman, D.L.; Hutchins, D.A. A bacterium that inhibits the growth of Pfiesteria piscicida and other dinoflagellates. Harmful Algae 2005, 4, 221–234. [Google Scholar] [CrossRef]
- Lee, B.-K.; Katano, T.; Kitamura, S.-I.; Oh, M.-J.; Han, M.-S. Monitoring of algicidal bacterium, Alteromonas sp. Strain A14 in its application to natural Cochlodinium polykrikoides blooming seawater using fluorescence in situ hybridization. J. Microbiol. 2008, 46, 274–282. [Google Scholar] [CrossRef]
- Herlemann, D.P.; Lundin, D.; Labrenz, M.; Jürgens, K.; Zheng, Z.; Aspeborg, H.; Andersson, A.F. Metagenomic de novo assembly of an aquatic representative of the verrucomicrobial class Spartobacteria. MBio 2013, 4, e00569-12. [Google Scholar] [CrossRef] [Green Version]
- Hattenrath-Lehmann, T.K.; Jankowiak, J.; Koch, F.; Gobler, C.J. Prokaryotic and eukaryotic microbiomes associated with blooms of the ichthyotoxic dinoflagellate Cochlodinium (Margalefidinium) polykrikoides in New York, USA, estuaries. PLoS ONE 2019, 14, e0223067. [Google Scholar] [CrossRef] [PubMed]
- Jeong, H.J.; Kim, J.S.; Kim, J.H.; Kim, S.T.; Seong, K.A.; Kim, T.H.; Song, J.Y.; Kim, S.K. Feeding and grazing impact of the newly described heterotrophic dinoflagellate Stoeckeria algicida on the harmful alga Heterosigma akashiwo. Mar. Ecol. Prog. Ser. 2005, 295, 69–78. [Google Scholar] [CrossRef]
- Jeong, H.J.; Yoo, Y.D.; Kim, J.S.; Kim, T.H.; Kim, J.H.; Kang, N.S.; Yih, W. Mixotrophy in the phototrophic harmful alga Cochlodinium polykrikoides (Dinophycean): Prey species, the effects of prey concentration, and grazing impact. J. Eukaryot. Microbiol. 2004, 51, 563–569. [Google Scholar] [CrossRef]
- Langille, M.G.; Zaneveld, J.; Caporaso, J.G.; McDonald, D.; Knights, D.; Reyes, J.A.; Clemente, J.C.; Burkepile, D.E.; Vega Thurber, R.L.; Knight, R.; et al. Predictive functional profiling of microbial communities using 16S rRNA marker gene sequences. Nat. Biotechnol. 2013, 31, 814. [Google Scholar] [CrossRef]
- Kudela, R.M.; Lane, J.Q.; Cochlan, W.P. The potential role of anthropogenically derived nitrogen in the growth of harmful algae in California, USA. Harmful algae 2008, 8, 103–110. [Google Scholar] [CrossRef]
Figure 1.
Sampling sites for the metabarcoding analysis of C. polykrikoides bloom in the Southern Korean coastal waters.
Figure 1.
Sampling sites for the metabarcoding analysis of C. polykrikoides bloom in the Southern Korean coastal waters.

Figure 2.
A linear relationship between copy numbers and cell numbers for C. polykrikoides. (A) 2018, (B) 2019, (C) 2018 and 2019.
Figure 2.
A linear relationship between copy numbers and cell numbers for C. polykrikoides. (A) 2018, (B) 2019, (C) 2018 and 2019.

Figure 3.
Microbial community structure of samples. Relative abundances of the dominant groups at the phylum level.
Figure 3.
Microbial community structure of samples. Relative abundances of the dominant groups at the phylum level.

Figure 4.
Bray-Curtis similarity-based Cluster at the operational taxonomic Unit (OTU) level illustrating groups ((A): Microbial community, (B): Phytoplankton community) and non-metric multidimensional scaling ((C): Microbial community, (D): phytoplankton community) in C. polykrikoides bloomed water samples.

Figure 5.
Shade plot illustrating the microbial communities at the phylum level by sites for 18 samples. The plot depicts the relative abundance of phyla within microbial communities. **: >1,000,000 copies/mL (rDNA of C. polykrikoides).
Figure 5.
Shade plot illustrating the microbial communities at the phylum level by sites for 18 samples. The plot depicts the relative abundance of phyla within microbial communities. **: >1,000,000 copies/mL (rDNA of C. polykrikoides).

Figure 6.
Microbial OTUs associated with C. polykrikoides are related to gene functional pathways. Gene functions were predicted from 16S rRNA gene-based microbial compositions using the PICRUSt algorithm to make inferences from KEGG pathways.
Figure 6.
Microbial OTUs associated with C. polykrikoides are related to gene functional pathways. Gene functions were predicted from 16S rRNA gene-based microbial compositions using the PICRUSt algorithm to make inferences from KEGG pathways.

Figure 7.
Photosynthetic phytoplankton community structures of samples. Relative abundances of the dominant groups at the phylum level.
Figure 7.
Photosynthetic phytoplankton community structures of samples. Relative abundances of the dominant groups at the phylum level.

Figure 8.
Canonical correspondence analysis (CCA) of microbial communities (OTUs), phytoplankton communities, and environmental parameters sampled during C. polykrikoides bloom.
Figure 8.
Canonical correspondence analysis (CCA) of microbial communities (OTUs), phytoplankton communities, and environmental parameters sampled during C. polykrikoides bloom.

Figure 9.
Shade plot illustrating the phytoplankton communities at the phylum level by site, for 18 samples. The plot depicts the relative abundance of phyla within microbial communities. **: >1,000,000 copies/mL (rDNA of C. polykrikoides).
Figure 9.
Shade plot illustrating the phytoplankton communities at the phylum level by site, for 18 samples. The plot depicts the relative abundance of phyla within microbial communities. **: >1,000,000 copies/mL (rDNA of C. polykrikoides).


Table 1.
Primer list for qPCR and metabarcoding analysis.
| Primer | Sequences (5′ to 3′) | References |
|---|---|---|
| 16S universal primer F | CCTACGGGNGGCWGCAG | [30] |
| 16S universal primer R | GACTACHVGGGTATCTAATCC | |
| p23S universal primer F | GGACARWAAGACCCTATGMAG | [31] |
| p23S universal primer R | AGATYAGCCTGTTATCCCT | |
| Nex 16SF | TCGTCGGCAGCGTCAGATGTGTATAAGAGACAGCCTACGGGNGGCWGCAG | |
| Nex 16SR | GTCTCGTGGGCTCGGAGATGTGTATAAGAGACAGGACTACHVGGGTATCTAATCC | |
| Nex p23SF | TCGTCGGCAGCGTCAGATGTGTATAAGAGACAGGGACARWAAGACCCTATGMAG | |
| Nex p23SR | GTCTCGTGGGCTCGGAGATGTGTATAAGAGACAGAGATYAGCCTGTTATCCCT | |
| CPLSUF | GCCGAGGATACCTGCAAAG | [32] |
| CPLSUR | TGTCAGGACCCACGATCA | |
| CPLSUP (probe) | FAM-CTCACATGATCAGCGGCCGAGTACTAA–BHQ1 |
Table 2.
Environmental parameters during C. polykrikoides nlooms in Korean coastal waters.
| Year | Station | Temp. °C | Salinity PSU | NH4-N μΜ | NO2-N μΜ | NO3-N μΜ | DIN μΜ | PO4-P μΜ | SiO2-Si μΜ | Chl-a ug/L |
|---|---|---|---|---|---|---|---|---|---|---|
| 2018 | A | 22.78 | 33.04 | 0.22 | 0.03 | 0.11 | 1.00 | 0.01 | 3.59 | 2.98 |
| B | 23.03 | 32.97 | 0.42 | 0.05 | 0.36 | 1.00 | 0.11 | 5.41 | 5.12 | |
| C | 26.06 | 32.73 | 0.15 | 0.02 | 0.56 | 1.00 | 0.04 | 11.65 | 2.66 | |
| D | 27.39 | 31.66 | 0.11 | 0.03 | 1.00 | 2.00 | 0.03 | 5.32 | 0.22 | |
| E | 32.66 | 0.37 | 0.02 | 0.55 | 1.00 | 0.05 | 4.89 | 1.24 | ||
| H | 27.52 | 32.46 | 0.00 | 0.02 | 0.56 | 0.58 | 0.12 | 7.90 | 67.47 | |
| I | 27.16 | 32.50 | 0.00 | 0.00 | 0.12 | 0.12 | 0.01 | 5.40 | 0.28 | |
| J | 26.09 | 32.90 | 0.00 | 0.03 | 0.67 | 0.70 | 0.06 | 9.93 | 2.08 | |
| 2019 | A | 22.16 | 32.19 | 1.32 | 0.24 | 2.24 | 18.01 | 0.29 | 4.48 | 2.00 |
| C | 23.80 | 32.20 | 0.97 | 0.05 | 0.88 | 19.28 | 0.06 | 2.99 | 3.04 | |
| D | 22.83 | 30.76 | 0.88 | 0.02 | 1.08 | 17.69 | 0.08 | 2.39 | 1.10 | |
| E | 33.46 | 31.71 | 0.85 | 0.01 | 0.85 | 34.39 | 0.00 | 3.33 | 16.24 | |
| F | 25.18 | 32.18 | 1.06 | 0.02 | 1.14 | 18.99 | 0.05 | 3.52 | 2.82 | |
| G | 33.46 | 31.71 | 0.82 | 0.01 | 1.18 | 17.61 | 0.02 | 3.15 | 1.70 | |
| H | 23.72 | 32.19 | 0.40 | 0.27 | 1.03 | 1.69 | 0.43 | 10.97 | 15.97 | |
| I | 24.79 | 32.14 | 0.00 | 0.01 | 0.06 | 0.06 | 0.16 | 5.30 | 2.04 | |
| J | 25.00 | 32.42 | 0.00 | 0.00 | 0.00 | 0.00 | 0.24 | 4.82 | 4.05 |
Table 3.
Copy numbers of C. polykrikoides and microorganisms and phytoplankton according to quantitative PCR.
Table 3.
Copy numbers of C. polykrikoides and microorganisms and phytoplankton according to quantitative PCR.
| Year | Station | Microorganisms (Copies/mL) | Phytoplankton (Copies/mL) | C. polykrikoides (Copies/mL) | C. polykrikoides (Cells/mL) | C. polykrikoides (Copies/Cell) |
|---|---|---|---|---|---|---|
| 2018 | A | 373,039.66 | 75,191.72 | 226,496.55 | 0.00 | - |
| B | 410,109.67 | 131,904.62 | 143,526.43 | 0.00 | - | |
| C | 693,074.64 | 129,993.01 | 374,770.09 | 7.50 | 49,969.35 | |
| D | 214,395.18 | 12,760.27 | 5538.65 | 0.00 | - | |
| E | 362,322.25 | 69,390.50 | 1,472,837.75 | 12.00 | 122,736.48 | |
| F | 668,274.68 | 98,505.39 | 2,391,768.23 | 26.40 | 90,597.28 | |
| H | 28,896.15 | 4428.02 | 6,740,167.32 | 1200.00 | 5616.81 | |
| I | 678,086.36 | 114,823.30 | 103,142.69 | 0.10 | 1,031,426.90 | |
| J | 1,179,845.14 | 137,809.77 | 5,367,153.82 | 250.00 | 21,468.62 | |
| Ave. | 512,004.86 ± 336,315.44 | 86,089.62 ± 50,155.64 | 1,869,489.06 ± 2,522,253.95 | 166.22 ± 396.03 | 220,302.57 ± 399,725.81 | |
| 2019 | A | 1167,211.57 | 134,914.67 | 867,252.99 | 1.38 | 628,444.20 |
| C | 1,082,885.87 | 148,788.00 | 3,089,347.13 | 450.00 | 6865.22 | |
| D | 738,466.68 | 82,077.02 | 36,526.34 | 0.00 | - | |
| E | 581,862.02 | 70,706.48 | 248,181,801.83 | 1240.00 | 200,146.61 | |
| F | 843,365.30 | 106,511.24 | 4,958,103.49 | 7.50 | 661,080.47 | |
| G | 463,332.43 | 60,937.70 | 5,726,129.65 | 0.00 | - | |
| H | 913,077.22 | 81,334.28 | 9,081,941.97 | 24.00 | 378,414.25 | |
| I | 752,222.62 | 64,549.08 | 1,143,482.48 | 0.30 | 3,811,608.27 | |
| J | 1,556,795.40 | 87,493.06 | 0.00 | 0.00 | - | |
| Ave | 899,913.23 ± 331,554.94 | 93,034.61 ± 30,967.44 | 30,342,731.76 ± 81,746,202.15 | 212.40 ± 443.89 | 947,759.83 ± 1,425,071.09 |
Table 4.
Pearson correlation coefficient between environmental variables and C. polykrikoides rDNA copies (* p < 0.05; ** p < 0.01).
Table 4.
Pearson correlation coefficient between environmental variables and C. polykrikoides rDNA copies (* p < 0.05; ** p < 0.01).
| C. polykrikoides | Microorganism | Phytoplankton | Temperature | Salinity | NH4-N | NO2-N | NO3-N | DIN | PO4-P | SiO2-Si | |
|---|---|---|---|---|---|---|---|---|---|---|---|
| Microorganism | −0.082 | ||||||||||
| Phytoplankton | −0.124 | 0.632 ** | |||||||||
| Temperature | 0.605 ** | −0.311 | −0.13 | ||||||||
| Salinity | −0.247 | 0.013 | 0.296 | −0.261 | |||||||
| NH4-N | 0.241 | 0.189 | 0.271 | −0.016 | −0.461 | ||||||
| NO2-N | −0.112 | 0.293 | 0.35 | −0.402 | 0.007 | 0.361 | |||||
| NO3-N | 0.069 | 0.131 | 0.015 | 0.005 | −0.455 | 0.792 ** | 0.609 ** | ||||
| DIN | 0.646 ** | 0.124 | 0.174 | 0.386 | −0.589 * | 0.845 ** | 0.047 | 0.591 * | |||
| PO4-P | −0.205 | 0.453 | 0.382 | −0.439 | 0.005 | 0.056 | 0.808 ** | 0.253 | −0.188 | ||
| SiO2-Si | −0.187 | 0.054 | 0.176 | −0.089 | 0.443 | −0.53 | 0.309 | −0.129 | −0.562 * | 0.353 | |
| Chl-a | 0.752 ** | −0.407 | 0.599 * | 0.195 | 0.065 | −0.205 | 0.024 | −0.055 | −0.075 | 0.158 | 0.266 |
Table 5.
The diversity indices of microorganisms and phytoplankton.
| Year | Station | Microorganisms | Phytoplankton | ||||||
|---|---|---|---|---|---|---|---|---|---|
| Chao1 | Pielou’s Evenness (J’) | Shannon Index (H’) | Simpson Index (1-λ) | Chao1 | Pielou’s Evenness (J’) | Shannon Index (H’) | Simpson Index (1-λ) | ||
| 2018 | A | 50.2 | 0.6587 | 4.154 | 0.9106 | 11.35 | 0.6733 | 3.256 | 0.917 |
| B | 39.18 | 0.6979 | 4.185 | 0.9377 | 8.139 | 0.6003 | 2.694 | 0.8495 | |
| C | 36.9 | 0.6757 | 4.019 | 0.9228 | 10.37 | 0.611 | 2.92 | 0.8904 | |
| D | 27.93 | 0.5303 | 3.021 | 0.7385 | 8.166 | 0.6651 | 2.939 | 0.8485 | |
| E | 35.33 | 0.6375 | 3.758 | 0.8977 | 9.675 | 0.542 | 2.538 | 0.7612 | |
| F | 42.78 | 0.6559 | 4.044 | 0.9177 | 8.69 | 0.5656 | 2.575 | 0.822 | |
| H | 38.79 | 0.5546 | 3.381 | 0.8673 | 10.77 | 0.5123 | 2.444 | 0.733 | |
| I | 41.44 | 0.5689 | 3.51 | 0.8759 | 9.885 | 0.4516 | 2.114 | 0.6819 | |
| J | 43.79 | 0.6404 | 3.978 | 0.9086 | 7.445 | 0.379 | 1.675 | 0.5861 | |
| 2019 | A | 39.13 | 0.5584 | 3.379 | 0.8041 | 10.72 | 0.732 | 3.467 | 0.9392 |
| C | 34.66 | 0.5391 | 3.203 | 0.8265 | 10.78 | 0.5934 | 2.8 | 0.8068 | |
| D | 34.76 | 0.5233 | 3.09 | 0.7703 | 11.89 | 0.6461 | 3.13 | 0.881 | |
| E | 38.43 | 0.4983 | 3.02 | 0.8101 | 9.294 | 0.5108 | 2.331 | 0.6994 | |
| F | 42.12 | 0.5048 | 3.113 | 0.7995 | 9.043 | 0.5999 | 2.738 | 0.8439 | |
| G | 22.71 | 0.5229 | 2.889 | 0.8293 | 8.107 | 0.4168 | 1.852 | 0.6464 | |
| H | 46.58 | 0.5956 | 3.73 | 0.8427 | 10.27 | 0.6942 | 3.257 | 0.9148 | |
| I | 47.23 | 0.5318 | 3.332 | 0.7915 | 9.808 | 0.6582 | 3.038 | 0.868 | |
| J | 41.5 | 0.4656 | 2.85 | 0.688 | 10.87 | 0.6673 | 3.166 | 0.9135 | |
Table 6.
Analysis of similarities (ANOSIM) and PERMANOVA results for years and stations.
| Microbial Community | Phytoplankton Community | |||
|---|---|---|---|---|
| ANOSIM (Global R) | PERMANOVA (Pseudo-F) | ANOSIM (Global R) | PERMANOVA (Pseudo-F) | |
| 2018 VS. 2019 | 0.350 | 3.730 | 0.392 | 4.776 |
| R2 | 0.001 | 0.015 | 0.001 | 0.005 |
| A, B, C, D, E, F, G, H, I, J | 0.109 | 1.621 | 0.134 | 1.649 |
| R2 | 0.245 | 0.011 | 0.216 | 0.006 |
Table 7.
Microbial OTUs strongly correlated with C. polykrikoides.
| Year | OTU | Correlation Coefficient | p | Description | Accession | Identify (%) | Phylum | Regression Equation | R2 |
|---|---|---|---|---|---|---|---|---|---|
| 2018 | 16SOTU19 | 0.688 | <0.05 | Cyanobacterium | KC687149 | 100 | Cyanobacteria | y = (2 × 10⁻⁸)x + 0.0092 | 0.4733 |
| 16SOTU29 | 0.698 | <0.01 | Gamma proteobacterium | MH077347 | 100 | Proteobacteria | y = (1 × 10⁻⁷)x + 0.338 | 0.4869 | |
| 16SOTU92 | 0.713 | <0.05 | Rhodobacteraceae bacterium | MK603708 | 100 | Proteobacteria | y = (4 × 10⁻⁷)x − 0.003 | 0.5078 | |
| 2019 | 16SOTU29 | 0.707 | <0.05 | Gamma proteobacterium | MH077347 | 100 | Proteobacteria | y = (9 × 10⁻¹⁰)x + 0.0859 | 0.4997 |
| 16SOTU70 | 0.678 | <0.05 | Gamma proteobacterium | HM057639 | 99.84 | Proteobacteria | y =(2 × 10⁻⁹)x + 0.1066 | 0.4594 | |
| 16SOTU102 | 0.999 | <0.01 | Alpha proteobacterium | DQ436547 | 99.83 | Proteobacteria | y = (8 × 10⁻¹⁰)x − 0.0026 | 0.9986 | |
| 16SOTU123 | 0.841 | <0.01 | Flavobacteriales bacterium | LC314467 | 99.68 | Bacteroidetes | y = (7 × 10⁻¹⁰)x + 0.0117 | 0.7074 | |
| 16SOTU125 | 0.984 | <0.01 | Verrucomicrobia bacterium | HQ675288 | 99.21 | Verrucomicrobia | y = (3 × 10⁻⁸)x + 0.2271 | 0.9685 | |
| 16SOTU146 | 0.999 | <0.01 | Alpha proteobacterium | DQ187753 | 99.59 | Proteobacteria | y = (5 × 10⁻¹⁰)x − 0.0014 | 0.9986 | |
| 16SOTU153 | 0.864 | <0.01 | Alpha proteobacterium | JX528177 | 99.59 | Proteobacteria | y = (1 × 10⁻⁸)x + 0.1774 | 0.7462 | |
| 16SOTU211 | 0.999 | <0.01 | Gamma proteobacterium | LC018880 | 99.06 | Proteobacteria | y = (4 × 10⁻¹⁰)x − 0.0014 | 0.9986 | |
| 16SOTU223 | 0.999 | <0.01 | Flavobacterium sp. | GU230428 | 99.05 | Bacteroidetes | y = (1 × 10⁻⁹)x − 0.003 | 0.9986 | |
| 16SOTU265 | 0.701 | <0.05 | Gamma proteobacterium | AY580810 | 99.61 | Proteobacteria | y = (5 × 10⁻¹⁰)x + 0.0128 | 0.4914 | |
| 16SOTU274 | 0.841 | <0.01 | Gamma sp. | EF414148 | 94.33 | Proteobacteria | y = (5 × 10⁻⁹)x + 0.0816 | 0.7079 | |
| 16SOTU308 | 0.999 | <0.01 | Pelagibacteraceae bacterium | MH077429 | 99.75 | Proteobacteria | y = (6 × 10⁻⁹)x − 0.0195 | 0.9986 | |
| 16SOTU338 | 0.973 | <0.01 | Flavobacteriales bacterium | KF786847 | 99.61 | Bacteroidetes | y = (2 × 10⁻⁹)x + 0.0109 | 0.9468 | |
| 16SOTU350 | 0.999 | <0.01 | Planctomycete sp. | JN233020 | 97.42 | Planctomycetes | y = (1 × 10⁻⁹)x − 0.0033 | 0.9986 | |
| 16SOTU351 | 0.999 | <0.01 | Alpha proteobacterium | EF471483 | 99.83 | Proteobacteria | y = (9 × 10⁻¹⁰)x − 0.0029 | 0.9986 | |
| 2018 | 16SOTU70 | 0.588 | <0.01 | Gamma proteobacterium | HM057639 | 99.84 | Proteobacteria | y = (2 × 10⁻⁹)x + 0.1234 | 0.3459 |
| And | 16SOTU123 | 0.712 | <0.01 | Flavobacteriales bacterium | LC314467 | 99.68 | Bacteroidetes | y = (7 × 10⁻¹⁰)x + 0.0126 | 0.5068 |
| 2019 | 16SOTU125 | 0.874 | <0.01 | Verrucomicrobia bacterium | HQ675288 | 99.21 | Verrucomicrobia | y = (3 × 10⁻⁸)x + 0.7289 | 0.7645 |
| 16SOTU153 | 0.76 | <0.01 | Alpha proteobacterium | JX528177 | 99.59 | Proteobacteria | y = (1 × 10⁻⁸)x + 0.2024 | 0.5769 |
Table 8.
Strongly correlated phytoplankton OTUs with C. polykrikoides.
| Year | OTU | Correlation Coefficient | p | Description | Accession | Identify (%) | Phylum | Regression Equation | R2 |
|---|---|---|---|---|---|---|---|---|---|
| 2018 | 23SOTU11 | −0.747 | <0.05 | Teleaulax minuta | KP142642 | 99.73 | Cryptophyta | y = (−6 × 10⁻⁸)x + 0.3042 | 0.5574 |
| 23SOTU16 | 0.895 | <0.01 | Bathycoccus sp. | FO082259 | 96.95 | Chlorophyta | y = (5 × 10⁻⁸)x − 0.0296 | 0.8004 | |
| 23SOTU26 | 0.724 | <0.05 | Micromonas pusilla | L42847 | 98.56 | Chlorophyta | y = (3 × 10⁻⁸)x − 0.0193 | 0.5244 | |
| 23SOTU58 | 0.724 | <0.05 | Attheya sp. | KJ958479 | 97.49 | Bacillariophyta | y =(3 × 10⁻⁸)x − 0.0181 | 0.5244 | |
| 23SOTU59 | 0.724 | <0.05 | Actinocyclus subtilis | KP826904 | 98.11 | Bacillariophyta | y = (3 × 10⁻⁸)x − 0.0215 | 0.5244 | |
| 23SOTU72 | 0.713 | <0.05 | Kryptoperidinium foliaceum | GU591328 | 98.74 | Miozoa | y = (2 × 10⁻⁷)x − 0.1419 | 0.5088 | |
| 23SOTU107 | −0.67 | <0.05 | Emiliania huxleyi | JN022705 | 98.83 | Haptophyta | y = (−5 × 10⁻⁸)x + 0.3755 | 0.4485 | |
| 23SOTU116 | 0.728 | <0.05 | Mallomonas sp. | KM817948 | 92.94 | Ochrophyta | y = (8 × 10⁻⁸)x + 0.0021 | 0.5297 | |
| 23SOTU160 | 0.724 | <0.05 | Thalassiosira oceanica | GU323224 | 99.01 | Bacillariophyta | y = (2 × 10⁻⁸)x − 0.011 | 0.5244 | |
| 23SOTU193 | 0.719 | <0.05 | Synechococcus sp. | CP006882 | 99.01 | Cyanobacteria | y = 0.0859x − 0.2161 | 0.3983 | |
| 23SOTU211 | 0.724 | <0.05 | Synechococcus sp. | CP006882 | 99.01 | Cyanobacteria | y = (2 × 10⁻⁸)x − 0.0134 | 0.5244 | |
| 23SOTU212 | 0.724 | <0.05 | Synechococcus sp. | CP006882 | 99.28 | Cyanobacteria | y = (2 × 10⁻⁸)x − 0.0153 | 0.5244 | |
| 2019 | 23SOTU11 | 0.73 | <0.05 | Teleaulax minuta | KP142642 | 99.73 | Cryptophyta | y = (1 × 10⁻⁹)x + 0.0535 | 0.5322 |
| 23SOTU116 | 0.668 | <0.05 | Mallomonas sp. | KM817948 | 92.94 | Ochrophyta | y = (6 × 10⁻¹⁰)x + 0.0177 | 0.446 | |
| 23SOTU125 | 0.745 | <0.05 | Synechococcus sp. | LC455658 | 99.28 | Cyanobacteria | y = (9 × 10⁻¹⁰)x + 0.0215 | 0.5553 | |
| 23SOTU150 | 0.999 | <0.01 | Mallomonas sp. | KM817983 | 92.73 | Ochrophyta | y = (6 × 10⁻¹⁰)x − 0.0018 | 0.9986 | |
| 23SOTU171 | 0.999 | <0.01 | Ochromonas sp. | KJ877675 | 92.27 | Ochrophyta | y = (5 × 10⁻¹⁰)x − 0.0015 | 0.9986 | |
| 23SOTU215 | 0.975 | <0.01 | Synechococcus sp. | CP006882 | 99.01 | Cyanobacteria | y = (5 × 10⁻⁹)x + 0.0192 | 0.95 | |
| 2018 | 23SOTU25 | 0.616 | <0.01 | Prymnesiophyte sp. | HM565909 | 97.84 | Haptophyta | y = (8 × 10⁻¹⁰)x + 0.0123 | 0.3795 |
| And | 23SOTU150 | 0.999 | <0.01 | Mallomonas sp. | KM817983 | 92.73 | Ochrophyta | y = (6 × 10⁻¹⁰)x − 0.0014 | 0.9977 |
| 2019 | 23SOTU171 | 0.999 | <0.01 | Ochromonas sp. | KJ877675 | 92.27 | Ochrophyta | y = (5 × 10⁻¹⁰)x − 0.0012 | 0.9977 |
| 23SOTU215 | 0.975 | <0.01 | Synechococcus sp. | CP006882 | 99.01 | Cyanobacteria | y = (5 × 10⁻⁹)x + 0.0037 | 0.9513 |
Publisher’s Note: MDPI stays neutral with regard to jurisdictional claims in published maps and institutional affiliations. |
© 2022 by the authors. Licensee MDPI, Basel, Switzerland. This article is an open access article distributed under the terms and conditions of the Creative Commons Attribution (CC BY) license (https://creativecommons.org/licenses/by/4.0/).
Share and Cite
MDPI and ACS Style
Kang, H.-E.; Yoon, T.-H.; Park, J.-W.; Lim, W.-A.; Kang, C.-K.; Kim, H.-W. A Study on the Possibility of Early Warning for Cochlodinium polykrikoides Blooms, Using Molecular Methods. Water 2022, 14, 3115. https://doi.org/10.3390/w14193115
AMA Style
Kang H-E, Yoon T-H, Park J-W, Lim W-A, Kang C-K, Kim H-W. A Study on the Possibility of Early Warning for Cochlodinium polykrikoides Blooms, Using Molecular Methods. Water. 2022; 14(19):3115. https://doi.org/10.3390/w14193115
Chicago/Turabian StyleKang, Hye-Eun, Tae-Ho Yoon, Jong-Woo Park, Weol-Ae Lim, Chang-Keun Kang, and Hyun-Woo Kim. 2022. "A Study on the Possibility of Early Warning for Cochlodinium polykrikoides Blooms, Using Molecular Methods" Water 14, no. 19: 3115. https://doi.org/10.3390/w14193115
Note that from the first issue of 2016, this journal uses article numbers instead of page numbers. See further details here.