
The Characteristics of Lipid Biomarkers from the Abyssal and Hadal Sediments of the Yap Trench and the Influence of V-Shape Topography

Abstract
:1. Introduction
2. Materials and Methods
2.1. Study Area of the Yap Trench
2.2. Sampling Stations
2.3. Extraction of Lipid Compounds
2.4. Instrumental Analysis of Lipids
2.5. Analysis of δ13C of FAs
3. Results
3.1. Analysis of Lipid Biomarkers
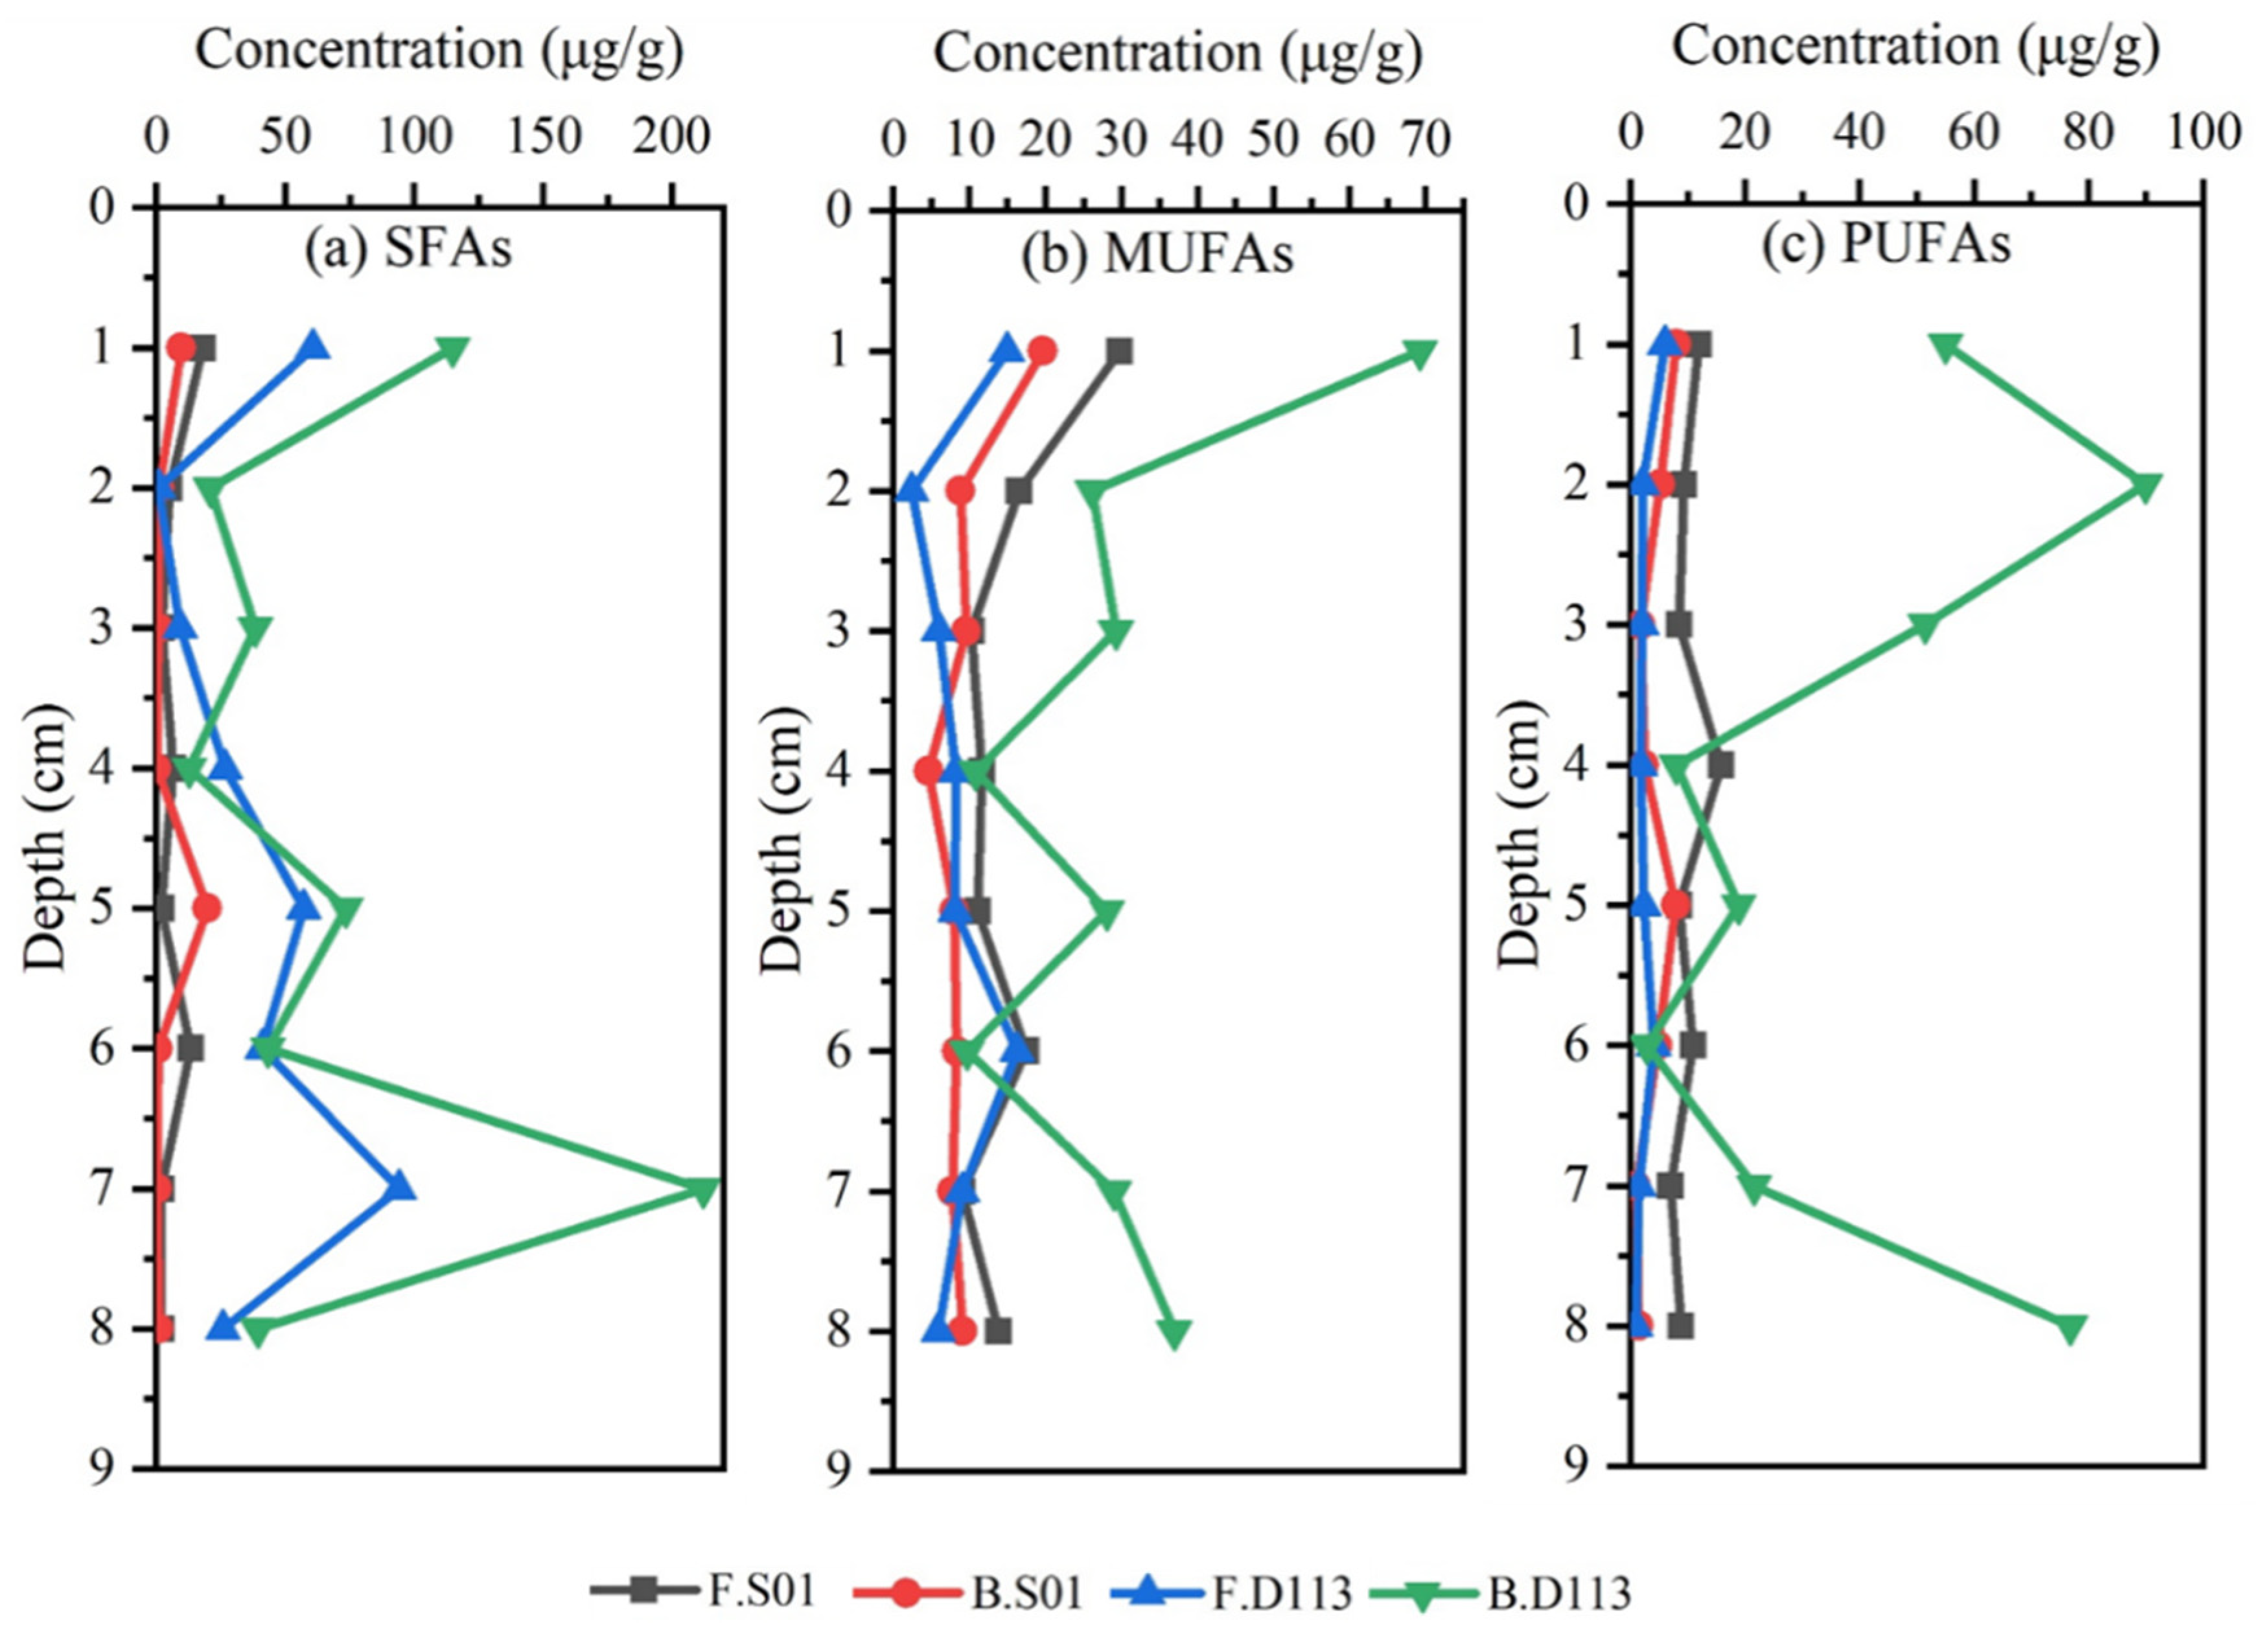
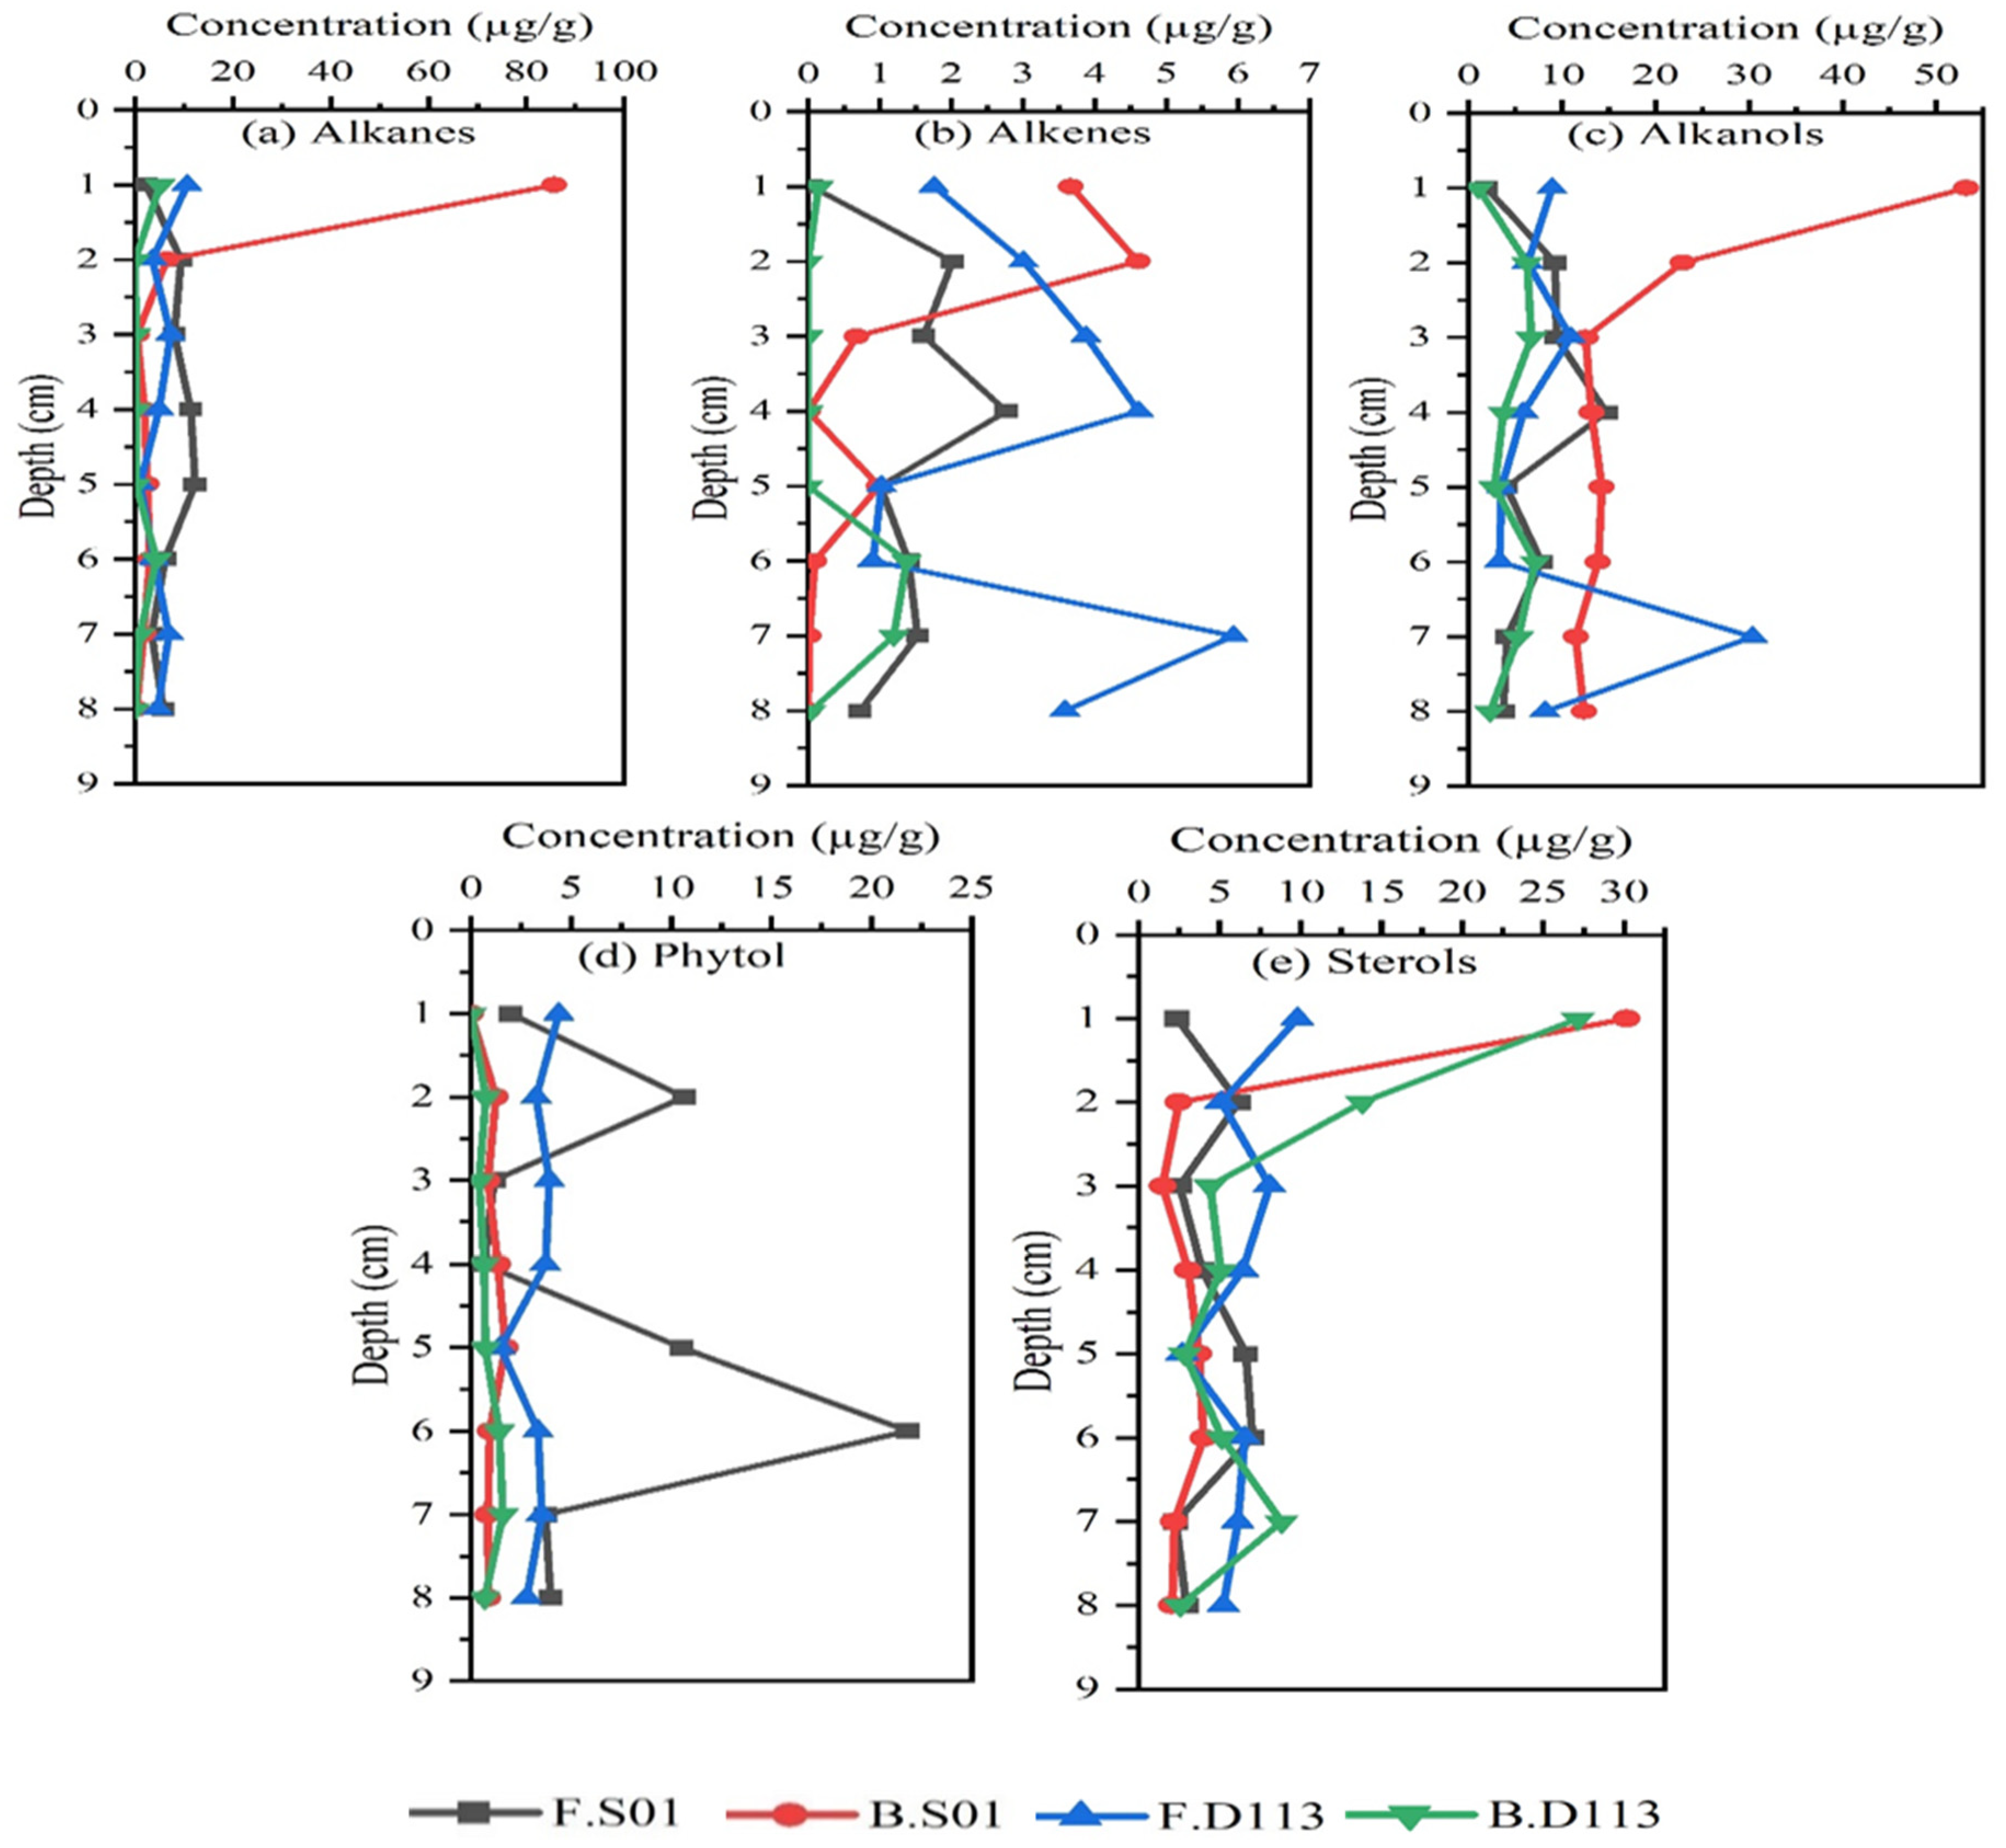
3.2. Composition and Vertical Distribution of Lipids
4. Discussion
4.1. Lipid Biomarkers in the Marine Environment
4.2. Sources of Fatty Acids
4.3. Sources of Neutral Lipids
4.4. Characteristic Preference Index of Lipid Biomarkers
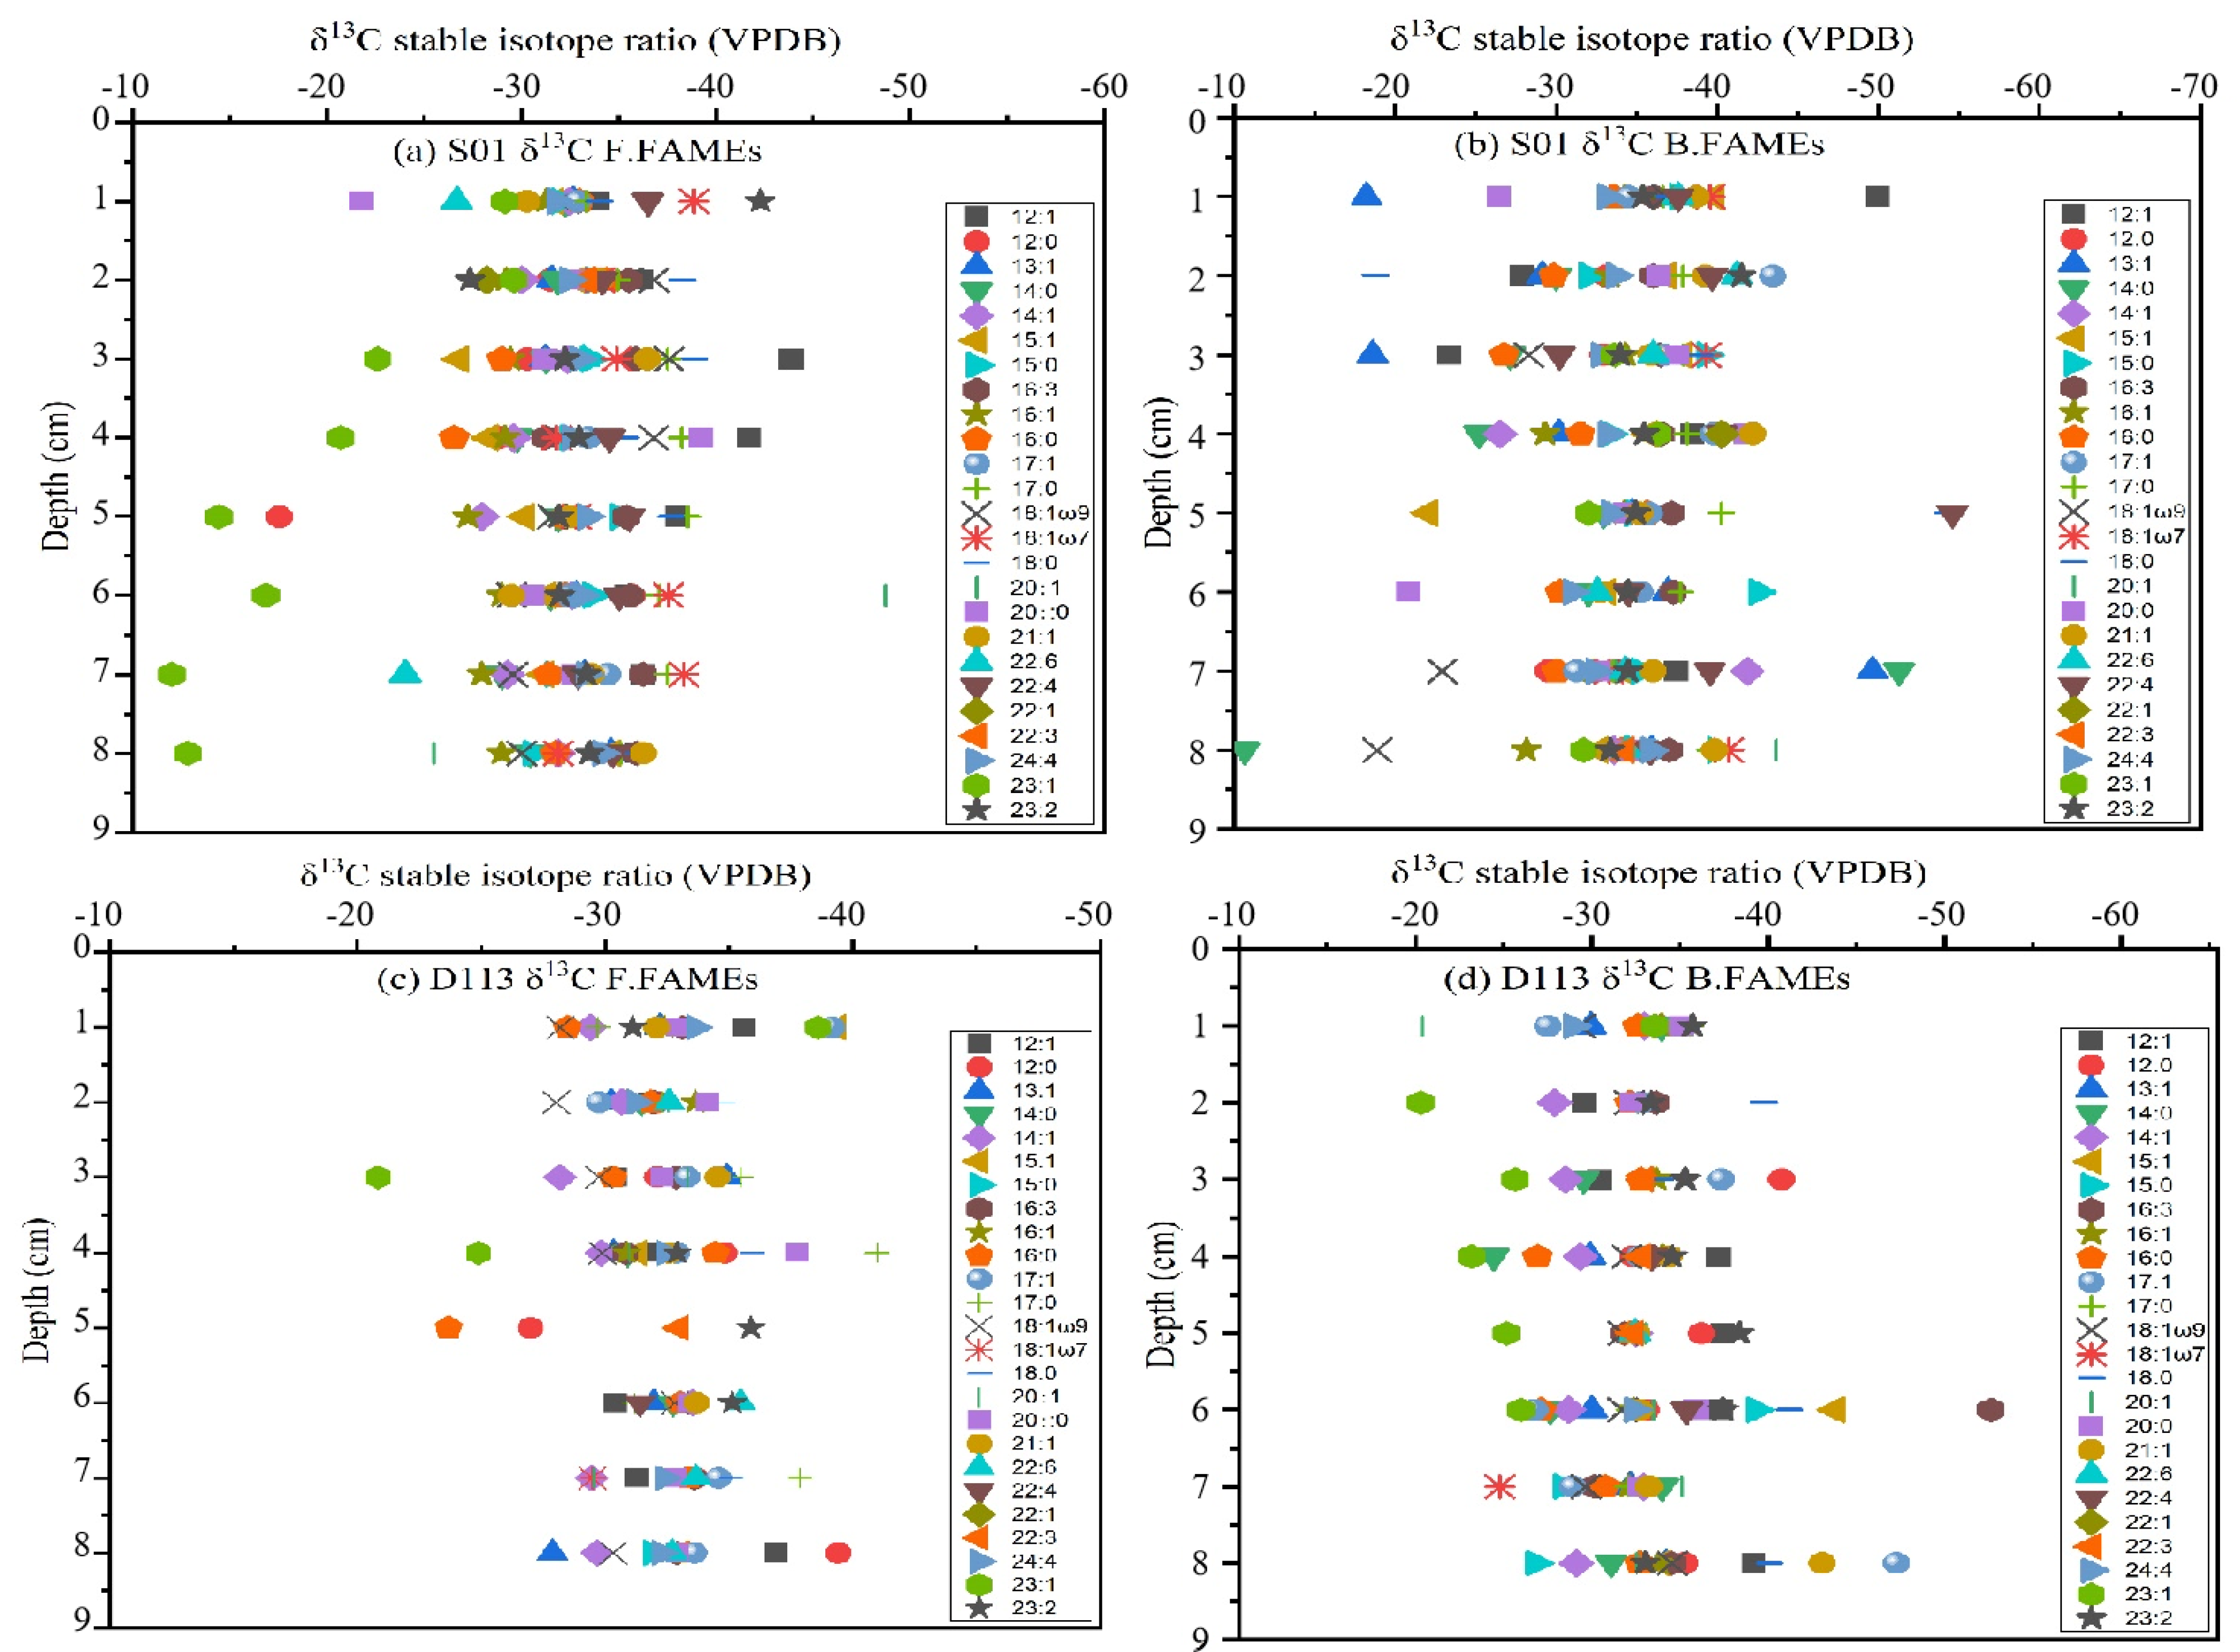
4.5. Tracking the Sources of FAs According to the δ13C Stable Isotope Values
5. Conclusions
Author Contributions
Funding
Conflicts of Interest
References
- Taira, K.; Yanagimoto, D.; Kitagawa, S. Deep CTD Casts in the Challenger Deep, Mariana Trench. J. Oceanogr. 2005, 61, 447–454. [Google Scholar] [CrossRef]
- Yan, Y.; Sun, C.; Huang, Y.; Cao, W.; Jiang, F.; Yang, G.; Ding, H. Distribution Characteristics of Lipids in Hadal Sediment in the Yap Trench. J. Oceanol. Limnol. 2020, 38, 634–649. [Google Scholar] [CrossRef]
- Huang, Y.; Sun, C.; Yang, G.; Yue, X.; Jiang, F.; Cao, W.; Yin, X.; Guo, C.; Niu, J.; Ding, H. Geochemical Characteristics of Hadal Sediment in the Northern Yap Trench. J. Oceanol. Limnol. 2020, 38, 650–664. [Google Scholar] [CrossRef]
- Li, Z.; Sun, Y.; Nie, X. Biomarkers as a Soil Organic Carbon Tracer of Sediment: Recent Advances and Challenges. Earth-Sci. Rev. 2020, 208, 103277. [Google Scholar] [CrossRef]
- Luo, M.; Gieskes, J.; Chen, L.; Shi, X.; Chen, D. Provenances, Distribution, and Accumulation of Organic Matter in the Southern Mariana Trench Rim and Slope: Implication for Carbon Cycle and Burial in Hadal Trenches. Mar. Geol. 2017, 386, 98–106. [Google Scholar] [CrossRef]
- Luo, M.; Glud, R.N.; Pan, B.; Wenzhöfer, F.; Xu, Y.; Lin, G.; Chen, D. Benthic Carbon Mineralization in Hadal Trenches: Insights from in Situ Determination of Benthic Oxygen Consumption. Geophys. Res. Lett. 2018, 45, 2752–2760. [Google Scholar] [CrossRef] [Green Version]
- Gallo, N.D.; Cameron, J.; Hardy, K.; Fryer, P.; Bartlett, D.H.; Levin, L.A. Submersible-and Lander-Observed Community Patterns in the Mariana and New Britain Trenches: Influence of Productivity and Depth on Epibenthic and Scavenging Communities. Deep Sea Res. Part I Oceanogr. Res. Pap. 2015, 99, 119–133. [Google Scholar] [CrossRef] [Green Version]
- Glud, R.N.; Wenzhöfer, F.; Middelboe, M.; Oguri, K.; Turnewitsch, R.; Canfield, D.E.; Kitazato, H. High Rates of Microbial Carbon Turnover in Sediments in the Deepest Oceanic Trench on Earth. Nat. Geosci. 2013, 6, 284–288. [Google Scholar] [CrossRef]
- Bao, R.; Strasser, M.; McNichol, A.P.; Haghipour, N.; McIntyre, C.; Wefer, G.; Eglinton, T.I. Tectonically-Triggered Sediment and Carbon Export to the Hadal Zone. Nat. Commun. 2018, 9, 1–8. [Google Scholar] [CrossRef] [Green Version]
- Danovaro, R.; Della Croce, N.; Dell’Anno, A.; Pusceddu, A. A Depocenter of Organic Matter at 7800 m Depth in the SE Pacific Ocean. Deep Sea Res. Part I Oceanogr. Res. Pap. 2003, 50, 1411–1420. [Google Scholar] [CrossRef]
- Leduc, D.; Rowden, A.A. Nematode Communities in Sediments of the Kermadec Trench, Southwest Pacific Ocean. Deep Sea Res. Part I Oceanogr. Res. Pap. 2018, 134, 23–31. [Google Scholar] [CrossRef]
- Li, D.; Zhao, J.; Yao, P.; Liu, C.; Sun, C.; Chen, J.; Pan, J.; Han, Z.; Hu, J. Spatial Heterogeneity of Organic Carbon Cycling in Sediments of the Northern Yap Trench: Implications for Organic Carbon Burial. Mar. Chem. 2020, 223, 103813. [Google Scholar] [CrossRef]
- Longhurst, A.; Sathyendranath, S.; Platt, T.; Caverhill, C. An Estimate of Global Primary Production in the Ocean from Satellite Radiometer Data. J. Plankton Res. 1995, 17, 1245–1271. [Google Scholar] [CrossRef] [Green Version]
- Itou, M.; Matsumura, I.; Noriki, S. A Large Flux of Particulate Matter in the Deep Japan Trench Observed Just after the 1994 Sanriku-Oki Earthquake. Deep Sea Res. Part I Oceanogr. Res. Pap. 2000, 47, 1987–1998. [Google Scholar] [CrossRef]
- Turnewitsch, R.; Falahat, S.; Stehlikova, J.; Oguri, K.; Glud, R.N.; Middelboe, M.; Kitazato, H.; Wenzhöfer, F.; Ando, K.; Fujio, S. Recent Sediment Dynamics in Hadal Trenches: Evidence for the Influence of Higher-Frequency (Tidal, near-Inertial) Fluid Dynamics. Deep Sea Res. Part I Oceanogr. Res. Pap. 2014, 90, 125–138. [Google Scholar] [CrossRef]
- Nunoura, T.; Takaki, Y.; Hirai, M.; Shimamura, S.; Makabe, A.; Koide, O.; Kikuchi, T.; Miyazaki, J.; Koba, K.; Yoshida, N. Hadal Biosphere: Insight into the Microbial Ecosystem in the Deepest Ocean on Earth. Proc. Natl. Acad. Sci. USA 2015, 112, E1230–E1236. [Google Scholar] [CrossRef] [PubMed] [Green Version]
- Oguri, K.; Kawamura, K.; Sakaguchi, A.; Toyofuku, T.; Kasaya, T.; Murayama, M.; Fujikura, K.; Glud, R.N.; Kitazato, H. Hadal Disturbance in the Japan Trench Induced by the 2011 Tohoku–Oki Earthquake. Sci. Rep. 2013, 3, 1915. [Google Scholar] [CrossRef] [Green Version]
- Jamieson, A.J.; Fujii, T.; Mayor, D.J.; Solan, M.; Priede, I.G. Hadal Trenches: The Ecology of the Deepest Places on Earth. Trends Ecol. Evol. 2010, 25, 190–197. [Google Scholar] [CrossRef]
- Rex, M.A.; Etter, R.J.; Morris, J.S.; Crouse, J.; McClain, C.R.; Johnson, N.A.; Stuart, C.T.; Deming, J.W.; Thies, R.; Avery, R. Global Bathymetric Patterns of Standing Stock and Body Size in the Deep-Sea Benthos. Mar. Ecol. Prog. Ser. 2006, 317, 1–8. [Google Scholar] [CrossRef] [Green Version]
- Wang, L.; MacLennan, S.A.; Cheng, F. From a Proximal-Deposition-Dominated Basin Sink to a Significant Sediment Source to the Chinese Loess Plateau: Insight from the Quantitative Provenance Analysis on the Cenozoic Sediments in the Qaidam Basin, Northern Tibetan Plateau. Palaeogeogr. Palaeoclimatol. Palaeoecol. 2020, 556, 109883. [Google Scholar] [CrossRef]
- Alba-González, P.; Álvarez-Salgado, X.A.; Cobelo-García, A.; Kaal, J.; Teira, E. Faeces of Marine Birds and Mammals as Substrates for Microbial Plankton Communities. Mar. Environ. Res. 2022, 174, 105560. [Google Scholar] [CrossRef]
- Koszelnik, P.; Gruca-Rokosz, R.; Bartoszek, L. An Isotopic Model for the Origin of Autochthonous Organic Matter Contained in the Bottom Sediments of a Reservoir. Int. J. Sediment Res. 2018, 33, 285–293. [Google Scholar] [CrossRef]
- Abdel-Wahab, M.A.; El-Samawaty, A.E.R.M.A.; Elgorban, A.M.; Bahkali, A.H. Fatty Acid Production of Thraustochytrids from Saudi Arabian Mangroves. Saudi J. Biol. Sci. 2021, 28, 855–864. [Google Scholar] [CrossRef] [PubMed]
- Guan, H.; Chen, L.; Luo, M.; Liu, L.; Mao, S.; Ge, H.; Zhang, M.; Fang, J.; Chen, D. Composition and Origin of Lipid Biomarkers in the Surface Sediments from the Southern Challenger Deep, Mariana Trench. Geosci. Front. 2019, 10, 351–360. [Google Scholar] [CrossRef]
- Tao, K.; Xu, Y.; Wang, Y.; Wang, Y.; He, D. Source, Sink and Preservation of Organic Matter from a Machine Learning Approach of Polar Lipid Tracers in Sediments and Soils from the Yellow River and Bohai Sea, Eastern China. Chem. Geol. 2021, 582, 120441. [Google Scholar] [CrossRef]
- Lee, S.-M. Deformation from the Convergence of Oceanic Lithosphere into Yap Trench and Its Implications for Early-Stage Subduction. J. Geodyn. 2004, 37, 83–102. [Google Scholar] [CrossRef]
- Ohara, Y.; Reagan, M.K.; Fujikura, K.; Watanabe, H.; Michibayashi, K.; Ishii, T.; Stern, R.J.; Pujana, I.; Martinez, F.; Girard, G. A Serpentinite-Hosted Ecosystem in the Southern Mariana Forearc. Proc. Natl. Acad. Sci. USA 2012, 109, 2831–2835. [Google Scholar] [CrossRef] [Green Version]
- Fujiwara, T.; Tamura, C.; Nishizawa, A.; Fujioka, K.; Kobayashi, K.; Iwabuchi, Y. Morphology and Tectonics of the Yap Trench. Mar. Geophys. Res. 2000, 21, 69–86. [Google Scholar] [CrossRef]
- Shiraki, K. Metamorphic Basement Rocks of Yap Islands, Western Pacific: Possible Oceanic Crust beneath an Island Arc. Earth Planet. Sci. Lett. 1971, 13, 167–174. [Google Scholar] [CrossRef]
- Hawkins, J.; Batiza, R. Metamorphic Rocks of the Yap Arc-Trench System. Earth Planet. Sci. Lett. 1977, 37, 216–229. [Google Scholar] [CrossRef]
- McCabe, R.; Uyeda, S. Hypothetical Model for the Bending of the Mariana Arc. Wash. DC Am. Geophys. Union Geophys. Monogr. Ser. 1983, 27, 281–293. [Google Scholar]
- Song, Y.; Ma, X.; Zhang, G.; Liu, X.; Luan, Z.; Dong, D.; Yan, J. Heat Flow In-Situ Measurement at Yap Trench of the Western Pacific. Mar. Geol. Quat. Geol. 2016, 36, 51–56. [Google Scholar]
- Yang, Y.; Wu, S.; Gao, J.; Tian, L.; Yang, J.; Xu, Y. Geology of the Yap Trench: New Observations from a Transect near 10° N from Manned Submersible Jiaolong. Int. Geol. Rev. 2018, 60, 1941–1953. [Google Scholar] [CrossRef]
- Wenzhöfer, F.; Oguri, K.; Middelboe, M.; Turnewitsch, R.; Toyofuku, T.; Kitazato, H.; Glud, R.N. Benthic Carbon Mineralization in Hadal Trenches: Assessment by in Situ O2 Microprofile Measurements. Deep Sea Res. Part I Oceanogr. Res. Pap. 2016, 116, 276–286. [Google Scholar] [CrossRef] [Green Version]
- Liu, Y.; Liu, X.; Lv, X.; Cao, W.; Sun, C.; Lu, J.; Wang, C.; Lu, B.; Yang, J. Watermass Properties and Deep Currents in the Northern Yap Trench Observed by the Submersible Jiaolong System. Deep Sea Res. Part I Oceanogr. Res. Pap. 2018, 139, 27–42. [Google Scholar] [CrossRef]
- Coplen, T.B. Discontinuance of SMOW and PDB. Nature 1995, 375, 285. [Google Scholar] [CrossRef]
- Holtvoeth, J.; Whiteside, J.H.; Engels, S.; Freitas, F.S.; Grice, K.; Greenwood, P.; Johnson, S.; Kendall, I.; Lengger, S.K.; Lücke, A.; et al. The Paleolimnologist’s Guide to Compound-Specific Stable Isotope Analysis—An Introduction to Principles and Applications of CSIA for Quaternary Lake Sediments. Quat. Sci. Rev. 2019, 207, 101–133. [Google Scholar] [CrossRef]
- Wehrmann, L.M.; Arndt, S.; März, C.; Ferdelman, T.G.; Brunner, B. The Evolution of Early Diagenetic Signals in Bering Sea Subseafloor Sediments in Response to Varying Organic Carbon Deposition over the Last 4.3 Ma. Geochim. Cosmochim. Acta 2013, 109, 175–196. [Google Scholar] [CrossRef]
- Zonneveld, K.A.F.; Versteegh, G.J.M.; Kasten, S.; Eglinton, T.I.; Emeis, K.C.; Huguet, C.; Koch, B.P.; De Lange, G.J.; De Leeuw, J.W.; Middelburg, J.J.; et al. Selective Preservation of Organic Matter in Marine Environments; Processes and Impact on the Sedimentary Record. Biogeosciences 2010, 7, 483–511. [Google Scholar] [CrossRef] [Green Version]
- Benner, R.; Benitez-Nelson, B.; Kaiser, K.; Amon, R.M.W. Export of Young Terrigenous Dissolved Organic Carbon from Rivers to the Arctic Ocean. Geophys. Res. Lett. 2004, 31, L05305. [Google Scholar] [CrossRef] [Green Version]
- Rumolo, P.; Barra, M.; Gherardi, S.; Marsella, E.; Sprovieri, M. Stable Isotopes and C/N Ratios in Marine Sediments as a Tool for Discriminating Anthropogenic Impact. J. Environ. Monit. 2011, 13, 3399–3408. [Google Scholar] [CrossRef] [PubMed]
- Johnston, E.L.; Mayer-Pinto, M.; Crowe, T.P. REVIEW: Chemical Contaminant Effects on Marine Ecosystem Functioning. J. Appl. Ecol. 2015, 52, 140–149. [Google Scholar] [CrossRef]
- Pearson, A.; Hurley, S.J.; Walter, S.R.S.; Kusch, S.; Lichtin, S.; Zhang, Y.G. Stable Carbon Isotope Ratios of Intact GDGTs Indicate Heterogeneous Sources to Marine Sediments. Geochim. Cosmochim. Acta 2016, 181, 18–35. [Google Scholar] [CrossRef]
- Darnaude, A.M.; Salen-Picard, C.; Polunin, N.V.C.; Harmelin-Vivien, M.L. Trophodynamic Linkage between River Runoff and Coastal Fishery Yield Elucidated by Stable Isotope Data in the Gulf of Lions (NW Mediterranean). Oecologia 2004, 138, 325–332. [Google Scholar] [CrossRef]
- Meyers, P.A. Preservation of Elemental and Isotopic Source Identification of Sedimentary Organic Matter. Chem. Geol. 1994, 114, 289–302. [Google Scholar] [CrossRef] [Green Version]
- Sanchez-Cabeza, J.-A.; Druffel, E.R. Environmental Records of Anthropogenic Impacts on Coastal Ecosystems: An Introduction. Mar. Pollut. Bull. 2009, 59, 87–90. [Google Scholar] [CrossRef] [Green Version]
- Whitney, E.J.; Beaudreau, A.H.; Howe, E.R. Using Stable Isotopes to Assess the Contribution of Terrestrial and Riverine Organic Matter to Diets of Nearshore Marine Consumers in a Glacially Influenced Estuary. Estuaries Coasts 2018, 41, 193–205. [Google Scholar] [CrossRef]
- Wang, X.; Li, N.; Feng, D.; Hu, Y.; Bayon, G.; Liang, Q.; Tong, H.; Gong, S.; Tao, J.; Chen, D. Using Chemical Compositions of Sediments to Constrain Methane Seepage Dynamics: A Case Study from Haima Cold Seeps of the South China Sea. J. Asian Earth Sci. 2018, 168, 137–144. [Google Scholar] [CrossRef]
- Yang, S.; Wang, J.T. Composition and Form Distribution of Lipids Biomarkers in Surficial Sediments in Southern Coastal Area of Shandong Peninsula. Mar. Environ. Sci. 2012, 31, 11–15. [Google Scholar]
- Wang, J.T.; Yang, S.; Tan, L.J.; Hu, J. Composition and Form Distribution of Lipids Biomarkers in a Sediment Core from Southern Coastal Area of Zhejiang Province. Acta Oceanol. Sin. 2011, 33, 83–90. [Google Scholar]
- Guo, W.; Jia, G.; Ye, F.; Xiao, H.; Zhang, Z. Lipid Biomarkers in Suspended Particulate Matter and Surface Sediments in the Pearl River Estuary, a Subtropical Estuary in Southern China. Sci. Total Environ. 2019, 646, 416–426. [Google Scholar] [CrossRef]
- Cordeiro, L.G.M.S.; Wagener, A.L.R.; Carreira, R.S. Organic Matter in Sediments of a Tropical and Upwelling Influenced Region of the Brazilian Continental Margin (Campos Basin, Rio de Janeiro). Org. Geochem. 2018, 120, 86–98. [Google Scholar] [CrossRef]
- Ding, H.; Sun, M.-Y. Biochemical Degradation of Algal Fatty Acids in Oxic and Anoxic Sediment–Seawater Interface Systems: Effects of Structural Association and Relative Roles of Aerobic and Anaerobic Bacteria. Mar. Chem. 2005, 93, 1–19. [Google Scholar] [CrossRef]
- Budge, S.M.; Parrish, C.C.; Mckenzie, C.H. Fatty Acid Composition of Phytoplankton, Settling Particulate Matter and Sediments at a Sheltered Bivalve Aquaculture Site. Mar. Chem. 2001, 76, 285–303. [Google Scholar] [CrossRef]
- Rütters, H.; Sass, H.; Cypionka, H.; Rullkötter, J. Phospholipid Analysis as a Tool to Study Complex Microbial Communities in Marine Sediments. J. Microbiol. Methods 2002, 48, 149–160. [Google Scholar] [CrossRef]
- Yamanaka, T.; Sakata, S. Abundance and Distribution of Fatty Acids in Hydrothermal Vent Sediments of the Western Pacific Ocean. Org. Geochem. 2004, 35, 573–582. [Google Scholar] [CrossRef]
- Zegouagh, Y.; Derenne, S.; Largeau, C.; Saliot, A. A Geochemical Investigation of Carboxylic Acids Released via Sequential Treatments of Two Surficial Sediments from the Changjiang Delta and East China Sea. Org. Geochem. 2000, 31, 375–388. [Google Scholar] [CrossRef]
- Menzel, D.; Van Bergen, P.F.; Schouten, S.; Sinninghe Damsté, J.S. Reconstruction of Changes in Export Productivity during Pliocene Sapropel Deposition: A Biomarker Approach. Palaeogeogr. Palaeoclimatol. Palaeoecol. 2003, 190, 273–287. [Google Scholar] [CrossRef]
- Li, X.; Liu, W.; Xu, L. Carbon Isotopes in Surface-Sediment Carbonates of Modern Lake Qinghai (Qinghai-Tibet Plateau): Implications for Lake Evolution in Arid Areas. Chem. Geol. 2012, 300–301, 88–96. [Google Scholar] [CrossRef]
- Wang, K.; Zou, L.; Lu, X.; Mou, X. Organic Carbon Source and Salinity Shape Sediment Bacterial Composition in Two China Marginal Seas and Their Major Tributaries. Sci. Total Environ. 2018, 633, 1510–1517. [Google Scholar] [CrossRef]
- Bao, R.; Blattmann, T.M.; McIntyre, C.; Zhao, M.; Eglinton, T.I. Relationships between Grain Size and Organic Carbon 14C Heterogeneity in Continental Margin Sediments. Earth Planet. Sci. Lett. 2019, 505, 76–85. [Google Scholar] [CrossRef]
- Liu, H.; Li, Y.X.; He, X.; Sissou, Z.; Tong, L.; Yarnes, C.; Huang, X. Compound-Specific Carbon Isotopic Fractionation during Transport of Phthalate Esters in Sandy Aquifer. Chemosphere 2016, 144, 1831–1836. [Google Scholar] [CrossRef] [PubMed]
- Wang, J.; Hilton, R.G.; Jin, Z.; Zhang, F.; Densmore, A.L.; Gröcke, D.R.; Xu, X.; Li, G.; West, A.J. The Isotopic Composition and Fluxes of Particulate Organic Carbon Exported from the Eastern Margin of the Tibetan Plateau. Geochim. Cosmochim. Acta 2019, 252, 1–15. [Google Scholar] [CrossRef] [Green Version]
- Jaffé, R.; Mead, R.; Hernandez, M.E.; Peralba, M.C.; DiGuida, O.A. Origin and Transport of Sedimentary Organic Matter in Two Subtropical Estuaries: A Comparative, Biomarker-Based Study. Org. Geochem. 2001, 32, 507–526. [Google Scholar] [CrossRef]
- Chen, J.; Li, F.; He, X.; He, X.; Wang, J. Lipid Biomarker as Indicator for Assessing the Input of Organic Matters into Sediments and Evaluating Phytoplankton Evolution in Upper Water of the East China Sea. Ecol. Indic. 2019, 101, 380–387. [Google Scholar] [CrossRef]
- Hu, J.; Zhang, H.; Peng, P. Fatty Acid Composition of Surface Sediments in the Subtropical Pearl River Estuary and Adjacent Shelf, Southern China. Estuar. Coast. Shelf Sci. 2006, 66, 346–356. [Google Scholar] [CrossRef]
- Birgel, D.; Stein, R.; Hefter, J. Aliphatic Lipids in Recent Sediments of the Fram Strait/Yermak Plateau (Arctic Ocean): Composition, Sources and Transport Processes. Mar. Chem. 2004, 88, 127–160. [Google Scholar] [CrossRef] [Green Version]
- Xue, B.; Yao, S. Recent Sedimentation Rates in Lakes in Lower Yangtze River Basin. Quat. Int. 2011, 244, 248–253. [Google Scholar] [CrossRef]
- Silliman, J.E.; Schelske, C.L. Saturated Hydrocarbons in the Sediments of Lake Apopka, Florida. Org. Geochem. 2003, 34, 253–260. [Google Scholar] [CrossRef]
- Pancost, R.D.; Sinninghe Damsté, J.S.; De Lint, S.; Van Der Maarel, M.J.E.C.; Gottschal, J.C. Biomarker Evidence for Widespread Anaerobic Methane Oxidation in Mediterranean Sediments by a Consortium of Methanogenic Archaea and Bacteria. Appl. Environ. Microbiol. 2000, 66, 1126–1132. [Google Scholar] [CrossRef] [PubMed] [Green Version]
- Fu, L.; Li, D.; Mi, T.; Zhao, J.; Liu, C.; Sun, C.; Zhen, Y. Characteristics of the Archaeal and Bacterial Communities in Core Sediments from Southern Yap Trench via in Situ Sampling by the Manned Submersible Jiaolong. Sci. Total Environ. 2020, 703, 134884. [Google Scholar] [CrossRef] [PubMed]
- Thiel, V.; Peckmann, J.; Seifert, R.; Wehrung, P.; Reitner, J.; Michaelis, W. Highly Isotopically Depleted Isoprenoids: Molecular Markers for Ancient Methane Venting. Geochim. Cosmochim. Acta 1999, 63, 3959–3966. [Google Scholar] [CrossRef] [Green Version]
- Hoehler, T.M.; Alperin, M.J.; Albert, D.B.; Martens, C.S. Field and Laboratory Studies of Methane Oxidation in an Anoxic Marine Sediment: Evidence for a Methanogen-Sulfate Reducer Consortium. Glob. Biogeochem. Cycles 1994, 8, 451–463. [Google Scholar] [CrossRef]


| Sampling Stations | Sampling Location | Depth of Station (m) | Longitude | Latitude |
|---|---|---|---|---|
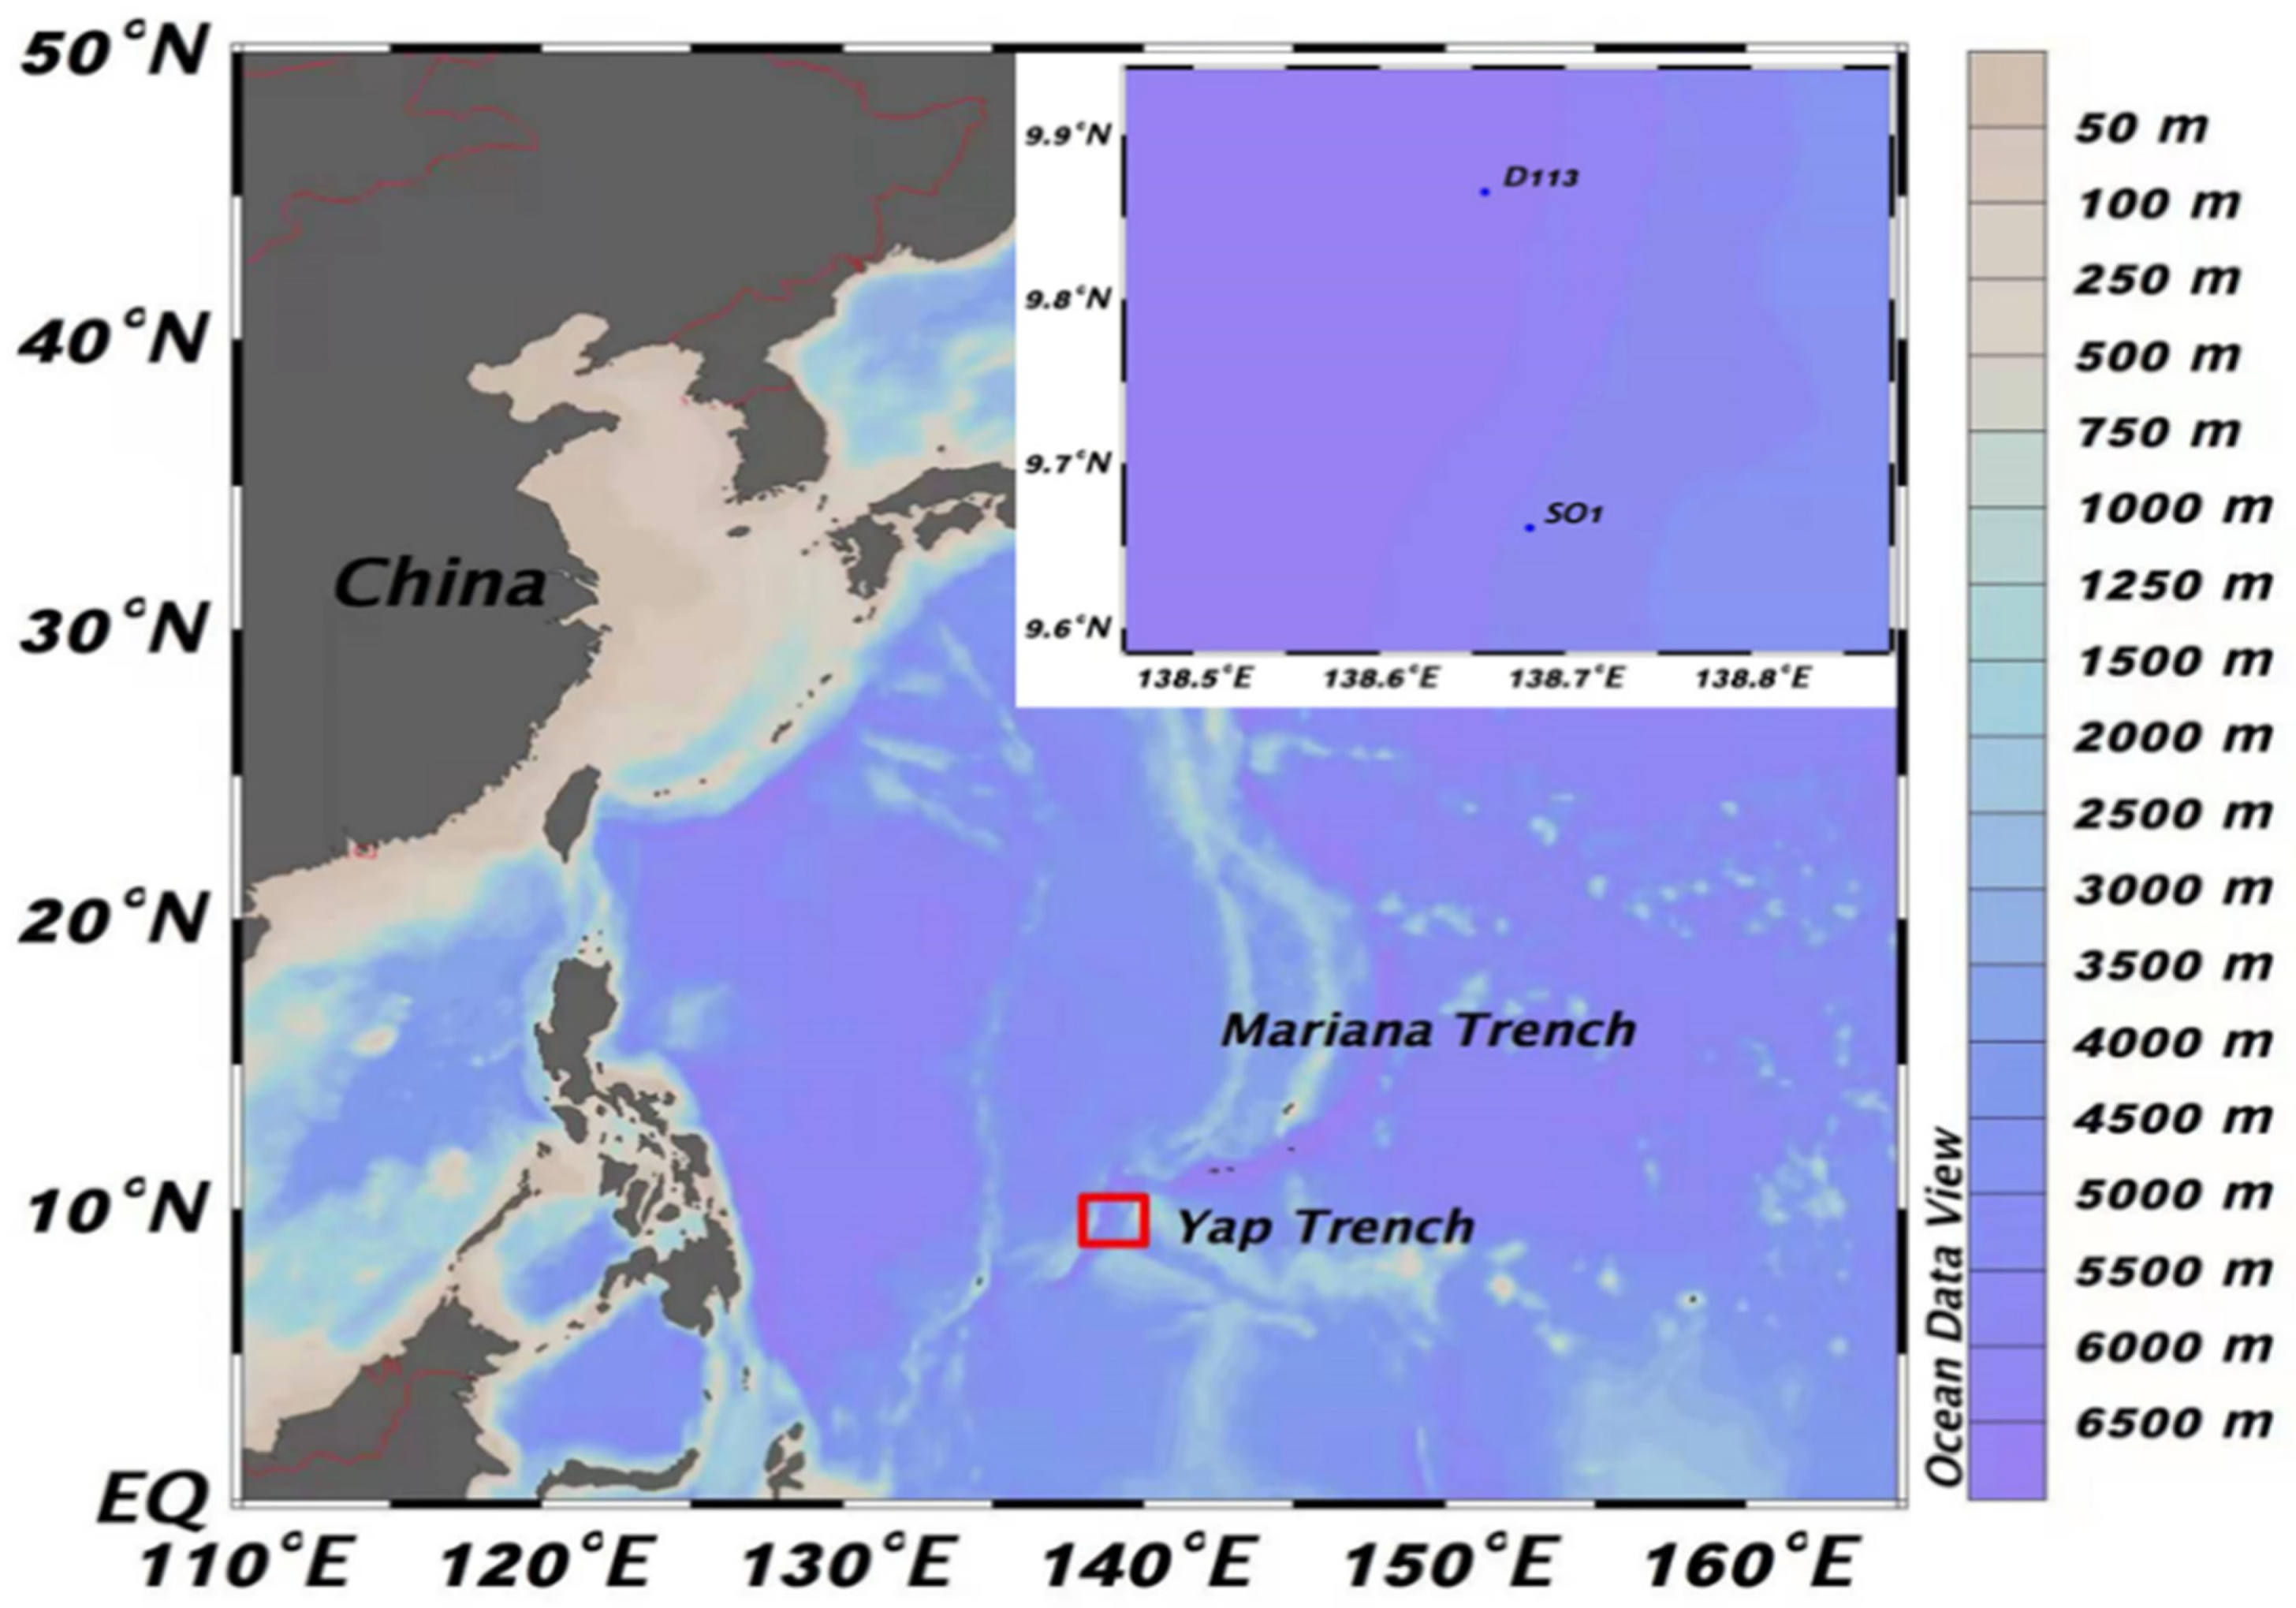
| S01 | East side of the trench cliff | 5058 | 138°40.86’ | 9°39.67’ |
| D113 | East side of the trench cliff | 6578 | 138°39.41’ | 9°51.93’ |
| CPI Values of FFAs | CPI Values of BFAs | ||||||||||
|---|---|---|---|---|---|---|---|---|---|---|---|
| Depth/(cm) | (Odd/Even) | (Even/Odd) | C16:0/C18:0 | C16:1/C16:0 | C18:1ω7/18:1ω9 | (Odd/Even) | (Even/Odd) | C16:0/C18:0 | C16:1/C16:0 | C18:1ω7/18:1ω9 | |
| 1 | 0.0 | 56.12 | 0.63 | 0.01 | 4.92 | 0.03 | 33.63 | 0.89 | 0.02 | 0.72 | |
| 2 | 8.81 | 0.11 | 0.00 | 0.00 | 1.12 | 0.03 | 29.03 | 1.29 | 0.02 | 0.37 | |
| 3 | 0.14 | 7.10 | 1.57 | 0.02 | 0.91 | 0.02 | 35.40 | 1.31 | 0.02 | 0.26 | |
| D113 | 4 | 0.04 | 24.26 | 1.25 | 0.01 | 1.51 | 0.04 | 20.31 | 1.25 | 0.02 | 0.78 |
| 5 | 0.03 | 33.19 | 1.08 | 0.01 | 1.17 | 0.05 | 18.57 | 0.84 | 0.01 | 0.46 | |
| 6 | 0.02 | 43.73 | 0.64 | 0.01 | 3.48 | 0.01 | 80.65 | 0.48 | 0.01 | 4.81 | |
| 7 | 0.02 | 41.76 | 1.25 | 0.00 | 1.00 | 0.01 | 86.43 | 1.23 | 0.01 | 0.41 | |
| 8 | 0.04 | 24.52 | 1.15 | 0.01 | 1.00 | 0.02 | 41.50 | 1.03 | 0.02 | 0.26 | |
| 1 | 0.04 | 24.91 | 0.66 | 0.46 | 2.83 | 0.10 | 10.33 | 0.12 | 1.89 | 0.37 | |
| 2 | 0.01 | 62.08 | 3.03 | 0.71 | 0.23 | 0.68 | 1.47 | 0.00 | 0.00 | 0.36 | |
| 3 | 0.08 | 11.11 | 0.64 | 2.43 | 0.00 | 0.66 | 1.51 | 0.00 | 0.00 | 0.55 | |
| S01 | 4 | 0.06 | 14.37 | 1.00 | 0.71 | 0.17 | 0.00 | 0.00 | 0.00 | 0.00 | 0.82 |
| 5 | 0.12 | 8.132 | 0.00 | 0.00 | 0.16 | 0.03 | 32.61 | 0.78 | 0.13 | 0.00 | |
| 6 | 0.01 | 128.39 | 1.01 | 0.39 | 0.08 | 0.19 | 5.41 | 0.00 | 0.00 | 0.11 | |
| 7 | 0.72 | 1.38 | 0.00 | 0.00 | 0.21 | 0.11 | 9.11 | 0.00 | 0.00 | 0.88 | |
| 8 | 0.09 | 10.89 | 0.00 | 0.00 | 0.35 | 0.52 | 1.92 | 0.00 | 0.00 | 0.69 | |
| CPI Values of Free Alkanes | CPI Values of Bound Alkanes | ||||||||
|---|---|---|---|---|---|---|---|---|---|
| Depth(cm) | H/L | TAR | CPI1 | CPI2 | H/L | TAR | CPI1 | CPI2 | |
| 1 | 0.90 | 0.98 | 0.70 | 0.76 | 12.0 | 0.0 | 0.0 | 1.52 | |
| 2 | 0.18 | 0.0 | 0.24 | 0.0 | 0.0 | 0.0 | 0.0 | 0.0 | |
| 3 | 0.24 | 0.0 | 0.94 | 0.0 | 2.43 | 0.0 | 0.0 | 0.0 | |
| D113 | 4 | 0.34 | 0.0 | 0.74 | 0.0 | 0.0 | 0.0 | 0.0 | 0.0 |
| 5 | 0.0 | 0.0 | 0.0 | 0.0 | 0.0 | 0.0 | 0.0 | 0.0 | |
| 6 | 0.29 | 0.05 | 0.58 | 0.06 | 0.2 | 0.0 | 0.51 | 0.0 | |
| 7 | 0.28 | 0.0 | 0.89 | 0.0 | 3.01 | 0.0 | 0.0 | 0.0 | |
| 8 | 0.21 | 0.0 | 0.93 | 0.0 | 0.0 | 0.0 | 0.0 | 0.0 | |
| 1 | 0.05 | 0.36 | 0.08 | 0.98 | 0.0 | 0.39 | 0.10 | 1.30 | |
| 2 | 0.65 | 9.87 | 0.02 | 1.80 | 0.19 | 4.60 | 0.0 | 0.0 | |
| 3 | 0.98 | 0.37 | 0.3 | 1.42 | 0.20 | 0.0 | 0.0 | 0.0 | |
| S01 | 4 | 1.07 | 0.18 | 0.22 | 1.22 | 0.89 | 0.0 | 0.0 | 1.31 |
| 5 | 1.21 | 1.33 | 0.26 | 1.35 | 0.62 | 0.0 | 0.1 | 3.20 | |
| 6 | 1.74 | 7.53 | 0.07 | 2.29 | 4.88 | 0.0 | 0.0 | 3.68 | |
| 7 | 1.72 | 0.0 | 0.21 | 1.09 | 4.37 | 0.0 | 0.0 | 0.71 | |
| 8 | 0.91 | 0.27 | 0.27 | 0.87 | 0.0 | 0.0 | 0.0 | 0.0 | |
Publisher’s Note: MDPI stays neutral with regard to jurisdictional claims in published maps and institutional affiliations. |
© 2022 by the authors. Licensee MDPI, Basel, Switzerland. This article is an open access article distributed under the terms and conditions of the Creative Commons Attribution (CC BY) license (https://creativecommons.org/licenses/by/4.0/).
Share and Cite
Khuhawar, A.H.; Sun, C.; Yang, G.-P.; Ding, H. The Characteristics of Lipid Biomarkers from the Abyssal and Hadal Sediments of the Yap Trench and the Influence of V-Shape Topography. Water 2022, 14, 3111. https://doi.org/10.3390/w14193111
Khuhawar AH, Sun C, Yang G-P, Ding H. The Characteristics of Lipid Biomarkers from the Abyssal and Hadal Sediments of the Yap Trench and the Influence of V-Shape Topography. Water. 2022; 14(19):3111. https://doi.org/10.3390/w14193111
Chicago/Turabian StyleKhuhawar, Aftab Hussain, Chengjun Sun, Gui-Peng Yang, and Haibing Ding. 2022. "The Characteristics of Lipid Biomarkers from the Abyssal and Hadal Sediments of the Yap Trench and the Influence of V-Shape Topography" Water 14, no. 19: 3111. https://doi.org/10.3390/w14193111