
Effects of Coal Gangue on the Hydrochemical Components under Different Types of Site Karst Water in Closed Mines

 , ,
, ,
Abstract
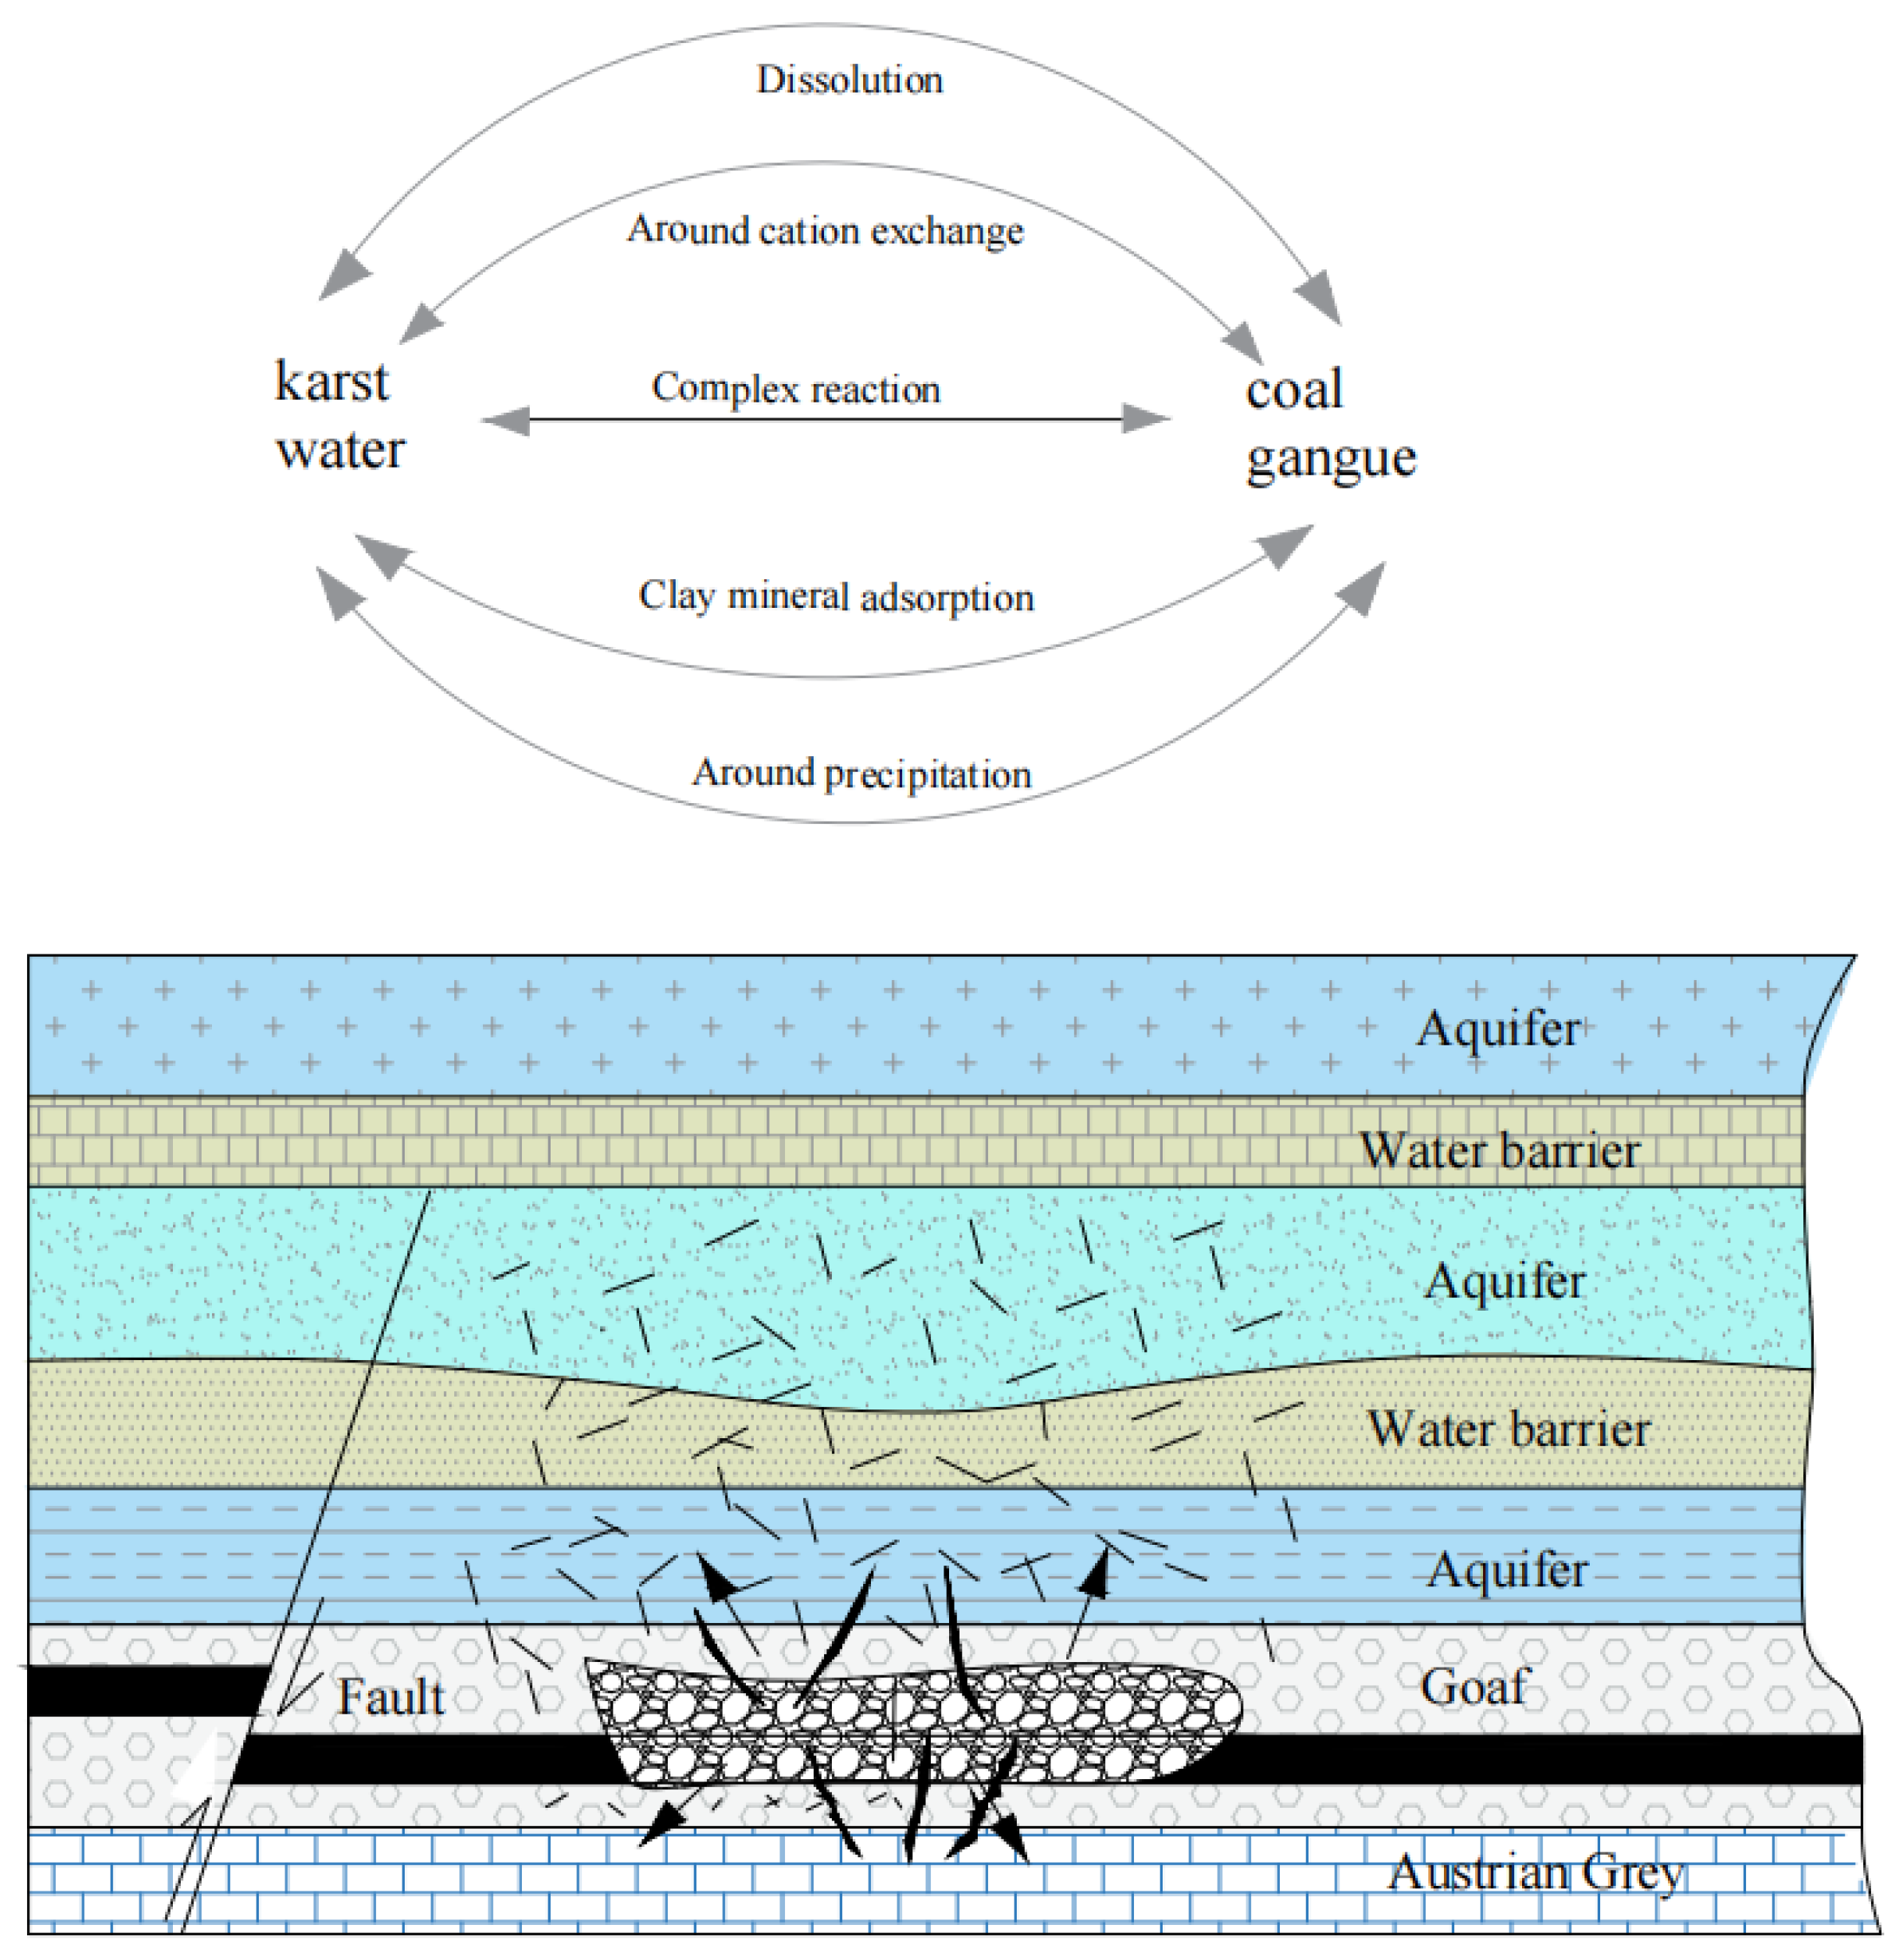
:1. Introduction
2. Experimental Section
2.1. Research Area
2.2. Sampling and Preparation
2.3. Immersion Test
3. Results and Discussion
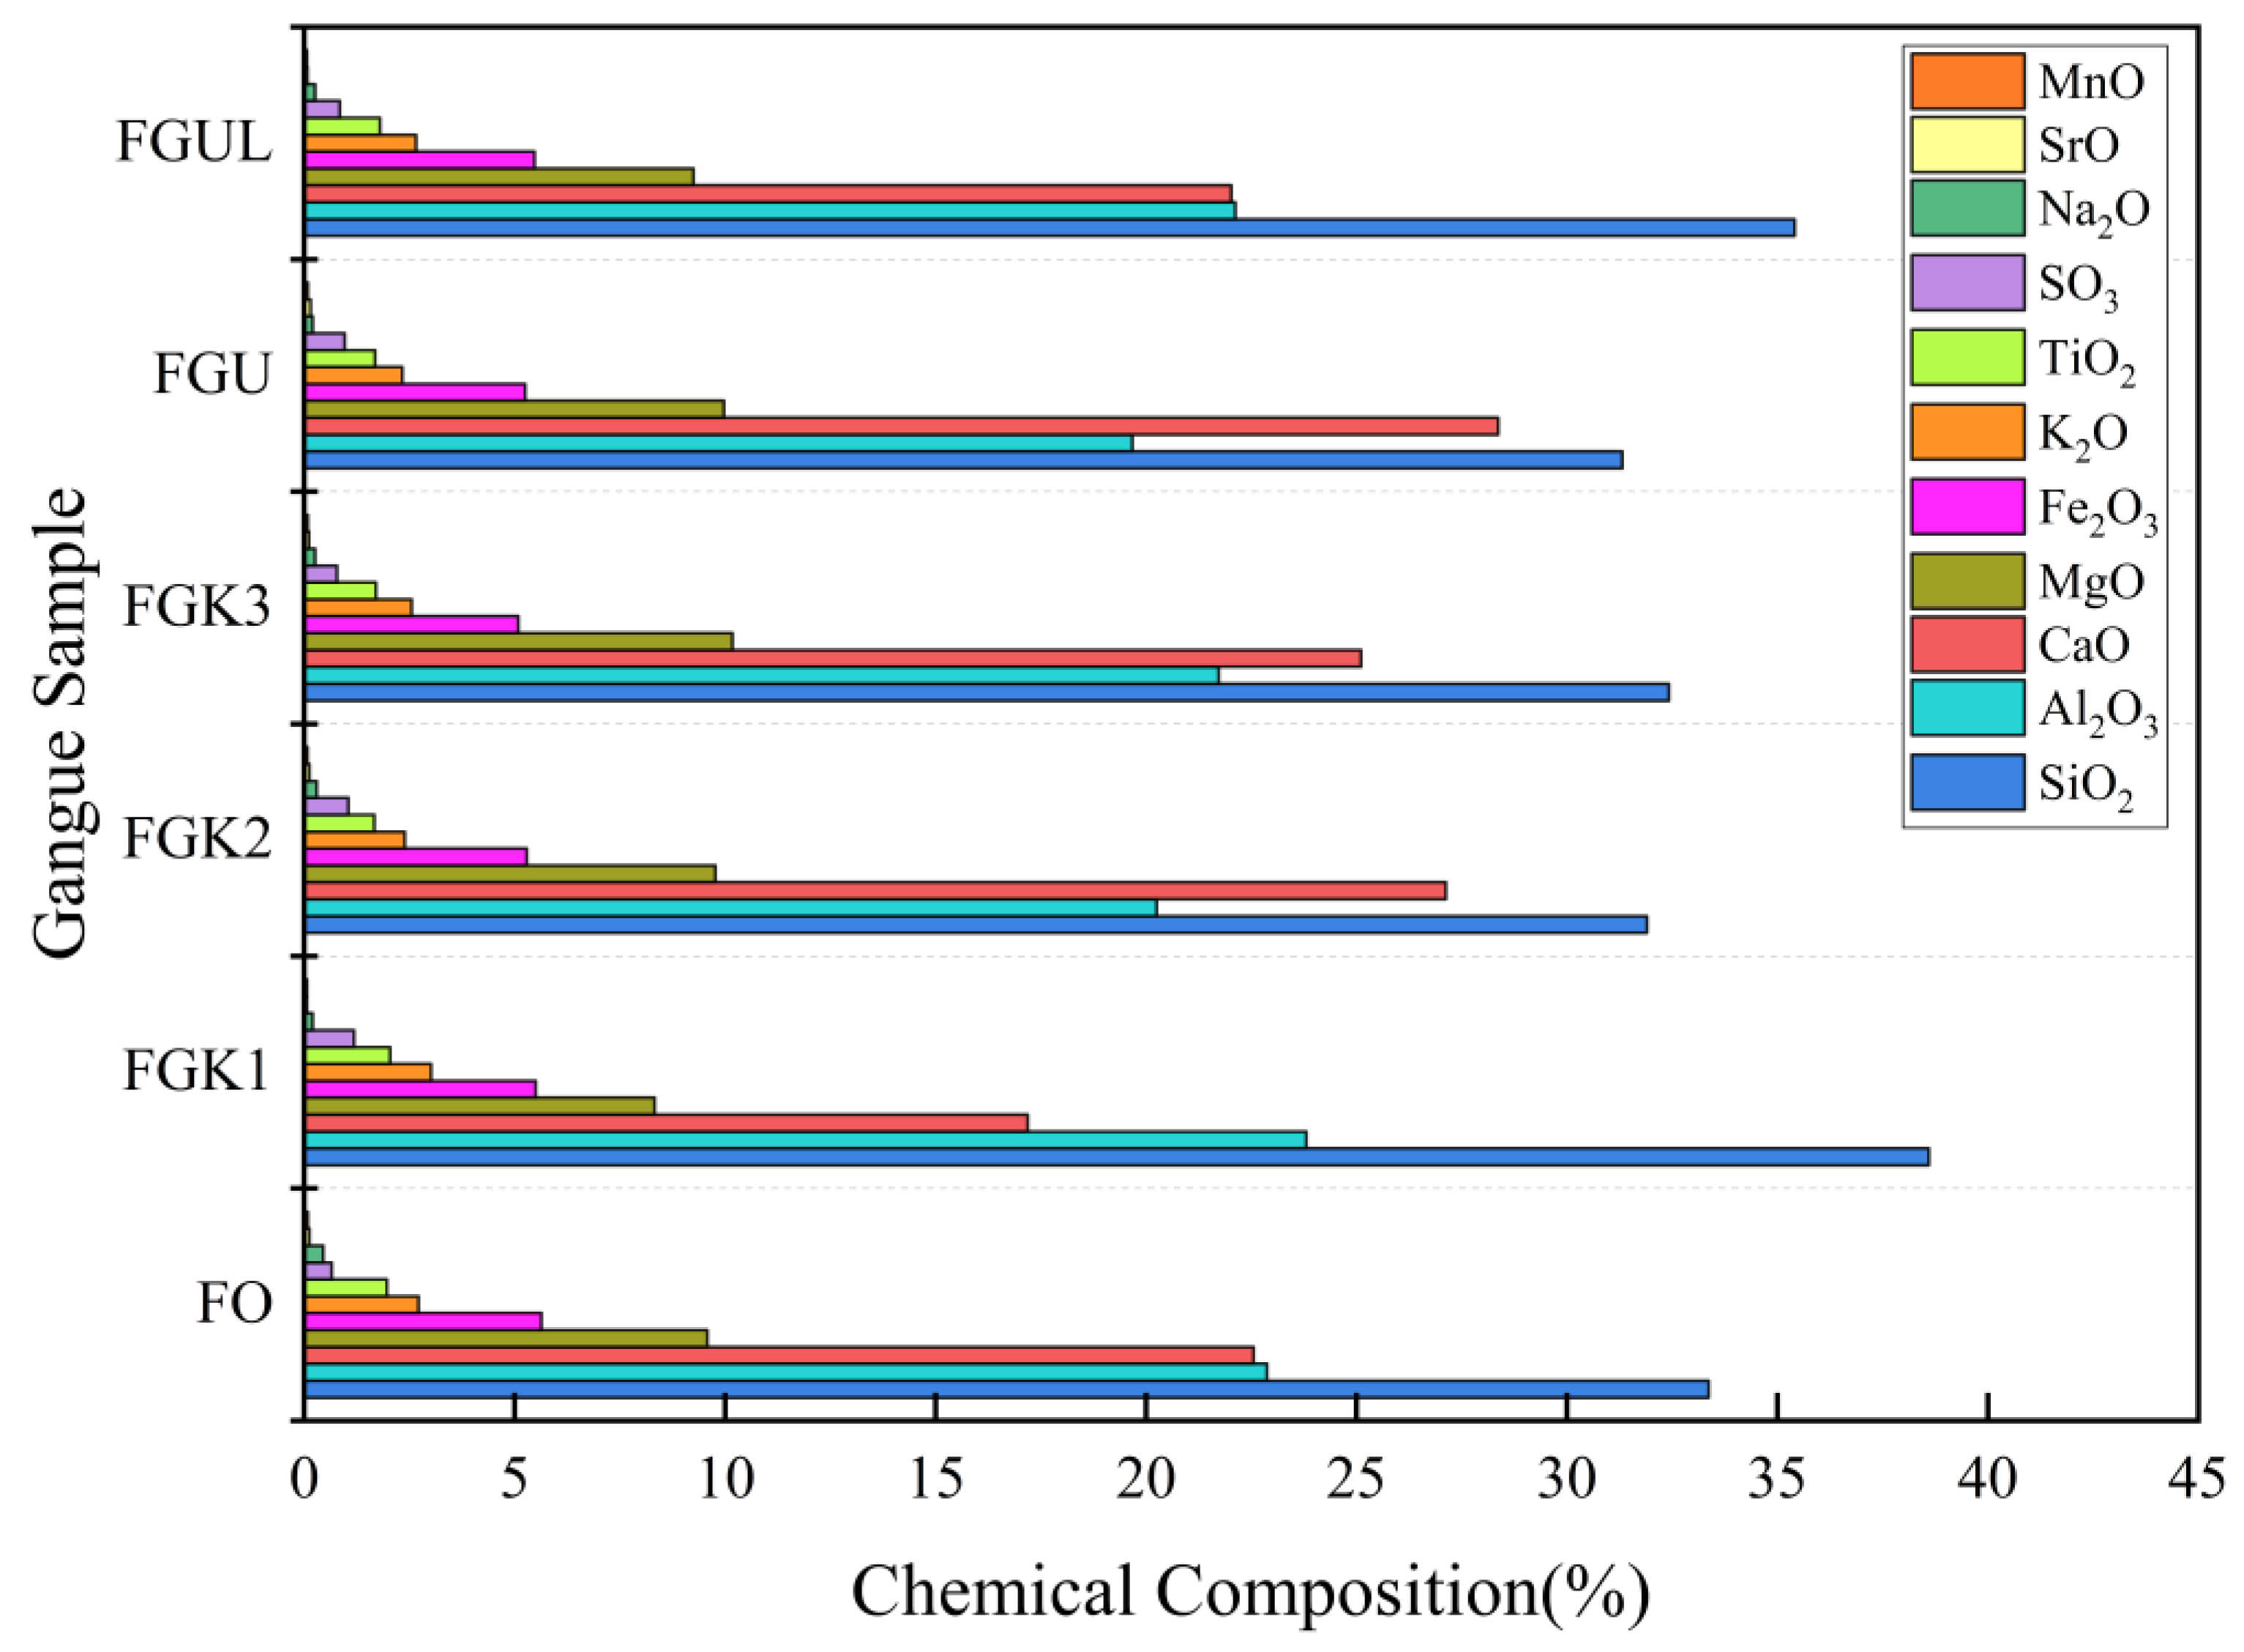
3.1. Mineral Components Analysis of Coal Gangue
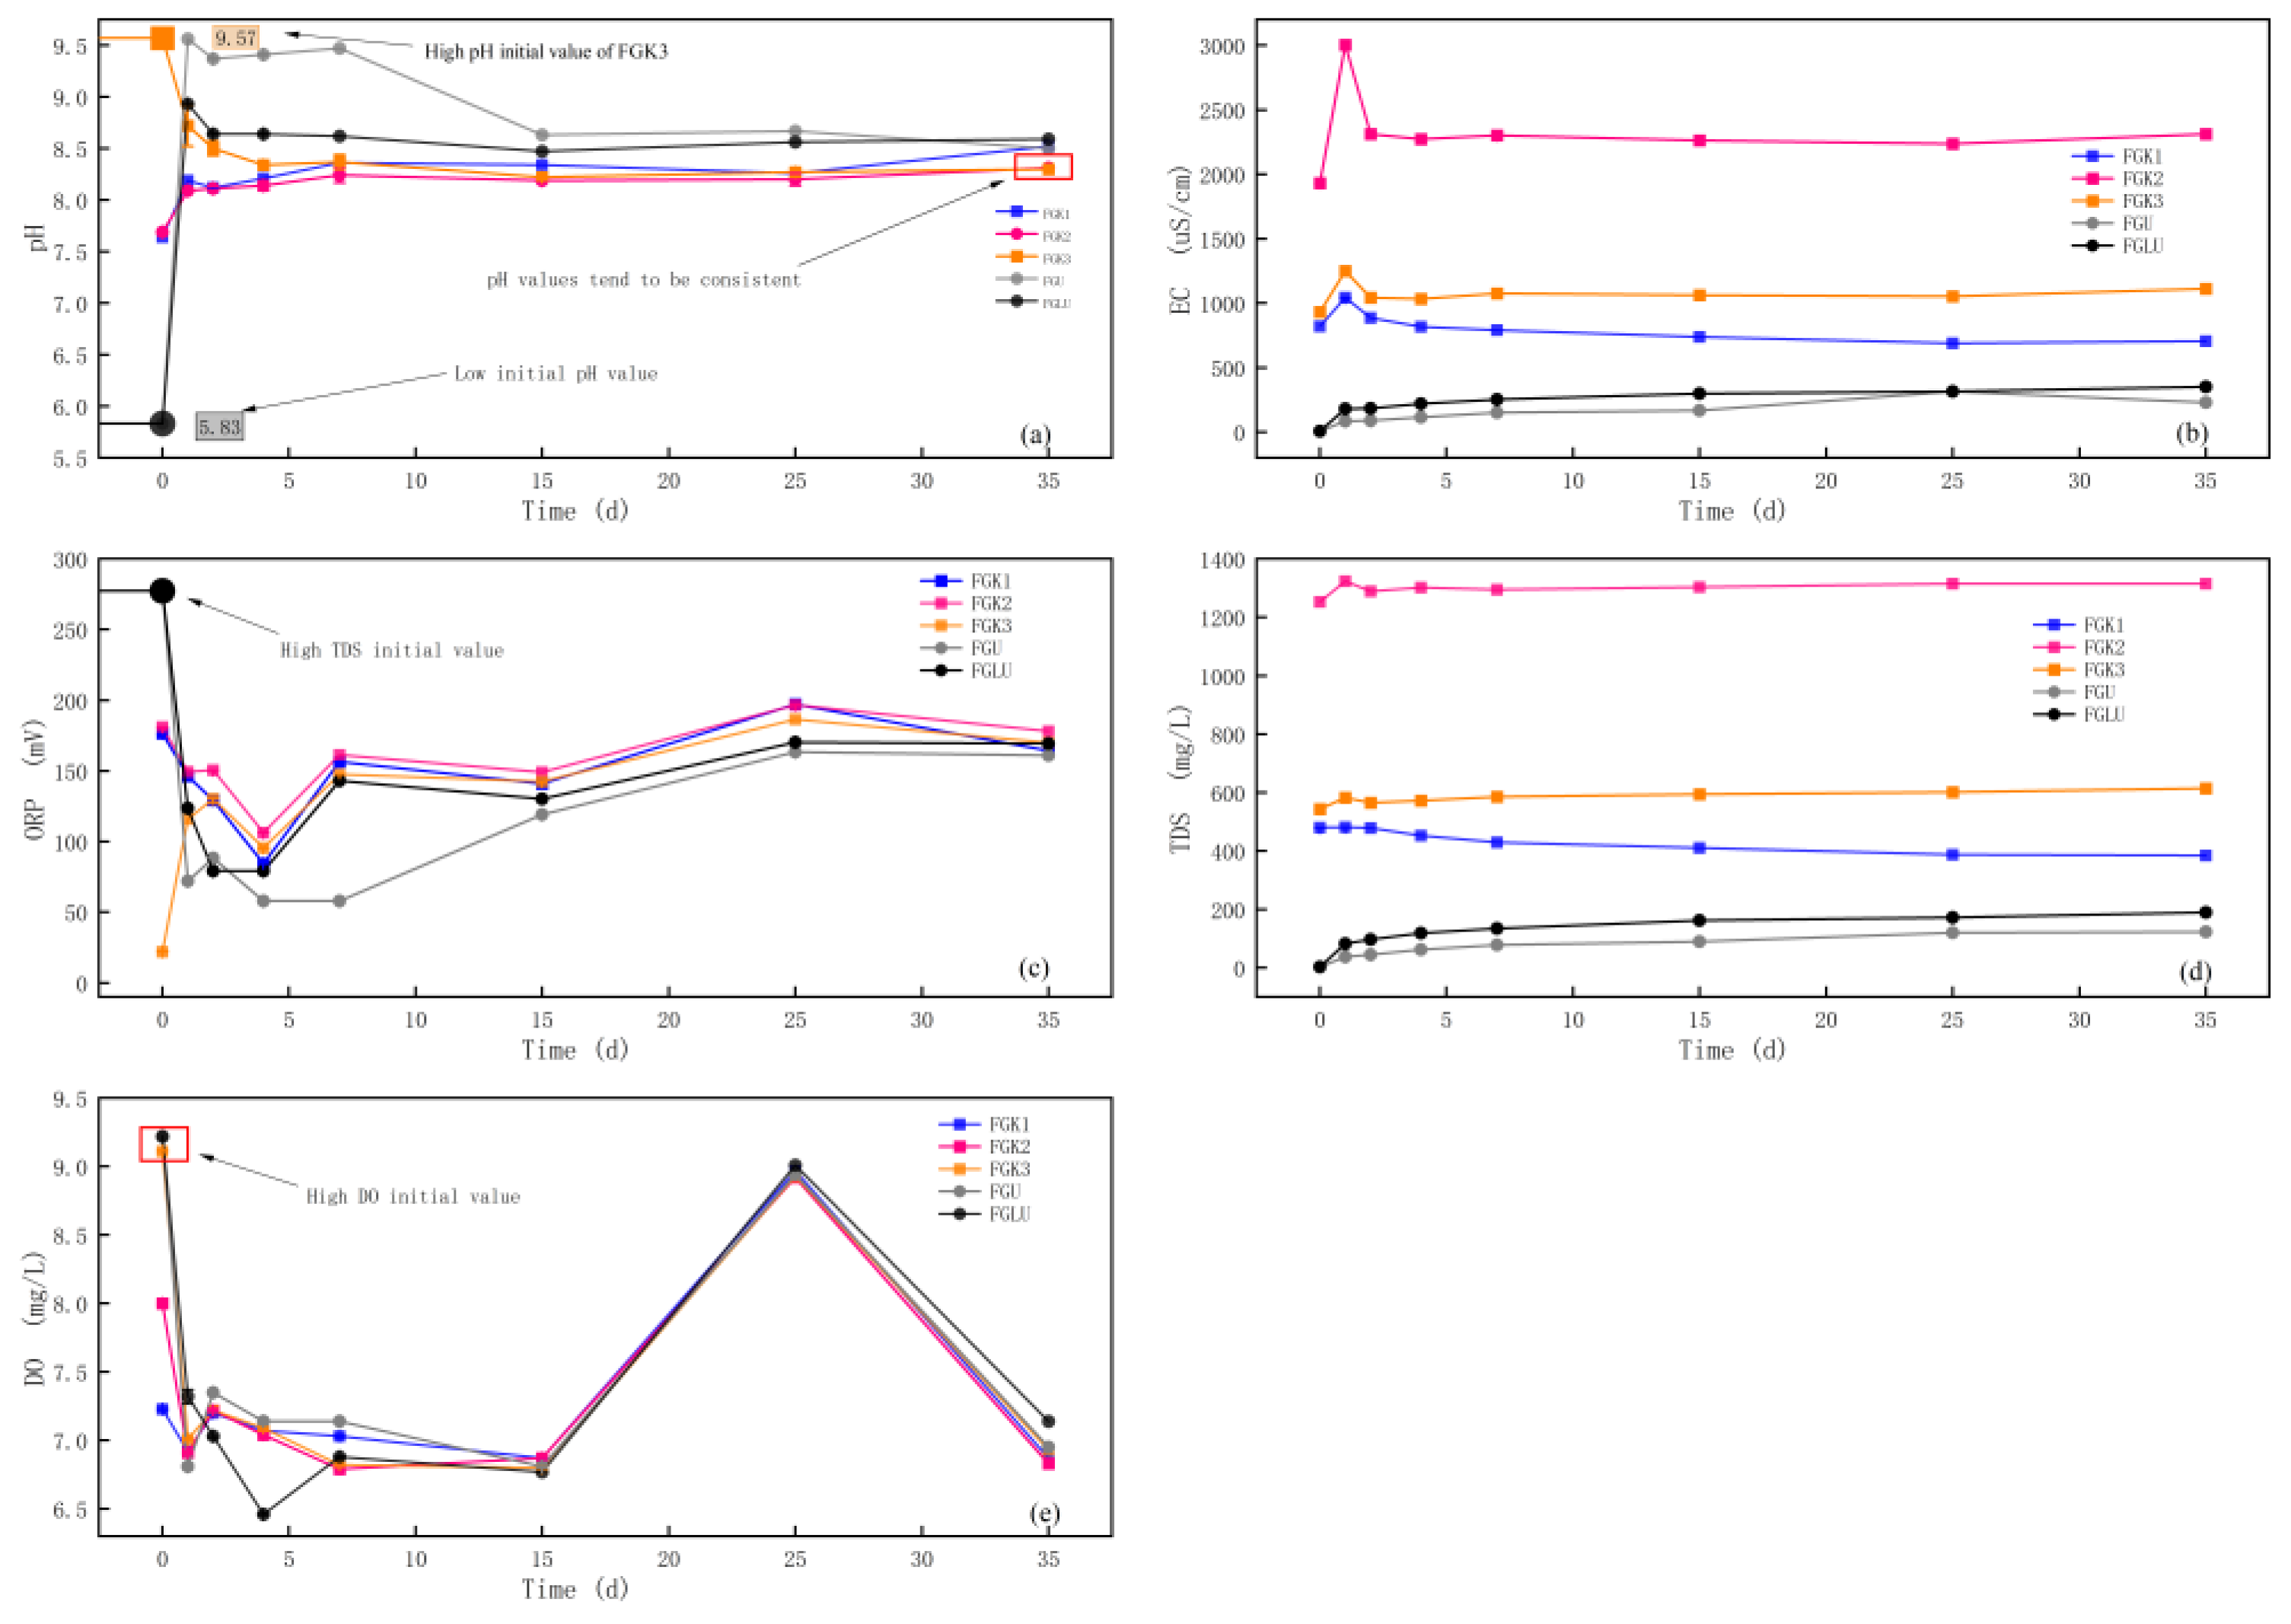
3.2. Analysis of Basic Water Quality Parameters for Different Immersion Solutions Interacting with the Coal Gangue
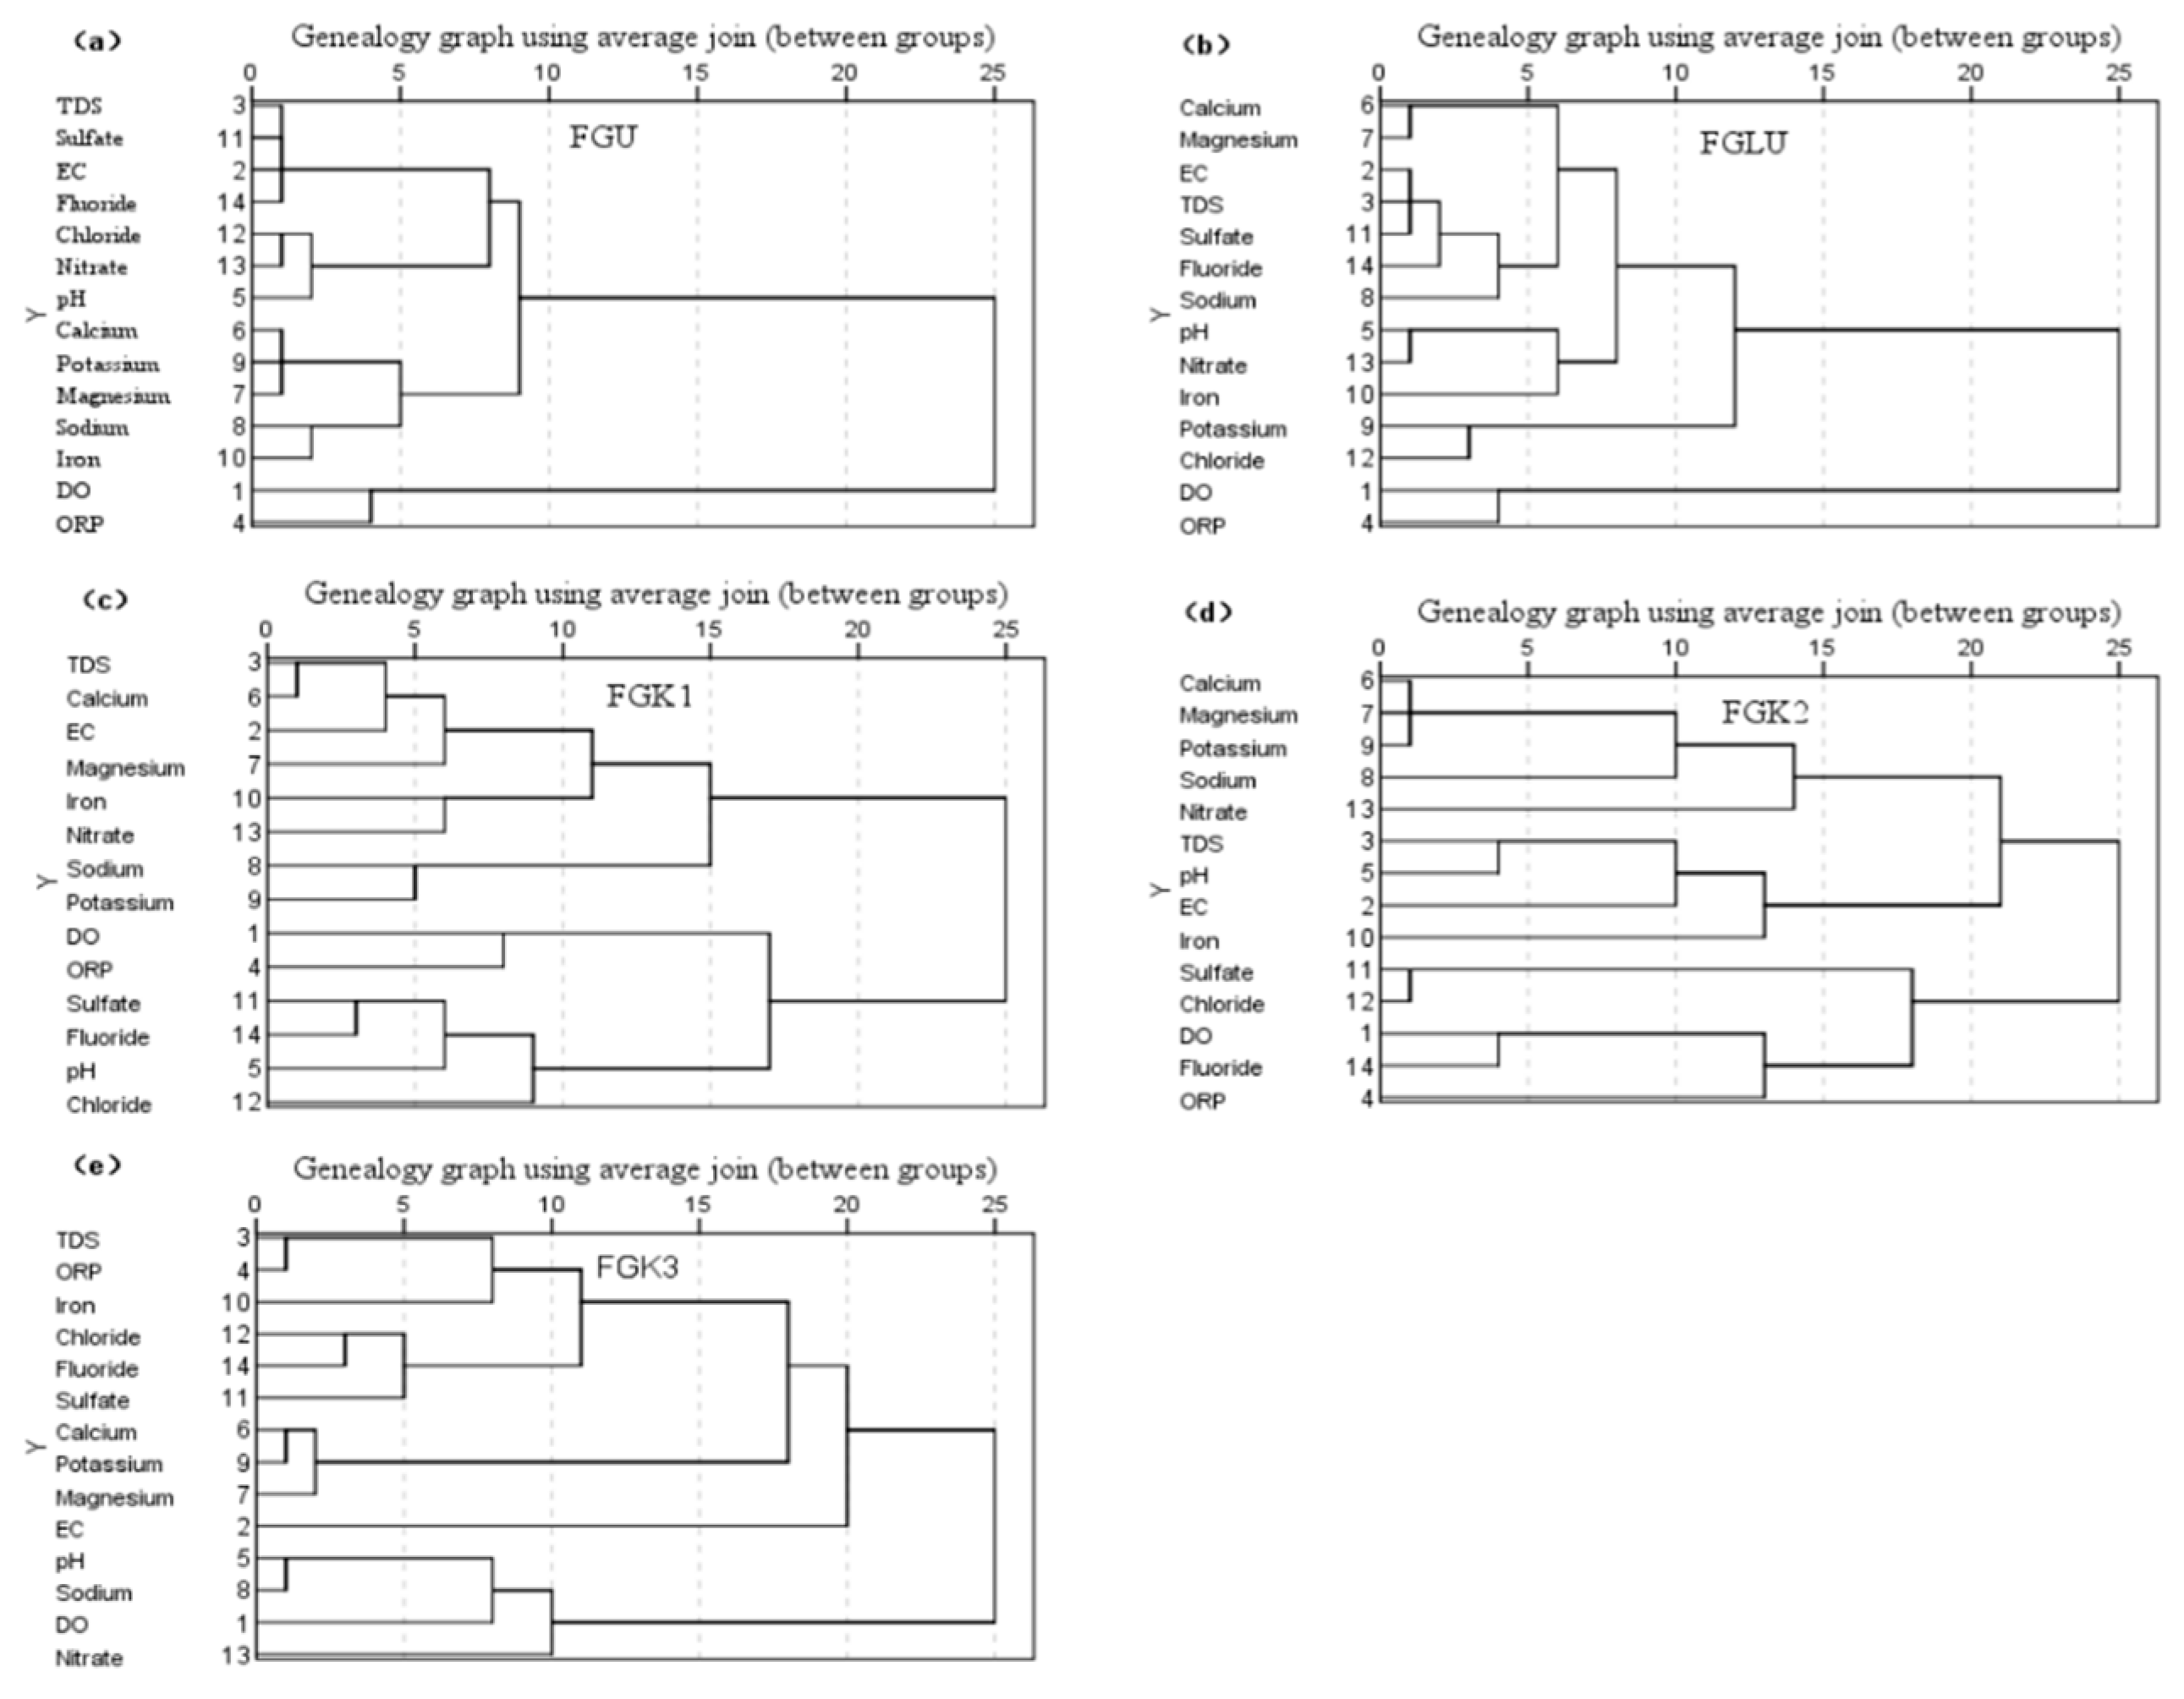
3.3. Cluster Analysis of the Water Quality Parameters of Each Solution
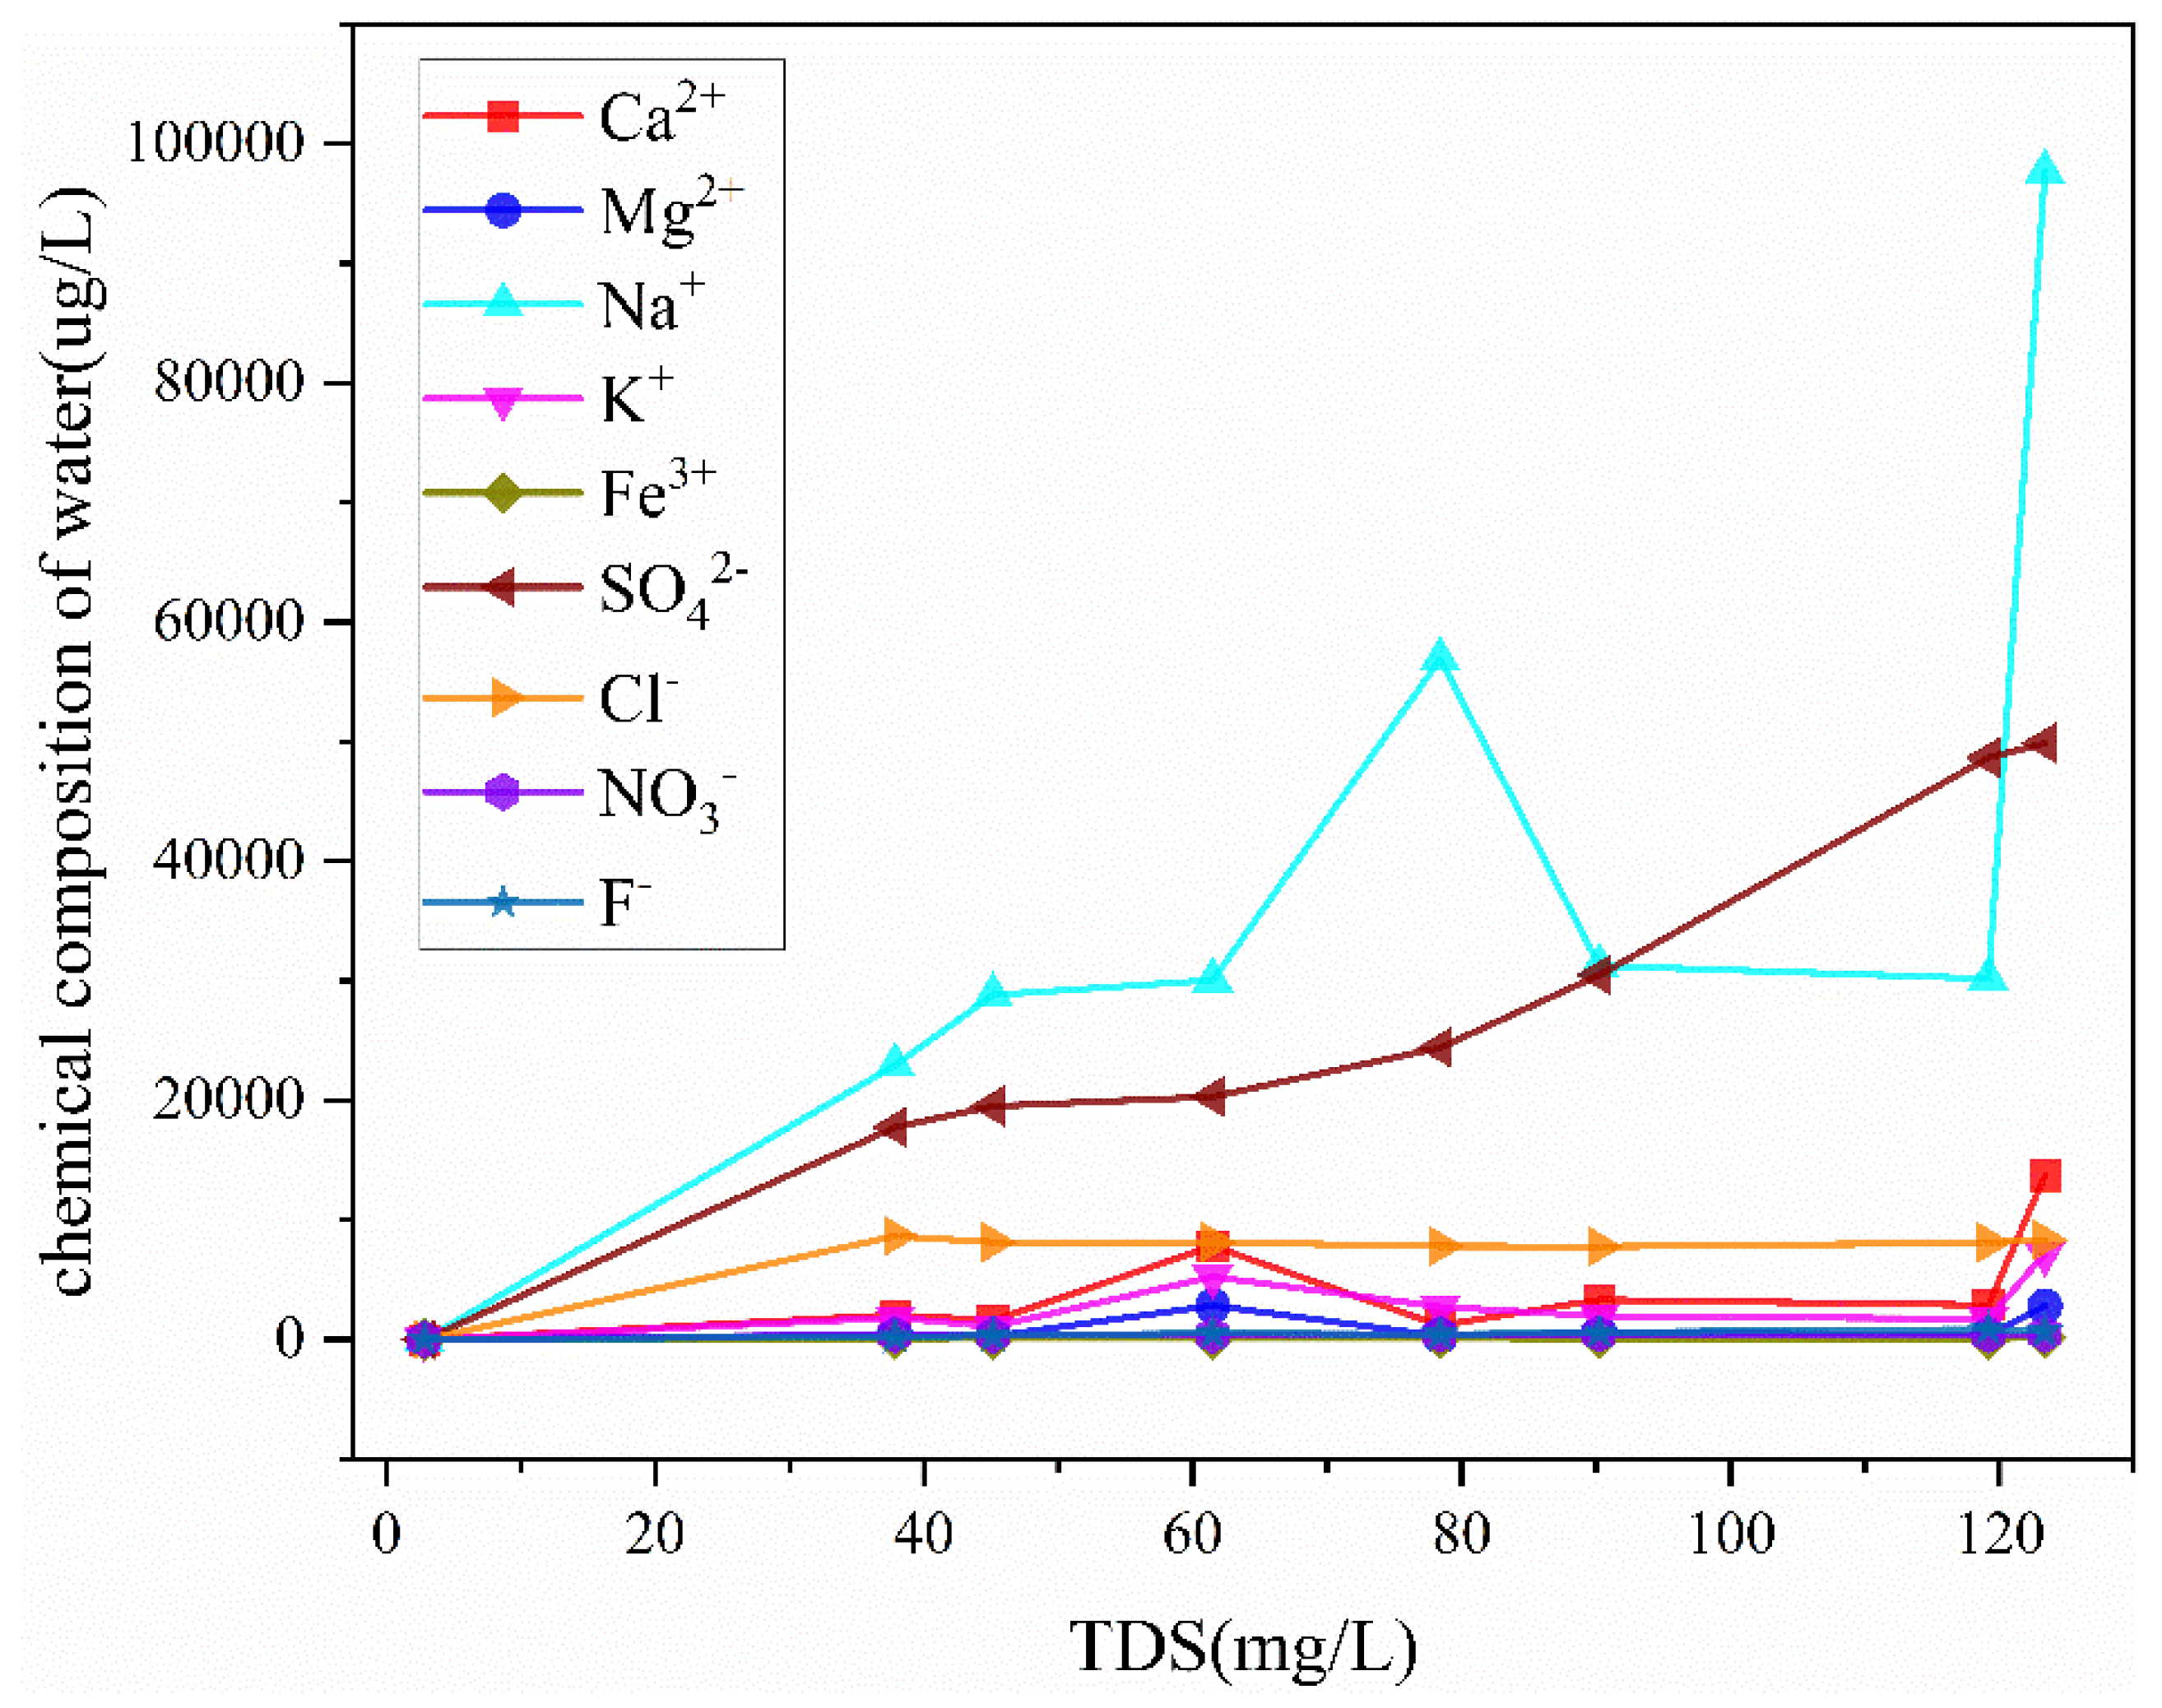
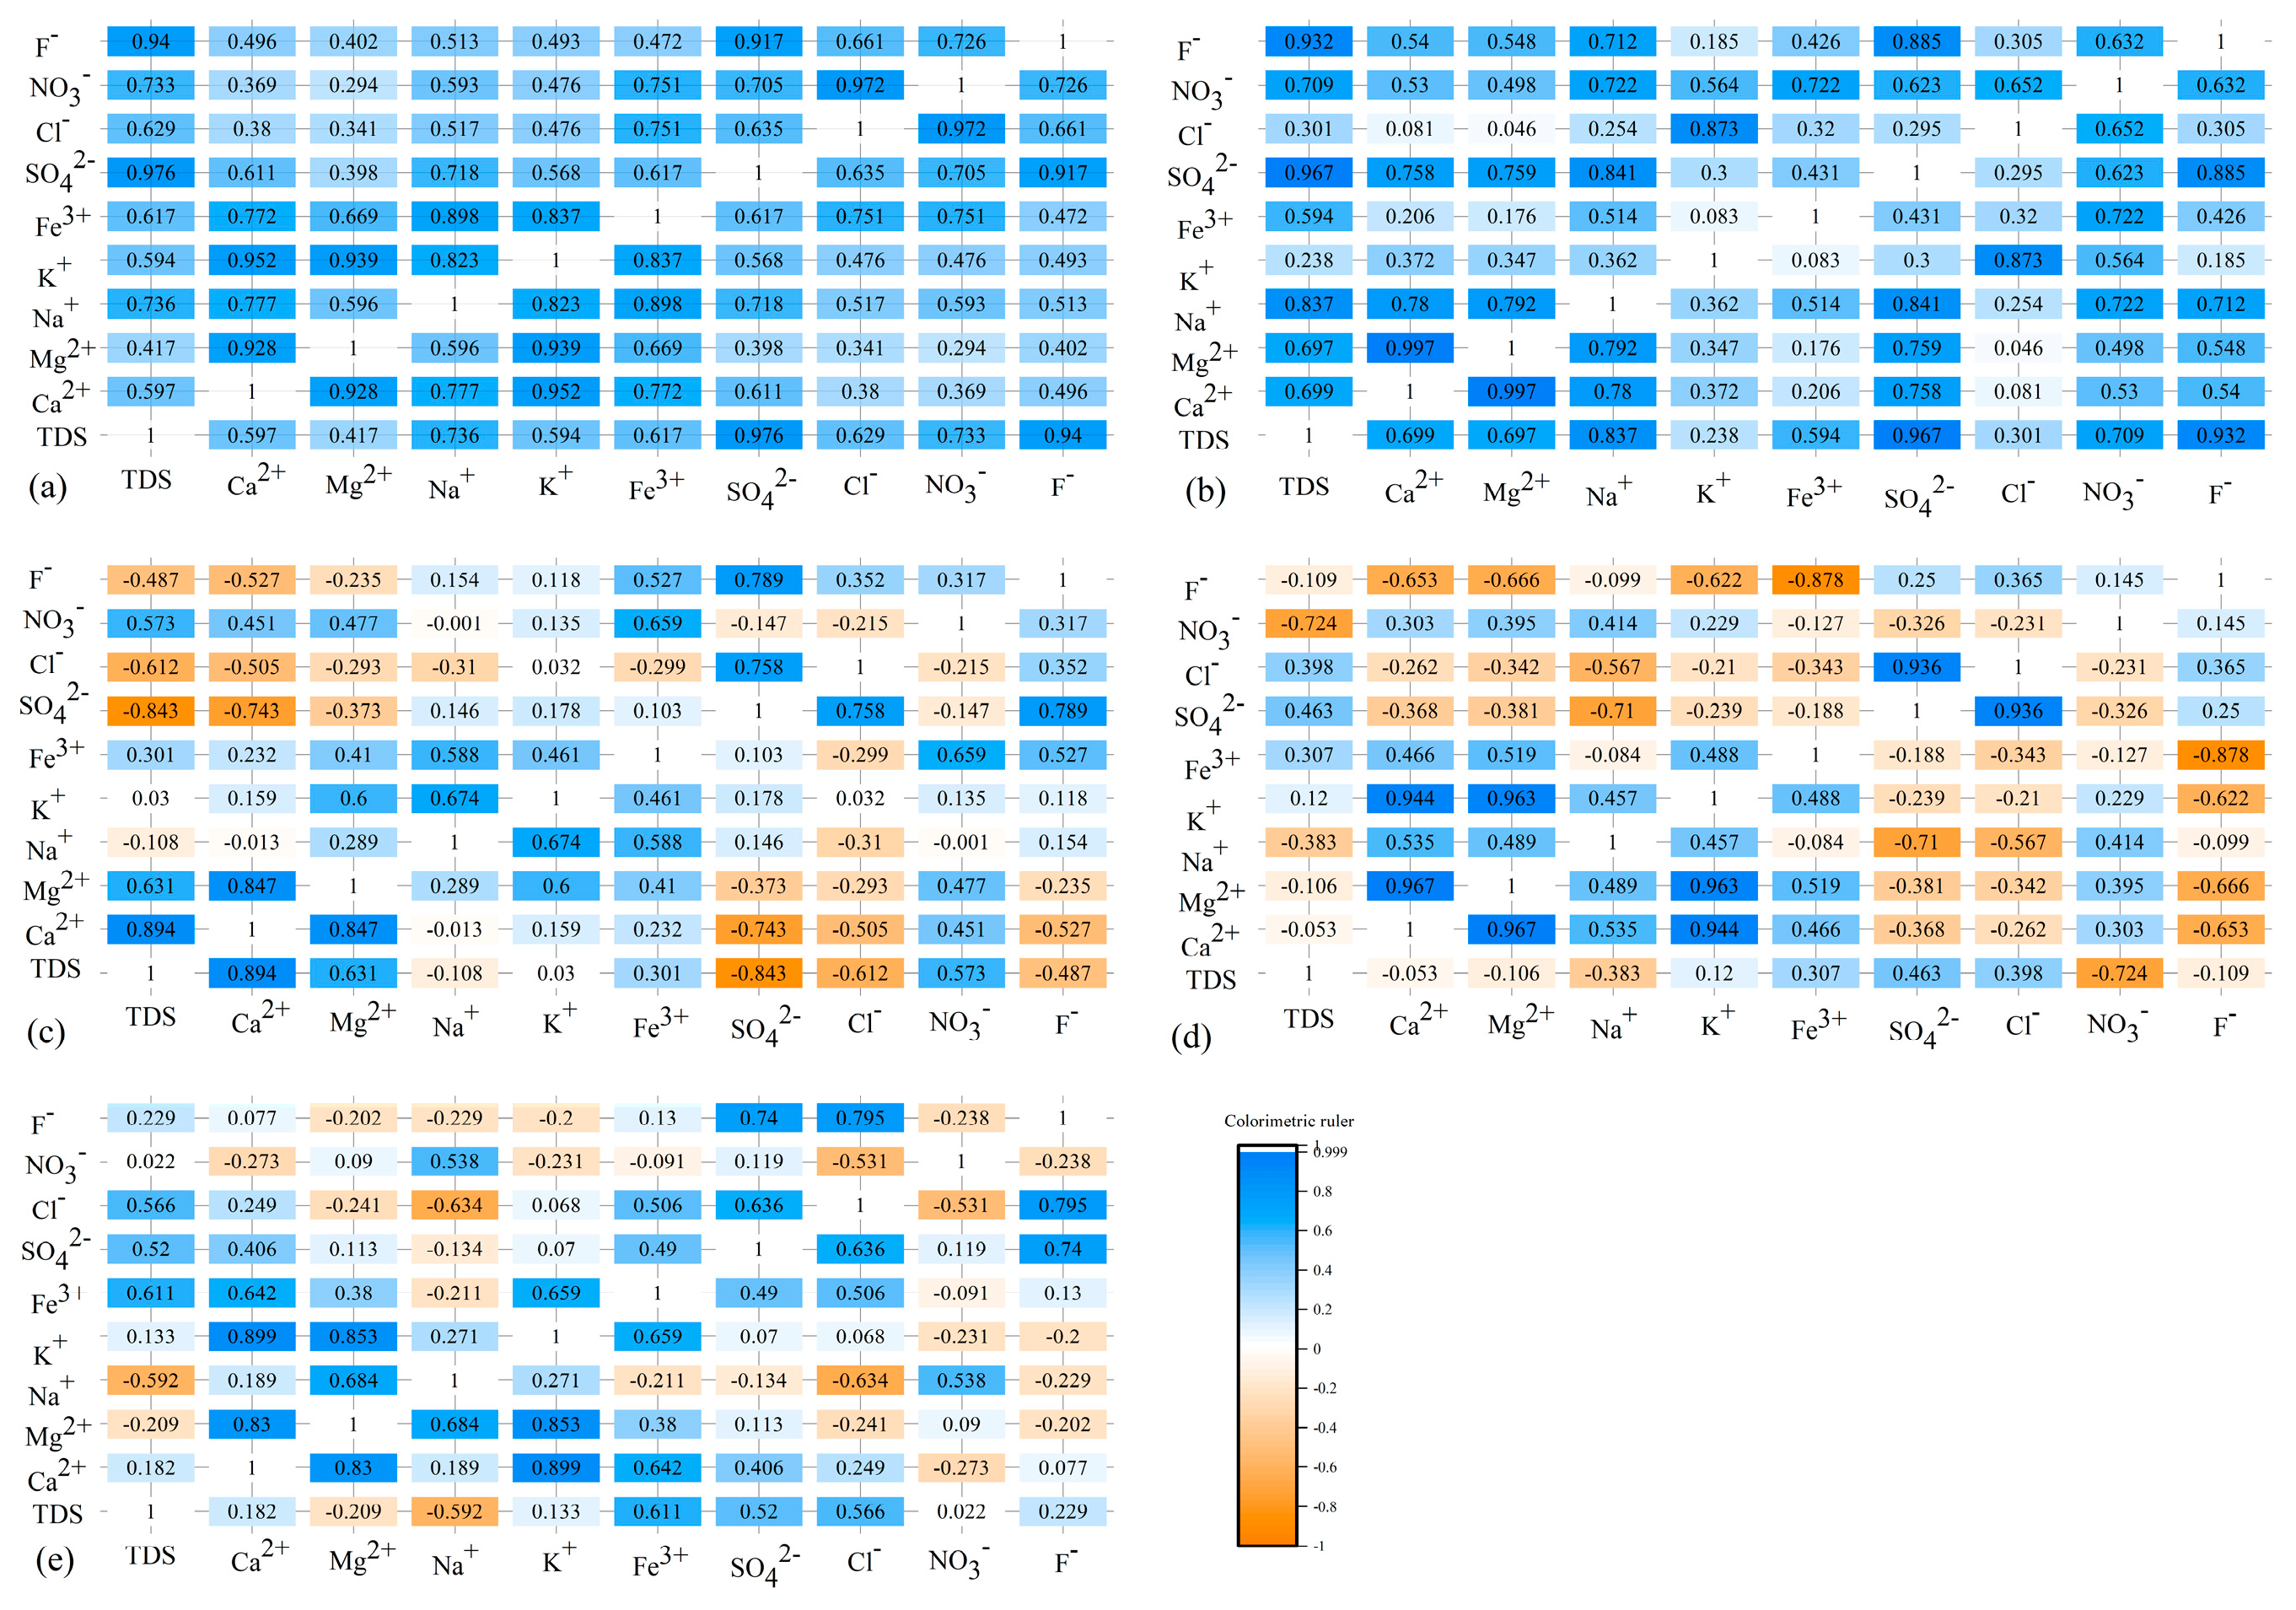
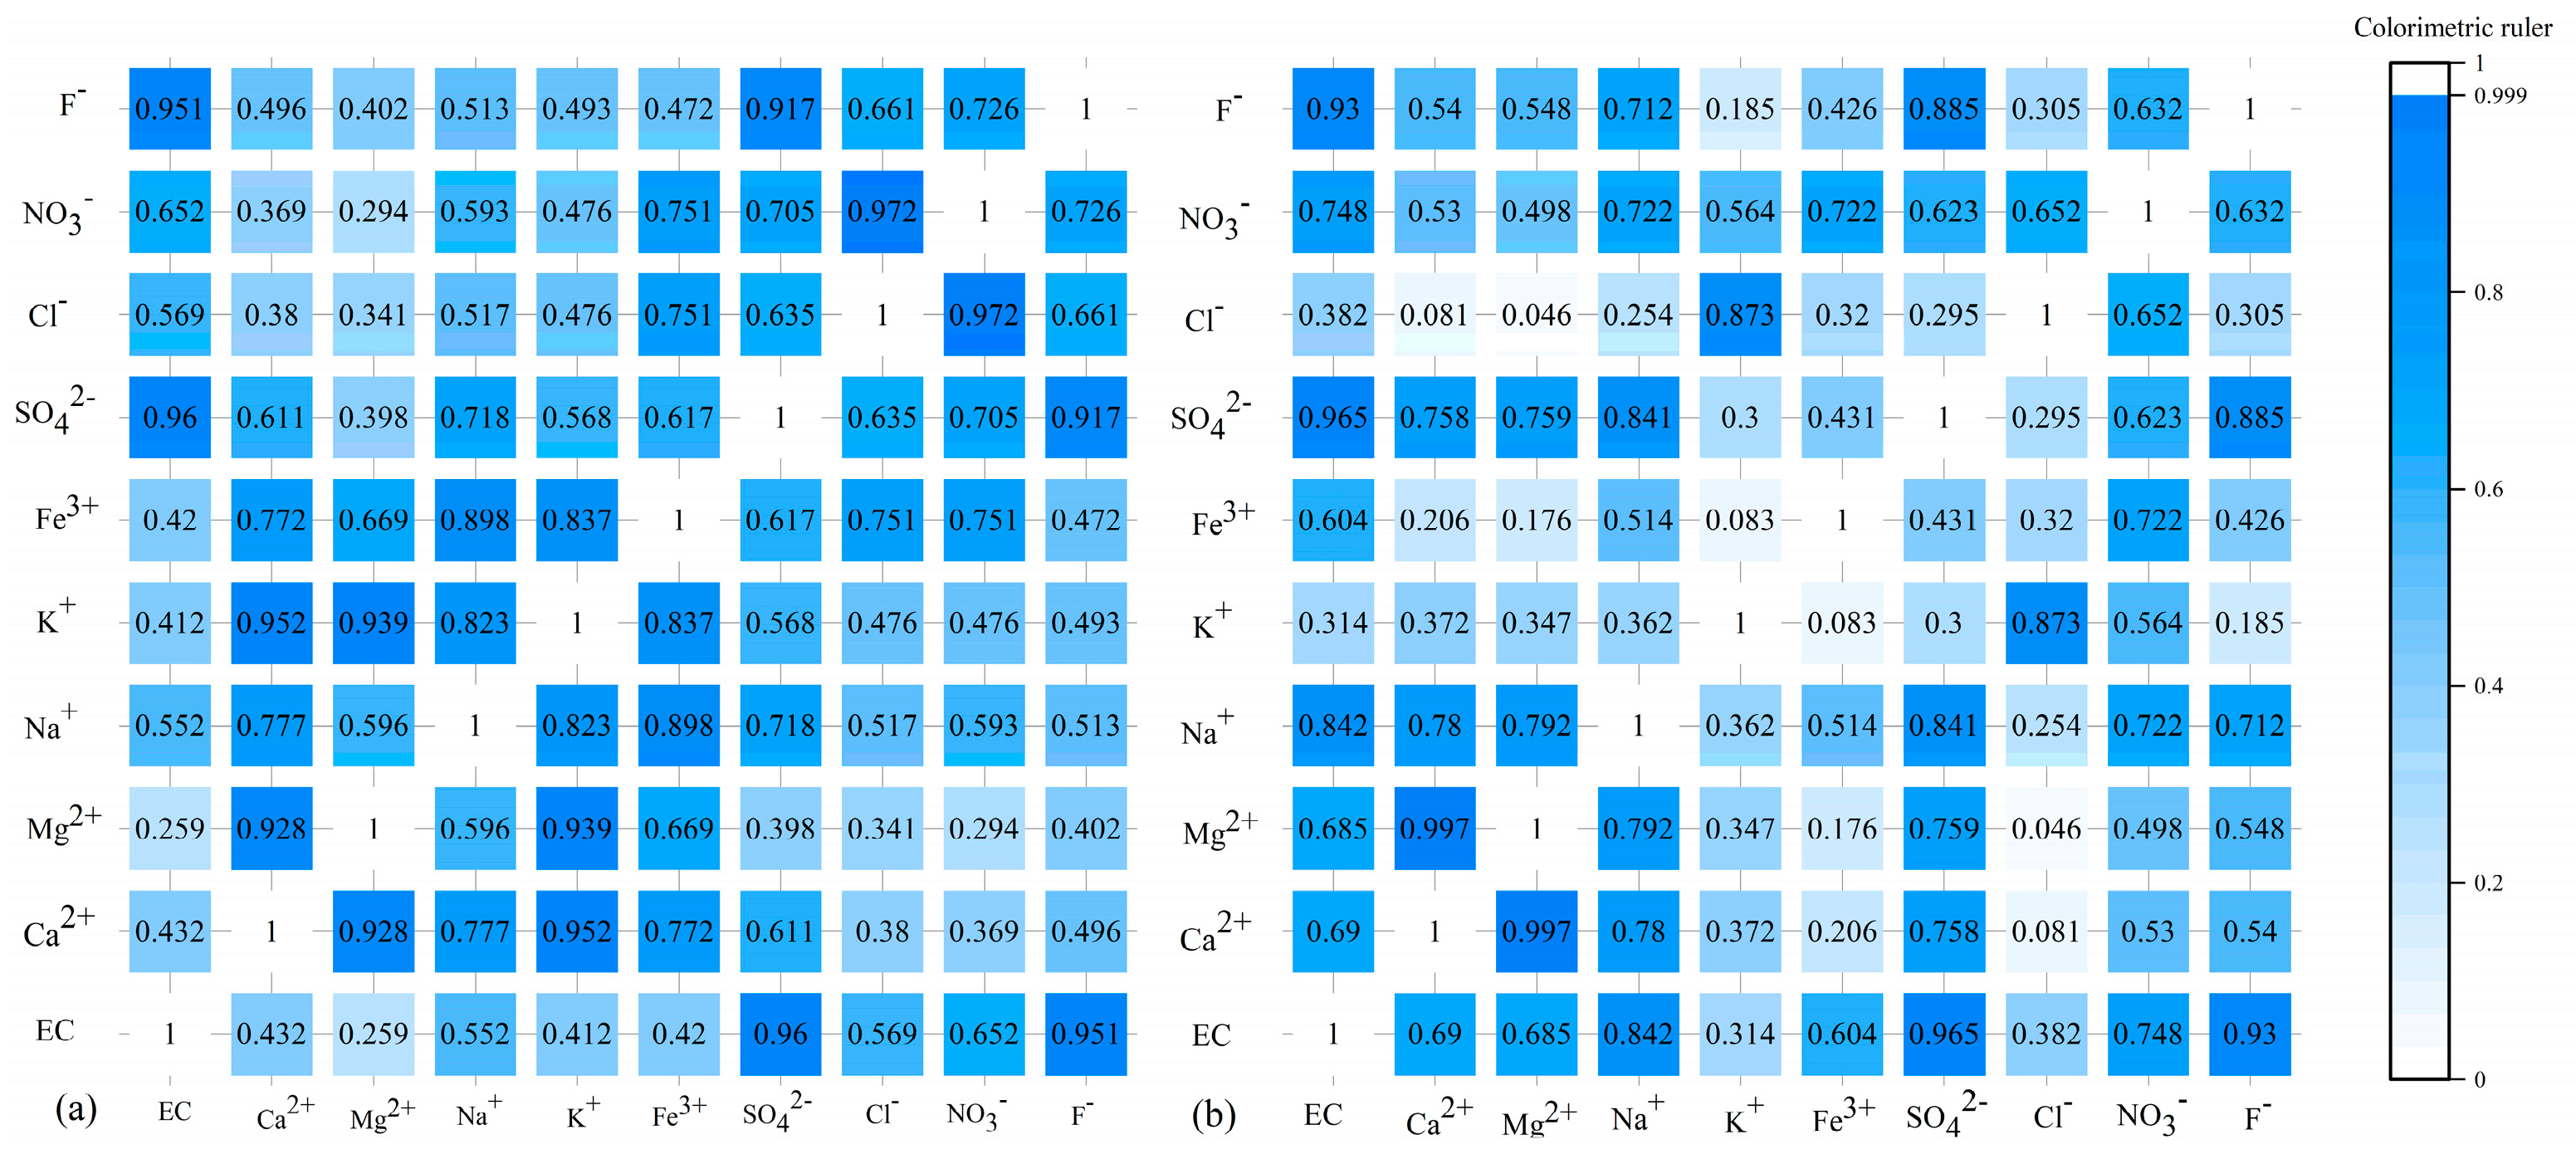
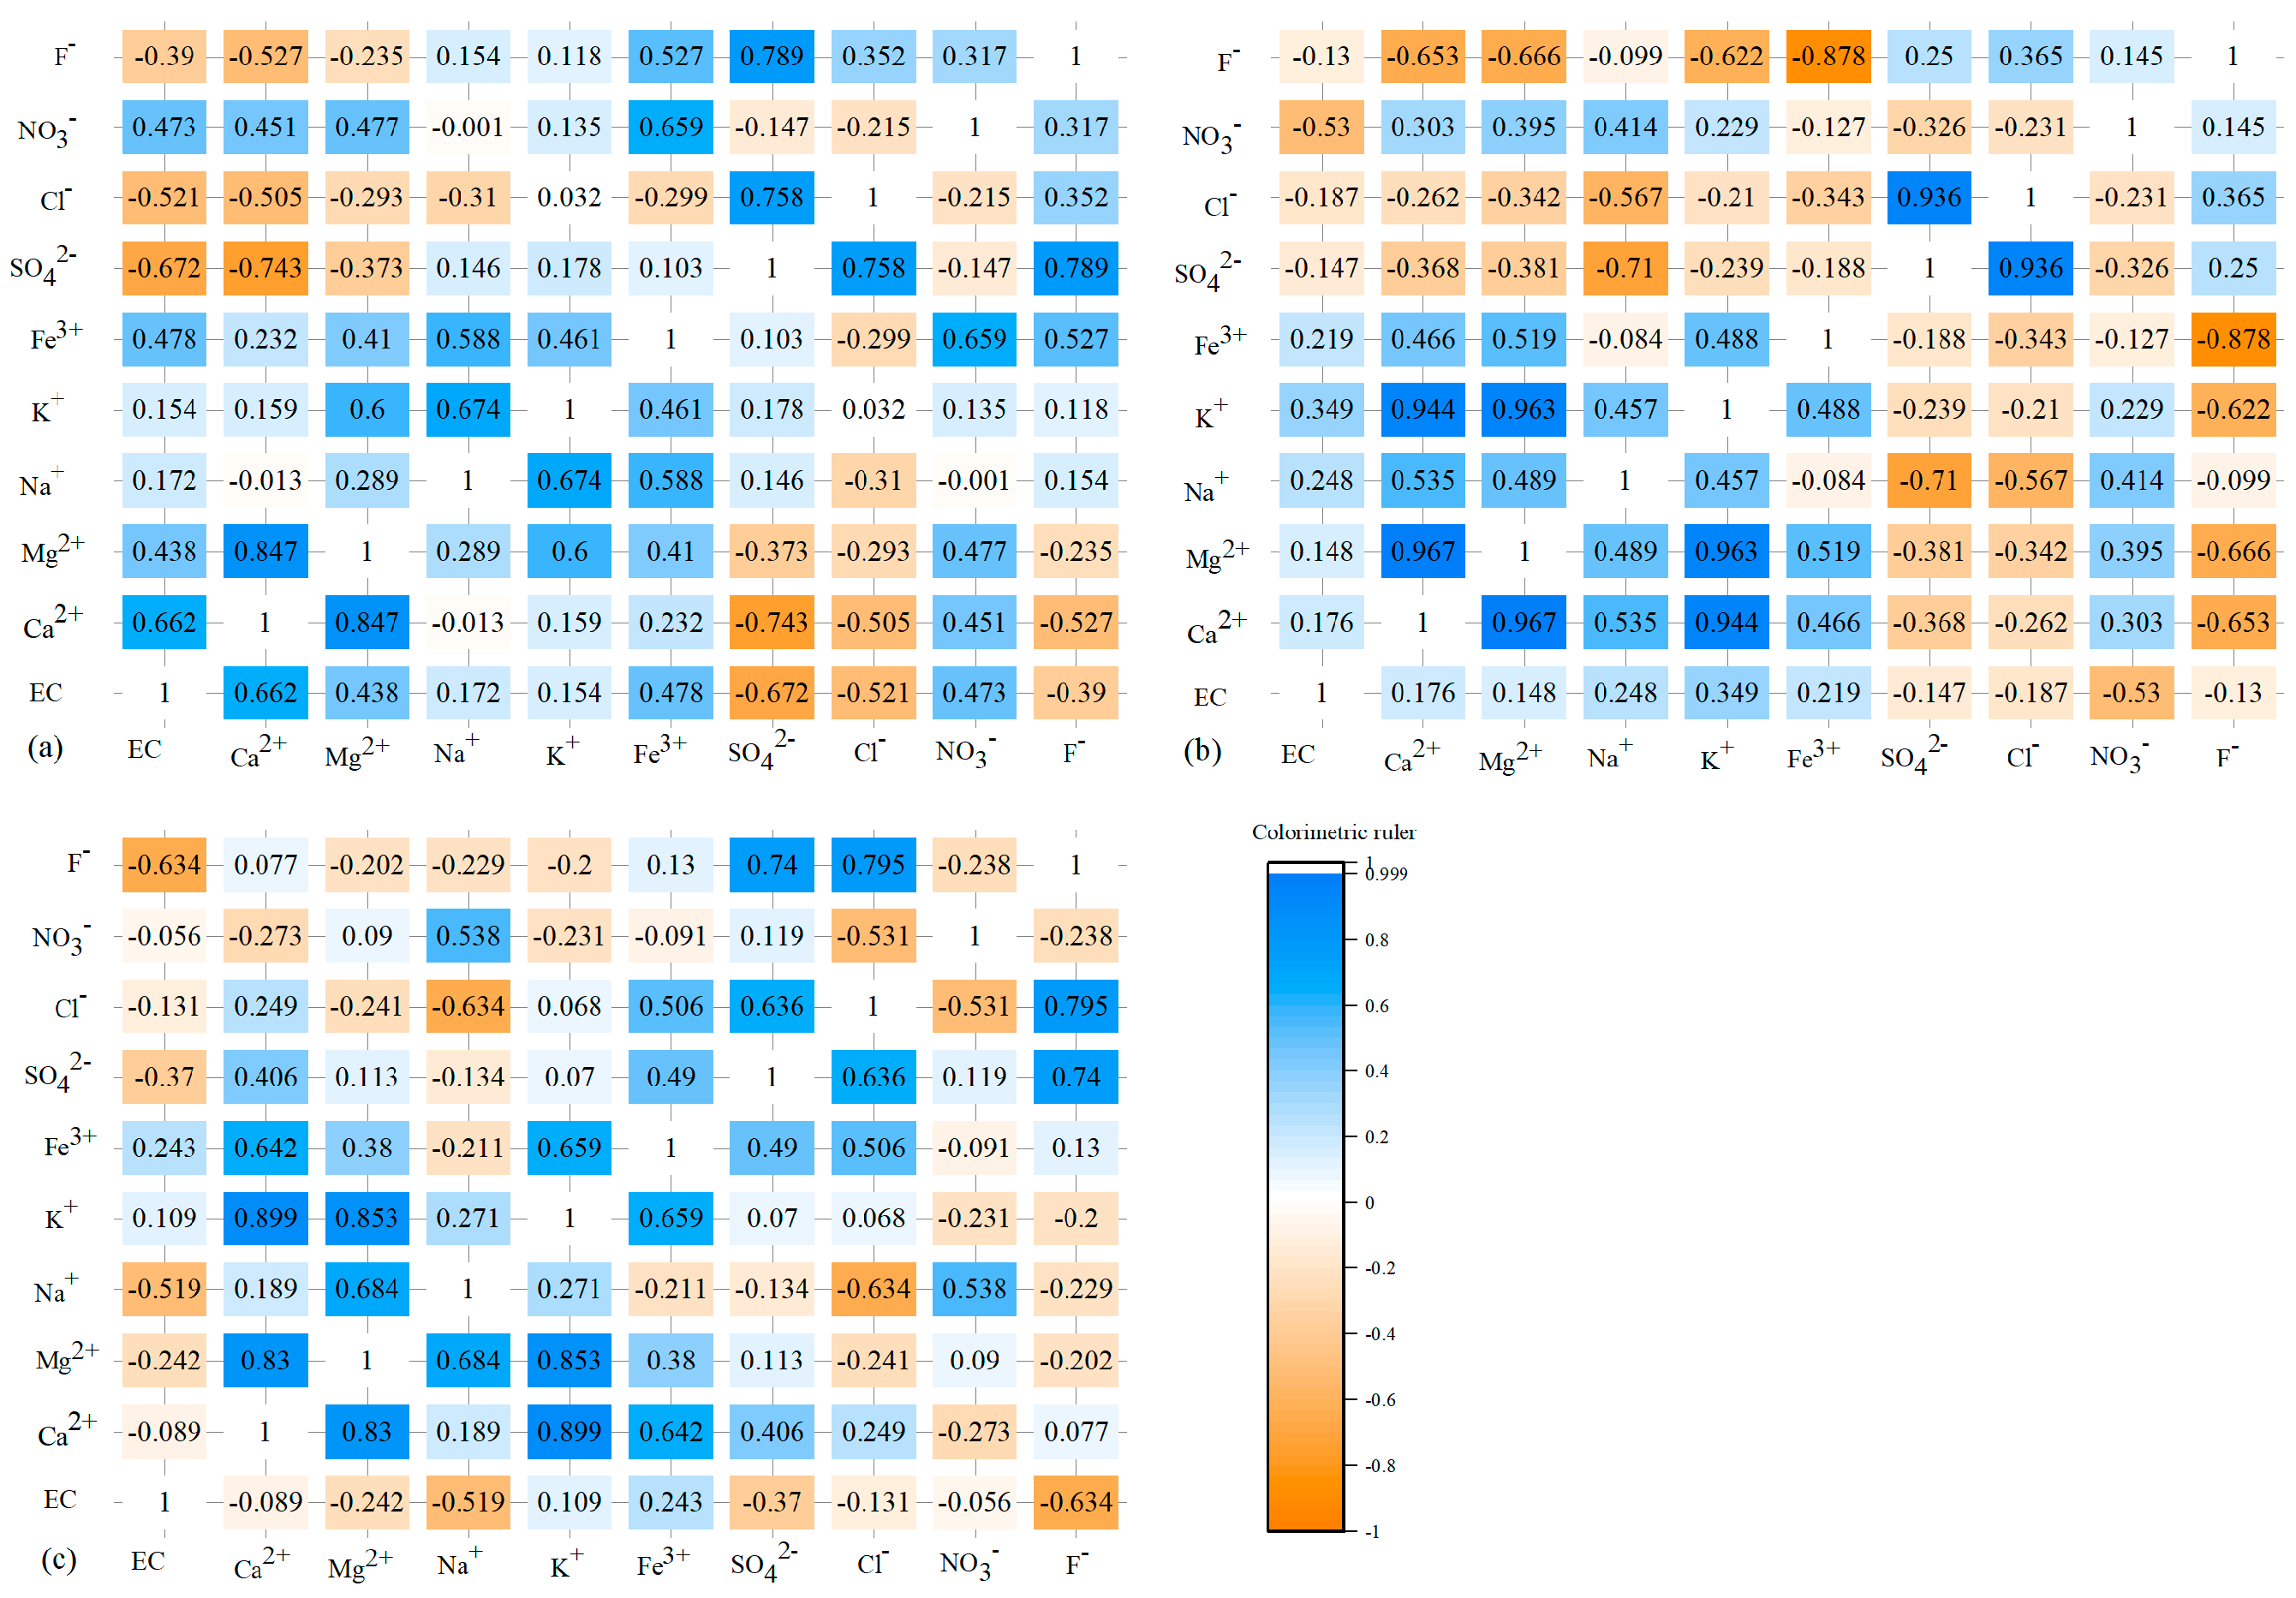
3.4. Main Influencing Factors Controlling the TDS and EC
3.4.1. TDS Correlation Analysis of Each Immersion Solution
3.4.2. EC Correlation Analysis of Each Immersion Solution
4. Conclusions
Author Contributions
Funding
Data Availability Statement
Acknowledgments
Conflicts of Interest
References
- Sun, W.; Wu, Q.; Liu, H.; Jiao, J. Prediction and assessment of the disturbances of the coal mining in Kailuan to karst groundwater system. Phys. Chem. Earth 2015, 89–90, 136–144. [Google Scholar] [CrossRef]
- Fan, G.Q. Absence of Carboniferous (Bamboofly) Belt in the East of North China Plate and Its Significance. Liaoning Geol. 1990, 1, 50–55. [Google Scholar]
- Li, Q.M.; Zhai, L.J.; Fu, Y.J.; Ma, X.F.; Ta, Y.B.; Li, J.Y.; Li, H.; Meng, Y.; Ma, Y. A study on coal mining aquifer destruction mode in north china typed coalfields. Coal Geol. China 2012, 24, 38–43. [Google Scholar]
- Xie, C.L.; Hu, B.L.; Xu, H.J.; Liu, H.H.; Chen, Q.; Gao, D.Y.; Guo, P.F.; Chen, Y.H. Permo-carboniferous argillutite measures distribution and sedimentary environment analysis in huainan coalfield. Coal Geol. China 2015, 27, 6–11. [Google Scholar]
- Qiao, X.; Li, G.; Li, M.; Zhou, J.; Du, J.; Du, C.; Sun, Z. Influence of coal mining on regional karst groundwater system: A case study in West Mountain area of Taiyuan City, Northern China. Environ. Earth Sci. 2011, 64, 1525–1535. [Google Scholar] [CrossRef]
- Huang, Y.; Li, J.; Song, T.; Sun, Q.; Kong, G.; Wang, F. Microstructure of coal gangue and precipitation of heavy metal elements. J. Spectrosc. 2017, 2017, 3128549. [Google Scholar] [CrossRef] [Green Version]
- Wu, H.; Wen, Q.; Hu, L.; Gong, M.; Tang, Z. Feasibility study on the application of coal gangue as landfill liner material. Waste Manag. 2017, 63, 161–171. [Google Scholar] [CrossRef]
- Zhou, M.J. Application of Coal Gangue Filling Mining Technology in Pingmei No.12 Mine. Zhong Zhou Coal. 2012, 10, 75–76. [Google Scholar]
- Zhou, H.Y.; Xu, G.X. The research and application of reclamation technology in complex matrix of VA mycorrhiza on coal mine abandoned wasteland. Adv. Mater. Res. 2012, 550–553, 2224–2227. [Google Scholar] [CrossRef]
- Daniels, W.L.; Orndorff, Z.W.; Eick, M.J.; Zipper, C.E. Predicting TDS release from Appalachian mine spoils. In Environmental Considerations in Energy Production; Craynon, J.R., Ed.; Society for Mining Metallurgy and Exploration: Englewood, CO, USA, 2013; pp. 275–285. [Google Scholar]
- Li, Q.; Wu, P.; Zhan, X.; Li, X.; Wu, L.; Gu, S. Effects of mining activities on evolution of water chemistry in coal-bearing aquifers in karst region of Midwestern Guizhou, China: Evidences from δ 13 C of dissolved inorganic carbon and δ 34 S of sulfate. Environ. Sci. Pollut. Res. 2018, 25, 18038–18048. [Google Scholar] [CrossRef]
- Li, X.L.; Wang, L.G.; Li, S.W.; Zhang, C.F. Current Status and Prospects of Research on Mine Water Resources Evaluation. J. Saf. Environ. 2010, 10, 106–110. [Google Scholar]
- Maqsoud, A.; Neculita, C.M.; Bussiere, B.; Benzaazoua, M.; Dionne, J. Impact of fresh tailing deposition on the evolution of groundwater hydrogeochemistry at the abandoned Manitou mine site, Quebec, Canada. Environ. Sci. Pollut. Res. 2016, 23, 9054–9072. [Google Scholar] [CrossRef] [PubMed]
- Peng, B.; Li, X.; Zhao, W.; Yang, L. Study on the release characteristics of chlorine in coal gangue under leaching conditions of different pH values. Fuel 2018, 217, 427–433. [Google Scholar] [CrossRef]
- Cañedo-Argüelles, M.; Kefford, B.J.; Piscart, C.; Prat, N.; Schäfer, R.B.; Schulz, C.J. Salinisation of rivers: An urgent ecological issue. Environ. Pollu. 2013, 173, 157–167. [Google Scholar] [CrossRef] [PubMed]
- Yang, D.L.; Li, J.M.; Huang, Y.L.; Song, T.Q.; Guo, H.D.; Qiao, M. Research on Migration Law of Mn in Mudstone Floor in the Goaf under Coupling Conditions of Seepage and Stress. Pol. J. Environ. Stud. 2019, 29, 939–950. [Google Scholar] [CrossRef]
- Hjelmar, O.; Holm, J.; Crillesen, K. Utilisation of mswi bottom ash as sub-base in road construction: First results from a large-scale test site. J. Hazard. Mater. 2007, 139, 471–480. [Google Scholar] [CrossRef] [PubMed]
- Krueger, O.; Kalbe, U.; Berger, W.; Simon, F.G.; Meza, S.L. Leaching experiments on the release of heavy metals and pah from soil and waste materials. J. Hazard. Mater. 2012, 207–208, 51–55. [Google Scholar] [CrossRef]
- Delay, M.; Lager, T.; Schulz, H.D. Comparison of leaching tests to determine and quantify the release of inorganic contaminants in demolition waste. Waste Manag. 2007, 27, 248–255. [Google Scholar] [CrossRef]
- Atanackovic, N.; Dragisic, V.; Zivanovic, V.; Gardijan, S.; Magazinovic, S. Regional-scale screening of groundwater pollution risk induced by historical mining activities in serbia. Environ. Earth Sci. 2016, 75, 1152. [Google Scholar] [CrossRef]
- Huang, B.; Liu, J.; Nan, L.I.; Zhao, X. Framework of the theory and technology for mine closure. J. China Univ. Min. Technol. 2017, 46, 715–729, 747. [Google Scholar]
- Hasheela, I.; Schneider, G.I.C.; Ellmies, R.; Haidula, A.; Leonard, R.; Ndalulilwa, K.; Shigwana, O.; Walmsley, B. Risk assessment methodology for shut-down and abandoned mine sites in Namibia. J. Geochem. Explor. J. Assoc. Explor. Geochem. 2014, 144, 572–580. [Google Scholar] [CrossRef]
- Wang, Y.P. Study on Mechanism and Prevention Technology of Water Inrush from Concealed Structure of Floor in Baizhuang Mine; China University of Mining and Technology: Xuzhou, China, 2019. [Google Scholar]
- Yin, H.Y.; Wei, J.C.; Wang, Y.; Guo, J.B.; Shi, L.Q. Risk evaluation of water inrush from seam floor during mining of lower group in Zhaizhen coal mine. China Min. Mag. 2009, 18, 97–99. [Google Scholar]
- Wang, X.C. Hydrogeological condition analysis of 3 coal seam in Hongqi coal mine. Jiaxiang Shandong Coal Sci. Technol. 2017, 5, 117–119. [Google Scholar]
- Zhang, R.A. Researsh on Prediction of Floor Water Inrush Based on GWO-Elman Neural Network. Master’s Thesis, Shandong University of Science and Technology, Qingdao, China, 2020. [Google Scholar]
- Fan, X.; Wang, C.F.; You, C.Y.; Wei, X.Y.; Chen, L.; Cao, J.P.; Zhao, Y.P.; Zhao, W.; Wang, Y.G.; Lu, J.L. Characterization of a chinese lignite and the corresponding derivatives using direct analysis in real time quadrupole time-of-flight mass spectrometry. R. Soc. Chem. 2016, 6, 105780–105785. [Google Scholar] [CrossRef]
- Li, B. Geochemistry Effkt of Gangue Leaching and Its Potential Risk—Take the Hancheng Coal Area as an Example. Master’s Thesis, Chang’an University, Xi’an, China, 2013. [Google Scholar]
- Yu, J.Q. Introduction to the detection methods of dissolved oxygen in three water bodies. Contemp. Aquat. 2017, 2, 78–79. [Google Scholar]
- Fuoco, I.; Marini, L.; De Rosa, R.; Figoli, A.; Gabriele, B.; Apollaro, C. Use of reaction path modelling to investigate the evolution of water chemistry in shallow to deep crystalline aquifers with a special focus on fluoride. Sci. Total Environ. 2022, 830, 154566. [Google Scholar] [CrossRef] [PubMed]
- Fuoco, I.; De Rosa, R.; Barca, D.; Figoli, A.; Gabriele, B.; Apollaro, C. Arsenic polluted waters: Application of geochemical modelling as a tool to understand the release and fate of the pollutant in crystalline aquifers. J. Environ. Manag. 2022, 301, 113796. [Google Scholar] [CrossRef]
- Fan, R.; Qian, G.; Li, Y.; Short, M.D.; Schumann, R.C.; Chen, M.; Smart, R.S.C.; Gerson, A.R. Evolution of pyrite oxidation from a 10-year kinetic leach study: Implications for secondary mineralisation in acid mine drainage control. Chem. Geol. 2022, 588, 120653. [Google Scholar] [CrossRef]
- Jiang, X.Q. Limestone in Hunnan Area Study on the Treatment Effect and Mechanism of Acid Mine Drainage. Master’s Thesis, Changsha University of Science and Technology, Changsha, China, 2020. [Google Scholar] [CrossRef]


| Serial Number | Sample | Immersion Solutions | Buried Depth (m) | pH | ORP (mV) | TDS (mg/L) | EC (μS/cm) | DO (mg/L) |
|---|---|---|---|---|---|---|---|---|
| FGK1 | Fresh gangue | Baizhuang Ordovician limestone water | 250 | 7.64 | 176.6 | 480.3 | 819.0 | 7.23 |
| FGK2 | Fresh gangue | Zhaizhen Ordovician limestone water | 549.8 | 7.69 | 181.1 | 1251.7 | 1930.3 | 8.00 |
| FGK3 | Fresh gangue | Zhaizhen Ordovician limestone water | 395.07 | 9.57 | 22.1 | 543.7 | 932.3 | 9.11 |
| FGU | Fresh gangue | Ultrapure water | - | 5.83 | 277.2 | 2.9 | 5.48 | 9.22 |
| FGUL | Fresh gangue + limestone | Ultrapure water | - | 5.83 | 277.2 | 2.9 | 5.48 | 9.22 |
| Serial Number | Na+ (μg/L) | K+ (μg/L) | Ca2+ (μg/L) | Mg2+ (μg/L) | Fe3+ (μg/L) | Cl− (mg/L) | SO42− (mg/L) | NO3 (mg/L) |
|---|---|---|---|---|---|---|---|---|
| FGK1 | 50,800 | 1321 | 137,800 | 52,340 | 319.3 | 68.33 | 114.39 | 12.23 |
| FGK2 | 1,000,000 | 16,390 | 217,500 | 69,070 | 713.3 | 82.63 | 1224.58 | 3.46 |
| FGK3 | 1,000,000 | 11,770 | 29,210 | 27,660 | 92.41 | 6.92 | 368.97 | 1.44 |
| FGU | 0 | 0 | 0 | 0 | 0 | 0 | 0 | 0 |
| FGUL | 0 | 0 | 0 | 0 | 0 | 0 | 0 | 0 |
| Chemical Composition (%) | SiO2 | Al2O3 | CaO | MgO | Fe2O3 | K2O | TiO2 | SO3 | Na2O | SrO | MnO |
|---|---|---|---|---|---|---|---|---|---|---|---|
| Initial sample (FO) | 33.359 | 22.872 | 22.557 | 9.576 | 5.632 | 2.719 | 1.964 | 0.655 | 0.454 | 0.127 | 0.084 |
| Post-leached residue of FGK1 | 38.596 | 23.806 | 17.188 | 8.324 | 5.503 | 3.011 | 2.045 | 1.184 | 0.205 | 0.07 | 0.069 |
| Post-leached residue of FGK2 | 31.895 | 20.246 | 27.121 | 9.772 | 5.293 | 2.392 | 1.668 | 1.053 | 0.295 | 0.122 | 0.081 |
| Post-leached residue of FGK3 | 32.421 | 21.727 | 25.102 | 10.171 | 5.084 | 2.552 | 1.708 | 0.785 | 0.256 | 0.113 | 0.082 |
| Post-leached residue of FGU | 31.313 | 19.671 | 28.363 | 9.973 | 5.246 | 2.333 | 1.686 | 0.966 | 0.207 | 0.154 | 0.087 |
| Post-leached residue of FGUL | 35.409 | 22.124 | 22.02 | 9.253 | 5.476 | 2.661 | 1.801 | 0.849 | 0.262 | 0.073 | 0.071 |
Publisher’s Note: MDPI stays neutral with regard to jurisdictional claims in published maps and institutional affiliations. |
© 2022 by the authors. Licensee MDPI, Basel, Switzerland. This article is an open access article distributed under the terms and conditions of the Creative Commons Attribution (CC BY) license (https://creativecommons.org/licenses/by/4.0/).
Share and Cite
Jiang, B.-b.; Ji, K.-m.; Xu, D.-j.; Cao, Z.-g.; Wen, S.-k.; Song, K.; Ma, L. Effects of Coal Gangue on the Hydrochemical Components under Different Types of Site Karst Water in Closed Mines. Water 2022, 14, 3110. https://doi.org/10.3390/w14193110
Jiang B-b, Ji K-m, Xu D-j, Cao Z-g, Wen S-k, Song K, Ma L. Effects of Coal Gangue on the Hydrochemical Components under Different Types of Site Karst Water in Closed Mines. Water. 2022; 14(19):3110. https://doi.org/10.3390/w14193110
Chicago/Turabian StyleJiang, Bin-bin, Kai-ming Ji, Dong-jing Xu, Zhi-guo Cao, Shao-kun Wen, Kun Song, and Li Ma. 2022. "Effects of Coal Gangue on the Hydrochemical Components under Different Types of Site Karst Water in Closed Mines" Water 14, no. 19: 3110. https://doi.org/10.3390/w14193110