
Research on Fine Ship Sewage Generation Inventory Based on AIS Data and Its Application in the Yangtze River
1
Base for International Science & Technology Cooperation on Waterborne Transport Pollution Prevention and Major Accident Emergency Response, China Waterborne Transport Research Institute, Beijing 100088, China
2
Environmental Protection Center of the Ministry of Transport, Beijing 100013, China
*
Author to whom correspondence should be addressed.
Water 2022, 14(19), 3109; https://doi.org/10.3390/w14193109
Submission received: 22 August 2022
/
Revised: 22 September 2022
/
Accepted: 27 September 2022
/
Published: 2 October 2022
(This article belongs to the Special Issue Sustainable Development of Inland Waterways)
Abstract
:Inland waterway transport is an essential element of integrated transport systems, and the inland waterway freight volume accounts for about 50% of the total waterway freight volume in China. During the navigation, anchoring, and operation of ships, various water pollutants are generated, and the pollution generated by sewage is receiving more and more attraction. To prevent and control pollution from ships, it is important to estimate the amount of sewage and pollutants involved. In this study, the data preparation process is established to generate the Degree of Ship Activity (DSA) data pool after cleaning and thinning the massive original Automatic identification System (AIS) data, and then the data fusion method of a fine GIS grid is established to integrate the DSA data into each grid. The total DSA in the lower reaches of the Yangtze River is 37.14 million h/a. The sewage and pollutant generation inventories for the lower reaches of Yangtze River are estimated and analyzed spatiotemporally. It is estimated that the generations of sewage are 1,768,600 t/a in total. After spatial analysis, it is revealed that the water areas with a relatively large amount of pollutant generation are mainly related to ports distributed along the channel and the DSA density. Finally, based on the spatial distribution characteristics of the estimated inventories, the countermeasures of “zero discharge” for inland ships, the receiving facility system improving, and prevention and control at the river basin level are proposed.
1. Introduction
Waterway transportation is a basic industry supporting national economic and social development, effectively ensuring the coordinated development of the national economy, foreign trade, and regional economy. Nevertheless, during the navigation, anchoring, and operation of the ships, various water pollutants are produced, including sewage (black water), grey water, ship garbage, oily bilge water, oily water containing oil cargo residues, oil residues, and waste water containing noxious liquid substances, due to the operation of the marine power system, the crew living on board, and the cargo operation. Compared with stationary pollution sources and land vehicle mobile pollution sources, ship mobile pollution sources have their particularities, as follows: (1) a wide navigation range, typically across large scale regions; (2) various pollutants produced by each single ship; (3) ship type diversification and large tonnage variation range, and great differences in the generation and level of pollutants per ship; (4) pollutants discharged from ships directly entering the water, which are more likely to attract attention; and (5) in most navigation waters, the pollutants produced by ships are difficult to treat with shore-based methods, and are only treated on board and then discharged according to standard, or are temporarily stored on the ship.
In order to alleviate the marine pollution caused by pollutants discharged during ship operations, the International Convention for the Prevention of Pollution from Ships (MARPOL) has been formulated by the International Maritime Organization. China formulated and implemented the Effluent Standard for Pollutants from Ships (GB 3552-83) in 1983, which stipulates the maximum allowable discharge concentration of oily water and sewage, as well as garbage discharge, regulations. The latest version of the standard, the Discharge Standard for Water Pollutants from Ships (GB 3552-2018) [1], specifies the requirements for the discharge control of oily water, sewage, waste water containing noxious liquid substances and ship garbage from ships to environmental water bodies, as well as the requirements for the implementation and supervision of the standard. In inland navigable waters, ship sewage should be discharged after being treated by ship-borne sewage treatment facilities that are in line with the standard, or should be discharged into receiving facilities after being temporarily stored on board.
Inland waterway transport is an essential element of integrated transport systems. Compared with other transport modes, inland waterway transport is characterized by a high transport volume, low energy consumption, and low environmental impact [2]. In 2021, China’s waterway freight volume accounted for 15.8% of the total commercial freight volume [3]. Among the 8.24 billion tons of waterway freight volume, the inland waterway freight volume accounts for about 50%. There are 113,600 inland ships sailing in navigable inland waters in China, and ships have become one of the most significant pollution sources of inland rivers. Among all kinds of ship water pollutants, domestic sewage generated by personnel on board is of great concern, especially the generation and spatial distribution thereof.
Currently, plenty of research is focused on the establishment of ship air pollution emission inventory [4,5,6,7]. In the research of establish methods for a ship pollutant discharge inventory, this can be divided into methods suitable for ship exhaust pollutants and ship water pollutants. The establish methods for ship exhaust pollutant discharge are relatively mature. According to the sources and types of basic data, the calculation methods can be divided into trade methods based on cargo turnover and cargo type, fuel methods based on fuel consumption statistics and discharge factors, statistical methods based on ship inbound and outbound data and engine power, and dynamic methods based on ship dynamic operations and engine discharge factors under different working conditions [8]. The emergence of the ship automatic identification system (AIS) provides a more accurate data basis for the dynamic method [9]. At present, there are many studies on the calculation of inland ship exhaust discharge inventory based on AIS data using dynamic methods, such as studies on the discharge inventory of the Yangtze River Estuary waters [10], the Pearl River Delta waters [11], and Guangzhou [12].
However, research that quantifies the sewage generated by ships is relatively less [13]. The established method for ship water pollutant generation or the discharge inventory mainly adopted the empirical formula method, considering the statistical reporting data of ships entering and leaving the port, port throughput, pollution generation, or discharge coefficient, and so on. The empirical formula method is applicable to the calculation of the demand for the onshore receiving capacity construction of pollutants from ships arriving at the port, and is not applicable for establishing an inventory in a large water area. In this study, AIS archived data are used for the hourly analysis, covering the situation of all active ships within the study water area, and the empirical pollution generation coefficient is used to estimate the pollution generation, which can effectively solve the problems existing in the empirical formula method, and furthermore provide mathematical models for establishing a dynamic and real-time ship water pollution monitoring platform. At present, few scholars have studied the amount of ship wastewater generated in the Shenzhen sea area based on AIS [14], and there are few quantitative studies of inland ship sewage generation based on AIS [15].
This study focuses on the inventory establishment method of sewage generation, and takes the lower reaches of the Yangtze River as an example for the case study. Using the AIS archived data of the year 2020, the data preprocessing process from data cleaning, degree of ship activity, grid matching, etc., are established, the estimation model of ship pollutant generation inventory is established, and the spatial distribution of the ship sewage pollutant generation is analyzed using GIS. Finally, based on these results, regional and ship shore coordinated pollution control measures are proposed.
2. Materials and Methods
2.1. Study Area
As the largest river flowing across East and West China, the Yangtze River, known as the “golden waterway”, has been the main channel of commercial trade and the traffic connecting East and West China since ancient times. The throughput of inland ports on the trunk line of the Yangtze River accounts for more than 60% of the throughput of inland ports in China, and shows an increasing trend year by year. In 2020, the cargo throughput of the Yangtze River trunk line exceeded 3 billion tons, and the average tonnage of cargo ships reached 1960 t [16]. With the shipping development of China’s golden waterway, the Yangtze River shipping will upgrade and undergo rapid development in the near future. The contradiction between shipping development and water environment protection has attracted more attention. Therefore, it is necessary to calculate the amount of ship water pollutants and to analyze their spatial distribution, so as to provide decision-making support for the ship and shore in order to ensure coordinated pollution prevention and control countermeasures.
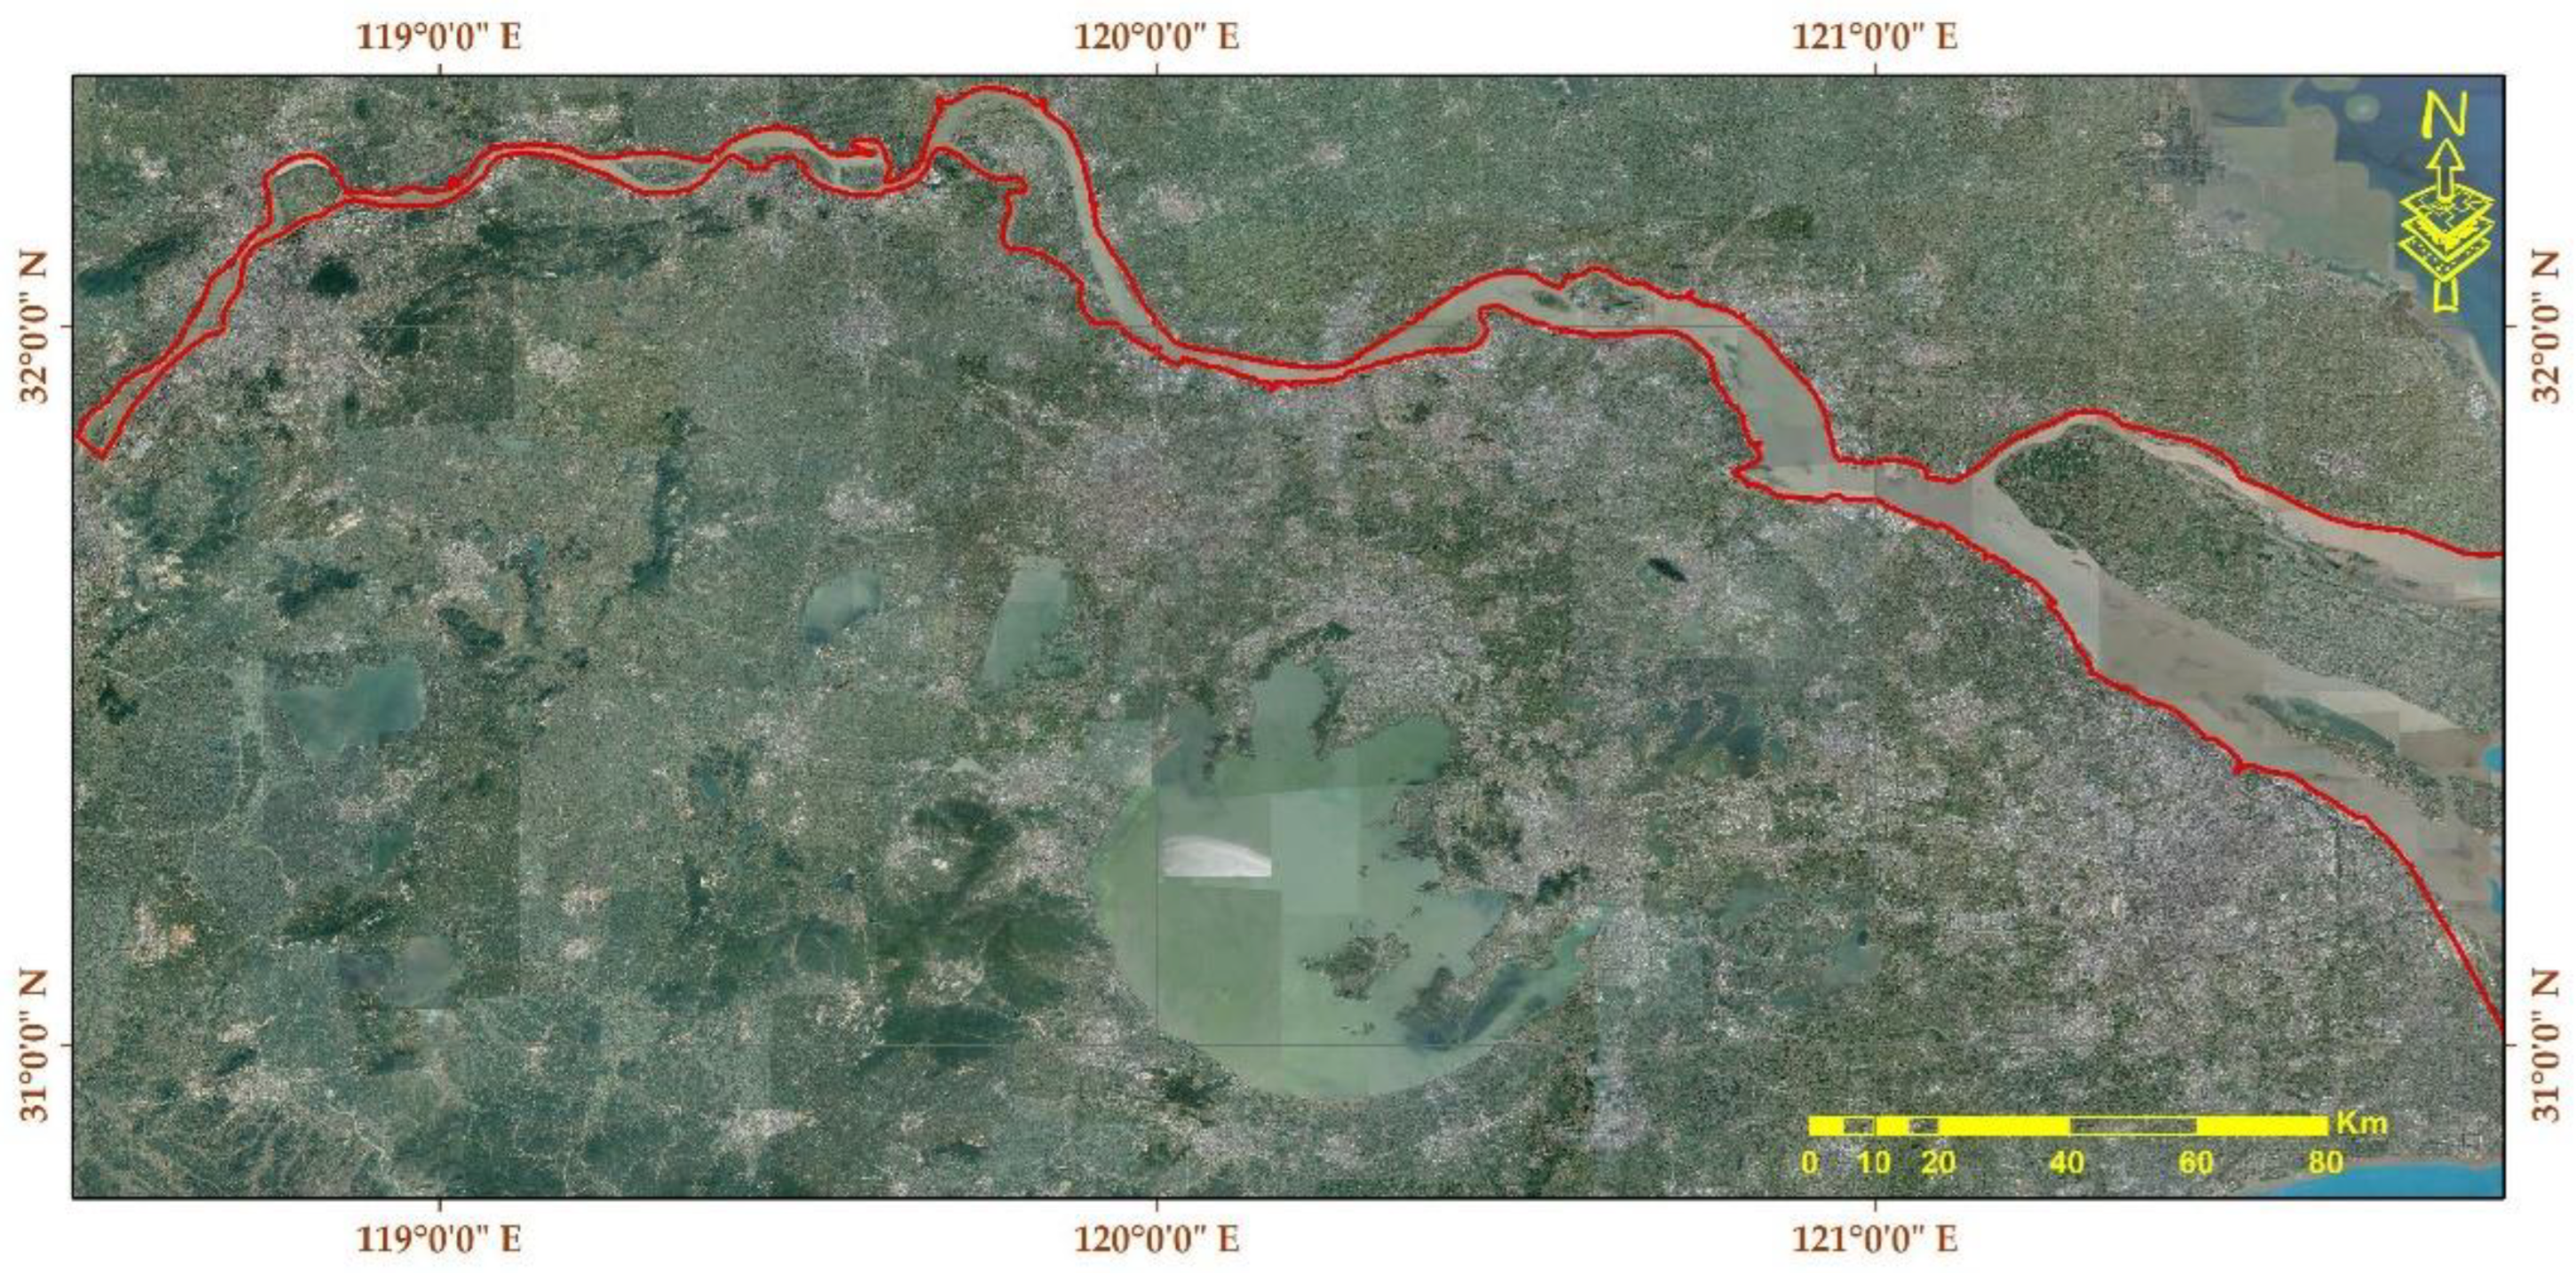
As shown in Figure 1, the study area in this research focuses on the lower reaches of the Yangtze River, from Nanjing to the estuary. The scale of the study area is 320 km × 170 km, and the Yangtze River section is about 395 km long. At present, the deep-water channel along the Yangtze River below Nanjing is fully connected to the coast waters; 50,000-ton seagoing ships can reach Nanjing port directly and 100,000-ton seagoing ships can also arrive with a reduced load. This section of the Yangtze River has become the most important and is the fastest-growing water area for shipping in the Yangtze River Basin, and has resulted in an increased risk of ship pollution. So, the geographical scope of the study includes the lower reaches of the Yangtze River, from Nanjing to the estuary.
2.2. Research Data
The research data used in this study are ship automatic identification system (AIS) data, and the time length of the AIS data obtained was from 1 January 2020 to 31 December 2020. AIS consists of shore base facilities and shipborne equipment. AIS accompanied by GPS can provide ship’s static data, such as the ship name, call sign, MMSI code, ship type, and ship length and breadth, as well as the ship dynamic data such as ship position (longitude and latitude), ship heading, track and speed. According to the requirements of the International Convention for the Safety of Life at Sea (SOLAS) and the domestic ship inspection technical rules, most commercial ships are equipped with AIS equipment at present, and ship AIS data have entered the big data era. The applications of AIS in scientific research mainly focus on the big data analysis of the shipping information [17], traffic routes [18], logistics organization optimization [19], traffic accident analysis and early warning [20], preparation of ship exhaust pollutant discharge inventory [21], and oil spill risk assessment [22,23], others. In terms of the integrity of AIS data, there is a problem of information incompleteness due to the abnormal startup of AIS, antenna failures, AIS information setting errors, equipment failures, crew mis-operation, and other various reasons. For example, the missing rate of AIS data in the Jiangsu section of the Yangtze River is about 30% [24].
In the autonomous working mode of the ship AIS equipment, AIS data automatically broadcast messages at different time intervals. Among them, the broadcasting interval of the ship motion status message is generally from 2 s to 3 min, a static message will be broadcast every 6 min or as required, and a short AIS message will be broadcast as required. Therefore, in busy shipping waters, a huge amount of AIS messages could be received every hour. If AIS archived data were analyzed item by item, it would consume a lot of computer operation time. Therefore, this study preprocesses the original AIS archived data in order to obtain the degree of ship activity (DSA) data pool [25], so as to improve the efficiency of the subsequent calculations and analyses. DSA refers to the duration of time, calculated per hour for the number of active ships within a certain period and a certain water area. Specifically, it is based on the broadcasting time field of the original AIS archived data. No matter how many messages the ship broadcasts within 1 h, it is calculated by 1 h DSA. The DSA of a single ship in a certain water area or the DSA of all ships in a certain water area can be calculated as needed.
2.3. Procedure of the Establishment of the Inventory
The overall steps for the establishment of the inventory can be divided into data preparation and inventory estimation, as shown in Figure 2.
2.4. Data Preparation
In the stage of data preparation, the first step is data cleaning, by deleting invalid, irrelevant, redundant, and wrong data in the original AIS data, and then generating a clean AIS database. The second step is DSA calculation, further processing the cleaned data into DSA and generating the DSA data pool. The water–land boundary of study area should be defined in this step, and then the study area is divided into grids according to the needs of research accuracy. Finally, the DSA data pool of each grid is created. Compared with the direct calculation using original AIS archived data, the calculation process of this study can reduce the computer operation time by more than 95%.
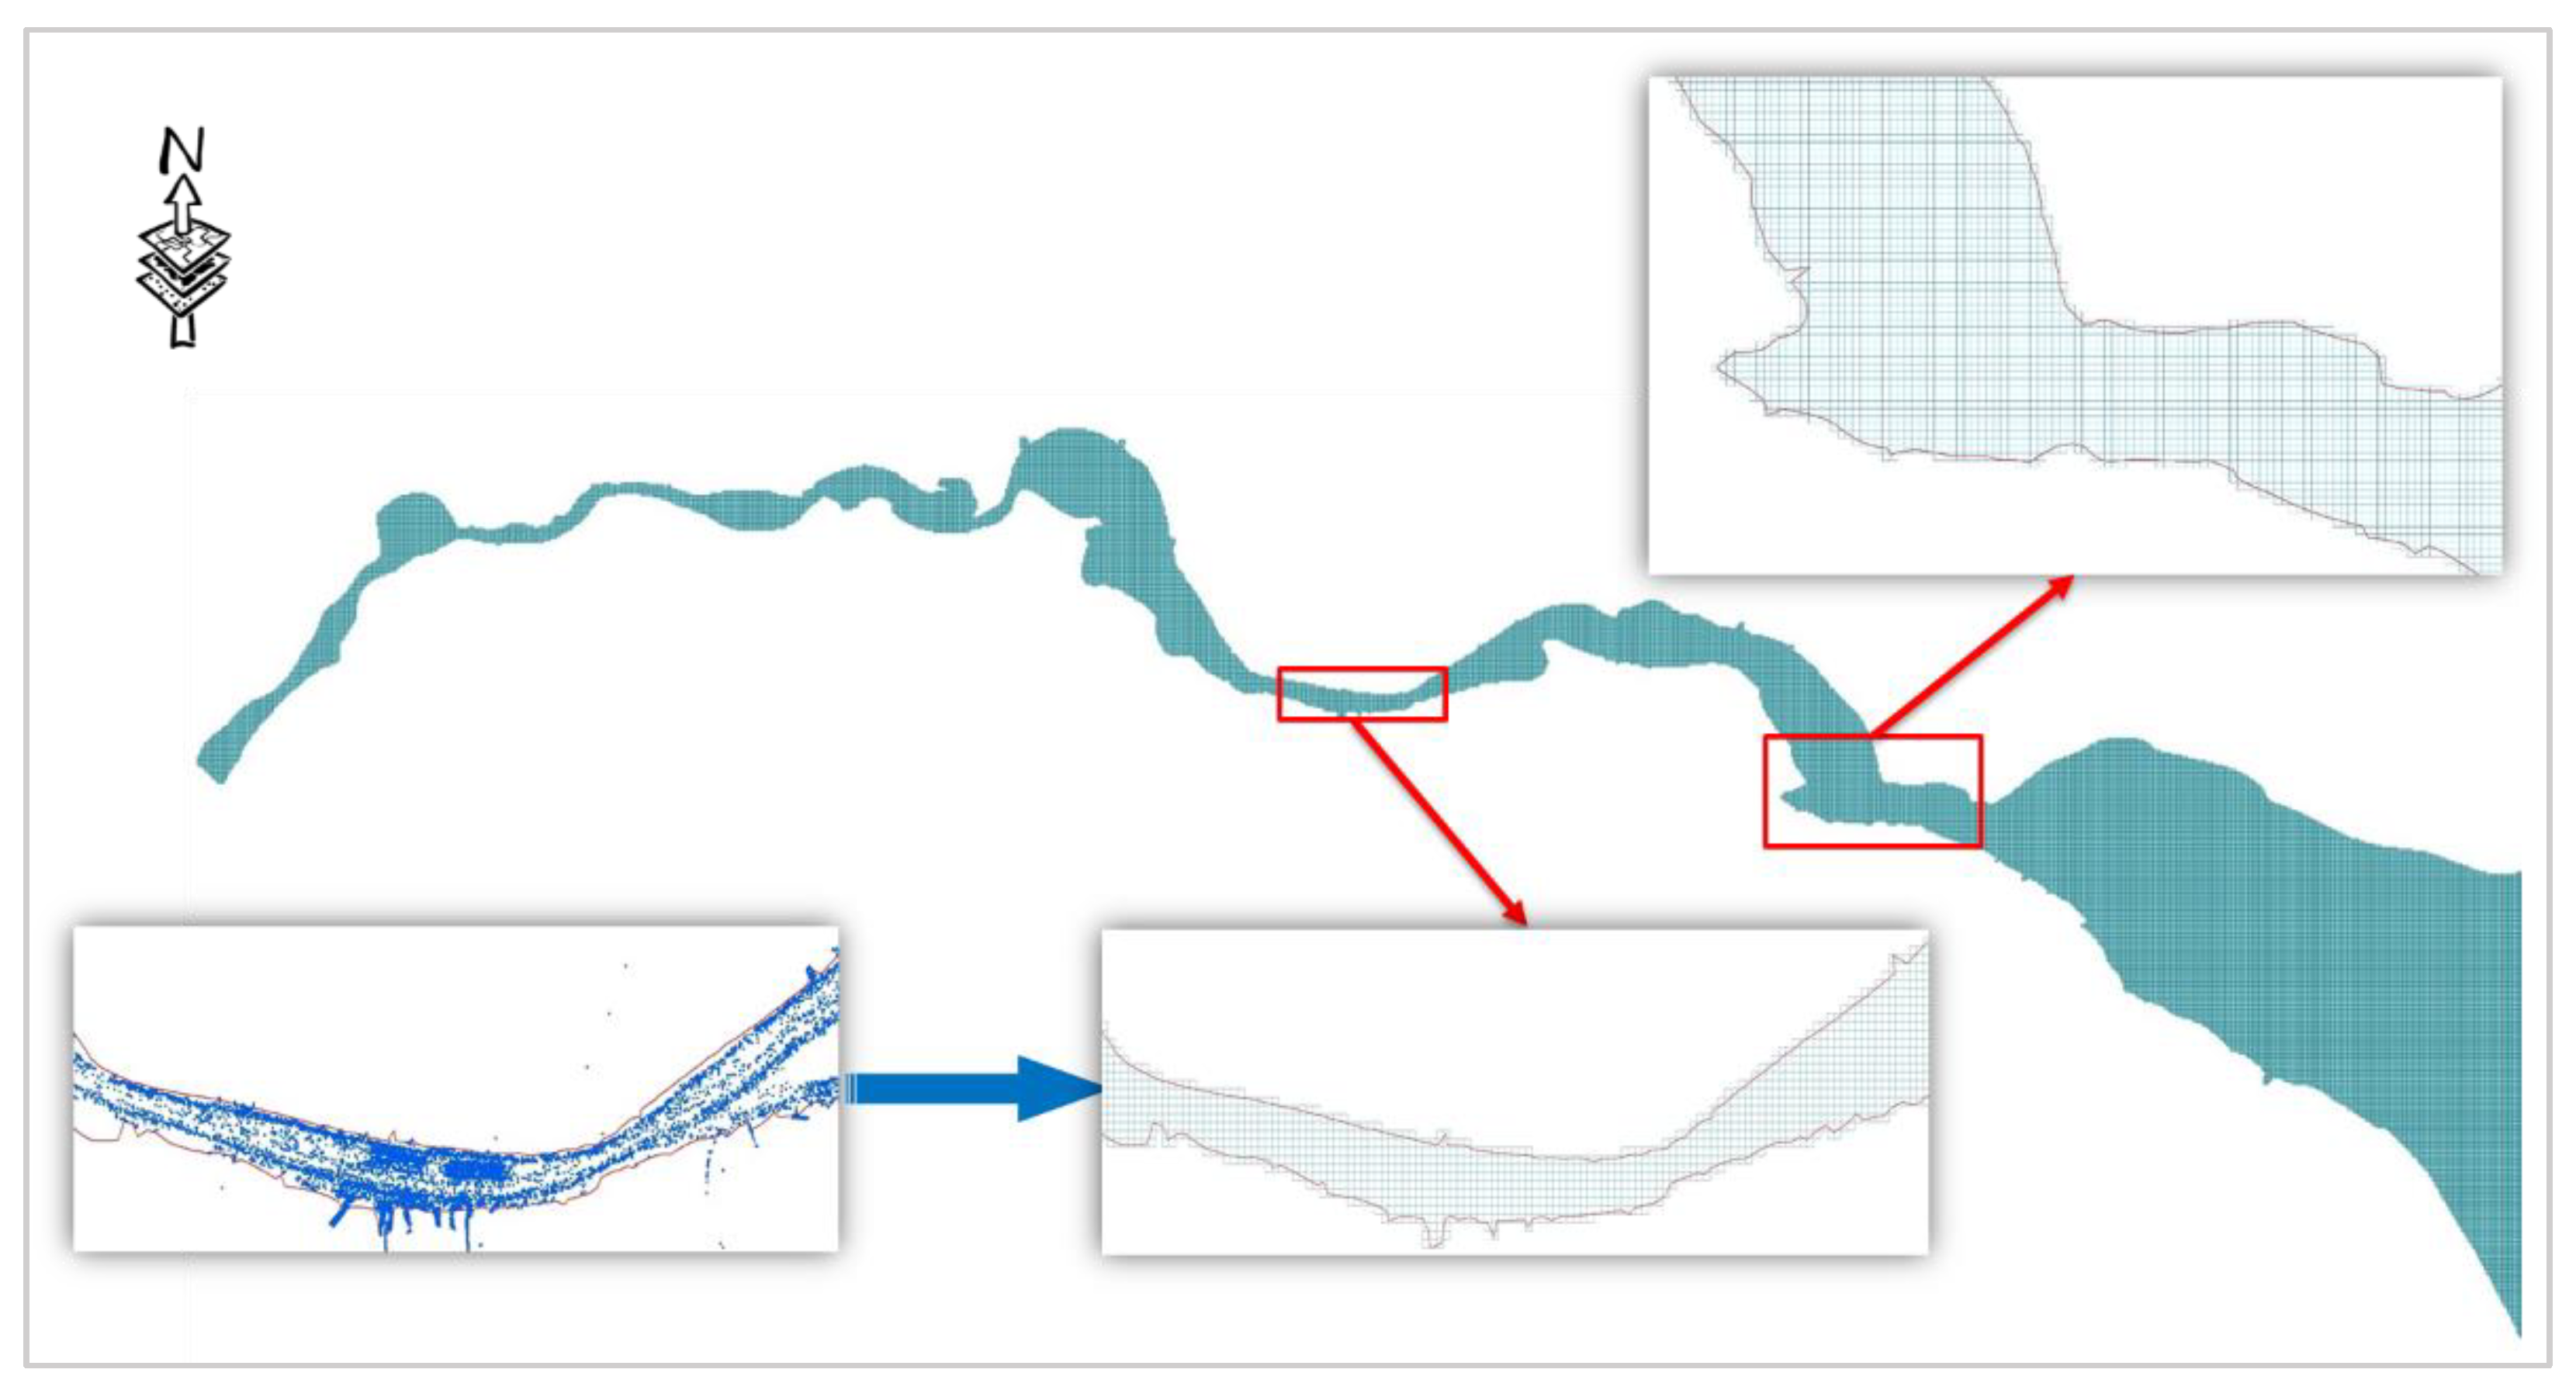
The archived ship AIS data from January to December 2020 are collected to process and obtain the DSA data pool. The water area in the lower reaches of the Yangtze River is about 395 km long and about 1 km to 15 km wide. During the process of mesh generation, the study considers both the fineness of results and the computational efficiency. The grid resolution must fit the channel distribution and different water area widths. Finally, the water area is divided into 53,067 grids, and the east–west and north–south lengths of each grid are about 330 m, as shown in Figure 3.
2.5. Inventory Estimation
In the stage of inventory estimation, the estimation model is first established. Then, the DSA data of the different water areas and time periods, the number of crew onboard, the pollution coefficient, and the concentration of pollutants are input into the model to estimate the inventory. Using the geographic information system, the spatiotemporal analysis of the inventory is conducted. Finally, the countermeasures are proposed according to the regional distribution and pollution characteristics.
This study mainly uses AIS archived data to calculate the generation of pollutants, which are applicable to sewage (black water), for instance. The study water area is divided into many rectangular grids, and DSA and other parameters in each rectangular grid are calculated individually to summarize and obtain the total generation of the ship water pollutants Pj within the study water area, as shown in the following equation.
where Pj is the total generation of a certain type of water pollutant, t/d; Di is the DSA of grid i on a certain day, h/d; ri is the average number of crew onboard per ship of grid i, crew number/per ship; qj is the pollution generation coefficient, t/person per day; k is the miss rate of the AIS data, %; Cj is the concentration of pollutants in the sewage, mg/L; i is the rectangular grid number, from 1 to n; and j is the type of pollutants, including COD, BOD, SS, TN, NH3-N, TP, etc.
The amount of sewage produced from the ships depends on the number of crew members and the onboard time. The onboard time of crew members on the ship is characterized by DSA, and the number of crew members can be determined according to the minimum staffing requirements of the ship. The generation of sewage from ships should be calculated according to 50 L/(per person, per day) [26] of gravity black water.
The discharge standard limits of pollutants in the ship sewage involve up to nine indexes, including chemical oxygen demand (CODCr), five-day biochemical oxygen demand (BOD5), suspended solids (SS), total nitrogen (TN), ammonia nitrogen (NH3-N), total phosphorus (TP), pH value, number of thermotolerant coliforms, and total chlorine (total residual chlorine). This study mainly estimates the generation of three conventional indexes (CODCr, BOD5, and SS) and three nutritive salt indexes (TN, NH3-N, and TP). Based on the inspection of the ship domestic sewage at home and abroad, CODCr, BOD5, SS, TN, NH3-N, and TP in the raw domestic sewage are valued at 1140 mg/L, 526 mg/L, 545 mg/L, 111 mg/L, 78.6 mg/L, and 18.1 mg/L respectively [27], see Table 1.
3. Results
3.1. Data Pool of DSA
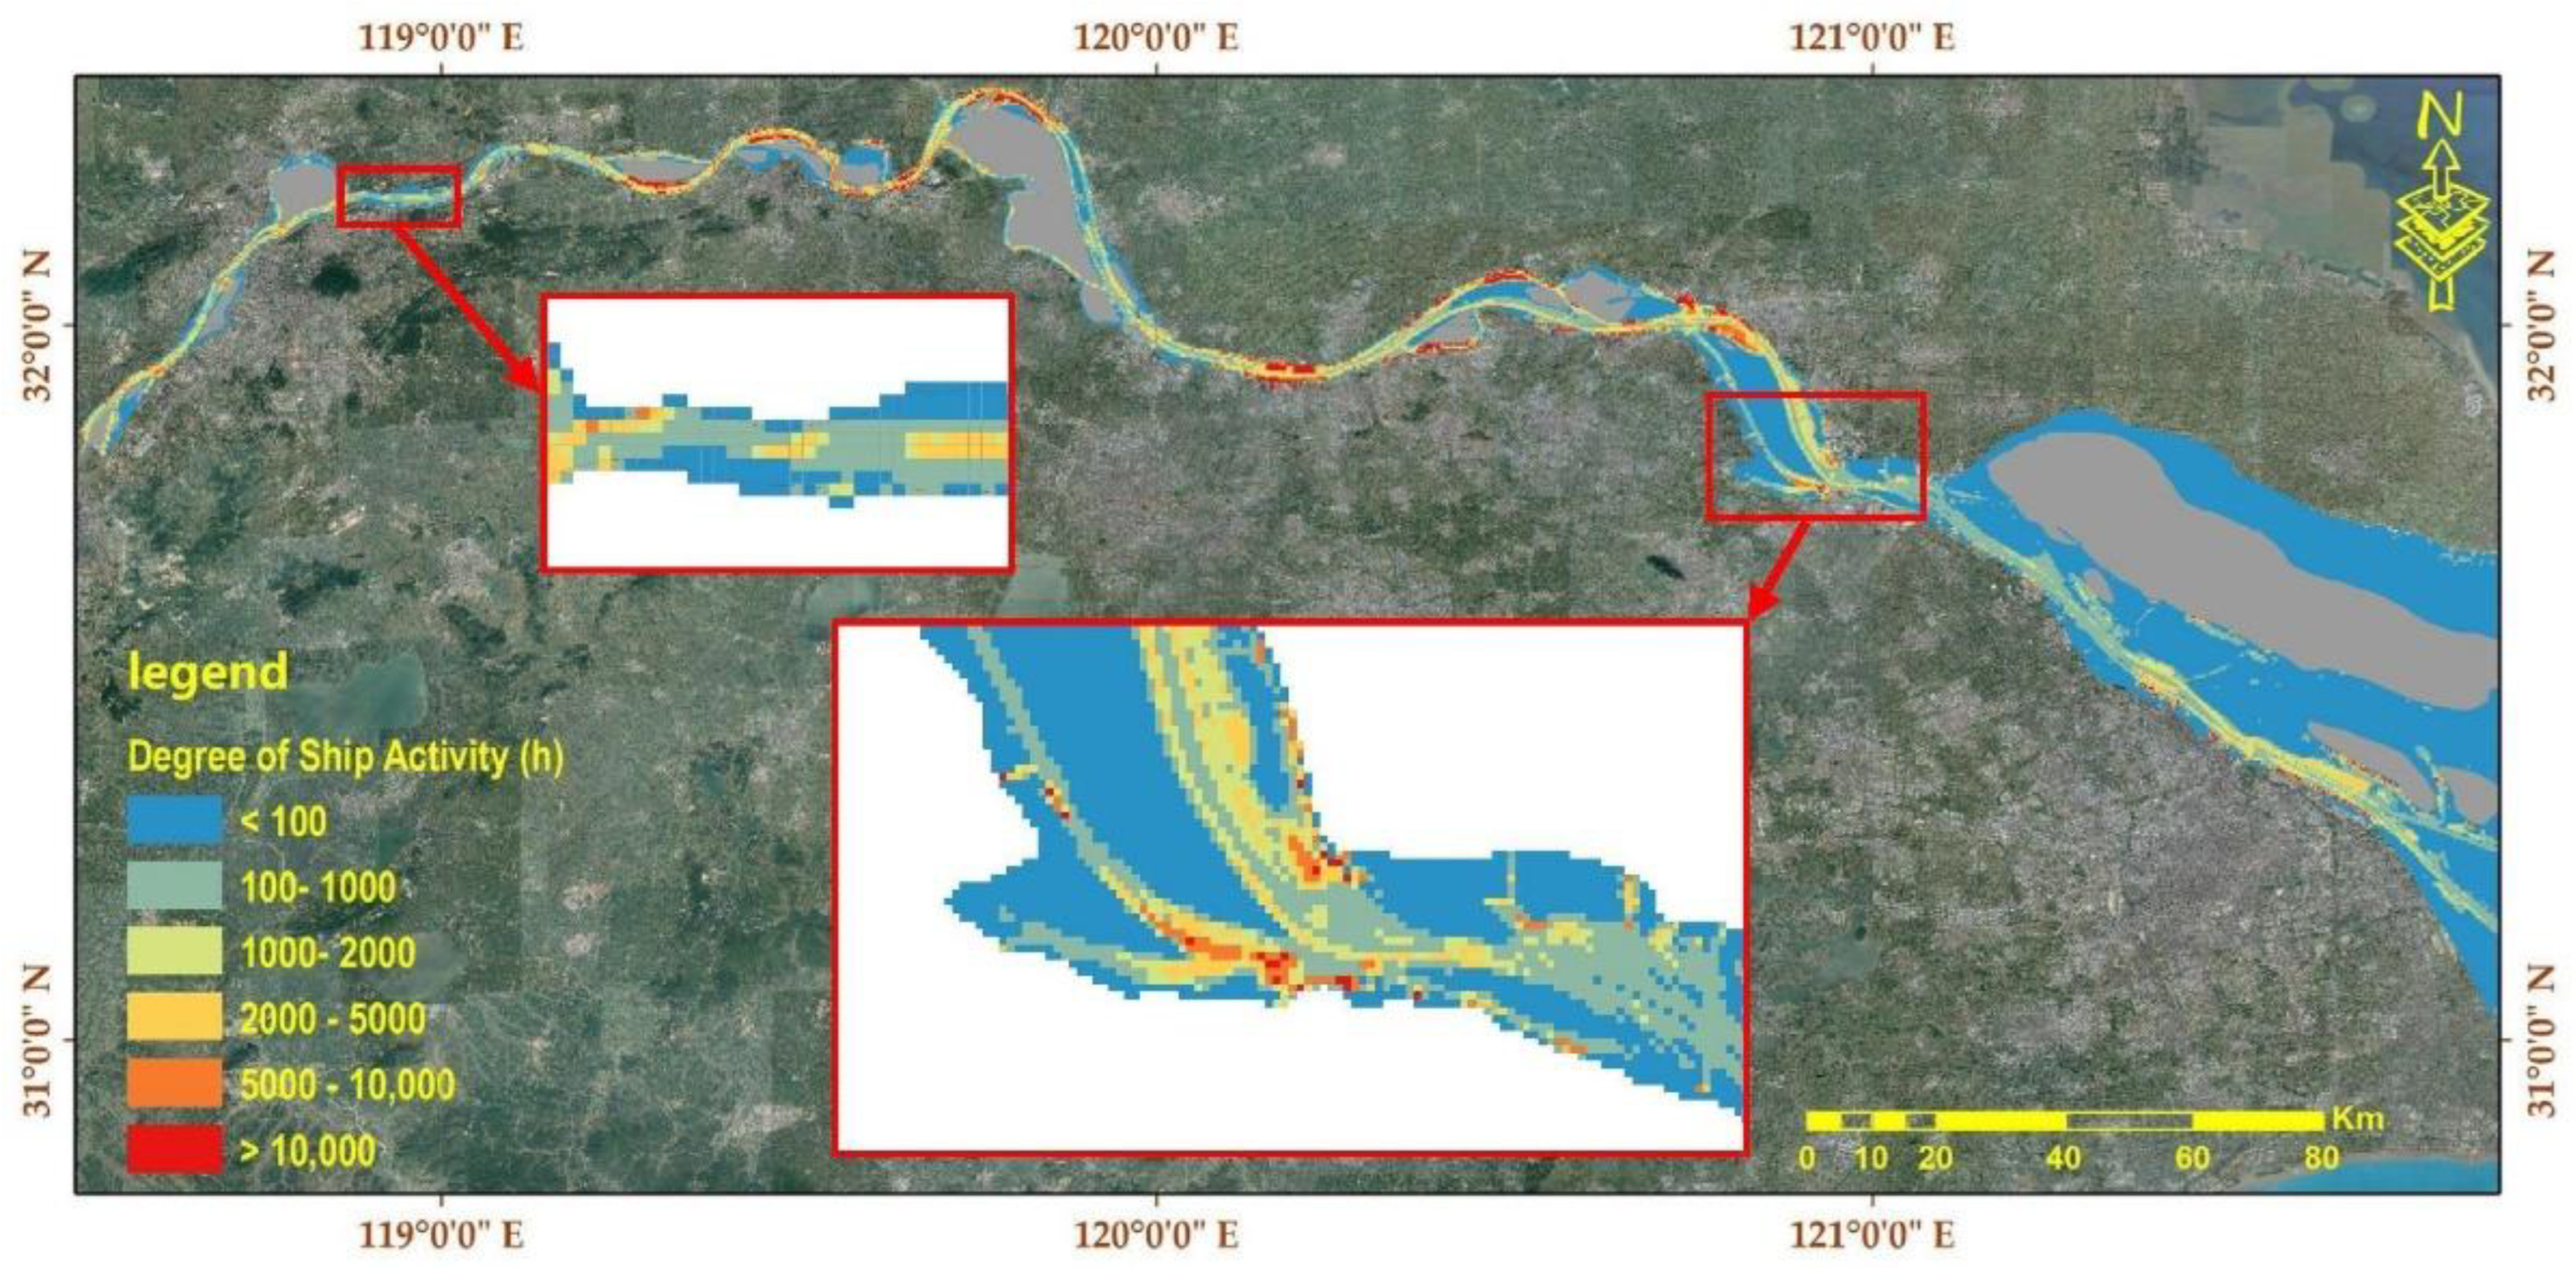
It was calculated that the DSA in the lower reaches of the Yangtze River within the study scope is 37.14 million hours/year, and the case of missing data is not considered in the figure. The areas with dense ships are mainly concentrated in the main channels in and out of the port and the berth waters where ships stop. There are 1747 grids with DSA exceeding 5000 h/a, about 3% of the total amount, and 6845 grids with DSA at 100–1000 h/a, exceeding 12% of the total amount. The DSA density in the lower reaches of the Yangtze River is shown in Figure 4.
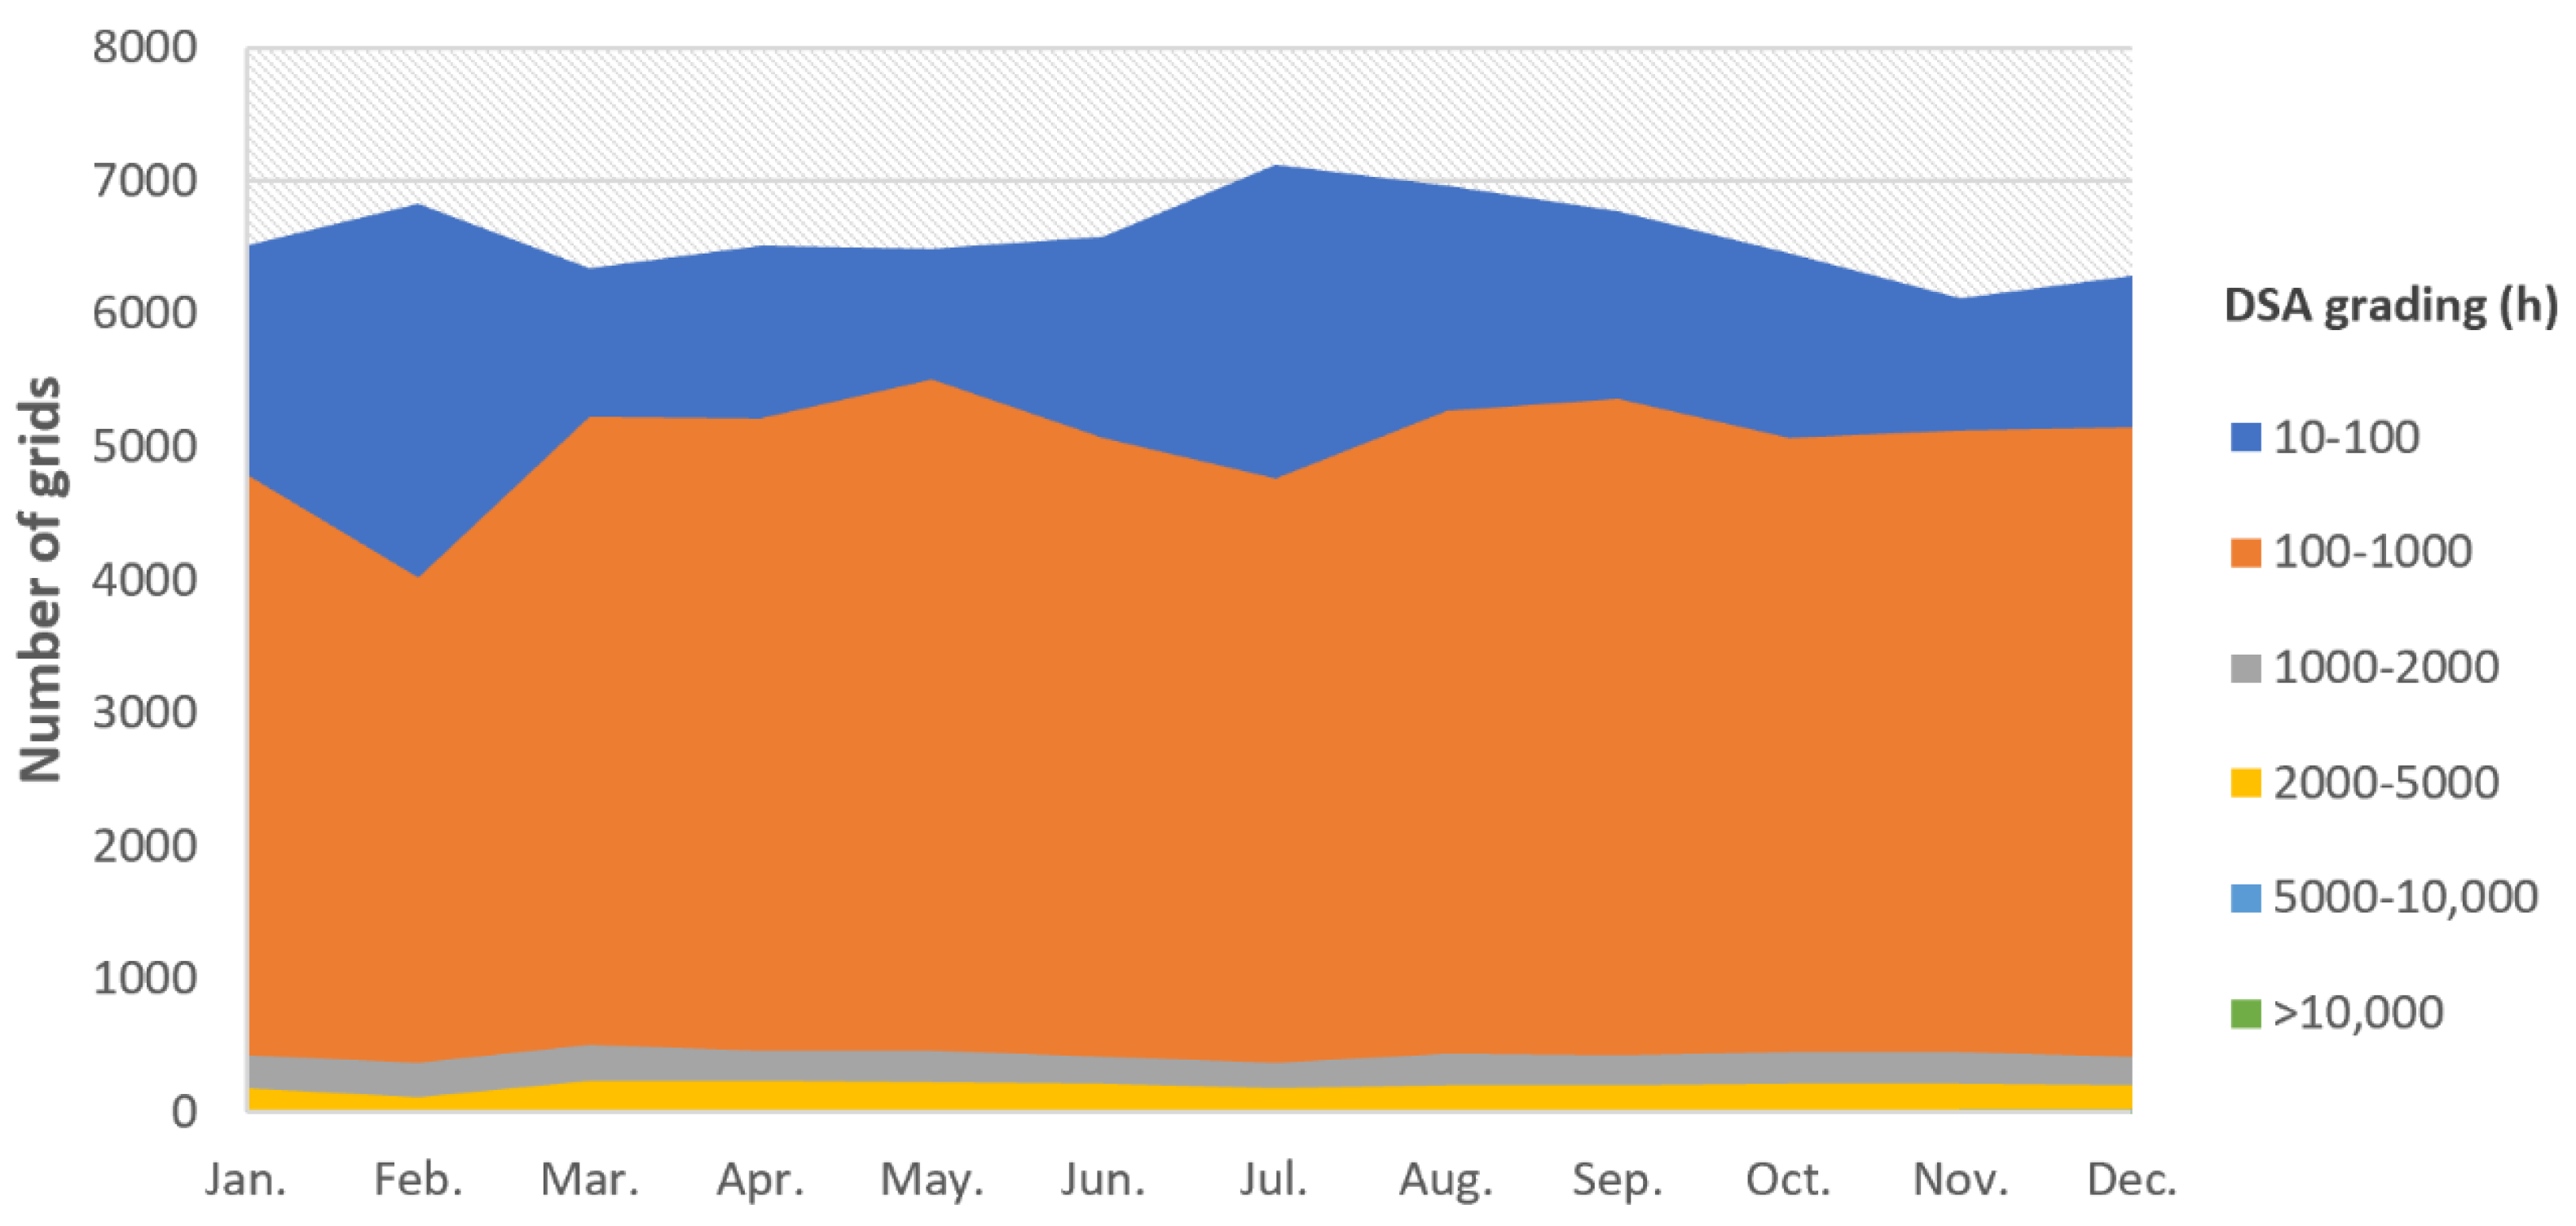
As for the monthly change of DSA in the lower reaches of the Yangtze River, the results fluctuate to a certain extent, as shown in Figure 5. For DSA below 100 h, the monthly change is not obvious. For DSA of 100 to 5000 h, it is relatively high in March, April, and May in spring, and August, September, and October in autumn. DSA of more than 10,000 h is rare for each month. According to the monthly distribution of DSAs in different grades, the monthly changes show a consistent trend.
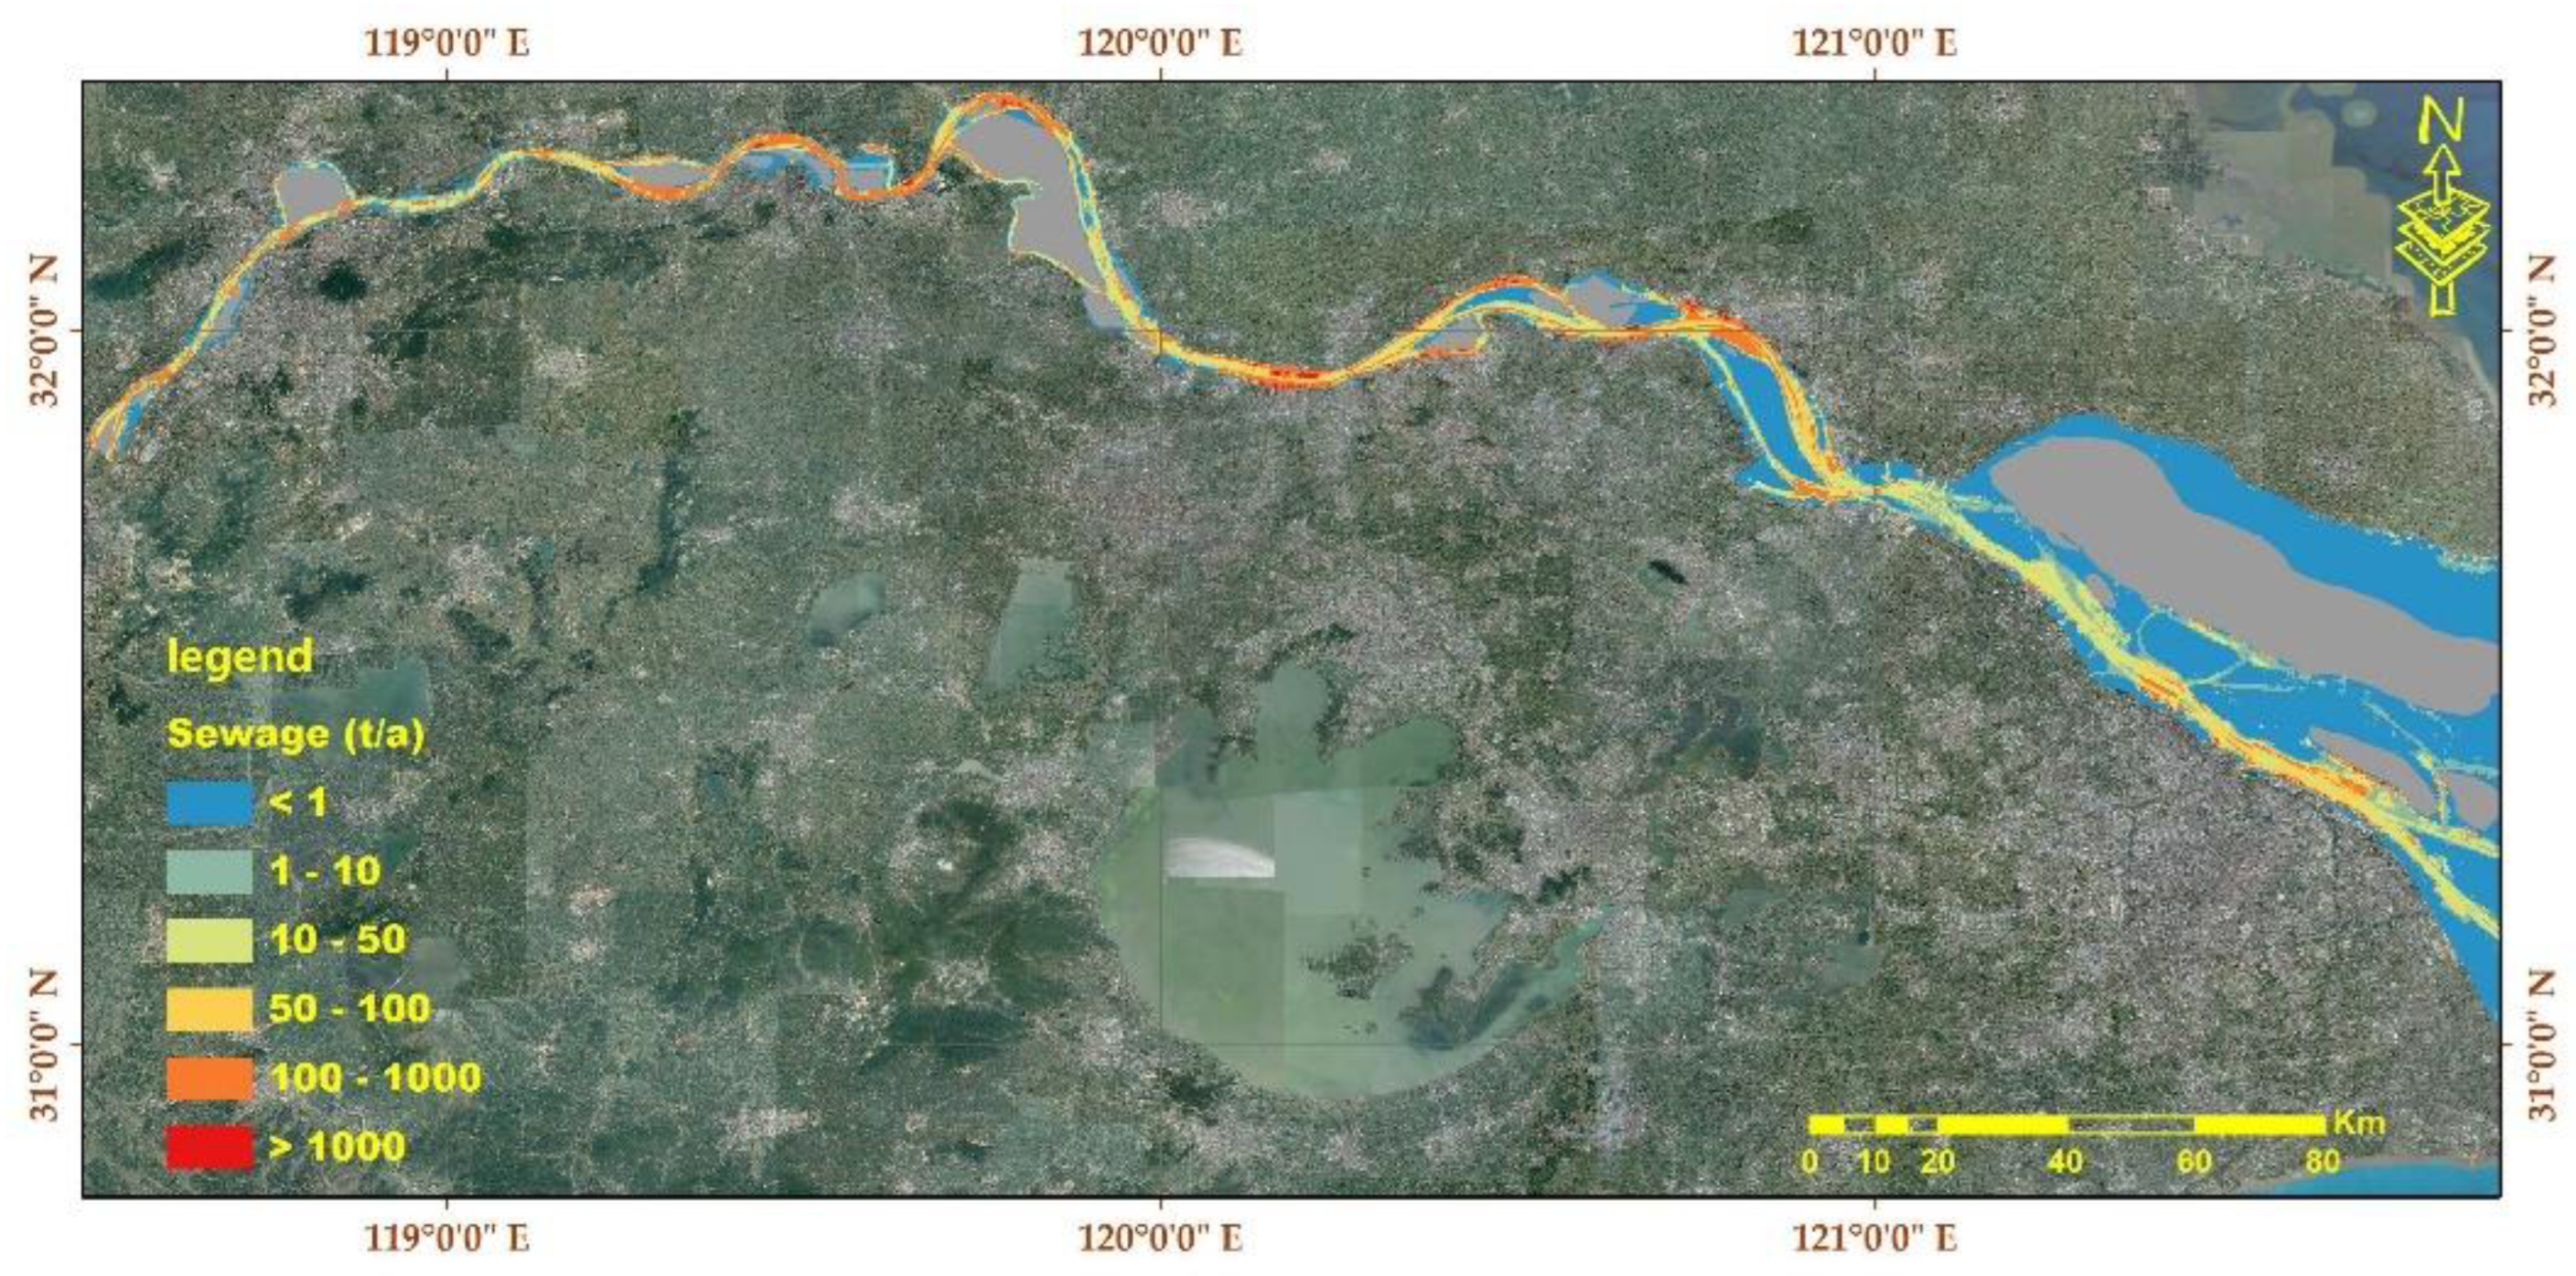
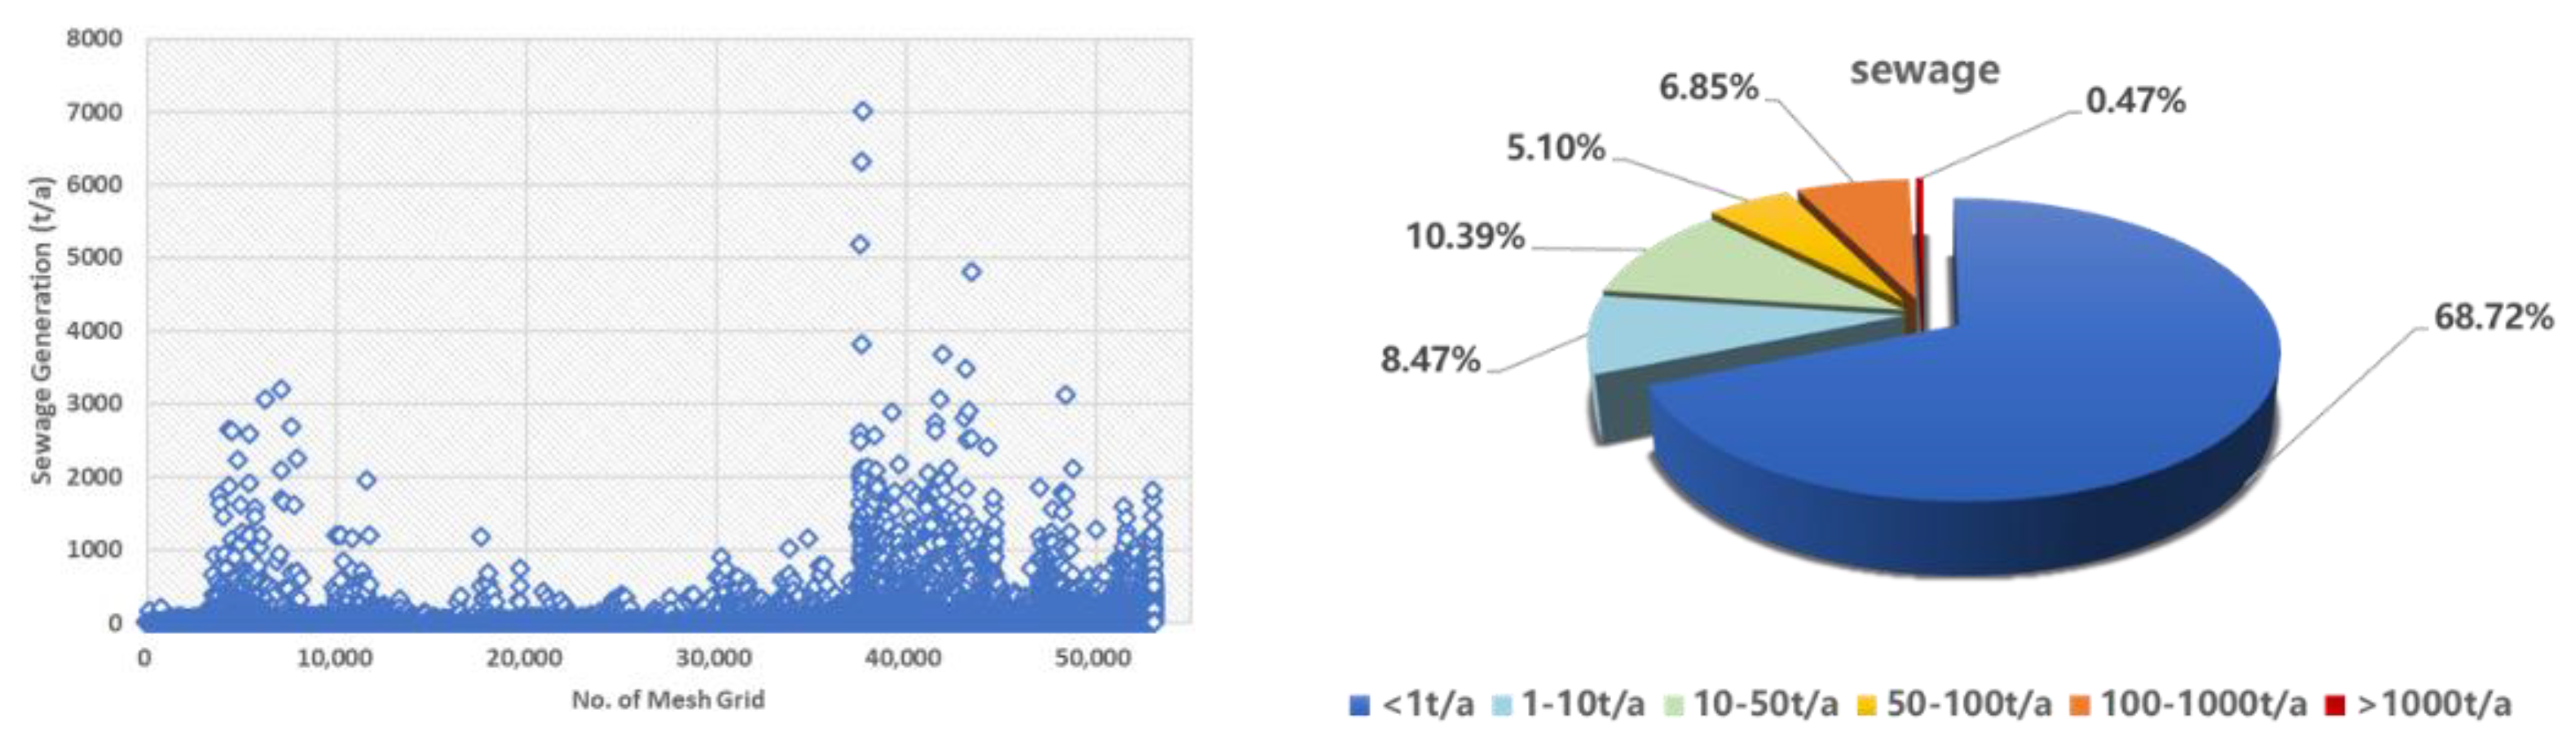
3.2. Generation of Sewage
Based on the DSA, the generation of sewage is 1,768,600 t/a in total. For the annual generations of ship sewage, see Figure 6 and Figure 7. From the calculation results of each grid, we can see that the distribution law of pollutant generation is basically consistent with that of the DSA. There are 12,715 and 12,556 grids with sewage generations within the range of 1–100 t, and 3882 and 4216 grids with more than 100 t. According to the generation classification diagram (see Figure 7), about 68% of the waters are less than 1 t/a. In the range of 1 to 10 t/a, 10 to 50 t/a, 50 to 100 t/a, and 100–1000 t/a, the sewage generation accounts for 5 to 10%, respectively.
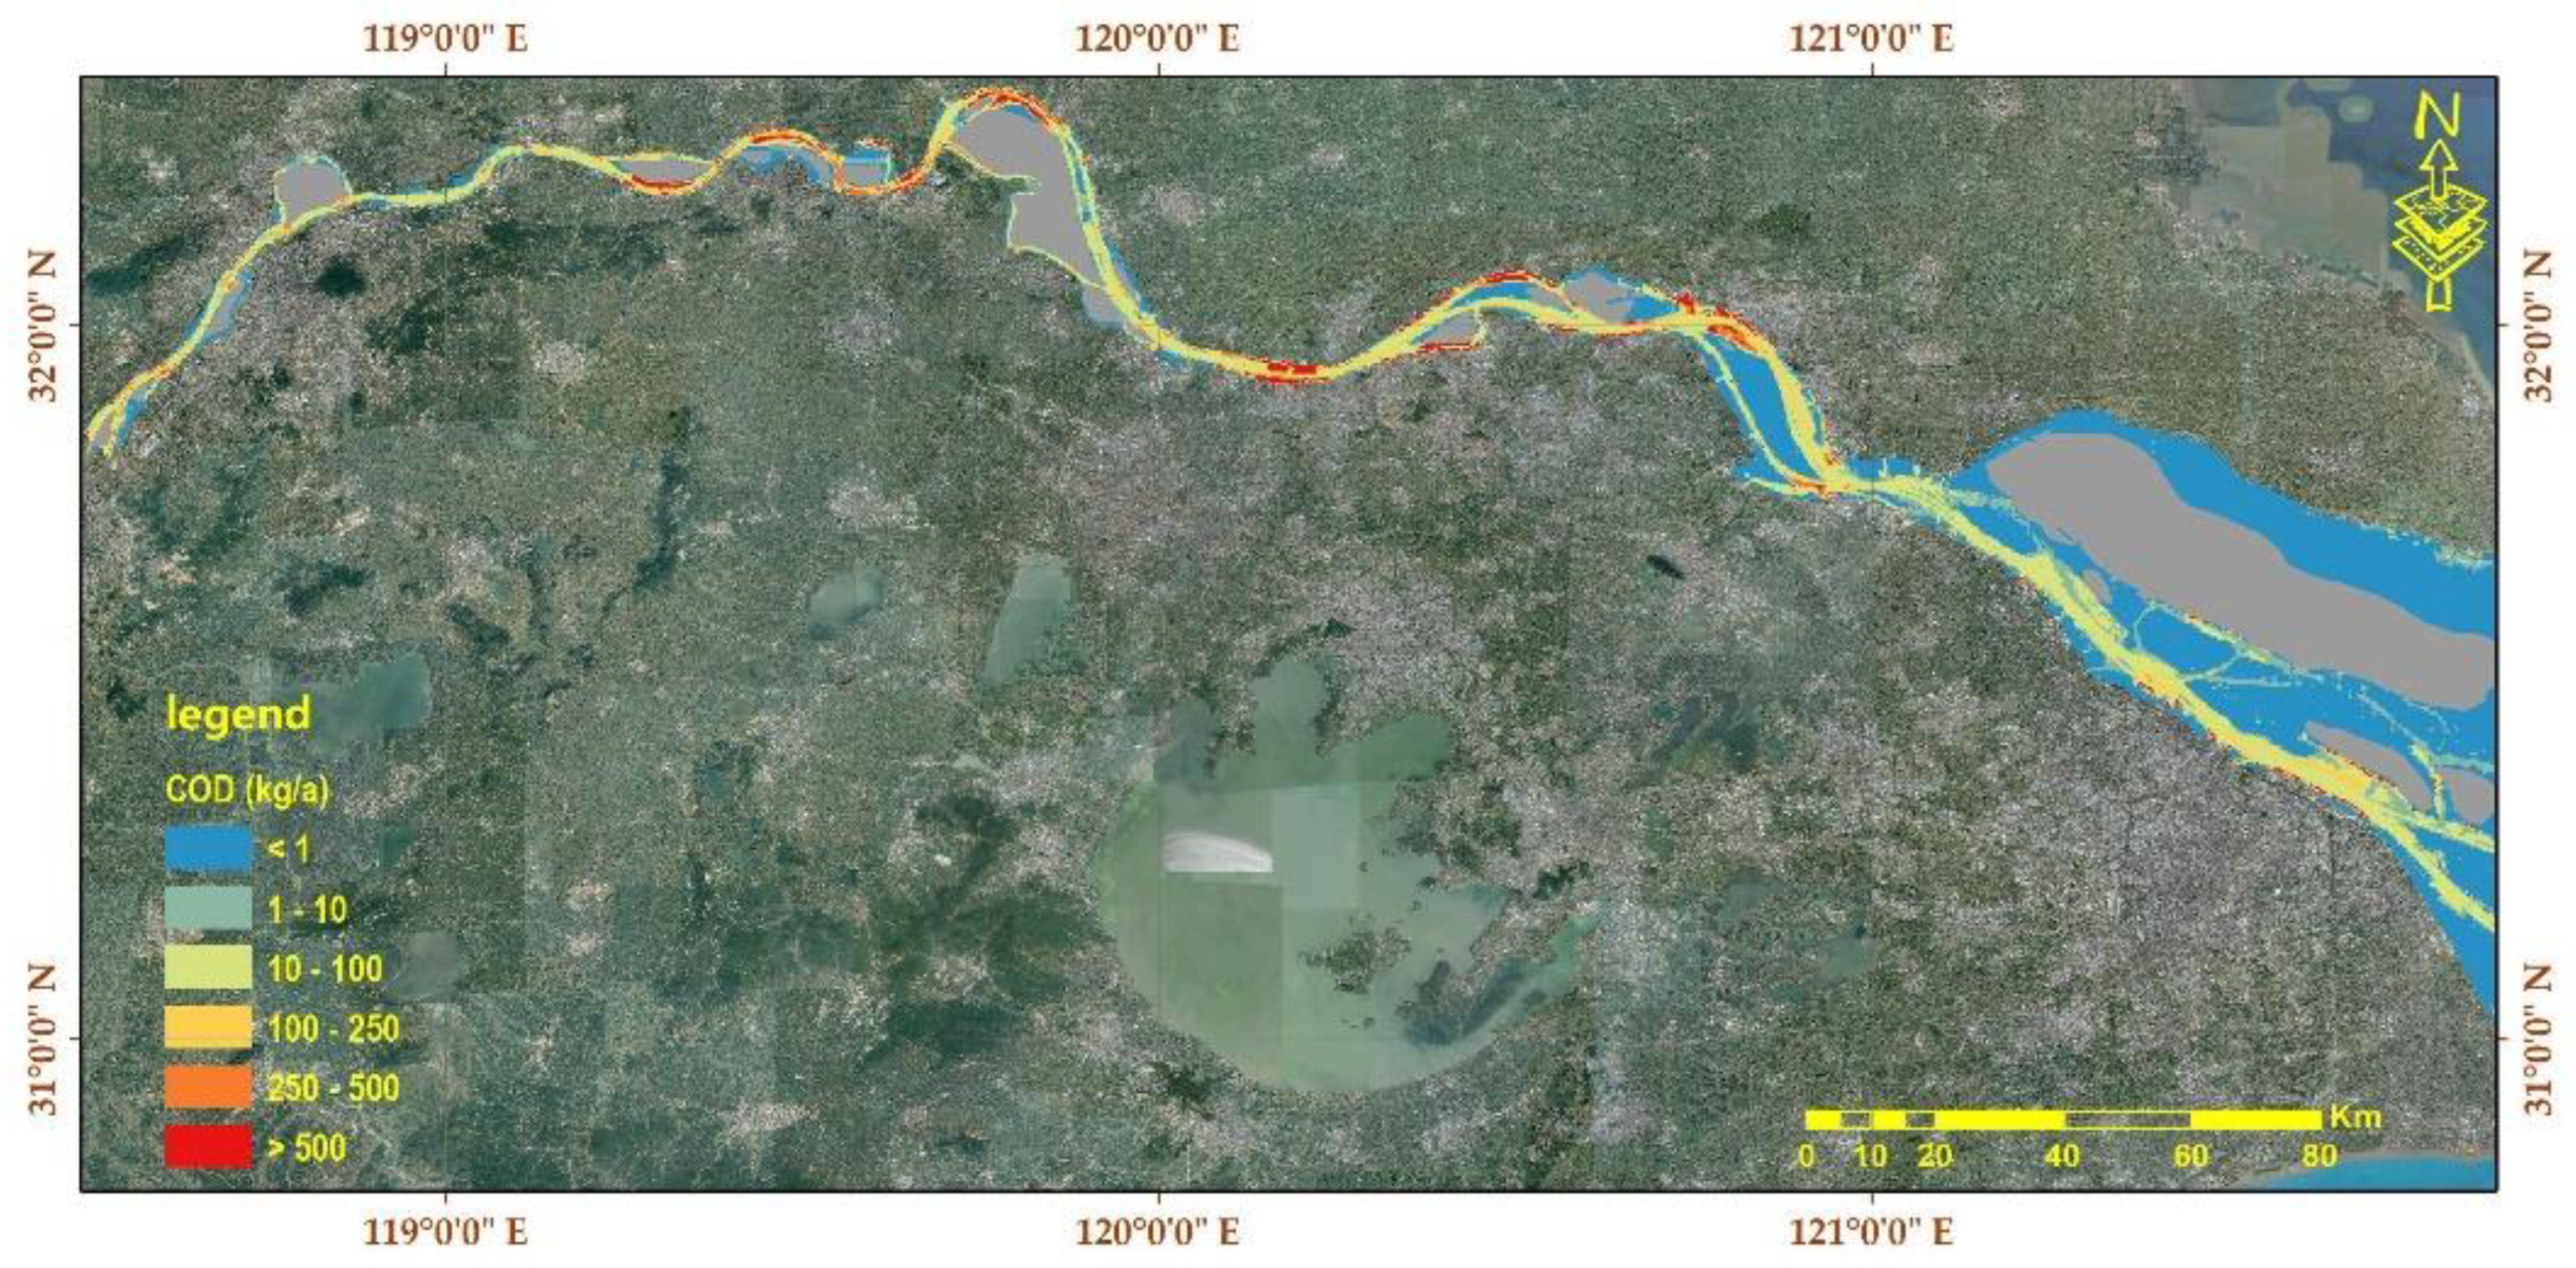
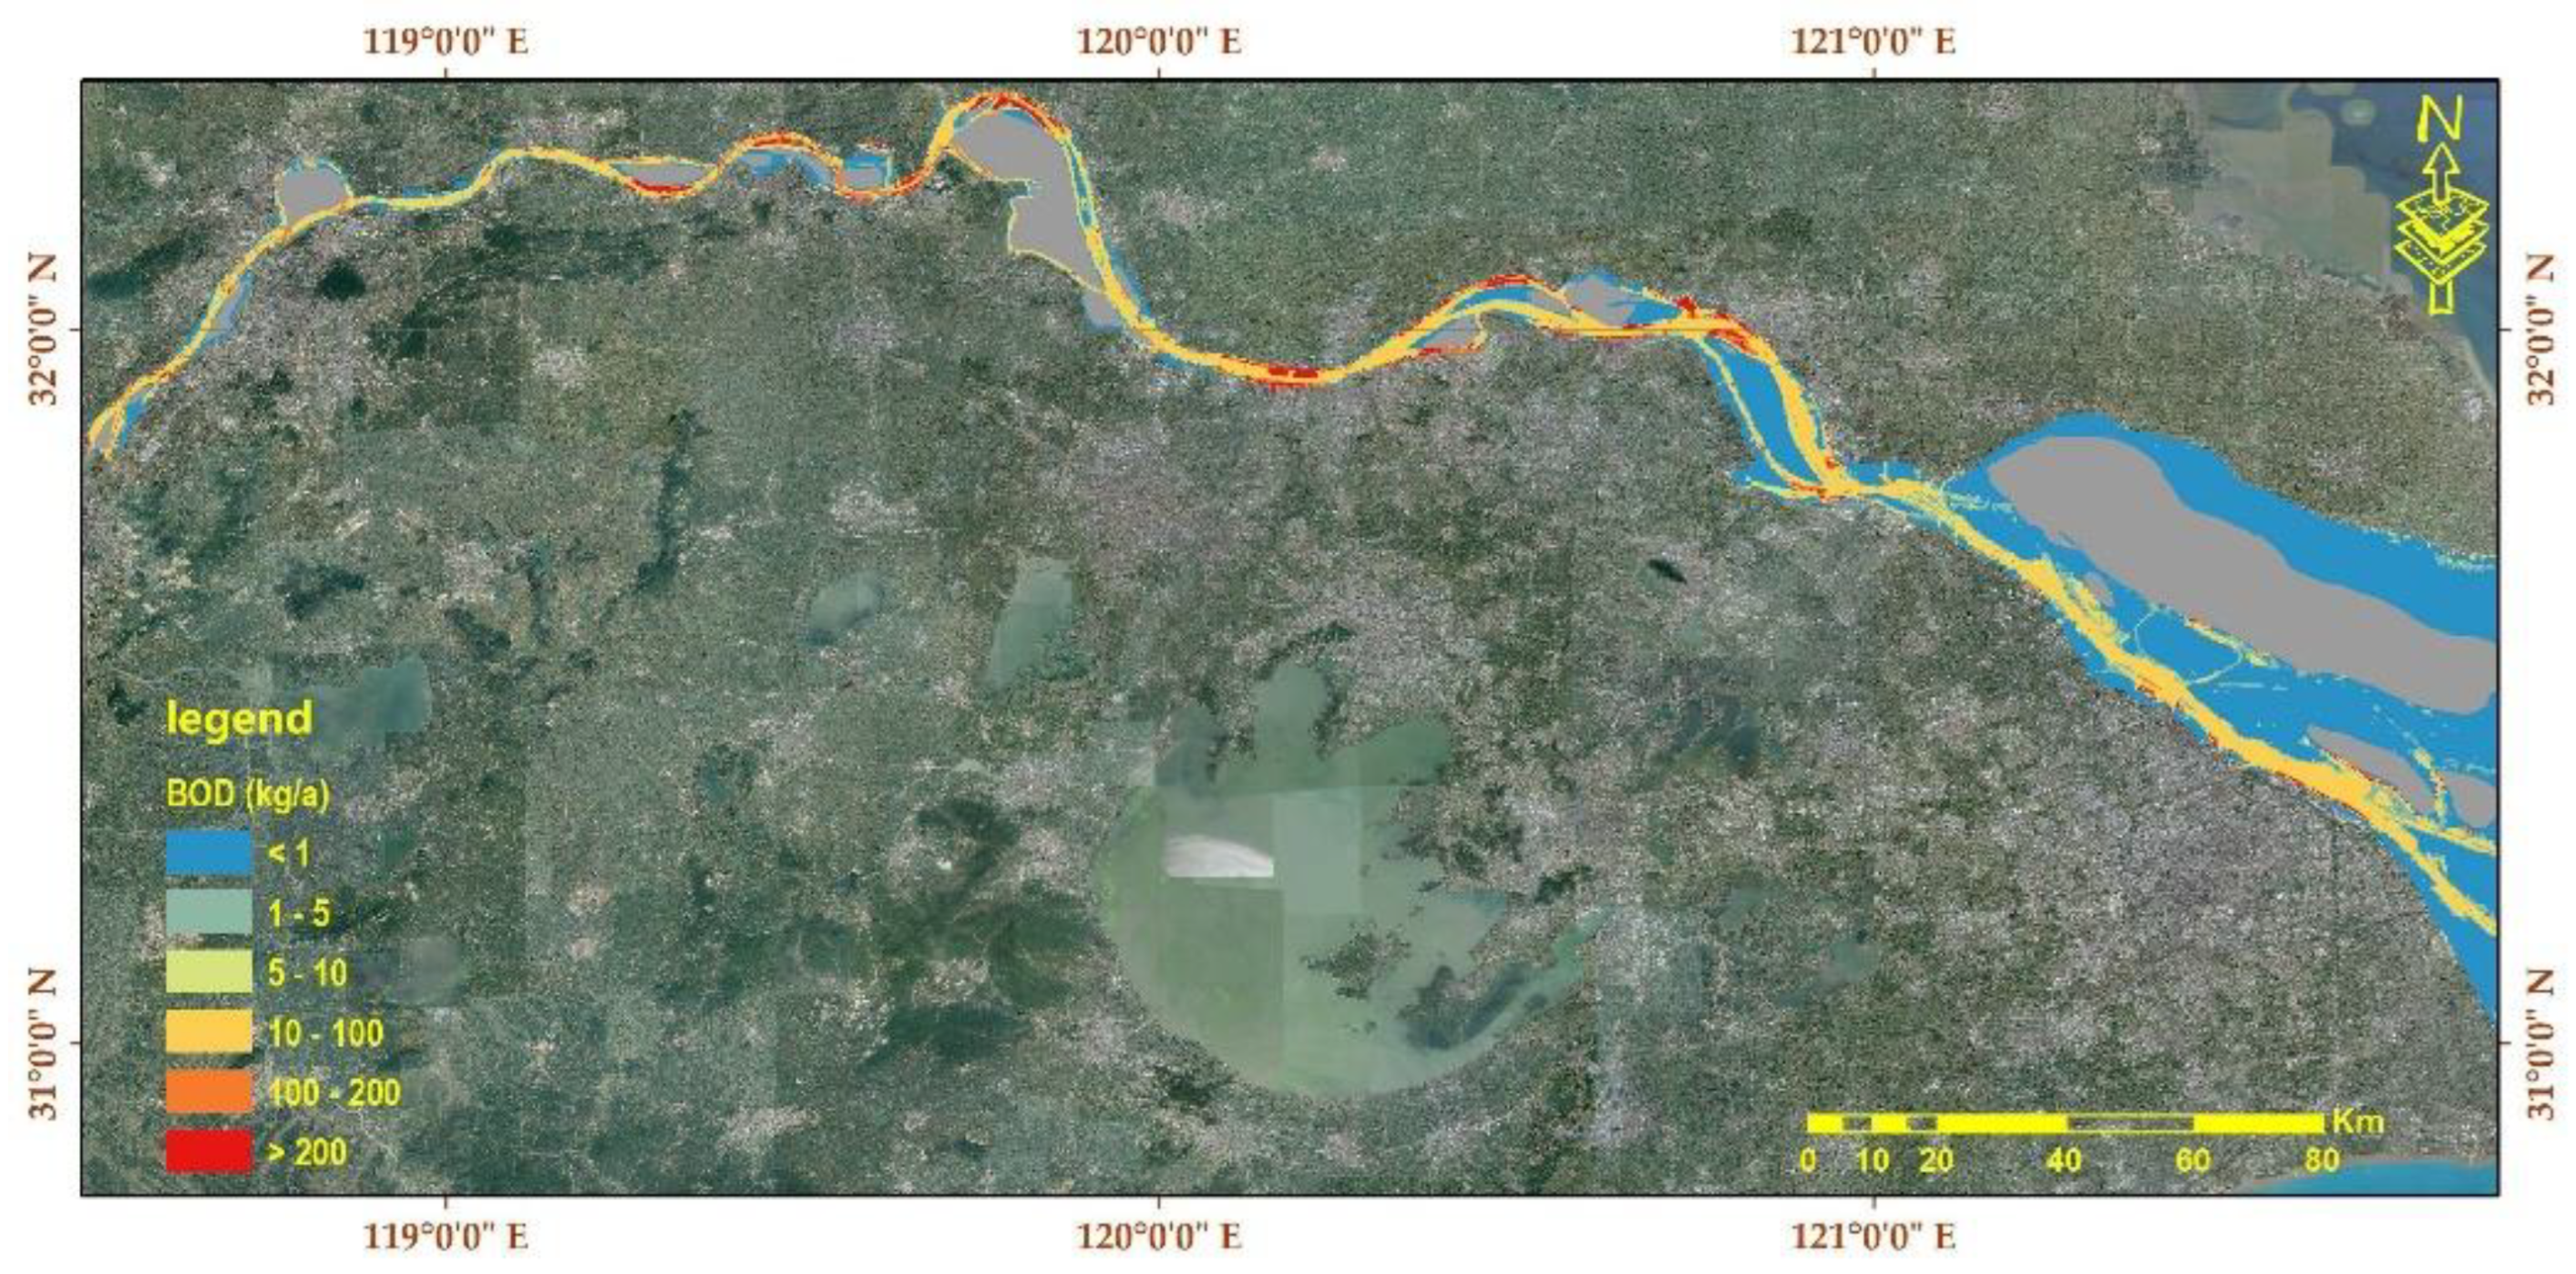
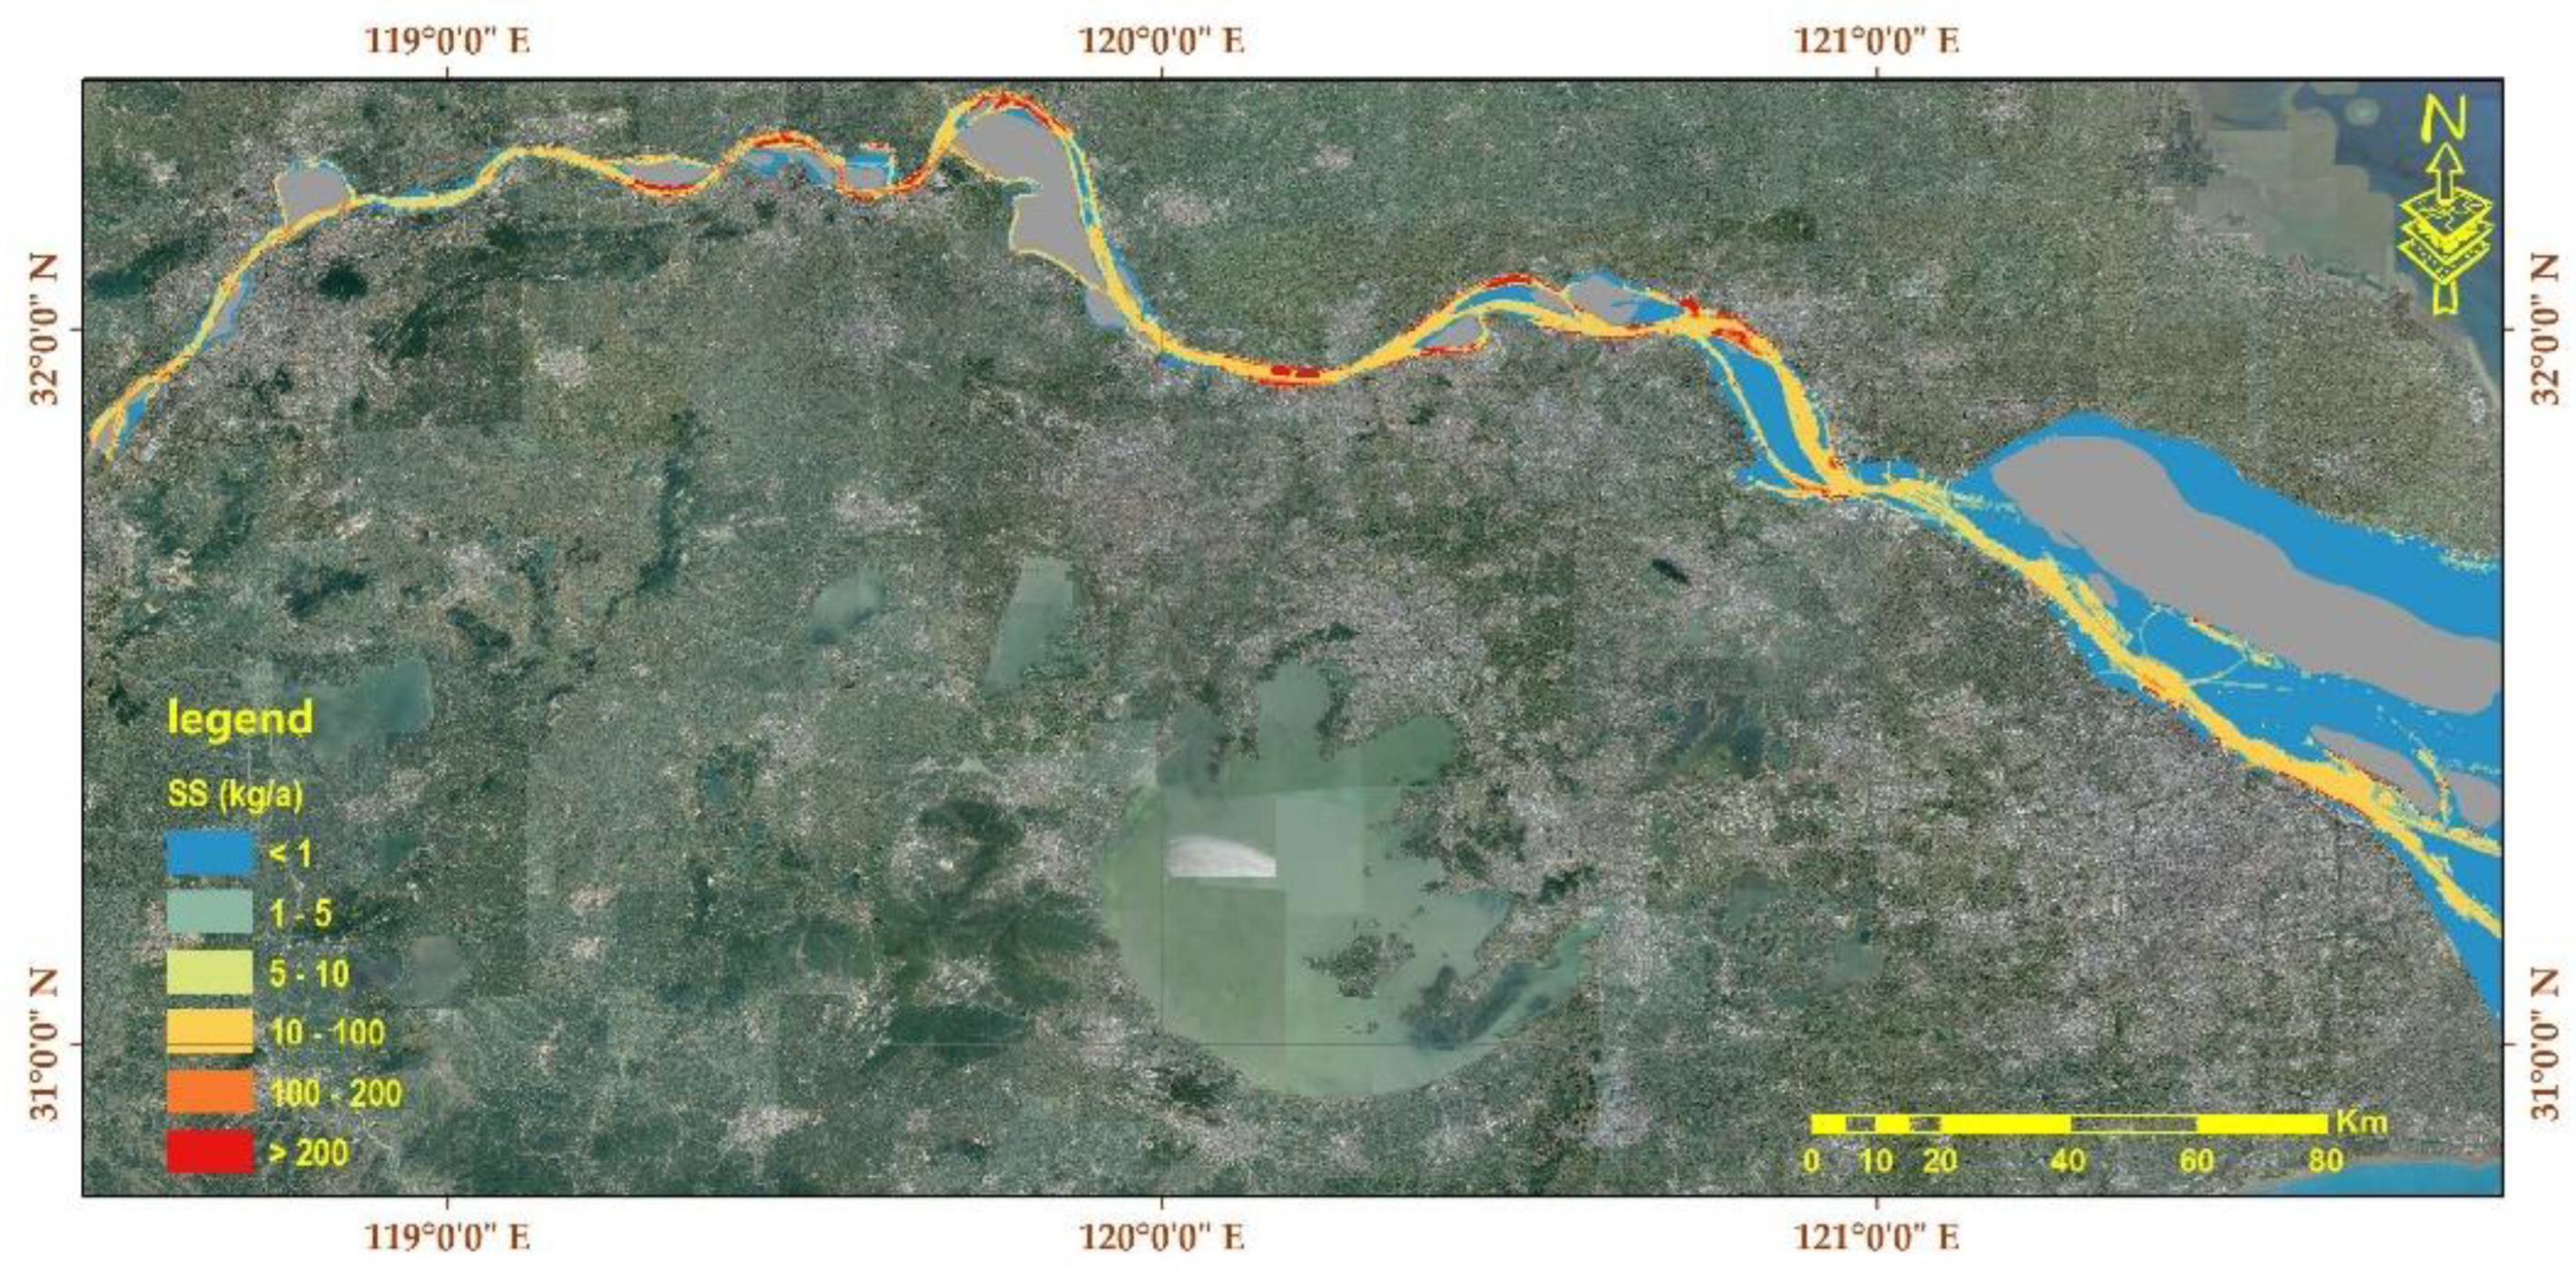
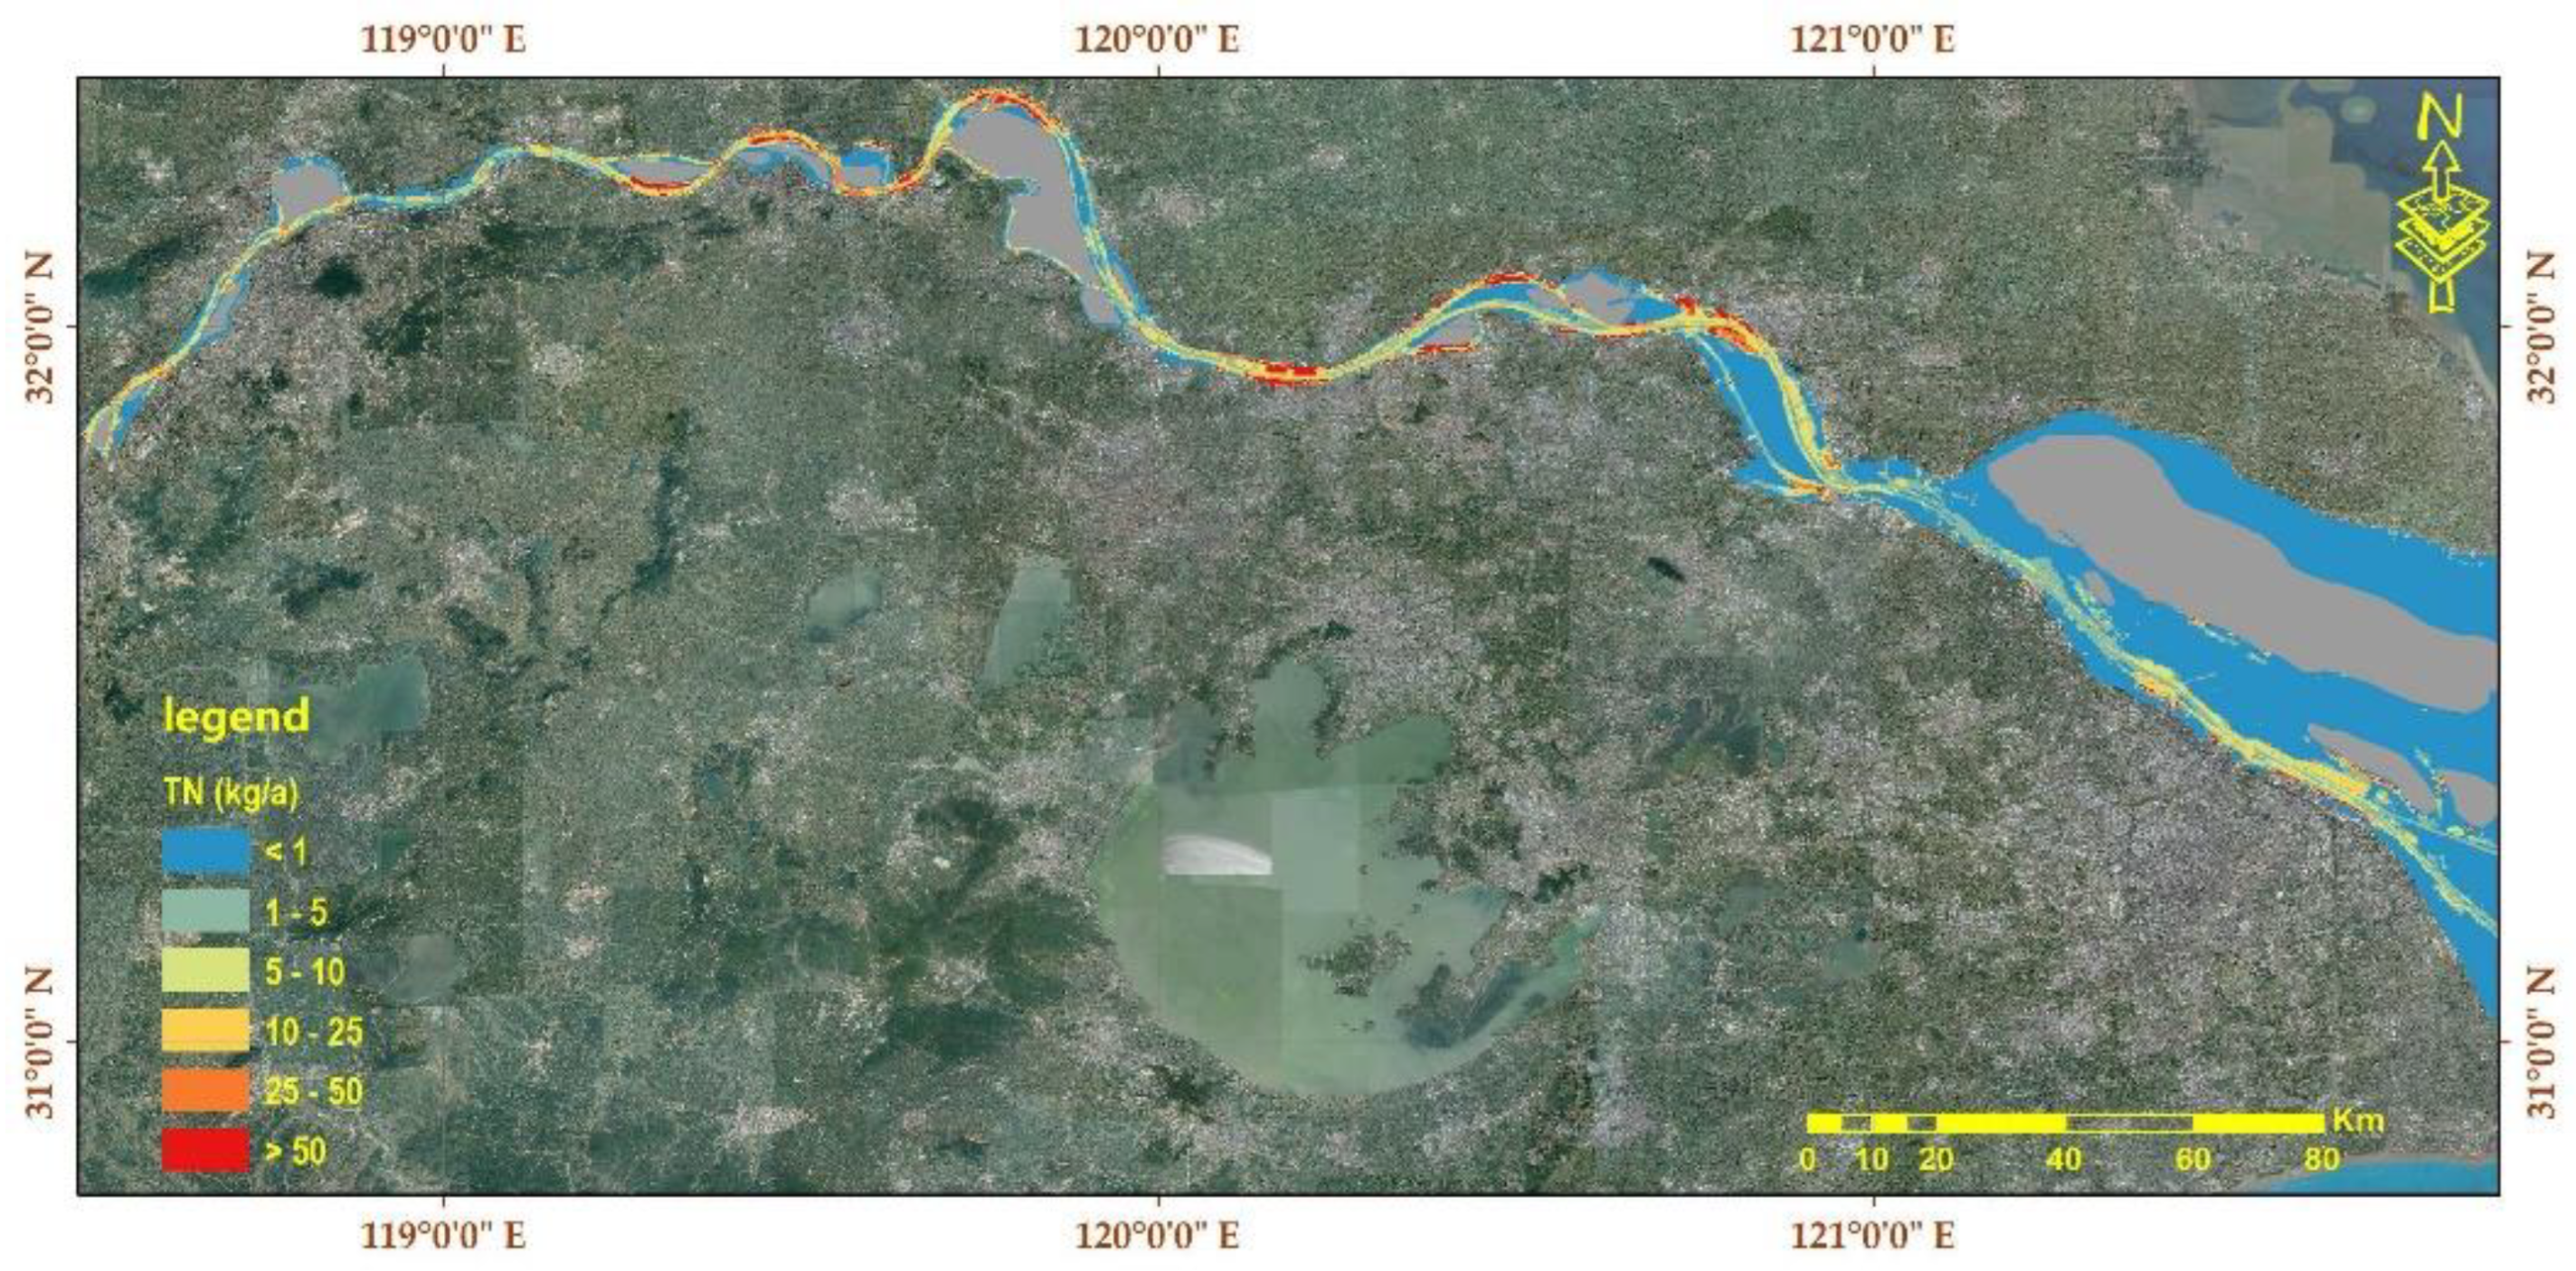
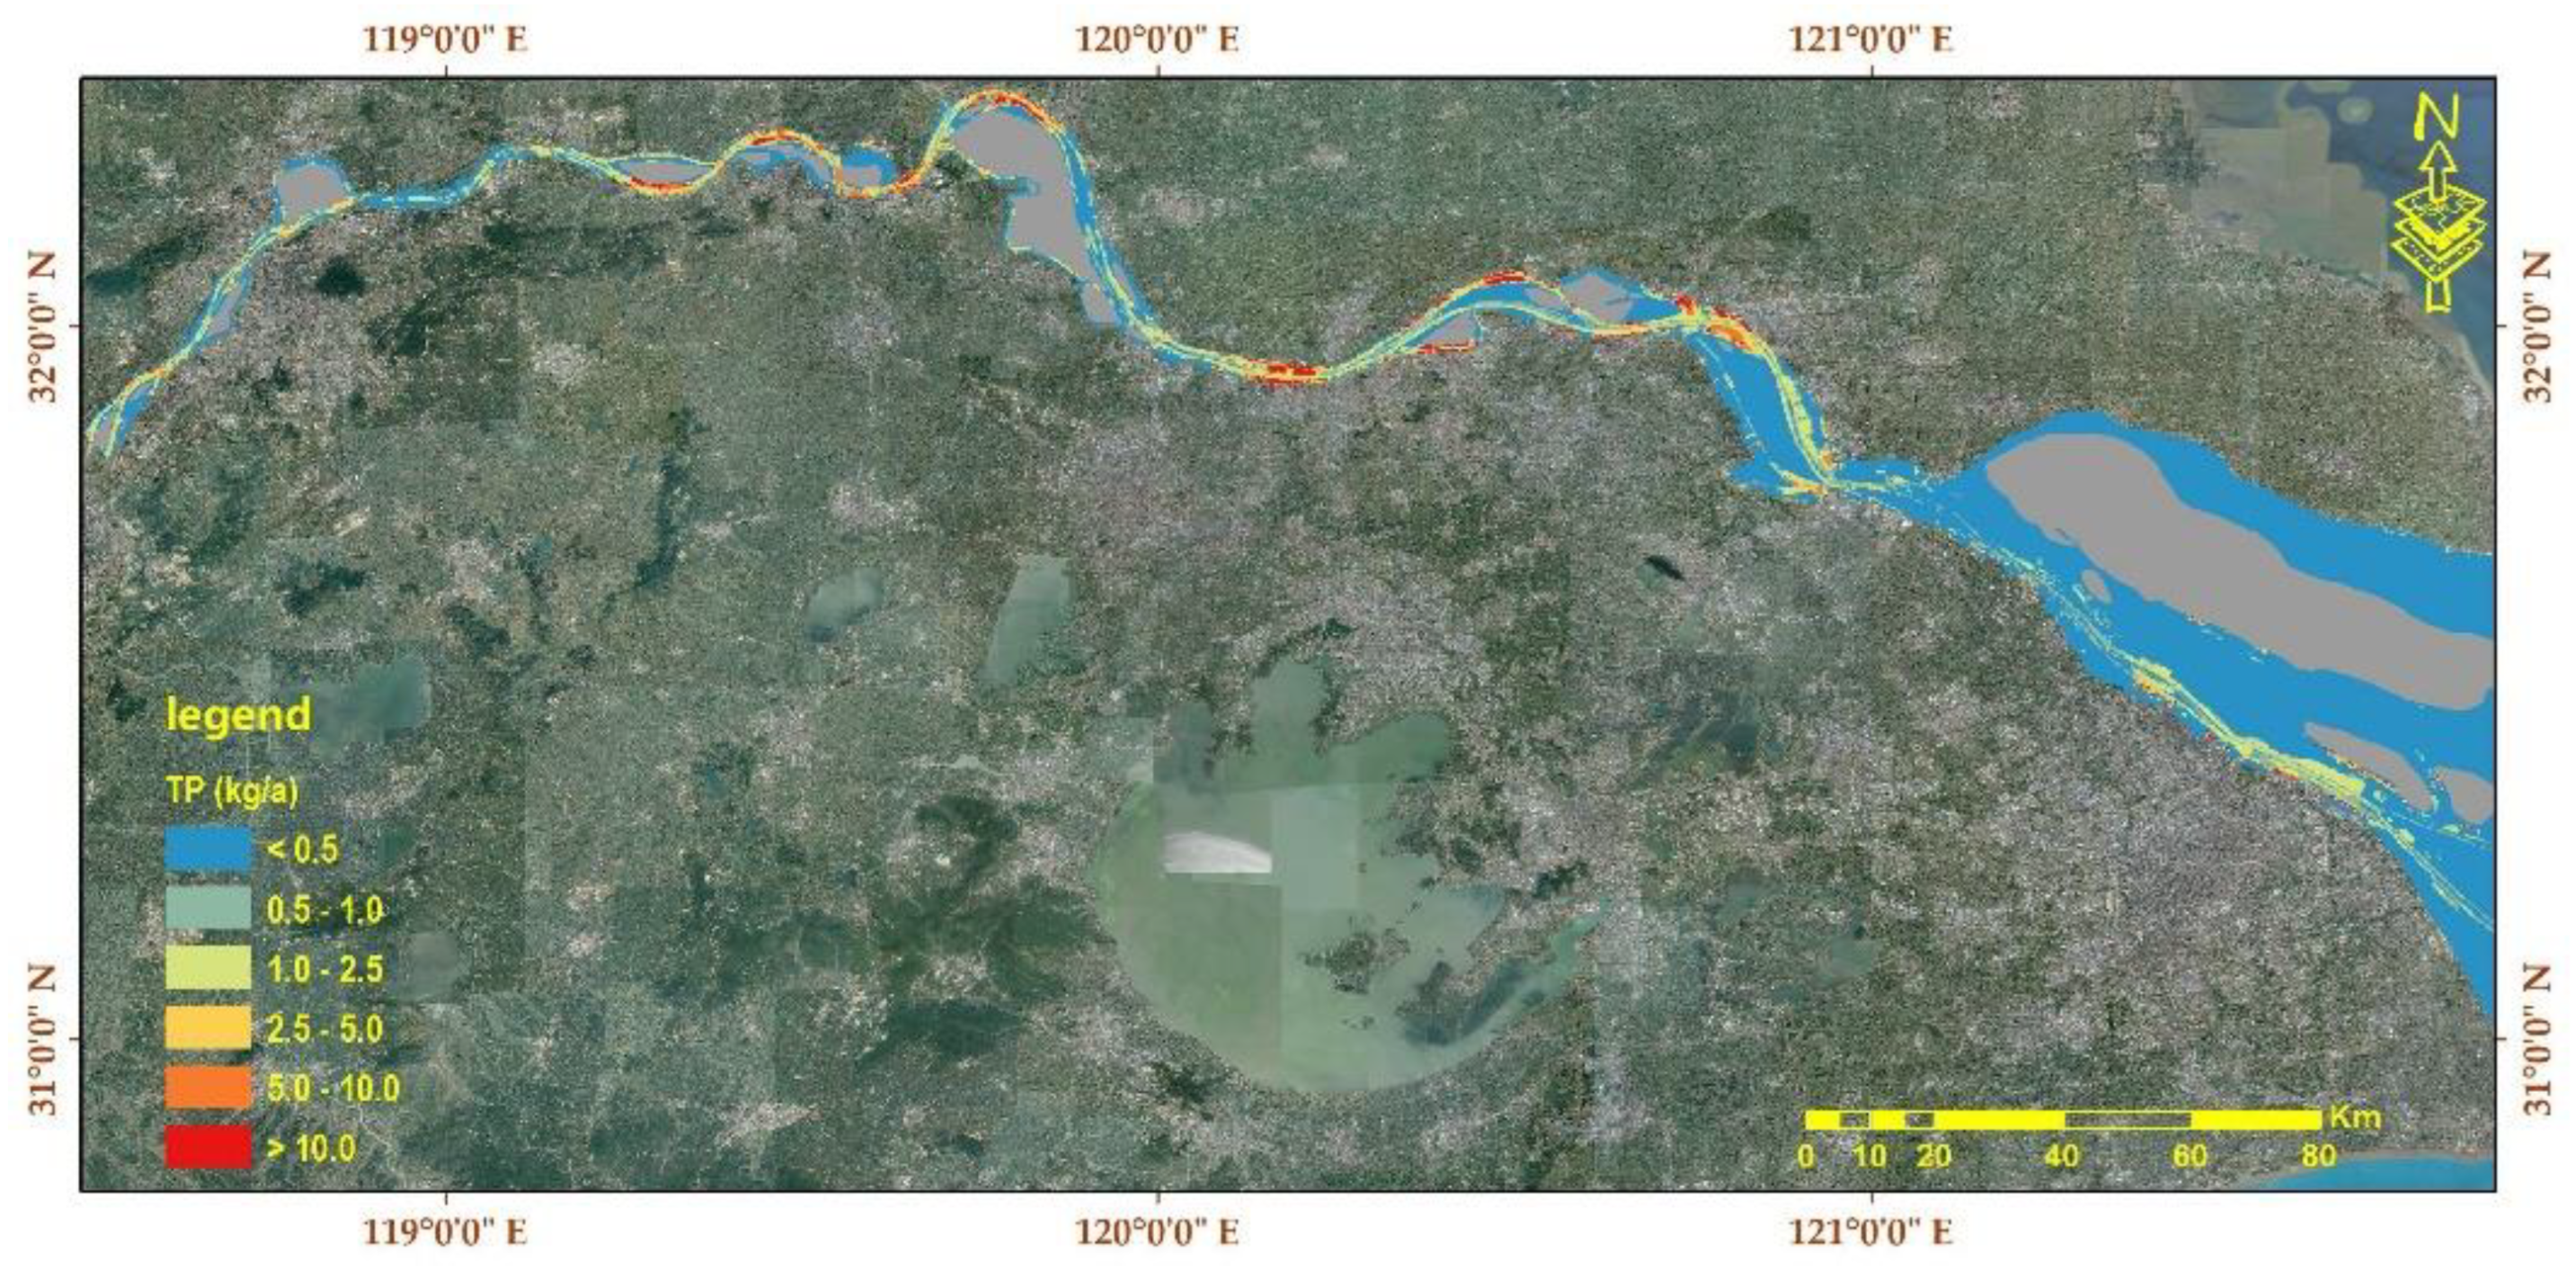
3.3. Spatial Distribution of Pollutants in Sewage
Based on the DSA data pool, tonnage, and other parameters obtained from the AIS data analysis, the pollutant generations of each grid were calculated according to Formula (1), and the inventory of the ship water pollutant generations in the lower reaches of the Yangtze River were summarized. The generation of various pollutants in the sewage are shown in Table 2.
For the regional distribution of the pollutant generation in sewage, see Figure 8, Figure 9, Figure 10, Figure 11, Figure 12 and Figure 13. It can be seen from the results that the water areas with a relatively large amount of pollutant generation were mainly related to the port distribution along the channel and the DSA density, while the areas with a high risk of ship pollution were mostly the water areas with concentrated ports and berths, access channels and berthing anchorages, or narrow waterways.
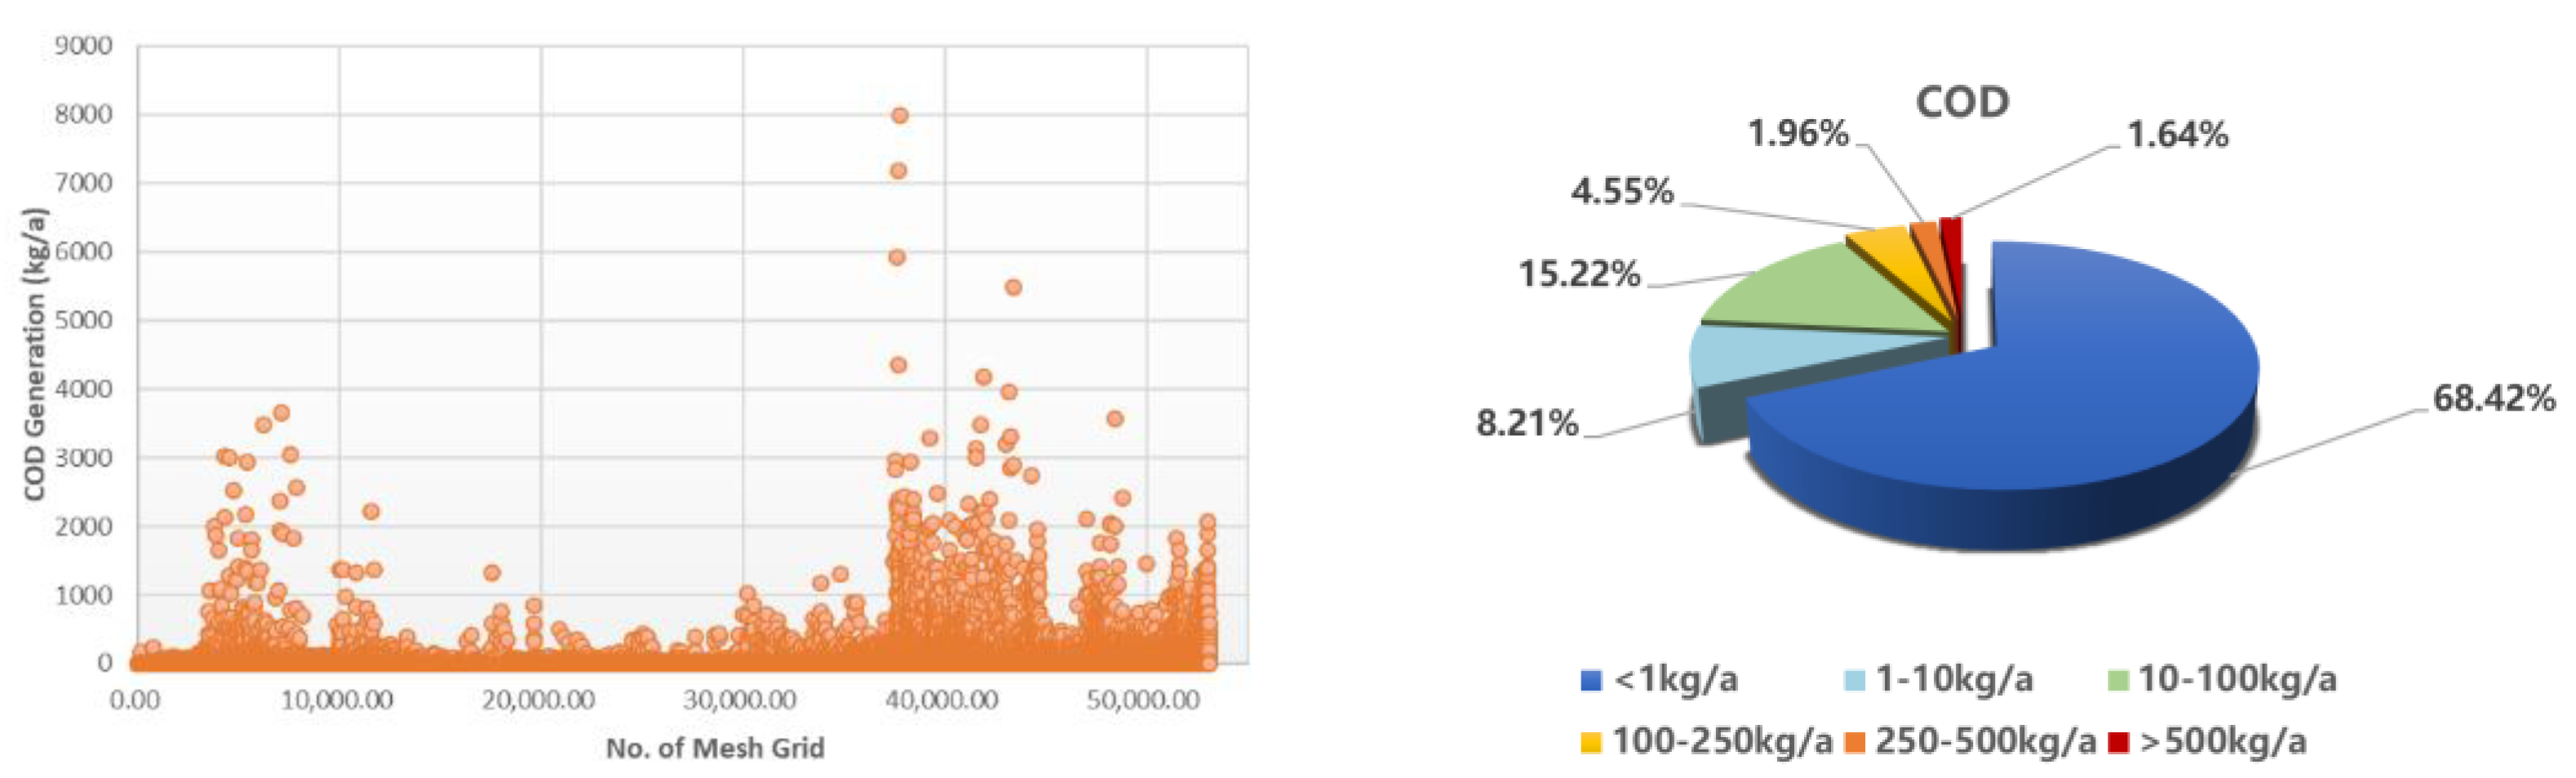
According to the COD generation classification diagram (see Figure 14), about 68.42% of the waters are less than 1 kg/a. About 8.15% of the waters exceed 100 kg/a and 23.43% of the waters are in the range of 1 to 100 kg/a.
4. Discussion
Compared with previous studies, the original massive AIS archived data were preconditioned by cleaning and thinning, and then the AIS data were processed further in-depth to DSA data, taking into account the ship tonnage and the number of crew on board. The data preprocessing and grid fusion method not only greatly accelerated the data processing process, but also improved the accuracy of the spatial analysis. The water pollutant inventory generation method based on AIS was applied to inland water, which is about 395 km long, and it has a very important guiding significance for the follow-up study of ship shore collaborative prevention and for the control measures of ship pollution in inland waters.
Different from coastal ships, ships operating in inland navigable waters can recieve assistance from the shore base more easily. Therefore, when considering the prevention and control of ship water pollution, collaborative prevention and control should be carried out considering two aspects, ships and shore bases, and two levels, ports and basins. Based on the spatial distribution characteristics of water pollutants from inland ships obtained in this study, the following countermeasures are proposed.
(1) Gradual implementation of “zero discharge” from inland ships. For sewage from ships, it is encouraged that during the design and construction of new ships, the mode of “storage on board and reception on shore” is followed. Existing ships are encouraged to carry out reformation for pollution prevention and to gradually realize zero discharge from the source. This will encourage the construction and use of green ships.
(2) Optimizing and improving the receiving facility system. On the basis of the existing receiving facility system (RFs), the network layout of RFs should be improved in various complementary ways. The fixed RFs for water pollutants of berthing ships should mainly be used, accompanied by the land mobile receiving tank wagons on shore and the receiving ships on water. In addition, the water service areas for ships or public receiving points for ship water pollutants should be built in waters with dense ships and appropriate conditions. According to the regional distribution of ship pollutant generation, the network layout of existing RFs should be optimized and improved, such as increasing the number of RFs or improving the capacity of RFs in water areas with large sewage generation.
(3) Strengthening collaborative prevention and control at the river basin level. Based on the existing joint supervision and service information systems of ship water pollutants in the Yangtze River economic belt, the receiving, transfer, and disposal of high-risk areas of ship pollution in the systems should be paid special attention, according to the regional distribution characteristics of the inventory of ship water pollutants. The inventory estimation of ship water pollutant generation should be regularly carried out in the study river section, while scientifically guiding the optimization of the network layout and targeting capacity improvement from the navigable river basin level. Research regarding online monitoring of the characteristic water pollutants of high-risk ships and the remote sensing and telemetry of illegal discharge should be carried out, so as to improve the technical level of dynamic supervision. Based on the regional variation characteristics of pollutant generations calculated in this study, the distribution of drinking water sources, the environmental water quality requirements of rare species protection areas, and scenic spots should be comprehensively investigated, and the discharge control areas of ship sewage should be studied and designed. In addition, based on this study, a dynamic prediction and early warning platform for ship pollution risks can be developed to prevent ships from generating water pollutants that exceed their receiving capacity in local waters.
5. Conclusions
In this study, first, the data pre-processing process is established in order to generate the DSA data pool after cleaning and thinning the massive original AIS data, and then the data fusion method of a high-precision GIS grid is established to integrate DSA data into each grid. The total DSA in the lower reaches of the Yangtze River is 37.14 million h/a. The DSA value range for most grids is 100–1000 h/a.
Second, the sewage and pollutant generation inventories of the lower reaches of the Yangtze River are estimated and analyzed spatiotemporally. It is estimated that the generation of sewage is 1,768,600 t/a in total, and about 68% of the waters are less than 1 t/a. The generation of CODcr, BOD5, SS, TN, NH3-N, and TP are 2016.23 t/a, 930.30 t/a, 963.90 t/a, 196.32 t/a, 139.01 t/a, and 32.01 t/a, respectively. According to the spatial analysis results, water areas with a relatively large amount of pollutant generations are mainly related to the port distributions along the channel and the DSA density, while the areas with a high risk of ship pollution are mostly the water areas with concentrated ports and berths, access channels and berthing anchorages, or narrow waterways.
Finally, a ship shore system for prevention and control measures for inland river ship pollution is proposed. Based on the spatial distribution characteristics of the water pollutants from inland ships obtained in this study, the countermeasures proposed mainly include the gradual implementation of “zero discharge” from inland ships, optimizing and improving the receiving facility system, and strengthening collaborative prevention and control at the river basin level.
There is some uncertainty regarding the calculation results of ship water pollutant generation due to the accuracy of the AIS data itself, the number of people on board, and the change in the pollution generation coefficient. The calculation results have more significance as a guide for the formulation and implementation of the overall policy for ship pollution prevention and control at the basin level.
Author Contributions
Conceptualization, R.C.; methodology, C.L.; software and validation, Q.X.; investigation, R.C.; resources, Q.X. and R.R.; data curation, C.L.; writing—original draft preparation, R.C.; writing—review and editing, R.C. and C.L.; visualization and supervision, R.C.; funding acquisition, R.C. All authors have read and agreed to the published version of the manuscript.
Funding
This research was funded by the Prospective Basic Project of China Waterborne Transport Research Institute, grant numbers 62201 and 62220.
Data Availability Statement
The data presented in this study are available from the responding author upon request.
Acknowledgments
We would like to thank the Decision Support Platform for Emergency Response to Accidents of Oil Spill and Chemical Leaks for their technical support.
Conflicts of Interest
The authors declare no conflict of interest.
References
- GB 3552-2018; Discharge Standard for Water Pollutants from Ships. China Environmental Science Press: Beijing, China, 2018.
- Zhang, J.; Wan, C.; He, A.; Zhang, D.; Soares, C.G. A two-stage black-spot identification model for inland waterway transportation. Reliab. Eng. Syst. Saf. 2021, 213, 107677. [Google Scholar] [CrossRef]
- Ministry of Transport of the People’s Republic of China. Statistical Bulletin of Transport Industry Development in 2021. Available online: https://xxgk.mot.gov.cn/2020/jigou/zhghs/202205/t20220524_3656659.html (accessed on 10 September 2022).
- Schwarzkopf, D.A.; Petrik, R.; Matthias, V.; Quante, M.; Yu, G.; Zhang, Y. Comparison of the Impact of Ship Emissions in Northern Europe and Eastern China. Atmosphere 2022, 13, 894. [Google Scholar] [CrossRef]
- Zhao, T.; Chen, M.; Lee, H. A Study on the Framework for Estimating Ship Air Pollutant Emissions—Focusing on Ports of South Korea. Atmosphere 2022, 13, 1141. [Google Scholar] [CrossRef]
- Peng, Z.; Wang, L.; Tong, L.; Zhang, C.; Zou, H.; Tan, J. Establishment of Inland Ship Air Pollution Emission Inventory Based on Power Method Correction Model. Sustainability 2022, 14, 11188. [Google Scholar] [CrossRef]
- Xiao, G.; Wang, T.; Chen, X.; Zhou, L. Evaluation of Ship Pollutant Emissions in the Ports of Los Angeles and Long Beach. J. Mar. Sci. Eng. 2022, 10, 1206. [Google Scholar] [CrossRef]
- Liu, H.; Shang, Y.; Jin, X. Review of methods and progress on shipping emission inventory studies. Acta Sci. Circumstantiae 2018, 38, 1–12. (In Chinese) [Google Scholar] [CrossRef] [Green Version]
- Lee, E.; Mokashi, A.; Moon, S.; Kim, G. The Maturity of Automatic Identification Systems (AIS) and Its Implications for Innovation. J. Mar. Sci. Eng. 2019, 7, 287. [Google Scholar] [CrossRef] [Green Version]
- YAO, X.; MOU, J.; ZHANG, X. Ship exhaust emission inventories at the Yangtze River estuary based on the terrestrial AIS data. J. Saf. Environ. 2017, 17, 1510–1514. (In Chinese) [Google Scholar]
- Zhu, Q.; Liao, C.; Wang, L. Application of fine vessel emission inventory compilation method based on AIS data. China Environ. Sci. 2017, 37, 4493–4500. (In Chinese) [Google Scholar]
- Jiang, H.; Peng, D.; Wang, Y.; Fu, M. Comparison of Inland Ship Emission Results from a Real-World Test and an AIS-Based Model. Atmosphere 2021, 12, 1611. [Google Scholar] [CrossRef]
- Sweeting, J.; Wayne, S. A shifting tide: Environmental challenges and cruise industry responses. In Cruise Ship Tourism; CABI International: London, UK, 2006; pp. 327–337. [Google Scholar]
- Shu, Y.; Wang, X.; Huang, Z.; Song, L.; Fei, Z.; Gan, L.; Xu, Y.; Yin, J. Estimating spatiotemporal distribution of wastewater generated by ships in coastal areas. Ocean. Coast. Manag. 2022, 222, 106133. [Google Scholar] [CrossRef]
- Chen, L.; Zhang, D.; Li, S. Port sensing computation based on maritime big data. J. Geo-Inf. Sci. 2016, 18, 1485–1493. (In Chinese) [Google Scholar]
- Zhang, X. The annual cargo throughput of the Yangtze River main channel exceeded 3 billion tons. China Shipp. Gaz. 2021, 2, 19. (In Chinese) [Google Scholar]
- Kim, J.K. Semi-Continuous Spatial Statistical Analysis Using AIS Data for Vessel Traffic Flow Characteristics in Fairway. J. Mar. Sci. Eng. 2021, 9, 378. [Google Scholar] [CrossRef]
- Lee, J.-S.; Cho, I.-S. Extracting the Maritime Traffic Route in Korea Based on Probabilistic Approach Using Automatic Identification System Big Data. Appl. Sci. 2022, 12, 635. [Google Scholar] [CrossRef]
- Xiao, Y.; Chen, Y.; Liu, X.; Yan, Z.; Cheng, L.; Li, M. Oil Flow Analysis in the Maritime Silk Road Region Using AIS Data. Int. J. Geo-Inf. 2020, 9, 265. [Google Scholar] [CrossRef] [Green Version]
- Nguyen, M.; Zhang, S.; Wang, X. A Novel Method for Risk Assessment and Simulation of Collision Avoidance for Vessels based on AIS. Algorithms 2018, 11, 204. [Google Scholar] [CrossRef] [Green Version]
- Tian, Y.; Ren, L.; Wang, H.; Li, T.; Yuan, Y.; Zhang, Y. Impact of AIS Data Thinning on Ship Air Pollutant Emissions Inventories. Atmosphere 2022, 13, 1135. [Google Scholar] [CrossRef]
- Zhu, G.; Xie, Z.; Xu, H.; Wang, N.; Zhang, L.; Mao, N.; Cheng, J. Oil Spill Environmental Risk Assessment and Mapping in Coastal China Using Automatic Identification System (AIS) Data. Sustainability 2022, 14, 5837. [Google Scholar] [CrossRef]
- Fetissov, M.; Aps, R.; Goerlandt, F.; Jänes, H.; Kotta, J.; Kujala, P.; Szava-Kovats, R. Next-Generation Smart Response Web (NG-SRW): An Operational Spatial Decision Support System for Maritime Oil Spill Emergency Response in the Gulf of Finland (Baltic Sea). Sustainability 2021, 13, 6585. [Google Scholar] [CrossRef]
- Feng, X.; Yuan, S.; Zhang, Y. Fuel exhaust emission inventory and the spatiotemporal distribution particularities of Jiangsu section of Yangtze River channel. J. Saf. Environ. 2018, 18, 1609–1614. (In Chinese) [Google Scholar]
- Chen, R.; Shi, J.; Wang, Z. Method Study on Establishing of Ship Sewage Pollutants Discharging Inventory Based on AIS. IOP Conf. Ser. Earth Environ. Sci. 2019, 237, 022018. [Google Scholar] [CrossRef]
- GB/T 10833-2015; Marine Sewage Treatment Equipment Specification. Standards Press of China: Beijing, China, 2015.
- U.S. Environmental Protection Agency. Cruise Ship Discharge Assessment Report; EPA842-R-07-005; 2008. Available online: https://nepis.epa.gov/Exe/ZyPURL.cgi?Dockey=P1002SVS.txt (accessed on 10 September 2022).
Figure 1.
The geographical scope of the study.

Figure 2.
The procedure for the establishment of the inventory.

Figure 3.
Mesh generation of study waters.

Figure 4.
DSA distribution in the lower reaches of the Yangtze River.

Figure 5.
DSA monthly change in the lower reaches of the Yangtze River.

Figure 6.
Domestic sewage generation.

Figure 7.
Classification diagram of sewage generation.

Figure 8.
COD generations distribution.

Figure 9.
BOD generation distribution.

Figure 10.
SS generations distribution.

Figure 11.
TN generation distribution.

Figure 12.
NH3-N generation distribution.

Figure 13.
TP generation distribution.

Figure 14.
Classification diagram of COD generation in sewage.


Table 1.
Pollutant concentration of sewage (mg/L).
| Pollutants | CODcr | BOD5 | SS | TN | NH3-N | TP |
|---|---|---|---|---|---|---|
| concentration | 1140 | 526 | 545 | 111 | 78.6 | 18.1 |
Table 2.
Generation of ship water pollutants in the lower reaches of the Yangtze River (t/a).
| Sewage Type | Domestic Sewage | |||||
|---|---|---|---|---|---|---|
| Pollutant name | CODcr | BOD5 | SS | TN | NH3-N | TP |
| Generation (t/a) | 2016.23 | 930.30 | 963.90 | 196.32 | 139.01 | 32.01 |
Publisher’s Note: MDPI stays neutral with regard to jurisdictional claims in published maps and institutional affiliations. |
© 2022 by the authors. Licensee MDPI, Basel, Switzerland. This article is an open access article distributed under the terms and conditions of the Creative Commons Attribution (CC BY) license (https://creativecommons.org/licenses/by/4.0/).
Share and Cite
MDPI and ACS Style
Chen, R.; Liu, C.; Xue, Q.; Rui, R. Research on Fine Ship Sewage Generation Inventory Based on AIS Data and Its Application in the Yangtze River. Water 2022, 14, 3109. https://doi.org/10.3390/w14193109
AMA Style
Chen R, Liu C, Xue Q, Rui R. Research on Fine Ship Sewage Generation Inventory Based on AIS Data and Its Application in the Yangtze River. Water. 2022; 14(19):3109. https://doi.org/10.3390/w14193109
Chicago/Turabian StyleChen, Rongchang, Chen Liu, Qingqing Xue, and Rui Rui. 2022. "Research on Fine Ship Sewage Generation Inventory Based on AIS Data and Its Application in the Yangtze River" Water 14, no. 19: 3109. https://doi.org/10.3390/w14193109
Note that from the first issue of 2016, this journal uses article numbers instead of page numbers. See further details here.