
Quantitative Study of Climatic and Anthropogenic Contributions to Streamflow and Sediment Load in the Yangtze River, China

1
Changjiang Design Group Co., Ltd., Wuhan 430010, China
2
Key Laboratory of Engineering Sediment, Tianjin Research Institute for Water Transport Engineering, Ministry of Transport, Tianjin 300456, China
3
Institute of International Rivers and Eco-Security, Yunnan University, Kunming 650091, China
*
Author to whom correspondence should be addressed.
Water 2022, 14(19), 3104; https://doi.org/10.3390/w14193104
Submission received: 27 July 2022
/
Revised: 19 September 2022
/
Accepted: 28 September 2022
/
Published: 2 October 2022
(This article belongs to the Special Issue Sustainable Development of Inland Waterways)
Abstract
:Under intensifying human activities and climate change, runoff and sediment load have changed significantly in the Yangtze River Basin, China. Daily discharge data at six hydrological stations and daily precipitation at 175 weather stations from 1961–2020 were collected to analyze the changes in hydrological regimes. Two periods, namely the natural period (1961–1980) and the impacted period (1981–2020), were proposed to estimate the impacts of climate change and human activities by using regression analysis to reconstruct the natural runoff and the natural sediment load. The results show that there was a 0–3% difference in runoff reduction in the affected period, compared with the natural period at the five hydrological stations, except for the Datong station, while the sediment load in the whole river basin shows a downward trend varying from 17% to 40%. Human activities are the main reason for the reduced annual runoff at the other five stations during the impacted period, while climate change is the dominant factor for the increased runoff at Datong stations. This is because the precipitation-increased runoff in the basin of Lake Poyang exceeded the human-decreased runoff in the upper reaches. Human activities are the reason for the reduced sediment load in the mainstream during the impacted period, and their effects enhance over time, while climate change brings the opposite.
1. Introduction
Rivers, the primary pathways link between the land surface and the ocean through runoff and sediment transport, play an essential role in biological and chemical processes for ecosystems [1,2]. However, it has been a public understanding that global warming has dramatically impacted global and regional climate, significantly increasing extreme climate events. On the one hand, Allen et al. [3] and Salzmann et al. [4] predicted an increased trend in precipitation on a global scale due to greenhouse gases, which will significantly affect hydrological processes, further having a considerable impact on agricultural production and socio-economic development under the influence of global warming. On the other hand, with the increasing population, the global demand for water resources for irrigation, electricity production, and industrial and domestic water consumption has increased rapidly [5], decreasing runoff in rivers. Reservoir operation drastically reduced the sediment discharge to the sea in the global rivers, including the Colorado River [6], Mississippi River [7], Yellow River [8], Kurobe River [9], and Pearl River [10], which increased the risk of coastal erosion [11], delta erosion [12], and bank retreat [13]. As a result, increased human activities and climate change have significantly altered runoff and sediment transport in river systems [14].
Until now, the quantitation of the impacts of human activities and climate change has been regarded as one of the most critical aspects of understanding hydrological mechanisms [15,16,17]. The correlations between the respective hydrological series and the regional precipitation are used to estimate climate change and human activities’ contributions to the variation of annual runoff and sediment load in the Yellow River [18]. Several models, such as the SWAT and SEDD model, used to reconstruct natural runoff in many rivers worldwide, have demonstrated a greater contribution of human activities to runoff changes [19,20,21].
The Yangtze River, the longest river in China, historically ranks fifth globally in annual water discharge (920 km3·year−1) and fourth in annual sediment load (4.8 × 10⁸ t·year−1) [22]. More than 50,000 reservoirs, including the Three Gorges Dam (TGD) and the Gezhouba Dam, have been built and changed the hydrological processes of the Yangtze River Basin [23,24]. For instance, more than 17.3 × 10⁸ t sediment has been retained in TGD from June 2003 to December 2020, resulting in a 1.46 × 10⁸ t·year−1 decline in the suspended sediment load at Zhicheng station [25,26]. From 1 January to 10 June 2011, the total water volume supplemented by the TGD was up to 215 × 108 m3 for satisfying the needs of shipping, irrigation, and the ecological environment downstream of the dam [27,28]. Other human activities, including soil-water conservation projects and sand mining, are also in the Yangtze River Basin. On the other hand, climate change further alters the characteristics of runoff and sediment load in time and space.
However, the dominant reasons for the changes in runoff and sediment load remain controversial. On the one hand, since most studies on separating anthropogenic and climatic impacts have focused on sub-regions or single years in the Yangtze River [29,30], some state that climate change is the dominant factor during the recent decades [26,31,32] and the future [33,34], while others, on the contrary, claim that dam construction is the main reason for the downward trend in the runoff. Therefore, it is necessary to expand the study area to the whole basin and extend the study period to several decades. On the other hand, human activities, especially reservoir construction and soil conservation projects, have been recognized as the first reason for the sharp decrease in the sediment load [35,36,37], while little is known about the effect of climate change on sediment load [24,32,38]. Previous studies have typically assumed that climate change is primarily responsible for changes in runoff and that sediment load changes are primarily influenced by human activities [29,36,39]. Thus, based on the correlations between runoff and sediment, the change in sediment load caused by the runoff variation contributes to climate change.
The main objectives of this study are as follows: (1) to analyze various characteristics of annual runoff, sediment load, and precipitation in the Yangtze River Basin from 1961 to 2020 in order to determine the relationship between annual runoff, sediment load, and precipitation; (2) to reconstruct natural runoff and sediment load without human activities using the linear regression method, and to quantify the contribution of climate change and human activities to annual runoff and sediment change; (3) to estimate the errors for the regression-based prediction. The research results can contribute to a better understanding of river runoff and sediment load response to climate change and human activities and provide references for decision making about water and sediment resources management.
2. Study Area and Datasets
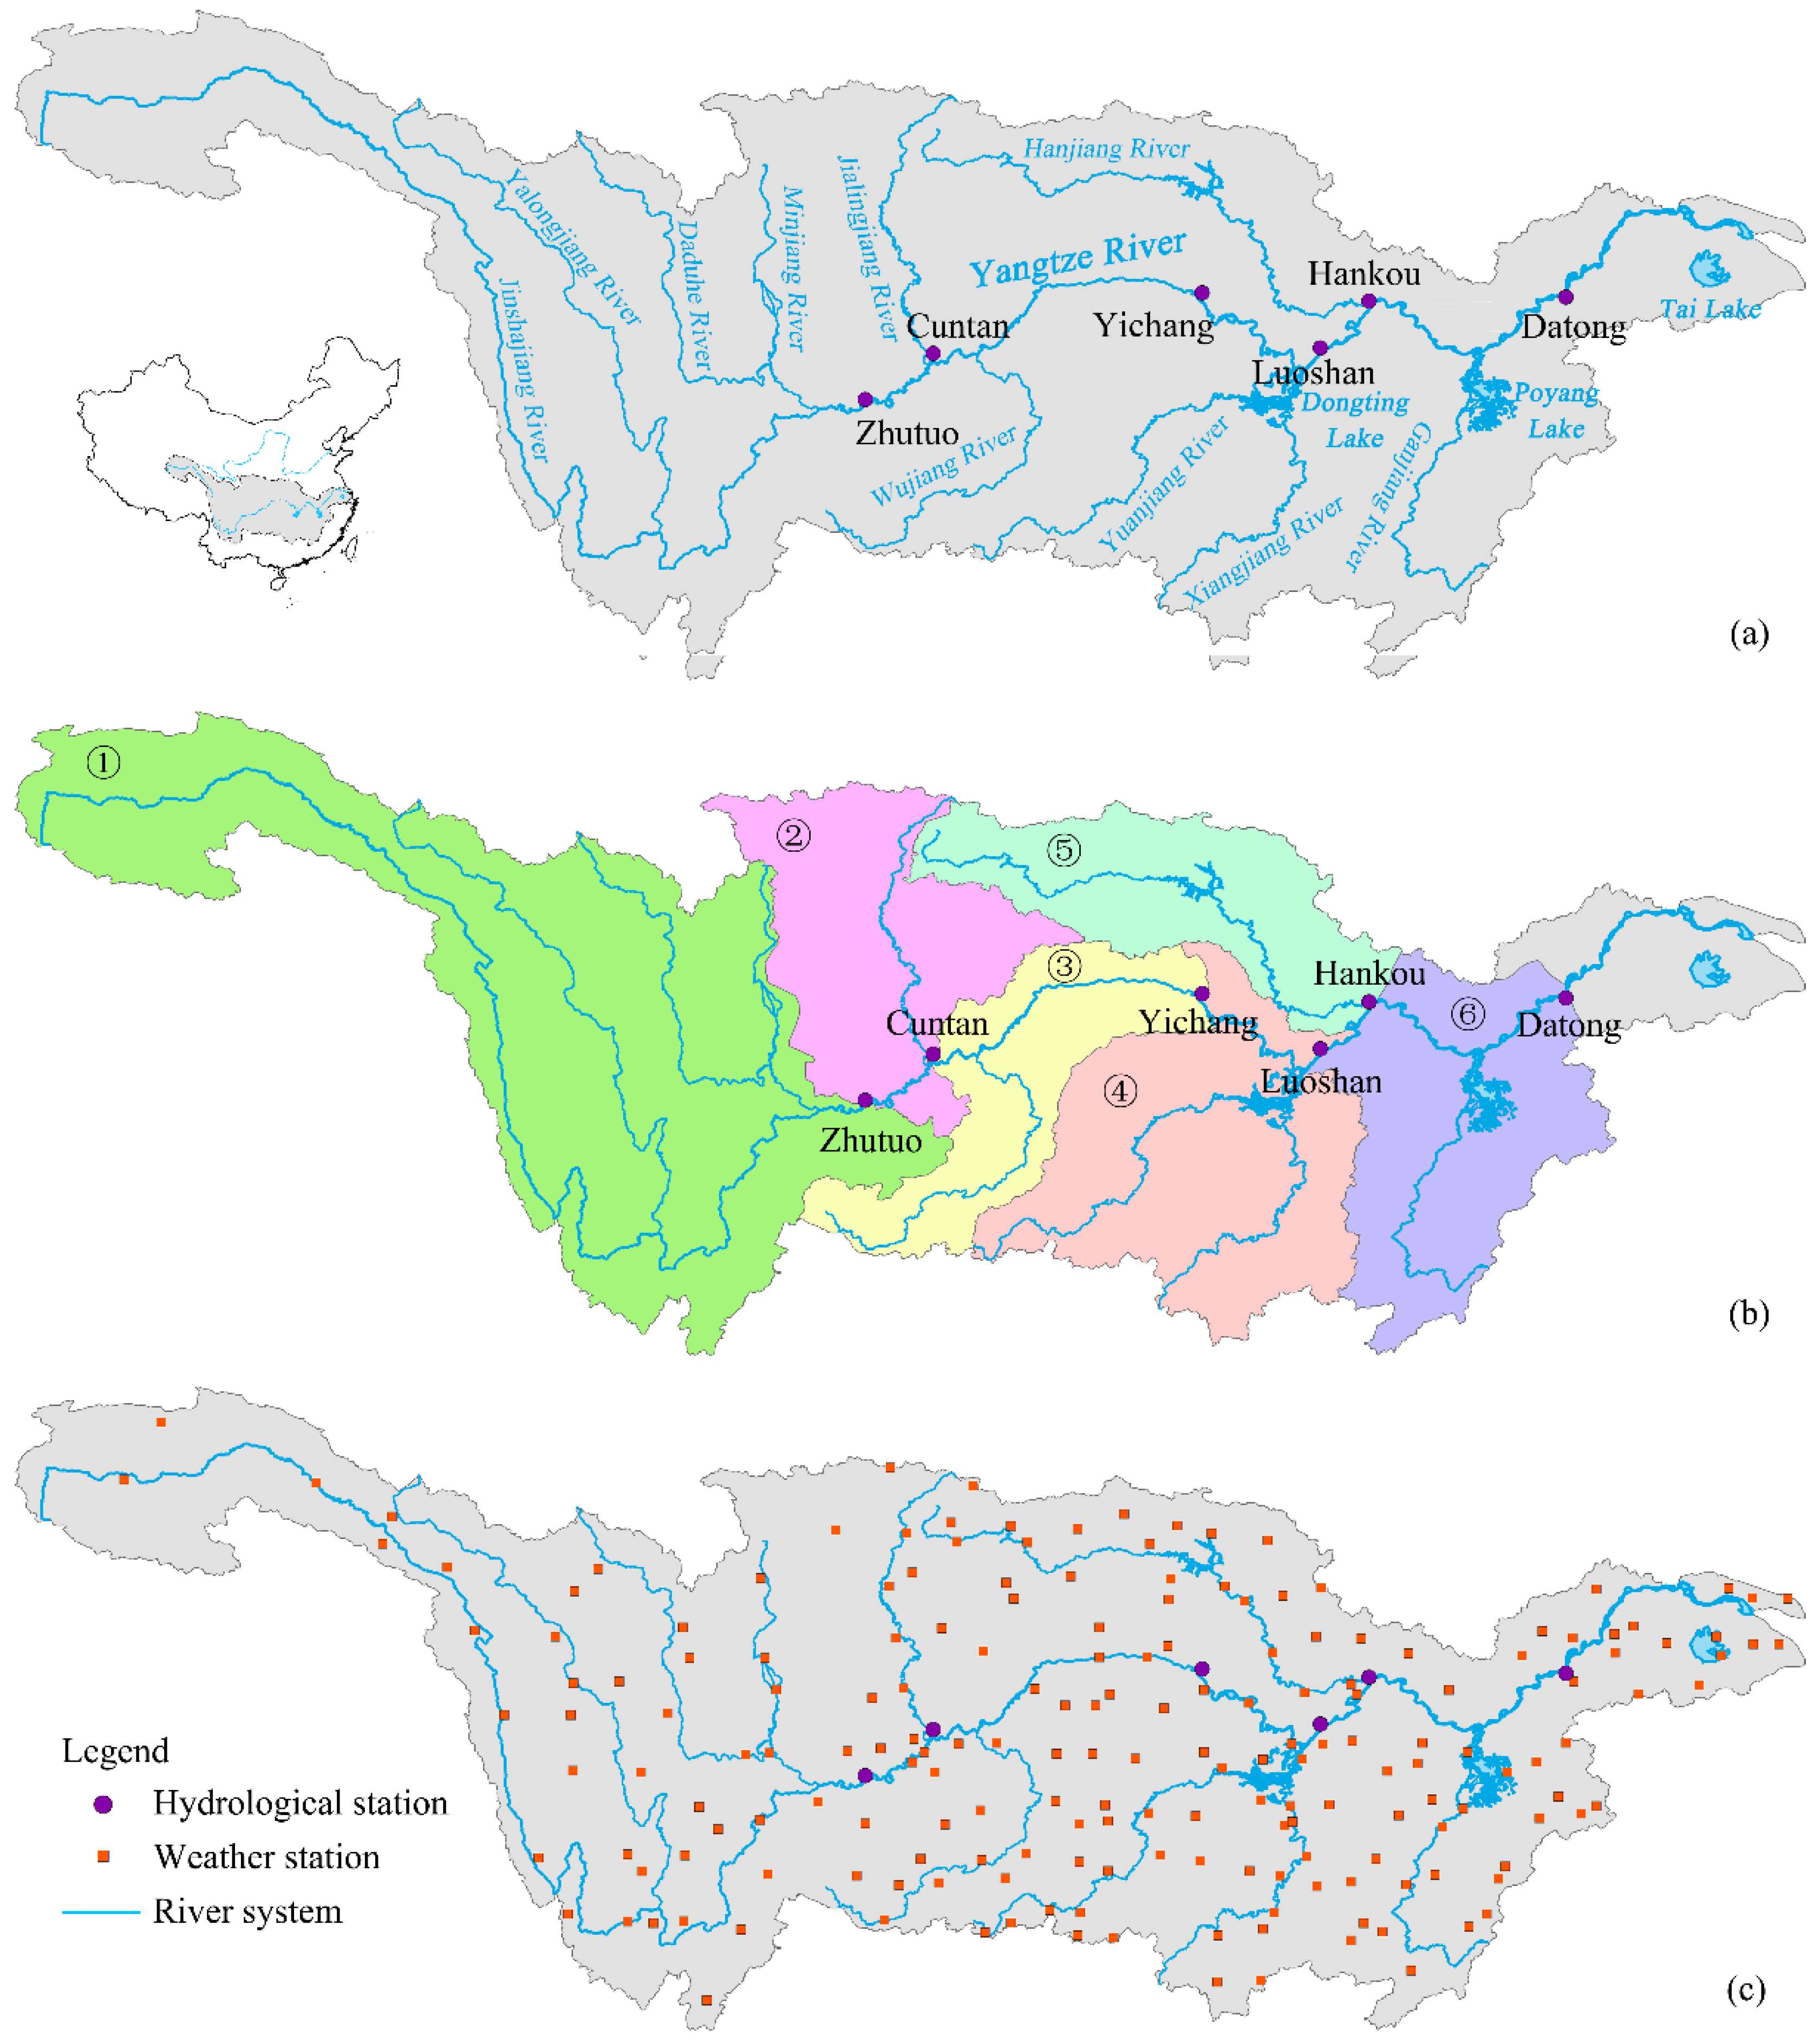
The Yangtze River, one of China’s longest and most important rivers, originates on the Tibetan Plateau and extends 6397 km eastward to the East China Sea. Its basin covers an area of 1.8 × 10⁶ km2 (9th in the world) and produces an annual sediment discharge of about 4.8 × 10⁸ t (5th in the world). As shown in Figure 1a, the main stream of the Yangtze River is separated by Yichang and Hukou hydrological stations into the upper, middle, and lower reaches with a length of 4504 km, 955 km, and 388 km, respectively [40]. The upper, middle, and lower basins account for 55%, 38%, and 7% of the total drainage area, respectively, and provide 50%, 30%, and 20% of total runoff, respectively [41]. Six major hydrological stations are Zhutuo, Cuntan, Yichang, Luoshan, Hankou, and Datong. Many tributaries and lakes in the Yangtze River Basin, including Jinshajiang River, Yalongjiang River, Minjiang River, Jialingjiang River, Hanjiang River, Dongting Lake, and Poyang Lake, contribute to the flow and sediment transport and add to the complexity of the Yangtze River system [33].
The daily discharge and sediment load at six hydrological stations are provided by the Ministry of Water Conservancy of China, covering 60 years from 1961 to 2020 for the stations on the main river. The bedload sediment is ignored due to the small proportion of the total sediment load [5,7], so the suspended sediment load represents the sediment load. The daily precipitation at 175 weather stations from 1961–2020 is provided by the Resource and Environment Data Cloud Platform (http://www.resdc.cn/UserReg.aspx) (accessed on 1 June 2021). Detailed data information of six hydrological stations is shown in Table 1. Data on soil and water conservation area, reservoir storage, and water consumption in the Yangtze River Basin are collected from Yang et al. [42] and Changjiang & Southwest Rivers Water Resources Bulletin (2006–2020).
In addition, the Yangtze River Basin is famous for its complex precipitation distributions. Precipitation increases along the mainstream, ranging from 400 mm in the western Tibet Plateau to 2500 mm in the east [43]. Due to the uneven distribution, the Yangtze River Basin is divided into six sub-regions, corresponding to six hydrological stations (Figure 1b). The drainage area of each hydrological station is shown in Table 1. Based on the weather stations in the upper sub-regions of each hydrological station (Figure 1c), precipitation is calculated for each station using the Thiessen polygon method.
3. Methods
3.1. Division of Periods
In this study, the trend changes of hydro-meteorological factors along the Yangtze River are determined by the Mann–Kendall test, which has been effectively used to analyze the variation trend and the abrupt points of the hydro-meteorological data [44]. In addition, these abrupt points in the trend can be used to delineate the natural and impacted periods [45].
For the Mann–Kendall test, the intersection of the sequential statistical curve UF and the reverse statistical curve UB is defined as the abrupt point by the previous studies [14]. Once this point is crossed, the time series trends will be changed significantly due to outside distractions. The first abrupt point is typically regarded as the boundary of the whole period. Thus, the whole period is separated into the quasi-natural period (before the first abrupt point) and the impacted period (after the first abrupt point). External distractions (such as human activities) can be ignored during the natural period due to their negligible effect on hydrological variables, including water flow and sediment load. In contrast, human activities significantly impact during the impacted period, leading to apparent changes in hydrological processes [45,46].
Reservoir operations significantly impact sediment load but have a negligible impact on annual runoff, especially those reservoirs that implement annual flow regulation rules [47]. For example, after the operation of the Three Gorges Project, the sediment load measured at Datong station was reduced by nearly half, compared to those before the operation in 2003, while flow discharge did not change much [48,49]. On the other hand, Zhao et al. [20] found no significant abrupt points in the runoff time series of stations in the Yangtze River. Thus, the abrupt points of sediment load are more reasonable to represent the effects of human activities, and thus that is used to separate the whole period [14].
3.2. Effects Assessment of Climate Change and Human Activities
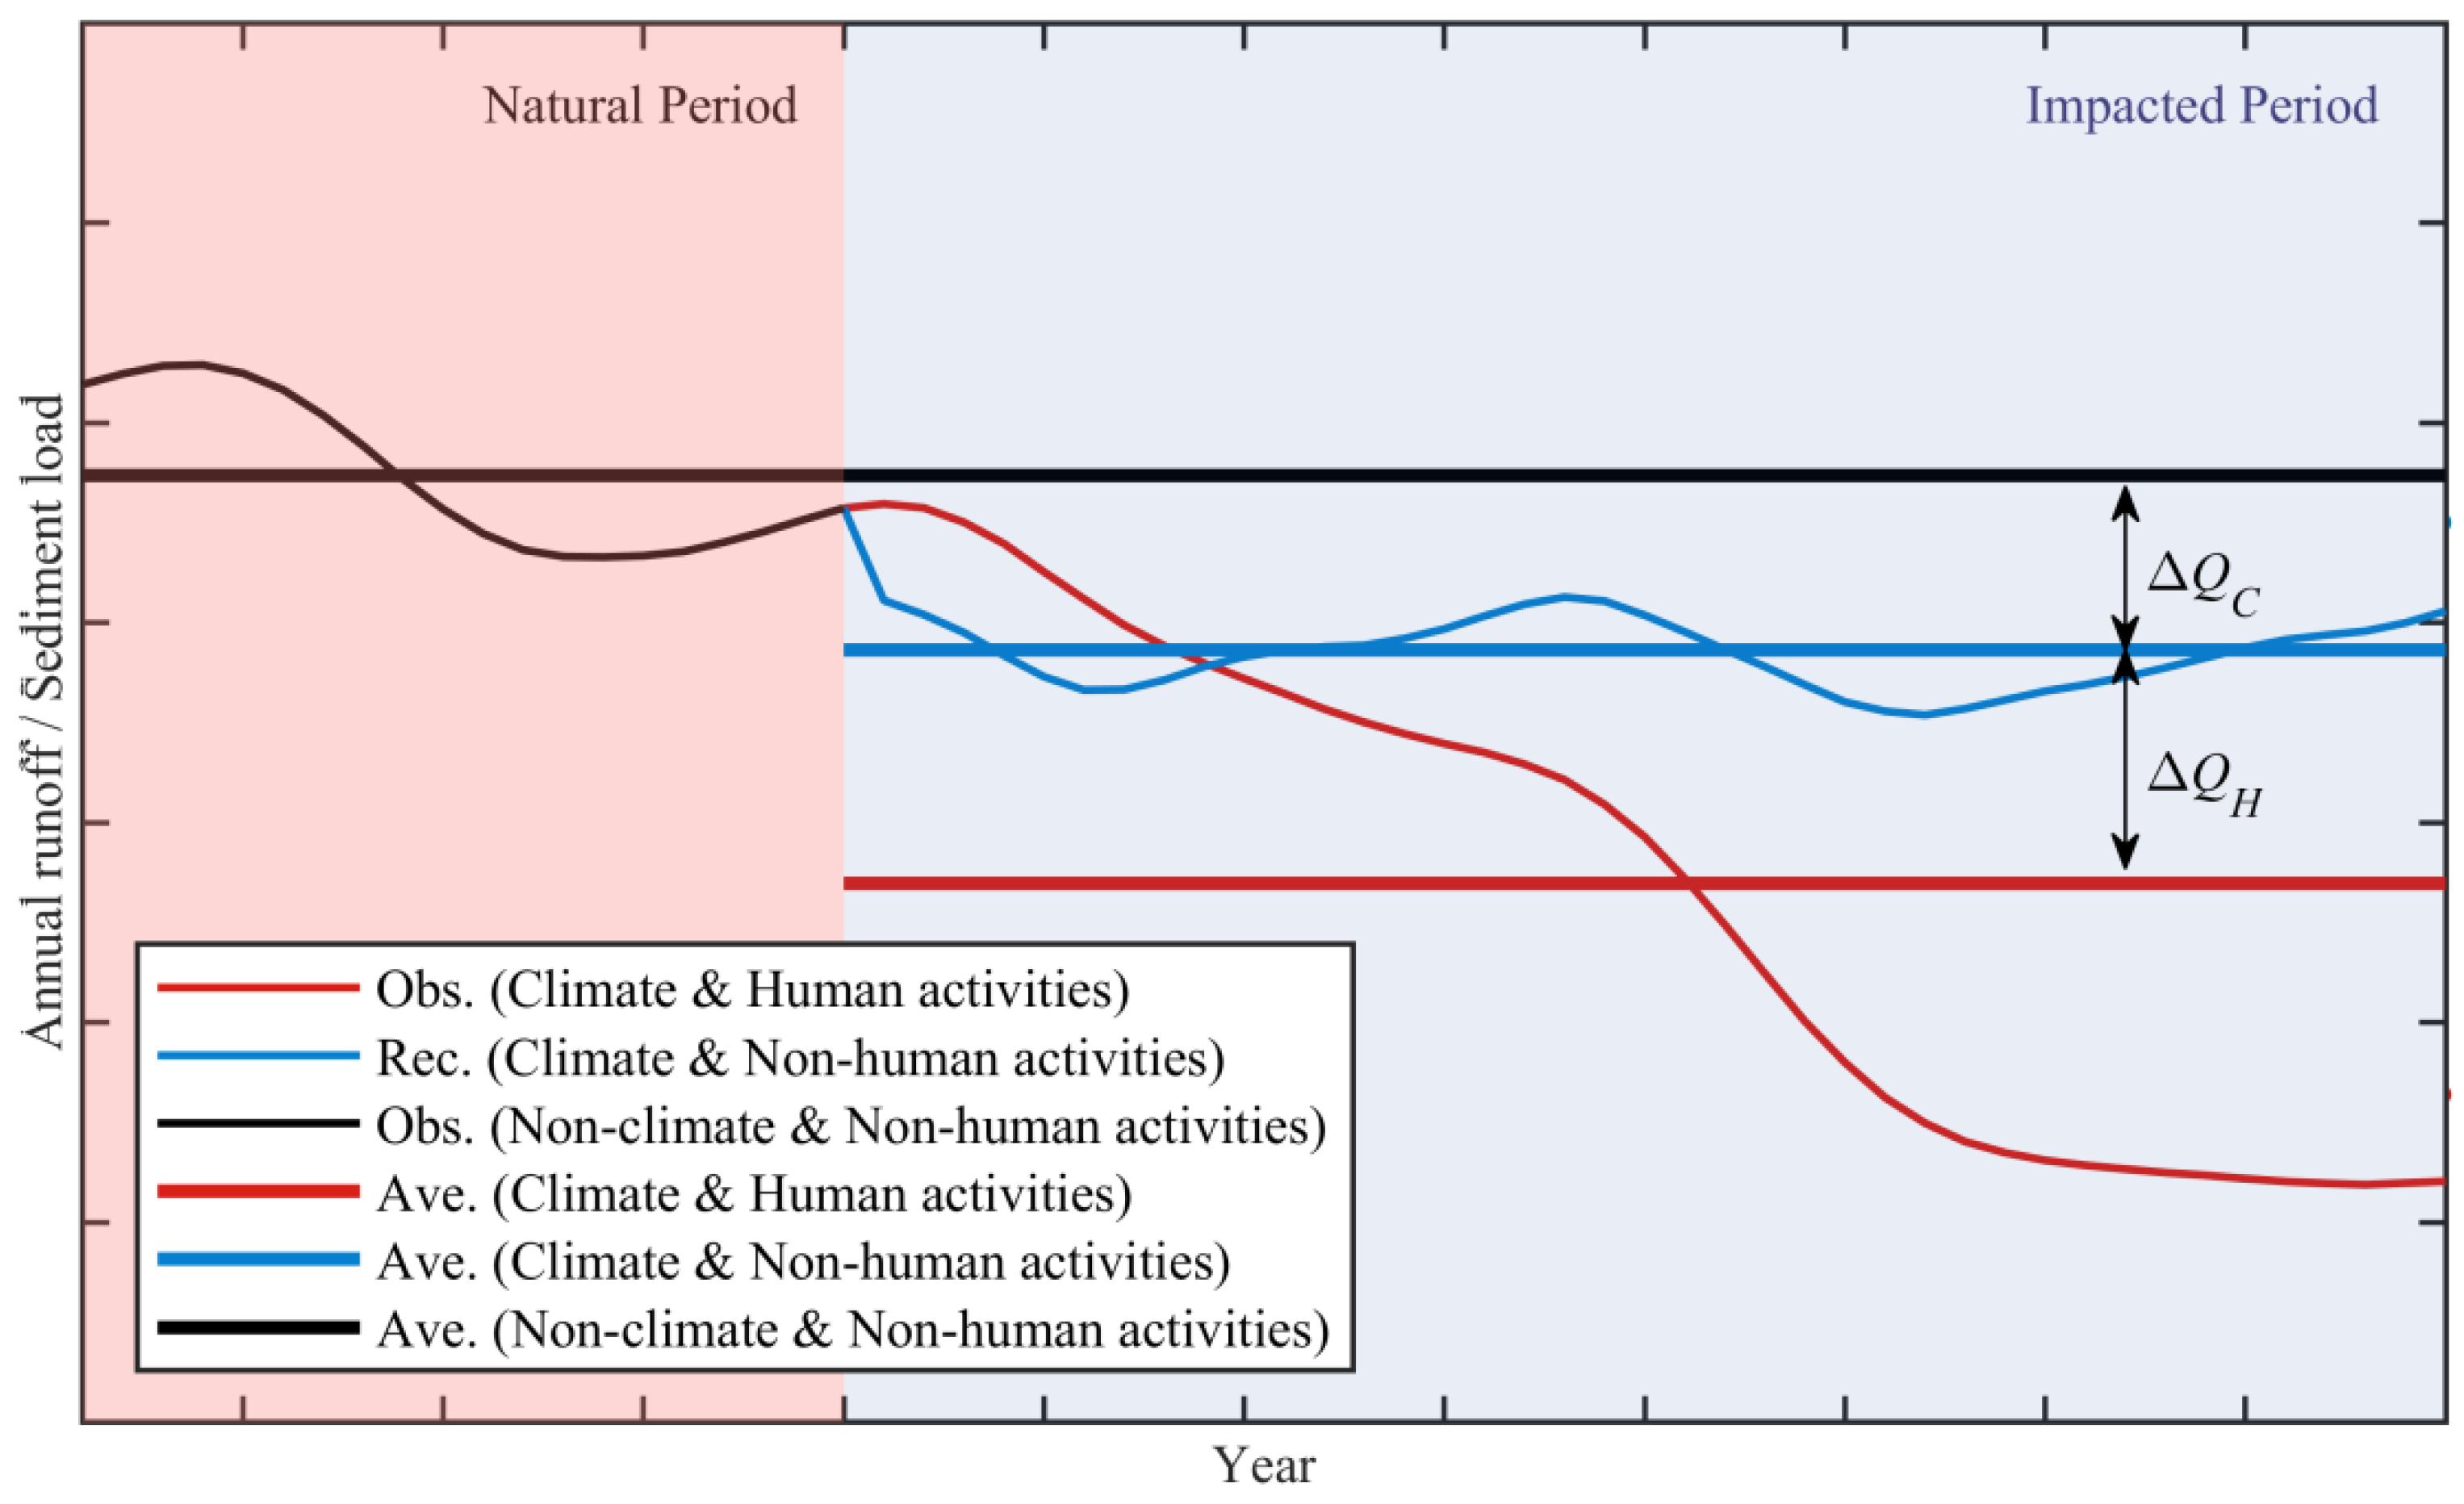
The multi-year average annual runoff during the natural and impacted periods are Qn and Qd, respectively. The changes in the annual runoff (ΔQ) in these two periods can be calculated by Equation (1), which is composed of the effects of climate change (ΔQc) and human activities (ΔQH), as shown in Figure 2.
The runoff variation is closely related to precipitation. The regression method uses precipitation and annual runoff data during the quasi-natural period to build a linear relationship. Then, the precipitation data during the impacted period is put into the regression equations. Thus, the annual runoff in response to climate change during the impacted period is reconstructed (Figure 2, blue lines). The reconstructed multi-year average annual runoff is defined as . Finally, and are estimated using Equations (2) and (3), respectively, which can evaluate the effects of human activities and climate changes on the variation of annual runoff.
The evaluation of the effects of climatic and anthropic factors on the changes in sediment load is similar to the annual runoff calculation. Runoff is the driving force for sediment transport; thus, they usually have a good relationship during the natural period. During the natural period, the annual observational runoff and the observational sediment load are used to build a relationship using the regression method. The current research used the annual observational runoff during the impacted period (red points in Figure 2) affected by human activities to simulate the sediment load, which might underestimate human contribution to sediment load changes [42]. During the impacted period, the changes in runoff should be regarded as the effects of climate change and human activities. The reconstructed runoff during the impacted period (blue points in Figure 2) affected by climate changes is put into the regression equations during the natural period to simulate the sediment load. The sediment load in response to climate change can also be reconstructed.
3.3. Error Assessment of Regression-Based Predictions
Regression analysis is performed between runoff, sediment load, and precipitation to reconstruct the annual runoff and sediment load. The difference between the reconstructed and observed data in each period represents different driving factors, including climate change and human activities. Here, the p-value is introduced to evaluate the regression model’s reliability. If p-value is smaller than 0.05, the regression model is significant for regression analysis. Only estimating the p-values cannot fully account for the accuracy of regression analysis. The correlation coefficient R2 is also used as a statistical indicator of the relationship between two variables.
However, if the p-value is small and the correlation coefficient R2 is relatively low, the model fitting degree would be poor. Then, the relationship between independent and dependent variables should be carefully explained. The model’s accuracy can be explained appropriately when the p-value and R2 are evaluated. Thus, we further estimate the errors for regression-based prediction.
where n is the number of data points, i is the order of the data, S is the predicted value using the regression equation, and O is the measured value. The standard deviation (Sd) has been widely used to represent the errors of regression-based predictions [42].
4. Results
4.1. Periods Division by Abrupt Change Points
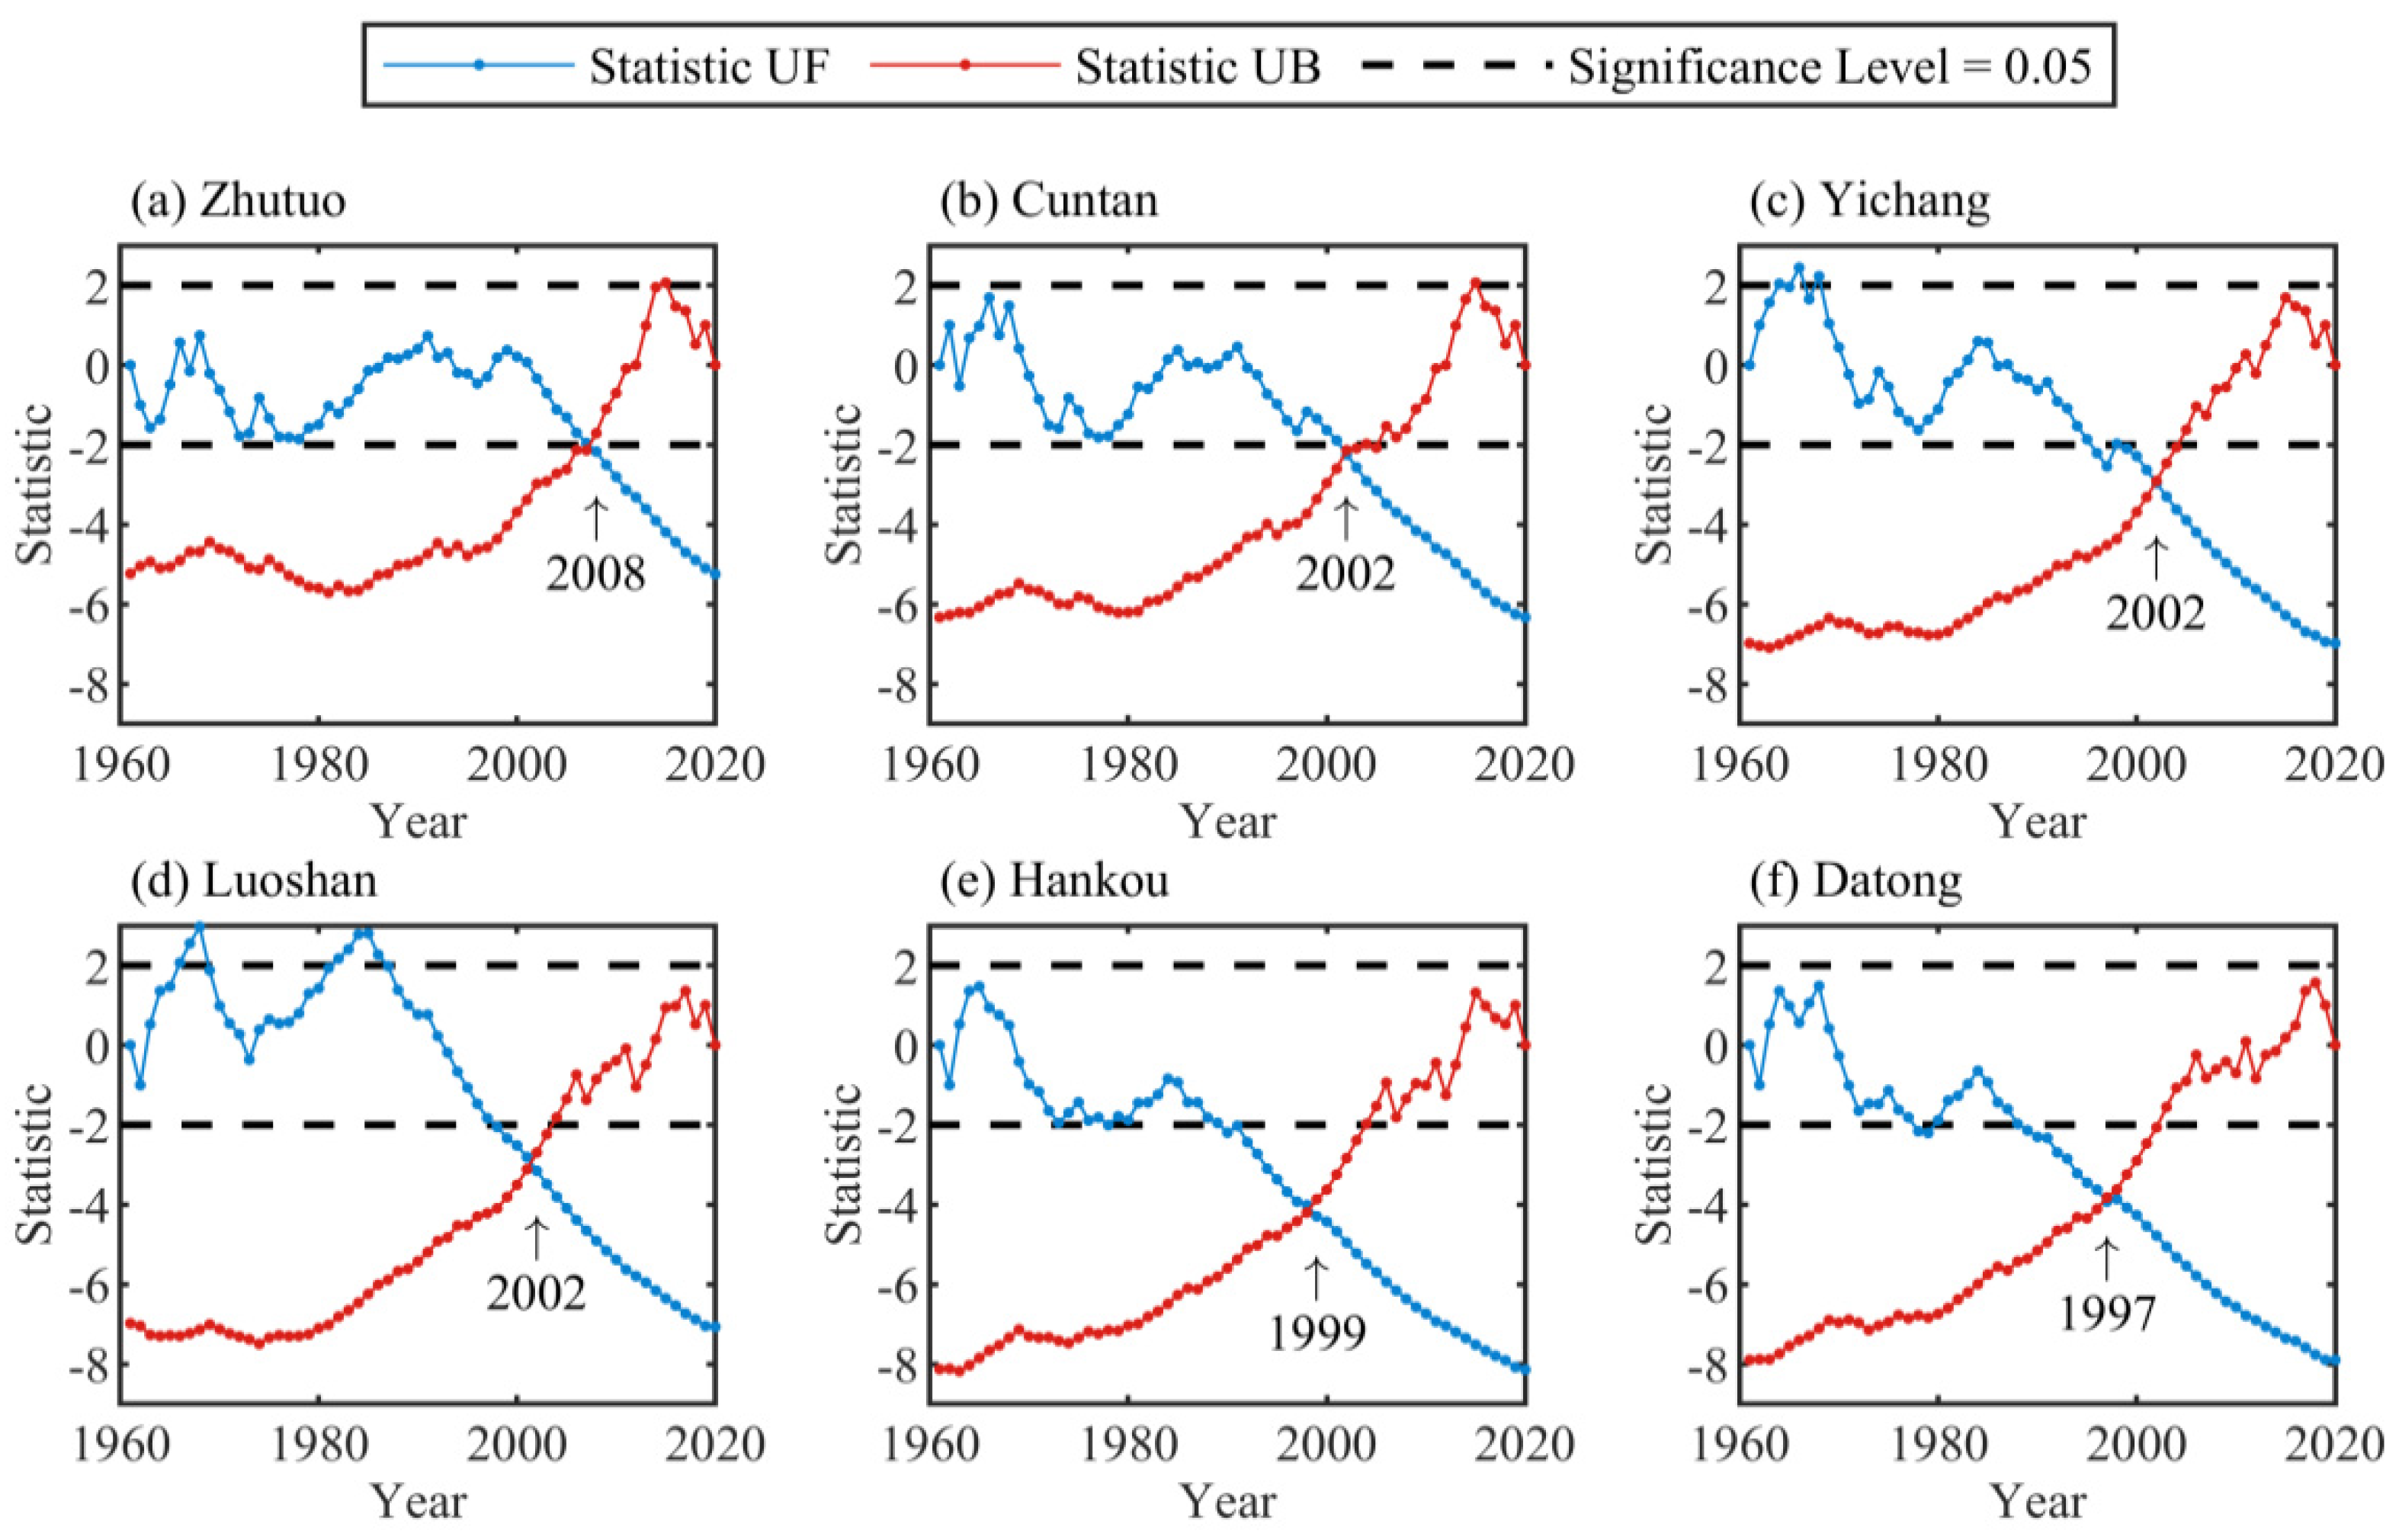
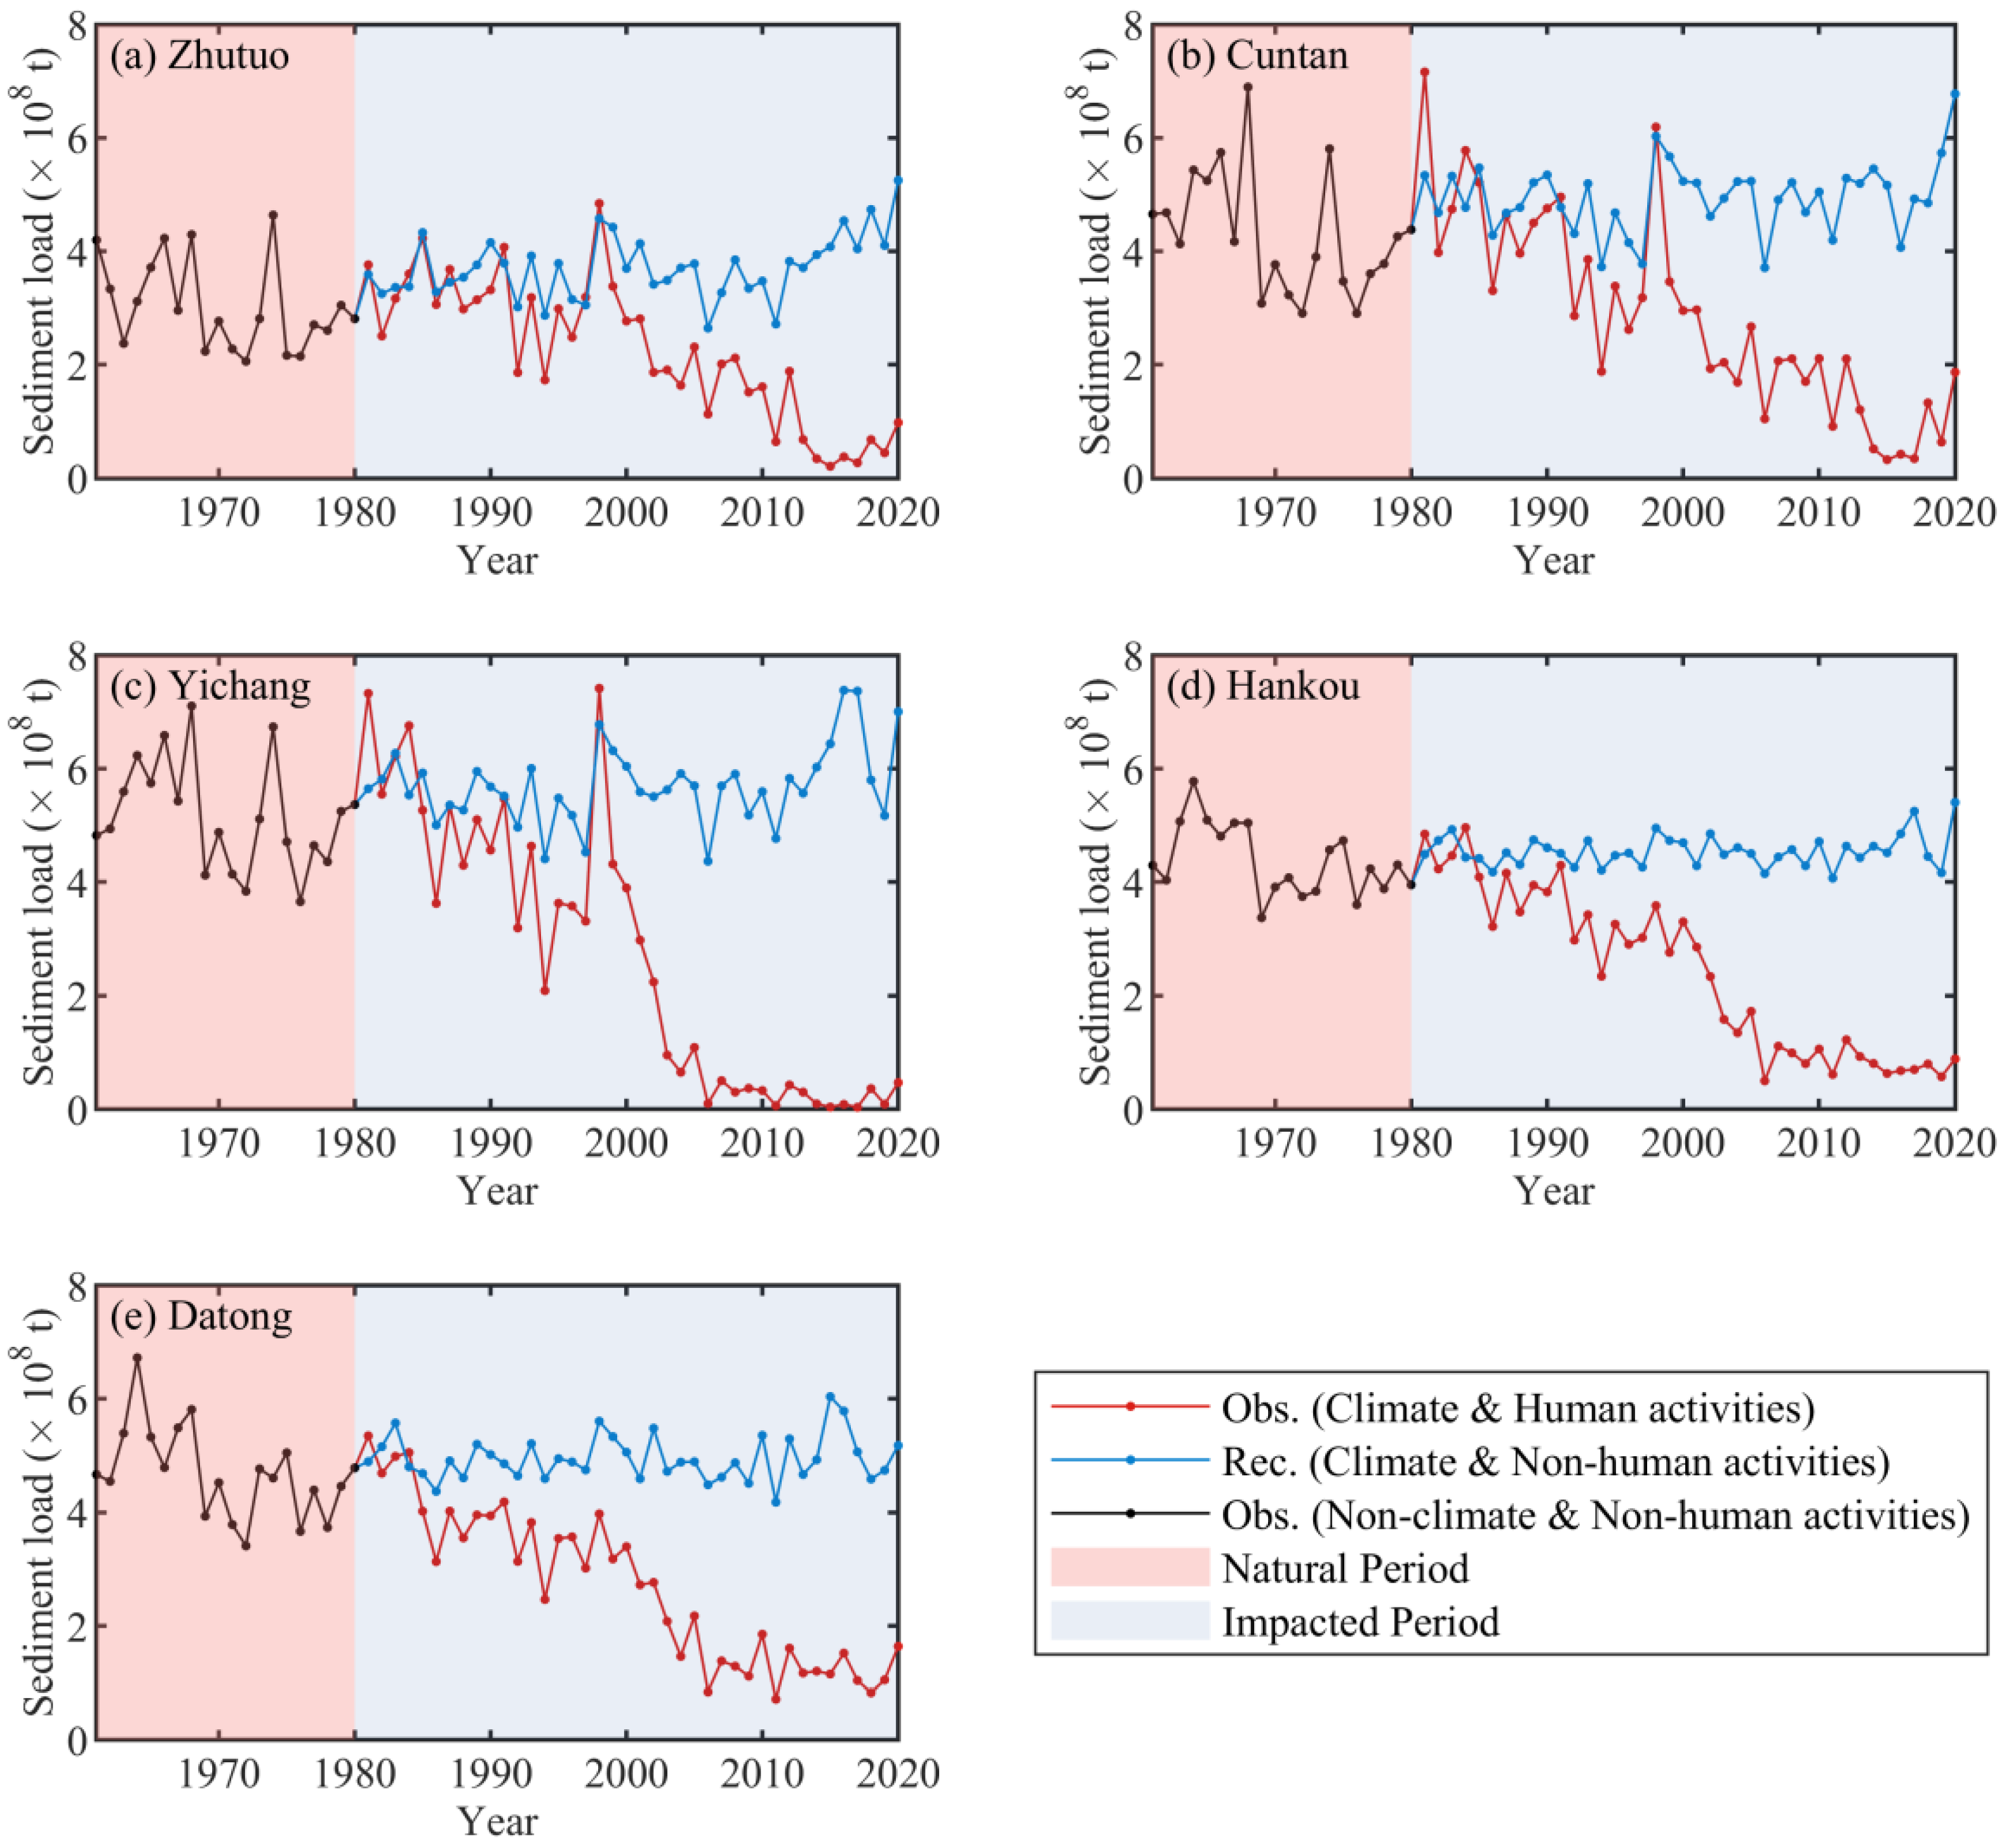
The results of the Mann–Kendall test of the sediment load at six stations in the Yangtze River are shown in Figure 3. There are significant abrupt changes in sediment loads at six stations along the mainstream. At a significance level of 0.05, these changes occurred in the late 1990s for the entire Yangtze River basin. Using 1990 as the abrupt point is not appropriate, despite it being the earliest time point in the Mann–Kendall test. Prior to this time, there were two human activities that would have had a significant impact on sediment transport processes: the operation of the first Gezhouba Dam on the Yangtze River mainstream in 1981 and the first key national soil and water conservation projects in 1983 [50]. Li et al. [51] found that the first sediment load abrupt point at Chenglingji station is 1980. Thus, the year 1980 is more reasonable and representative to be the boundary of the whole period. Finally, the period from 1961–1980 (or 1981–2020) is considered natural (or impacted). The impacted period is further separated into 1981–2000 and 2001–2020 for a more detailed analysis due to the stronger human activities.
During the natural period, the sediment load (runoff) in the years 1961 and 1980 are 4.66 × 10⁸ t (8923 × 108 m3) and 4.78 × 10⁸ t (9962 × 108 m3), respectively. In contrast, the sediment load and runoff in 2020 (impacted period) are 4.66 × 10⁸ t and 11,180 × 108 m3, respectively. These results suggest that climate change and human activities have significantly different effects on runoff and sediment loads in the Yangtze River basin over different periods, with sediment loads being reduced more significantly than runoff [14,20].
4.2. Changes in Annual Precipitation, Runoff, and Sediment Load
4.2.1. Variation Trend of Precipitation
As shown in Figure 4, precipitation at six hydrological stations in the Yangtze River Basin shows an increasing trend from 1961 to 2020. The basin-wide average annual precipitation from 1961–2020 was 1114 mm, ranging from 682 mm to 1267 mm, which is in general agreement with Dai et al. [7]. According to the linear regression, the annual precipitation in the Yangtze River basin showed a slight statistical upward trend (Figure 4). The average annual rate of increase in precipitation was 1.575 mm·yr−1, which may potentially affect the runoff and sediment load.
The rainfall varies slightly in impacted period. As shown in Table 2, during the period 1981–2020, the values of six hydrological stations increased, compared to the natural period. Among them, there is not much difference between the increase in 1980–2000 and 2001–2020. In terms of climate change, the rising precipitation would promote the increase in runoff in the Yangtze River basin.
4.2.2. Variation Trend of Runoff and Sediment Load
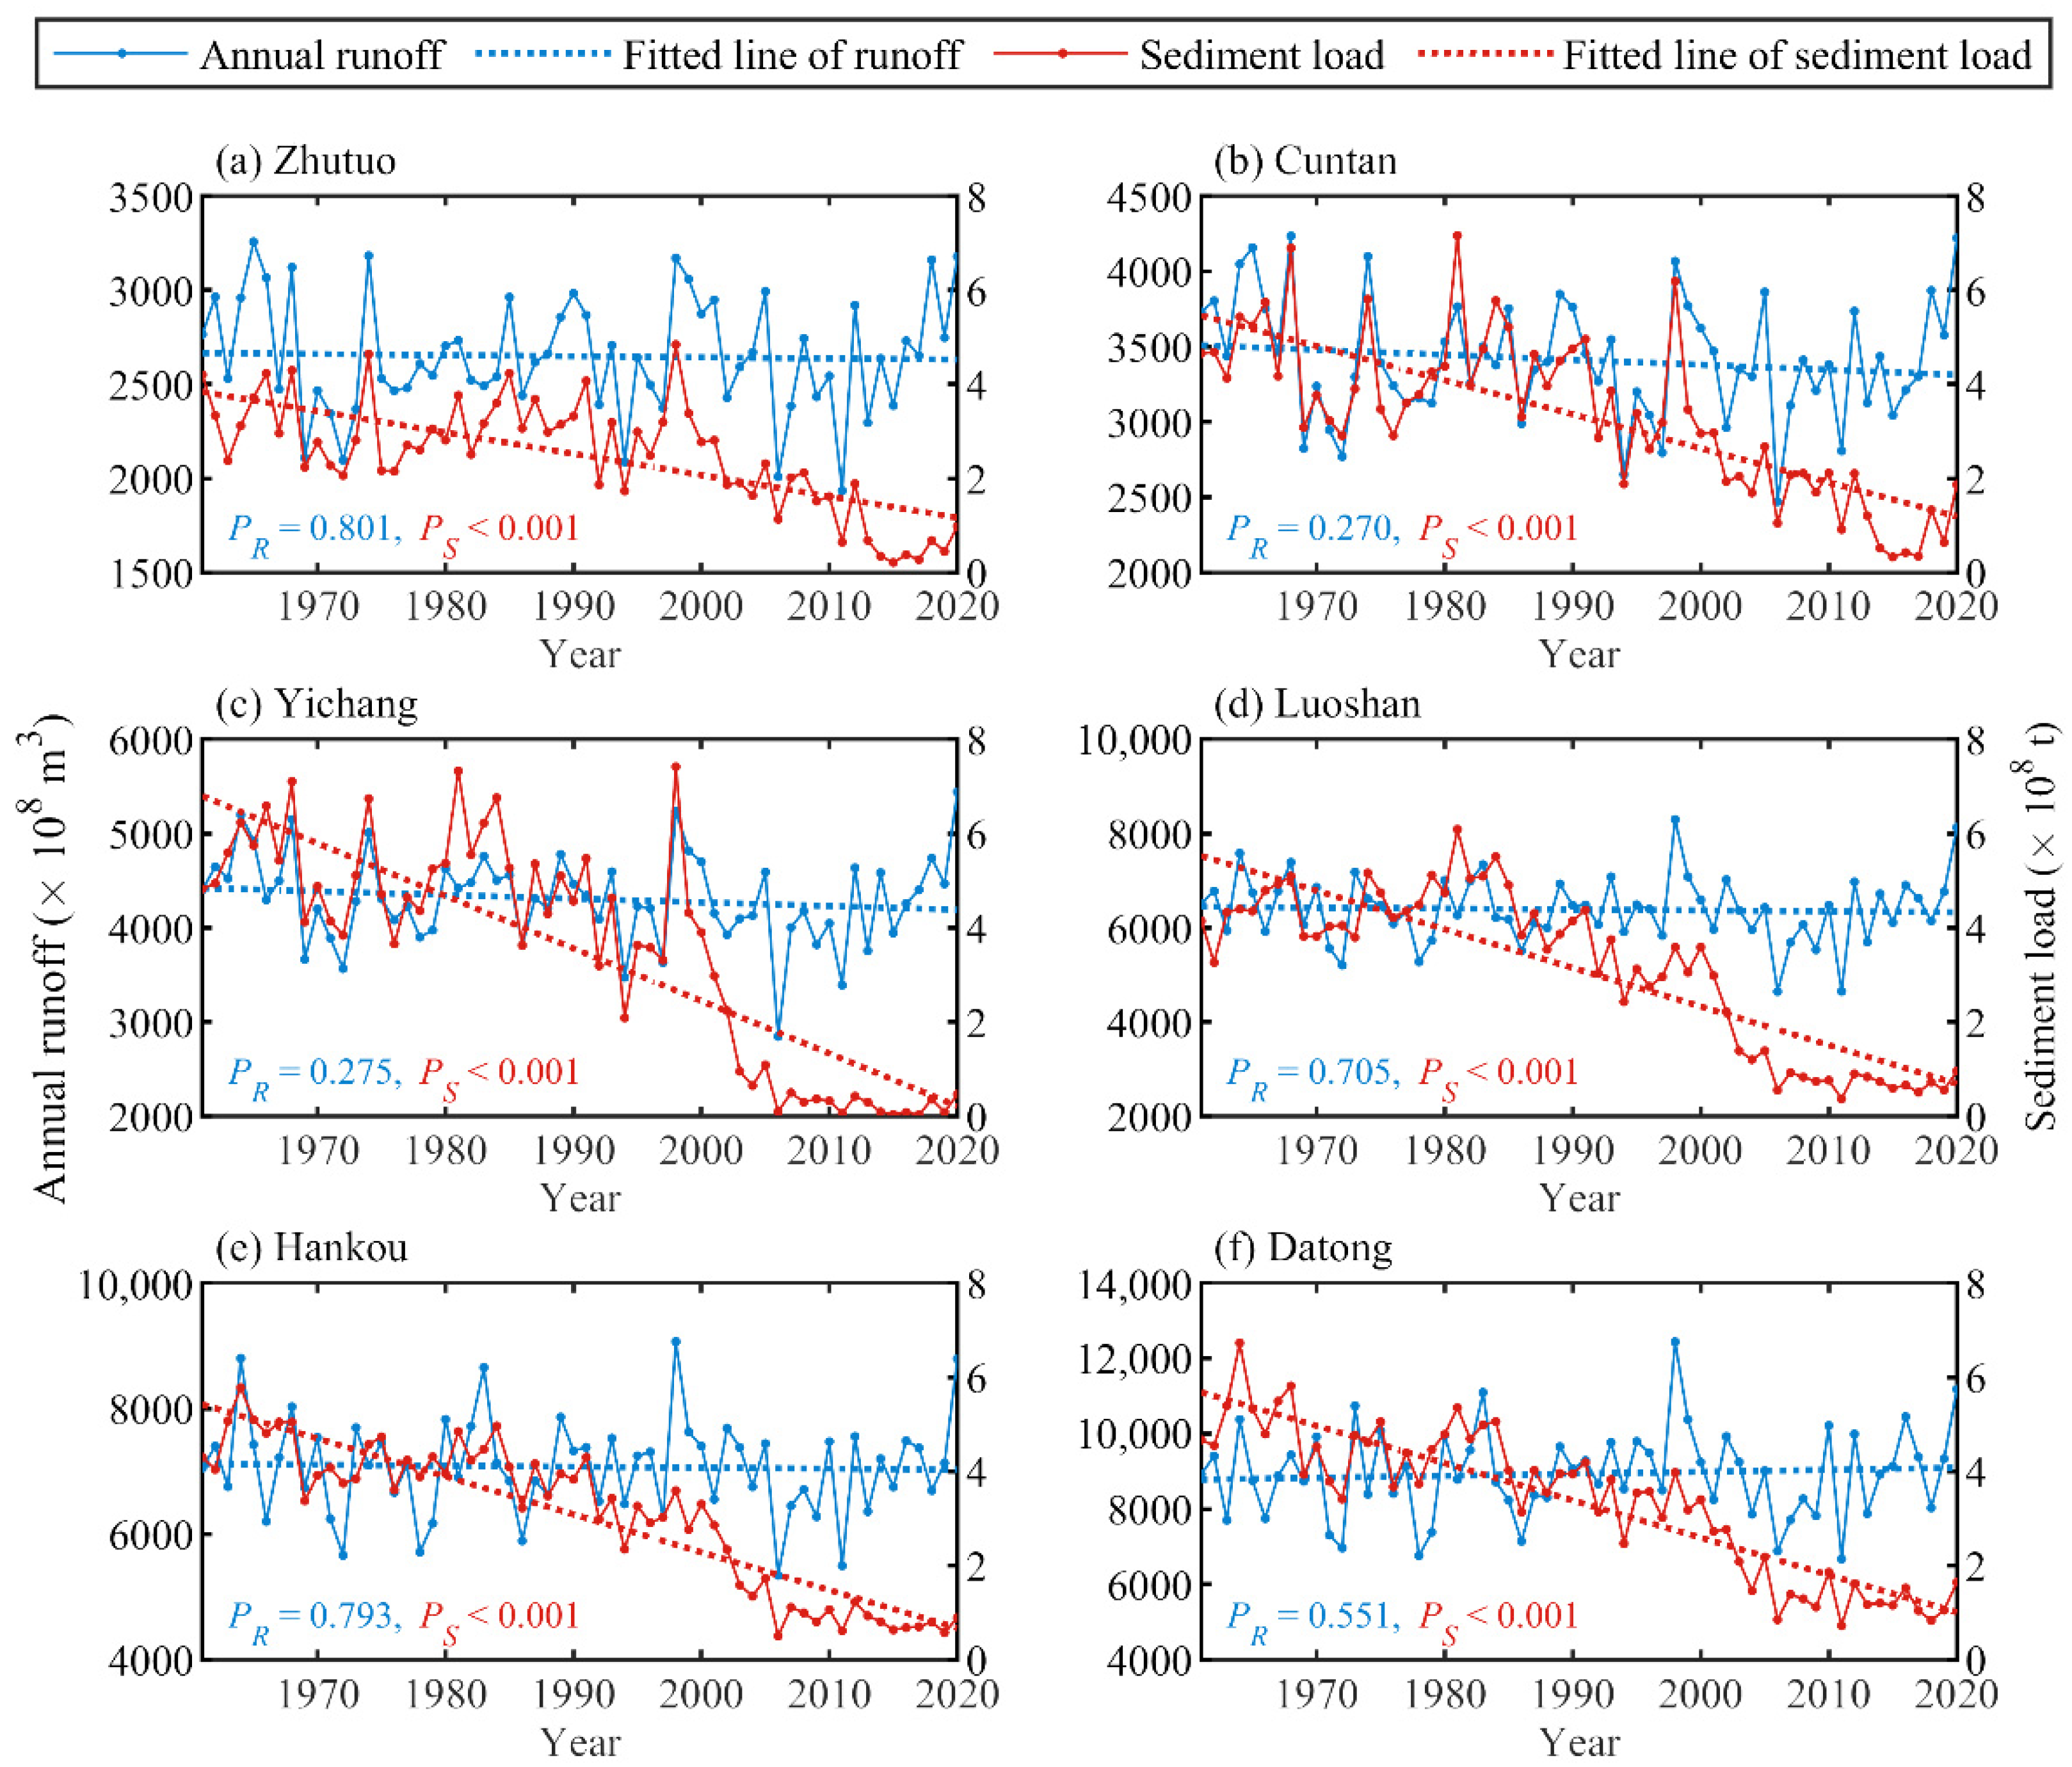
With the intensifying human activities and changes in the climate, the runoff and the sediment load in the Yangtze River Basin have changed significantly. Figure 5 illustrates the trend analysis based on linear regressions for runoff and sediment load at the six stations from 1961 to 2020. The annual runoff at Datong station shows an increasing trend from 1961 to 2020. In contrast, the other five hydrological stations show slightly decreasing values. The sediment load at five hydrological stations shows a sharp falling trend, especially since 1980. The sediment load and the annual runoff have a similar variation trend during the natural period (before the 1980s), while, due to the effects of human activities, the variation trends are different during the impacted period. The water discharge was consistent with the precipitation during different decades (Table 2).
Table 3 lists the changes in multi-year average annual runoff and sediment load during the impacted period, compared to the natural period. The runoff increases during 1981–2000 except at Cuntan station, while that reduces significantly during 2001–2020 except at Datong station. During the whole period, the runoff reduces in the mainstream except at Hankou and Datong stations, and the decreased percentages vary from 0.2% at Zhutuo station to 2.5% at Cuntan station. The multi-year average sediment load decreases in the mainstream, except at Zhutuo station during 1981–2000, and the sediment load reduces noticeably at six hydrological stations during 2001–2020. The reduced percentages vary from 26% at Zhutuo station to 48% at Yichang station during the whole period.
4.2.3. Relationships among Runoff, Sediment Load, and Precipitation
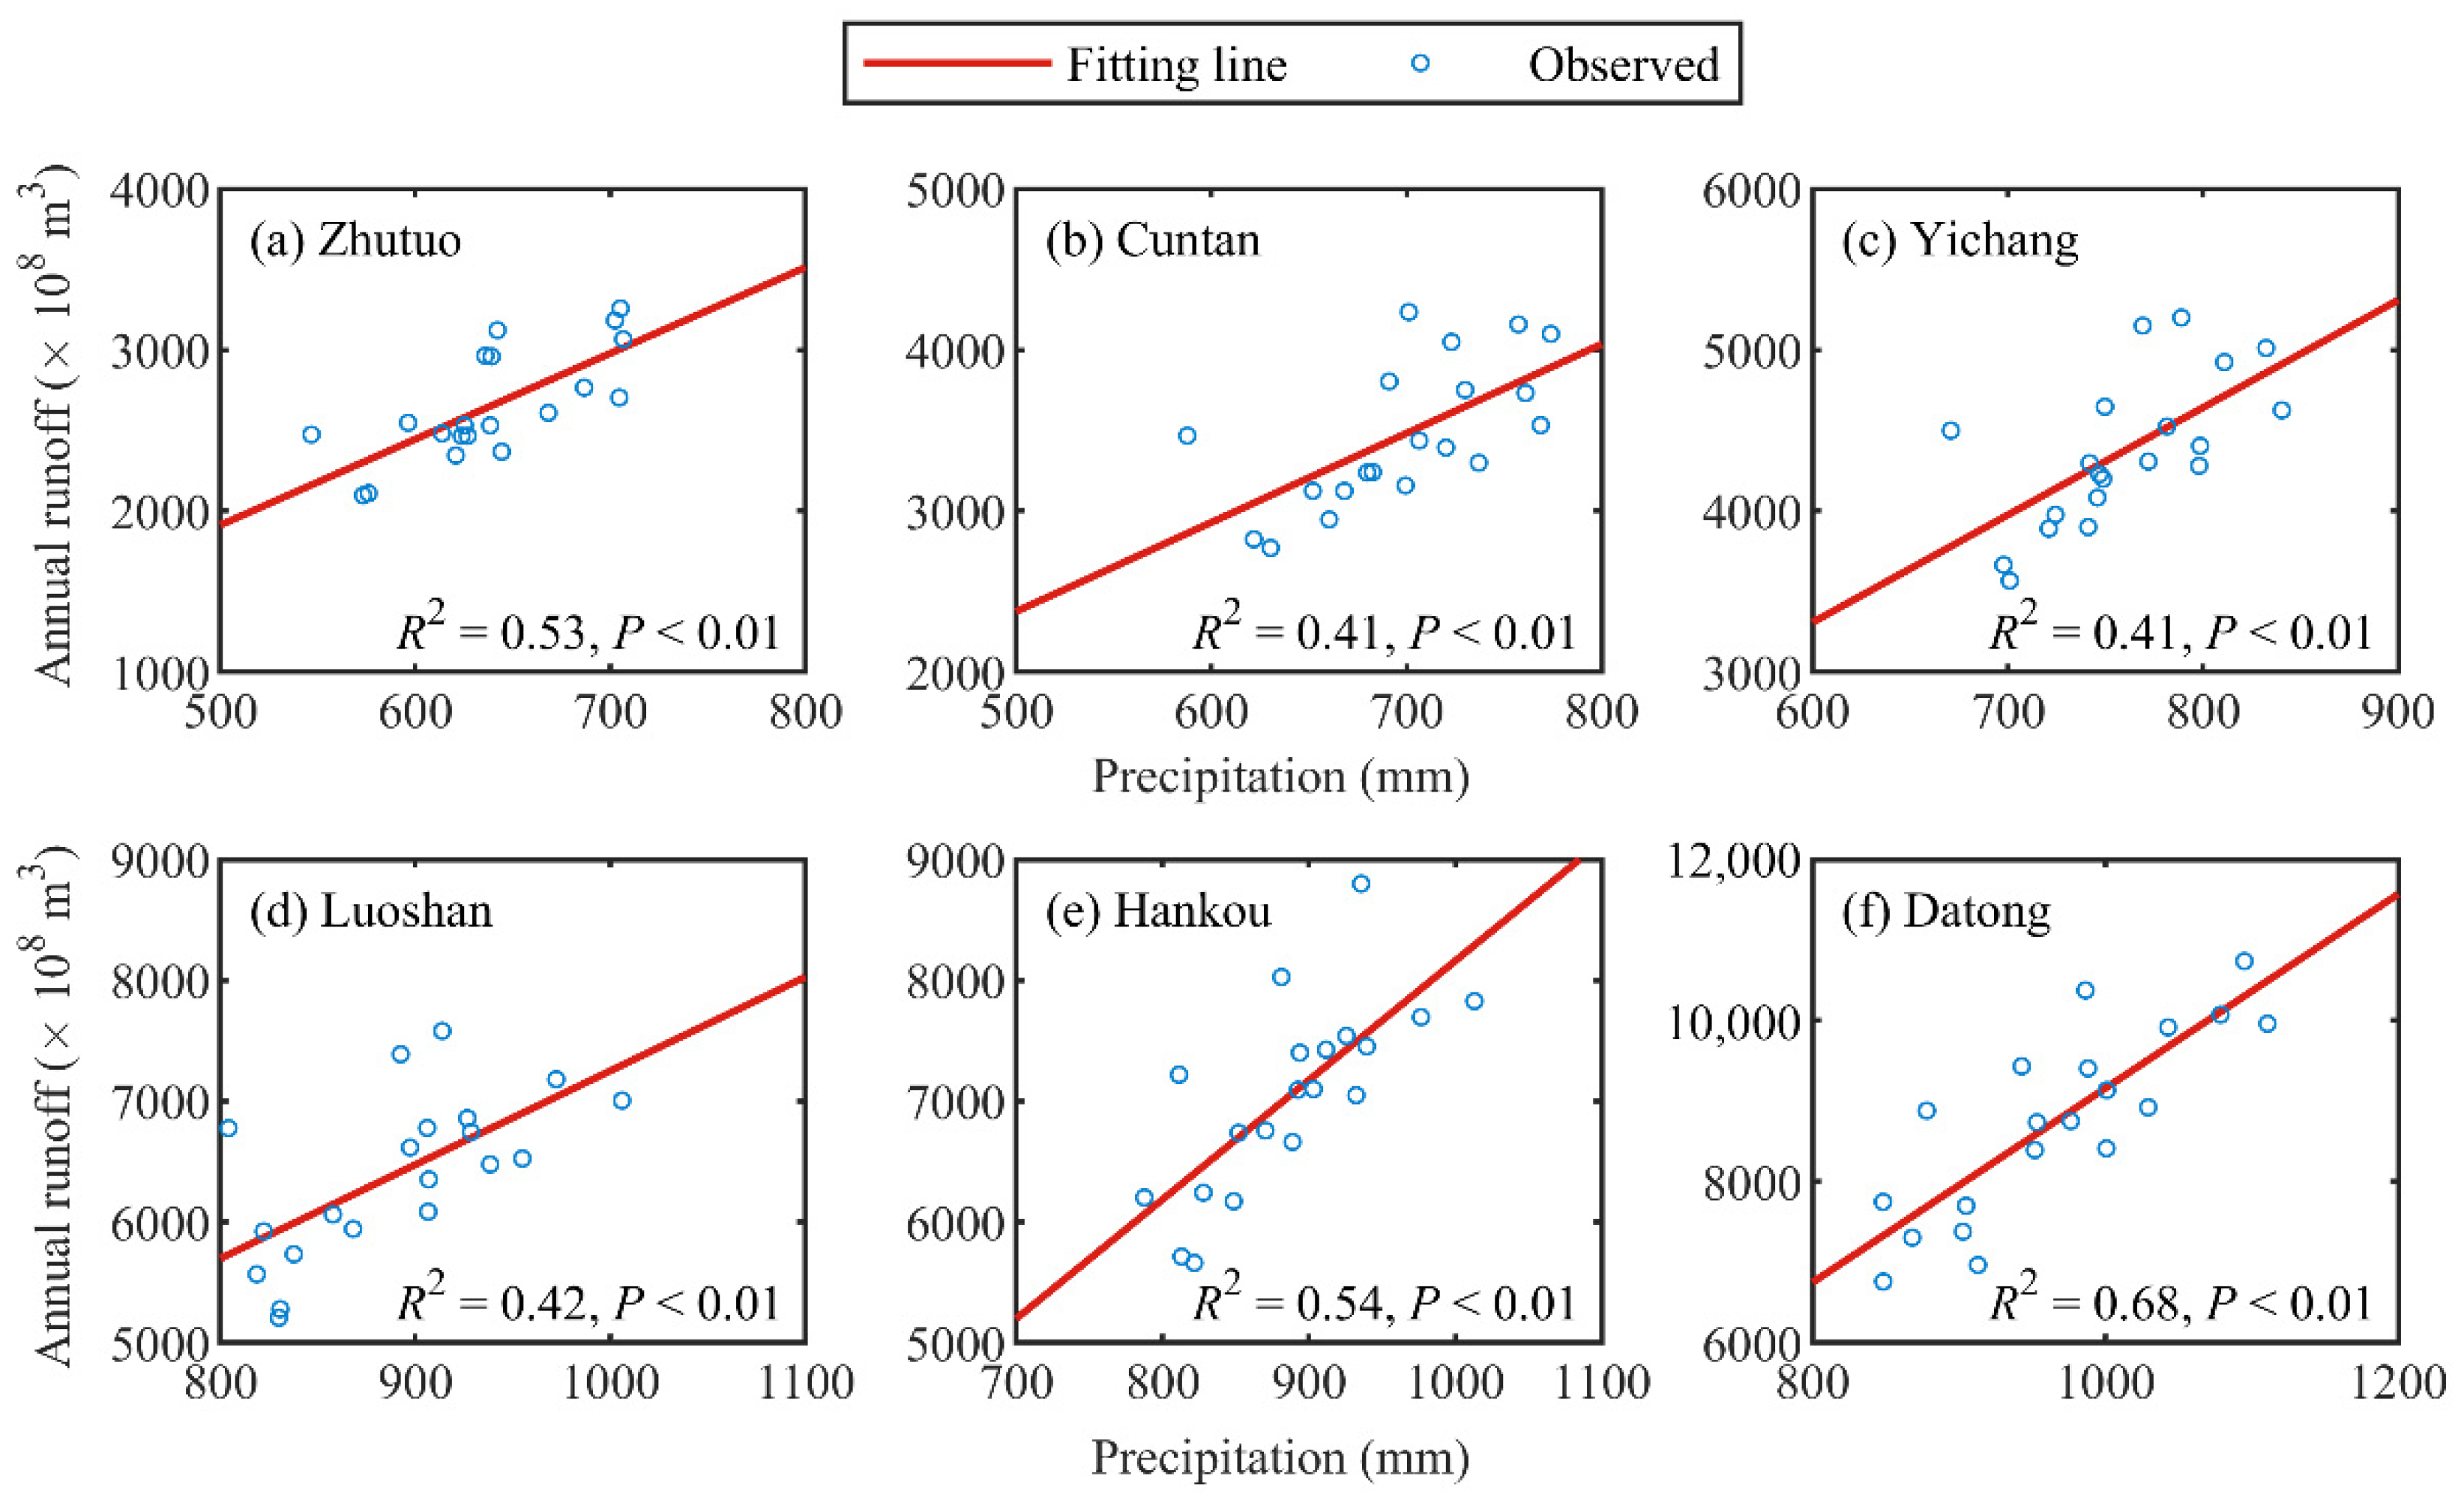
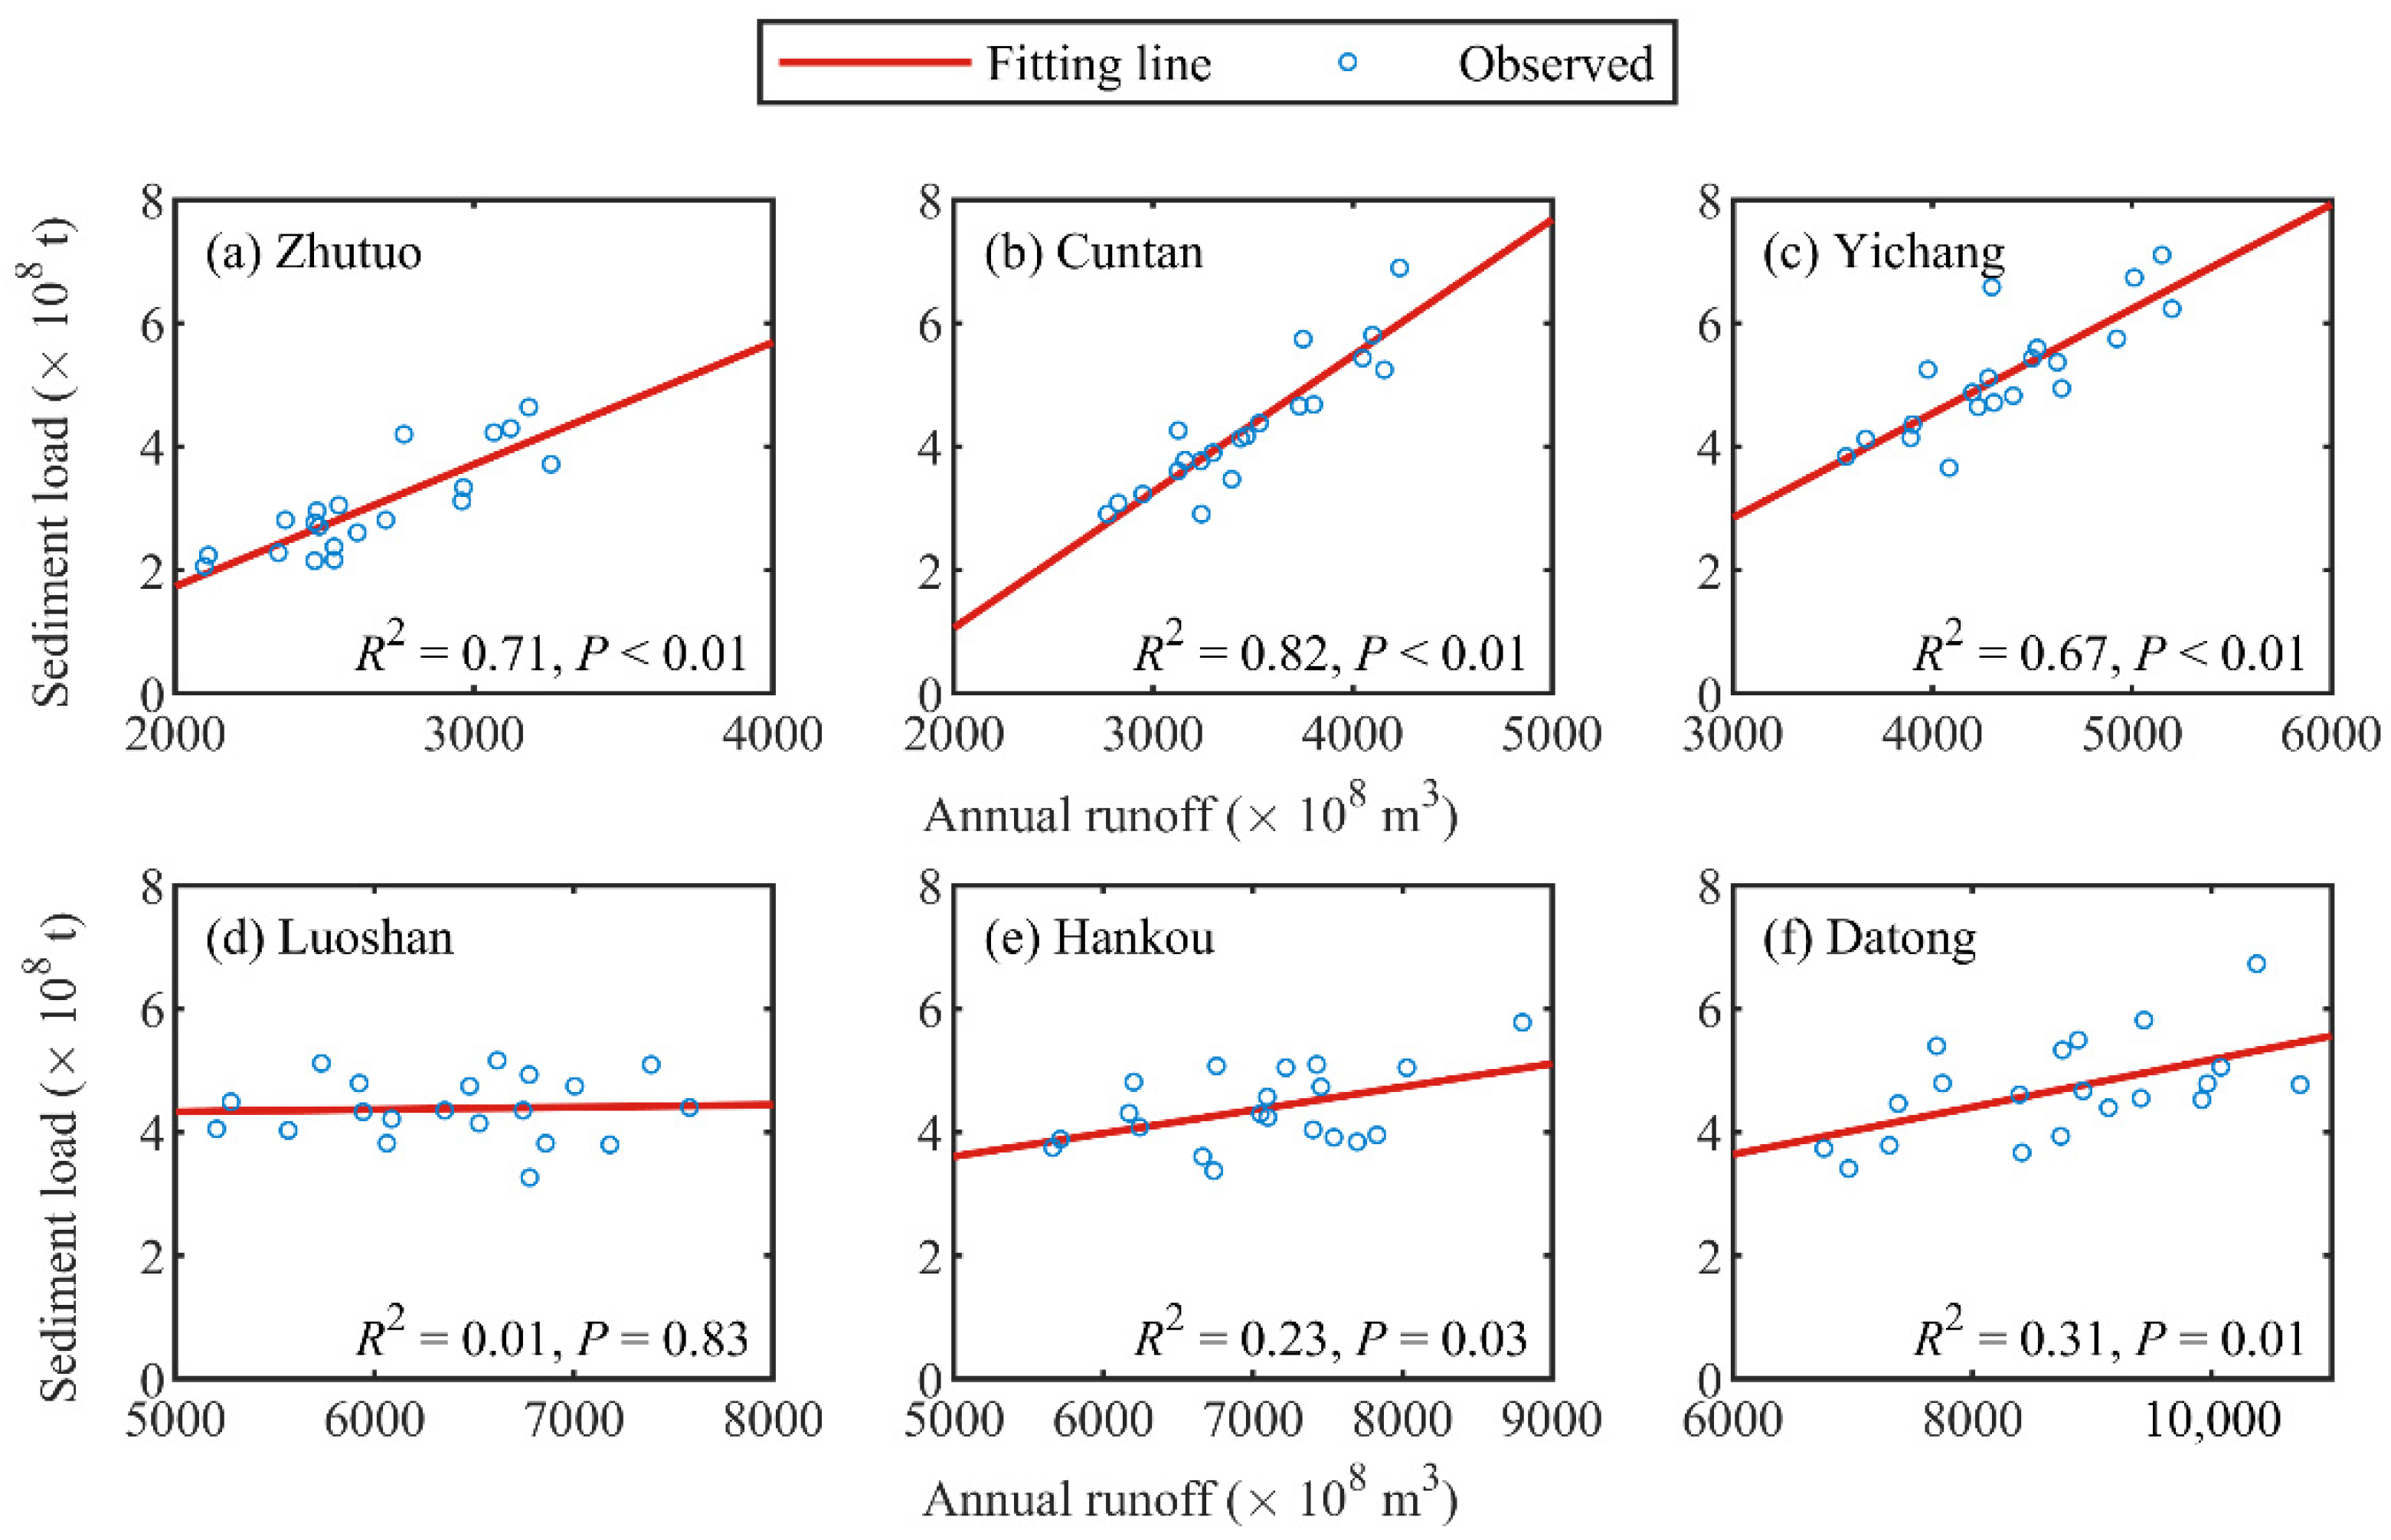
The relationships between annual runoff and precipitation, as well as between sediment load and annual runoff during the natural period, are established by linear regression methods to reconstruct the annual runoff and sediment load response to climate change during the impacted period. Figure 6 and Figure 7 show regression analysis results of annual runoff and sediment discharge at six hydrological stations.
The correlations between annual runoff and precipitation are significantly over the 99% confidence level. From Zhutuo to Yichang stations, the relationships between annual runoff and sediment load are excellent, with a confidence level of over 99%. The correlations at Hankou and Datong stations are significant, with over 95% confidence. It should be noted that the water and sediment interactions between the Poyang Lake and the mainstream of the Yangtze River have led to poor relations between sediment load and runoff at Luoshan stations (low correlations in Figure 6 and Figure 7). Therefore, the Luoshan station is excluded when estimating the effects of climate and human factors on runoff and sediment transport [31]. High correlations between annual runoff and precipitation, as well as between sediment load and annual runoff mean that precipitation directly affects runoff and then affects sediment load during the natural period. Annual runoff has a positive correlation with precipitation and sediment load, respectively, which means that the rising precipitation can increase the runoff, and then increase sediment load.
Table 4 lists the regression equations and the annual runoff and precipitation coefficients, sediment load, and annual runoff. The coefficients represent the influence of precipitation on annual runoff and sediment load. The coefficients of precipitation show an increasing trend along the mainstream, which means that the effects of precipitation on the runoff increase. In contrast, taking the Three Gorges Dam as the boundary, there is a significant decrease in the coefficient between sediment load on runoff, indicating that the influence of runoff on sediment transport in the mainstream is weakened. This decreasing trend is that the increase in the runoff along the mainstream is more significant than the increase in the sediment load. For instance, during 1961–2020, the multi-year average annual runoff at Datong station (8936 × 108 m3) is 3.37 times the value at Zhutuo station (2650 × 108 m3), while the multi-year average sediment load at Datong station (3.34 × 10⁸ t) is only 1.34 times than the value at Zhutuo station (2.50 × 10⁸ t). The variations of sediment load are increasingly unable to catch up with the changes in runoff along the mainstream.
As shown in Table 4, the variation of annual runoff caused by human activities during 1981–2000 varies from −183.9 × 10⁸ m3 at Datong station to −306.1 × 10⁸ m3 at Cuntan station, and the values during 2001–2020 further decrease, and the maximum reduction in this period is up to −615.8 × 10⁸ m3 at Hankou station, which shows that human activities reduce the runoff in these two periods and the magnitude of reduction increases over time. Human activities are the reason for the reduced annual runoff during 2001–2020.
4.3. Quantitative Assessments of Climate Change and Human Activities
4.3.1. Effects of Climate Change and Human Activities on Runoff
Figure 8 shows the variation of observed and reconstructed annual runoff in five stations in the Yangtze River Basin. The observed annual runoff decreased from 1981–2020, compared to the reconstructed value in the impacted period, which means that human activities reduce the runoff. Conversely, the reconstructed annual runoff in response to climate change increased at five hydrological stations, compared with the natural period, representing an increase in runoff from the mainstream area due to climate change.
Table 5 presents the multi-year average annual runoff changes at five stations for 1981–2000 and 2001–2020, compared to the natural period 1961–1980. The contributions of human activities and climate change to annual runoff changes are essentially different. In terms of human activities, the change in annual runoff due to human activities during 1981–2000 ranged from −183.9 × 10⁸ m3 at Datong station to −306.1 × 10⁸ m3 at Cuntan station, and the annual runoff during 2001–2020 was further reduced, with the maximum reduction of up to −615.8 × 10⁸ m3 at Hankou station. In spite of the climate change-induced increase in precipitation, the river runoff decreased, which must be attributed to human interventions. The change in multi-year average annual runoff caused by climate change increased at all five hydrological stations from 1981–2000, ranging from 248.3 × 10⁸ m3 at Yichang station to 684.4 × 10⁸ m3 at Datong station, and from 2001 to 2020, the change in runoff caused by climate change also increased from the upper reaches to the estuary, from 393.5 × 10⁸ m3 at Zhutuo station to 656.0 × 10⁸ m3 at Datong station. Therefore, in spite of the climate change induced increase in precipitation, the river runoff decreased, which must be attributed to human activities. In conclusion, human activities are responsible for decreased annual runoff from 2001 to 2020, and climate change has delayed the trend.
4.3.2. Effects of Climate Change and Human Activities on Sediment Load
Figure 9 shows the variation of observed and reconstructed annual runoff at five stations in the Yangtze River Basin, similar to the method used to analyze the contribution of annual runoff impacts. The observed sediment load is significantly reduced, compared to the reconstructed values from 1981–2020, indicating that human activities have reduced the sediment load in the mainstream. The reconstructed sediment load increased slightly, compared to the natural period, suggesting that climate change would have increased sediment loads. However, other studies [14,33] overestimate the effects of climate change on reducing sediment loads (contribution of 5–14%) because they assume that changes in runoff, whether decreasing or increasing, are solely due to climate change exaggerating climate effects.
Table 6 presents the changes in multi-year average annual sediment load at the five stations for 1981–2000 and 2001–2020, compared to 1961–1980. On the one hand, anthropogenic impacts significantly reduced the multi-year average sediment load. The minimum and maximum reductions from 1981–2000 are 0.42 × 10⁸ t at Zhutuo station and 1.11 × 10⁸ t at Datong station, respectively, while the reductions caused by anthropogenic activities increased further during 2001–2020, from −2.53 × 10⁸ t at Zhutuo station to −5.25 × 10⁸ t at Yichang station. Thus, during both periods, human activities caused a continuous reduction in sediment load, and its impact will increase significantly over time due to the presence of TGD downstream of Yichang station. On the other hand, the change in the multi-year average sediment load due to climate change increased throughout the mainstream between 1981–2000 and 2001–2020, ranging from 0.18 × 10⁸ t to 0.78 × 10⁸ t. Therefore, climate change is not the main cause of sediment load reduction in the Yangtze River.
5. Discussion
5.1. Human Activities Involved in Runoff and Sediment Load Changes
Human activities, especially reservoir operation, soil conservation, and sand mining, play a crucial role in runoff changes and are the main reason for the decrease in sediment load at six hydrological stations.
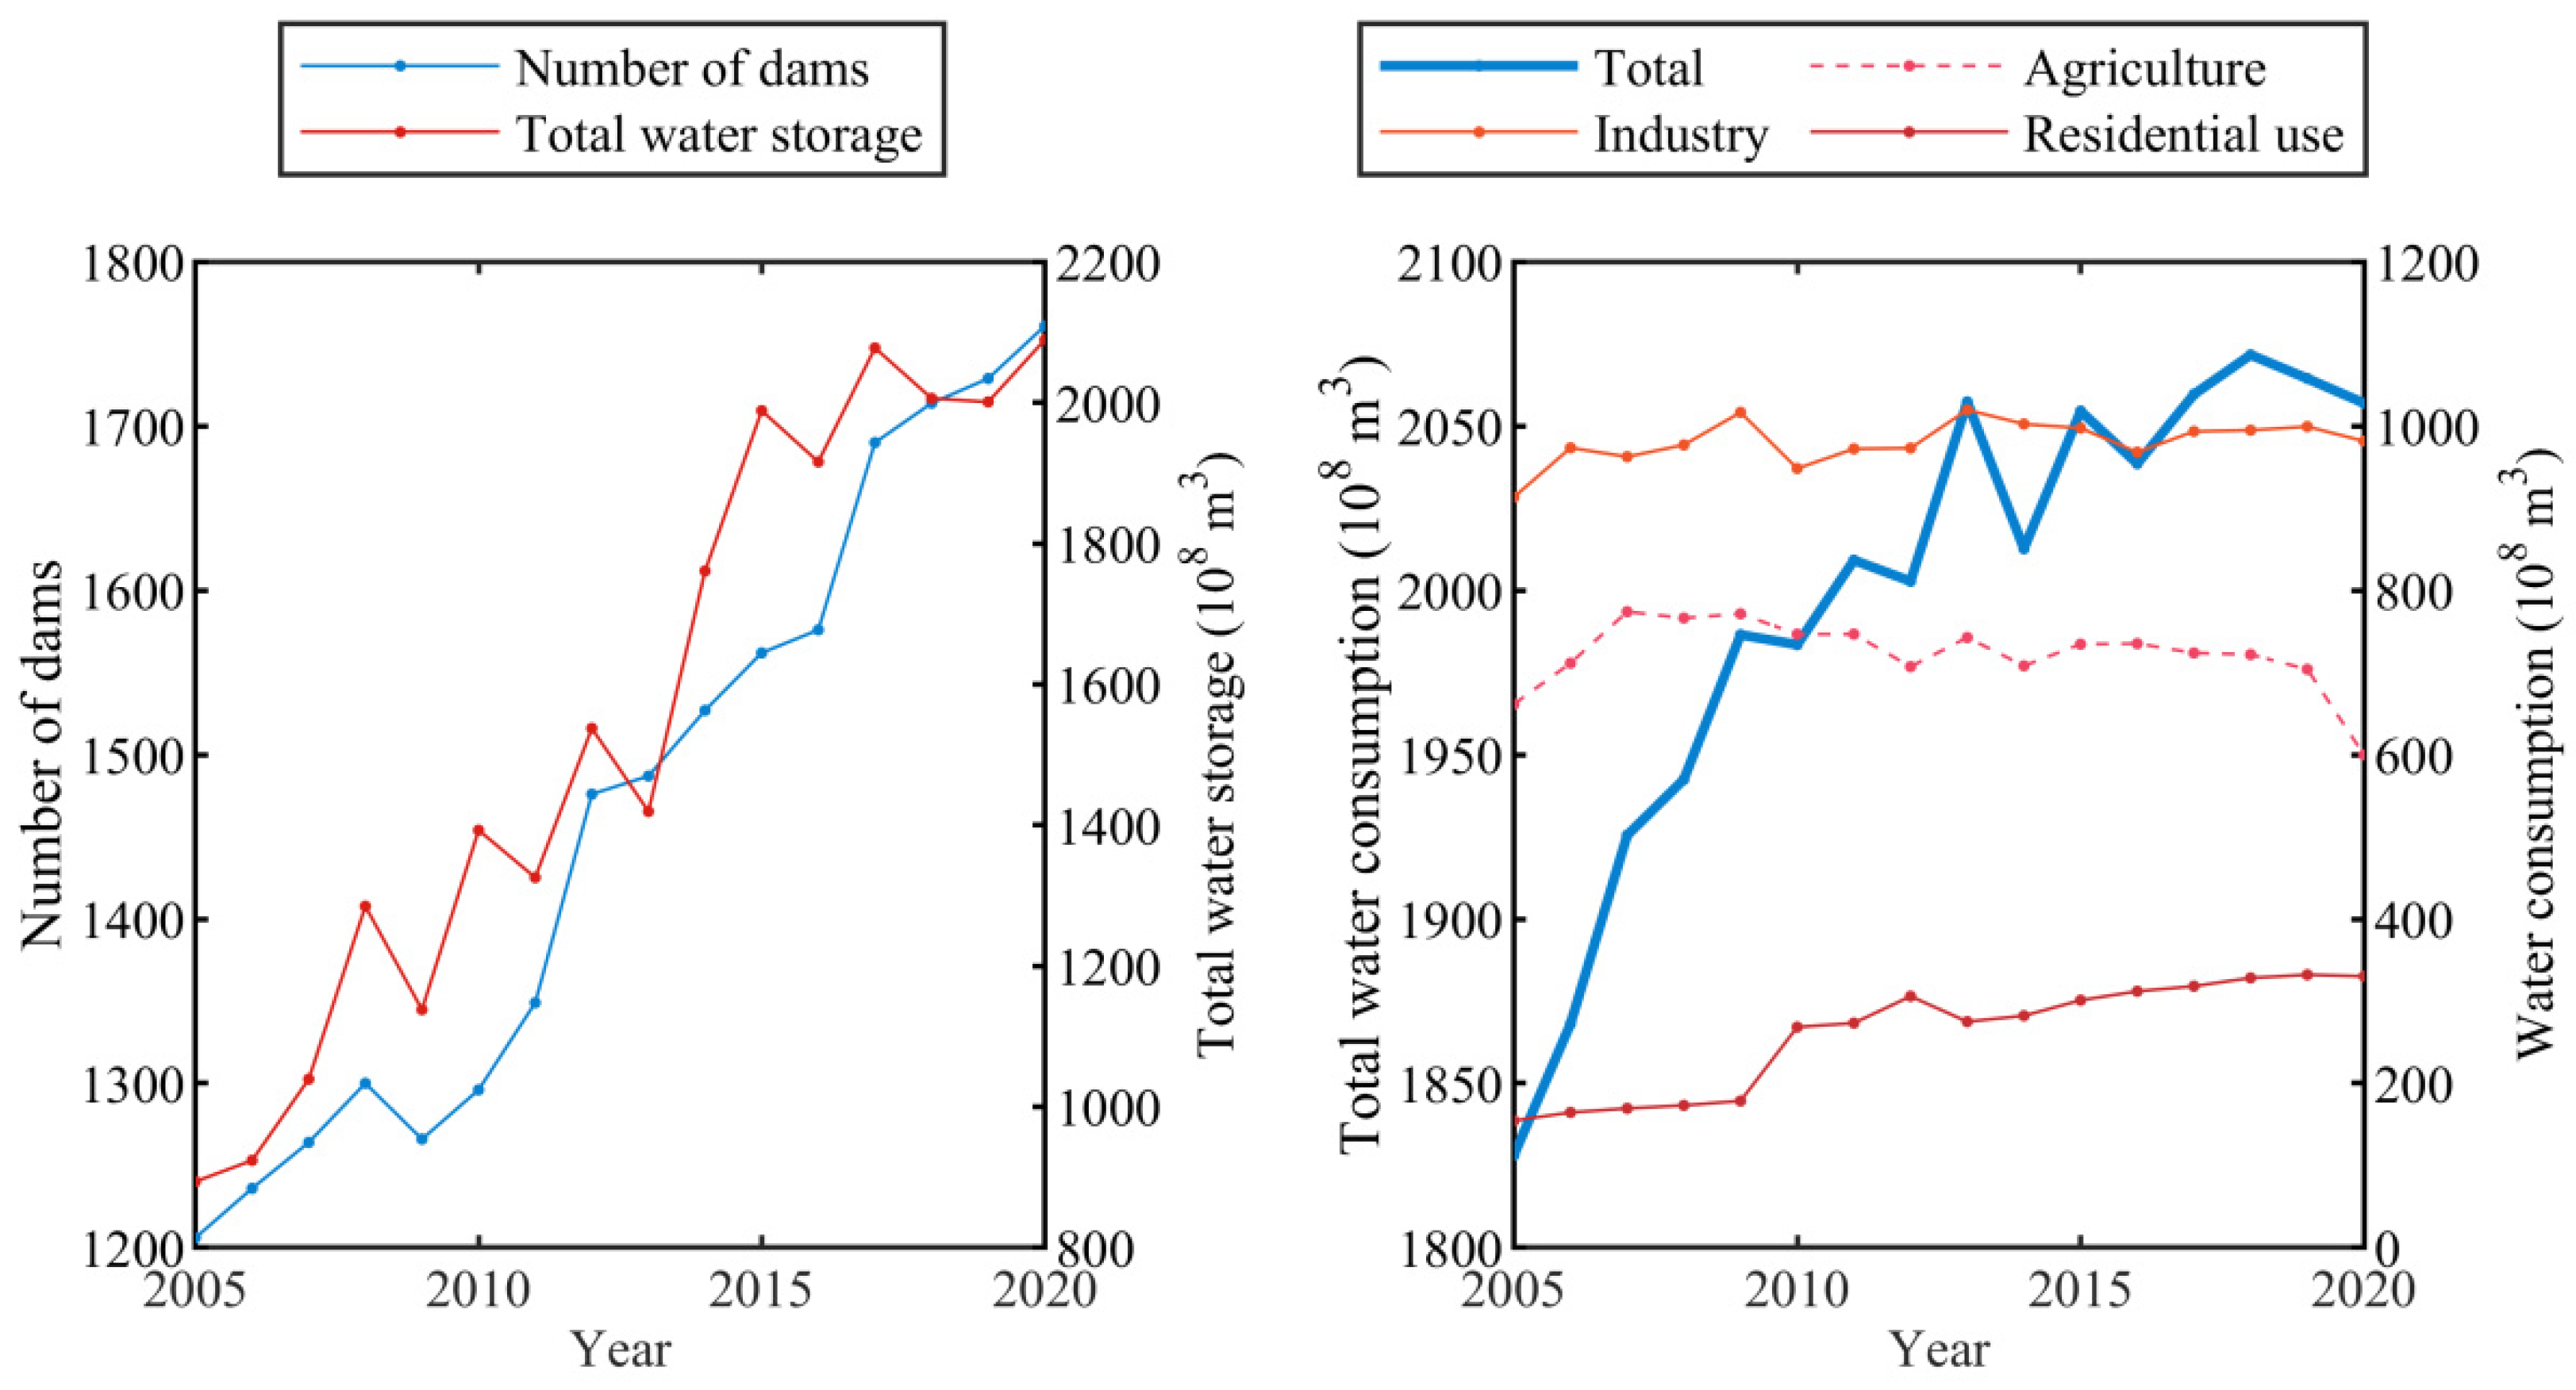
By 2000, more than 50,000 dams had been constructed in the Yangtze River Basin, and 20 dams taller than 100 m are scheduled to be constructed by 2020. The Three Gorges Dam, the largest dam in the world, 185 m high, was operated in 2003, further storing the water resources behind dams since 2000 [52]. As shown in Figure 10 left, while the reservoir storage in the 1990s was about 57 km3, the reservoir capacity in 2020 increased to 200 km3. Due to more than 50,000 dams, the reservoir sediment accumulation increased from zero in 1950 to 8.5 × 10⁸ t·yr−1 in 2003 [53]. This is the reason why the sediment in our case significantly decreases since 2003. In addition, many dams on the tributaries, such as Danjiangkou, Wujiangdu, and Dongjiang dams, also contribute to sediment load reduction [54]. Therefore, the operation of the dams is a fundamental reason for the reduction in sediment load in the Yangtze River. Dam operation will also lead to riverbed erosion.
The impact of water use in the Yangtze River cannot be ignored. During 1949–2000, water use in the Yangtze River basin increased rapidly due to the increase in irrigated agriculture, and the demand for population increased from 180 to 400 million [55], resulting in high water use of about 170 km3·yr−1 (Figure 10 right). However, since 2000, water use has increased further with economic development and population increase, with values reaching 186 km3·yr−1.
The upper Yangtze River area has been considered a priority area for implementing soil and water conservation projects since 1988 to ensure the safety of the Three Gorges Dam. Since 2008, these projects have covered 10 provinces and 214 cities [32]. The soil and water conservation area have increased yearly from 156 × 103 km2 in 1993 to as high as 305 × 103 km2 in 2012. Soil and water conservation projects can reduce river runoff. For example, soil and water conservation projects on the Loess Plateau reduced the annual runoff of the Yellow River by about 5% [56]. Xu et al. [57] found that soil and water conservation projects increased the vegetation cover of the entire Yangtze River basin by 23% and reduced the sediment load of the Datong station by 0.21 × 10⁸ t·yr−1.
Corresponding to soil and water conservation is the reduction in sand in the river, and with the rapid development of society, the demand for sand, an important construction material, has increased significantly. Since 2003, the Yangtze River Protection Committee has issued a limit that sand extraction should be less than 0.3 × 10⁸ t·yr−1, but due to illegal sand extraction, the actual sand extraction in 2003–2006 may be between 0.3 × 10⁸ t·yr−1 and 0.8 × 10⁸ t·yr−1 [58].
5.2. Climate Change Involved in Runoff and Sediment Load
The sediment load reduction is generally attributed to reservoir operation and water-soil conservation (Planting vegetation in bare land), but climate change, especially increased precipitation, can lead to a rise in sediment load [59]. Extreme climate events (flood and drought) can impact the runoff and the sediment load in the Yangtze River Basin. In 1998 (Figure 4), the Yangtze River Basin suffered from an enormous flood disaster [60], which can vastly increase the runoff and sediment load. In contrast, the runoff and sediment loads in the basin decreased significantly due to extreme drought events suffered in 2006 and 2011 [31,61,62]. Taking the historical (1961–2020) data of Yichang station as an example, the annual runoff and sediment loads in 1998 were 5232 × 108 m3 and 7.42 × 10⁸ t, both of which were the largest, while in 2006 and 2011, the annual runoff was the lowest and second lowest, and the sediment loads were the second lowest and lowest. Extreme climate events are essential for the sudden runoff and sediment load changes.
5.3. Evaluation of the Error of Regression Prediction
Although the regressive relationships between the precipitation and the annual runoff, as well as between the annual runoff and the sediment during the natural period, are all significant, with confidence levels over 95% (Figure 5), the prediction errors still need to be evaluated. Taking Zhutuo Station (Table 7) first, the linear regression relationships between the measured annual runoff and precipitation are built for uneven years and even years during the natural period (1961–1980). The regression equations predict the annual runoff from 1961 to 1980. Next, absolute and relative errors are calculated between the predicted and measured values in each year, and then the average and the standard deviation of errors are also calculated.
We also evaluated the regression predictions of annual runoff and sediment load errors at six hydrological stations. The maximum relative error between the predicted and measured annual runoff is only 3%, and the maximum value between the predicted and measured sediment load is only 6%. The above method is widely used to verify the reliability of regression prediction [42,63]. As shown in Table 7, the average absolute errors are only 2 m3·s−1 and 1 m3·s−1 for uneven years and even years, respectively, and both of the average relative errors are only 1% due to the inherent relation of the predicted values to the measured values, which can be neglected. The standard deviations of absolute errors are ±228 m3·s−1 and ±246 m3·s−1 for uneven years and even years, respectively, compared with the annual runoff from1961–1980 (2667 m3·s−1). The regression equations of uneven years predict the annual runoff during even years and vice versa to avoid the inherent relationship. By doing so, the average ± standard deviation of absolute errors are −84 ± 284 m3·s−1 and −37 ± 295 m3·s−1, respectively, and the average ± standard deviations of relative error are only −2 ± 10% and −1 ± 12%, respectively. Thus, the effects of the inherent relation of the predicted value to the measured value are relatively small and can be ignored.
6. Conclusions
Under the intensifying human activities and climate change, hydrological processes have changed noticeably in the Yangtze River Basin, which will significantly affect the shipping conditions, irrigation, flood control, and eco-environmental protection. The variation characteristics of runoff and sediment load are analyzed by comparing the impacted period (1981–2020) with the natural period (1961–1980) in this study. The conclusions are as follows:
(1) The runoff in the mainstream of the Yangtze River increased slightly during the period 1981–2000 except for Cuntan station, and then reduced significantly during 2001–2020 except for Datong station. The sediment load decreased from 1981 to 2000 except for Zhutuo station, and enhanced decreasing trend was found at all stations from 2001 to 2020. The effects of precipitation on the runoff along the Yangtze River show a downstream increasing trend, while the effects of runoff on sediment load show a downstream decreasing trend from Zhutuo to Luoshan station.
(2) The increased runoff induced by the rising precipitation was more significant than the reduced runoff caused by human activities during 1981–2000. In contrast, significant intensifying human activities, such as human water consumption, water-soil conservation, and water storage in reservoirs, have further reduced runoff since 2000, and precipitation also somewhat mitigates the runoff decrease.
(3) During the impacted period, the intensifying human activities are the reason for the reduced sediment load, and their impacts become more and more significant. The changed sediment load caused human activities to vary from −0.211 × 10⁸ t to −4.779 × 10⁸ t. In contrast, the rising precipitation and delta erosion increased the sediment load in the mainstream, while its influence is far less than the impacts of anthropic activities. The maximum changed sediment load-induced climate change is only 0.636 × 10⁸ t.
(4) In this study, we used the linear regression method to separate the effects of human activities and climate changes on the sediment and the runoff. Here, we also evaluate the error regression prediction and reveal that the maximum relative error between the predicted and measured annual is only 3%, and the maximum value between the predicted and measured sediment load is only 6%. Thereby, our findings might be robustness.
The enhancing effects of human activities on the declining runoff and sediment load, which exacerbate water scarcity problems, and the risk of streambank collapse and streambed erosion need more significant attention.
Author Contributions
Conceptualization, H.Q. and Y.L.; methodology, J.L. and Y.L.; investigation, Y.Y. and Y.C.; data curation, Y.Y.; writing—original draft preparation, H.Q., J.L. and Y.C.; writing—review and editing, H.Q. and Y.L. All authors have read and agreed to the published version of the manuscript.
Funding
This research was funded by Independent Innovation Project-2019 of Changjiang Institute of Survey, Planning, Design and Research, grant number CX2019Z31.
Institutional Review Board Statement
Not applicable.
Data Availability Statement
The data supporting this study’s findings have been archived in the National Earth System Science Data Center (http://www.geodata.cn/index.html) (accessed on 1 June 2021).
Conflicts of Interest
The authors declare no conflict of interest.
References
- Iles, C.E.; Hegerl, G.C. Systematic change in global patterns of streamflow following volcanic eruptions. Nat. Geosci. 2015, 8, 838–842. [Google Scholar] [CrossRef] [PubMed] [Green Version]
- He, Y.; Wang, F.; Tian, P.; Mu, X.-M.; Gao, P.; Zhao, G.-J.; Wu, Y.-P. Impact Assessment of Human Activities on Runoff and Sediment of Beiluo River in the Yellow River Based on Paired Years of Similar Climate. Pol. J. Environ. Stud. 2016, 25, 121–135. [Google Scholar] [CrossRef]
- Cook, B.I.; Smerdon, J.E.; Seager, R.; Coats, S. Constraints on future changes in climate and the hydrologic cycle. Nature 2002, 419, 224. [Google Scholar]
- Salzmann, M. Global warming without global mean precipitation increase? Sci. Adv. 2016, 2, e1501572. [Google Scholar] [CrossRef]
- Tian, P.; Mu, X.; Liu, J.; Hu, J.; Gu, C. Impacts of Climate Variability and Human Activities on the Changes of Runoff and Sediment Load in a Catchment of the Loess Plateau, China. Adv. Meteorol. 2016, 2016, 4724067. [Google Scholar] [CrossRef] [Green Version]
- Grams, P.E.; Schmidt, J.C.; Topping, D.J. The rate and pattern of bed incision and bank adjustment on the Colorado River in Glen Canyon downstream from Glen Canyon Dam, 1956–2000. GSA Bull. 2007, 119, 556–575. [Google Scholar] [CrossRef] [Green Version]
- Dai, Z.; Liu, J.T. Impacts of large dams on downstream fluvial sedimentation: An example of the Three Gorges Dam (TGD) on the Changjiang (Yangtze River). J. Hydrol. 2013, 480, 10–18. [Google Scholar] [CrossRef]
- Wang, H.; Liu, J.; Guo, W. The variation and attribution analysis of the runoff and sediment in the lower reach of the Yellow River during the past 60 years. Water Supply 2021, 21, 3193–3209. [Google Scholar] [CrossRef]
- Asaeda, T.; Rashid, H. The impacts of sediment released from dams on downstream sediment bar vegetation. J. Hydrol. 2012, 430–431, 25–38. [Google Scholar] [CrossRef]
- Wei, X.; Cai, S.; Ni, P.; Zhan, W. Impacts of climate change and human activities on the water discharge and sediment load of the Pearl River, southern China. Sci. Rep. 2020, 10, 16743. [Google Scholar] [CrossRef]
- Yang, S.L.; Luo, X.; Temmerman, S.; Kirwan, M.; Bouma, T.; Xu, K.; Zhang, S.; Fan, J.; Shi, B.; Yang, H.; et al. Role of delta-front erosion in sustaining salt marshes under sea-level rise and fluvial sediment decline. Limnol. Oceanogr. 2020, 65, 1990–2009. [Google Scholar] [CrossRef]
- Wiegel, R.L. Nile Delta Erosion. Science 1996, 272, 338–340. [Google Scholar] [CrossRef]
- Wei, W.; Chang, Y.; Dai, Z. Streamflow changes of the Changjiang (Yangtze) River in the recent 60 years: Impacts of the East Asian summer monsoon, ENSO, and human activities. Quat. Int. 2014, 336, 98–107. [Google Scholar] [CrossRef]
- Zhao, Y.; Zou, X.; Gao, J.; Xu, X.; Wang, C.; Tang, D.; Wang, T.; Wu, X. Quantifying the anthropogenic and climatic contributions to changes in water discharge and sediment load into the sea: A case study of the Yangtze River, China. Sci. Total Environ. 2015, 536, 803–812. [Google Scholar] [CrossRef]
- Liu, Q.; Cui, B. Impacts of climate change/variability on the streamflow in the Yellow River Basin, China. Ecol. Model. 2011, 222, 268–274. [Google Scholar] [CrossRef]
- Cheng, D.; Qi, G.; Song, J.; Zhang, Y.; Bai, H.; Gao, X. Quantitative Assessment of the Contributions of Climate Change and Human Activities to Vegetation Variation in the Qinling Mountains. Front. Earth Sci. 2021, 9, 782287. [Google Scholar] [CrossRef]
- Wang, F.; Hessel, R.; Mu, X.; Maroulis, J.; Zhao, G.; Geissen, V.; Ritsema, C. Distinguishing the impacts of human activities and climate variability on runoff and sediment load change based on paired periods with similar weather conditions: A case in the Yan River, China. J. Hydrol. 2015, 527, 884–893. [Google Scholar] [CrossRef]
- Miao, C.; Ni, J.; Borthwick, A.G.; Yang, L. A preliminary estimate of human and natural contributions to the changes in water discharge and sediment load in the Yellow River. Glob. Planet. Chang. 2011, 76, 196–205. [Google Scholar] [CrossRef] [Green Version]
- Zhang, A.; Zhang, C.; Fu, G.; Wang, B.; Bao, Z.; Zheng, H. Assessments of Impacts of Climate Change and Human Activities on Runoff with SWAT for the Huifa River Basin, Northeast China. Water Resour. Manag. 2012, 26, 2199–2217. [Google Scholar] [CrossRef]
- Zhao, G.; Mu, X.; Jiao, J.; Gao, P.; Sun, W.; Li, E.; Wei, Y.; Huang, J. Assessing response of sediment load variation to climate change and human activities with six different approaches. Sci. Total Environ. 2018, 639, 773–784. [Google Scholar] [CrossRef]
- Hu, J.; Zhao, G.; Mu, X.; Tian, P.; Gao, P.; Sun, W. Quantifying the impacts of human activities on runoff and sediment load changes in a Loess Plateau catchment, China. J. Soils Sediments 2019, 19, 3866–3880. [Google Scholar] [CrossRef]
- Bian, H.; Lü, H.; Sadeghi, A.M.; Zhu, Y.; Yu, Z.; Ouyang, F.; Su, J.; Chen, R. Assessment on the Effect of Climate Change on Streamflow in the Source Region of the Yangtze River, China. Water 2017, 9, 70. [Google Scholar] [CrossRef] [Green Version]
- Li, K.; Zhu, C.; Wu, L.; Huang, L. Problems caused by the Three Gorges Dam construction in the Yangtze River basin: A review. Environ. Rev. 2013, 21, 127–135. [Google Scholar] [CrossRef]
- Yan, H.; Zhang, X.; Xu, Q. Variation of runoff and sediment inflows to the Three Gorges Reservoir: Impact of upstream cascade reservoirs. J. Hydrol. 2021, 603, 126875. [Google Scholar] [CrossRef]
- Zhou, Y.; Jeppesen, E.; Li, J.; Zhang, Y.; Zhang, X.; Li, X. Impacts of Three Gorges Reservoir on the sedimentation regimes in the downstream-linked two largest Chinese freshwater lakes. Sci. Rep. 2016, 6, 35396. [Google Scholar] [CrossRef] [PubMed] [Green Version]
- Liu, J.; Deng, J.; Chai, Y.; Yang, Y.; Zhu, B.; Li, S. Variation of the Water Level in the Yangtze River in Response to Natural and Anthropogenic Changes. Water 2019, 11, 2594. [Google Scholar] [CrossRef] [Green Version]
- Yu, Y.; Mei, X.; Dai, Z.; Gao, J.; Li, J.; Wang, J.; Lou, Y. Hydromorphological processes of Dongting Lake in China between 1951 and 2014. J. Hydrol. 2018, 562, 254–266. [Google Scholar] [CrossRef]
- Yan, H.-C.; Zhang, X.-F.; Xu, Q.-X. Unprecedented sedimentation in response to emerging cascade reservoirs in the upper Yangtze River Basin. Catena 2022, 209, 105833. [Google Scholar] [CrossRef]
- Dai, Z.; Fagherazzi, S.; Mei, X.; Gao, J. Decline in suspended sediment concentration delivered by the Changjiang (Yangtze) River into the East China Sea between 1956 and 2013. Geomorphology 2016, 268, 123–132. [Google Scholar] [CrossRef] [Green Version]
- Dai, Z.; Chu, A.; Stive, M.; Du, J.; Li, J. Is the Three Gorges Dam the cause behind the extremely low suspended sediment discharge into the Yangtze (Changjiang) Estuary of 2006? Hydrol. Sci. J. 2011, 56, 1280–1288. [Google Scholar] [CrossRef]
- Zhang, X.Y.; Yang, S.L. Climatic and anthropogenic impacts on water discharge in the Yangtze river over the last 56 years (1956–2011). Resour. Environ. Yangtze Basin 2014, 23, 1729–1739. [Google Scholar] [CrossRef]
- Dai, S.; Lu, X. Sediment load change in the Yangtze River (Changjiang): A review. Geomorphology 2014, 215, 60–73. [Google Scholar] [CrossRef]
- Guo, S.L.; Guo, J.L.; Hou, Y.K.; Xiong, L.H.; Hong, X.J. Prediction of future runoff change based on Budyko hypothesis in Yangtze River Basin. Adv. Water Sci. 2015, 26, 151–160. [Google Scholar] [CrossRef]
- Zhang, Q.; Liu, J.; Singh, V.P.; Gu, X.; Chen, X. Evaluation of impacts of climate change and human activities on streamflow in the Poyang Lake basin, China. Hydrol. Process. 2016, 30, 2562–2576. [Google Scholar] [CrossRef]
- Mei, X.; Dai, Z.; Wei, W.; Li, W.; Wang, J.; Sheng, H. Secular bathymetric variations of the North Channel in the Changjiang (Yangtze) Estuary, China, 1880–2013: Causes and effects. Geomorphology 2017, 303, 30–40. [Google Scholar] [CrossRef]
- Yang, S.; Milliman, J.; Xu, K.; Deng, B.; Zhang, X.; Luo, X. Downstream sedimentary and geomorphic impacts of the Three Gorges Dam on the Yangtze River. Earth-Sci. Rev. 2014, 138, 469–486. [Google Scholar] [CrossRef]
- Yang, H.; Yang, S.; Xu, K.; Milliman, J.; Wang, H.; Yang, Z.; Chen, Z.; Zhang, C. Human impacts on sediment in the Yangtze River: A review and new perspectives. Glob. Planet. Chang. 2018, 162, 8–17. [Google Scholar] [CrossRef]
- Xu, K.; Milliman, J.D.; Yang, Z.; Xu, H. Climatic and Anthropogenic Impacts on Water and Sediment Discharges from the Yangtze River (Changjiang), 1950–2005. In Large Rivers: Geomorphology and Management; John Wiley Sons, Ltd.: Hoboken, NJ, USA, 2008. [Google Scholar] [CrossRef]
- Dai, Z.; Du, J.; Li, J.; Li, W.; Chen, J. Runoff characteristics of the Changjiang River during 2006: Effect of extreme drought and the impounding of the Three Gorges Dam. Geophys. Res. Lett. 2008, 35, 521–539. [Google Scholar] [CrossRef]
- Yang, Y.; Zhang, M.; Zhu, L.; Liu, W.; Han, J.; Yang, Y. Influence of Large Reservoir Operation on Water-Levels and Flows in Reaches below Dam: Case Study of the Three Gorges Reservoir. Sci. Rep. 2017, 7, 15640. [Google Scholar] [CrossRef] [Green Version]
- Mei, X.; Dai, Z.; van Gelder, P.H.A.J.M.; Gao, J. Linking Three Gorges Dam and downstream hydrological regimes along the Yangtze River, China. Earth Space Sci. 2015, 2, 94–106. [Google Scholar] [CrossRef]
- Yang, S.L.; Xu, K.; Milliman, J.D.; Yang, H.F.; Wu, C.S. Decline of Yangtze River water and sediment discharge: Impact from natural and anthropogenic changes. Sci. Rep. 2015, 5, 12581. [Google Scholar] [CrossRef]
- Yan, Y.; Wang, S.; Chen, J. Spatial patterns of scale effect on specific sediment yield in the Yangtze River basin. Geomorphology 2011, 130, 29–39. [Google Scholar] [CrossRef]
- Zhang, Q.; Li, J.; Singh, V.P.; Xu, C.-Y. Copula-based spatio-temporal patterns of precipitation extremes in China. Int. J. Climatol. 2013, 33, 1140–1152. [Google Scholar] [CrossRef]
- Bao, Z.; Zhang, J.; Wang, G.; Fu, G.; He, R.; Yan, X.; Jin, J.; Liu, Y.; Zhang, A. Attribution for decreasing streamflow of the Haihe River basin, northern China: Climate variability or human activities? J. Hydrol. 2012, 460–461, 117–129. [Google Scholar] [CrossRef]
- Yuan, Y.; Zeng, G.; Liang, J.; Huang, L.; Hua, S.; Li, F.; Zhu, Y.; Wu, H.; Liu, J.; He, X.; et al. Variation of water level in Dongting Lake over a 50-year period: Implications for the impacts of anthropogenic and climatic factors. J. Hydrol. 2015, 525, 450–456. [Google Scholar] [CrossRef]
- Kunz, M.J.; Wüest, A.; Wehrli, B.; Landert, J.; Senn, D. Impact of a large tropical reservoir on riverine transport of sediment, carbon, and nutrients to downstream wetlands. Water Resour. Res. 2011, 47, W12531. [Google Scholar] [CrossRef] [Green Version]
- Xu, K.; Milliman, J.D.; Yang, Z.; Wang, H. Yangtze sediment decline partly from Three Gorges Dam. Eos Trans. Am. Geophys. Union 2006, 87, 185–190. [Google Scholar] [CrossRef]
- Ran, L.; Wang, S.; Fan, X. Channel change at Toudaoguai Station and its responses to the operation of upstream reservoirs in the upper Yellow River. J. Geogr. Sci. 2010, 20, 231–247. [Google Scholar] [CrossRef]
- Liao, C.Y. Review and prospect of 60-year soil and water conservation in Yangtze River Basin. Yangtze River 2010, 41, 26–30. (In Chinese) [Google Scholar] [CrossRef]
- Li, N.; Wang, L.; Zeng, C.; Wang, D.; Liu, D.; Wu, X. Variations of Runoff and Sediment Load in the Middle and Lower Reaches of the Yangtze River, China (1950-2013). PLoS ONE 2016, 11, e0160154. [Google Scholar] [CrossRef]
- Yang, S.; Milliman, J.; Li, P.; Xu, K. 50,000 dams later: Erosion of the Yangtze River and its delta. Glob. Planet. Chang. 2011, 75, 14–20. [Google Scholar] [CrossRef]
- Yang, S.L.; Zhang, J.; Zhu, J.; Smith, J.P.; Dai, S.; Gao, A.; Li, P. Impact of dams on Yangtze River sediment supply to the sea and delta intertidal wetland response. J. Geophys. Res. Earth Surf. 2005, 110, F03006. [Google Scholar] [CrossRef]
- Yang, Y.; Zhang, M.; Liu, W.; Wang, J.; Li, X. Relationship between Waterway Depth and Low-Flow Water Levels in Reaches below the Three Gorges Dam. J. Waterw. Port Coastal Ocean Eng. 2019, 145, 04018032. [Google Scholar] [CrossRef]
- Qi, W.; Müller, B.; Pernet-Coudrier, B.; Singer, H.; Liu, H.; Qu, J.; Berg, M. Organic micropollutants in the Yangtze River: Seasonal occurrence and annual loads. Sci. Total Environ. 2014, 472, 789–799. [Google Scholar] [CrossRef] [Green Version]
- Li, Z.J.; Zhou, P.X.; Mao, L.H. General Review on Effects of Soil and Water Conservation Measures on Water Resources in China. Prog. Geogr. 2006, 25, 49–57. (In Chinese) [Google Scholar] [CrossRef]
- Xu, K.; Milliman, J.D. Seasonal variations of sediment discharge from the Yangtze River before and after impoundment of the Three Gorges Dam. Geomorphology 2009, 104, 276–283. [Google Scholar] [CrossRef]
- Xiqing, C.; Qiaoju, Z.; Erfeng, Z. In-channel sand extraction from the mid-lower Yangtze channels and its management: Problems and challenges. J. Environ. Plan. Manag. 2006, 49, 309–320. [Google Scholar] [CrossRef]
- Zhu, Y.-M.; Lu, X.; Zhou, Y. Sediment flux sensitivity to climate change: A case study in the Longchuanjiang catchment of the upper Yangtze River, China. Glob. Planet. Chang. 2008, 60, 429–442. [Google Scholar] [CrossRef]
- Yin, H.; Li, C. Human impact on floods and flood disasters on the Yangtze River. Geomorphology 2001, 41, 105–109. [Google Scholar] [CrossRef]
- Dai, Z.-J.; Chu, A.; Du, J.-Z.; Stive, M.; Hong, Y. Assessment of extreme drought and human interference on baseflow of the Yangtze River. Hydrol. Process. 2009, 24, 749–757. [Google Scholar] [CrossRef]
- Lu, E.; Liu, S.; Luo, Y.; Zhao, W.; Li, H.; Chen, H.; Zeng, Y.; Liu, P.; Wang, X.; Higgins, R.W.; et al. The atmospheric anomalies associated with the drought over the Yangtze River basin during spring 2011. J. Geophys. Res. Atmos. 2014, 119, 5881–5894. [Google Scholar] [CrossRef]
- Yang, S.L.; Liu, Z.; Dai, S.; Gao, Z.X.; Zhang, J.; Wang, H.; Luo, X.X.; Wu, C.S.; Zhang, Z. Temporal variations in water resources in the Yangtze River (Changjiang) over the Industrial Period based on reconstruction of missing monthly discharges. Water Resour. Res. 2010, 46, W10516. [Google Scholar] [CrossRef]
Figure 1.
Sketch map of the location of the Yangtze River Basin. (a) Locations of relevant hydrological stations; (b) Locations of river systems and sub-regions; (c) Locations of weather stations. Note: ①, ②,…,⑥ represent the catchment area of each hydrological station along the mainstream.
Figure 1.
Sketch map of the location of the Yangtze River Basin. (a) Locations of relevant hydrological stations; (b) Locations of river systems and sub-regions; (c) Locations of weather stations. Note: ①, ②,…,⑥ represent the catchment area of each hydrological station along the mainstream.

Figure 2.
A graphical illustration of quantifying the impacts of climate change and human activities on annual runoff or sediment load.
Figure 2.
A graphical illustration of quantifying the impacts of climate change and human activities on annual runoff or sediment load.

Figure 3.
Abrupt analysis of the sediment load at six hydrological stations in the Yangtze River.

Figure 4.
Variation trend of precipitation at six hydrological stations from 1961–2020.

Figure 5.
Variation trend of annual runoff and sediment load at six hydrological stations from 1961–2020.
Figure 5.
Variation trend of annual runoff and sediment load at six hydrological stations from 1961–2020.

Figure 6.
Relationships between annual runoff and precipitation from the natural period.

Figure 7.
Relationships between a sediment load and annual runoff during the natural period.

Figure 8.
Variations of observed and reconstructed annual runoff at five hydrological stations.

Figure 9.
Variations of observed and reconstructed sediment load at five hydrological stations.

Figure 10.
Variation of human activities before and after the year 2000.


Table 1.
Detailed data information of six hydrological stations.
| Stations | Zhutuo | Cuntan | Yichang | Luoshan | Hankou | Datong |
|---|---|---|---|---|---|---|
| Drainage area (×104 km2) | 69.47 | 86.66 | 100.55 | 127 | 148.8 | 170.54 |
| Weather station | 41 | 18 | 21 | 40 | 24 | 31 |
| Location | Upper | Upper | Upper | Middle | Middle | Lower |
| Period | 1961–2020 | |||||
Table 2.
Precipitation variations during different periods, compared with the natural period 1961–1980.
Table 2.
Precipitation variations during different periods, compared with the natural period 1961–1980.
| Periods | Precipitation Variations (mm) | |||||
|---|---|---|---|---|---|---|
| Zhutuo | Cuntan | Yichang | Luoshan | Hankou | Datong | |
| 1981–2000 | 56 | 47 | 37 | 41 | 45 | 57 |
| 2001–2020 | 74 | 59 | 58 | 61 | 53 | 54 |
| 1981–2020 | 65 | 53 | 48 | 51 | 49 | 56 |
Table 3.
Variations in runoff and sediment load for different periods, compared to the natural period (1961–1980) *.
Table 3.
Variations in runoff and sediment load for different periods, compared to the natural period (1961–1980) *.
| Station | Runoff (×108 m3) | Sediment Load (×108 t) | ||||||||||
|---|---|---|---|---|---|---|---|---|---|---|---|---|
| 1981–2000 | 2001–2020 | 1981–2020 | 1981–2000 | 2001–2020 | 1981–2020 | |||||||
| Zhutuo | 22 | (+0.8%) | −33 | (−1.2%) | −5 | (−0.2%) | 0.2 | (+5.7%) | −1.8 | (−58%) | −0.8 | (−26%) |
| Cuntan | −48 | (−1.4%) | −126 | (−3.6%) | −87 | (−2.5%) | −0.1 | (−3.1%) | −2.8 | (−65%) | −1.5 | (−34%) |
| Yichang | 12 | (+0.3%) | −198 | (−4.5%) | −93 | (−2.1%) | −0.4 | (−7.4%) | −4.6 | (−89%) | −2.5 | (−48%) |
| Luoshan | 110 | (+1.7%) | −159 | (−2.5%) | −25 | (−0.4%) | −0.4 | (−9.9%) | −3.4 | (−77%) | −1.9 | (−44%) |
| Hankou | 193 | (+2.7%) | −93 | (−1.3%) | 50 | (+0.7%) | −0.7 | (−16.4%) | −3.3 | (−75%) | −2.0 | (−46%) |
| Datong | 500 | (+5.7%) | 58 | (+0.7%) | 279 | (+3.2%) | −0.8 | (−18.0%) | −3.2 | (−68%) | −2.0 | (−43%) |
Note: * The percentage (-%) presents the ratio of the change in runoff and sediment load to the average runoff and sediment load for the natural period.
Table 4.
Regression equations and coefficients.
| Station | Runoff | Sediment Load | ||
|---|---|---|---|---|
| Regression Equation | Coefficient | Regression Equation | Coefficient (×10−4) | |
| Zhutuo | 5.33·P − 754 | 5.33 | 1.98 × 10⁻³ Rr − 2.22 | 19.77 |
| Cuntan | 5.54·P − 393 | 5.54 | 2.21 × 10⁻³ Rr − 3.35 | 22.06 |
| Yichang | 6.67·P − 695 | 6.67 | 1.69 × 10⁻³ Rr − 2.23 | 16.92 |
| Luoshan | 7.77·P − 518 | 7.77 | 3.73 × 10⁻⁵ Rr + 4.14 | 0.37 |
| Hankou | 9.88·P − 1718 | 9.88 | 3.76 × 10⁻⁴ Rr + 1.73 | 3.76 |
| Datong | 12.06·P − 2897 | 12.06 | 3.84 × 10⁻⁴ Rr + 1.34 | 3.84 |
Note: P means precipitation; Rr denotes the reconstructed annual runoff.
Table 5.
Variations of annual runoff caused by climate change and human activities, compared with the natural period (1961–1980) *.
Table 5.
Variations of annual runoff caused by climate change and human activities, compared with the natural period (1961–1980) *.
| Station | 1981–2000 | 2001–2020 | 1981–2020 | ||||||
|---|---|---|---|---|---|---|---|---|---|
| Human Activities | Climate Change | Total Change | Human Activities | Climate Change | Total Change | Human Activities | Climate Change | Total Change | |
| Zhutuo | −279 | 301 | 22 | −426 | 394 | −33 | −353 | 347 | −5 |
| Cuntan | −306 | 258 | −48 | −452 | 326 | −126 | −379 | 292 | −87 |
| Yichang | −236 | 248 | 12 | −587 | 389 | −198 | −411 | 319 | −93 |
| Hankou | −247 | 440 | 193 | −616 | 522 | −93 | −431 | 481 | 50 |
| Datong | −184 | 684 | 500 | −598 | 656 | 58 | −391 | 670 | 279 |
Note: * All data units in Table 5 are ×108 m3.
Table 6.
Variations of sediment load caused by climate change and human activities, compared with the natural period (1961–1980) *.
Table 6.
Variations of sediment load caused by climate change and human activities, compared with the natural period (1961–1980) *.
| Station | 1981–2000 | 2001–2020 | 1981–2020 | ||||||
|---|---|---|---|---|---|---|---|---|---|
| Human Activities | Climate Change | Total Change | Human Activities | Climate Change | Total Change | Human Activities | Climate Change | Total Change | |
| Zhutuo | −0.42 | 0.60 | 0.17 | −2.53 | 0.78 | −1.75 | −1.48 | 0.69 | −0.79 |
| Cuntan | −0.70 | 0.57 | −0.13 | −3.52 | 0.72 | −2.80 | −2.11 | 0.64 | −1.47 |
| Yichang | −0.80 | 0.42 | −0.38 | −5.25 | 0.66 | −4.59 | −3.03 | 0.54 | −2.49 |
| Hankou | −0.88 | 0.17 | −0.72 | −3.46 | 0.20 | −3.27 | −2.17 | 0.18 | −1.99 |
| Datong | −1.11 | 0.26 | −0.84 | −3.47 | 0.25 | −3.21 | −2.29 | 0.2 | −2.03 |
Note: * All data units in Table 6 are ×108 t.
Table 7.
Error estimation for predicted streamflow at Zhutuo station using the measured precipitation and annual runoff regression relationship.
Table 7.
Error estimation for predicted streamflow at Zhutuo station using the measured precipitation and annual runoff regression relationship.
| Year | Observation | Prediction (m3·s−1) | Errors of Prediction (m3·s−1) | Relative Errors of Prediction (%) | ||||||||
|---|---|---|---|---|---|---|---|---|---|---|---|---|
| P (mm) | Q (m3·s−1) | Regression of uneven year | Regression of even year | Uneven-year regression for even year | Uneven-year regression for uneven year | Even-year regression for even year | Even-year regression for uneven year | Uneven-year regression for even year | Uneven-year regression for uneven year | Even-year regression for even year | Even-year regression for uneven year | |
| 1971 | 573 | 2097 | 2579.8 | 2554.9 | 235 | 210 | 0.10 | 0.09 | ||||
| 1972 | 644 | 2368 | 2458.6 | 2290.8 | 362 | 194 | 0.17 | 0.09 | ||||
| 1973 | 702 | 3183 | 2639.7 | 2685.4 | 272 | 318 | 0.11 | 0.13 | ||||
| 1974 | 638 | 2531 | 2787.7 | 3008.0 | −395 | −175 | −0.12 | −0.05 | ||||
| 1975 | 627 | 2466 | 2624.8 | 2653.0 | 94 | 123 | 0.04 | 0.05 | ||||
| 1976 | 614 | 2481 | 2595.4 | 2588.9 | 130 | 123 | 0.05 | 0.05 | ||||
| 1977 | 668 | 2609 | 2561.9 | 2515.9 | 81 | 35 | 0.03 | 0.01 | ||||
| 1978 | 596 | 2547 | 2700.7 | 2818.4 | 92 | 209 | 0.04 | 0.08 | ||||
| 1979 | 705 | 2704 | 2517.4 | 2419.0 | −30 | −128 | −0.01 | −0.05 | ||||
| 1980 | 573 | 2097 | 2793.3 | 3020.1 | 89 | 316 | 0.03 | 0.12 | ||||
| AA ± K | / | −84 ± 284 | 2 ± 228 | 1 ± 246 | −37 ± 295 | −2 ± 10 | 1 ± 8 | 1 ± 9 | −1 ± 12 | |||
Publisher’s Note: MDPI stays neutral with regard to jurisdictional claims in published maps and institutional affiliations. |
© 2022 by the authors. Licensee MDPI, Basel, Switzerland. This article is an open access article distributed under the terms and conditions of the Creative Commons Attribution (CC BY) license (https://creativecommons.org/licenses/by/4.0/).
Share and Cite
MDPI and ACS Style
Qian, H.; Liu, J.; Yang, Y.; Liu, Y.; Chai, Y. Quantitative Study of Climatic and Anthropogenic Contributions to Streamflow and Sediment Load in the Yangtze River, China. Water 2022, 14, 3104. https://doi.org/10.3390/w14193104
AMA Style
Qian H, Liu J, Yang Y, Liu Y, Chai Y. Quantitative Study of Climatic and Anthropogenic Contributions to Streamflow and Sediment Load in the Yangtze River, China. Water. 2022; 14(19):3104. https://doi.org/10.3390/w14193104
Chicago/Turabian StyleQian, Honglu, Jinxin Liu, Yunping Yang, Yunjia Liu, and Yuanfang Chai. 2022. "Quantitative Study of Climatic and Anthropogenic Contributions to Streamflow and Sediment Load in the Yangtze River, China" Water 14, no. 19: 3104. https://doi.org/10.3390/w14193104
Note that from the first issue of 2016, this journal uses article numbers instead of page numbers. See further details here.