
Industrial Wastewater Discharge and Compliance Investigation for Environmentally Resilient Rwanda

1
Department of Water Resources, Graduate School of Water Resources, Sungkyunkwan University, Suwon 16419, Korea
2
Rwanda Environment Management Authority, Division of Environmental Compliance and Enforcement, Kigali P.O. Box 7436, Rwanda
*
Authors to whom correspondence should be addressed.
Water 2022, 14(19), 3100; https://doi.org/10.3390/w14193100
Submission received: 29 August 2022
/
Revised: 25 September 2022
/
Accepted: 27 September 2022
/
Published: 1 October 2022
(This article belongs to the Section Water Quality and Contamination)
Abstract
:While Rwanda is aiming at environmental pollution resilience and green growth, some industries are still discharging untreated effluent into the environment. This study gives a general overview of the compliance level of industrial effluent discharge in Rwanda and the linked negative environmental impacts. It comprises qualitative and quantitative analyses of data obtained from wastewater samples collected from five selected industries in Rwanda. The selected industries had previously been audited and monitored by the Rwanda Environment Management Authority (REMA), due to complains from neighboring residents. The study found that the effluent discharge from wastewater treatment plants (WWTP) for all concerned industries failed to comply with (i) oil and grease (O&G) national and international tolerable parameter limits or the (ii) fecal coliforms national standard. In addition, a compliance level of 66.7% was observed for key water quality monitoring parameters (pH, dissolved oxygen (DO), biochemical oxygen demand (BOD), chemical oxygen demand (COD), total suspended solids (TSS), and heavy metals (i.e., lead (Pb), cadmium (Cd), and chromium (Cr)). Following these study findings, one industry was closed by the REMA for deliberately discharging untreated effluent into an adjacent river. This study recommends the adoption of the best available technology for effluent treatment, installation or renovation of existing WWTPs, and the relocation to industrial zones of industries adjacent to fragile environments.
1. Introduction
Environmental protection and sustainability must be given priority in any single development project, to ensure a healthy environment for current and future generations. Industries play a key role in every country’s development [1]. However, industrial wastewater effluents are major factors in a variety of water pollution problems [2,3]. Wastewater treatment is described as a multistage system, whose performance depends on the technology involved in each stage [4,5]. In general, the more stages that are involved, the higher level of treatment is achieved. The most complex system template for wastewater treatment would comprise four stages: pre-treatment, primary treatment, secondary treatment, and tertiary treatment. Each stage could be performed using various processes and technologies [6].
Rwanda is rapidly developing, and this development goes together with industrialization. However, as was observed in different industrialized countries, industrialization causes environmental pollution problems, mainly linked to poor industrial waste management [7,8]. The case of China’s Taihu lake eutrophication in 2007, which resulted from intensive industrial nutrients load [8], showed that it is imperative for developing countries to learn from the mistakes made in the past by developed countries, while developing their industrial sector. To achieve this, large scale and long-term industrial monitoring is needed, despite the political will and financial implications, which sometimes hinder monitoring in developing countries.
Along this journey of development, Rwanda has recognized the importance of environmental resiliency in sustainable development [9]. The country is serving as a model for different countries, as a rapidly developing country recognizing environmental protection as a driver of global and national economic development (an emerging concept termed “green growth”) and climate resilience, where environmental sustainability is a key development guiding principle. With the 2005 Environmental Organic Law and establishment of the Rwanda Environment Management Authority (REMA), the regulatory body for all environment related issues in Rwanda, a set of policies and regulations has been developed with compliance requirements for industrial wastewater effluent discharge [10,11]. The country has put much effort into developing industrial zones, and recently all industries located in the former Gikondo industrial zone, which is a wetland, have been relocated to the Kigali Special Economic Zone (KSEZ), in order to comply with the current environment law [12]. Apart from the KSEZ, other industrial zones have been developed in different districts across the country, and new industrial development projects are not allowed outside those industrial zones.
According to Rwanda’s regulations, every industrial zone must have a centralized WWTP. However, all industries in that industrial zones are required to have their own WWTPs for primary treatment of their specific effluent, before being channeled to the centralized WWTP [12,13]. Industries that were located outside the former Gikondo industrial zone and not yet relocated were also requested to put in place WWTPs, but some of them are still causing environmental pollution to adjacent fragile ecosystems.
During recent inspections conducted by the REMA, the agency in charge of environmental compliance in Rwanda, it was found that different industries outside industrial zones were purposely discharging untreated or substandard wastewater effluent into the environment, even though the owners knew that it is prohibited by national and international laws and regulations [10,11,12]. This has a negative impact on the country’s green growth and environmental resilience targets, since it is known that wastewater treatment plant discharge is often a principal source of surface water contamination [14]. Therefore, for any country aiming at environmental resilience, such as Rwanda, there is a need for large-scale and long-term monitoring studies to investigate any industrial wastewater discharge that can trigger irreversible environmental damage, such as that observed in China’s lake Taihu [8]. Algal blooms have been reported in Taihu Lake since 1987 and cost millions of dollars for each occurrence. In 2007, the lake was totally eutrophicated, causing the shutdown of drinking water to Wuxi city, previously supplied from the lake.
This study focuses on industrial wastewater discharge and data driven compliance investigation of possible deliberate discharge of untreated effluent for industries outside industrial zones in Rwanda. Considering the environmental concerns raised regarding industries outside industrial zones and the country’s commitment to green growth and environmental resilience, five industries operating outside designated industrial zones were selected across the country. The aim of this study was to assess the short-term, medium-term, and long-term environmental impact of the selected industries on the environment. This was done by analyzing the quality of effluent discharged by their WWTPs for a one-year period, with reference to national and international wastewater discharge standards. With reference to different studies done on WWTP performance and their threats to the environment [1], in this study, a particular emphasis was put on environmental pollution from leather industries [15], textile industries [16], and brewery industries [17] outside industrial zones in Rwanda, to resolve the issue of a lack of data and evidence on the extent of environmental pollution form those industries.
The approach of this study started with understanding the main objectives of the assignment, which were to determine the environmental impacts of industry on the environment. i.e., on water, soil quality, and human health; and to propose solutions to mitigate these impacts on a short-, medium- and long-term basis. In order to determine the environmental impacts of the industrial activities, one of the steps taken was to collect primary data by analysis of water quality and industry’s WWTP performance regarding Rwanda’s and international standards, and legal and regulatory frameworks.
This study assesses effluent quality for each of the concerned industry’s wastewater treatment systems and its possible threats to the receiving environment. It also investigates the deliberate discharge of untreated effluent into the environment. Finally, this study recommends the most technically suitable and environmentally friendly practices that should be put in place, in order to comply with current laws and regulations. The findings serve as an evaluation tool for wastewater system owners and/or operators and as a decision-making tool for regulatory authorities.
2. Materials and Methods
2.1. Data Acquisition
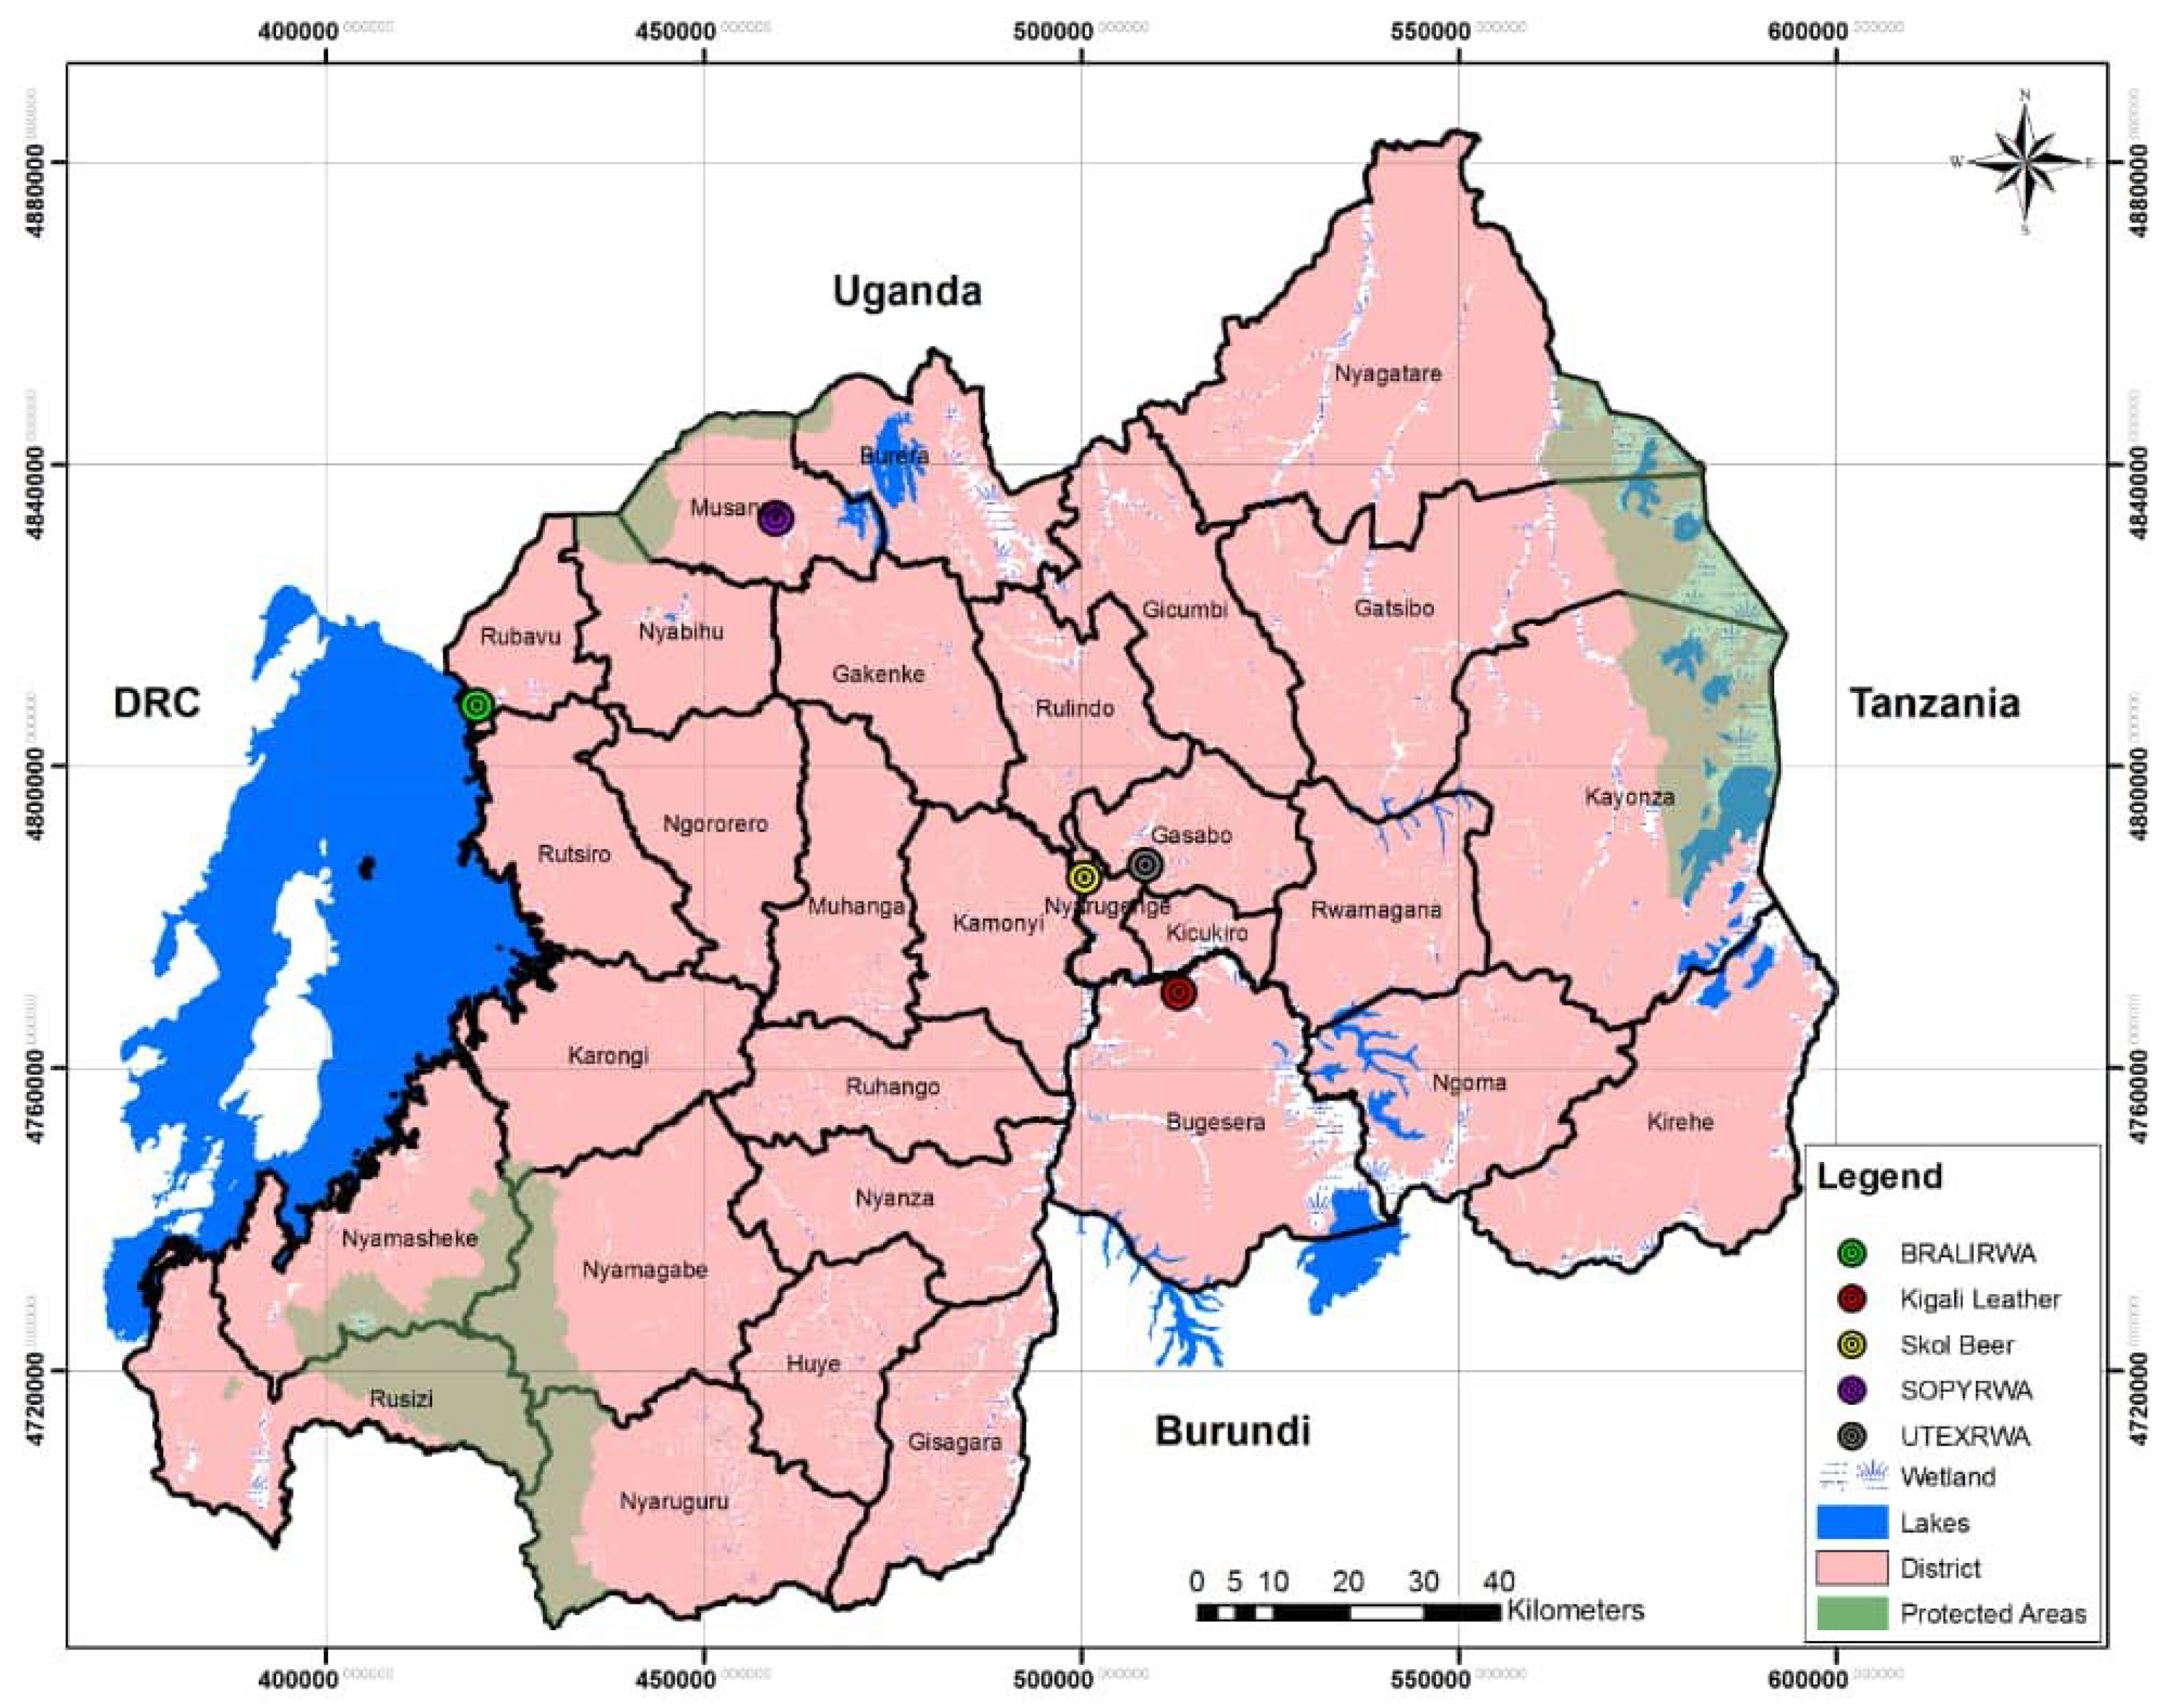
The five selected industries are among industries audited and monitored by REMA due to previous environmental pollution issues (see their location in Figure 1). For quantitative analysis, we acquired data for the selected industries’ wastewater treatment systems, for laboratory analysis of wastewater sampling conducted from December 2019 to August 2020. The sampling was meant to be done every 2 months from December 2019 up to April 2020, but due to the COVID-19 pandemic, the third sampling was delayed until July and August 2020. At every selected industry, the sampling points were proposed as follows:
- -
- The first sampling point was where wastewater from the factory is discharged into the industry’s treatment plant (“Inlet”);
- -
- The second point was where treated effluent from the WWTP is discharged into the environment (“Outlet”); and
- -
- Third sample point, where possible, was in a nearby receiving water bodies, where the concerned industry discharges its effluent (“R. environment”).
For Kigali Leather Ltd., located in Bugesera District, Eastern Province, due to the unprecedented circumstances caused by COVID-19, only one set of samples was taken in December from the industry. For Bralirwa Plc, located in Rubavu District, Wester Province, the third sampling for the receiving environment sampling point was done at the discharge of granular activated carbon (GAC) filtration system.
2.2. Sample Collection and Preservation
Wastewater samples were collected using a systematic method, in order to be representative of the wastewater of the concerned industry in a reproducible, tangible, and useful manner. Collected samples designated for physical-chemical analyses were taken in 1-L HDPE (High Density Polyethylene) plastic containers. Before collecting a sample, and in order to avoid any contamination, the plastic containers were cleaned and rinsed three times using the wastewater to be sampled. For microbiological analysis, the samples were collected in sterilized bottles and all samples collected were kept in an ice box (4 °C), to avoid any changes in the targeted parameters. The samples designated for heavy metals analysis were taken in bottles containing nitric acid of high purity (65% volume concentration), to prevent metal precipitation as hydroxide and to stop the redox reaction that occurs on metal at alkaline pH. All the samples were placed in a cooler box with ice for transportation to the Laboratory of the School of Science, College of Science and Technology, University of Rwanda, and stored in fridge at 4 °C [4].
2.3. Measurement of In Situ Parameters
In situ (on site), some parameters were measured, such as pH, conductivity, salinity, total dissolved solids (TDS), and DO, using an HQ40d Portable Multi Meter (Hach, Malaysia) comprised of electrode sensors for pH, conductivity, salinity, TDS, DO, and oxydo-reduction potential (ORP), for water and wastewater measurements.
2.4. Laboratory Analysis
The samples were analyzed in the Chemistry laboratory of the College of Science and Technology, University of Rwanda. During laboratory analysis, a UV spectrophotometer (Shimadzu Corporation, Kyoto Japan) was used for physio-chemical analysis and an atomic absorption spectrometer (AAS) (Shimadzu Corporation, Japan) was used for heavy metal measurement. The following parameters listed in Table 1 were selected for monitoring during this study.
2.4.1. Biochemical Oxygen Demand (BOD5)
Biochemical oxygen demand expresses the amount of oxygen utilized when the organic matter in a given volume of water is degraded biologically. The methods that were used comprised completely filling an airtight bottle of a specified size and incubating it at 20 °C for 5 days. BOD5 was calculated as the difference between the initial dissolved oxygen and the dissolved oxygen measured after 5 days’ incubation using a luminescent dissolved oxygen (LDO) apparatus. The BOD5 was obtained as the difference between the quantity of oxygen before and after the incubation procedure at 20 °C in darkness. BOD5 (20 °C) = [DO] initial − [DO] final [6].
2.4.2. Chemical Oxygen Demand (COD)
Chemical oxidation demand is used as a measure of the oxygen equivalent of the organic matter content of a sample that is susceptible to oxidation by a strong chemical oxidant (digestion solution) [18]. The strong oxidants (potassium dichromate (K2Cr2O7)) were used to oxidize all organic matter. The reduction of Cr4+ to Cr3+ indicates the presence of organic matters in water, and the solution becomes green-blue. The solutions that were used in this analysis were Ag2SO4 and H2SO4, as catalysts to oxidize bio-organic matter. The reading of absorbance was done the next day at 600 nm using a UV spectrophotometer [4].
2.4.3. Oil and Grease (O&G)
Oil and grease were determined by applying the Weibull method (Patwardhan, 2017). This method is generally applicable for determining oil and grease from food and water. At a given concentration of HCl, HCl 4N releases bound intracellular fat or protein. Lipids were collected on a wet filter, washed with warm water until the acid disappeared, and then dried and extracted with petroleum ether in a Soxhlet apparatus. The ether solution was distilled, and the residue was dried and weighed [19].
2.4.4. Total Suspended Solids (TSS)
The satisfaction of total suspended solid measurement levels in water depends on the different purposes of water use, such as irrigation, bathing, and drinking. TSS in water is associated with natural sources, sewage urban runoff, and industrial wastewater. The gravimetric method with a cellulose ester filter (pore size = 0.45 μm and diameter = 47 mm) was applied in this work, which involved the following steps: (i) the filter paper was washed and dried then cooled and weighed; (ii) the filtration apparatus was assembled; (iii) the filter paper was wetted with distilled water, the sample was stirred, and a given volume was pipetted, while stirring the sample; (iv) the sample was filtered and washed three times; (v) the filter was transferred to an evaporating dish and dried, then cooled and weighed; (vi) calculation in mg/ L and repetition of steps for verification [18]. Calculating the TSS concentration: mg suspended solids / L = [(A − B) × 1000]/ volume of sample (mL), where A = weight of filter + dried residue (mg) and B = weight of filter (mg).
2.4.5. Nutrients Analysis
- (a)
- Ortho Phosphate
Phosphate was determined in the wastewater samples using a UV spectrophotometer at 880 nm. In this method, ammonium molybdate and potassium antimonyl tartrate reacts in an acid medium with orthophosphate, to form a heteropoly acid–phosphomolybdic acid that is reduced to intensely-colored molybdenum blue by ascorbic acid [20].
- (b)
- Ammonia Nitrogen
The ammonia nitrogen reacts with hypochlorite ions formed by the alkaline hydrolysis of dichloro-isocyanurate and with sodium salicylate in the presence of sodium nitro prussiate, to form a blue dye, which appears green due to the interference of the yellow color of reagents. Measurement was performed using a UV spectrophotometer at 655 nm [20].
2.4.6. Heavy Metal Analysis
The analysis of heavy metals (i.e., Lead-Pb, Cadmium-Cd, and Chromium-Cr) involved digestion of unfiltered samples with nitric acid, in order to obtain dissociation of the metals in samples and then the samples were filtered on glass fiber filters (pore size = 0.45 μm and diameter = 47 mm), before analyzing them to avoid the clogging of the AAS aspirator capillary [21]. The concentration of these metals was determined using an atomic absorption spectrophotometer (AAS with air/acetylene flame method).
2.4.7. Bacteriological Parameters Analysis
Bacteriological analysis is a method of analyzing water and wastewater, to estimate the number of bacteria present [14]. For the bacteriological analysis, a membrane filtration method was applied to all the samples collected, by filtering samples through a sterile ester membrane of cellulose (pore size = 0.45 μm and diameter = 47 mm) with a vacuum pump. The coliforms were identified by counting colonies on Petri dishes incubated at 44 °C for 24 h [15,22].
3. Results and Discussion
3.1. pH
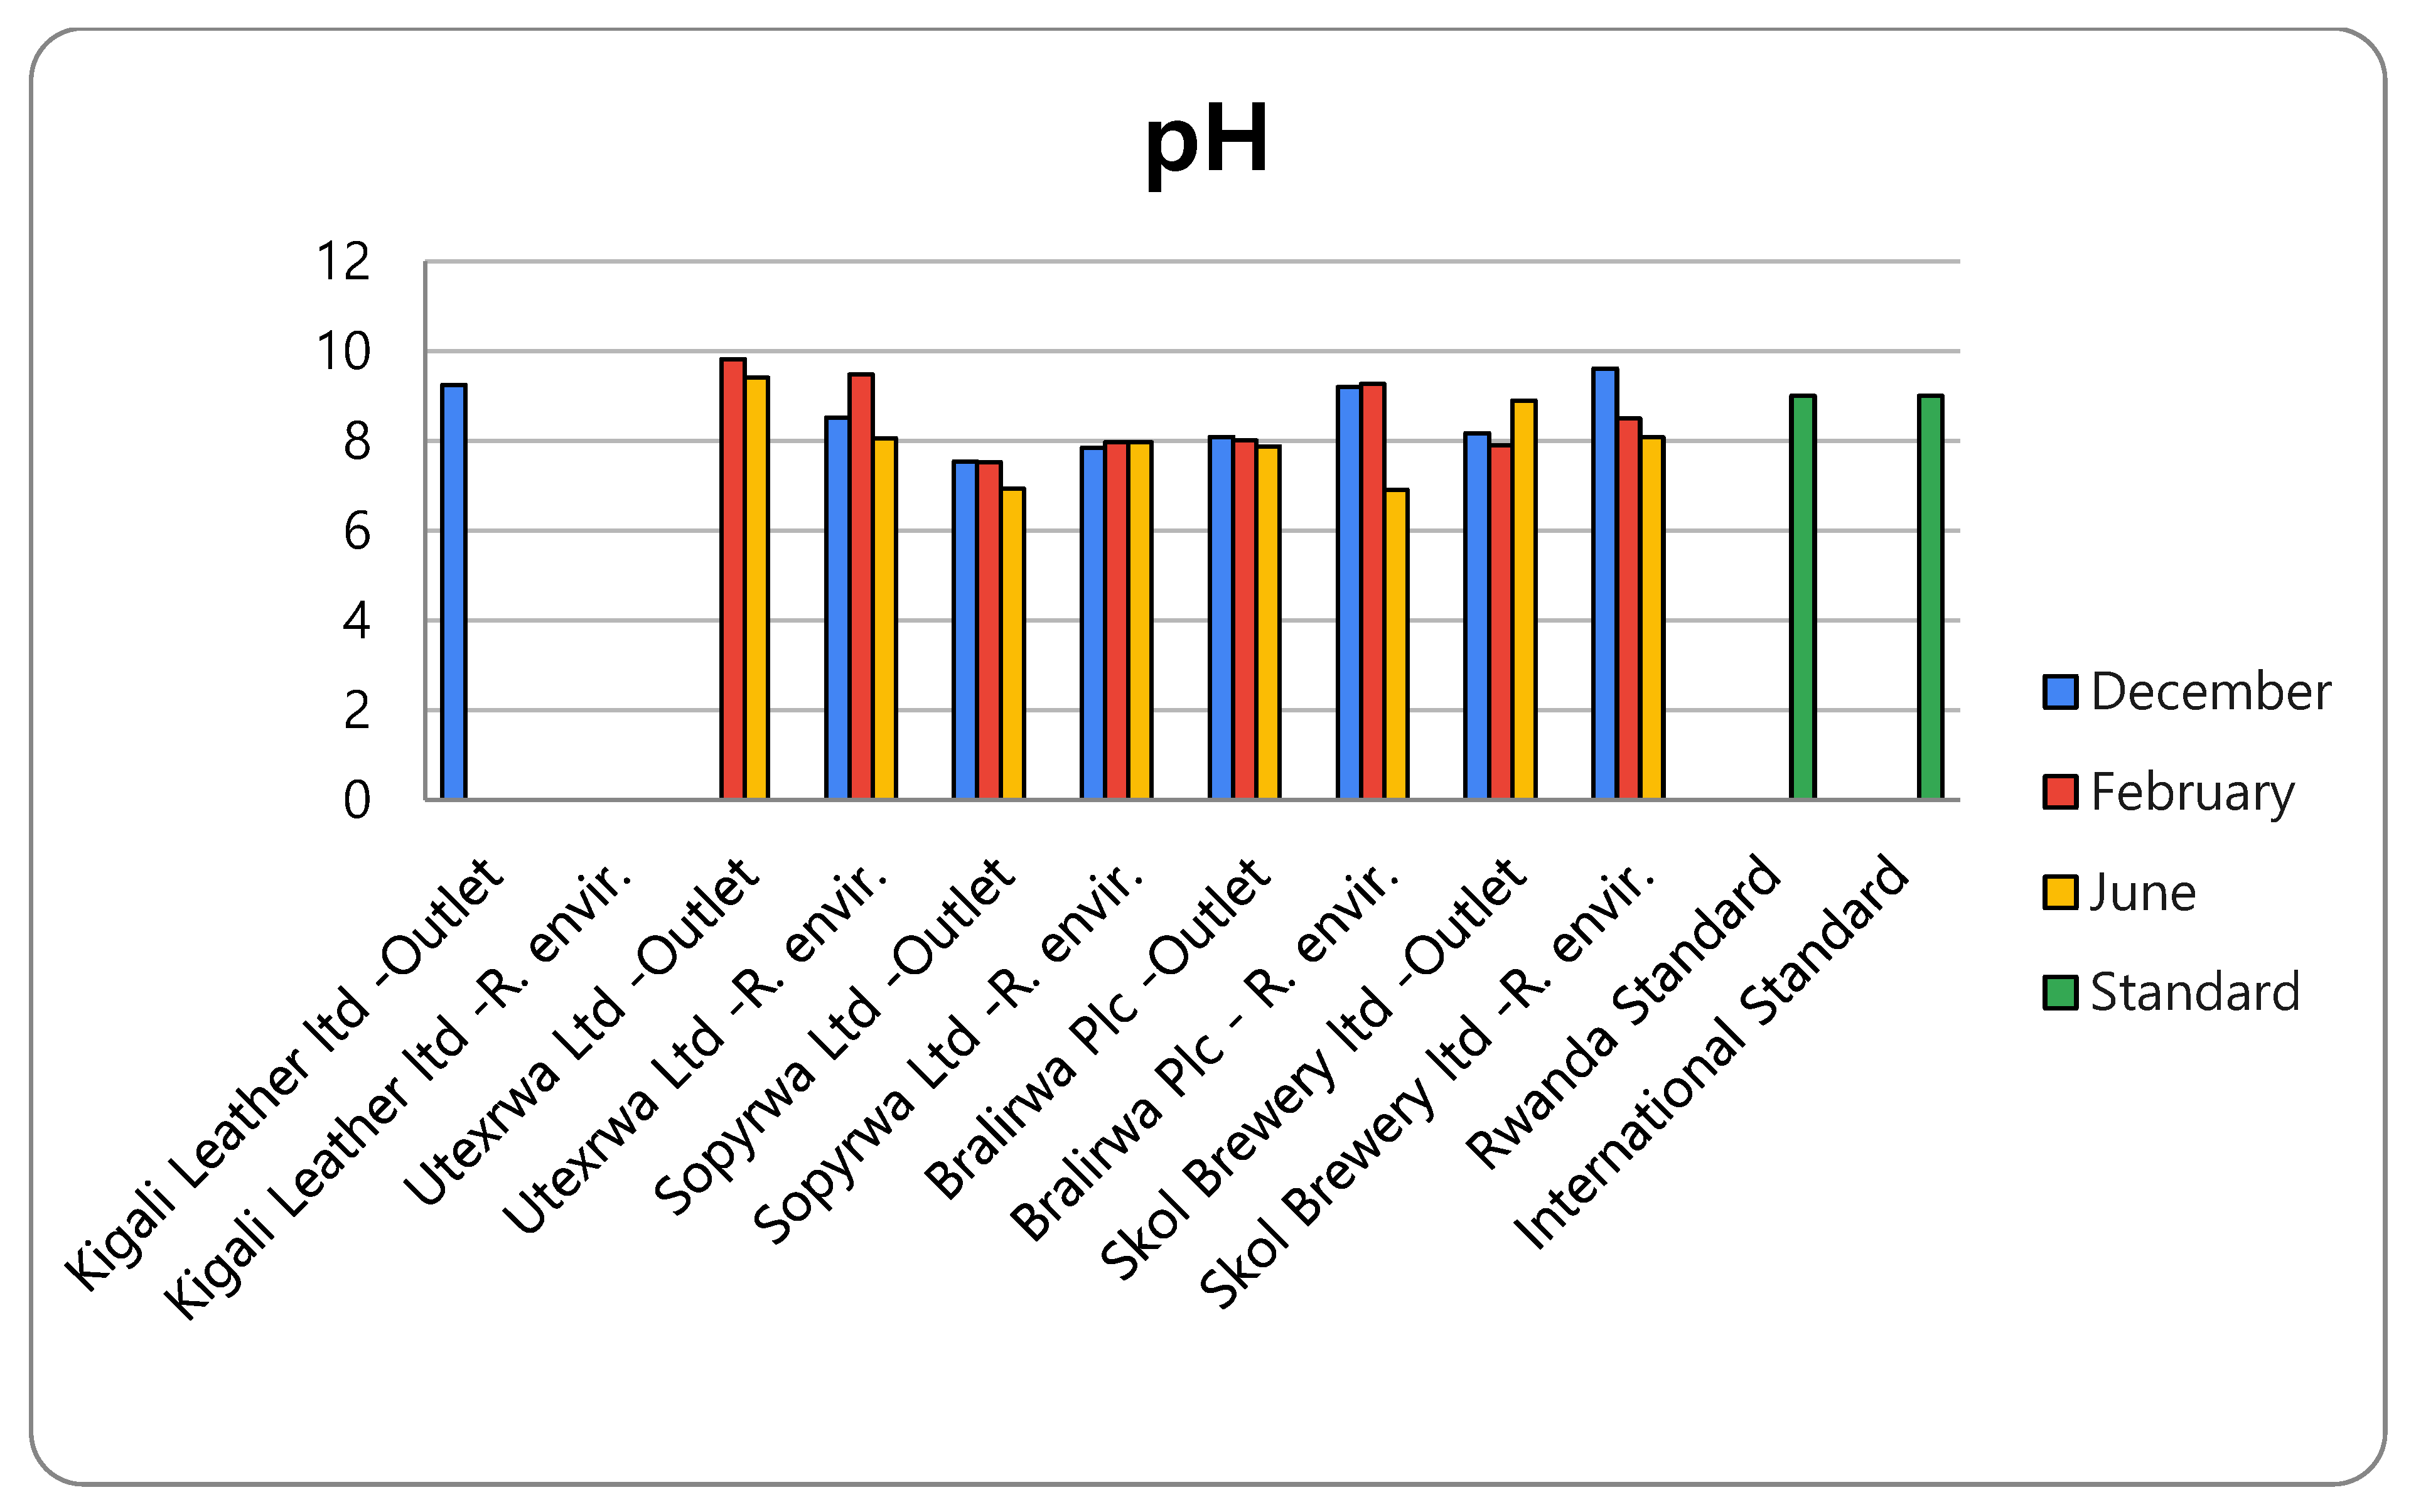
The results of pH from the monitoring of discharged effluent (for WWTP outlet and receiving environment: second and third sampling points) at five selected industries ranged between 6.93 (Sopyrwa Ltd., Musanze, Rwanda) and 9.82 (Utexrwa Ltd., Kigali, Rwanda). The high pH levels of effluent at the Utexrwa WWTP outlet, exceeding tolerance limits, were likely to have resulted from the non-operation of the plant to reduce the quantities of caustic soda (NaOH) applied during the bleaching and mercerizing stages of the textile process [16]. This is likely to affect the aquatic life in the stream that flows through the Rwampara wetland and into the Nyabugogo wetland. Therefore, this has to be corrected, by operating the factory’s WWTP at an optimal level. Table 2 presents the results of pH at all sampling sites in comparison to Rwandan [10] and international [11] effluent discharge standards (i.e., “Rda Std” and “Int’l Std”, respectively in Table 2).
As shown in Table 2 above, in samples taken from the WWTP outlet and receiving environment for all five industries for the covered period of the study, only 7 out of 24 did not comply with admissible levels of pH, regarding the effluent discharge standard, which represents a compliance level of 70.8%. Figure 2 represents the pH levels per site.
High pH effluent levels can cause plant’s soil pH to increase, which disrupts the plant’s ability to absorb certain nutrients [23]. High pH levels in waters can damage the gills and skin of aquatic organisms and cause death at levels over 10.0 [24]. On the other hand, high pH causes a bitter taste, water pipes and water-using appliances become encrusted with sediments, and it depresses the effectiveness of the disinfection with chlorine, thereby causing the need for additional chlorine when the pH is high [25]. This is likely to affect the soils and cultivation occurring in wetlands adjacent to the concerned industries and the aquatic life in rivers and lakes where effluent is discharged.
3.2. Biochemical Oxygen Demand (BOD5)
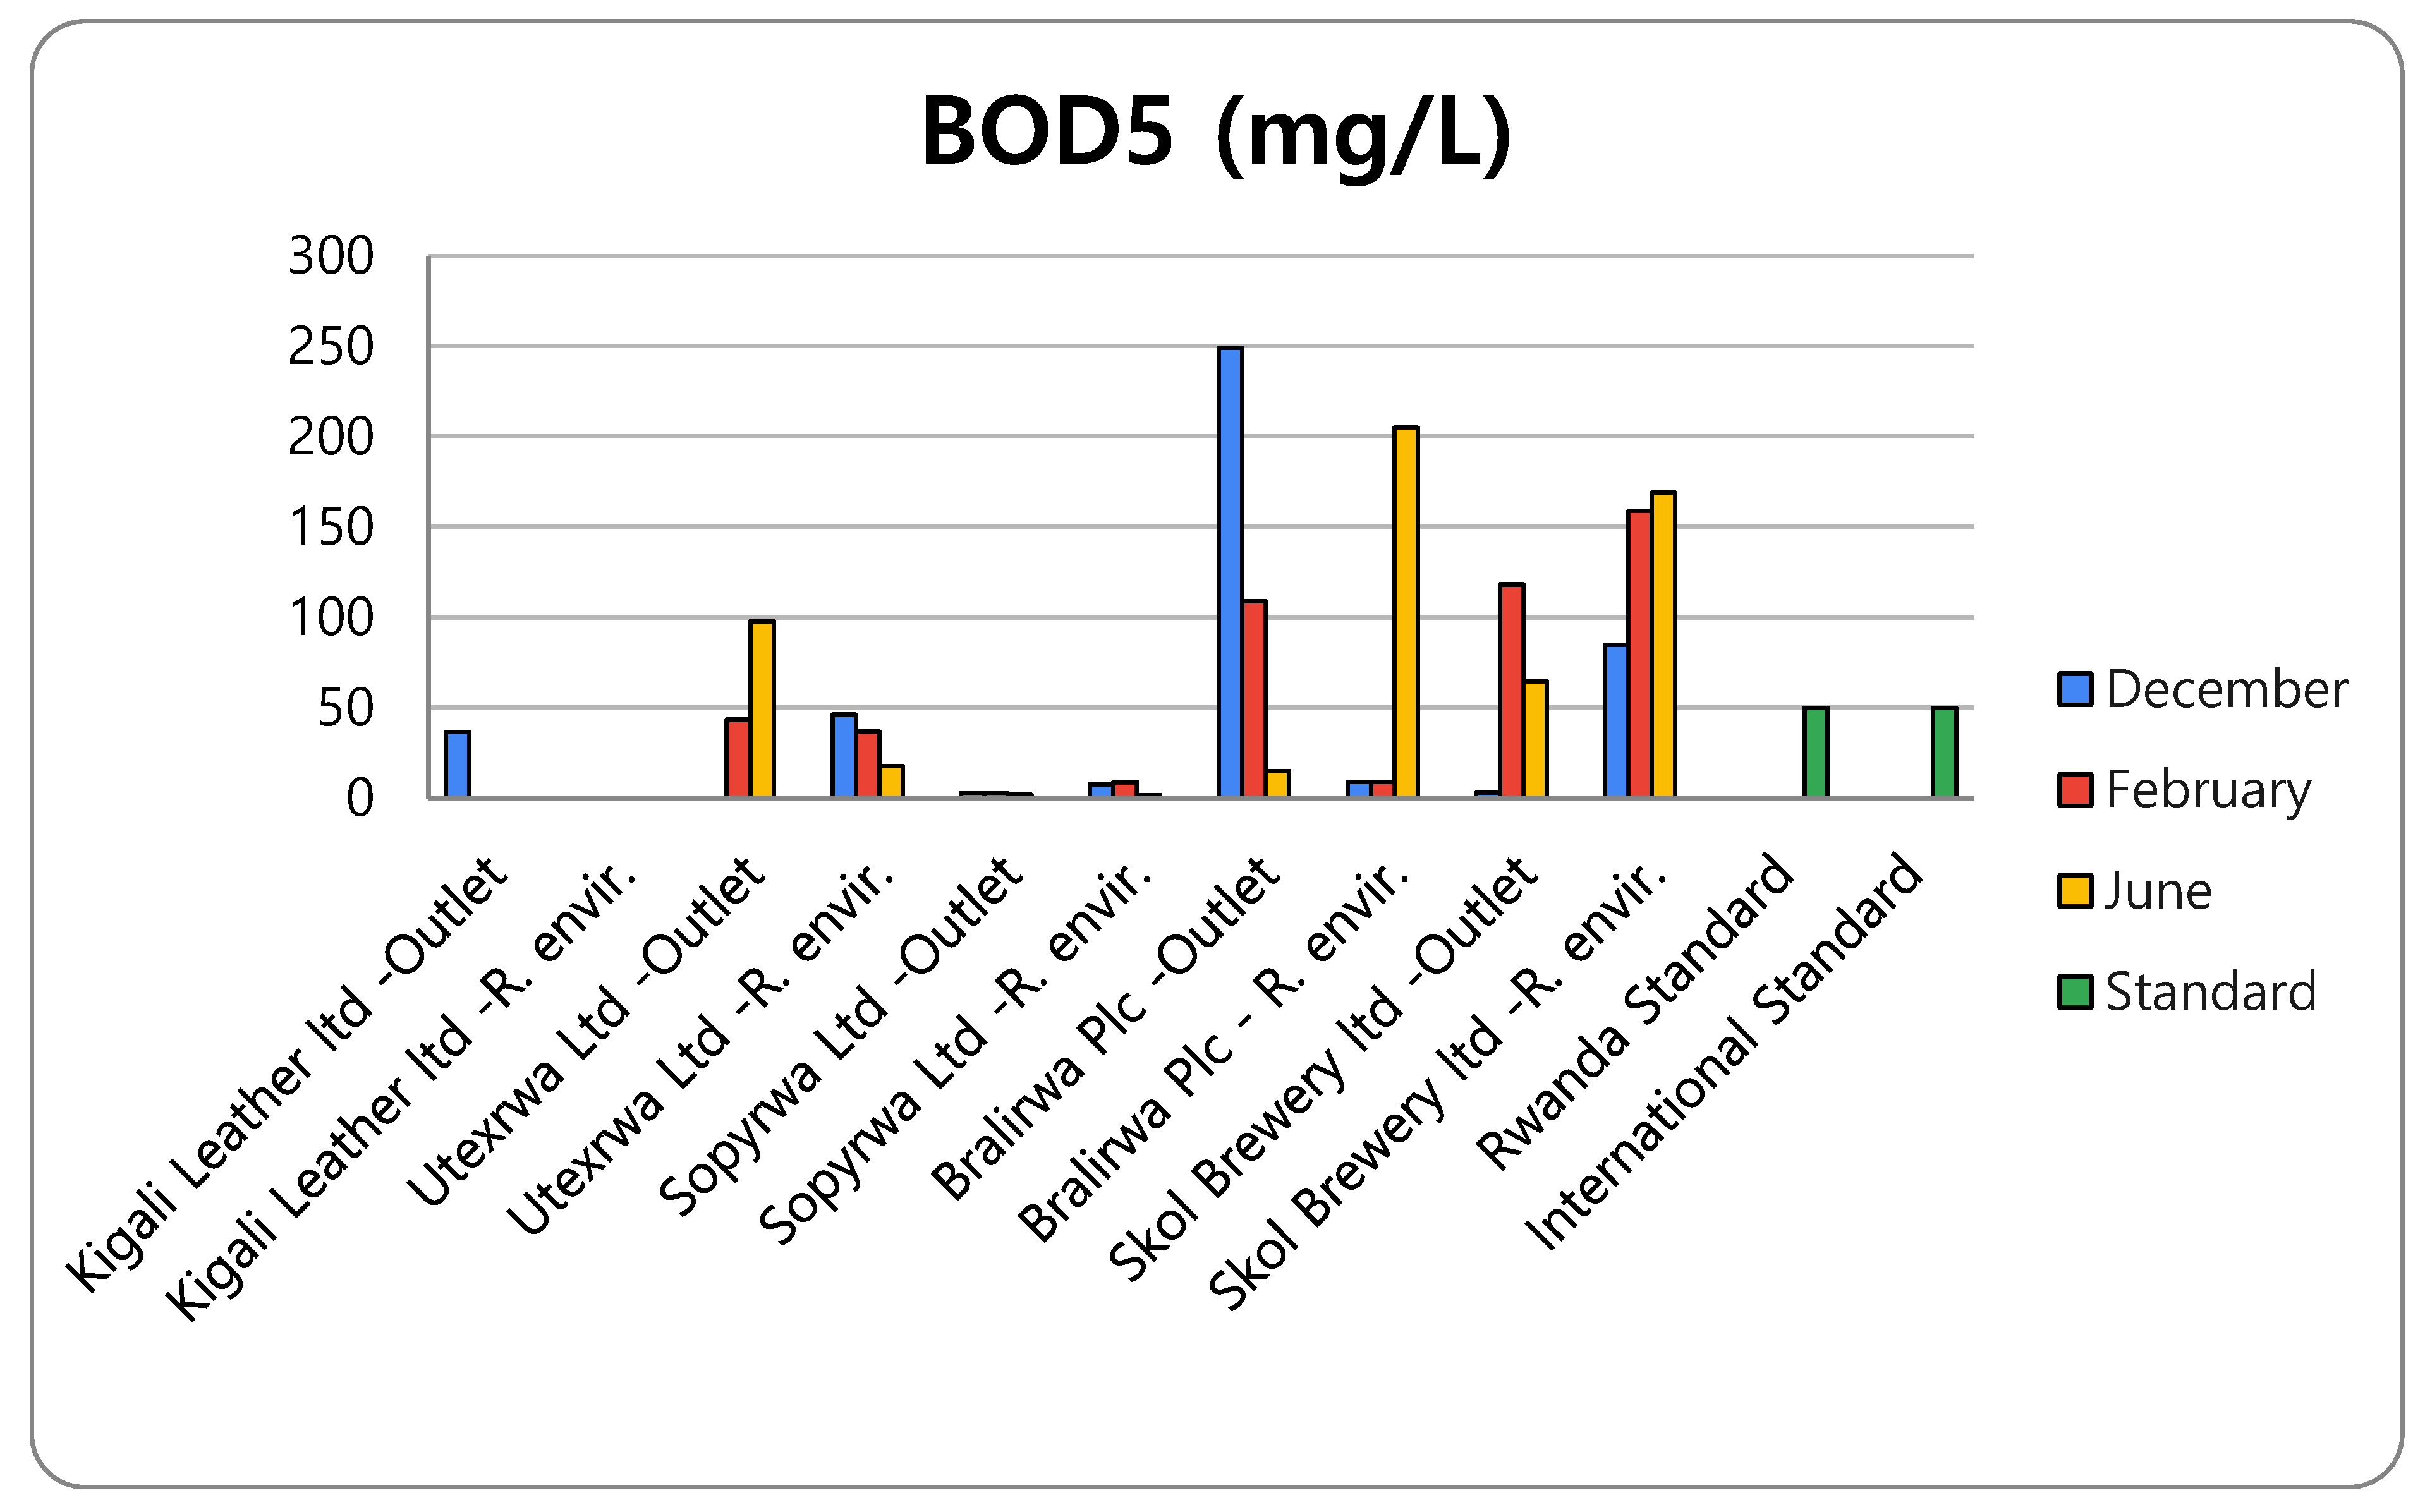
The results of BOD5 from the monitoring of discharged effluent at five selected industries ranged between 1.79 mg/L (Sopyrwa Ltd.) and 249 mg/L (Bralirwa Plc). The higher BOD5 value for Bralirwa Plc in December compared to other months could have been due to the full production of brewing, packaging line 2 and 3, in addition to the oxidizing polymers used at the WWTP, which were out of stock for the period of December and February, as explained by Bralirwa. This could be resolved by the increasing filtration during brewing, to reduce suspended solids going to the WWTP and the dilution of influent by employing more intense cleaning activities (as observed for the inlet BOD5 value in June while applying this practice). Table 3 presents the results of BOD5 at all sampling sites in comparison to Rwandan [10] and international [11] effluent discharge standards (i.e., “Rda Std” and “Int’l Std”, respectively in Table 3).
With regards to BOD5 permissible levels for effluent discharge standards, only two industries (Sopyrwa Ltd. and Kigali Leather Ltd.) out of five monitored complied with the permissible discharge levels of BOD5 for all taken and analyzed samples, which represents a compliance level of 40%. However, taking into account all samples taken from the WWTPs outlets and receiving environments for all concerned industries, for the covered period of the study, 8 out of 24 did not comply with admissible discharge levels of BOD5, which represents a compliance level of 66.7% with national [10] and international [11] standards. Although the compliance level in the receiving environments was relatively high, it should not be overlooked that this level of compliance may be lower during the dry season, as it can be greatly affected by the flow rate of the receiving water body, depending on the climate. Figure 3 represents the average BOD5 distribution per site.
All BOD5 refers to the amount of oxygen required for the biotic degradation of organic matter in bodies of water. When BOD5 levels are high, DO levels decrease, because the oxygen that is available in the water is being consumed by the bacteria. Since less DO is available in the water, fish and other aquatic organisms may not survive [25].
3.3. Chemical Oxygen Demand (COD)
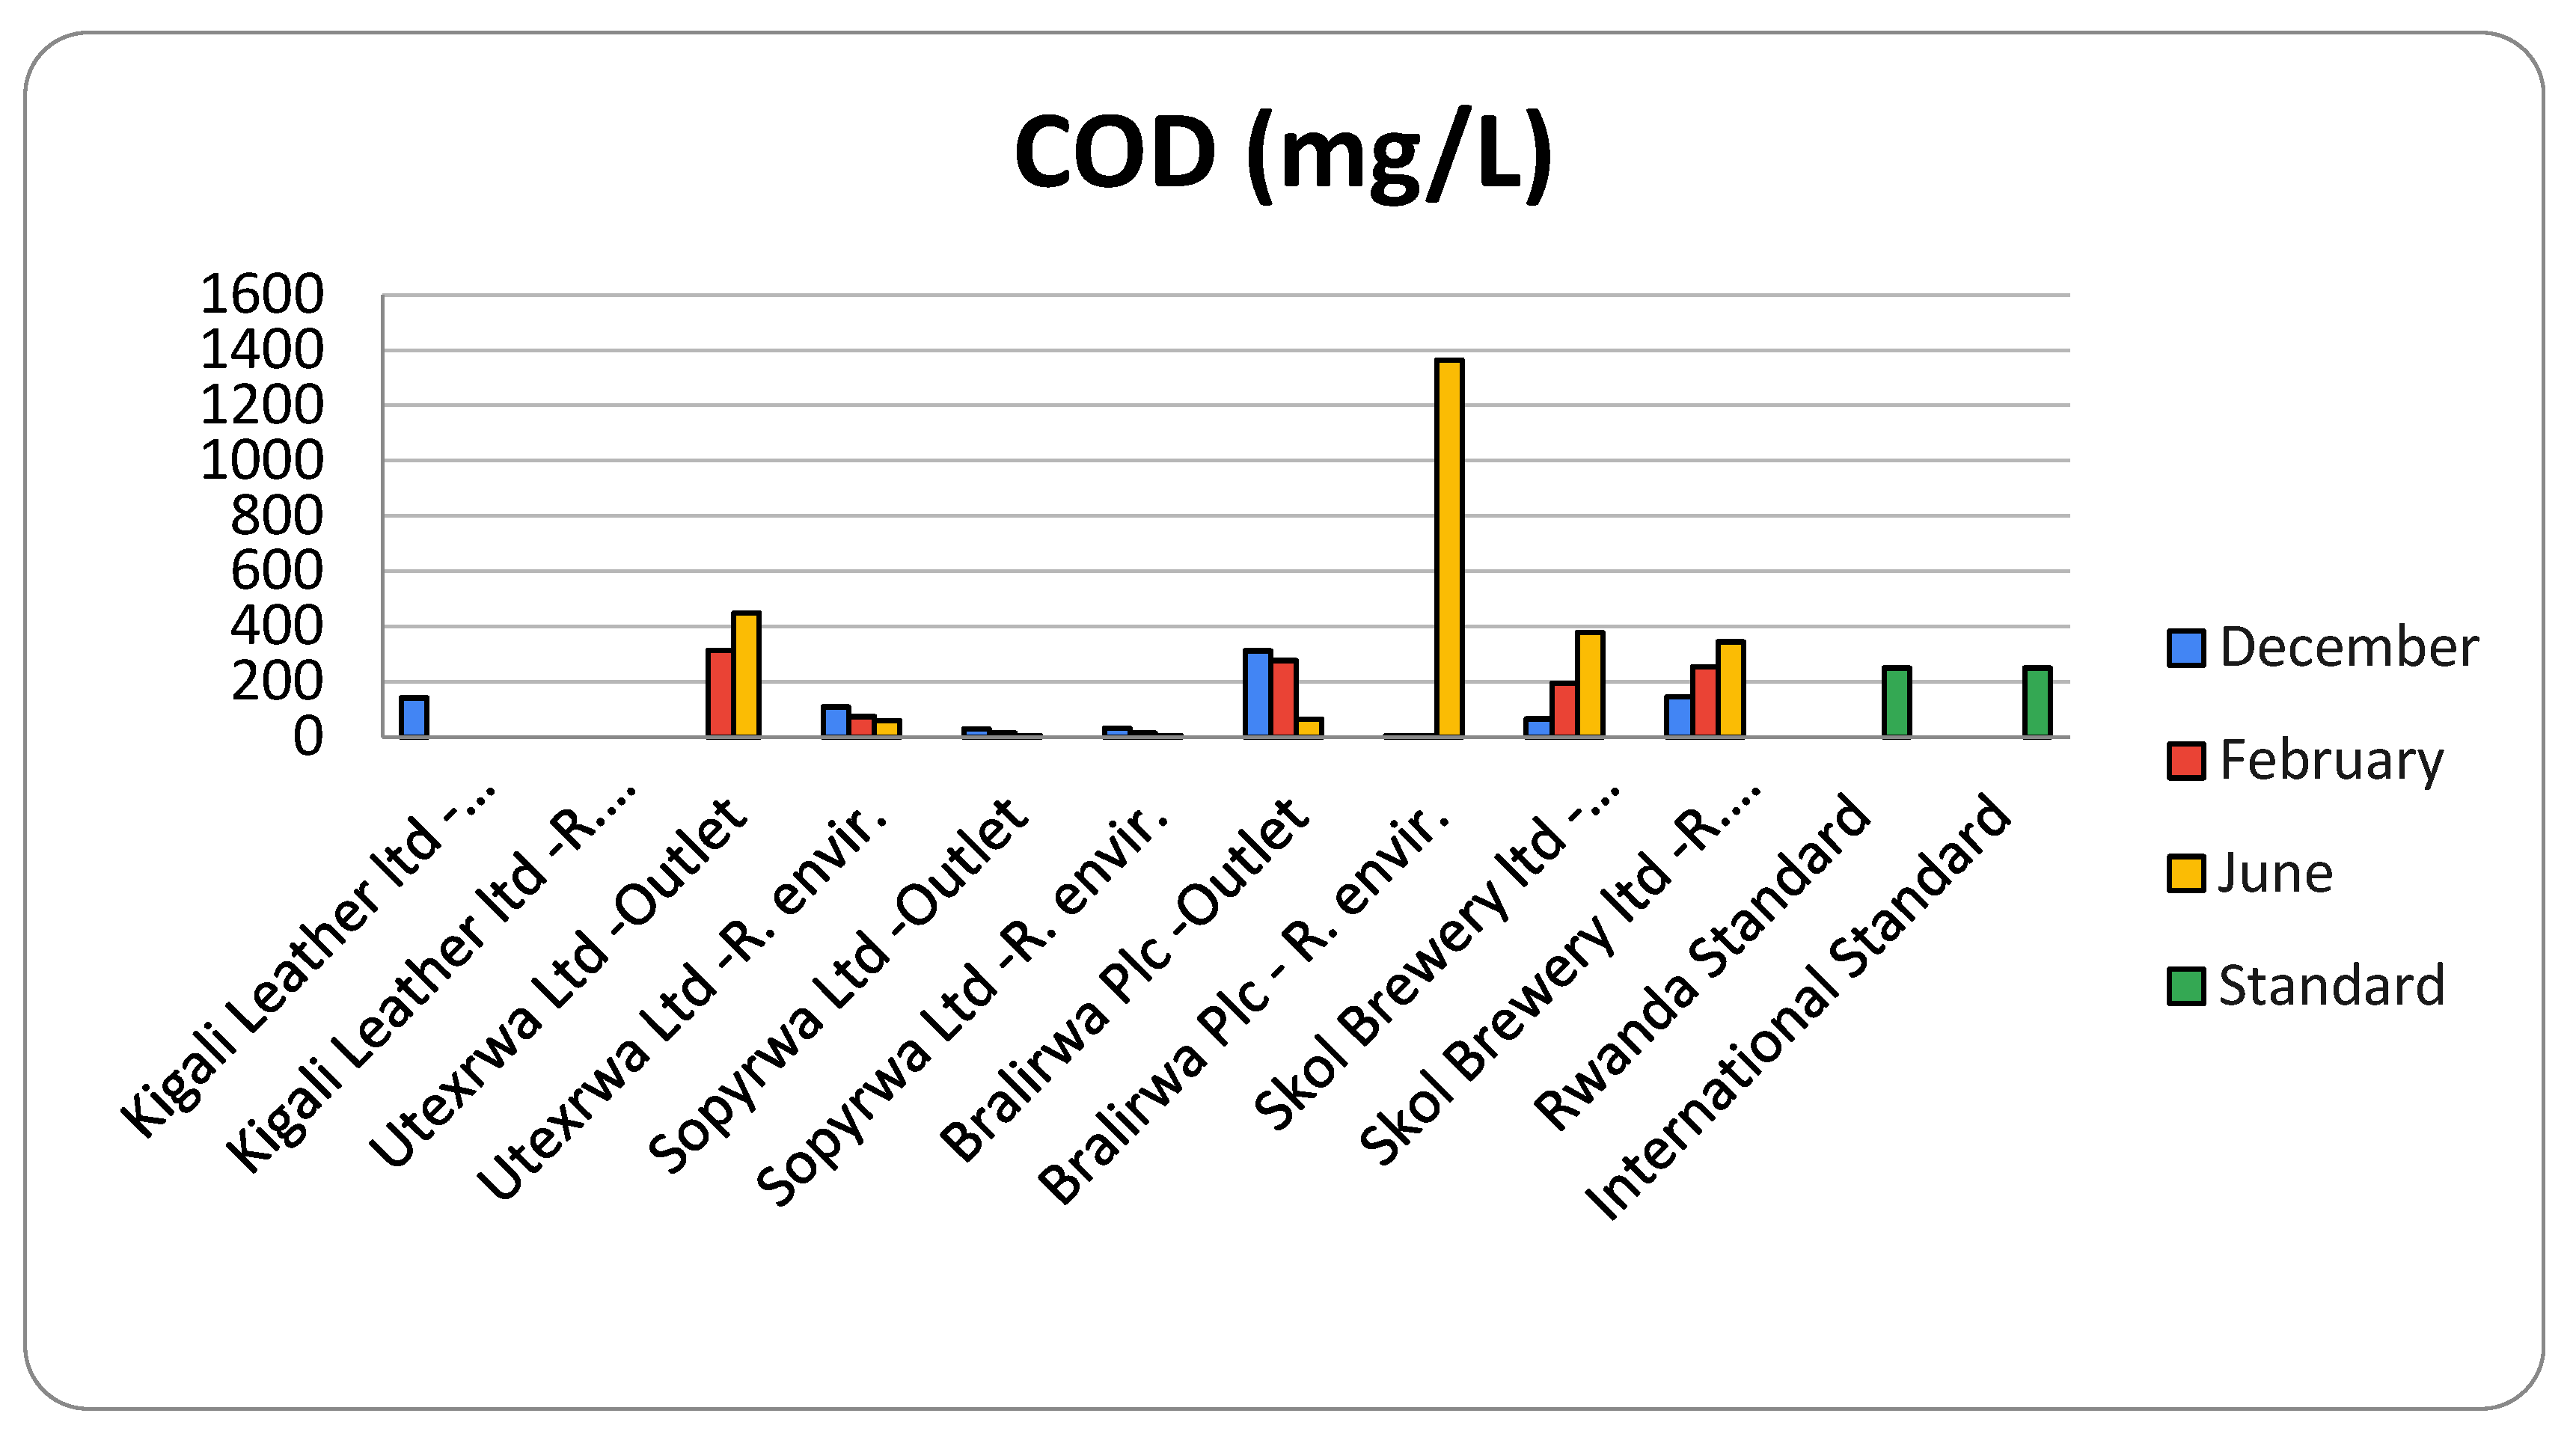
The results for chemical oxygen demand from the monitoring of discharged effluent at the five selected industries ranged between 4 mg/L (Sopyrwa Ltd.) and 1364 mg/L (Bralirwa Plc). The 1364 mg/L COD observed for Bralirwa in June was from a sample taken from the spent Kieselguhr effluent discharged directly to Lake Kivu, without treatment. Higher COD levels for Bralirwa Plc in February compared to other months could be due to the factory’s full production activities and the inefficiency of WWTP, as explained above for BOD5. Increased filtration during brewing, to reduce the suspended solids going to the WWTP, and dilution of influent by more intense cleaning activities should resolve this issue, as observed. Table 4 presents the results of COD at all sampling sites in comparison to Rwandan [10] and international [11] effluent discharge standards (i.e., “Rda Std” and “Int’l Std”, respectively in Table 4).
With regards to permissible COD levels for effluent discharge standards, only two industries (Sopyrwa Ltd. and Kigali Leather Ltd.) out of the five monitored complied for all taken and analyzed samples, which represents a compliance level of 40%. However, considering all samples taken from the WWTPs outlets and receiving environments for all five industries, for the covered period of the study, a compliance level of 66.7% was observed, since 8 out of 24 samples did not comply with admissible discharge levels of COD for national [10] and international [11] standards. Figure 4 represents the COD level distribution per site.
All high COD and BOD5 levels in industry effluent imply higher organic matter levels in the receiving water, leading to increased oxygen consumption by organic matter decomposers. The latter implies the depletion of the oxygen content of the receiving water body, translated as pollution of waters [25].
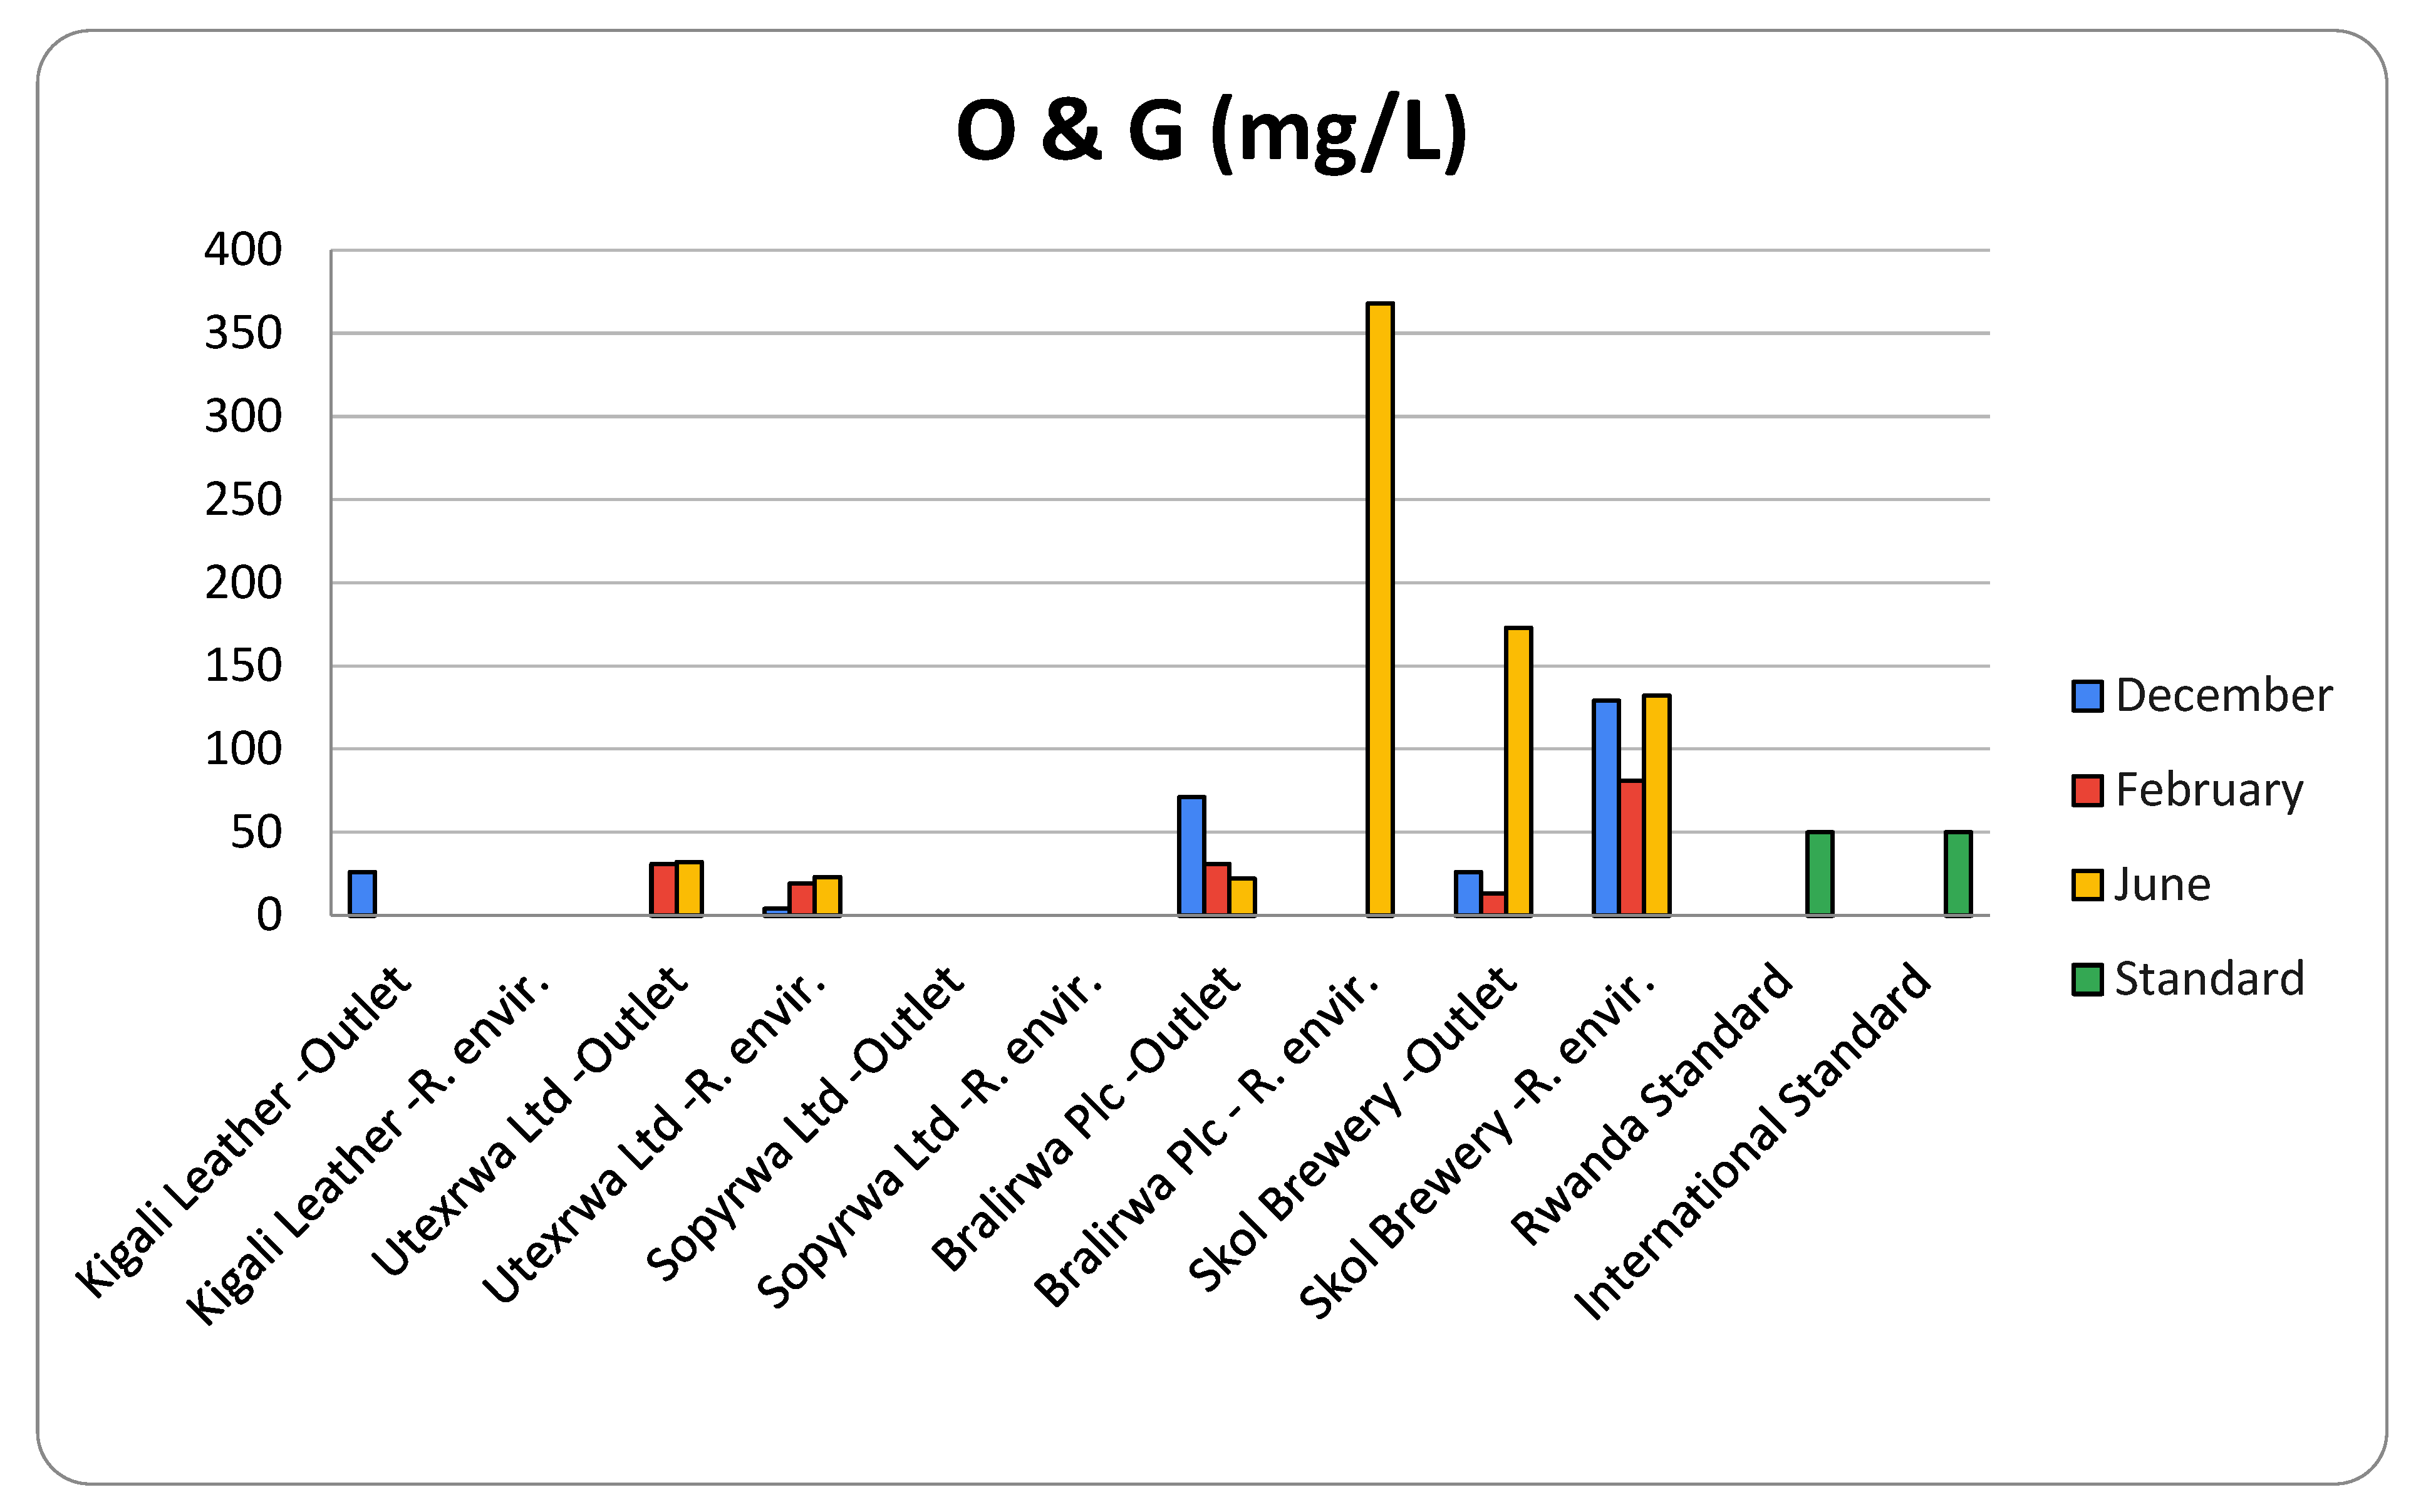
3.4. Oil and Grease
The results for oil and grease from the monitoring of effluent discharged from WWTPs at the five selected industries ranged between 8 mg/L (Utexrwa Ltd., Kigali, Rwanda and Skol Brewery Ltd., Kigali, Rwanda) and 150 mg/L (Utexrwa Plc). However, the sample collected on 21 August 2020 (represented in Table 5 as for June) from wastewater directly discharged by Utexrwa to the wetland (i.e., R. environment in Table 5) had 1764 mg/L of O&G, a value which is far beyond the tolerance limits of the national [10] and international [11] standards (10 mg/L). Considering that this value is a higher value any of the samples at the WWTP inlet, this is a clear indication that Utexrwa released effluent directly to the wetland, without treatment by the WWTP. Failure to remove oil and grease from effluent to below tolerable limits could be due to a non-operating WWTP or a lack of, or inefficient, grease trap at the industry.
Apart from Utexrwa, the results of O&G for Bralirwa Plc from the sample taken at Lake Kivu (i.e., R. environment in Table 5) were 27 mg/L, which is also beyond the national [10] and international [11] tolerance limits. This could have been resulted from spent Kieselguhr being discharged directly from the filtration system into the lake. Table 5 presents the results of O&G at all sampling sites, in comparison to Rwandan and international effluent discharge standards. Table 5 also presents the results of pH at all sampling sites in comparison to Rwandan [10] and international [11] effluent discharge standards (i.e., “Rda Std” and “Int’l Std”, respectively in Table 5).
With regards to the permissible oil and grease levels for effluent discharge standards, all five industries did not comply with permissible levels of O&G for all taken and analyzed samples, which represents 0% compliance. In addition, in all samples taken (including the actual one taken in June at Utexrwa Ltd., which was replaced by the one of August in the Table 5) from WWTPs outlets and receiving environments for all five industries concerned for the period covered by the study, only 2 out of 12 were below the permissible limits of O&G set by national [10] and international [11] standards. This represents a compliance level of 16.7% (the lowest observed for all parameters).
O&G constituents can cause devastating physical effects, such as coating animals and plants with oil and suffocating them by oxygen depletion; be toxic and form toxic products; destroy future and existing food supplies, breeding animals, and habitats; produce rancid odors; and foul shorelines and clog water treatment plants [19]. Figure 5 presents the O&G levels per site.
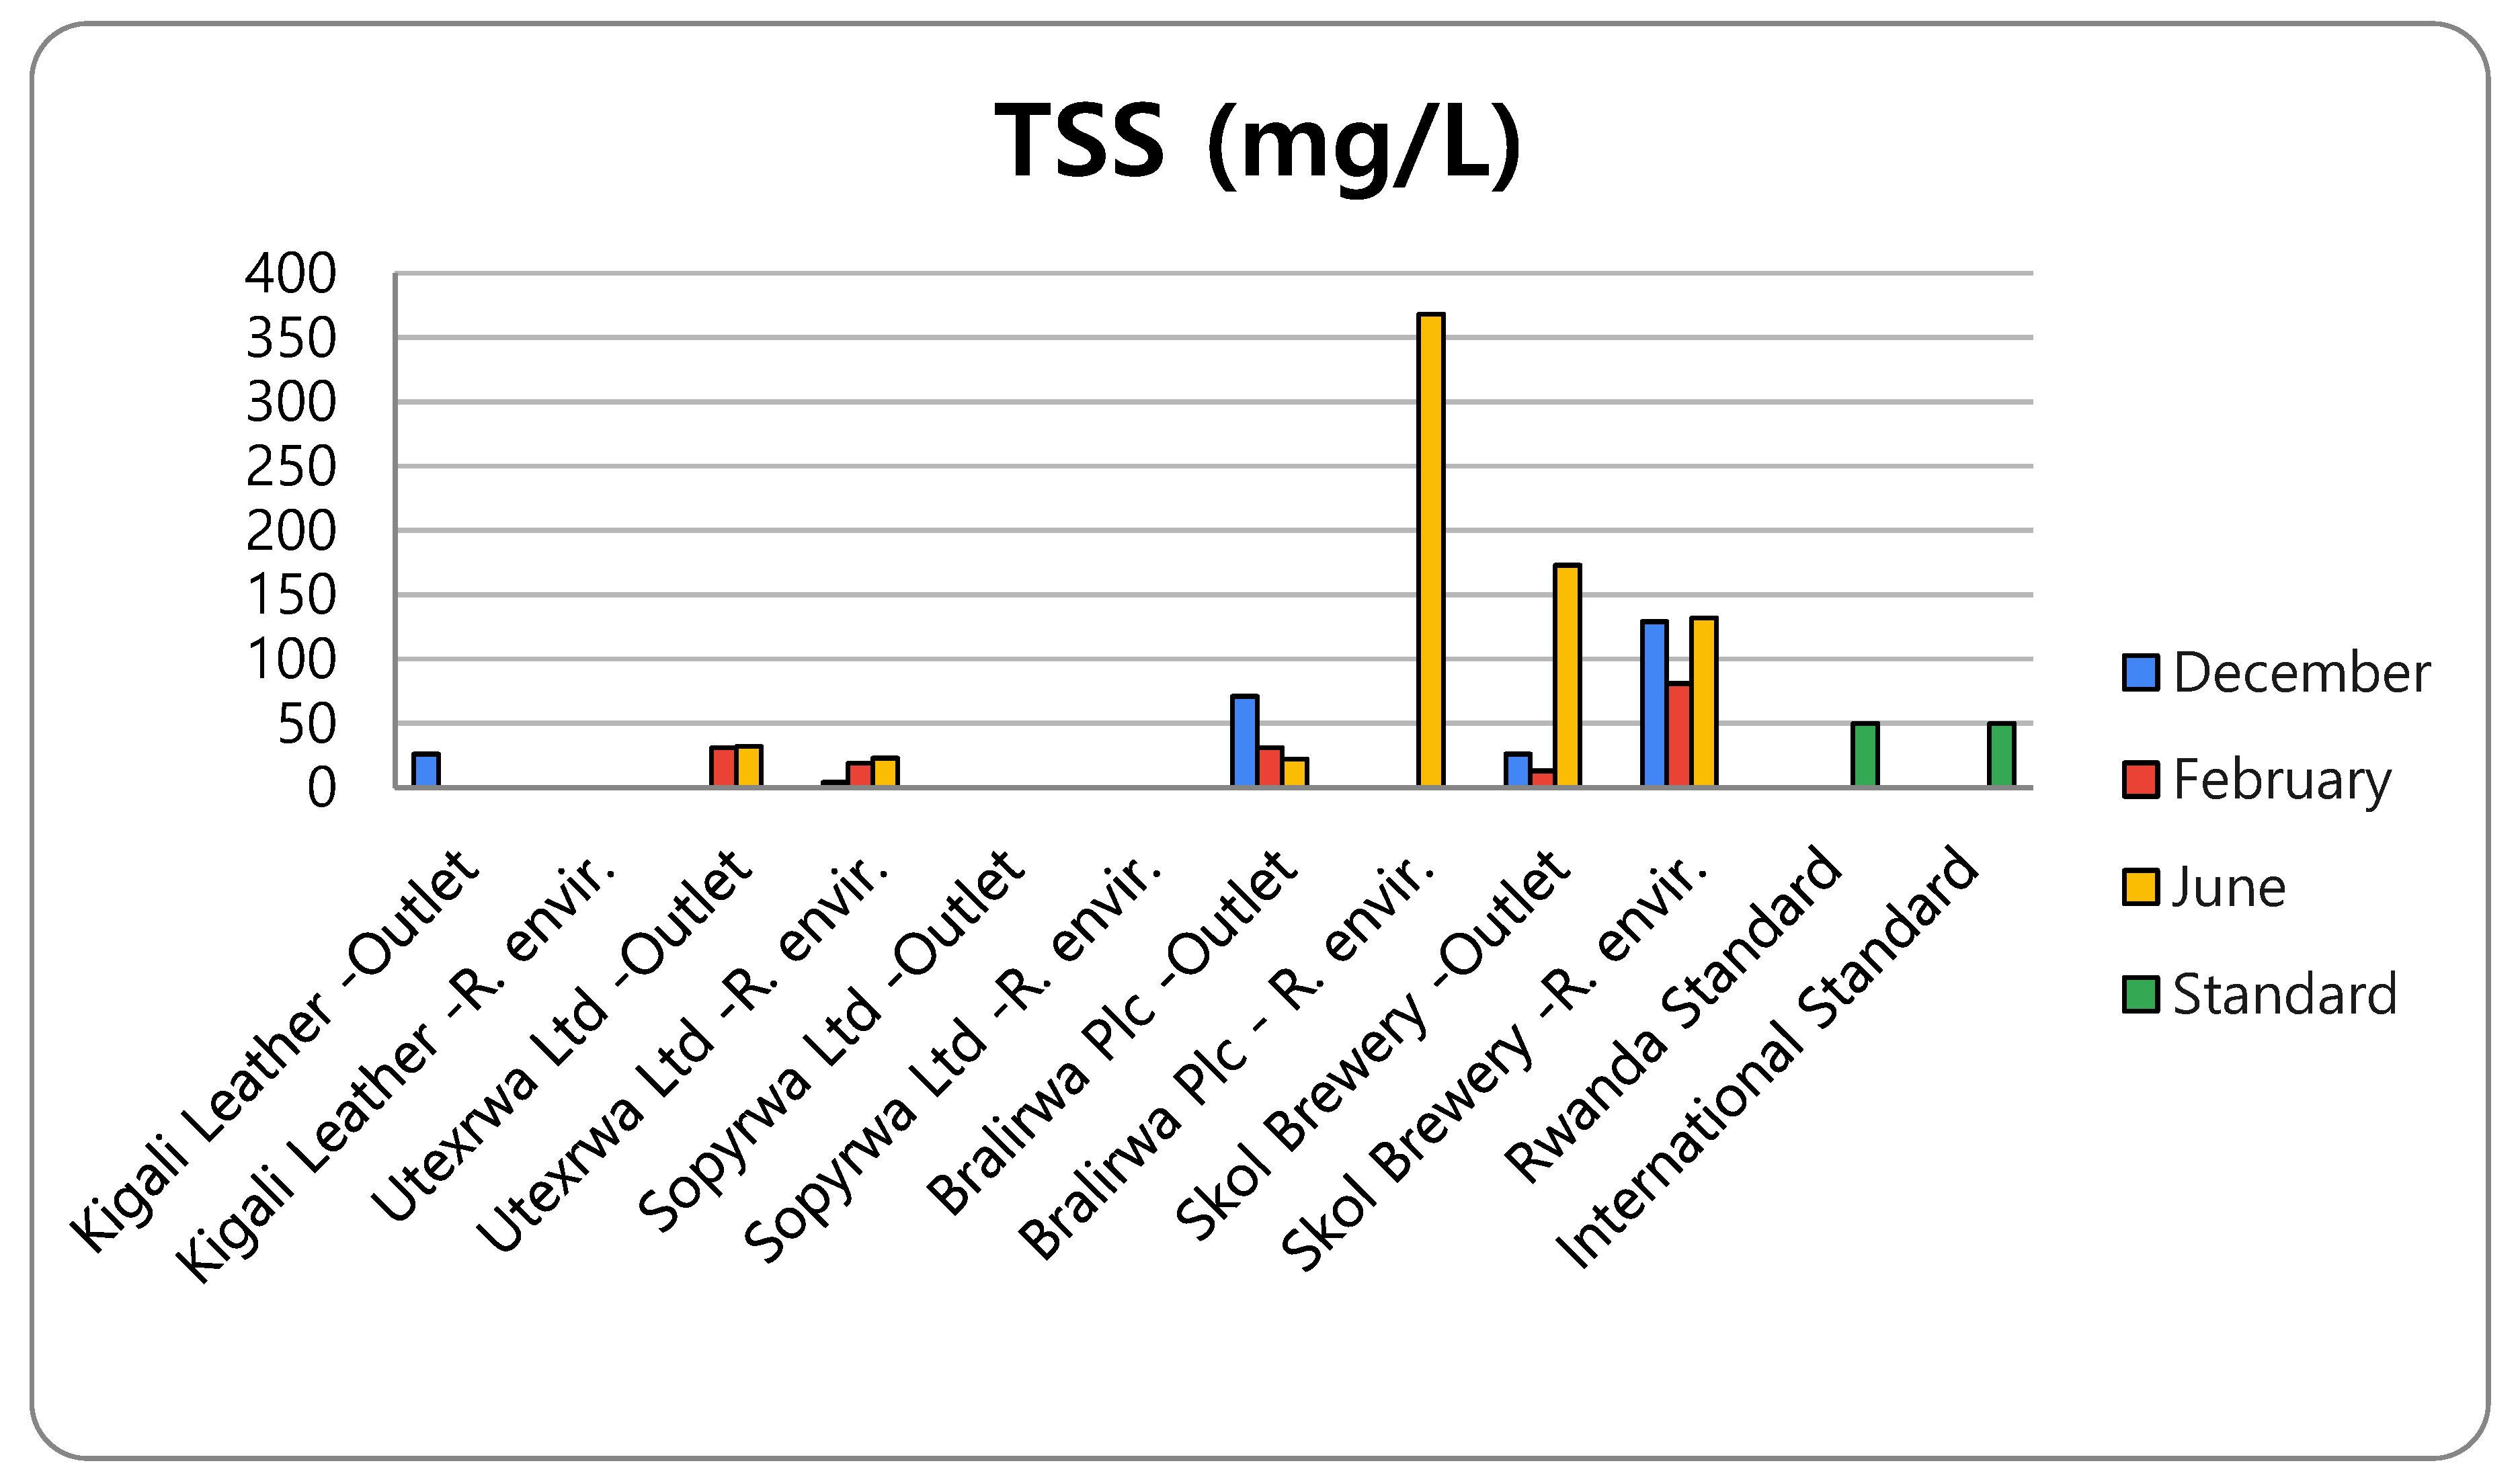
3.5. Total Suspended Solids (TSS)
The results for total suspended solids from the monitoring of discharged effluent at five selected industries ranged between 0 mg/L (Sopyrwa Ltd.) and 368 mg/L (Bralirwa Plc). The higher levels of TSS for Bralirwa Plc in December and June samples compared to February could be explained by increased suspended solids going to the WWTP inlet from the extra activity of maintenance works and washing at packaging line 3 in December and weekly deep cleaning in the brew house in June. The non-compliance for December could be explained by the fact that, during the period of December, the oxidizing polymers used at the WWTP were out of stock, rendering the WWTP ineffective in reducing the high levels of TSS to acceptable levels, as compared to June. Furthermore, the highest TSS level (368 mg/L) observed at the Bralirwa receiving environment was due to the spent Kieselguhr effluent discharged from the filtration system. Table 6 presents the results of TSS at all sampling sites in comparison to Rwandan [10] and international [11] effluent discharge standards (i.e., “Rda Std” and “Int’l Std”, respectively in Table 6).
With regards to the permissible TSS levels for effluent discharge standards, only two industries out of the five presented nonconformities towards Rwandan [10] and international [11] effluent discharge standards, which represents a compliance level of 60%. In addition, considering all samples taken from the WWTP outlets and receiving environments for all five industries for the period covered by the study, a compliance level of 75% was observed, since 6 out of 24 samples did not comply with the admissible discharge levels of TSS for the national [10] and international [11] standards. Figure 6 represents the TSS levels per site.
The most visible environmental impact that TSS has on the environment is the siltation and sedimentation of the receiving water body over time. TSS comprises both organic and inorganic matter, and can consist of a range of materials; sand, grit, metal particles, and decaying plant or animal matter can all contribute. It is considered a waterborne pollutant. In terms of water quality, high levels of total suspended solids will increase water temperatures and decrease DO levels. This is because suspended particles absorb more heat from solar radiation than water molecules. This heat is then transferred to the surrounding water by conduction.
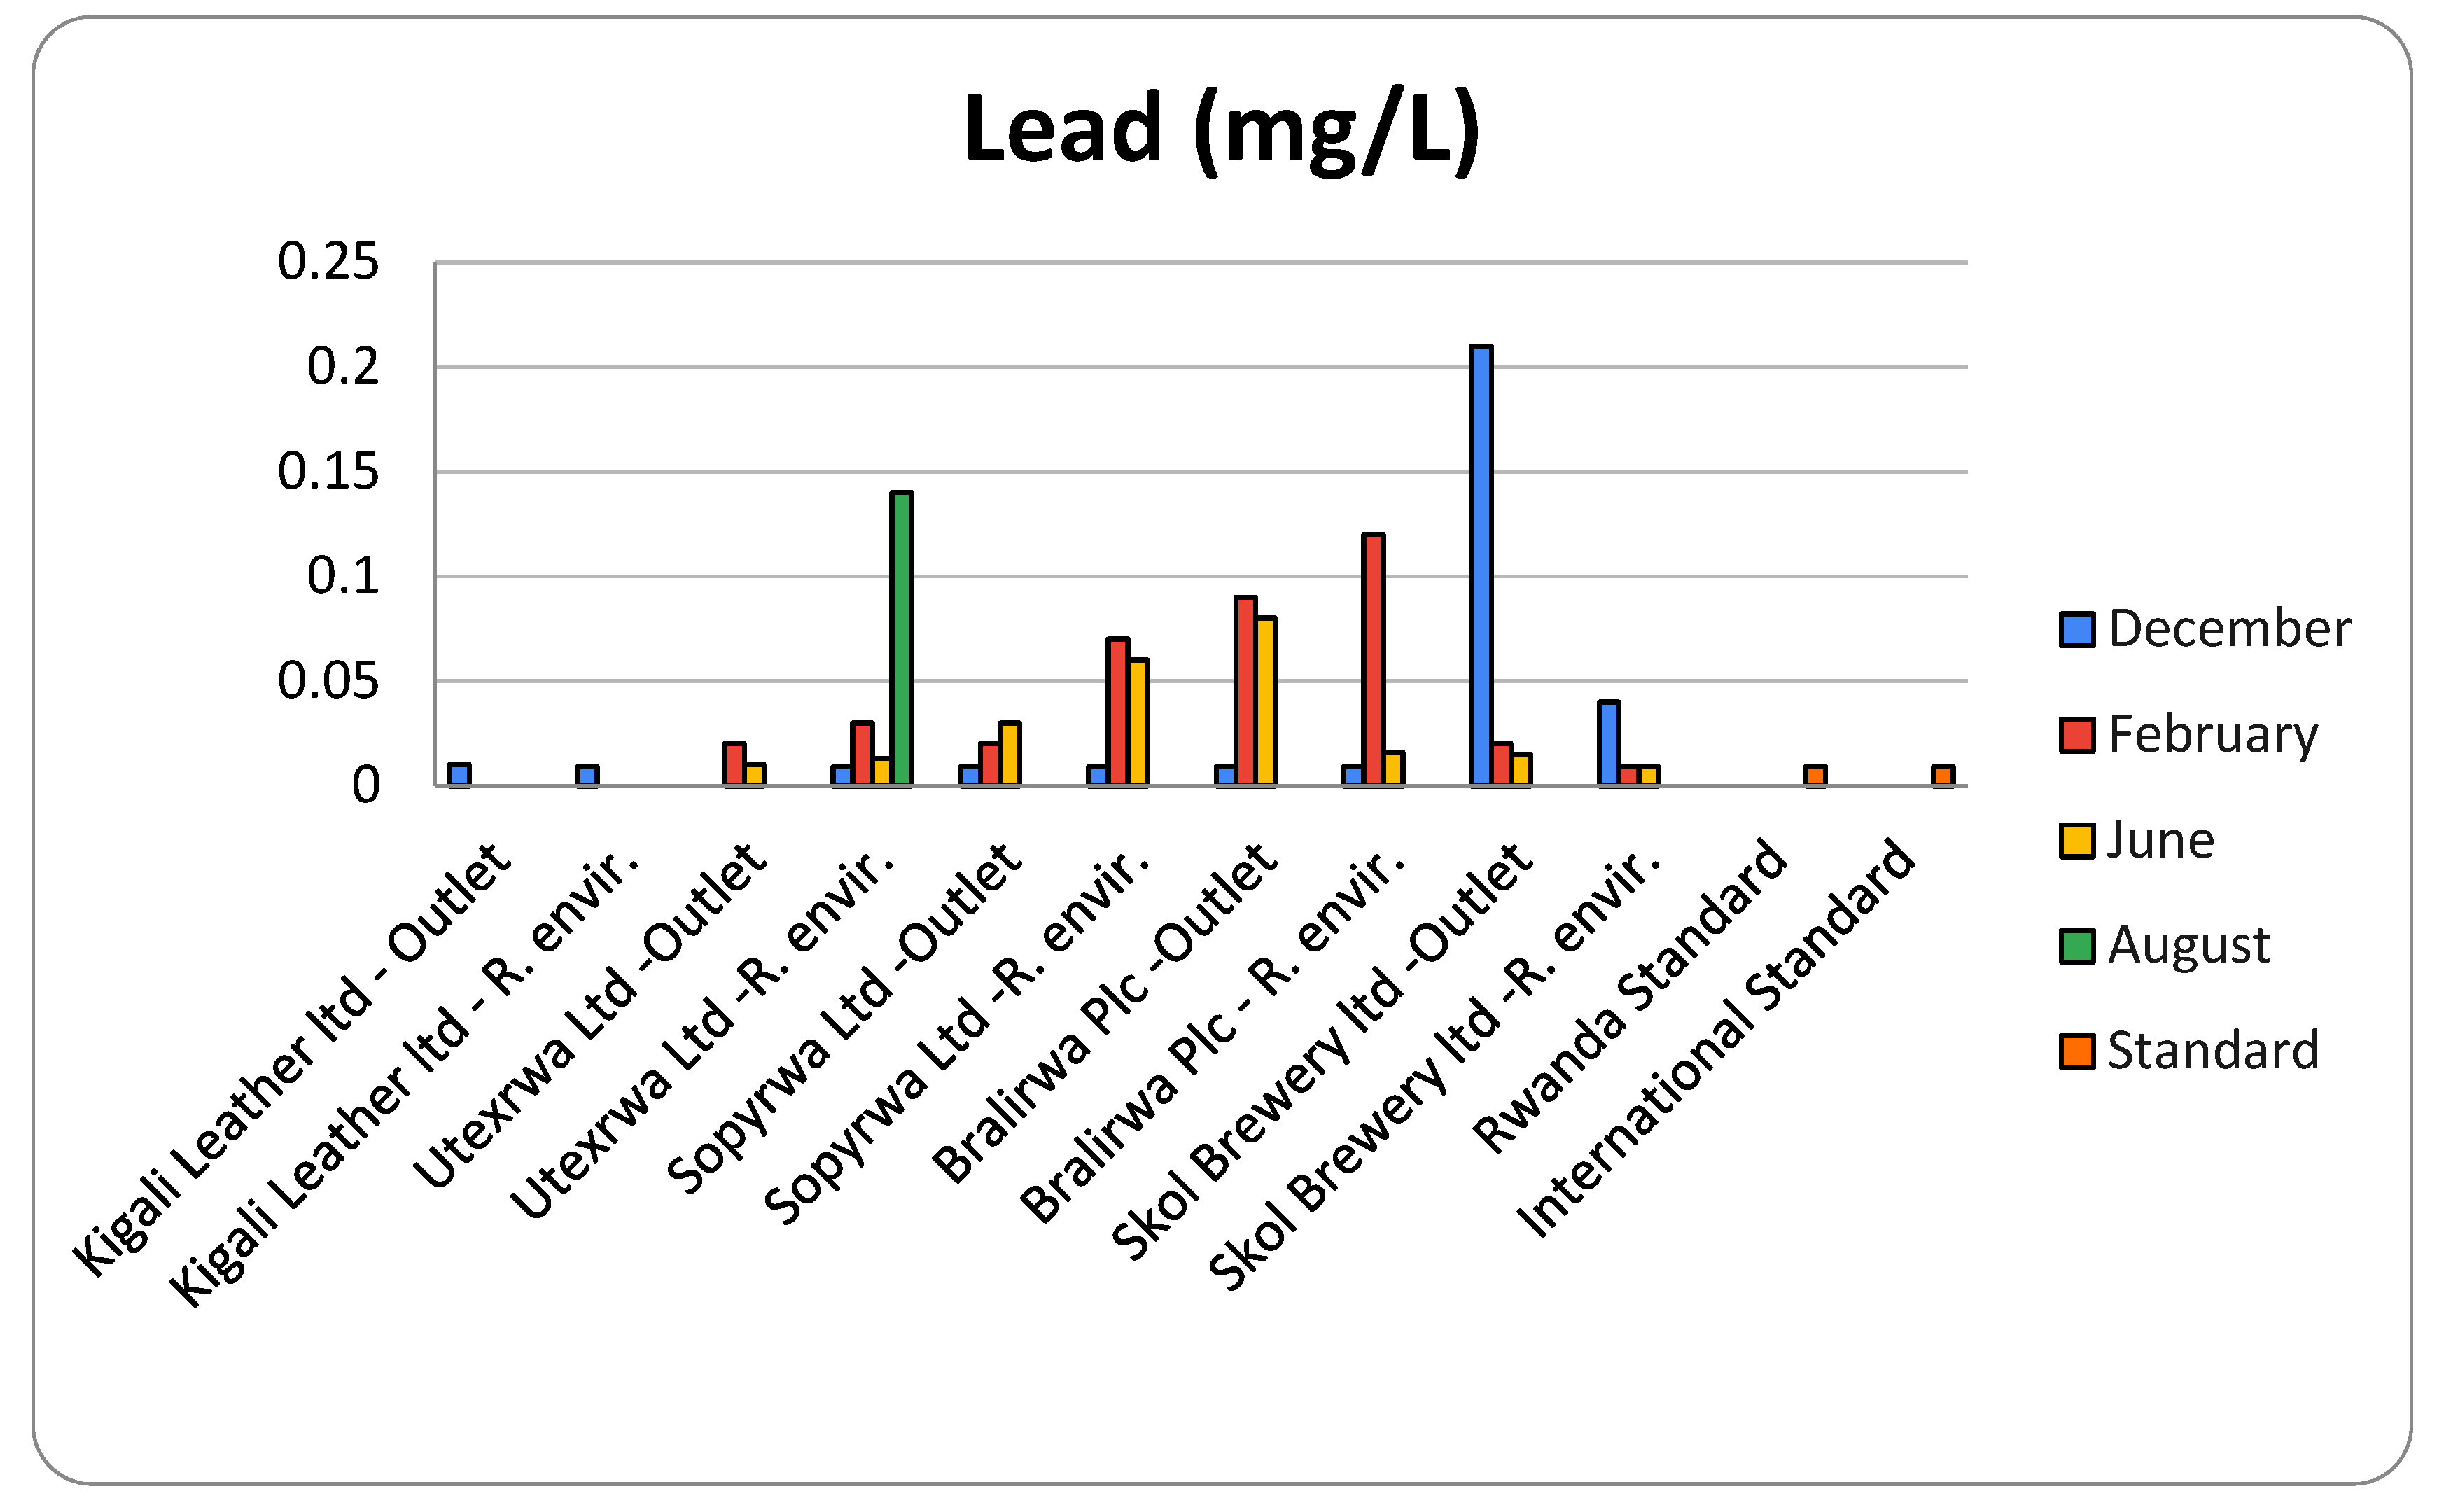
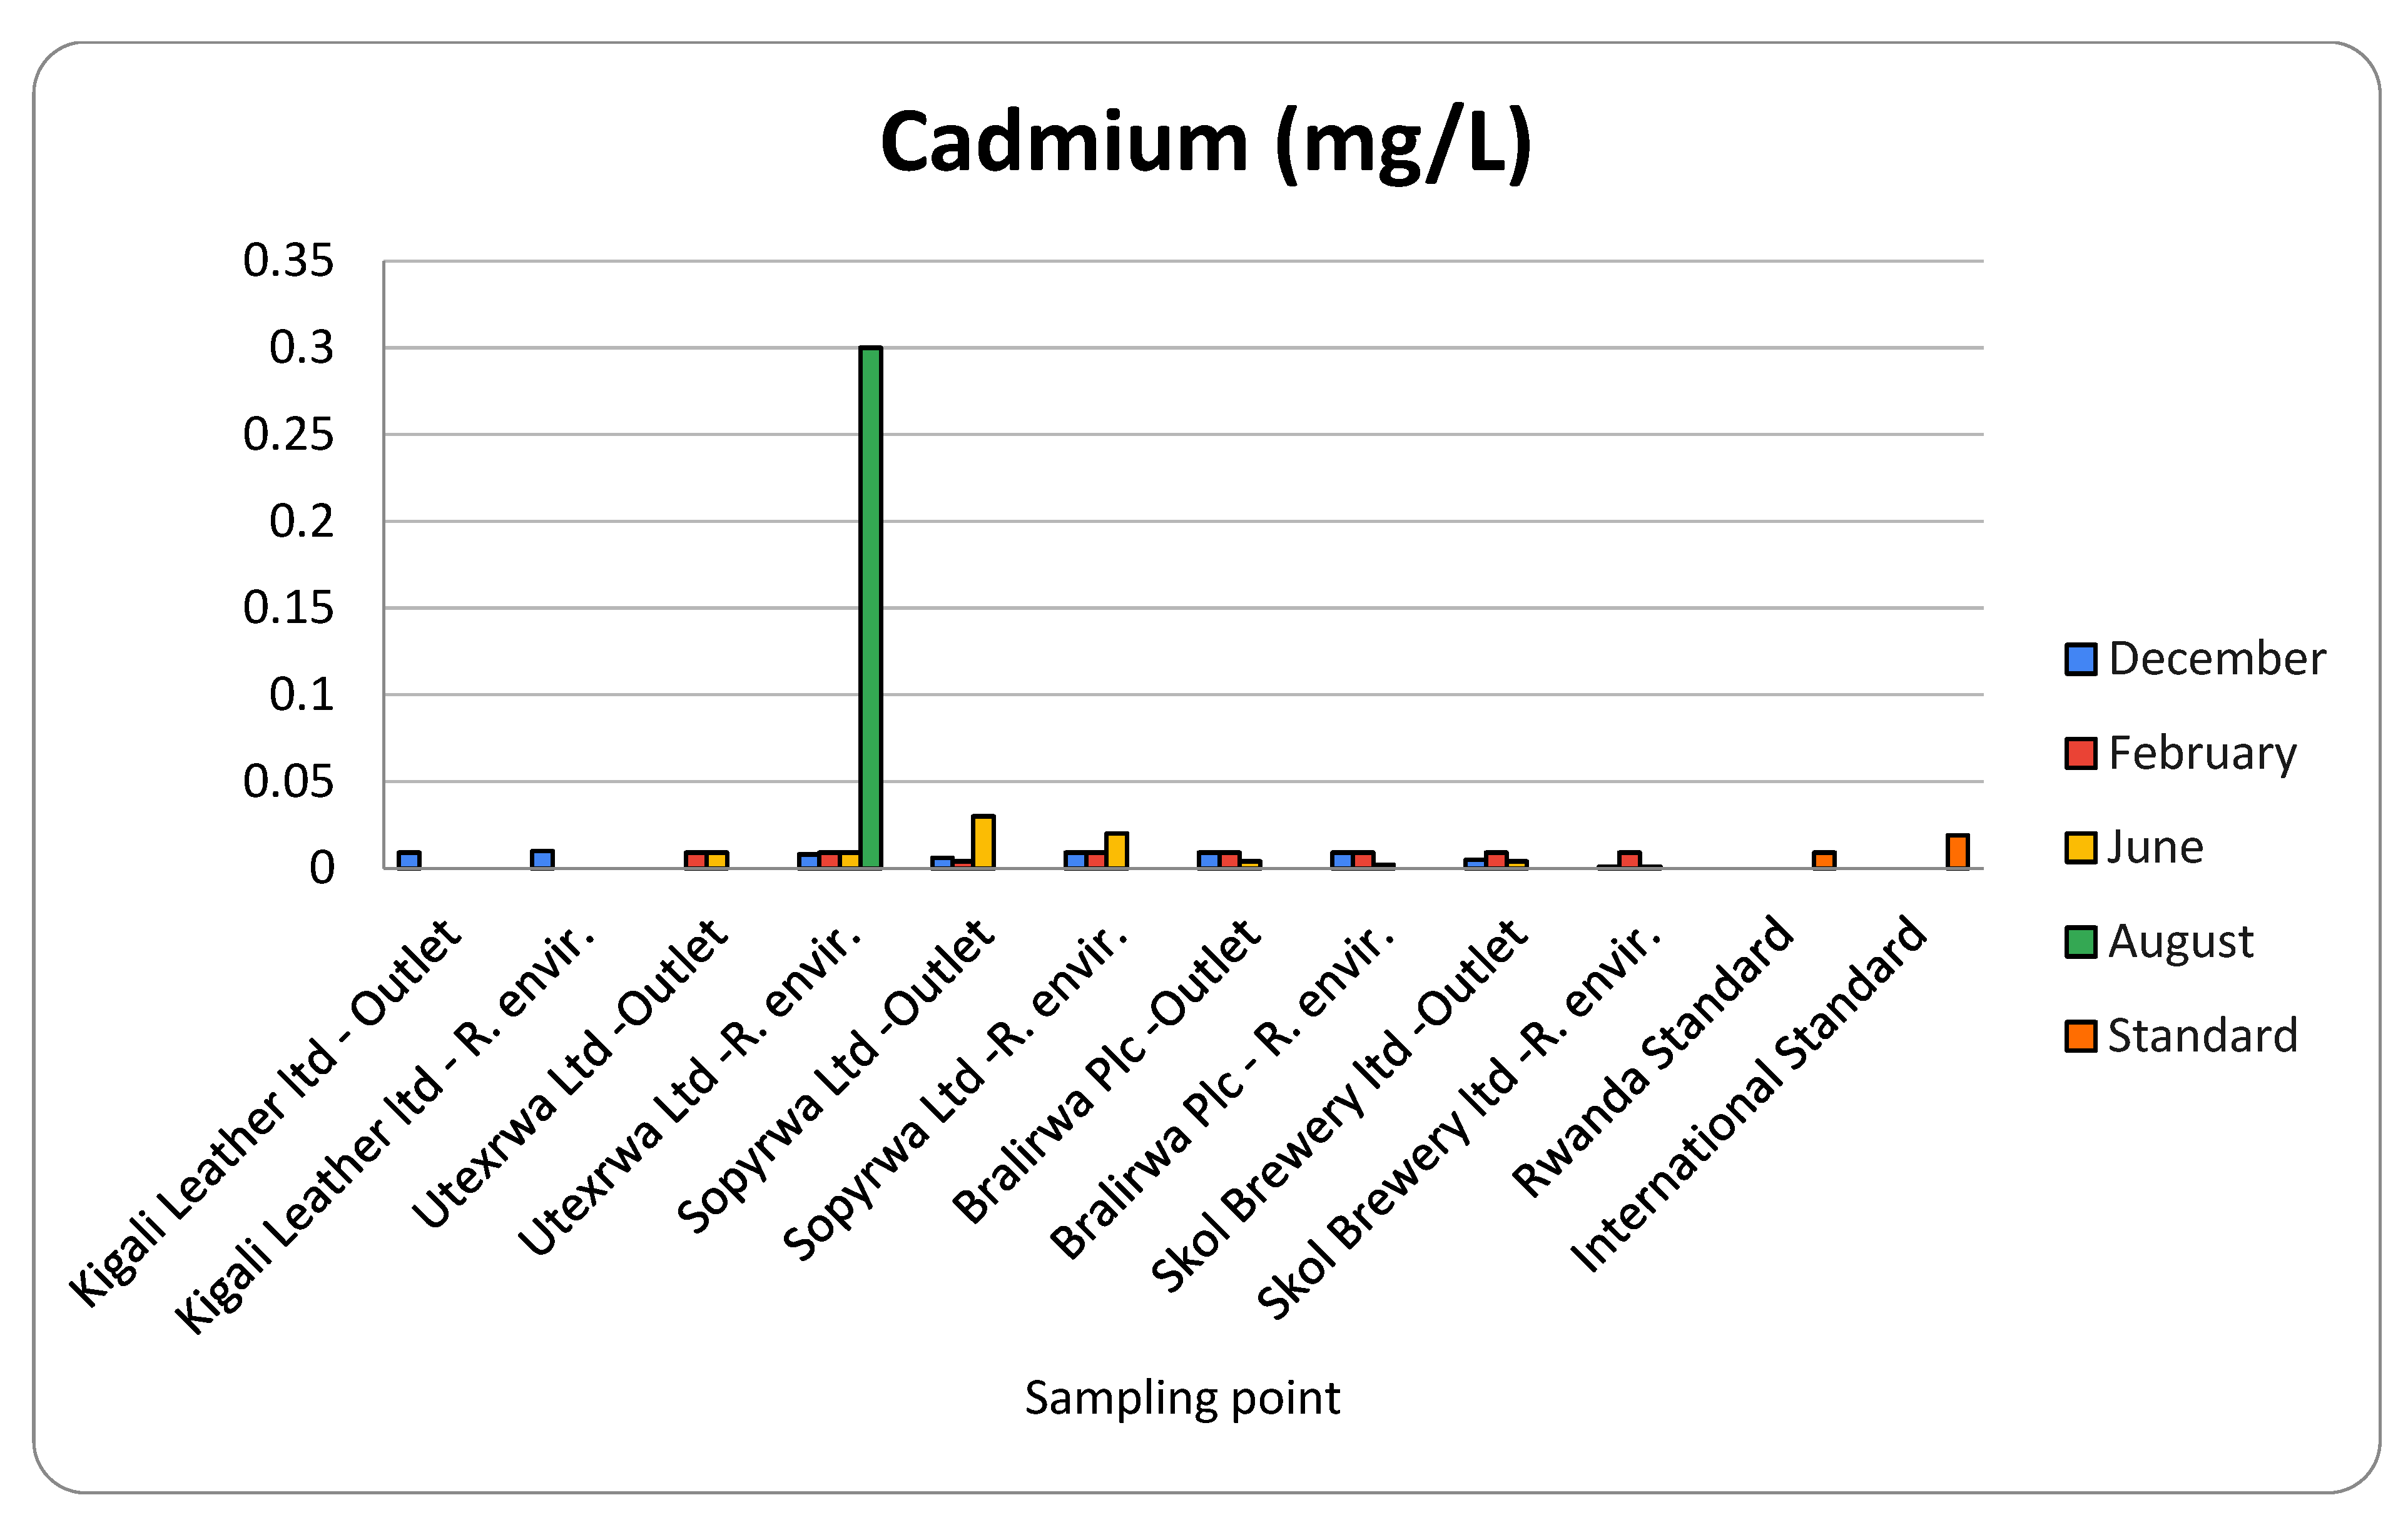
3.6. Heavy Metals (Pb, Cd, and Cr)
The results of heavy metals (i.e., Pb, Cd, and Cr) from the monitoring of discharged effluent for five selected industries at all sampling sites, in comparison to Rwandan [10] and international [11] effluent discharge standards, are presented in Table 7.
Considering all samples taken from the WWTPs of the concerned industries, the compliance level for heavy metals seemed to be high. However, the situation in the field for some individual cases was different. For example, for the case of Utexrwa Ltd., the samples taken on 21 August 2020 (represented as a second value of June for R. environment in Table 7) from the industry’s effluent to the Rwampara wetland showed high levels for lead (Pb) (Figure 7), cadmium (Cd) (Figure 8), and chromium (Cr) (Figure 9); hence, not complying with national standards. This showed a clear indication that Utexrwa Ltd. was directly discharging its wastewater, without passing through its WWTP.
In addition, for the case of Kigali Leather Ltd., the levels of heavy metals from the WWTP effluent seemed to be within admissible limits. However, very low chromium (Cr) levels at the inlet of the WWTP (Figure 7) for an industry that uses chromium sulfate in the tanning process to produce wet blue leather, could only imply one of two things: either (i) Kigali Leather ltd efficiently controls the use of chromium sulfate, recovers and reuses chromium (which was not observed during industry visits during the study: instead, wet floors of probably spilled chromium sulfate, water, and other chemicals were observed), or (ii) Kigali Leather ltd might not discharge chromium effluent into the WWTP but instead discharge through a by-pass pipe, directly discharging its wastewater into the Akagera river. Inspections that followed the recommendations of this study in February 2021 confirmed the suspicions in (ii) scenario. Therefore, the industry was closed, required to pay a fine, and the responsible employees were jailed, as determined by the law [12].
Some of the negative impacts of heavy metals to aquatic ecosystems include death of aquatic life, algal blooms, habitat destruction from sedimentation, debris, increased water flow, and other short- and long-term toxicity from chemical contaminants [26]. Abundant heavy metals present in soils cause a reduction in the quality and quantity of food for humans, by preventing plants’ growth and uptake of nutrients. Severe effects on animals can include reduced growth and development, cancer, organ damage, nervous system damage, and, in extreme cases, death [21]. Humans are exposed to lead in paint, dust, soil, air, and food, as well as in drinking water. In this case, they can be exposed through the food chain from plant uptake of Pb at the receiving wetlands. Cadmium has the chronic potential to cause kidney, liver, bone, and blood damage from long-term exposure at levels above the maximum contaminant level [27]. The impact of chromium discharged into the wetland could result in non-occupational exposure to the metal, which happens via the ingestion of chromium-containing food and water, while occupational exposure arises via inhalation. Accumulated chromium in soil can also be the reason for acute and long-term toxic effects on soil ecosystems [23].
3.7. Fecal Coliforms
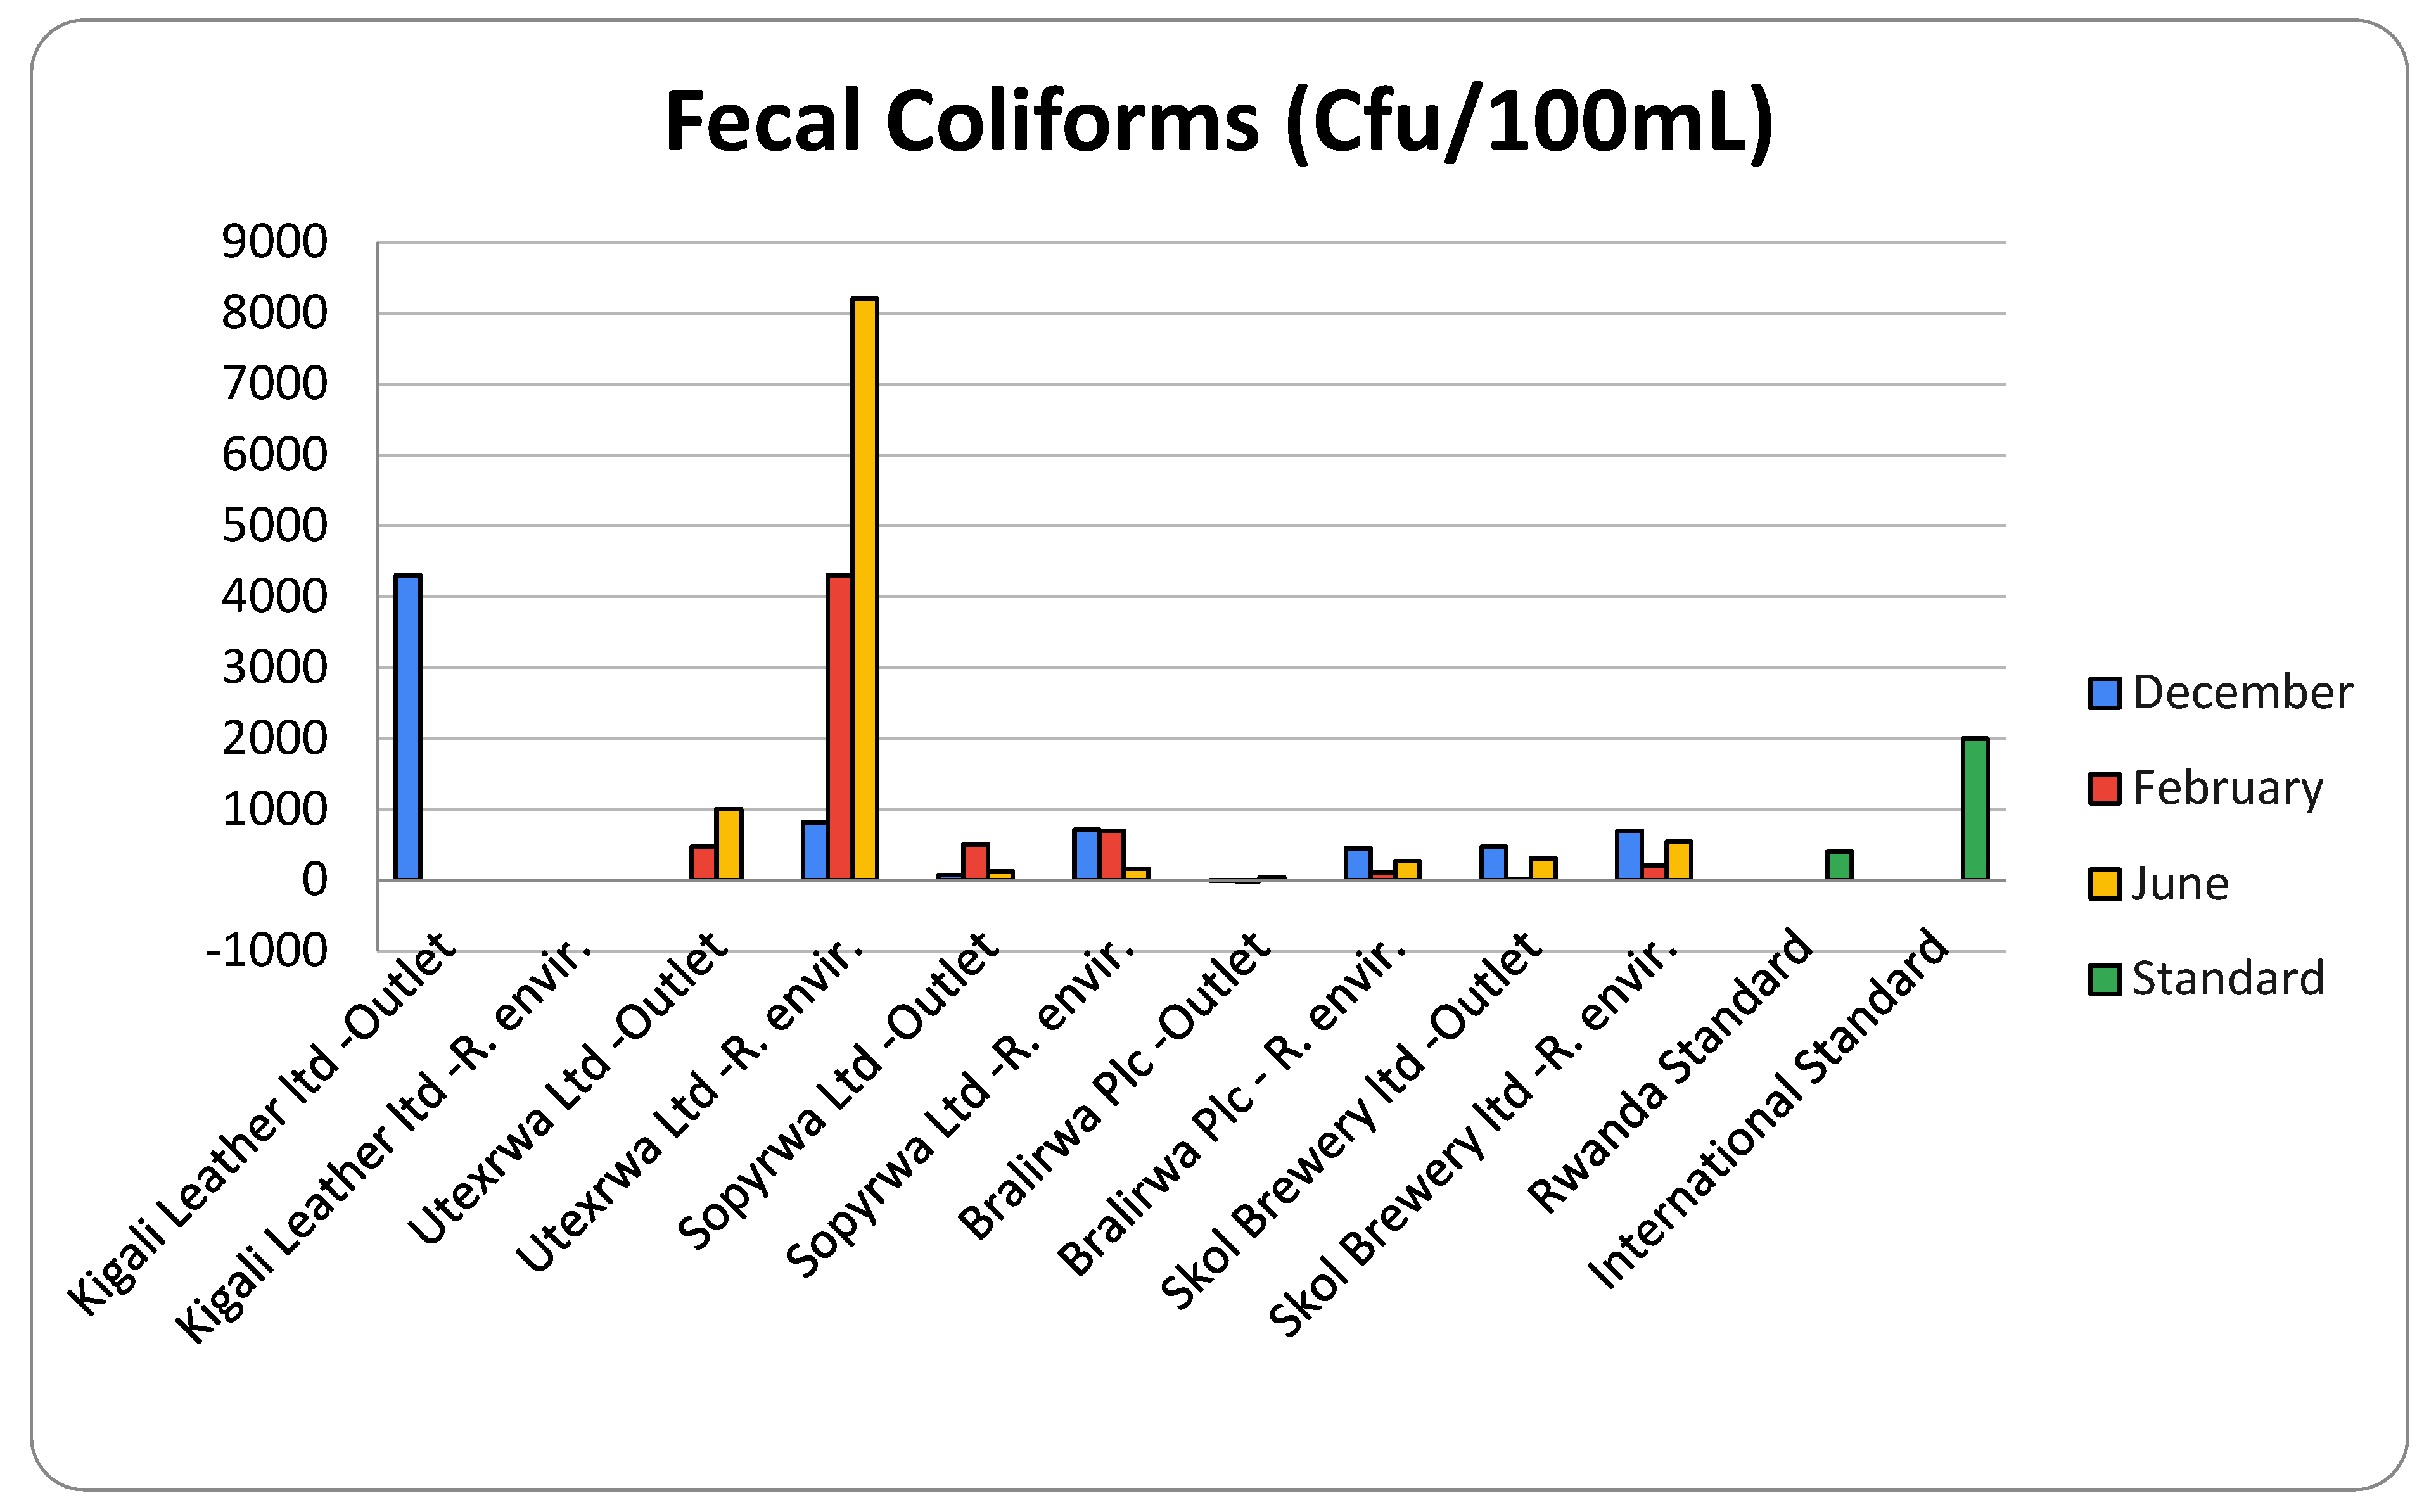
The results for fecal coliforms (FC) from the monitoring of discharged effluent at five selected industries ranged between <1 Cfu/100 mL (Bralirwa Plc) and 8200 Cfu/100 mL (Utexrwa). The results of FC for Utexrwa varied at the inlet and outlet between (230–2100 Cfu/100 mL) and (470–1000 Cfu/100 mL), respectively. Effluent at the WWTP outlet in February (470 Cfu/100 mL) and June (1000 Cfu/100 mL) was beyond the tolerance limits of the national standards (400 Cfu/100 mL) [10] but complied with the international standards (<2000 Cfu/100 mL) [11]. The failure for Utexrwa to reduce the FC levels of effluent to below the national tolerable limits could have been due to the non-operation of its WWTP. Much higher FC levels (820–8200 mg/L) were observed in the sample of 21 August 2020 from the effluent of Utexrwa to the wetland, confirming direct wastewater discharge to the wetland, without treatment; since this was even higher than FC levels at the WWTP inlet. Table 8 presents the results of fecal coliforms at all sampling sites in comparison to Rwandan [10] and international [11] effluent discharge standards.
With regards to the permissible fecal coliform levels for the effluent discharge standards, all five industries monitored did not comply with Rwandan [10] effluent discharge standards (<400 Cfu/100 mL). However, three industries out of five (60%) complied with international standards (<2000 Cfu/100 mL) [11]. Considering all samples taken from the WWTPs outlets and receiving environments for all industries concerned in the study, a compliance level of 54.2% was observed (eleven out of twenty-four failed) for Rwandan [10] standards, despite a compliance level of 87.5% (only three out of twenty-four failed) international standards [11].
Levels of FC beyond tolerated limits may indicate a higher risk of pathogens being discharged into the water. Some waterborne pathogenic diseases that may coincide with fecal coliform contamination include ear infections, dysentery, typhoid fever, viral and bacterial gastroenteritis, and hepatitis A [28]. Untreated organic matter that contains fecal coliforms can be harmful to the environment. Aerobic decomposition of this material can reduce dissolved oxygen levels if discharged into rivers or waterways. This may reduce the oxygen level enough to kill fish and other aquatic life. Figure 10 shows the levels of Fecal Coliforms discharged into the environment.
3.8. Other Key Parameters
For this study other important wastewater parameters were also analyzed, as indicated in Table 1. Figure 11 shows the average distributions of other key parameters. Note that, based on the total number of samples collected and analyzed for all five industries for the full period coved by the study, the compliance levels for the effluent discharged into environment were below 50%, even through the average may not seem alarming.
4. Conclusions
The results of this study show that the trend of environmental pollution from industrial effluent discharge in Rwanda is alarming. The situation of industries outside industrial zone requires special attention, otherwise this could hinder the country’s targets of being environmentally resilient. This study revealed that the compliance level of industries outside industrial zones is still low, and industry owners still discharge untreated or substandard effluent to the environment, despite the sanctions prevailed by the law. This was especially the case for Utexrwa Ltd. and Kigali Leather Ltd.
The case of Kigali Leather showed that industrial compliance investigations should be duly performed by comparing laboratory results with industry’s production process, in addition to public consultation. By looking at laboratory results (which were within permissible limits) and considering previous sanctions imposed to the industry by REMA in 2018, none could have imagined that the industry re-installed the by-pass pipe to again discharge untreated effluent directly into the Akagera river. Fortunately, this study suspicion was taken into account during inspections conducted and further measures were imposed, including the closure of the factory.
With regard to national and international effluent discharge standards, the compliance level for key wastewater treatment parameters is very low. First, all five industries failed to comply for oil and grease (O&G) with national and international tolerable parameter limits. The compliance level, taking into account all samples taken from all WWTPs outlets and receiving environments for all five industries, was only at 16.7%. Next, only one out of five concerned industries complied with admissible standard limits for pH, dissolved oxygen (DO), biochemical oxygen demand (BOD5), chemical oxygen demand (COD), total suspended solids (TSS), and heavy metals (including lead (Pb), Cadmium (Cd), and Chromium (Cr)). However, considering all samples taken from all WWTPs outlets and receiving environments, for all five industries, for the period covered by the study, the compliance level for the above mentioned parameters was 66.7%. Lastly, all five industries failed to comply with the national tolerance limit (<400 Cfu/100 mL) for fecal coliforms, even though three of them complied with international standards (<2000 Cfu/100 mL). Whereas, considering all the samples taken from all WWTPs outlets and receiving environments, for all five industries and for the period covered by the study, the compliance level for fecal coliforms was 54.2% and 87.5% for, national and international standards respectively.
Industries adjacent to fragile ecosystems or prohibited industrial areas (wetlands) require special attention. They are causing huge pollution to the environment, and it is not feasible to upgrade their WWTPs at their current locations, since the construction of WWTPs in wetlands is not allowed by the environmental laws and regulations. Those industries should be relocated to designated industrial zones as soon as possible (with priority given to Utexrwa Ltd.). Meanwhile, a rigorous monitoring system should be put in place to ensure that those industries are no longer discharging untreated effluent into the environment. In addition, the government should plan the rehabilitation of the contaminated area. A feasibility study for the rehabilitation should be conducted, to clearly guide the rehabilitation plan, and recommend the best rehabilitation technology and possible reuse and reclamation of the area for the best of local residents. The concerned industries should contribute to the cost of rehabilitation, with respect to the polluter-pays principle.
The concerned industries were generally recommended to minimize or eliminate their WWTPs’ non-conformities by, where deemed necessary, putting in place or renovating their WWTP and adopting the best available technology for the treatment of their effluent, in order to meet national and international wastewater discharge standards. In addition, they were recommended to adopt a self-evaluation attitude, by regularly performing water quality monitoring for their WWTP, to determine their treatment efficiency.
The situation of deliberate direct discharge of untreated effluent to rivers and lakes observed in Rwanda during this study may be observed in other countries. The example set by Rwanda, by relocating industries in wetlands to designated industrial zones, may serve as a model, since it is more practicable to monitor individual WWTPs while connected to a centralized one. However, setting industries in industrial zones is not a guarantee of effluent discharge compliance. Environmental and industrial regulatory authorities should put in place rigorous self-reporting monitoring systems for every specific industry.
For the case of Rwanda, this study provides the situation for industries outside industrial zones, but the situation may be the same in industrial zones. Therefore, there is a need for a full-scale and long-term study, as well as investigation of the situation of all industries present in the country, whether in industrial zones or not. Subsequent studies should not only focus on laboratory testing but also gather information from residents neighboring those industries and duly analyze and compare laboratory results to the industries production process and the information received from industries’ neighboring residents.
Author Contributions
Conceptualization, I.D., H.K. and S.L.; methodology, I.D. and Y.L.; validation, I.D., Y.L., H.K. and S.L.; formal analysis, I.D. and Y.L.; investigation, I.D. and Y.L.; resources, I.D.; data curation, I.D.; writing—original draft preparation, I.D. and S.L.; writing—review and editing, H.K. and S.L.; supervision, H.K. and S.L.; project administration, Y.L., H.K. and S.L.; funding acquisition, Y.L., H.K. and S.L. All authors have read and agreed to the published version of the manuscript.
Funding
This work was supported by Korea Environment Industry & Technology Institute (KEITI) through Ecological Imitation-based Environmental Pollution Management Technology Program, funded by Korea Ministry of Environment(MOE) (2021002800001).
Institutional Review Board Statement
Not applicable.
Informed Consent Statement
Not applicable.
Data Availability Statement
The data presented in this study are available on request from the corresponding author.
Acknowledgments
We would like to thank the Management of Rwanda Environment Management Authority (REMA) and its staff in the Environmental Compliance and Enforcement Division for their support during this study. Our gratitude also goes to Marie Josée IGIRANEZA and Rachael BUSINGE for proofreading the manuscript.
Conflicts of Interest
The authors declare no conflict of interest.
References
- Sweetapple, C.; Fu, G.; Farmani, R.; Butler, D. Exploring wastewater system performance under future threats: Does enhancing resilience increase sustainability? Water Res. 2019, 149, 448–459. [Google Scholar] [CrossRef] [PubMed]
- Joshua, N.E.; John, O.O.; Olatunde, S.D. Impact of wastewater on surface water quality in developing countries: A case study of South Africa. In Water Quality, 1st ed.; Hlanganani, T., Ed.; IntechOpen: Johannesburg, South Africa, 2017; pp. 401–416. [Google Scholar]
- Taiwo, O.D.; Aderonke, A.A.; David, O.O.; Olumuyiwa, O. Impact assessment of wastewater discharge from a textile industry in Lagos, Nigeria. Cogent Eng. 2018, 5, 1531687. [Google Scholar]
- Patwardhan, A.D. Industrial Wastewater Treatment, 2nd ed.; PHI Learning Pvt. Ltd.: Delhi, India, 2017; pp. 124–158. [Google Scholar]
- Nickel, J.P.; Sacher, F.; Fuchsa, S. Up-to-date monitoring data of wastewater and stormwater quality in Germany. Water Res. 2021, 202, 117452. [Google Scholar] [CrossRef] [PubMed]
- Judd, S. Watermaths: Process Fundamentals for the Design and Operation of Water and Wastewater Treatment Technologies, 3rd ed.; IWA Publishing: London, UK, 2019; pp. 54–89. [Google Scholar]
- Maxcy-Brown, J.; Elliott, M.A.; Krometis, L.A.; Brown, J.; White, K.D.; Lalle, U. Making waves: Right in our backyard-surface discharge of untreated wastewater from homes in the United States. Water Res. 2021, 190, 116647. [Google Scholar] [CrossRef] [PubMed]
- Tai, C.; Ellis, L. Green wash or green clean. In China Environmental Health Project Research Brief; Available online: https://www.wilsoncenter.org/sites/default/files/media/documents/publication/taihu_oct08.pdf (accessed on 28 June 2022)This research brief was produced as part of the China Environment Forum’s partnership with Western Kentucky University on the USAID-supported China Environmental Health Project, Oct. 2008.
- Government of Rwanda. National Environment and Climate Change Policy; Ministry of Environment: Kigali, Rwanda, 2019.
- Rwanda Standard Board (RSB). Tolerance Limit of Industrial Discharged Wastewater; Reference Number RS 109; RSB: Kigali, Rwanda, 2017. [Google Scholar]
- ES-RQ-225; International Standards for Wastewater Quality Requirements. ISO: London, UK, 2008.
- Government of Rwanda. Environmental Law N°48/2018 of 13/08/2018; Official Gazette: Kigali, Rwanda, 2018.
- Government of Rwanda, National Industrial Policy; Ministry of Trade & Industry: Kigali, Rwanda, 2011.
- Hwang, H.T.; Frey, S.K.; Park, Y.J.; Pintar, K.D.M.; Lapen, D.R.; Thomas, J.L.; Spoelstra, J.; Schiff, S.L.; Broun, S.J.; Sudicky, E.A. Estimating cumulative wastewater treatment plant discharge influences on acesulfame and Escherichia coli in a highly impacted watershed with a fully-integrated modelling approach. Water Res. 2019, 157, 647–662. [Google Scholar] [CrossRef] [PubMed]
- Islam, R.M.S.; Rahman, M.R.; Ali, M.Y.; Uddin, M.F. Environmental Pollution due to Production of Wet-Blue Leather from Goat Skin. IOSR J. Environ. Sci. Toxicol. Food Technol. 2018, 12, 1–8. [Google Scholar]
- Toprak, T.; Anis, P. Textile Industry's environmental effects and approaching cleaner production and sustainability, an overview. J. Text. Eng. Fash. Technol. 2017, 2, 429–442. [Google Scholar] [CrossRef] [Green Version]
- Olajire, A.A. The brewery industry and environmental challenges. J. Clean. Prod. 2020, 256, 102817. [Google Scholar] [CrossRef]
- Lin, S.D. Water and Wastewater Calculations Manual, 3rd ed.; The McGraw-Hill Companies: New York, NY, USA, 2014; pp. 1–121. [Google Scholar]
- Eljaiek-Urzola, M.; Romero-Sierra, N.; Segrera-Cabarcas, L.; Valdelamar-Martinez, D.; Quiñones-Bolaños, É. Oil and grease as a water quality index parameter for the conservation of marine biota. Water 2019, 11, 856. [Google Scholar] [CrossRef] [Green Version]
- Mesquita, R.B.; Ferreira, M.T.; Tóth, I.V.; Bordalo, A.A.; Mckelvie, I.D.; Rangel, A. Development of a flow method for the determination of phosphate in estuarine and freshwaters—Comparison of flow cells in spectrophotometric sequential injection analysis. Anal. Chim. Acta 2011, 701, 15–22. [Google Scholar] [CrossRef] [PubMed]
- Akpor, O.B.; Ohiobor, G.O.; Olaolu, D.T. Heavy metal pollutants in wastewater effluents: Sources, effects and remediation. Adv. Biosci. Bioeng. 2014, 2, 37–43. [Google Scholar] [CrossRef] [Green Version]
- Sekomo, C.B.; Rousseau, D.P.L.; Saleh, S.A.; Lens, P.N.L. Heavy metal removal in duckweed and algae ponds as a polishing step for textile wastewater treatment. Ecol. Eng. 2012, 44, 102–110. [Google Scholar] [CrossRef]
- Alam, S.M. Impact of soil pH on nutrient uptake by crop plants. In Handbook of Plant and Crop Stress, 2nd ed.; Pessarakli, M., Ed.; Marcel Dekker, Inc.: New York, NY, USA, 1999; Volume 2, pp. 51–60. [Google Scholar]
- Demeke, A.; Tassew, A. A review on water quality and its impact on fish health. Int. J. Fauna Biol. Stud. 2016, 3, 21–31. [Google Scholar]
- Sabljic, A. Environmental and Ecological Chemistry, FC ed.; Eolss Publishers Co. Ltd.: Oxford, UK, 2009; Volume 2, pp. 165–199. [Google Scholar]
- Kihampa, C. Heavy metal contamination in water and sediment downstream of municipal wastewater treatment plants, Dar es Salaam, Tanzania. Int. J. Environ. Sci. 2013, 3, 1407–1415. [Google Scholar]
- Järup, L. Hazards of Heavy Metal Contamination. Br. Med. Bull. 2003, 68, 167–182. [Google Scholar] [CrossRef] [PubMed] [Green Version]
- Wu, R.S.S. Eutrophication, water borne pathogens and xenobiotic compounds: Environmental risks and challenges. Mar. Pollut. Bull. 1999, 39, 11–22. [Google Scholar] [CrossRef]
Figure 1.
Map of Rwanda, showing the selected industries’ locations.

Figure 2.
pH levels per site.

Figure 3.
BOD (mg/L) levels per site.

Figure 4.
COD (mg/L) distribution per site.

Figure 5.
Oil and grease levels per site.

Figure 6.
TSS (mg/L) levels discharged per site.

Figure 7.
Lead discharge levels per site.

Figure 8.
Cadmium discharge levels per site.

Figure 9.
Chromium discharge levels per site.

Figure 10.
Fecal Coliforms discharge levels per site.

Figure 11.
Distribution of various chemicals per site.


Table 1.
Parameters analyzed for the selected industries.
| Industry | Category | pH, Conductivity, TDS, DO | BOD5 | COD | TSS | Sulfide and Salinity | Oil and Grease | Heavy Metals (Pb, Cd, Cr, Hg) | Pesticides | Fecal Coliforms |
|---|---|---|---|---|---|---|---|---|---|---|
| Kigali Leather Ltd. | Tannery | √ | √ | √ | √ | √ | √ | √ | √ | √ |
| UTEXRWA Ltd. | Textile | √ | √ | √ | √ | √ | √ | √ | √ | √ |
| SOPYRWA Ltd. | Pyrethrin | √ | √ | √ | √ | √ | √ | √ | √ | √ |
| BRALIRWA Plc | Brewery | √ | √ | √ | √ | √ | √ | √ | √ | √ |
| SKOL BREWERY Ltd. | Brewery | √ | √ | √ | √ | √ | √ | √ | √ | √ |
Table 2.
pH results for the five selected industries.
| pH | ||||||
|---|---|---|---|---|---|---|
| Sampling Point | December | February | June | Rda Std | Int’l Std | |
| Kigali Leather Ltd. | Inlet | 12.01 | NA * | NA * | 5.0–9.0 | 6.0–9.0 |
| Outlet | 9.25 | NA * | NA * | |||
| R. environment | NA * | NA * | NA * | |||
| Utexrwa Ltd. | Inlet | 4.41 | 4.82 | 12.31 | ||
| Outlet | NA * | 9.82 | 9.41 | |||
| R. environment | 8.52 | 9.48 | 8.06 | |||
| Sopyrwa Ltd. | Inlet | 8.25 | 8.43 | 7.48 | ||
| Outlet | 7.54 | 7.53 | 6.93 | |||
| R. environment | 7.85 | 7.97 | 7.45 | |||
| Bralirwa Plc | Inlet | 8.89 | 11.68 | 11.55 | ||
| Outlet | 8.09 | 8.01 | 7.88 | |||
| R. environment | 9.2 | 9.27 | 6.91 | |||
| Skol Brewery Ltd. | Inlet | 7.49 | 7.82 | 7.17 | ||
| Outlet | 8.17 | 7.9 | 8.9 | |||
| R. environment | 9.61 | 8.5 | 8.08 | |||
Note: * NA: Not applicable: No sample taken at that site for that period.
Table 3.
BOD5 results for the selected industries.
| BOD5 (mg/L) | ||||||
|---|---|---|---|---|---|---|
| Industry | Sampling Point | December | February | June | Rda Std | Int’l Std |
| Kigali Leather Ltd. | Inlet | 1488 | NA * | NA * | <50 | <50 |
| Outlet | 36.6 | NA * | NA * | |||
| R. environment | NA * | NA * | NA * | |||
| Utexrwa Ltd. | Inlet | 99 | 576 | 738 | ||
| Outlet | NA * | 43.5 | 97.8 | |||
| R. environment | 46.2 | 36.9 | 17.7 | |||
| Sopyrwa Ltd. | Inlet | 32.4 | 12.4 | 16.6 | ||
| Outlet | 2.7 | 2.7 | 1.79 | |||
| R. environment | 7.8 | 8.8 | 1.64 | |||
| Bralirwa Plc | Inlet | 1572 | 1890 | 638 | ||
| Outlet | 249 | 109 | 15 | |||
| R. environment | 9 | 8.9 | 204.9 | |||
| Skol Brewery Ltd. | Inlet | 655 | 792 | 748.5 | ||
| Outlet | 3 | 118.2 | 64.8 | |||
| R. environment | 84.9 | 159 | 168.9 | |||
Note: * NA: Not applicable: No sample taken at that site for that period.
Table 4.
COD results for the selected industries.
| COD (mg/L) | ||||||
|---|---|---|---|---|---|---|
| Industry | Sampling Point | December | February | June | Rda Std | Int’l Std |
| Kigali Leather Ltd. | Inlet | 2609 | NA * | NA * | <250 | <250 |
| Outlet | 142 | NA * | NA * | |||
| R. environment | NA* | NA* | NA * | |||
| Utexrwa Ltd. | Inlet | 489 | 1049 | 1664 | ||
| Outlet | NA * | 314 | 449 | |||
| R. environment | 109 | 74 | 59 | |||
| Sopyrwa Ltd. | Inlet | 65 | 34 | 34 | ||
| Outlet | 29 | 14 | 4 | |||
| R. environment | 32 | 14 | 4 | |||
| Bralirwa Plc | Inlet | 1764 | 1589 | 1263 | ||
| Outlet | 312 | 277.2 | 64 | |||
| R. environment | 5 | 4 | 1364 | |||
| Skol Brewery Ltd. | Inlet | 702 | 1184 | 1514 | ||
| Outlet | 65 | 194 | 379 | |||
| R. environment | 145 | 254 | 344.9 | |||
Note: * NA: Not applicable: No sample taken at that site for that period.
Table 5.
Oil and grease results for the selected industries.
| Oil and Grease (mg/L) | |||||||
|---|---|---|---|---|---|---|---|
| Industry | Sampling Point | December | February | June | Rda Std | Int’l Std | |
| Kigali Leather Ltd. | Inlet | 260 | NA * | NA * | <10 | <10 | |
| Outlet | 28 | NA | NA * | ||||
| R. environment | NA * | NA * | NA * | ||||
| Utexrwa Ltd. | Inlet | 48 | 178 | 43 | |||
| Outlet | NA * | 150 | 35.5 | ||||
| R. environment | ND | 8 | 22.8 | 1764 | |||
| Sopyrwa Ltd. | Outlet | 11.8 | 46 | ND | |||
| R. environment 1 | ND | ND | ND | ||||
| R. environment 2 | ND | ND | ND | ||||
| Bralirwa Plc | Inlet | 36 | 12 | 32.4 | |||
| Outlet | ND | ND | ND | ||||
| R. environment | ND | ND | 27 | ||||
| Skol Brewery Ltd. | Inlet | 42 | 48 | 18 | |||
| Outlet | ND | 26 | 14 | ||||
| R. environment | ND | ND | 8 | ||||
Note: * NA: Not applicable: No sample taken at that site for that period.
Table 6.
TSS results for the selected industries.
| TSS (mg/L) | ||||||
|---|---|---|---|---|---|---|
| Industry | Sampling Point | December | February | June | Rda Std | Int’l Std |
| Kigali Leather Ltd. | Inlet | 1067 | NA * | NA * | <50 | <50 |
| Outlet | 26 | NA * | NA * | |||
| R. environment | NA * | NA * | NA * | |||
| Utexrwa Ltd. | Inlet | 40 | 111 | 123 | ||
| Outlet | NA | 31 | 32 | |||
| R. environment | 4 | 19 | 23 | |||
| Sopyrwa Ltd. | Inlet | 1 | 3 | 1 | ||
| Outlet | 0 | 0 | 0 | |||
| R. environment | 0 | 0 | 0 | |||
| Bralirwa Plc | Inlet | 258 | 146 | 221 | ||
| Outlet | 71 | 31 | 22 | |||
| R. environment | 0 | 0 | 368 | |||
| Skol Brewery Ltd. | Inlet | 195 | 119 | 279 | ||
| Outlet | 26 | 13 | 173 | |||
| R. environment | 129 | 81 | 132 | |||
Note: * NA: Not applicable: No sample taken at that site for that period.
Table 7.
Heavy metal results for the selected industries.
| Industry | Sampling Point | Chromium (mg/L) | Cadmium (mg/L) | Lead (mg/L) | ||||||||||||
|---|---|---|---|---|---|---|---|---|---|---|---|---|---|---|---|---|
| Dec | Feb | June | Rda std | Int’l std | Dec | Feb | June | Rda std | Int’l std | Dec | Feb | June | Rda std | Int’l std | ||
| Kigali Leather Ltd. | Inlet | 0.006 | NA * | NA * | <0.05 | <0.1 | 1.307 | NA * | NA * | <0.1 | <0.02 | <0.01 | NA * | NA * | <0.1 | <1.0 |
| Outlet | 0.009 | NA * | NA * | <0.01 | NA * | NA * | 0.01 | NA * | NA * | |||||||
| R. environment | NA * | NA * | NA * | NA * | NA * | NA * | NA * | NA * | NA * | |||||||
| UTEXRWA Ltd. | Inlet | 0.054 | 0.084 | 0.072 | 0 | <0.01 | <0.01 | 0.05 | 0.06 | 0.02 | ||||||
| Outlet | NA * | <0.01 | <0.01 | NA | <0.01 | <0.01 | NA * | 0.02 | 0.01 | |||||||
| R. environment | <0.01 | <0.01 | 0.12 | 0.008 | <0.01 | <0.01 0.3 | <0.01 | 0.03 | 0.013 0.14 | |||||||
| SOPYRWA | Inlet | <0.01 | <0.01 | <0.01 | 0.002 | 0.026 | 0.021 | 0.05 | 0.05 | 0.045 | ||||||
| Outlet | <0.01 | <0.01 | <0.01 | 0.006 | 0.004 | 0.03 | <0.01 | 0.02 | 0.03 | |||||||
| R. environment | <0.01 | <0.01 | <0.01 | 0.008 | <0.01 | 0.02 | <0.01 | 0.07 | 0.06 | |||||||
| BRALIRWA Plc | Inlet | <0.01 | 0.035 | 0.011 | 0.079 | <0.01 | 0.041 | 0.01 | 0.07 | 0.004 | ||||||
| Outlet | <0.01 | 0.016 | 0.009 | 0.009 | <0.01 | 0.004 | <0.01 | 0.09 | 0.08 | |||||||
| R. environment | <0.01 | 0.025 | 0.026 | 0.009 | <0.01 | 0.002 | <0.01 | 0.12 | 0.016 | |||||||
| Skol Brewery Ltd. | Inlet | <0.01 | <0.01 | <0.01 | 0.011 | <0.01 | 0.012 | 0.49 | 0.05 | 0.08 | ||||||
| Outlet | <0.01 | <0.01 | <0.01 | 0.005 | <0.01 | 0.004 | 0.21 | 0.02 | 0.015 | |||||||
| R. environment | <0.01 | <0.01 | <0.01 | 0.001 | <0.01 | 0.001 | 0.04 | <0.01 | <0.01 | |||||||
Note: * NA: Not applicable: No sample taken at that site for that period.
Table 8.
Fecal coliform results for the selected industries.
| Fecal Coliforms (Cfu/100 mL) | ||||||
|---|---|---|---|---|---|---|
| Industry | Sampling Point | December | February | June | Rda Std | Int’l Std |
| Kigali Leather Ltd. | Inlet | 26,000 | NA * | NA * | <400 | <2000 |
| Outlet | 4300 | NA * | NA * | |||
| R. environment | NA * | NA * | NA | |||
| Utexrwa Ltd. | Inlet | 230 | 550 | 2100 | ||
| Outlet | NA * | 470 | 1000 | |||
| R. environment | 820 | 4300 | 8200 | |||
| Sopyrwa Ltd. | Inlet | 140 | 240 | 6600 | ||
| Outlet | 70 | 500 | 120 | |||
| R. environment | 710 | 700 | 160 | |||
| Bralirwa Plc | Inlet | 330 | 4100 | 850 | ||
| Outlet | <1 | <10 | 40 | |||
| R. environment | 450 | 110 | 270 | |||
| Skol Brewery Ltd. | Inlet | 610 | 320 | 8100 | ||
| Outlet | 470 | 11 | 310 | |||
| R. environment | 700 | 200 | 540 | |||
Note: * NA: Not applicable: No sample taken at that site for that period.
Publisher’s Note: MDPI stays neutral with regard to jurisdictional claims in published maps and institutional affiliations. |
© 2022 by the authors. Licensee MDPI, Basel, Switzerland. This article is an open access article distributed under the terms and conditions of the Creative Commons Attribution (CC BY) license (https://creativecommons.org/licenses/by/4.0/).
Share and Cite
MDPI and ACS Style
Dufatanye, I.; Lee, Y.; Kim, H.; Lee, S. Industrial Wastewater Discharge and Compliance Investigation for Environmentally Resilient Rwanda. Water 2022, 14, 3100. https://doi.org/10.3390/w14193100
AMA Style
Dufatanye I, Lee Y, Kim H, Lee S. Industrial Wastewater Discharge and Compliance Investigation for Environmentally Resilient Rwanda. Water. 2022; 14(19):3100. https://doi.org/10.3390/w14193100
Chicago/Turabian StyleDufatanye, Israel, Youngjae Lee, Hyungsoo Kim, and Sangyoup Lee. 2022. "Industrial Wastewater Discharge and Compliance Investigation for Environmentally Resilient Rwanda" Water 14, no. 19: 3100. https://doi.org/10.3390/w14193100
Note that from the first issue of 2016, this journal uses article numbers instead of page numbers. See further details here.