
Potential Contribution of Coastal Upwelling to Carbon Sink through Interaction between Cyanobacteria and Microbial Eukaryotes
by
 and
and
Xiuping Liu
1,
Ningdong Xie
1,
Jiaqian Li
1,
Mohan Bai
1,
Biswarup Sen
1,* and
Guangyi Wang
1,2,3,4,* 1
Center for Marine Environmental Ecology, School of Environmental Science and Engineering, Tianjin University, Tianjin 300072, China
2
Frontiers Science Center for Synthetic Biology, Tianjin University, Tianjin 300072, China
3
Key Laboratory of Systems Bioengineering (MOE), Tianjin University, Tianjin 300072, China
4
Center for Biosafety Research and Strategy, Tianjin University, Tianjin 300072, China
*
Authors to whom correspondence should be addressed.
Water 2022, 14(19), 3097; https://doi.org/10.3390/w14193097
Submission received: 16 August 2022
/
Revised: 24 September 2022
/
Accepted: 26 September 2022
/
Published: 1 October 2022
(This article belongs to the Special Issue Diversity and Dynamics of Microbial Communities in Marine Ecosystems)
Abstract
:Upwelling, a common oceanographic event, can make great contributions, directly or indirectly, to deep ocean carbon sequestration. However, the extent of its contribution indirectly depends on the composition of microbial communities and the interactions between bacterioplankton and other microorganisms. This study provides insights into the influence of upwelling on bacterioplankton at the whole community level and predicts their potential functional profiles. The α diversity of the bacterial community exhibited no significant differences between the upwelling area and non-upwelling area, while the community composition varied clearly in different habitats. Proteobacteria, Cyanobacteria, Bacteroidota, Firmicutes, and Actinobacteria were the five dominant phyla in all of the habitats. The proportions of members of Firmicutes were increased whereas Cyanobacteria were reduced in upwelling water. However, the percentage of Cyanobacteria was enhanced in the upwelling deep water. Functional genes that are involved in signal transductions, which belong to environmental information processing, were more active in upwelling surface water than in the other habitats. Closer and more complex relationships between bacterioplankton and microbial eukaryotes were found in the upwelling area, which altered with the variation of the external environmental conditions. Cyanobacteria showed a positive correlation with microbial eukaryotes in upwelling deep water. Combined with the high proportions of Cyanobacteria in upwelling deep water, this might be strong evidence that Cyanobacteria contribute to a deep ocean carbon sink. Overall, our study reveals the impacts of upwelling on the bacterial community composition, metabolic functions, and microbial interactions, which are significant to further understanding the carbon sink effects of upwelling.
1. Introduction
Rising CO2 concentration in the atmosphere resulting from rapid industrial development has caused catastrophic climate changes [1]. Nowadays, to alleviate these environmental and climatic consequences, reburying the CO2 in the atmosphere back underground has been considered one of the most effective approaches. Through CO2 fixation and subsequent particulate organic carbon (POC) exportation, which is known as the “biological pump”, the ocean absorbs 39% of industrial-age fossil carbon emissions and modulates the growth rate of atmospheric CO2 significantly [2,3,4,5]. Therefore, several geological engineering measures (e.g., ocean iron fertilization and artificial upwelling) have been proposed to increase the carbon storage of the ocean [6,7,8]. Particularly, artificial upwelling, which simulates natural upwelling and transports the surplus nutrients from the deep ocean to the surface water, is considered to be an effective countermeasure to promote primary production and consequently, increase the biological pump efficiency in exporting organic carbon to the deep sea [8,9]. Thus far, it has been successfully tested in several sea trials [10,11,12,13].
Although artificial upwelling has bright prospects for healing the Earth, there are still great difficulties with its large-scale application [4,11,14]. For example, it is difficult to control the intensity and application mode of artificial upwelling, and the potential disturbances of artificial upwelling to the natural ecosystem cannot be ignored [4,8,11]. These questions were essentially attributed to the limited exploration of the carbon sequestration mechanism, the efficiency, and the spatiotemporal fluctuation in natural upwelling. Upwelling can act as a carbon sink as well as a carbon source [15,16,17,18], largely depending on the microbial community structure and metabolic activities in upwelling [19]. Microbial processes modify the rates of the microbial carbon pump, which transforms the labile dissolved organic carbon into recalcitrant dissolved organic carbon. Therefore, a full understanding of the microbial community structure, metabolic function, and interactions in the natural upwelling system is crucial for the successful development of geoengineering projects in the future.
It has been reported that the community structure and metabolism of bacterioplankton are altered by upwelling [20,21,22,23]. According to a study of the South China Sea, genes that are involved in the membrane transport, photosynthesis, and metabolism of lipid, nitrogen, and sulfur from predicted metagenomes are increased in the upwelling area, which indicates that the upwelling can increase the nutrient exchange and transformation ability of bacterioplankton [21]. Motility genes are also enriched in the upwelling area, suggesting that upwelling may have an important effect on bacterial chemotaxis [21]. Our previous research identified that the abundance of bacterioplankton is much higher in the upwelling region than in the non-upwelling region [24], therefore we speculate that the metabolic function of the bacterial community in the upwelling area will also be changed dramatically. Furthermore, the succession of microbial communities could control the particulate organic carbon export [19]. For instance, as the upwelling intensity transforms from strong to weak, the phytoplankton community changes from diatom-dominated to cyanobacteria-dominated. At the same time, the microbial carbon pump becomes the prevailing mechanism for carbon sequestration instead of the biological pump [19]. Furthermore, the community compositions of microeukaryotes are found to change under the influence of upwelling, so we infer that the interactions between microbial eukaryotes and bacterioplankton may profoundly affect the carbon sink effect of upwelling.
The existence of Qiongdong upwelling provides a unique natural condition for studying the role and mechanism of upwelling in the carbon sink. In this study, we analyzed the diversity and structural changes of the bacterial communities and predicted the function of the whole bacterial community in the upwelling areas and non-upwelling areas. In addition, the interactions between microeukaryotes and bacterioplankton were explored. This study aims to contribute to the understanding of microbial community dynamics and the carbon sink effect of upwelling.
2. Materials and Methods
2.1. Sampling and Metadata
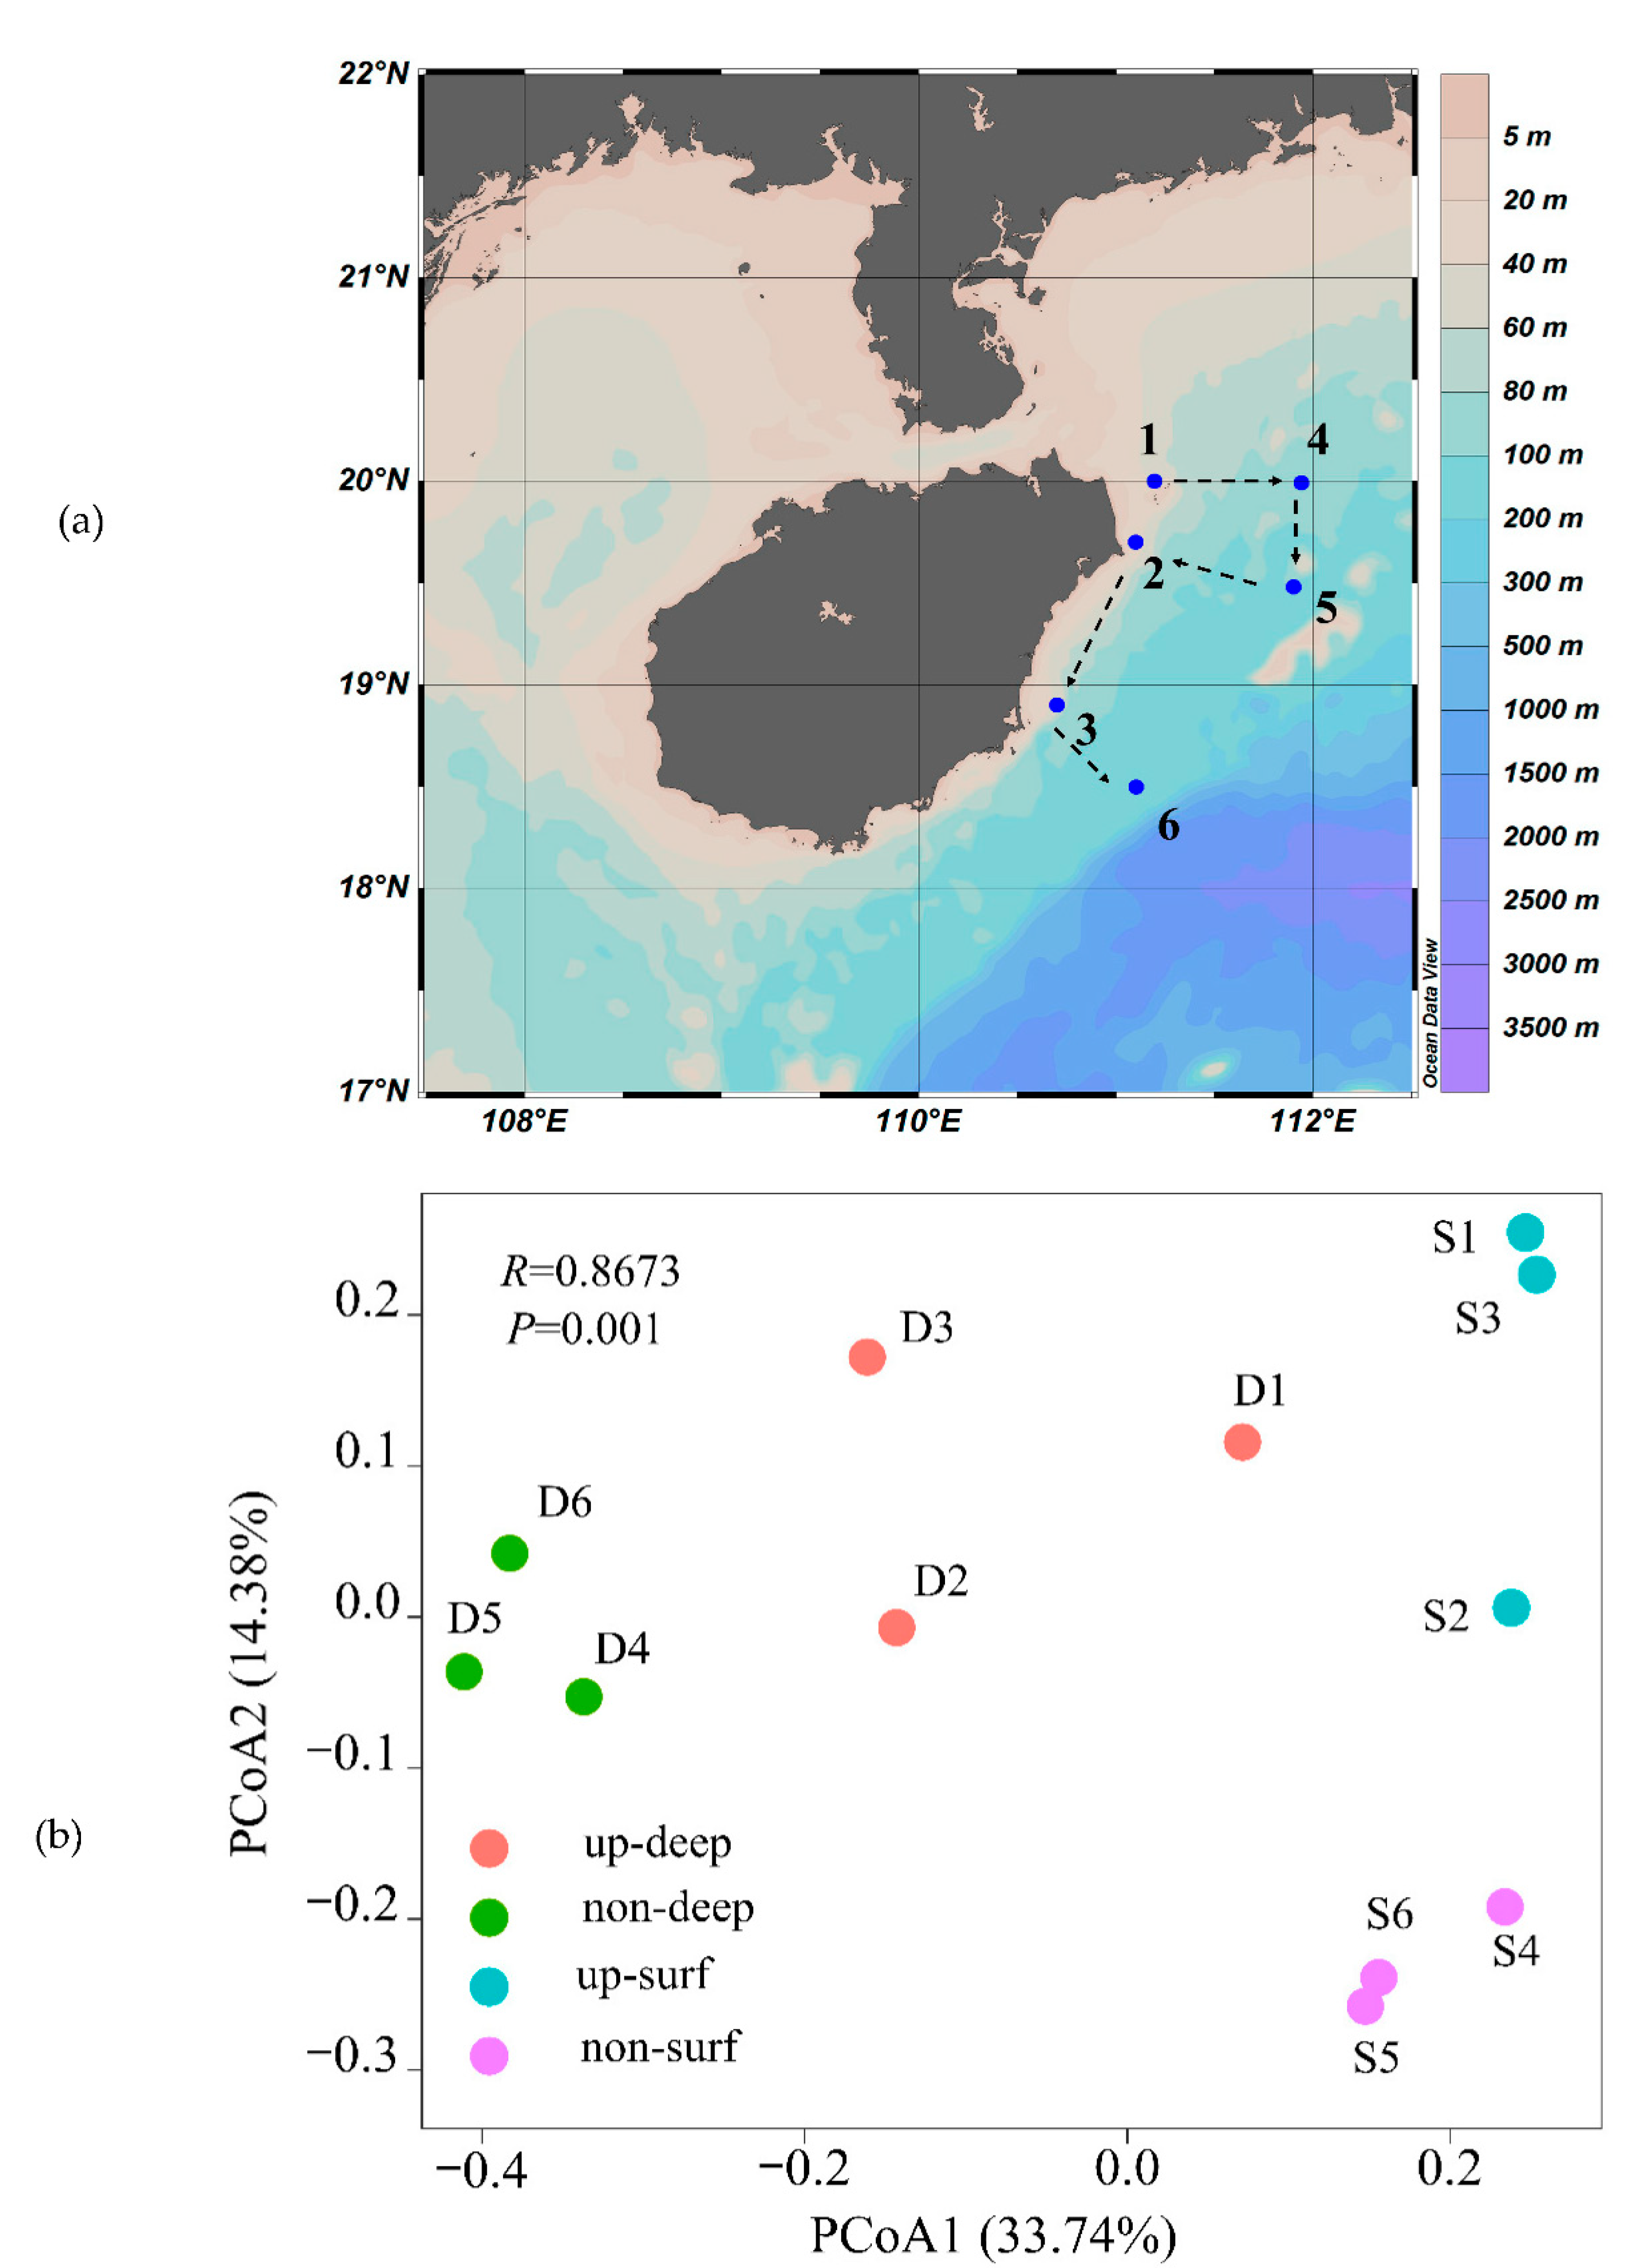
The sampling information has been described in our previous publication [24]. Briefly, the samples were collected from six stations along the east coast of Hainan Island in the South China Sea during June 2020. Stations 1, 2, and 3 were nearshore stations that are affected by the coastal upwelling, whereas stations 4, 5, and 6 were offshore stations with no upwelling (Figure 1a). For each station, the seawater samples were taken from the surface layer (3 m) and the deep layer (bottom water). The location, sampling depth, temperature, and salinity data of each station were obtained using the CTD sensors (Sea-Bird Electronics, Bellevue, WA, USA) and they are listed in Table S1.
About 2 L seawater was retrieved using the Sea-Bird CTD rosette sampler (Sea-Bird Electronics, Bellevue, WA, USA), which was then filtered through 0.22 μm polycarbonate filters (Millipore, USA) and the filters were stored at −80 °C until the DNA extraction was performed. Another 0.1 L seawater was collected in a polyethylene bottle (i-Quip, Aladdin, China) and stored at −20 °C for the determination of its nutrients, including nitrate nitrogen (NO3−), ammonium nitrogen (NH4+), nitrite nitrogen (NO2−), total nitrogen (TN), total phosphorus (TP), phosphate (PO43−), and silicate (SiO32−). The concentrations of these nutrients were measured according to the methods that were described previously [25].
2.2. DNA Extraction and Amplicon Sequencing
The total DNA was extracted from the filters by using the E.Z.N.ATM Water DNA kit (OMEGA, USA) according to the manufacturer’s instructions. Briefly, cell lysis was performed in tubes containing beads and buffer. The contaminants were subsequently removed after a heat-freeze step was performed. A HiBind® DNA Mini Column was then used to adsorb the DNA. Rapid wash steps were finally carried out to elute the DNA. The extracted DNA was PCR amplified using primers sets 341F (5′-CCTACGGGNGGCWGCAG-3′) and 805R (5′-GACTACHVGGGTATCTAATCC-3′), which targeted the V3-V4 region of the bacterial 16S rRNA gene [26]. The PCR reaction mix contained 12.5 μL Phusion® Hot Start Flex 2X Master Mix (NEB, Ipswich, MA, USA), 2.5 μL (1 μM) of each of the forward and reverse primers, 50 ng of DNA template, and 25 μL of ddH2O. A PCR was performed with an initial denaturation at 98 °C for 30 s, followed by 35 cycles of 98 °C for 10 s, 54 °C for 30 s, and 72 °C for 45 s, and a final extension at 72 °C for 10 min. The size of the PCR product was ~469 bp. The PCR product was purified using TIAN quick Midi Purification Kit (Tiangen, Beijing, China) and adequately pooled before the sequencing was performed. The paired-end sequencing of the PCR product was performed using an Illumina Novaseq 6000 sequencer (Illumina, Santiago, CA, USA) at a commercial company (LC-Bio, Hangzhou, China). Briefly, the binding sites of the sequencing primers were added to the connectors at both ends after constructing the DNA library. The template of the first sequencing was removed after the first sequencing run, and the paired-end module was used to guide the complementary strand to regenerate and amplify in the original position. The second complementary strand was then synthesized and sequenced.
2.3. Processing of Paired-End Sequences and Function Prediction
The barcodes from the raw sequencing data were removed using Cutadapt software (version 1.9) [27]. The paired-end reads were merged with a default error matching rate of 0.25 using FLASH software (version 1.2.8) [28]. The low-quality paired-end reads and chimeras were removed using fqtrim (version 0.94) and VSEARCH (version 2.3.4), respectively, with their default parameters [29]. All of the downstream analyses of the sequencing data were carried out by QIIME 2.0 software [30]. The dada2 plugin [31] of QIIME 2.0 was used to denoise the filtered sequencing data. Singletons were removed, and each sample was rarefied at a sequencing depth of 7419, the lowest among the samples. Taxonomy assignments of the ASVs (amplicon sequence variants) were performed against the SILVA database using the BLAST+ consensus taxonomy classifier [32]. The 16S rRNA sequence data were used to predict the potential functions of the bacterial communities in different samples using the PICRUSt2 tool [33].
2.4. Statistical Analyses
To visualize the differences between the bacterial communities in different habitats, a principal coordinate analysis (PCoA) that was based on the unweighted UniFrac distance was performed using the diversity plugin in QIIME 2.0. The α-diversity indexes including Shannon diversity, ASV richness, and Pielou’s evenness were calculated using the vegan package in R (version 3.4.3). Correlation analysis and visualization were performed using the OmicStudio tools. The Mantel test was used to examine the correlations between the five dominant phyla and the environmental factors. A redundancy analysis (RDA) was implemented at the simple effects level and conditional effects level using Canoco5 to reveal the potential environmental factors regulating the bacterial community composition. The output of the PICRUSt2 analysis displaying the gene family and metabolic pathway abundances in different samples was visualized and statistically analyzed using the STAMP tools [34]. For the association network analysis between the bacterioplankton and the microbial eukaryotes, we used freely available public data. Person’s rank correlations between the bacterioplankton and the microbial eukaryotes were calculated in R 3.6.3 and visualized using the igraph package (version 1.2.6). Only the strong correlations (rho > 0.8 and p < 0.05) between the bacterioplankton and the microbial eukaryotes were considered to be valid co-occurrences.
3. Results
3.1. Variations of Bacterioplankton Communities
The downstream processing of the raw sequencing reads provided a total of 2148 ASVs from 12 samples. The number of ASVs that were recovered from each sample ranged from 92 to 557, with the minimum and maximum values being in the deep waters of the upwelling area and non-upwelling area, respectively. The PCoA technique clustered the bacterioplankton communities into four groups (R = 0.8637, p = 0.001) (Figure 1b), which indicated that there were substantial differences among the habitats. Particularly, the samples from the upwelling surface water (S1, S2, S3) and the non-upwelling surface water (S4, S5, S6) were separated into two distinct clusters, which suggests that upwelling has a significant impact on the community composition of bacterioplankton. Furthermore, the Shannon diversity and richness of bacterioplankton in the deep water of the upwelling area was lower than that of the deep water of the non-upwelling area (Figure S1). However, the bacterioplankton diversity of the surface waters did not differ between the upwelling and non-upwelling areas.
Proteobacteria, Cyanobacteria, Bacteroidota, Firmicutes, and Actinobacteriota, which accounted for more than 90% of the total sequences, were the five most abundant phyla (Figure 2). The relative abundance of these phyla varied dramatically in each sample. Proteobacteria was the most abundant phylum in all of the samples, and it accounted for over 40% of the sequences in each sample (Figure 2a). Most Cyanobacteria were detected in surface water rather than in deep water, especially in non-upwelling surface water. The abundance of Cyanobacteria in upwelling surface water was decreased, indicating that upwelling may not be suitable for the growth of Cyanobacteria. However, Cyanobacteria were also found in upwelling deep water (Figure 2a). Some taxa were almost solely detected in the deep water, such as Nitrospinota, Chloroflexi, Planctomycetota, SAR324, and SAR406. Firmicutes, which usually account for a large proportion of the species in deep water [35], were more abundant in the upwelling surface water than they were in non-upwelling surface water (Figure 2a). At the class level, Bacilli (phylum Firmicutes) was promoted under the influence of upwelling (Figure 2b). Cyanobacteria (phylum Cyanobacteria) were found to decrease in upwelling surface water, but they increased in upwelling deep water (Figure 2b). Bacteroidia (phylum Bacteroidota) and Gammaproteobacteria (phylum Proteobacteria) also increased in upwelling surface water (Figure 2b).
3.2. Relationship between Environmental Factors and Bacterioplankton Community Composition
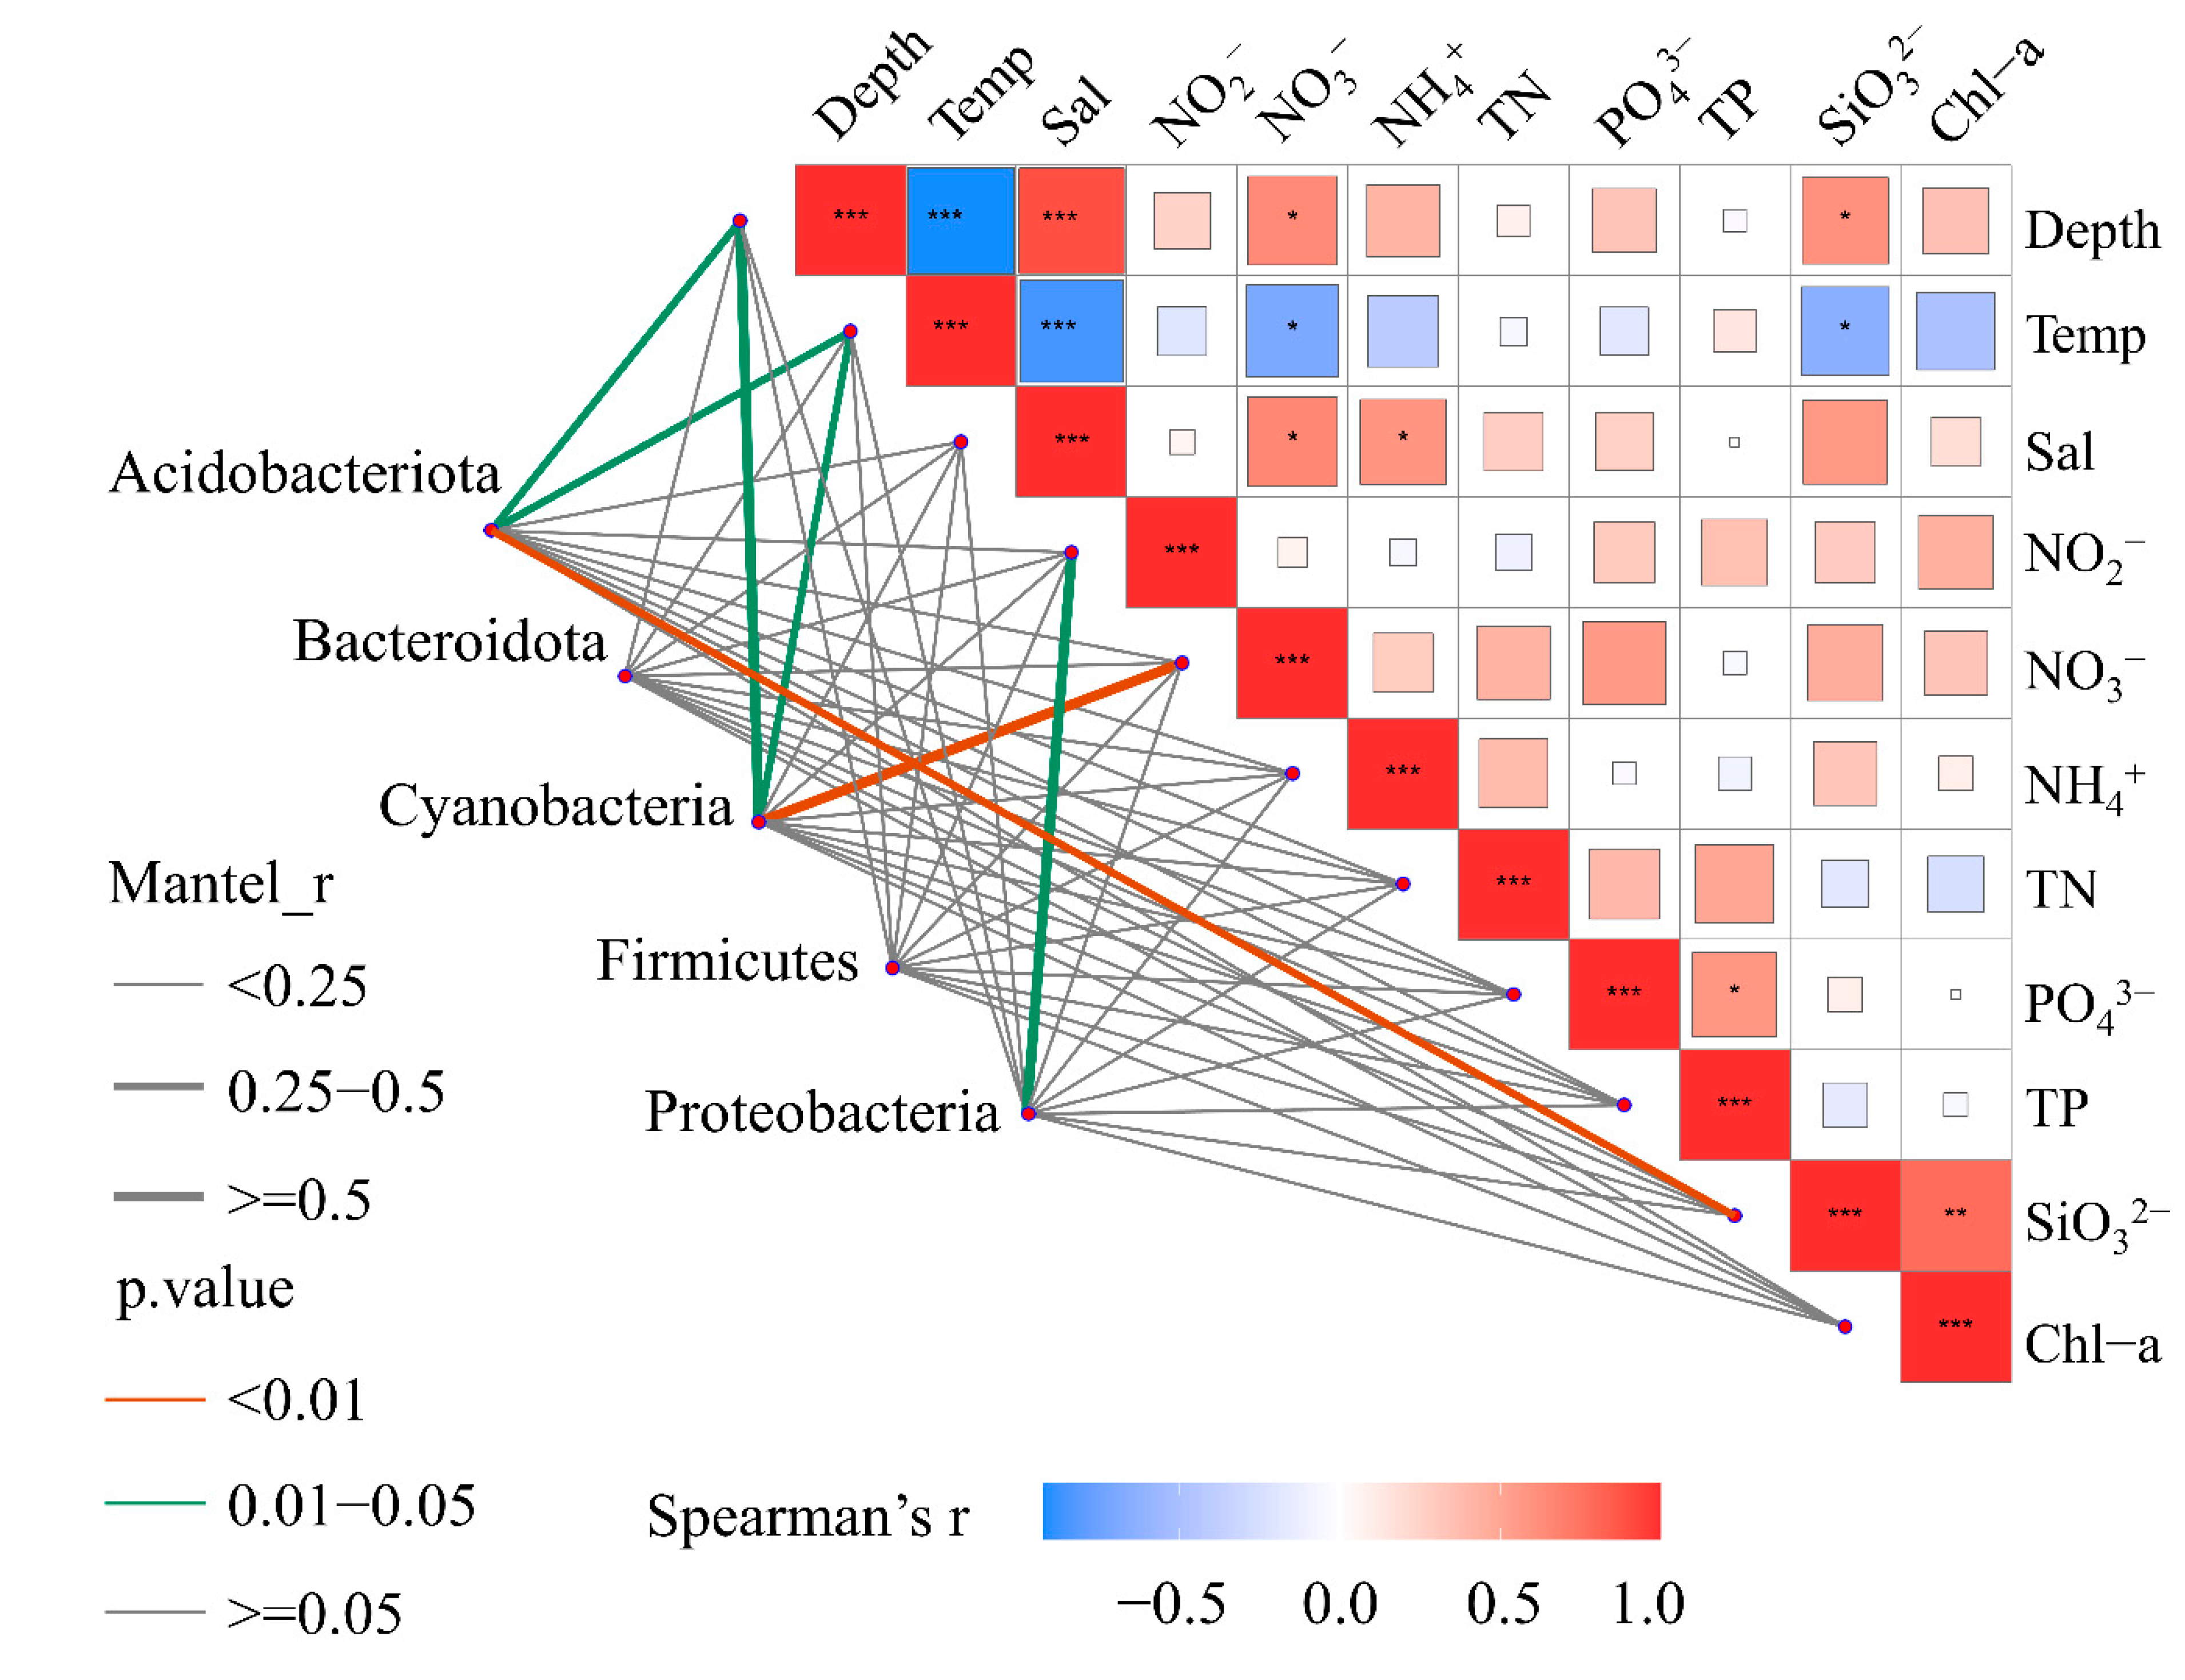
To reveal the relationship between the bacterial community composition and the environmental factors, correlation tests were carried out and the results were visualized in a heatmap (Figure S2). Most of the bacterial phyla exhibited a strong positive relationship with depth, such as Actinobacteriota, NB1-j, Nitrospinota, SAR324, SAR406, and Chloroflexi. These results were consistent with the distribution pattern of these phyla, and they only appeared in deep water rather than surface water. To eliminate the interference of autocorrelation between the different environmental factors, further correlations between the five dominant phyla and the biogeochemical parameters were analyzed by the Mantel test (Figure 3). The results showed that Acidobacteriota and Cyanobacteria had significant correlations with depth and temperature, whereas the other three phyla showed few significant correlations with certain environmental factors. Furthermore, the RDA revealed that depth was the most important factor in terms of a conditional effect (Table S2). Unlike the importance of temperature for the shaping of microbial eukaryotic communities [24], the influence of depth on bacterial communities indicates that there are more complex mechanisms for the structuring of bacterial communities in different environments because depth is a proxy for pressure, light, and other factors, unlike temperature.
3.3. Functional Differences of the Bacterioplankton Communities
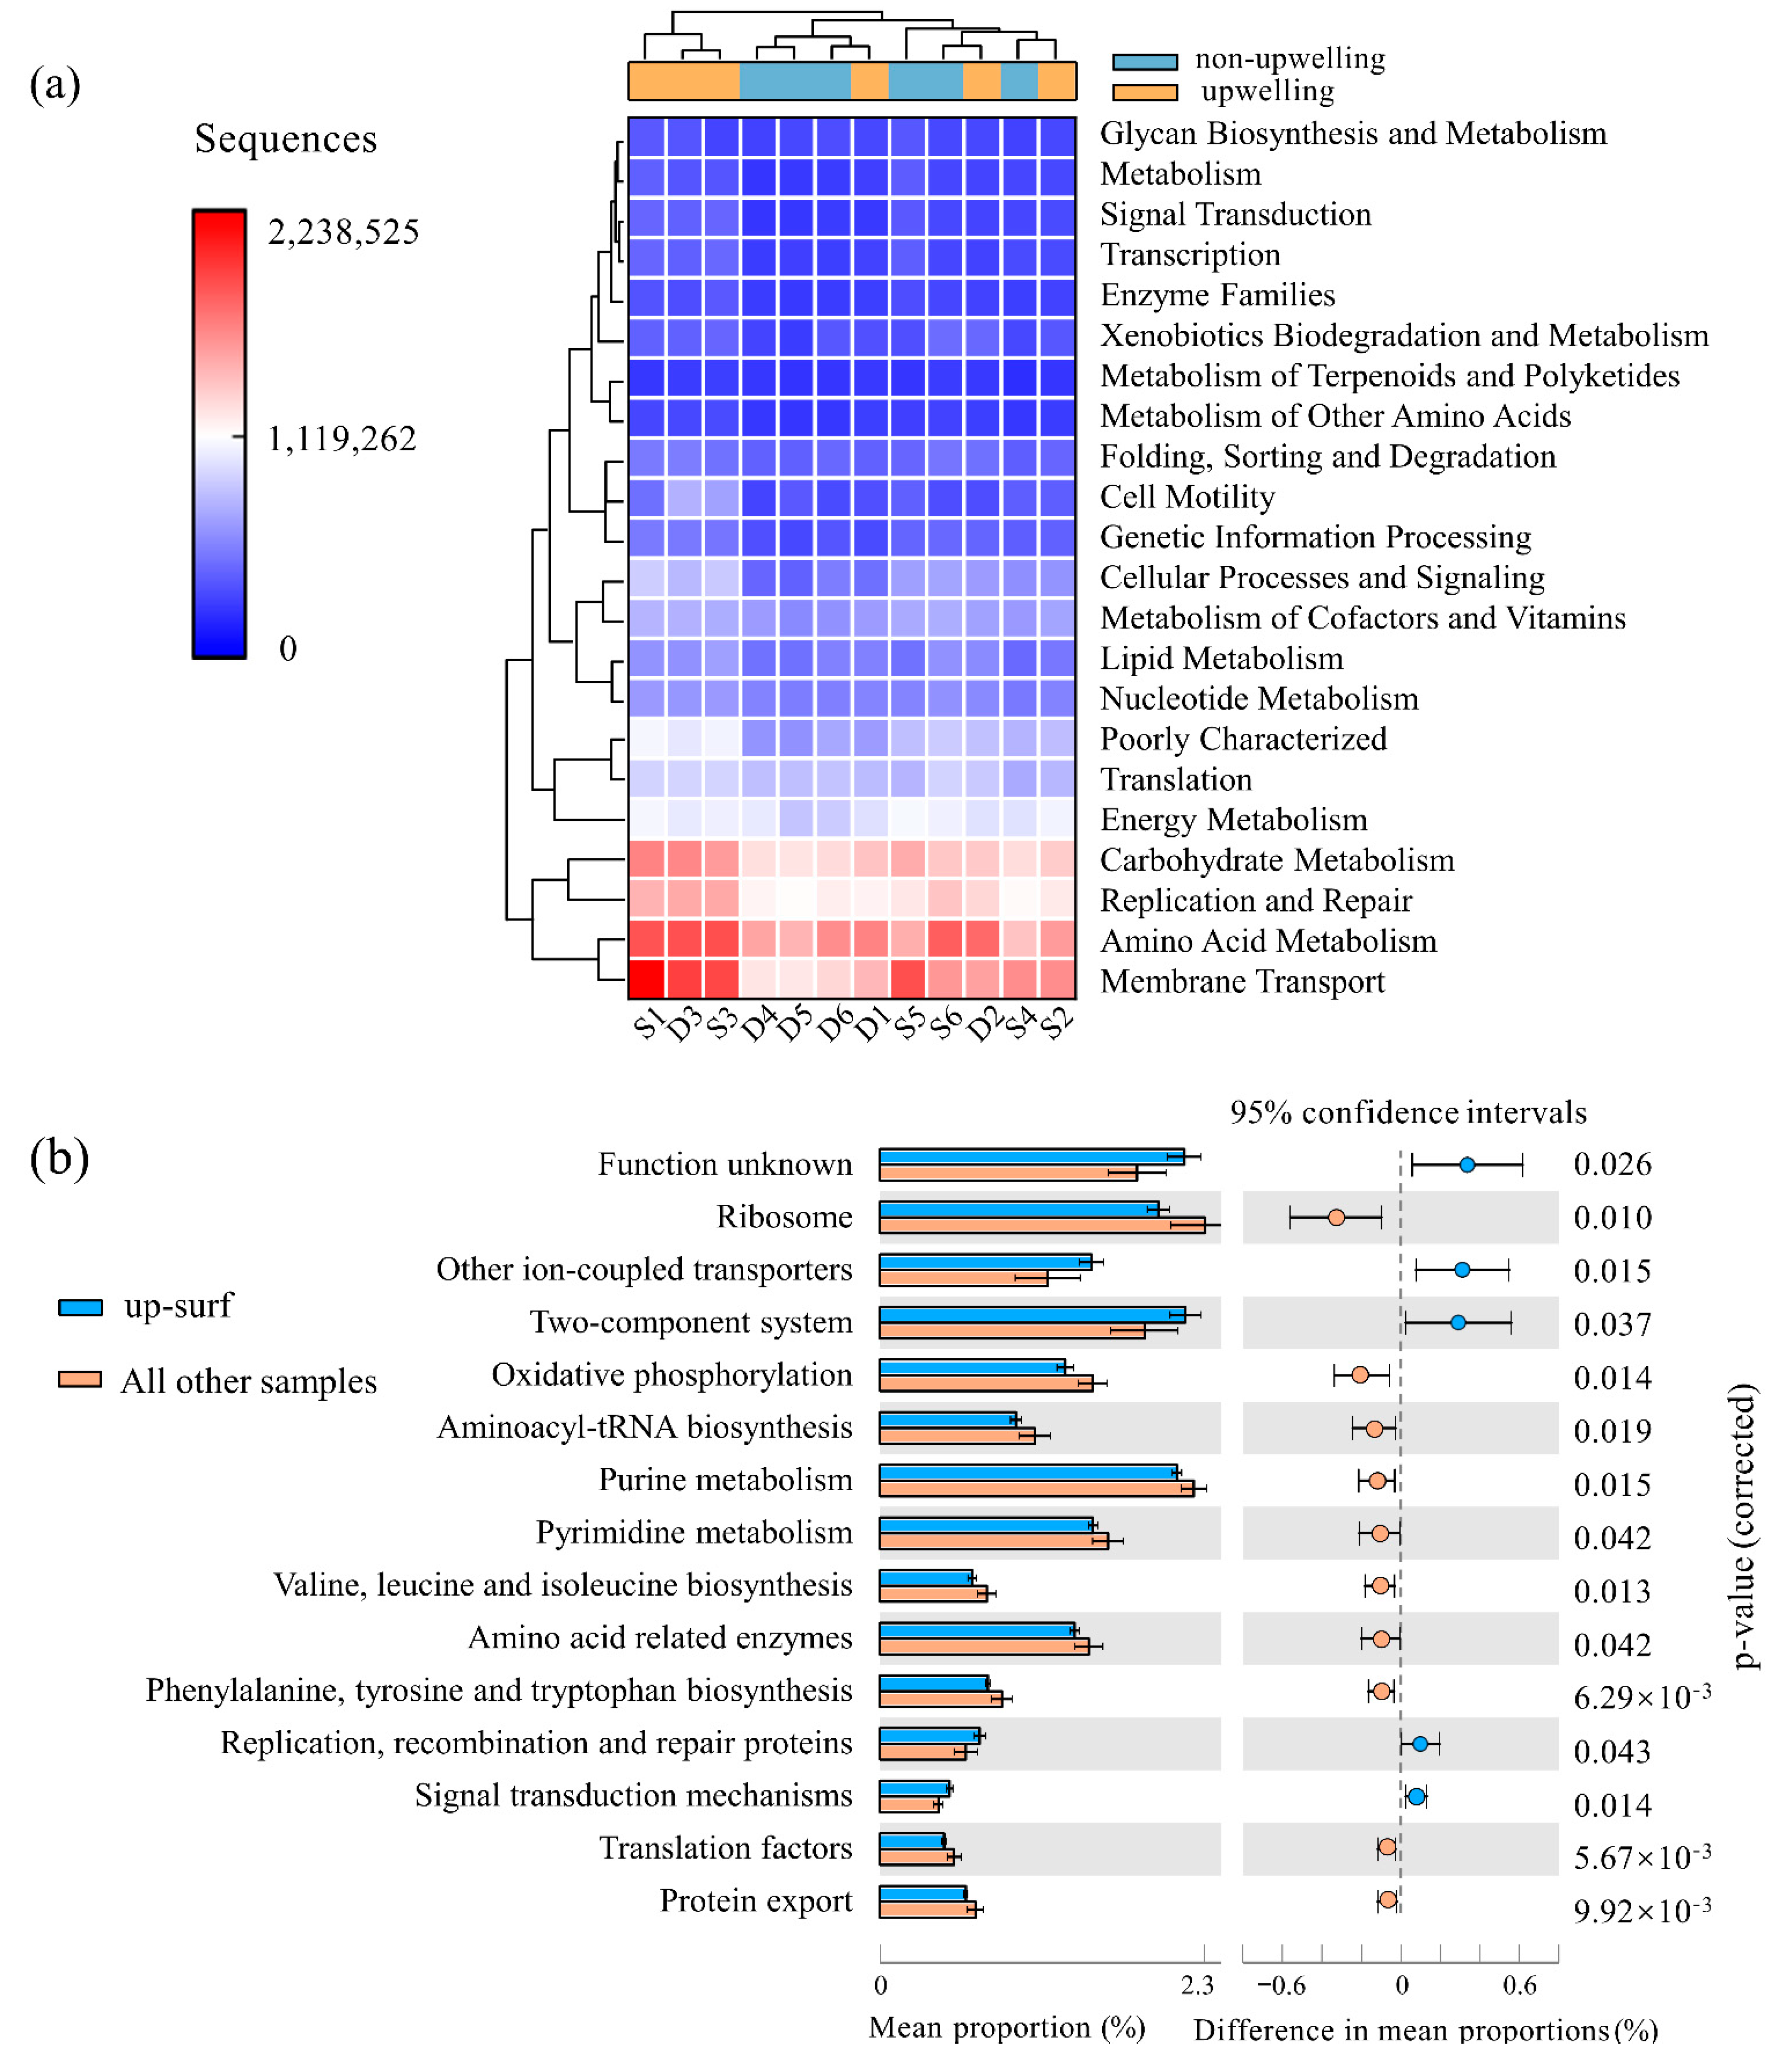
A PCA plot that was based on the KEGG pathways showed that there are significant differences between the surface water and the deep water, which is reflected in the profound impacts of depth on the bacterial community composition as well as metabolic functions (Figure S3). The functional pathway genes that are involved in amino acid metabolism (average 10.55%), membrane transport (average 10.26%), carbohydrate metabolism (average 8.95%), and replication and repair (average 8.16%) represented dominant functions in all 12 of the stations. However, these gene families in upwelling surface samples (especially S1 and S3) were significantly higher than those in non-upwelling areas (Figure 4a), which indicated that the nutrient exchanges and metabolic activities in the upwelling area were increased.
To explore the variations in community functions caused by upwelling, the other three habitats (i.e., upwelling deep, non-upwelling deep, and non-upwelling surface) were pooled together as one group and analyzed at the KEGG level 3 against the upwelling surface samples. The results showed that the functional genes that are related to signaling such as two-component systems, signal transduction mechanisms, and other ion-coupled transporters, were increased in the upwelling surface area (Figure 4b). All of the functional genes that were enhanced by upwelling were classified as Environmental Information Processing (KEGG level 1), which indicated that the bacteria have a strong and positive response to the environmental disturbances caused by upwelling. Furthermore, the increases in signaling genes probably imply the close connections as well as interactions between the bacterial communities and other microbes.
3.4. Interactions between Bacterioplankton and Microbial Eukaryotes
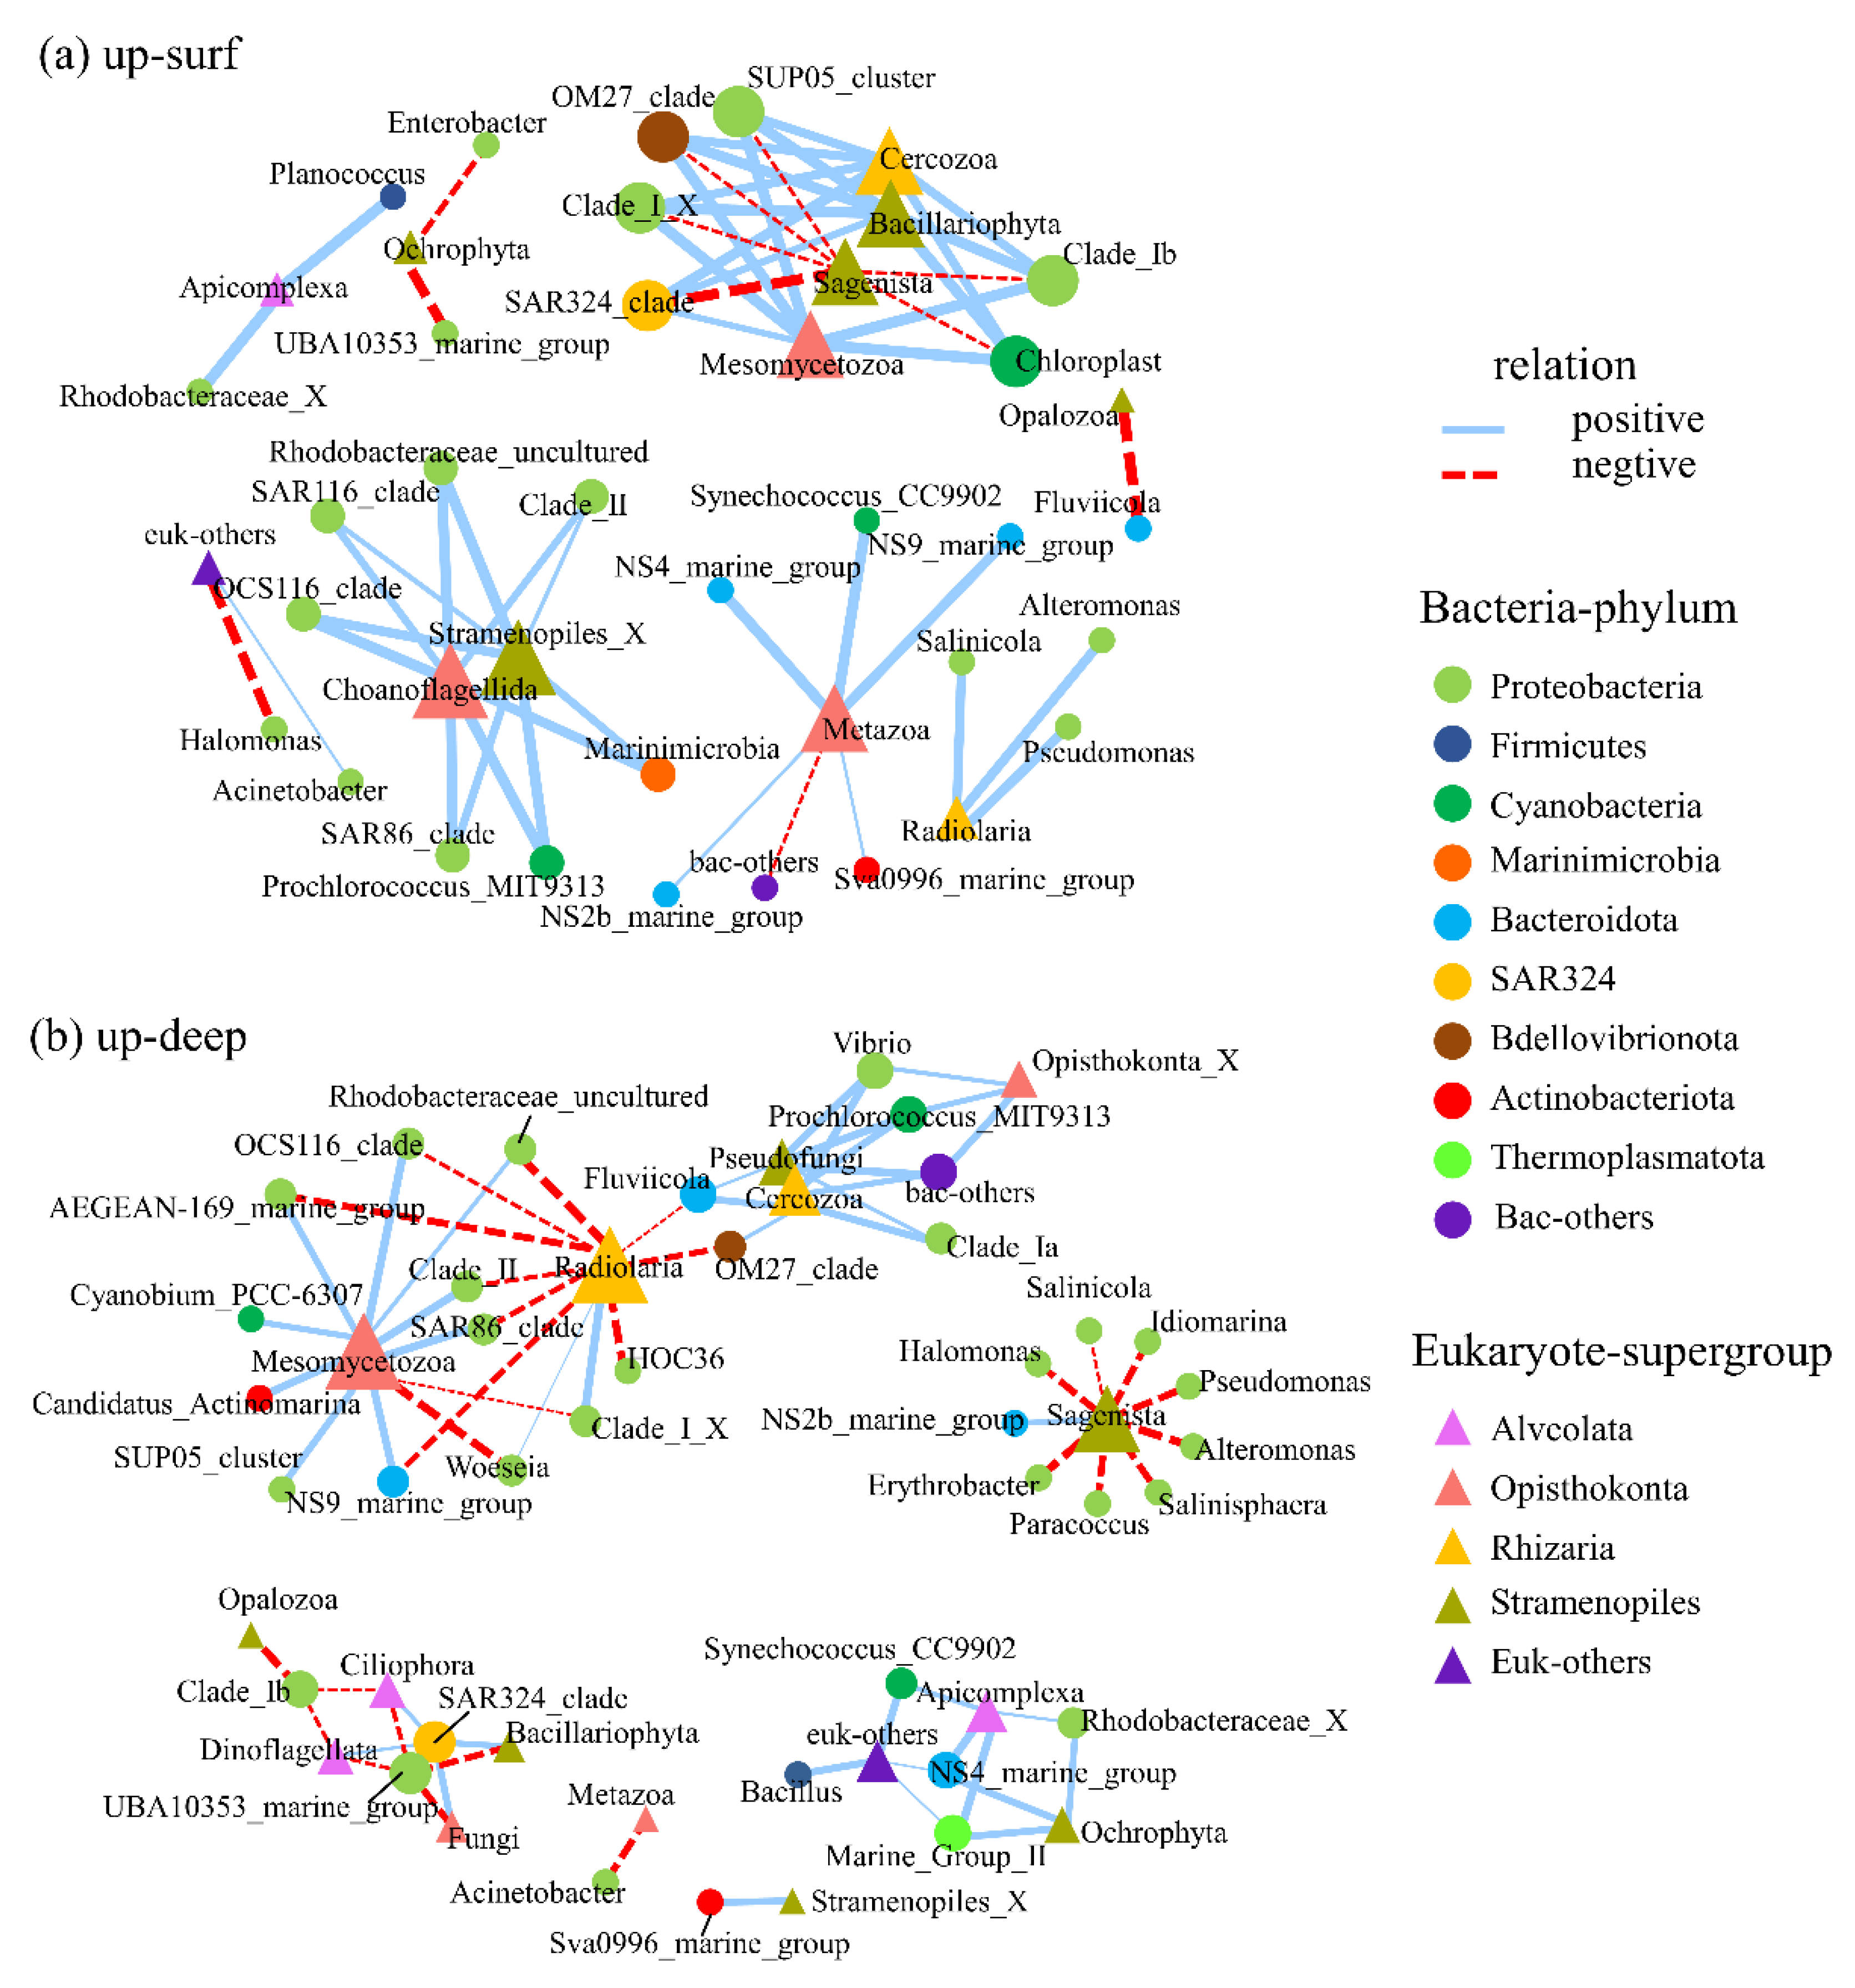
We speculated that there would be close interactions between bacteria and the other microbial communities because upwelling promoted the prosperity of genes that are related to signal transduction (see Figure 4). To test this conjecture, a network analysis between the bacterioplankton and the microbial eukaryotes was conducted (Figure 5, Figure S4). The resulting network showed that the associations between the bacterioplankton and the microbial eukaryotes at the phyla level were significantly closer in the upwelling area than they were in the non-upwelling area (18 nodes, 11 edges in upwelling surface area; 22 nodes, 19 edges in upwelling deep area; 9 nodes, 8 edges in non-upwelling surface area; 11 nodes, 7 edges in the non-upwelling deep area, respectively, Figure S4).
To further explore the impact of upwelling on the relationships between the bacterioplankton and the microeukaryotes, we chose the samples from an upwelling surface area and an upwelling deep area for the subsequent analyses. We also refined the bacterial populations to the genus level. On the whole, the interaction networks take microeukaryotes as cores, and then, they radiate to various bacterial genera. As the most abundant bacterial phylum in the South China sea, Proteobacteria took plenty of nodes both in upwelling surface water as well as upwelling deep water and it had positive correlations with microbial eukaryotes, such as Choanoflagellida, Bacillariophyta, Cercozoa, Metazoa. In the surface water, SAR11_clade (Clade_I_X and Clade_Ib) and SAR324_clade were negatively correlated with Sagenista, which were mainly composed of Labyrinthulomycetes. According to our previous study, Labyrinthulomycetes, known as “left-over scavengers”, was marked as a biomarker in upwelling areas. Considering that there are overlaps between the niches of Labyrinthulomycetes and bacterioplankton, the negative correlations between those two may reflect competition between them. Interestingly, Radiolaria showed positive correlations with Salinicola, Alteromonas, and Pseudomonas in the upwelling surface water, while exhibiting negative correlations with multiple genera of Proteobacteria in the upwelling deep water (Figure 5), which indicates that bacterioplankton and microbial eukaryotes might change their interaction modes to respond to the changing environment. More importantly, two Cyanobacteria genera, namely Prochlorococcus_MIT9313 and Synechococcus_CC9902, showed positive correlations with several microbial eukaryotes, including Alveolata, Stramenopiles, Rhizaria, and Opisthokonta in upwelling deep water. The survival strategies of photosynthetic organisms such as Cyanobacteria under the aphotic environment may largely depend on their cooperative symbiosis with other microorganisms. The migration of Cyanobacteria might be an important way to transport organic carbon that is fixed by photosynthesis from the euphotic layer to the deep sea and make contributions to the microbial carbon sink.
4. Discussion
4.1. Response of Bacterioplankton Communities to the Upwelling
Upwelling has been reported to have significant influences on the abundance and community composition of bacterioplankton [20,36,37]. The research on the succession of bacterial assemblages in aging, upwelled water of the Benguela upwelling found that the shift of the bacterial community during the upwelling period is closely related to the succession periods of phytoplankton bloom [22]. In our previous study, we discovered that some phytoplankton such as diatoms and green algae proliferate under the influence of upwelling [24]. In this research, several bacterial classes such as Bacilli, Bacteroidia, and Gammaproteobacteria were increased during the diatom bloom period (Figure 2b), which is consistent with other reports [38,39,40]. Contrary to the diatom blooms, the relative abundance of Cyanobacteria decreased more in the upwelling surface water than it did in the non-upwelling surface water (Figure 2a), which might be due to diatoms having faster capabilities of nutrient uptake and storage [41]. The intensity of upwelling, more precisely, the supply of nutrients, plays a vital role in the succession of these microbial communities. Conversely, the alteration of microbial communities deeply affects the intensity and exportation rates of the microbial carbon pump. It has been reported that in the upwelling area of the western South China Sea, the phytoplankton community shifts from being composed of diatoms to picoplankton (such as Prochlorococcus and Synechococcus) as the upwelling intensities shift from initial intensification to the later weakness periods [19]. Considering that our sampling time was during a strong period of upwelling, the rapid response of the diatoms to nutrients made it a competitive rival to Cyanobacteria, and this led to the reduction of Cyanobacteria abundance. Studies have shown that Cyanobacteria make outstanding contributions to primary productivity, especially in oligotrophic areas [42,43]. Therefore, although the abundance of Cyanobacteria decreased in the early stage of upwelling, it might dominate the phytoplankton community in the late period of upwelling and absorb large amounts of CO2 to then become the major carbon export to the deep sea [19]. We found that Cyanobacteria accounted for a high proportion in the deep water of the upwelling area (13.3% and 7.1% of total sequences in D1 and D2, respectively), which might be strong evidence that Cyanobacteria can migrate downward to transport carbon to the deep sea and promote long-term carbon sequestration.
The relative abundance of Bacilli, which belong to the Firmicutes phylum, was increased by upwelling (Figure 2b). Firmicutes include many different species of Bacilli with an efficient denitrification capacity [35,44], and they are usually detected in deep water or sediments [45,46,47]. Bacilli have strong adaptability to different environmental stressors. For example, the activation of the SigB-controlled general stress response can provide significant cross-protection for Bacillus subtilis to deal with lethal oxidative stress [48]. In addition, under the conditions wherein diatoms and green algae prevail and compete for a large number of nutrients, Bacilli might use refractory macromolecular carbon compounds to avoid direct competition with the diatoms and thereby, improve its survival competitiveness. It has been reported that the members of Firmicutes can use biphenyl as the sole carbon and energy source, which suggests the potential of bioremediation by those highly adaptable organisms [49]. The highly resilient ability and utilization potential of special carbon sources are likely strategies that are employed by the Firmicutes to survive in fluctuating upwelling environments.
4.2. Upregulated Signaling Function in Upwelling and Potential Contribution of Bacterioplankton to Carbon Sequestration
The resilience ability of bacterioplankton is known to allow them to survive during constantly changing conditions [50]. According to our previous study, we found that the abundances of bacterioplankton are increased by upwelling and thus, we speculated that bacterioplankton communities enact rapid and direct response mechanisms to engage with the fluctuating environment [24]. Hence, we predicted the impacts of upwelling on functional genes, subsequently, in this research. The results showed that functional genes that are involved in signal transduction were promoted, which confirmed the preceding speculation and demonstrated that bacterial communities have active response strategies to upwelling [37]. Upwelling usually brings abundant nutrients with low-temperature stress synchronously, which sometimes, could be a selection pressure and eventually decrease the microbial diversity [51,52,53]. The temperature is identified as the most important factor that shapes the microbial eukaryotic communities in the upwelling region [24]. Similar to the microbial eukaryotic communities, the major bacterial groups were found to have close correlations with depth and temperature (Figure 3). Therefore, how bacterioplankton sense and adapt to low temperatures has become the key point for them surviving successfully, which primarily depends on the ability of a sensor to sense changes in the temperature [54]. In the present study, the functional genes that are involved in the two-component system were increased (Figure 4b). The two-component system is reported to be a major strategy in connecting variations in input signals to variations in cellular physiological output [55]. Previous studies have shown that the decreased membrane fluidity serves as a primary signal for cold temperature perception, and then, a two-component signal transduction pathway consisting of a membrane-associated sensor and a cytoplasmic response regulator is involved in triggering the cold-responsive mechanisms [56,57,58,59]. As a consequence, inducible proteins accumulate to repair the damage that is caused by cold stress [54]. In addition to regulating the temperature stress system, the two-component system is reported to help bacterioplankton cope with various environmental stresses, including high-salt stress, high-light stress, and high-temperature stress [60,61], and it even helps in regulating the growth and cell cycle progression of bacteria [62,63]. Active signal transduction systems are likely to be effective ways for bacterial communities to adapt to the fluctuating environment.
Studies have shown that the cell-to-cell signaling of bacteria has an important influence on bacteria-host interactions [64,65]. Thus, we hypothesize that the signal transduction system can not only make bacterial communities adapt to the adverse environment easier, but also probably adjust the interactions between bacterioplankton and microeukaryotes. Indeed, more complex networks at the phyla level between bacterioplankton and microbial eukaryotes were revealed in the upwelling areas than in non-upwelling areas (Figure S4), which might make a potential contribution to downward carbon export and sequestration. For example, although Cyanobacteria are vital carbon dioxide fixers, the contribution of planktonic Cyanobacteria to the burial of organic carbon in deep-sea sediments has been considered negligible due to their slow sinking rate [66,67]. However, research has shown that the physical aggregation of Cyanobacteria and eukaryotes can be one important way to enhance sinking rates in the deep ocean because it increases the effective size of the small cells [68]. Some eukaryotes can secrete extracellular polysaccharides and even use ectoplasmic nets to attach to detritus as well as living microbes, and then speed up the formation of large fast-sinking particles [69,70]. This phenomenon can be reflected in the complex network between microbial eukaryotes and bacterioplankton (Figure 5). Cyanobacteria, especially the members of the genus Synechococcus, are an important component of these particulate organic aggregations, which are known as marine snow, and are even detected in the guts of zooplankton, frequently [71,72,73], which might explain the high proportion of Cyanobacteria in upwelling deep water (Figure 2a). In addition, previous research has shown that Cyanobacteria perform no alkaline phosphatase activity in marine snow, which is unlike the other dense populations of bacterioplankton [74]. Therefore, phosphorus that is released by other bacterioplankton or microeukaryotes may support the proliferation of Cyanobacteria in marine snow. Overall, the complex relationship between bacterioplankton and microbial eukaryotes can benefit both their survival in changeful habitats and provide a useful mode to strengthen the deep ocean carbon sink.
5. Conclusions
Figuring out the dynamic changes and alterations in the metabolic functions of bacterial communities in an upwelling habitat is a prerequisite for accurately evaluating the carbon sink contribution and ecological functions of upwelling. Here, we used a 16S rRNA high-throughput sequencing approach to investigate the bacterial communities in upwelling and non-upwelling areas. Our results showed that the bacterial community composition varied between the upwelling and non-upwelling areas. Members of Firmicutes were more abundant in the upwelling than non-upwelling water areas, while the members of Cyanobacteria presented the opposite pattern. Active signal transduction systems, such as the two-component systems and signal transduction mechanisms, are the crucial survival mechanisms of bacterioplankton when they are facing an adverse environment, and they may also regulate the interactions between bacterial communities and other microorganisms. The relationships between bacterioplankton and microbial eukaryotes showed more complicated correlations in upwelling, and the positive correlations between Cyanobacteria and microbial eukaryotes revealed the potential contribution of Cyanobacteria to the carbon sink. More direct analyses of their metabolism and function, such as studies of metagenomics and metatranscriptomics, should be employed in future research to accurately reflect the dynamics of microbial communities in upwelling. In addition, the application of isotope tracer technology can make a more accurate assessment and quantification of the microbial contribution to carbon sequestration.
Supplementary Materials
The following supporting information can be downloaded at: https://www.mdpi.com/article/10.3390/w14193097/s1. Figure S1: Shannon (a), Richness (b), and Evenness (c) for the bacterial communities from different habitats. Labels “non-deep”, “non-surf”, “up-deep” and “up-surf” represent non-upwelling deep water, non-upwelling surface water, upwelling deep water, and upwelling surface water, respectively. The boxes represent the ranges of the first and third quartiles, the line and small square inside each box represent the median and mean values, and the ends of the whiskers represent the lowest and highest datums (mean ± 1.5 SD); Figure S2: Correlations between environmental parameters and bacterial phyla. Asterisks indicate P < 0.05 and the color bar is based on the scale of Pearson’s correlation coefficients; Figure S3: Principal component analysis based on the predicted KEGG pathways. Labels “non-deep”, “non-surf”, “up-deep” and “up-surf” represent non-upwelling deep water, non-upwelling surface water, upwelling deep water, and upwelling surface water, respectively; Figure S4: A network analysis of associations between bacterioplankton and microbial eukaryotes in (a) upwelling surface water, (b) non-upwelling surface water, (c) upwelling deep water, and (d) non-upwelling deep water. The bacterioplankton phyla and microbial eukaryotes phyla are represented by circles with distinctive colors. The size of the nodes represented the relative abundances of each microbe. The blue and red lines between the nodes represent positive or negative correlations, respectively. The thickness of the line represents the strength of correlation. Table S1: Location, depth, temperature, and salinity of environmental samples; Table S2: Potential environmental factors for the bacterial phyla composition revealed by RDA.
Author Contributions
Conceptualization, X.L., B.S. and G.W.; Formal analysis, X.L. and J.L.; Investigation, X.L., N.X. and J.L.; Methodology, X.L., N.X. and J.L.; Visualization, X.L., N.X. and M.B.; Writing—original draft, X.L. and G.W.; Project administration, J.L. and M.B.; Data Curation, X.L., M.B. and B.S.; Writing—review and editing; B.S. and G.W.; Funding acquisition, G.W.; Supervision, G.W. and B.S. All authors have read and agreed to the published version of the manuscript.
Funding
This research was funded by the National Science Foundation of China (32170063).
Data Availability Statement
The raw sequences have been deposited in NCBI under the BioProject PRJNA861929.
Conflicts of Interest
The authors declare no conflict of interest. The funders had no role in the design of the study; in the collection, analyses, or interpretation of data; in the writing of the manuscript; or in the decision to publish the results.
References
- Kuang, C.Y. Analysis of Green House Gases and Positive Impact of Replacing Traditional Energy with Clean Energy. In Proceedings of the 8th International Conference on Environment Pollution and Prevention (ICEPP), Electr Network, Sydney, Australia, 3–5 December 2020. [Google Scholar]
- Lawrence, M.W. Efficiency of carbon sequestration by added reactive nitrogen in ocean fertilisation. Int. J. Glob. Warm. 2014, 6, 15–33. [Google Scholar] [CrossRef]
- Rickels, W.; Lontzek, T.S. Optimal global carbon management with ocean sequestration. Oxf. Econ. Pap. -New Ser. 2012, 64, 323–349. [Google Scholar] [CrossRef] [Green Version]
- Sun, Y.; Zhou, L.; Li, Y. Development Status of CO2 Marine Sequestration. Geol. Sci. Techol. Inf. 2018, 37, 212–218. [Google Scholar]
- Le Quere, C.; Andrew, R.M.; Friedlingstein, P.; Sitch, S.; Hauck, J.; Pongratz, J.; Pickers, P.A.; Korsbakken, J.I.; Peters, G.P.; Canadell, J.G.; et al. Global Carbon Budget 2018. Earth Syst. Sci. Data 2018, 10, 2141–2194. [Google Scholar] [CrossRef] [Green Version]
- Rotko, D.; Stupar, D.; Neale, C.M.; Maltese, A. Carbon sequestering using remote sensing. In Proceedings of the Remote Sensing for Agriculture, Ecosystems, and Hydrology XXI, Strasbourg, France, 21 October 2019. [Google Scholar]
- Cao, L.; Caldeira, K. Can ocean iron fertilization mitigate ocean acidification? Clim. Change 2010, 99, 303–311. [Google Scholar] [CrossRef]
- Baumann, M.; Taucher, J.; Paul, A.J.; Heinemann, M.; Vanharanta, M.; Bach, L.T.; Spilling, K.; Ortiz, J.; Aristegui, J.; Hernandez-Hernandez, N.; et al. Effect of Intensity and Mode of Artificial Upwelling on Particle Flux and Carbon Export. Front. Mar. Sci. 2021, 8, 742142. [Google Scholar] [CrossRef]
- Pan, Y.W.; You, L.; Li, Y.F.; Fan, W.; Chen, C.T.A.; Wang, B.J.; Chen, Y. Achieving Highly Efficient Atmospheric CO2 Uptake by Artificial Upwelling. Sustainability 2018, 10, 664. [Google Scholar] [CrossRef] [Green Version]
- Lovelock, J.E.; Rapley, C.G. Ocean pipes could help the earth to cure itself. Nature 2007, 449, 403. [Google Scholar] [CrossRef] [Green Version]
- Zhang, Y.; Zhao, M.; Cui, Q.; Fan, W.; Qi, J.; Chen, Y.; Zhang, Y.; Gao, K.; Fan, J.; Wang, G.; et al. Processes of coastal ecosystem carbon sequestration and approaches for increasing carbon sink. Sci. China Earth Sci. 2017, 60, 809–820. [Google Scholar] [CrossRef]
- Pan, Y.W.; Fan, W.; Huang, T.H.; Wang, S.L.; Chen, C.T.A. Evaluation of the sinks and sources of atmospheric CO2 by artificial upwelling. Sci. Total Environ. 2015, 511, 692–702. [Google Scholar] [CrossRef]
- Pan, Y.W.; Wei, F.; Zhang, D.H.; Chen, J.W.; Huang, H.C.; Liu, S.X.; Jiang, Z.P.; Di, Y.N.; Tong, M.M.; Chen, Y. Research progress in artificial upwelling and its potential environmental effects. Sci. China-Earth Sci. 2016, 59, 236–248. [Google Scholar] [CrossRef]
- Yang, G.; Nian-peng, H.; Ya-feng, W. Characteristics of Carbon Sequestration by Ecosystem and Progress in Its Research. J. Nat. Resour. 2013, 28, 1264–1274. [Google Scholar]
- Beaulieu, S.E. Accumulation and fate of phytodetritus on the sea floor. In Oceanography and Marine Biology; Gibson, R.N., Barnes, M., Atkinson, R.J.A., Eds.; Taylor & Francis: Abingdon, UK, 2002; Volume 40, pp. 171–232. [Google Scholar]
- O’Brien, M.C.; Melling, H.; Pedersen, T.F.; Macdonald, R.W. The role of eddies on particle flux in the Canada Basin of the Arctic Ocean. Deep. -Sea Res. Part I-Oceanogr. Res. Pap. 2013, 71, 1–20. [Google Scholar] [CrossRef] [Green Version]
- Oschlies, A. Can eddies make ocean deserts bloom? Glob. Biogeochem. Cycles 2002, 16, 53-1–53-11. [Google Scholar] [CrossRef] [Green Version]
- Chen, F.Z.; Cai, W.J.; Benitez-Nelson, C.; Wang, Y.C. Sea surface pCO2-SST relationships across a cold-core cyclonic eddy: Implications for understanding regional variability and air-sea gas exchange. Geophys. Res. Lett. 2007, 34, L10603. [Google Scholar] [CrossRef] [Green Version]
- Jiao, N.; Zhang, Y.; Zhou, K.; Li, Q.; Dai, M.; Liu, J.; Guo, J.; Huang, B. Revisiting the CO2 “source” problem in upwelling areas—A comparative study on eddy upwellings in the South China Sea. Biogeosciences 2014, 11, 2465–2475. [Google Scholar] [CrossRef] [Green Version]
- Anas, A.; Sheeba, V.A.; Jasmin, C.; Gireeshkumar, T.R.; Mathew, D.; Krishna, K.; Nair, S.; Muraleedharan, K.R.; Jayalakshmy, K.V. Upwelling induced changes in the abundance and community structure of archaea and bacteria in a recurring mud bank along the southwest coast of India. Reg. Stud. Mar. Sci. 2018, 18, 113–121. [Google Scholar] [CrossRef]
- Sun, F.; Wu, M.; Wang, Y.; Sun, C.; Xu, Z. Diversity and potential function of bacterial communities in different upwelling systems. Estuar. Coast. Shelf Sci. 2020, 237, 106698. [Google Scholar] [CrossRef]
- Bergen, B.; Herlemann, D.P.; Jurgens, K. Zonation of bacterioplankton communities along aging upwelled water in the northern Benguela upwelling. Front. Microbiol. 2015, 6, 621. [Google Scholar] [CrossRef] [Green Version]
- Vijayan, J.; Ammini, P.; Nathan, V.K. Diversity pattern of marine culturable heterotrophic bacteria in a region with coexisting upwelling and mud banks in the southeastern Arabian Sea. Environ. Sci. Pollut. Res. 2021, 29, 3967–3982. [Google Scholar] [CrossRef]
- Liu, X.; Xie, N.; Bai, M.; Li, J.; Wang, G. Composition change and decreased diversity of microbial eukaryotes in the coastal upwelling waters of South China Sea. Sci. Total Environ. 2021, 795, 148892. [Google Scholar] [CrossRef] [PubMed]
- He, Y.; Sen, B.; Zhou, S.; Xie, N.; Zhang, Y.; Zhang, J.; Wang, G. Distinct Seasonal Patterns of Bacterioplankton Abundance and Dominance of Phyla alpha-Proteobacteria and Cyanobacteria in Qinhuangdao Coastal Waters Off the Bohai Sea. Front. Microbiol. 2017, 8, 1579. [Google Scholar] [CrossRef] [PubMed] [Green Version]
- Logue, J.B.; Stedmon, C.A.; Kellerman, A.M.; Nielsen, N.J.; Andersson, A.F.; Laudon, H.; Lindstrom, E.S.; Kritzberg, E.S. Experimental insights into the importance of aquatic bacterial community composition to the degradation of dissolved organic matter. ISME J. 2016, 10, 533–545. [Google Scholar] [CrossRef] [PubMed] [Green Version]
- Martin, M. Cutadapt removes adapter sequences from high-throughput sequencing reads. EMBnet. J. 2011, 17, 10–12. [Google Scholar] [CrossRef]
- Magoc, T.; Salzberg, S.L. FLASH: Fast length adjustment of short reads to improve genome assemblies. Bioinformatics 2011, 27, 2957–2963. [Google Scholar] [CrossRef] [Green Version]
- Rognes, T.; Flouri, T.; Nichols, B.; Quince, C.; Mahé, F. VSEARCH: A versatile open source tool for metagenomics. PeerJ 2016, 4, e2584. [Google Scholar] [CrossRef] [Green Version]
- Bolyen, E.; Rideout, J.R.; Dillon, M.R.; Bokulich, N.; Abnet, C.C.; Al-Ghalith, G.A.; Alexander, H.; Alm, E.J.; Arumugam, M.; Asnicar, F.; et al. Reproducible, interactive, scalable and extensible microbiome data science using QIIME 2. Nat. Biotechnol. 2019, 37, 852–857. [Google Scholar] [CrossRef]
- Callahan, B.J.; McMurdie, P.J.; Rosen, M.J.; Han, A.W.; Johnson, A.J.A.; Holmes, S.P. DADA2: High-resolution sample inference from Illumina amplicon data. Nat. Methods 2016, 13, 581–583. [Google Scholar] [CrossRef] [Green Version]
- Camacho, C.; Coulouris, G.; Avagyan, V.; Ma, N.; Papadopoulos, J.; Bealer, K.; Madden, T.L. BLAST+: Architecture and applications. BMC Bioinform. 2009, 10, 421. [Google Scholar] [CrossRef] [Green Version]
- Douglas, G.M.; Maffei, V.J.; Zaneveld, J.R.; Yurgel, S.N.; Brown, J.R.; Taylor, C.M.; Huttenhower, C.; Langille, M.G.I. PICRUSt2 for prediction of metagenome functions. Nat. Biotechnol. 2020, 38, 685–688. [Google Scholar] [CrossRef]
- Parks, D.H.; Tyson, G.W.; Hugenholtz, P.; Beiko, R.G. STAMP: Statistical analysis of taxonomic and functional profiles. Bioinformatics 2014, 30, 3123–3124. [Google Scholar] [CrossRef] [PubMed] [Green Version]
- Verbaendert, I.; Boon, N.; De Vos, P.; Heylen, K. Denitrification is a common feature among members of the genus Bacillus . Syst. Appl. Microbiol. 2011, 34, 385–391. [Google Scholar] [CrossRef]
- Tsai, A.-Y.; Gong, G.-C.; Sanders, R.W.; Chao, C.-F.; Chiang, K.-P. Microbial Dynamics in an Oligotrophic Bay of the Western Subtropical Pacific: Impact of Short-Term Heavy Freshwater Runoff and Upwelling. J. Oceanogr. 2010, 66, 873–883. [Google Scholar] [CrossRef]
- Malik, A.; Fernandes, C.E.G.; Gonsalves, M.J.B.D.; Subina, N.S.; Mamatha, S.S.; Krishna, K.; Varik, S.; Kumari, R.; Gauns, M.; Cejoice, R.P.; et al. Interactions between trophic levels in upwelling and non-upwelling regions during summer monsoon. J. Sea Res. 2015, 95, 56–69. [Google Scholar] [CrossRef]
- Teeling, H.; Fuchs, B.M.; Becher, D.; Klockow, C.; Gardebrecht, A.; Bennke, C.M.; Kassabgy, M.; Huang, S.X.; Mann, A.J.; Waldmann, J.; et al. Substrate-Controlled Succession of Marine Bacterioplankton Populations Induced by a Phytoplankton Bloom. Science 2012, 336, 608–611. [Google Scholar] [CrossRef]
- Pinhassi, J.; Sala, M.M.; Havskum, H.; Peters, F.; Guadayol, O.; Malits, A.; Marrase, C. Changes in bacterioplankton composition under different phytoplankton regimens. Appl. Environ. Microbiol. 2004, 70, 6753–6766. [Google Scholar] [CrossRef] [Green Version]
- Grossart, H.P.; Levold, F.; Allgaier, M.; Simon, M.; Brinkhoff, T. Marine diatom species harbour distinct bacterial communities. Environ. Microbiol. 2005, 7, 860–873. [Google Scholar] [CrossRef]
- Irwin, A.J.; Finkel, Z.V.; Schofield, O.M.E.; Falkowski, P.G. Scaling-up from nutrient physiology to the size-structure of phytoplankton communities. J. Plankton Res. 2006, 28, 459–471. [Google Scholar] [CrossRef] [Green Version]
- Liu, H.B.; Suzukil, K.; Minami, C.; Saino, T.; Watanabe, M. Picoplankton community structure in the subarctic Pacific Ocean and the Bering Sea during summer 1999. Mar. Ecol. Prog. Ser. 2002, 237, 1–14. [Google Scholar] [CrossRef] [Green Version]
- DuRand, M.D.; Olson, R.J.; Chisholm, S.W. Phytoplankton population dynamics at the Bermuda Atlantic Time-series station in the Sargasso Sea. Deep. Sea Res. II 2001, 48, 1983–2003. [Google Scholar] [CrossRef]
- Gomes, J.; Khandeparker, R.; Naik, H.; Shenoy, D.; Meena, R.M.; Ramaiah, N. Denitrification rates of culturable bacteria from a coastal location turning temporally hypoxic. J. Mar. Syst. 2020, 209, 103089. [Google Scholar] [CrossRef]
- Sun, Q.; Song, J.; Li, X.; Yuan, H.; Ma, J.; Wang, Q. Bacterial vertical and horizontal variability around a deep seamount in the Tropical Western Pacific Ocean. Mar. Pollut. Bull. 2020, 158, 111419. [Google Scholar] [CrossRef] [PubMed]
- Divya, B.; Parvathi, A.; Loka Bharathi, P.A.; Nair, S. 16S rRNA-based bacterial diversity in the organic-rich sediments underlying oxygen-deficient waters of the eastern Arabian Sea. World J. Microbiol. Biotechnol. 2011, 27, 2821–2833. [Google Scholar] [CrossRef] [Green Version]
- Velmurugan, N.; Kalpana, D.; Cho, J.-Y.; Lee, G.-H.; Park, S.-H.; Lee, Y.-S. Phylogenetic analysis of culturable marine bacteria in sediments from South Korean Yellow Sea. Microbiology 2011, 80, 261–272. [Google Scholar] [CrossRef]
- Tran, V.; Geraci, K.; Midili, G.; Satterwhite, W.; Wright, R.; Bonilla, C.Y. Resilience to oxidative and nitrosative stress is mediated by the stressosome, RsbP and SigB in Bacillus subtilis. J. Basic Microbiol. 2019, 59, 834–845. [Google Scholar] [CrossRef] [Green Version]
- Aldhafiri, S.; Mahmoud, H.; Al-Sarawi, M.; Ismail, W.A. Natural Attenuation Potential of Polychlorinated Biphenyl-Polluted Marine Sediments. Pol. J. Microbiol. 2018, 67, 37–48. [Google Scholar] [CrossRef] [Green Version]
- Guldimann, C.; Boor, K.J.; Wiedmann, M.; Guariglia-Oropeza, V. Resilience in the Face of Uncertainty: Sigma Factor B Fine-Tunes Gene Expression To Support Homeostasis in Gram-Positive Bacteria. Appl. Environ. Microbiol. 2016, 82, 4456–4469. [Google Scholar] [CrossRef] [Green Version]
- Chollett, I.; Mumby, P.J.; Cortés, J. Upwelling areas do not guarantee refuge for coral reefs in a warming ocean. Mar. Ecol. Prog. Ser. 2010, 416, 47–56. [Google Scholar] [CrossRef] [Green Version]
- Kozak, E.R.; Franco-Gordo, C.; Suarez-Morales, E.; Palomares-Garcia, R. Seasonal and interannual variability of the calanoid copepod community structure in shelf waters of the Eastern Tropical Pacific. Mar. Ecol. Prog. Ser. 2014, 507, 95–110. [Google Scholar] [CrossRef]
- Hirota, Y.; Itoh, H.; MoriMoto, H.; Ichikawa., T.; Horikawa., H. Comparison of copepod communities during upwelling and non-upwelling in the summers from 1992 to 2010 in Tosa Bay, western Japan. Plankton Benthos Res. 2017, 12, 201–211. [Google Scholar] [CrossRef] [Green Version]
- Shivaji, S.; Prakash, J.S. How do bacteria sense and respond to low temperature? Arch. Microbiol. 2010, 192, 85–95. [Google Scholar] [CrossRef] [PubMed]
- Liu, C.; Sun, D.; Zhu, J.; Liu, W. Two-Component Signal Transduction Systems: A Major Strategy for Connecting Input Stimuli to Biofilm Formation. Front. Microbiol. 2018, 9, 3279. [Google Scholar] [CrossRef] [PubMed]
- Los, D.A.; Suzuki, I.; Zinchenko, V.V.; Murata, N. Stress Responses in Synechocystis: Regulated Genes and Regulatory Systems. In the Cyanobacteria: Molecular Biology, Genomics and Evolution; Caister Academic Press: Norfolk, UK, 2008. [Google Scholar]
- Aguilar, P.S.; Hernandez-Arriaga, A.M.; Cybulski, L.E.; Erazo, A.C.; de Mendoza, D. Molecular basis of thermosensing: A two-component signal transduction thermometer in Bacillus subtilis. EMBO J. 2001, 20, 1681–1691. [Google Scholar] [CrossRef] [PubMed] [Green Version]
- Mironov, K.S.; Sidorov, R.A.; Trofimova, M.S.; Bedbenov, V.S.; Tsydendambaev, V.D.; Allakhverdiev, S.I.; Los, D.A. Light-dependent cold-induced fatty acid unsaturation, changes in membrane fluidity, and alterations in gene expression in Synechocystis. Biochim. Et Biophys. Acta-Bioenerg. 2012, 1817, 1352–1359. [Google Scholar] [CrossRef] [PubMed] [Green Version]
- Suzuki, I.; Kanesaki, Y.; Mikam, K.; Kanehisa, M.; Murata, N. Cold-regulated genes under control of the cold sensor Hik33 in Synechocystis. Mol. Microbiol. 2001, 40, 235–244. [Google Scholar] [CrossRef] [Green Version]
- Liu, Z.X.; Li, H.C.; Wei, Y.P.; Chu, W.Y.; Chong, Y.L.; Long, X.H.; Liu, Z.P.; Qin, S.; Shao, H.B. Signal transduction pathways in Synechocystis sp. PCC 6803 and biotechnological implications under abiotic stress. Crit. Rev. Biotechnol. 2015, 35, 269–280. [Google Scholar] [CrossRef]
- Shapiro, R.S.; Cowen, L.E. Thermal control of microbial development and virulence: Molecular mechanisms of microbial temperature sensing. mBio 2012, 3, e00238-12. [Google Scholar] [CrossRef] [Green Version]
- Skerker, J.M.; Prasol, M.S.; Perchuk, B.S.; Biondi, E.G.; Laub, M.T. Two-component signal transduction pathways regulating growth and cell cycle progression in a bacterium: A system-level analysis. PLoS Biol. 2005, 3, e334. [Google Scholar] [CrossRef] [Green Version]
- Harshey, R.M.; Kawagishi, I.; Maddock, J.; Kenney, L.J. Function, Diversity, and Evolution of Signal Transduction in Prokaryotes. Dev. Cell 2003, 4, 459–465. [Google Scholar] [CrossRef] [Green Version]
- Dudler, R.; Eberl, L. Interactions between bacteria and eukaryotes via small molecules. Curr. Opin. Biotechnol. 2006, 17, 268–273. [Google Scholar] [CrossRef]
- Wu, L.C.; Estrada, O.; Zaborina, O.; Bains, M.; Shen, L.; Kohler, J.E.; Patel, N.; Musch, M.W.; Chang, E.B.; Fu, Y.X.; et al. Recognition of host immune activation by Pseudomonas aeruginosa. Science 2005, 309, 774–777. [Google Scholar] [CrossRef] [PubMed] [Green Version]
- Kamennaya, N.A.; Zemla, M.; Mahoney, L.; Chen, L.; Holman, E.; Holman, H.Y.; Auer, M.; Ajo-Franklin, C.M.; Jansson, C. High pCO2-induced exopolysaccharide-rich ballasted aggregates of planktonic cyanobacteria could explain Paleoproterozoic carbon burial. Nat. Commun. 2018, 9, 2116. [Google Scholar] [CrossRef] [PubMed] [Green Version]
- Deng, W.; Monks, L.; Neuer, S. Effects of clay minerals on the aggregation and subsequent settling of marine Synechococcus. Limnol. Oceanogr. 2015, 60, 805–816. [Google Scholar] [CrossRef]
- Richardson, T.L. Mechanisms and Pathways of Small-Phytoplankton Export from the Surface Ocean. Annu. Rev. Mar. Sci. 2019, 11, 57–74. [Google Scholar] [CrossRef]
- Hamamoto, Y.; Honda, D. Nutritional intake of Aplanochytrium (Labyrinthulea, Stramenopiles) from living diatoms revealed by culture experiments suggesting the new prey-predator interactions in the grazing food web of the marine ecosystem. PLoS ONE 2019, 14, e0208941. [Google Scholar] [CrossRef]
- Bai, M.; Xie, N.; He, Y.; Li, J.; Collier, J.L.; Hunt, D.E.; Johnson, Z.I.; Jiao, N.; Wang, G. Vertical community patterns of Labyrinthulomycetes protists reveal their potential importance in the oceanic biological pump. Environ. Microbiol. 2021, 24, 1703–1713. [Google Scholar] [CrossRef]
- Lundgreen, R.B.C.; Jaspers, C.; Traving, S.J.; Ayala, D.J.; Lombard, F.; Grossart, H.P.; Nielsen, T.G.; Munk, P.; Riemann, L. Eukaryotic and cyanobacterial communities associated with marine snow particles in the oligotrophic Sargasso Sea. Sci. Rep. 2019, 9, 8891. [Google Scholar] [CrossRef] [Green Version]
- Thiele, S.; Fuchs, B.M.; Amann, R.; Iversen, M.H. Colonization in the photic zone and subsequent changes during sinking determine bacterial community composition in marine snow. Appl. Environ. Microbiol. 2015, 81, 1463–1471. [Google Scholar] [CrossRef] [Green Version]
- Sano, M.; Maki, K.; Nishibe, Y.; Nagata, T.; Nishida, S. Feeding habits of mesopelagic copepods in Sagami Bay: Insights from integrative analysis. Prog. Oceanogr. 2013, 110, 11–26. [Google Scholar] [CrossRef]
- Vojvoda, J.; Lamy, D.; Sintes, E.; Garcia, J.A.L.; Turk, V.; Herndl, G.J. Seasonal variation in marine-snow-associated and ambient-water prokaryotic communities in the northern Adriatic Sea. Aquat. Microb. Ecol. 2014, 73, 211–224. [Google Scholar] [CrossRef] [Green Version]
Figure 1.
(a) Map of the sampling stations in the South China Sea. The shipping route is shown in black dotted arrows. Stations 1, 2, and 3 were in the upwelling area, whereas stations 4, 5, and 6 were in the non-upwelling area. (b) PCoA plot based on unweighted UniFrac distance among the bacterial communities from different habitats. The non-upwelling deep water, non-upwelling surface water, upwelling deep water, and upwelling surface water are represented by non-deep, non-surf, up-deep, and up-surf, respectively. S and D indicate surface water and deep water, respectively. The number following S or D indicates the sampling station.

Figure 2.
Relative abundance of bacteria at the phylum level (a) and class level (b). S and D indicate surface water and deep water, respectively. The number following S or D indicates the sampling station.
Figure 2.
Relative abundance of bacteria at the phylum level (a) and class level (b). S and D indicate surface water and deep water, respectively. The number following S or D indicates the sampling station.

Figure 3.
Correlations between bacterial community composition (phylum level) and biogeochemical parameters. The width of grey lines indicates the r-value of the Mantel test; the color of lines indicates the p-value. Asterisks indicate p < 0.05 and the color bar is based on the scale of Spearman’s correlation coefficient.

Figure 4.
Functional predictions of bacterioplankton communities in different samples. (a) Heatmap showing the absolute abundance of the major gene families at KEGG level 2, and (b) extended error bar plot showing the significant dissimilarity of the metabolic pathways at KEGG level 3 between the up-surf area and all other samples. Surface water and deep water are represented by S and D, respectively. The number following S or D indicates the sampling station.

Figure 5.
Network analysis of associations between bacterioplankton and microbial eukaryotes in (a) surface water and (b) deep water. The different bacterioplankton genus and microbial eukaryote phyla are represented by circles and triangles with distinctive colors, respectively. The size of the nodes represented the relative abundances of each microbe. The blue and red lines between the nodes represent positive or negative correlations, respectively. The thickness of the line represents the strength of correlation.

Publisher’s Note: MDPI stays neutral with regard to jurisdictional claims in published maps and institutional affiliations. |
© 2022 by the authors. Licensee MDPI, Basel, Switzerland. This article is an open access article distributed under the terms and conditions of the Creative Commons Attribution (CC BY) license (https://creativecommons.org/licenses/by/4.0/).
Share and Cite
MDPI and ACS Style
Liu, X.; Xie, N.; Li, J.; Bai, M.; Sen, B.; Wang, G. Potential Contribution of Coastal Upwelling to Carbon Sink through Interaction between Cyanobacteria and Microbial Eukaryotes. Water 2022, 14, 3097. https://doi.org/10.3390/w14193097
AMA Style
Liu X, Xie N, Li J, Bai M, Sen B, Wang G. Potential Contribution of Coastal Upwelling to Carbon Sink through Interaction between Cyanobacteria and Microbial Eukaryotes. Water. 2022; 14(19):3097. https://doi.org/10.3390/w14193097
Chicago/Turabian StyleLiu, Xiuping, Ningdong Xie, Jiaqian Li, Mohan Bai, Biswarup Sen, and Guangyi Wang. 2022. "Potential Contribution of Coastal Upwelling to Carbon Sink through Interaction between Cyanobacteria and Microbial Eukaryotes" Water 14, no. 19: 3097. https://doi.org/10.3390/w14193097
Note that from the first issue of 2016, this journal uses article numbers instead of page numbers. See further details here.