Article

Implications of Watershed Management Practices on Water Availability Using Hydrus-1D Model in the Aba Gerima Watershed, Upper Blue Nile Basin, Ethiopia

1
Center for Environment and Development Studies, College of Development Studies, Addis Ababa University, Addis Ababa P.O. Box 1176, Ethiopia
2
ARUA Water Center of Excellence, Rhodes University, P.O. Box 94, Grahamstown 6140, South Africa
3
Water and Land Resource Center (WLRC), Addis Ababa University, Addis Ababa P.O. Box 3880, Ethiopia
4
Debre Tabor University, Debre Tabor P.O. Box 272, Ethiopia
5
Institute for Water Research, Rhodes University, P.O. Box 94, Grahamstown 6140, South Africa
6
Department of Plant Biology and Biodiversity Management, College of Natural Sciences Addis Ababa University Addis Ababa, Addis Ababa P.O. Box 3880, Ethiopia
*
Author to whom correspondence should be addressed.
Water 2022, 14(19), 3095; https://doi.org/10.3390/w14193095
Submission received: 31 August 2022 / Revised: 21 September 2022 / Accepted: 22 September 2022 / Published: 1 October 2022
(This article belongs to the Section Water Resources Management, Policy and Governance)

Abstract

:
The main objective of this study was to examine the implications of watershed management (WSM) on hydrological parameters in the Aba Gerima watershed in the Upper Blue Nile Basin. The Hydrus 1D model simulations were conducted in control sites and sites under WSM to estimate various components of the hydrologic cycle, using different soil physical & hydrological data under each category of experimental sites. Results were calibrated with measured soil moisture data through inverse solutions. Thus, Hydrus 1D model was found to be effective in predicting results, with R2 values of 0.73 to 0.853 and RMSE values ranging from 0.015 to 0.04. The cumulative evaporation estimated for 365 days for control sites was 37.6% higher than that of sites under WSM. Surface and bottom fluxes in the sites under WSM were 4.6% and 12.5%, respectively, higher than the control sites. This could be attributed to the increased soil water availability resulting from the implemented WSM practices in Aba Gerima, and the results of this study can be used as empirical evidence of the positive implications of WSM on water availability. Finally, WSM should be strengthened by concerned bodies and development partners in all watersheds, especially where water availability is affected by severe land degradation.

1. Introduction

Watersheds are biophysical systems which define the land surface that drains water and waterborne sediments, nutrients, and chemical constituents to a point in a stream channel or a river defined by topographic boundaries [1,2]. A watershed is also the system used to study the hydrologic cycle and to reveal how human activities influence components of the hydrologic cycle [1]. Ethiopia has potentially huge water and land resources suitable for agriculture to achieve food security. The country has 12 river basins with an annual runoff volume of 122 billion m3 of surface water, and 2.6–6.5 billion m3 of groundwater potential [3]. However, the high spatial and temporal variability in Ethiopian water resources makes it difficult to make use of them for poverty reduction and to attain food security. The country continues to be food insecure and is unable to irrigate over 5% (1850 km2) of the potential irrigable area [3,4]. The Upper Blue Nile (UBN) basin is the most important river basin in Ethiopia, because it accounts for a major share of the country’s irrigation and hydropower potential. Although the Ethiopian highlands contribute more than 80% of the flow to the Nile River, only a tiny portion of the Nile water is used in Ethiopia for irrigation [4].
The problem of land degradation is typical of the Ethiopian highlands [5]. The combined effects of deforestation, overgrazing and agricultural expansion, unwise consumption of natural resources, fragile soils, undulating terrain, and heavy seasonal rains make the Ethiopian highlands vulnerable to soil erosion by multiplying surface runoff and reducing recharge and soil fertility [6].
Watershed management (WSM) practices are nonstructural and structural actions taken in a watershed to increase productivity of the watershed [1]. WSM is one of the major factors which influences the water resource availability of the area by reducing land degradation and biodiversity loss. Major land use and land cover (LULC) changes have been observed since the late twentieth century in various parts of Ethiopia [7,8]. In particular, studies focusing on the Ethiopian highlands have shown an increase in the expansion of agricultural land, to the detriment of natural forests. Some studies maintain that the deforestation trend has recently decreased, and vegetation cover has increased in some parts of Ethiopia due to plantation operations on degraded hillsides [9].
Our study area, the Aba Gerima watershed in the Upper Blue Nile/Abbay River Basin shows evidence of unwise and improper use of natural resources, especially water and land resources. Water demand in the area has increased to meet high population growth, the needs of underdeveloped irrigation systems on commercial farms, and increased demands, mainly for khat irrigation [10]. The survey revealed that water scarcity in the region is largely driven by the irrigation demands of khat, which exceed other consumption.
Land degradation also causes the reduction of water available to the plant through removing the productive top soil. Sheet erosion and gully formation are the main forms of land degradation in the Aba Gerima watershed. Based on this, it is necessary to improve the water resource potential of the watershed by conducting effective WSM practices. The Ethiopian Government and various development partners have invested a considerable amount over the past three decades in establishing and supporting sustainable land management practices as part of their efforts to improve the natural environment, ensure food security and reduce poverty (e.g., [5,7]). As part of WSM practices, physical structures, such as short trenches, soil and stone bunds, cut-off drains, check dams, hillside terraces, and area closures have been combined with biological measures, such as vegetation establishment, and applied to a watershed to prevent soil erosion and its consequences [11].
These WSM activities have also been applied to the Aba Gerima watershed in order to prevent soil erosion, land degradation, ground water depletion and to promote surface water resource improvement [10,11,12,13]. However, there is not enough empirical evidence exposed on the implications of most of the promoted WSM activities on water availability.
This study focused on providing empirical evidence on the effects of those implemented WSM practices on the availability of surface and groundwater in Aba Gerima. The study was carried out by comparing the water availability in control sites with corresponding sites under WSM. Hydrus 1D modeling of water balance components was applied to examine the availability of water in the watershed.

2. Materials and Methods
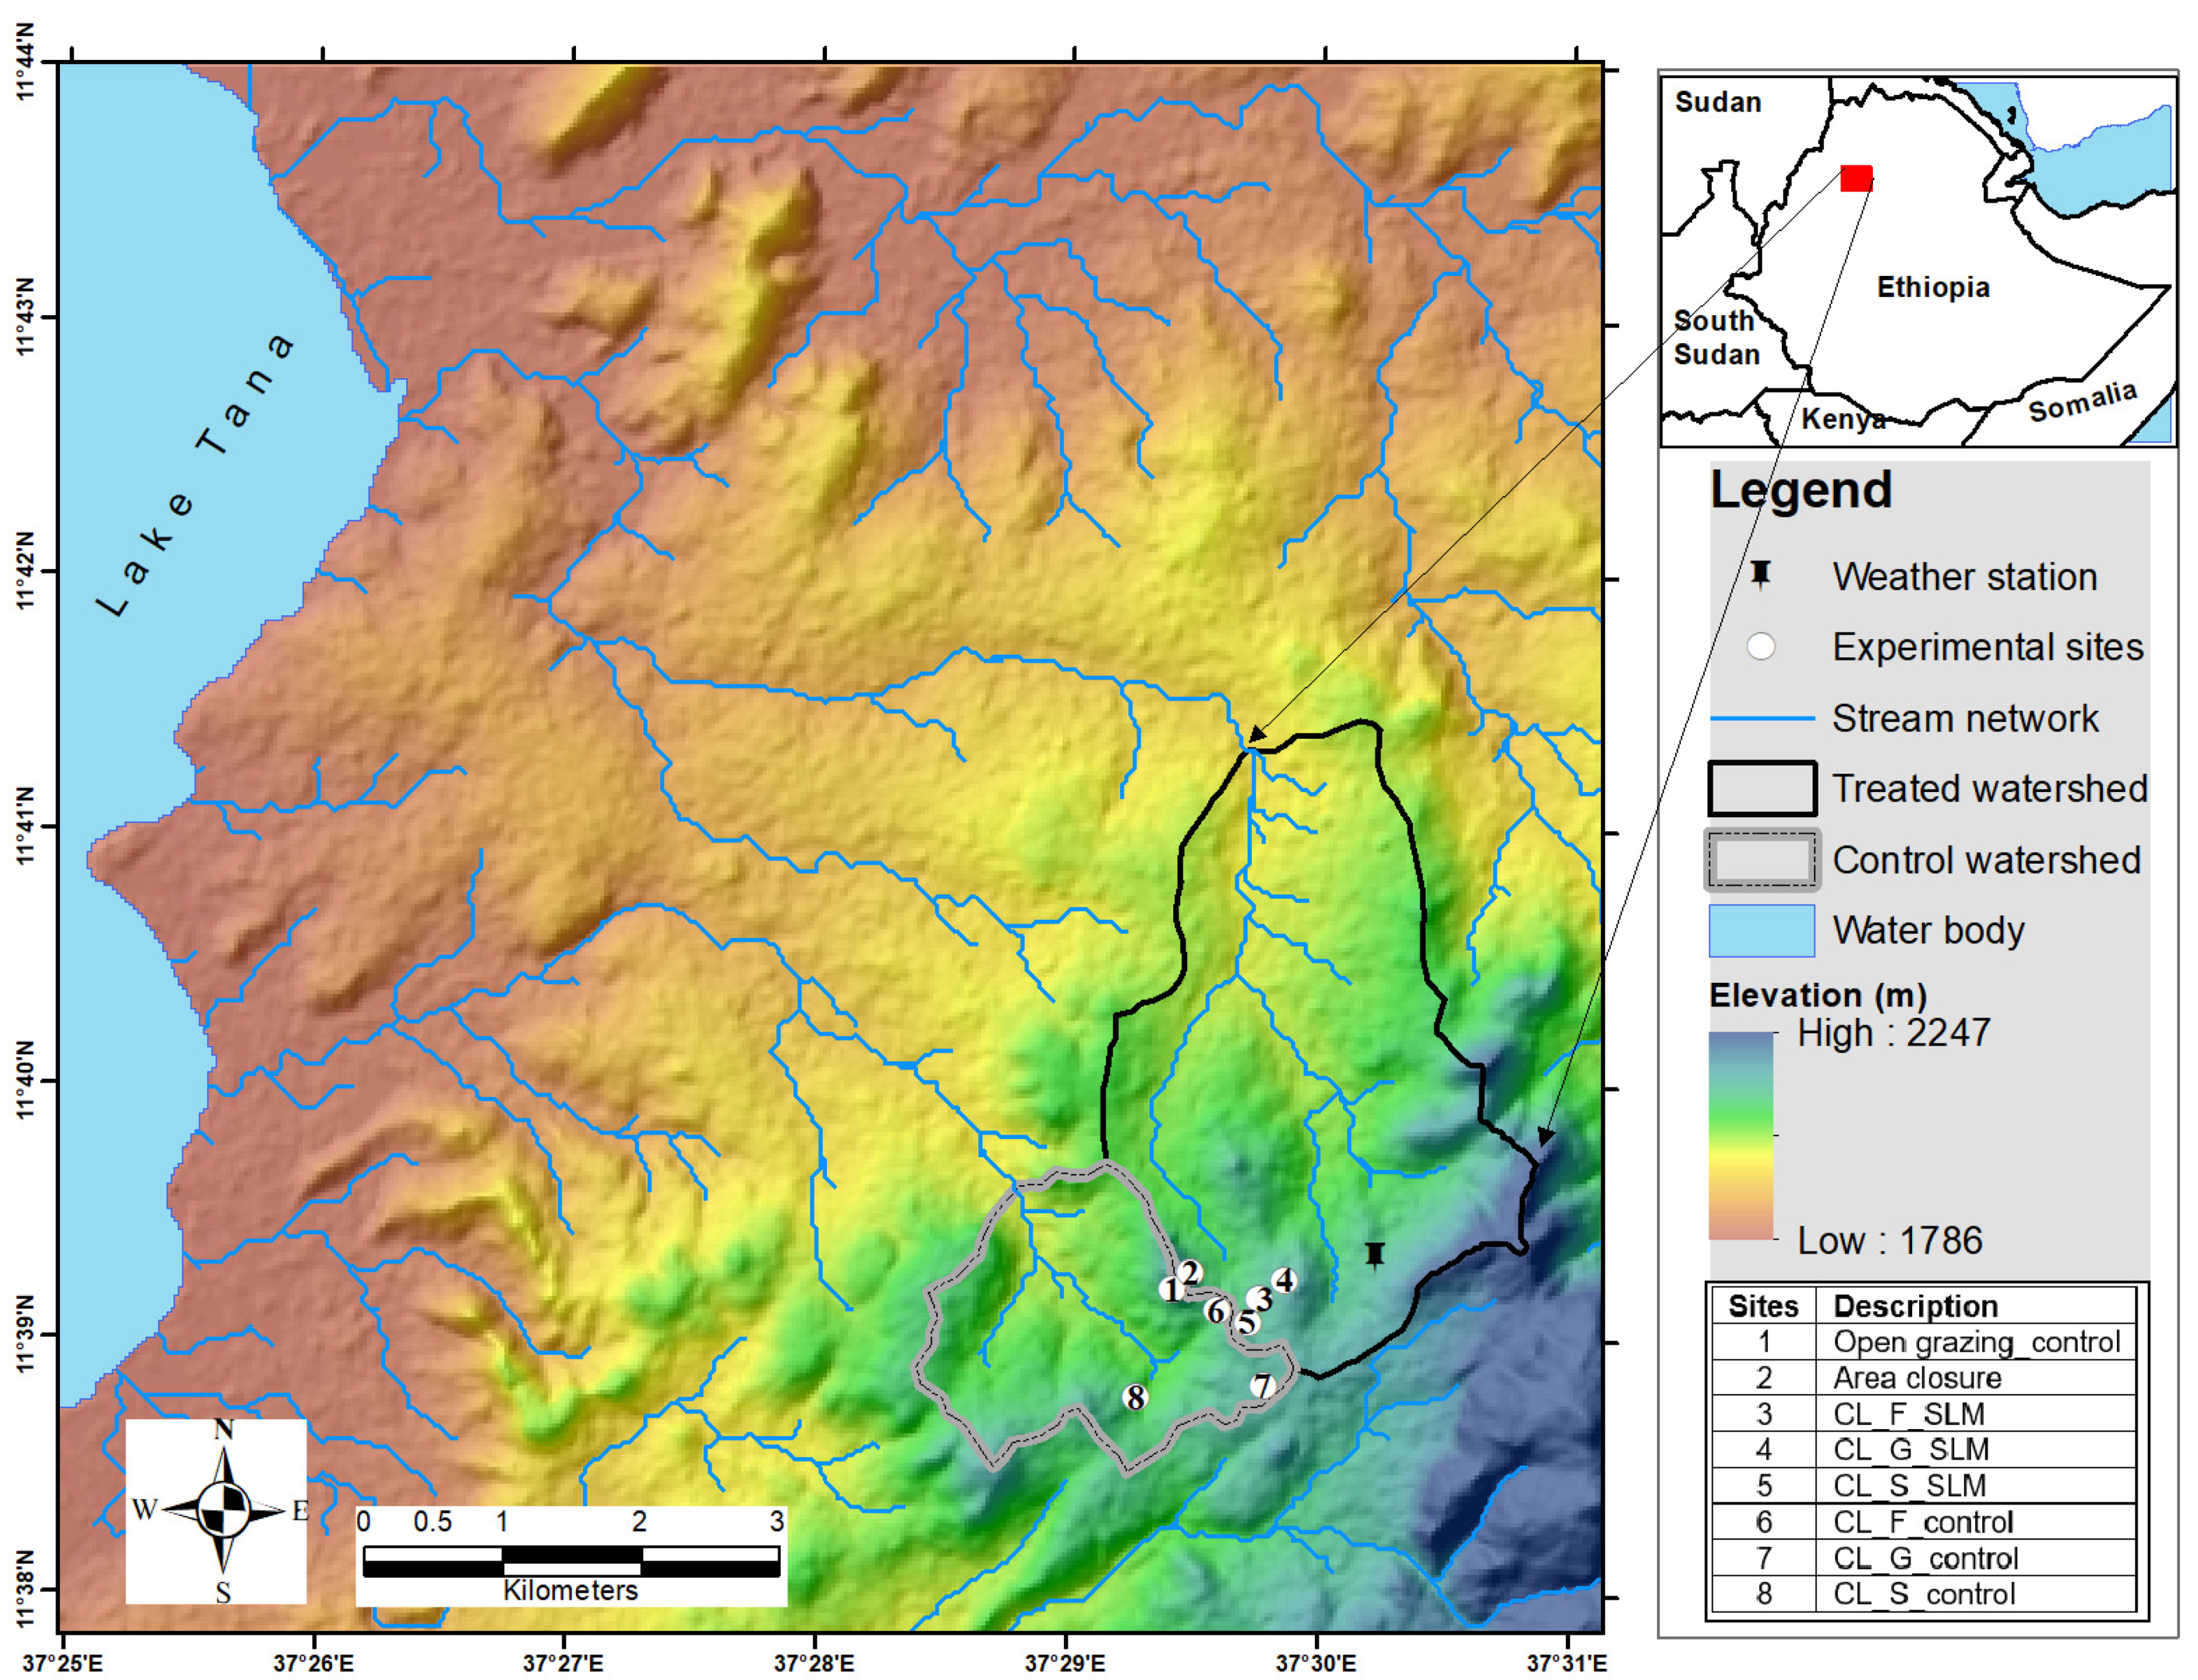
2.1. Study Area

Aba Gerima is a micro watershed located in the Amhara region, West Gojam zone, Bahir Dar Zuria Woreda. It is about 15 km north-east of the regional capital, Bahir Dar. The Aba Gerima watershed extends into three Kebelles, namely, Robit Debre Tsion in the north-west, Gonibat Abagerima to the north and north-west, and Laguna Abune Hana to the south and south-west, but most of the watershed is found in the Gonibat and Aba Gerima kebelles. The watershed covers around 900 ha of an area located in the Tana sub-basin near Lake Tana. Geomorphologically, the area has various relief patterns and structures which result in diverse land use systems and land cover types. According to the Water and Land Resource Center (WLRC; http://www.wlrc-eth.org, accessed on 1 January 2021), the average annual rainfall in the watershed is 1300 mm and the daily mean temperature is 20 °C. Four categories of soil type are dominant in Aba Gerima: orthic luvisols, eutric nitisols, dystric nitisols and dystric gleysols. Loam and clay-loam soils are the dominant soil texture of the watershed. As a part of the north-western Ethiopian plateau, the Aba Gerima watershed is geologically laid on a thick basaltic succession of tertiary and quaternary lava flows [12], making the elevation of the highland 2120 m above mean sea level (AMSL). The elevation difference between highest and lowest points in the watershed (1893 m and 2120 m) is about 227 m; as a result, most of the areas in the watershed have flat and almost flat geomorphological slopes.
Previous researchers [13,14] have described the major land use changes in the Aba Gerima watershed (treated) and neighbouring Zigba watershed (control) within the period from 2013 to 2019. According to Berihun et al. [14], forest land was the dominant LULC class accounting for 32.0% in the Aba Gerima watershed in 1982; currently, cultivated land is the major land use type. Gumma et al. [13] also described that 937 ha of terrace structures on cultivated land, 15 ha of check dams for gully treatment, 61.5 ha of hills rehabilitation and 1458 ha of other biological methods have been applied to rehabilitate the Aba Gerima area from 2012 to 2017.

2.2. Data Source

A range of data were collected for Hydrus 1D modeling and analysis of the study sites, together with some remote sensing data which were collected and analyzed to describe the study area (Table 1). Topographic data, such as elevation, slope gradient and geomorphic parameters were derived from a Digital Elevation Model (DEM) of 30 m spatial resolution, obtained from USGS Earth explorer (https://earthexplorer.usgs.gov/, accessed on 1 September 2021), and were analyzed for the extraction of a stream network [15]. Soil data of the most important soil parameters required for the model were found from in situ-measured and recorded data from WLRC, and a soil-type map obtained from the Ministry of Agriculture was applied in the study area description. Mean daily precipitation and the daily maximum and minimum air temperatures were collected from a weather station in the Aba Gerima watershed (Figure 1) to use as an input in the Hydrus 1D model for our study period. Land management with soil physical and hydrological data was collected from WLRC and applied in Hydrus 1D water flow and root water uptake modeling. This included quality-controlled in situ volumetric soil moisture measurements (m3 m−3) from the Aba Gerima watershed, collected from August 2017 to May 2019 at different soil layers (i.e., 100 mm, 200 mm, 300 mm, 400 mm) [16]. Additionally, a high-resolution land use map was also used to describe the land use character of the watershed.

2.3. Hydrus Model Set Up

The main focus of this study was Hydrus 1D modeling to simulate water balance components using water flow and root water uptake models. The output of the model, which estimated water balance components in the study sites, was to compare the water availability of the study sites under WSM with the control sites. The selected method would allow us to assess the water availability implications of WSM practices in Aba Gerima, since there wasn’t enough baseline data regarding hydrology & environmental conditions of the watershed to compare with post implementation conditions. The Hydrus 1D model simulations of water balance components were conducted in control sites and sites under WSM to estimate inflow and outflow components of the hydrologic cycle. The inflow components include infiltration, soil water content, recharge and dry-time surface runoff. The outflow is actual evaporation, transpiration (actual root water uptake) and wet-time surface runoff. Based on simulation results of those water balance components, the sites under WSM practices have been compared with control sites (as in Figure 1) to determine which group of sites has better water availability, as described in terms of infiltration, surface runoff (surface flux) in dry-time, soil water storage and recharge (bottom flux). However, actual evaporation and transpiration (root water uptake) indicate that the water leaves the system in the study period. Therefore, the sites that show a higher amount of actual evaporation and root water uptake have less available water, since both groups of sites are assumed to have the same climatic conditions.
Soil properties, such as textural class, soil organic carbon, bulk density, and soil moisture content were measured at eight sites at 100 mm depth intervals (i.e., 100, 200, 300, 400 mm). Based on this, the thickness of the soil profile under analysis was 400 mm. Most of the soil profile in the measured soil layers was dominated by clay, clay loam and loam soil textural classes in the study sites.
Hydrus 1D software was used for modeling water flow components and Microsoft Excel was applied to process the raw output data in an organized and meaningful way. Hydrus 1D is a program which solves the Richards equation numerically for water flow. The van Genuchten-Mualem equation [17] models the variation of K(h) with soil water content.
θ ( h ) = θ r + ( θ s θ r ) [ 1 + ( α h ) n ] m   ,   h   <   0  
θ ( h ) = θ s   ,   h   >   0  
K ( h ) = K s S e 1 [ 1 ( 1 S e 1 m ) m ] 2 ,   K ( h ) = K s   f o r   h   0
S e = ( θ + θ r ) ( θ s θ ) ,   f o r   m   = 1 1 n   ,   n   > 1
where, θr and θs are residual and saturated water content, respectively, Ks is saturated hydraulic conductivity, Se is effective saturation; empirical coefficients which are α, the inverse of the air-entry; distribution of pore-size index, n and parameter of a pore-connectivity.
The flow equation includes a sink term to account for water that plant roots take up. Besides this, the Rosetta V1.0 program was used in the estimation of hydraulic properties from the surrogate soil data, such as soil texture data and bulk density. The Rosetta V1.0 program is a Pedotransfer functions (PTFs) model which converts basic soil data into hydraulic properties [17].
One-directional water flow of uniform single-layered soil profiles, and 1D water flow of non-uniform multi-layered soil profiles were also analyzed using the Hydrus 1D model. The input data to calculate 1D water flow and root water uptake was collected and inserted to obtain simulation results. This methodology was selected since data for meteorological conditions, in situ soil information, crop growth, root depth, and ground water level were available for the study area (Table 1). The program for Hydrus 1D model is freely available at https://www.pcprogress.com/en/Default.aspx?Downloads (accessed on 1 January 2021).

3. Statistical Analysis

The level of agreement between measured and simulated soil moisture values can be described in terms of statistical parameters, such as ME (Mean Error), RMSE (Root mean square error), MAE (Mean weighted absolute error) & R-squared (R2).
Mean Error (ME) sums up the variances and divides the result by n. An error in this context is an uncertainty in a measurement, or the difference between the measured value and true/correct value.
Mean Error = Sum of all error values/Number of records
The RMSE of a simulated model with respect to the observed variable is defined as:
R M S E = i = n n ( X o b s ,   i X m o d ,   i ) 2 n
where, Xobs is observed values, Xmod is simulated values at time i.
Mean Absolute Error (MAE) is a measure of errors between paired observations, such as predicted versus observed, subsequent time versus initial time, and one technique of measurement versus an alternative technique of measurement. MAE for the measured & simulated values of soil moisture was calculated and displayed in the inverse solution information window as the sum of absolute errors divided by the number of observations.
M A E = i = 1 n | X M o d , i X o b s , i | n
R-squared (R2) is a statistical measure which explains the strength of the relationship between and simulated and modeled soil moisture values. R2 explains to what extent the variance of one variable explains the variance of the second variable. So, if the R2 of a model is greater than or equal to 0.50, more than half of the observed variation can be explained by the model’s inputs.

4. Results and Discussion

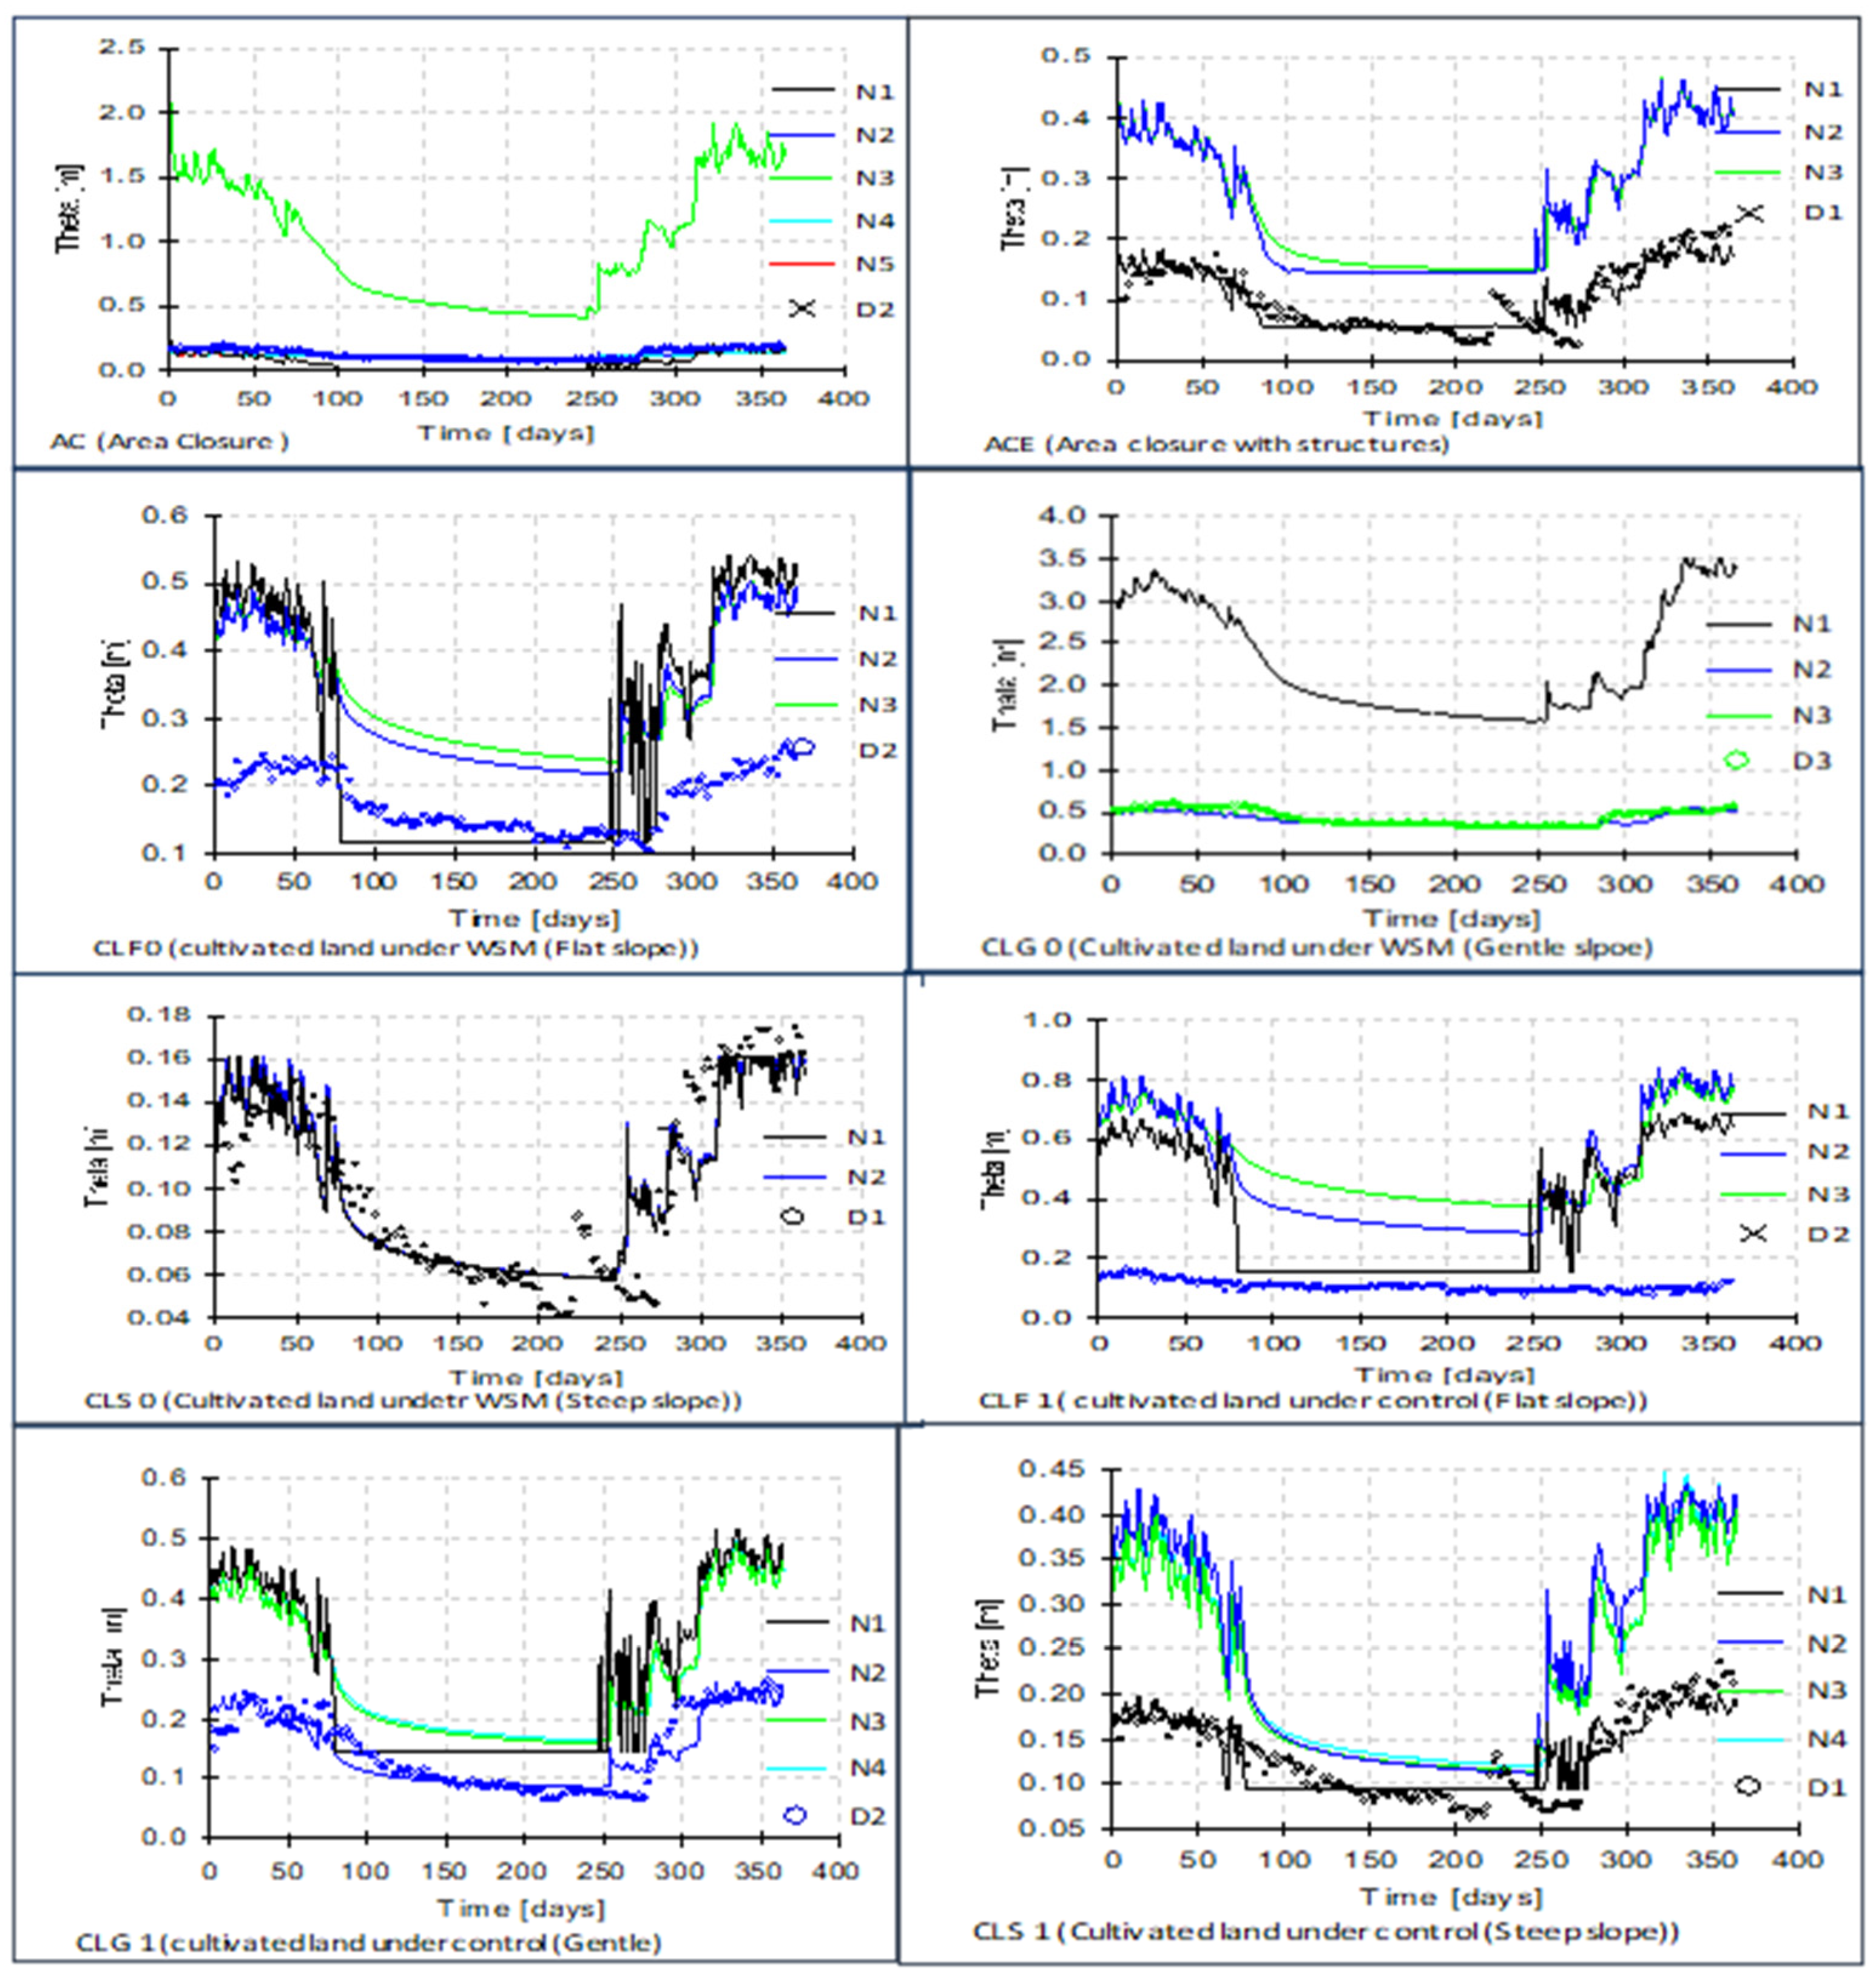
4.1. Hydrus 1D Simulation of Water Balance Components

The one-directional water flow model with root water uptake was simulated for water balance components in the 365-day study period from 23 August 2017 to 2022 August 2018, using the Hydrus 1D model for each of the eight selected sites under WSM and the control sites. Table 2 shows the difference in major water balance components, such as evaporation, soil water storage, and bottom flux. The results clearly indicate that, sites under WSM practices have high values of water availability parameters, such as bottom flux (flow to ground water zone) and soil water storage, with lower cumulative evaporation

4.2. Evaluation of Model Performance and Parameter Identification

The performance of the model was calculated using the collected volumetric soil moisture data within the 365-day time series. The soil moisture data collected at different depths (i.e., 100, 200, 300 and 400 mm) in all the eight experimental sites were used to calibrate the results of the Hydrus 1D SM results. The measurements of the in situ soil water content were used to evaluate the performance of the model.
The graphs in the Figure (Figure 2) below show the calibration of the simulation results of soil moisture content with some statistical measures (Table 3) in different layers for the eight experimental sites.
Site 1 (AC), Site 2, (ACE), Site 3 (CLF0), Site 4 (CLG0), Site 5 (CLS 0), Site 6 (CLF1), Site 7 (CLG 1) and Site 8 (CLS1).
The simulated SM (theta) in the above output graphs of Hydrus 1D, plotted for each single node or soil layer (N), was given as the no. of Ns represented by a unique color in the plots. Each observation node N represents the soil layers within each 400 mm soil profile per each experimental site. Based on this, the simulation result of soil water content for a model was calibrated by any single-layer time series reading of measured soil water content (D), including the average soil water content which best fits the simulation result.
Table 3 presents some explanations for commonly used statistical parameters applied to test the model performance in the Hydrus model.
This study examined the implications of WSM practices on water availability in the Aba Gerima watershed, and was conducted by analyzing physical and hydrological soil properties, evaluating different hydrological parameters using the Hydrus 1D model in different land management practices, and by examining the implication of WSM practices on the comparative hydraulic properties of the study sites for a period of 365 days.
In addition to studying the data of in situ measured soil physical and hydraulic properties, the study estimated the water balance component of each study site using the Hydrus 1D model to compare simulation results of water balance components and to quantify water availability in each of the eight study sites.
According to field observation and the baseline survey report [10], a significant amount of work had been done in implementing sustainable land management practices in the Aba Gerima watershed from 2012 to date [10,13]. Even though some of the structures are currently damaged, it is still clearly evident that the area was once comprehensively conserved in terms of environmental protection and land management. However, for many reasons, the WSM practices implemented in the past were not sustainable, and had many gaps in terms of maintaining best practices due to the absence of baseline data and impact data. This makes it difficult to conduct further research on these implications in the watershed, and to fill the gaps of WSM works to better implement more productive projects. This study aimed to fill some of these gaps by examining the impact of WSM practices on water availability in the Aba Gerima using limited data, field observations, and previous study findings from the study area.

4.3. The Impact of Land Management on Soil Physical Properties

The impact of land management on soil water availability can be attributed to the change in soil physical properties as a result of land management activities. According to Teferi et al. [18], based on a study conducted in one of the Ethiopian highlands, revealed that the impact of LULC and LM on soil quality affecting organic matter con-tent and bulk density. Tesfahunegn [19] also investigated the sustainability of land use or management by through assessing soil organic carbon, silt content, and bulk density. From field observations in Aba Gerima, there is improvement in surface landscape after the implementation of WSM practices. Consequently, these improvements manifest themselves in soil physical properties such as Bulk density and organic matter content. WSM practices such as area closures with soil and water conservation structures pre-vent erosion and transportation of soil while improve soil profile thickness of the area. The conserved fertile soil has lower bulk density which allows water to infiltrate through it than the eroded surface or the bed rock.

4.4. The Impact of Soil Physical Properties on Soil Hydrological Properties

In this study, soil physical parameters, such as textural composition (sand, silt, clay percentage) and the bulk density of soil were used as inputs to predict soil hydraulic parameters in Rossetta v.1.1 (June 2003). Soil hydraulic parameters, residual water content (cm3/cm3), saturated water content (cm3/cm3), Alpha coefficient (1/cm), n parameter (-), and saturated hydraulic conductivity (cm/day) were predicted. In situ measured saturated hydraulic conductivity, Ksat, was applied to compare the results with the simulated result, and clearly demonstrated that soil bulk density (g/cm3) has an important role in determining the Ksat of the soil layer. The residual and saturated moisture content of a soil layer were also highly dependent upon the physical properties of soil layers, such as the ratio of sand, silt, clay, and especially soil layer bulk density. Similarly, land management profoundly affects land use and slope of the area; both LULC and altitude also have significant implications for soil layer bulk density. According to Neill et al. [20], a significant increase in bulk density was observed after the conversion of forest to grassland. The study by Wang et al. [21], on the spatial variability of SWRC (VG model) on the Loess Plateau, also evidenced a basic relationship between soil bulk density and VG parameters, and showed that BD significantly influences the VG parameter variation (except for α). Biswas and Si [22] revealed a great influence of bulk density on soil hydrologic properties, and investigated the significant correlation of bulk density with the VG parameters (except for α) and Ks. Table 4 illustrates the main soil physical properties applied in determining VG parameters under treated versus control sites. In our study, the results of the Aba Gerima watershed, as well as the average bulk density of those sites under WSM practices decreased, more towards the bottom sampling layers than the surface layers. However, the reverse was true in the layers of the control sites which are untreated in terms of WSM. The reason could be attributed to length of time of implementation of WSM (i.e about five years) is not sufficient to change these parameters. The impact of this relationship is clear in the Hydrus 1D model simulation results of infiltration, soil water storage, actual surface and bottom fluxes of those sites under WSM practices. Based on this, the graphs of bottom flux and cumulative infiltration of sites under WSM practices increase, while soil bulk density and respective hydraulic conductivity decrease towards the bottom layer.

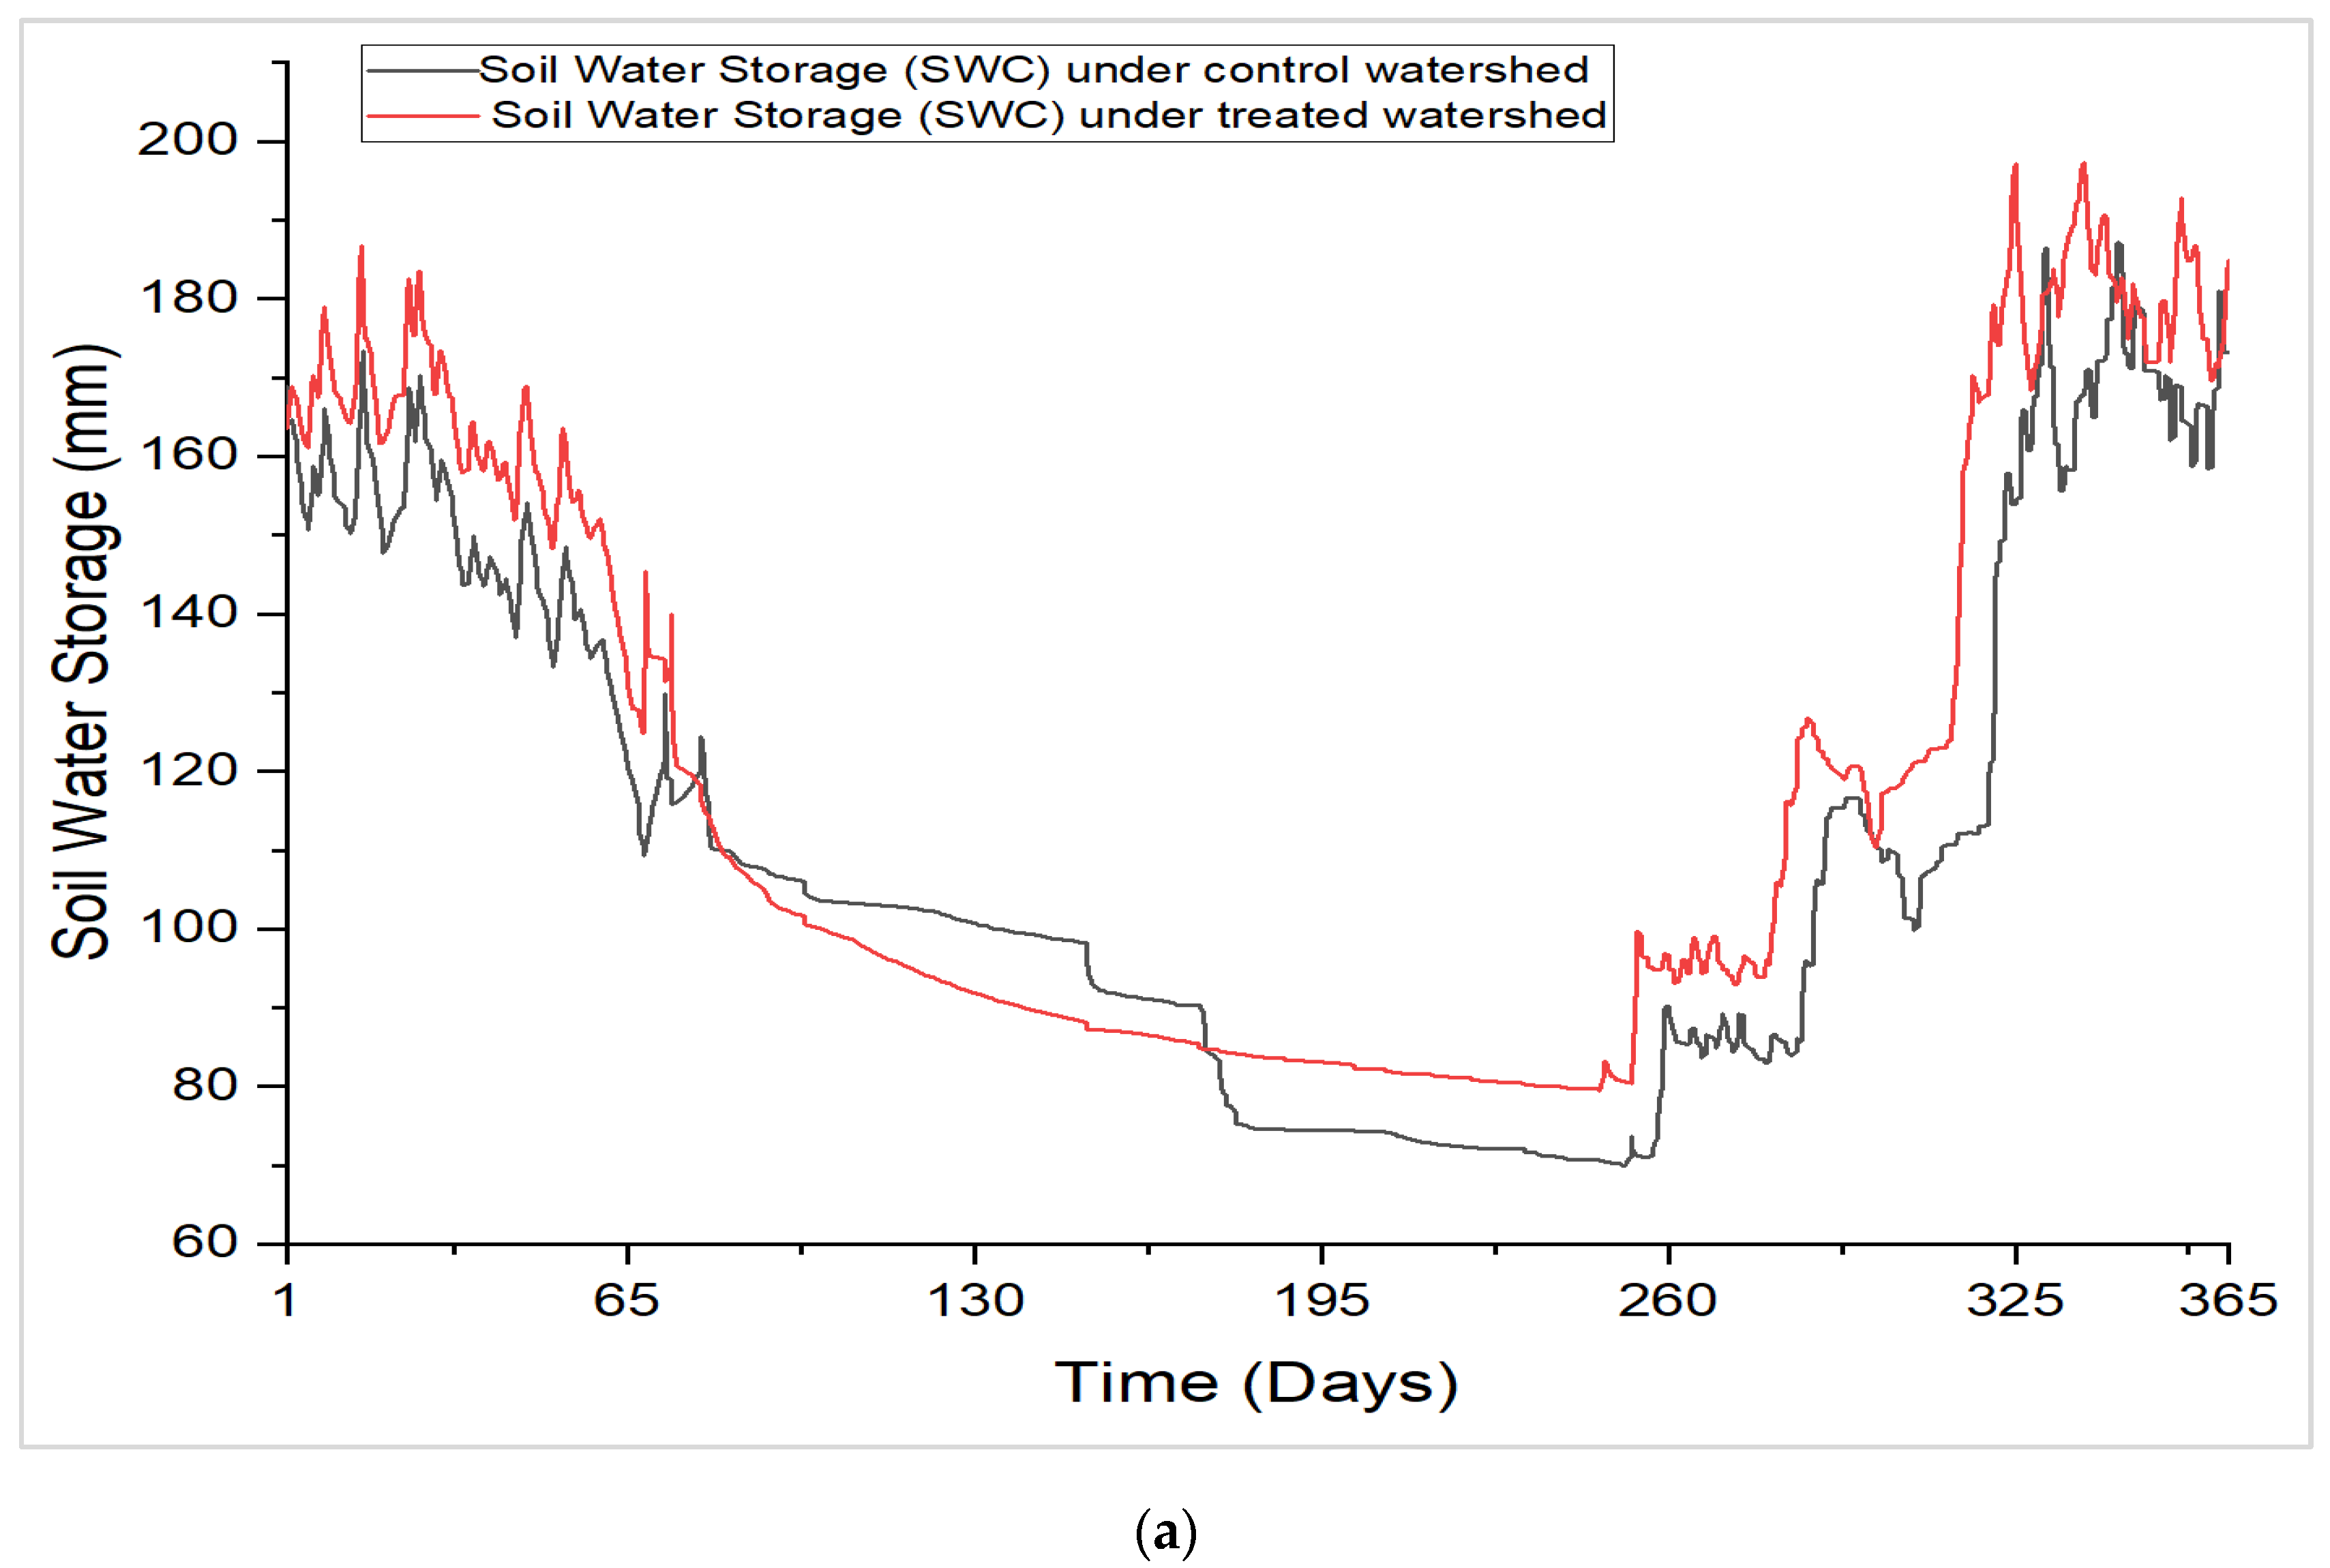
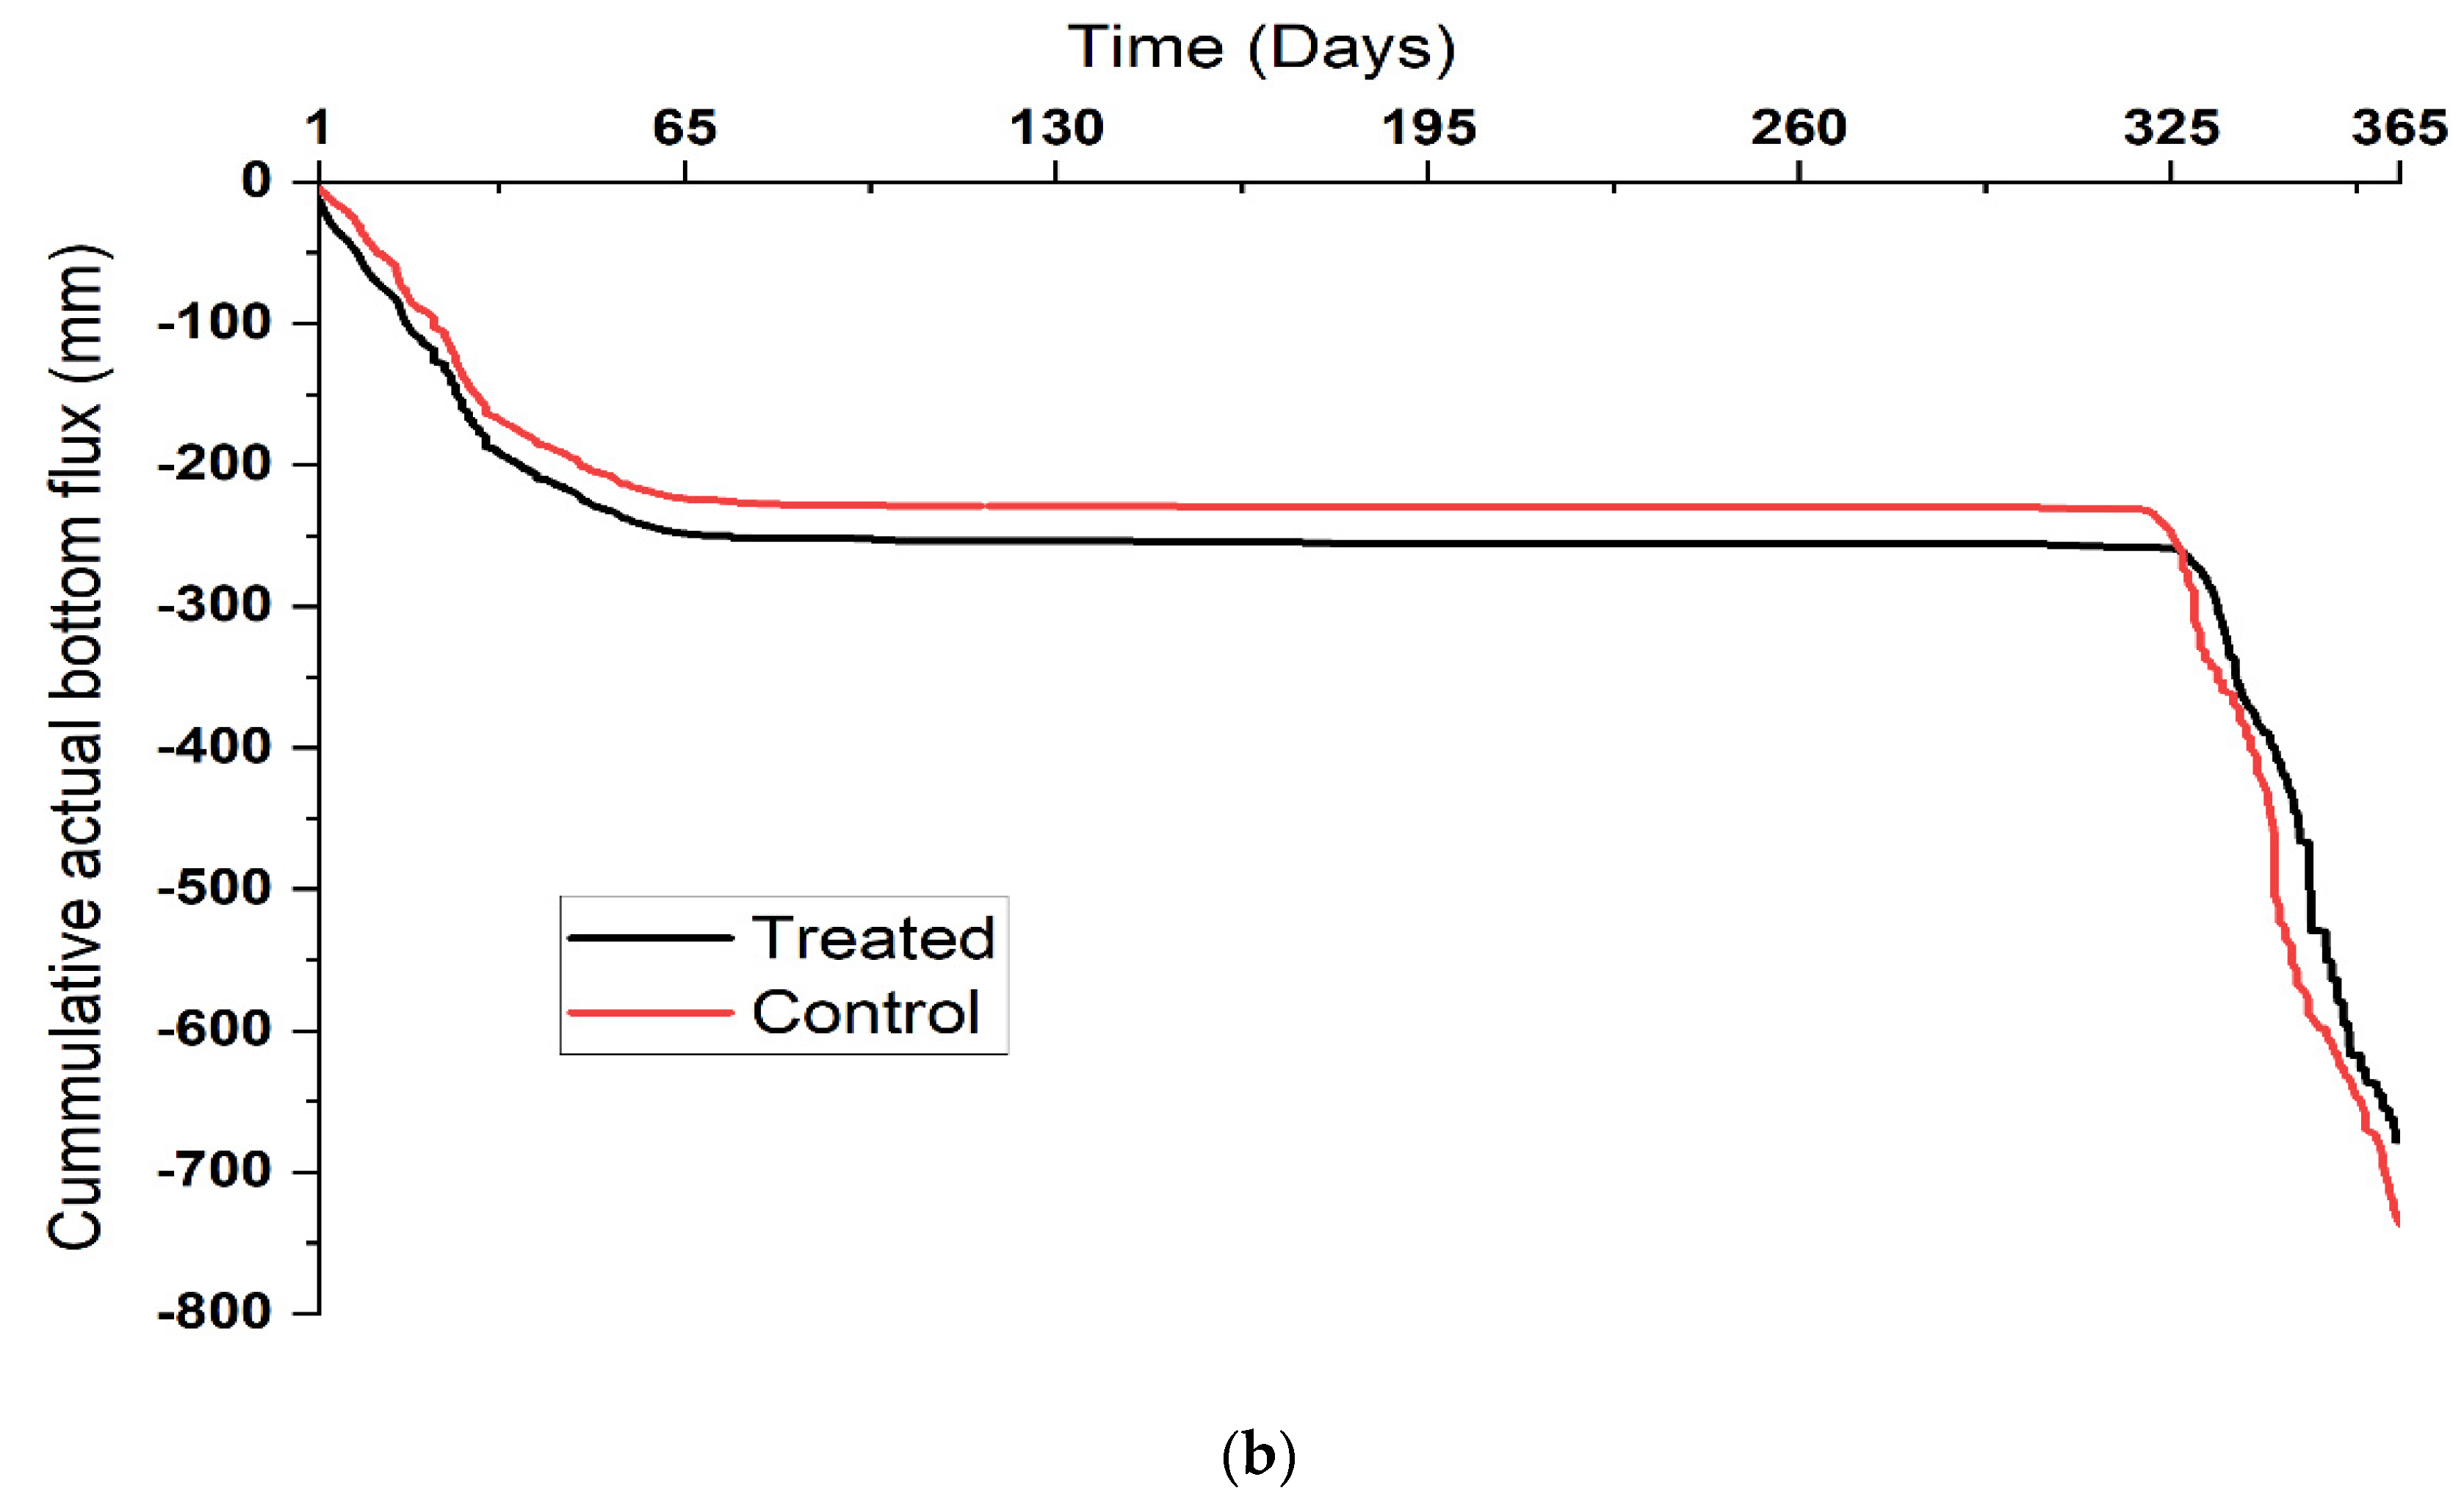
4.5. The Impact of Land Management on Water Availability

Water availability of a watershed is manifested by increased soil water storage and reduced evaporation. Studies indicate that WSM practices make a significant contribution to soil hydraulic properties of the watershed [18,23]. The Hydrus 1D model simulation results of water balance components revealed that sites under WSM practices provided better water availability than untreated control sites. Water availability was described in terms of water balance components, such as infiltration, soil water storage, surface flux, bottom flux, evaporation and transpiration. In other words, water balance components that feed the system positively were higher in sites under WSM, and components such as evaporation and surface runoff were lower. Site ACE has better soil water storage, with 106.039 mm annual cumulative soil water storage than the control with 100.37 mm. When we compare AC and ACE in terms of evaporated water from the surface of the land, 46.967 mm and 32.898 mm annual cumulative value, respectively, closed area with WSM is better in preventing evaporation and contributes positively to the water availability of the watershed.
The results for the remaining sites are within the acceptable range of results from different studies previously carried out on water balance components in the area [23,24,25]. Daily mean bottom flux of the remaining treated sites under WSM practices was estimated to be 3.33 mm/day, 3.28 mm/day, 3.5 mm/day for CLF0, CLG0 and CLS0, respectively. The comparison of results in the mean daily bottom flux of untreated sites, 3.2 mm/day for CLF 1, 3.2 mm/day, 3.33 mm/day for CLG1 and CLS1, respectively, with the respective sites under WSM practices clearly indicating that WSM sites had a better recharge capacity than the untreated control sites. There was also a significant difference between those groups of sites in terms of soil water storage. The average SWS in those sites under WSM was better than in the untreated control sites.
Annual soil water storage of sites under WSM practices was 100.37 mm, 106.04 mm, 153.76 mm, 120.58 mm, 113.5 mm for AC, ACE, CLF0, CLG0, CLS0, respectively, and 142.3 mm for CLF1, 132.4 mm for CLG1, 103.7 mm for CLS1, which are untreated control sites (i.e., compare results of AC vs. ACE, CLF0 vs. CLF1, CLG0 vs. CLG1, CLS0 vs. CLS1).
In addition, sites under WSM, such as CLG0, have high soil water storage than the respective control cultivated land on gentle slope, CLG1 (Figure 3). It is worth noting that the increased soil water storage on cultivated land resulted from watershed management activities can increase soil water availability to crops which in turn contributes to the food security situation of farmers practicing WSM.

5. Conclusions and Recommendations

The study results showed that the water availability of sites under WSM practices was better than that in the control sites. The impact of WSM practices on changing soil physical properties in the study sites was specifically addressed by examining the implication of soil physical properties on soil hydrology. The study showed how land use and land management practices modify soil physical properties, such as soil organic carbon content and bulk density, and this in turn affects soil hydrology. Generally, WSM practices in Aba Gerima were found to be successful in increasing the soil water availability of the watershed through maximizing recharge, surface flux and soil water storage, and minimizing evaporation, transpiration and surface runoff in the study sites, especially during the dry season of the study period. For this reason, it is strongly recommended that WSM practices should be strengthened, since they have positive implications for increasing dry season soil moisture availability. Thus, WSM interventions might have a positive effect on agricultural production in the Aba Gerima watershed. However, it is not clear whether the incepted surface runoff by WSM interventions can be transferred into baseflow and increase the streamflow in the dry season. This is the direction of future research.

Author Contributions

Conceptualization, T.F. and E.T.; Data curation, T.F., E.T. and B.D.; Formal analysis, T.F.; Funding acquisition, B.G., S.K.M., J.T., C.G.P. and Z.W.; Investigation, T.F. and B.D.; Methodology, T.F. and E.T.; Project administration, B.G., S.K.M., J.T., C.G.P. and Z.W.; Resources, T.F. and E.T.; Software, T.F. and E.T.; Supervision, E.T.; Validation, E.T.; Visualization, T.F.; Writing—original draft, T.F.; Writing—review & editing, T.F., E.T., B.G., S.K.M., J.T., C.G.P., Z.W., G.Z. and T.A. All authors have read and agreed to the published version of the manuscript.

Funding

RESEBEN PROJECT supported by the UKRI United Kingdom Research and Innovation (UKRI) for the African Research Universities Alliance (ARUA) Water Centre of Excellence (CoE) Grant number [ES/T015330/1].

Institutional Review Board Statement

Not applicable.

Informed Consent Statement

Not applicable.

Data Availability Statement

Not applicable.

Acknowledgments

We are very grateful for the financial support for this research work. We also thank REACH Water and Land Resource Center for providing soil hydrology data and meteorological data. We also acknowledge the Water and Land Resource Center of Addis Ababa University in the Water Security and Sustainable Development Hub project funded by the UK Research and Innovation (UKRI) Global Challenges Research Fund (GCRF), in the provision of biophysical data, research advice and guidance about the research work. Last but not least, we would like to thank the farmers, development agents and experts from the Amhara Bureau of Agriculture who supported this project during the fieldwork.

Conflicts of Interest

The authors declare no conflict of interest.

References

  1. Brooks, K.N.; Ffolliott, P.F.; Magner, J.A. Hydrology and the Management of Watersheds, 4th ed.; John Wiley & Sons: New York, NY, USA, 2012; p. 552. [Google Scholar]
  2. Wang, J.; Shrestha, N.K.; Delavar, M.A.; Meshesha, T.W.; Bhanja, S.N. Modelling Watershed and River Basin Processes in Cold Climate Regions: A Review. Water 2021, 13, 518. [Google Scholar] [CrossRef]
  3. Awulachew, S.B.; Yilma, A.D.; Loulseged, M.; Loiskandl, W.; Ayana, M.; Alamirew, T. Water Resources and Irrigation Development in Ethiopia; IWMI: Colombo, Sri Lanka, 2007; Volume 123. [Google Scholar]
  4. Worqlul, A.W.; Rientjes, T.H.M.; Gieske, A.S.M.; Getachew, H.A. Ungauged catchment contributions to Lake Tana’s water balance. Hydrol. Processes Int. J. 2009, 23, 3682–3693. [Google Scholar]
  5. Herweg, K.; Ludi, E. The performance of selected soil and water conservation measures—Case studies from Ethiopia and Eritrea. CATENA 1999, 36, 99–114. [Google Scholar] [CrossRef]
  6. Schmidt, E.; Zemadim, B. Expanding sustainable land management in Ethiopia: Scenarios for improved agricultural water management in the Blue Nile. Agric. Water Manag. 2015, 158, 166–178. [Google Scholar] [CrossRef]
  7. Haregeweyn, N.; Tesfaye, S.; Tsunekawa, A.; Tsubo, M.; Meshesha, D.T.; Adgo, E.; Elias, A. Dynamics of land use and land cover and its effects on hydrologic responses:case study of the Gilgel Tekeze catchment in the highlands of Northern Ethiopia. Environ. Monit. Assess. 2015, 187, 4090. [Google Scholar] [CrossRef]
  8. Maitima, J.M.; Mugatha, S.M.; Reid, R.S.; Gachimbi, L.N.; Majule, A.; Lyaruu, H.; Pomery, D.; Mathai, S.; Mugisha, S. The linkages between land-use change, land degradation and biodiversity across East Africa. Afr. J. Environ. Sci. Technol. 2009, 3, 310–325. [Google Scholar]
  9. Bantider, A.; Hurni, H.; Zeleke, G. Responses of rural households to the impacts of population and land-use changes along the Eastern Escarpment of Wello, Ethiopia. Nor. Geogr. Tidsskr. Nor. J. Geogr. 2011, 65, 42–53. [Google Scholar] [CrossRef]
  10. Water and Land Resource Center, WLRC. Baseline survey report Aba Gerima watershed, Part II-Biophysical settings of Aba Gerima watershed. Water 2012, 75, 10–15. [Google Scholar]
  11. Amare, T.; Zegeye, A.D.; Yitaferu, B.; Steenhuis, T.S.; Hurni, H.; Zeleke, G. Combined effect of soil bund with biological soil and water conservation measures in the northwestern Ethiopian highlands. Ecohydrol. Hydrobiol. 2014, 14, 192–199. [Google Scholar] [CrossRef]
  12. Kazmin, V. Stratigraphy and correlation of Cenozoic volcanic rocks in Ethiopia. Rep. Ethiop. Inst. Geol. Surv. 1979, 106, 1–26. [Google Scholar]
  13. Gumma, M.K.; Desta, G.; Amede, T.; Panjala, P.; Smith, A.P.; Kassawmar, T.; Tummala, K.; Zeleke, G.; Whitbread, A.M. Assessing the impacts of watershed interventions using ground data and remote sensing: A case study in Ethiopia. Int. J. Environ. Sci. Technol. 2022, 19, 1653–1670. [Google Scholar] [CrossRef]
  14. Berihun, M.L.; Tsunekawa, A.; Haregeweyn, N.; Meshesha, D.T.; Adgo, E.; Tsubo, M.; Masunaga, T.; Fenta, A.A.; Sultan, D.; Yibeltal, M. Exploring land-use/land cover changes, drivers and their implications in contrasting agro-ecological environments of Ethiopia. Land Use Policy 2019, 87, 104052. [Google Scholar] [CrossRef]
  15. Sarker, S.; Veremyev, A.; Boginski, V.; Singh, A. Critical nodes in river networks. Sci. Rep. 2019, 9, 11178. [Google Scholar] [CrossRef] [PubMed] [Green Version]
  16. Mersha, B.D.; Zeleke, G.; Alamirew, T.; Dejen, Z.A.; Gebrehiwot, S.G. Soil moisture spatio-temporal variability under treated and untreated catchment conditions in a fragile tropical highland environment: Implication for water security. Arab. J. Geosci. 2022, 15, 696. [Google Scholar] [CrossRef]
  17. Van Genuchten, M.T. A closed-form equation for predicting the hydraulic conductivity of unsaturated soils. Soil Sci. Soc. Am. J. 1980, 44, 892–898. [Google Scholar] [CrossRef] [Green Version]
  18. Teferi, E.; Bewket, W.; Simane, B. Effects of land use and land cover on selected soil quality indicators in the headwater area of the Blue Nile basin of Ethiopia. Environ. Monit. Assess. 2016, 188, 83. [Google Scholar] [CrossRef] [PubMed]
  19. Tesfahunegn, G.B.; Vlek, P.L.G.; Tamene, L. Application of SWAT model to assess erosion hotspot for sub-catchment management at Mai-Negus catchment in northern Ethiopia. East Afr. J. Sci. Technol. 2013, 2, 97–123. [Google Scholar]
  20. Neill, C.; Melillo, J.M.; Steudler, P.A.; Cerri, C.C.; de Moraes, J.F.; Piccolo, M.C.; Brito, M. Soil carbon and nitrogen stocks following forest clearing for pasture in the southwestern Brazilian Amazon. Ecol. Appl. 1997, 7, 1216–1225. [Google Scholar] [CrossRef]
  21. Wang, Y.; Hu, W.; Zhu, Y.; Shao, M.; Xiao, S.; Zhang, C. Vertical distribution and temporal stability of soil water in 21-m profiles under different land uses on the Loess Plateau in China. J. Hydrol. 2015, 527, 543–554. [Google Scholar] [CrossRef]
  22. Biswas, A.; Si, B.C. Spatial relationship between soil hydraulic and soil physical properties in a farm field. Can. J. Soil Sci. 2009, 89, 473–488. [Google Scholar] [CrossRef]
  23. Sultan, D.; Tsunekawa, A.; Haregeweyn, N.; Adgo, E.; Tsubo, M.; Meshesha, D.T.; Masunaga, T.; Aklog, D.; Fenta, A.A.; Ebabu, K. Efficiency of soil and water conservation practices in different agro-ecological environments in the Upper Blue Nile Basin of Ethiopia. J. Arid Land 2018, 10, 249–263. [Google Scholar] [CrossRef] [Green Version]
  24. Tekleab, S.; Uhlenbrook, S.; Mohamed, Y.; Savenije, H.H.G.; Temesgen, M.; Wenninger, J. Water balance modeling of Upper Blue Nile catchments using a top-down approach. Hydrol. Earth Syst. Sci. 2011, 15, 2179–2193. [Google Scholar] [CrossRef] [Green Version]
  25. Ayenew, T.; Demlie, M.; Wohnlich, S. Hydrogeological framework and occurrence of groundwater in the Ethiopian aquifers. J. Afr. Earth Sci. 2008, 52, 97–113. [Google Scholar] [CrossRef]
Figure 1. Location of experimental sites under the treated watershed (Aba Gerima) and untreated watershed (Site 1: Open grazing land (control), Site 2: Area closure, Site 3: cultivated land (CL) under Flat (F) with Sustainable Land Management (SLM), Site 4: CL under Gentle (G) with SLM, Site 5: CL under steep (S) with SLM, Site 6: CL under Flat (F) control, Site 7: CL under Gentle (G) control, and Site 8: CL under steep (S) control.
Water 14 03095 g001
Figure 2. Simulated versus measured soil moisture (SM) data of all sites.
Water 14 03095 g002
Figure 3. Soil water storage under treated versus control cultivated land on gentle slope (a), Cumulative bottom flux under treated versus control cultivated land on gentle slope (b).
Water 14 03095 g003aWater 14 03095 g003b
Table 1. Data type used in the study and their respective sources.
S/NData TypeData SourcePurpose
1Soil Physical and Hydrological Properties
(Soil moisture, textural composition, Bulk density,
Organic content under 400 mm depth within
August 2017 to May 2019)
Mersha et al. [16]Modeling water balance components
2Crop Growth data (soil depth)Kebelle/District Farmers Training centers (FTC) Modeling water balance components
3Meteorological Data
(Max.–Min daily T in °C, Mean daily Ppt in mm) within August 2017 to May 2019)
WLRCModeling water balance components
4Digital elevation Model (DEM)USGS Earth explorer (https://earthexplorer.usgs.gov/)Study area description
5Soil type MapWLRCStudy area description
6Ground water level and wells locationField survey of the study site (Aba Gerima)Water availability assessment.
7Aba Gerima shape file and Land cover map.WLRCHigh resolution study area LU map.
Table 2. Summarized Hydrus 1D simulation results of major water balance components in in treated and control sites.
Hydrologic ParametersControlTreatedControlTreatedControlTreatedControlTreated
ACACECLF1CLF0CLG1CLG0CLS1CLS0
Mean Actual Surface Flux (mm/day)4.74.64.5374.5264.3144.2444.244.43
Mean Actual Root water Uptake (mm/day)0.20.220.0450.0210.0460.0440.0460.019
Mean Bottom Flux (mm/day)4.13.83.253.33.223.283.33.5
Annual Cumulative Infiltration (mm)983.2983.21152.31150.51152.31150.31150.31150.2
Cumulative Evaporation (mm)4733326.67319.68329.05322.7321.37294.24
Mean SWS (mm)100.3106142.3153.8132.39120.57103.7113.5
Notes: CL; cultivated land under (F) Flat, (G) Gentle, (S) Steep slopes; 0 = watershed management, 1 = controlled; AC, Area closure; ACE, Area closure with structures.
Table 3. Level of agreement between measured and simulated SM data.
SitesModel PerformanceSitesModel Performance
ACME0.00CLS 0ME0.00
MAE0.01MAE0.01
RMSE0.02RMSE0.02
R20.86R20.78
ACEME0.00CLF 1ME−0.05
MAE0.02MAE0.06
RMSE0.03RMSE0.09
R20.77R20.55
CLF 0ME−0.16CLG 1ME0.00
MAE0.16MAE0.02
RMSE0.17RMSE0.03
R20.77R20.78
CLG 0ME0.01CLS 1ME0.00
MAE0.03MAE0.02
RMSE0.04RMSE0.02
R20.79R20.73
Note: ME, Mean Error; RMSE, Root mean square error; MAE, Mean weighted absolute error.
Table 4. soil hydraulic parameters estimation from measured soil texture & bulk density [16].
Watershed Management TypeSiteSoil Layer (mm)Soil TextureBD (g/mm3)
% Clay% Silt% Sand
ControlledAC0–1001032580.00102
100–2002020600.001032
200–3003040300.000934
300–4004636180.000888
TreatedACE0–2002440360.001262
200–40032.74027.30.001063
ControlledCLF10–4005220.527.50.001098
TreatedCLF00–2003139300.001206
200–4005326210.001199
ControlledCLG10–2004726270.001027
200–3003226420.001117
300–4002826460.001023
TreatedCLG00–1003242260.001223
100–3004832200.000993
300–4003826360.000994
ControlledCLS10–2002020600.001064
200–3001838440.001184
300–4001522630.00116
TreatedCLS00–1002638360.001178
100–40044.72628.70.001227
Publisher’s Note: MDPI stays neutral with regard to jurisdictional claims in published maps and institutional affiliations.

