
Evolution of Wet and Dry Spells Based on Original and Corrected Precipitation Data in Southwest China, 1961–2019

1
School of Geography and Ecotourism, Southwest Forestry University, Kunming 650224, China
2
Southwest Research Centre for Eco-civilization, National Forestry and Grassland Administration, Kunming 650224, China
3
National (Yunnan Province) Field Science Observation and Research Station Yulong Snow Mountain Cryosphere and Sustainable Development, Northwest Institute of Eco-Environment and Resources, Chinese Academy of Sciences, Lanzhou 730000, China
*
Author to whom correspondence should be addressed.
Water 2022, 14(19), 3090; https://doi.org/10.3390/w14193090
Submission received: 18 August 2022
/
Revised: 23 September 2022
/
Accepted: 23 September 2022
/
Published: 1 October 2022
(This article belongs to the Section Hydrology)
Abstract
:Gauge-measured precipitation data have long been recognized to underestimate actual precipitation due to wind-induced error, trace precipitation, and wetting loss, which affects the spatial and temporal characteristics of precipitation. In this study, we examined spatial and temporal differences in wet and dry spell indices based on original (Po) and corrected (Pc) precipitation data and their correlations with large-scale circulation indices (LSCIs) in Southwest China during 1961–2019. The main conclusions were: (1) Pc-based trends in wet/dry spell indices were generally more pronounced than Po-based. Specifically, when Pc-based, more stations had significant changes in the MWS, MLWS, MPWS, PWS95, FWW, FDW, MDS, MLDS, NLDS, and DDS95 indices, while fewer had significant changes in the NWS, NDS, FDD, and FWD indices. (2) Spearman’s results showed that more LSCIs were significantly related to the Pc-based wet/dry spell indices than Po-based. Po-based and Pc-based MWS, Po-based MDS, and Pc-based NLDS were significantly related to the most LSCIs. Therefore, taking them as examples, wavelet transform coherence (WTC) and partial wavelet coherence (PWC) were used to explore the coherence with LSCIs. WTC results showed South Asian Summer Monsoon Index (SASMI) + Po-based MWS, Arctic Oscillation (AO) + Po-based MDS, SASMI + Pc-based MWS, Asia Polar Vortex Intensity Index (APVI) + Pc-based NLDS exhibited the most obvious periodic resonance with main resonance periods of 2.13~7.8 year, 2.19~10.41 year, 2.13~12.13 year, 2.75~18.56 year, respectively. Since WTC may arbitrarily ignore the interaction between LSCIs, PWC is adopted for further analysis. PWC results showed the coherence of AO +Po-based MDS significantly increased after eliminating the Nino Eastern Pacific index (NEP) influence, with the main resonance period of 6.56~18.56 year. This study clearly demonstrated that corrected precipitation data should be used to improve the accuracy of drought assessments, climate models, eco-hydrological models, etc.
1. Introduction
Climate warming is intensifying the global water cycle, strengthening the contrast between wet and dry seasons, and increasing the intensity while decreasing the frequency of sub-seasonal precipitation [1,2,3,4]. Wet/dry spells, or periods of consecutive rainy/rainless days, respectively, can be used to represent the weather patterns of a region [5]. Large anomalies in the occurrences and durations of wet/dry spells can have large impacts on hydrological extremes as well as vegetation growth and food production [4,5,6,7]. Therefore, characterizing the evolution and causes of wet/dry spells is central to understanding, anticipating extreme hydrological events, and managing climate-related risks [8]. High spatiotemporal variability in wet/dry spells has been observed in Southern Africa [6], North America [7], South Asia [8], Europe [9], Mediterranean countries [10], the western Amazon [11], Northern Ghana [12], and India [13], among others. This has also been observed in some regions across China, with studies showing increased dry spells in Mainland China [14], prolongations in the maximum consecutive wet days in North China during winter [15], downward trends in heavy precipitation days in Southwest China [16], increased in consecutive extreme dry days in the Yangtze River region [17], increased frequency of 2~5-day wet spells in the Pearl River basin [18], decreasing/increasing trends in wet/dry spells in the Sichuan basin [19], decreases/increases in wet/dry spells in the South Mongolian Plateau [20], and so on. Furthermore, Wang et al. [20] focused on the alternating frequency between wet and dry spells in the South Mongolian Plateau by using the F(w-w), F(d-d), F(w-d), and F(d-w) indices, and they found that the frequencies of wet-to-dry spells and dry-to-wet spells were both low and tended to decrease due to the increases in continuous dry days. By defining wet and dry spells on annual scales, most recent studies have provided useful information about the spatial variability and temporal trends in wet and dry spells and improved their stochastic modeling. Furthermore, changes in wet and dry spells have been linked to low frequency large-scale oscillations such as the El Nino Southern Oscillation (ENSO), which are closely related to human influence, and changes in land-use resulting from anthropogenic invasion [6,16,19,21,22].
Accurate gauge-measured precipitation data is critical to climate and hydrological research. In the 19th century, liquid precipitation measurement gauges were evaluated in St. Petersburg, and it was determined that the gauges underestimated the actual precipitation [23]. This means it is necessary to conduct bias corrections before using gauge-measured precipitation data in meteorological research and hydrological research [24,25,26,27,28,29]. Original precipitation (Po) and corrected precipitation (Pc) data exhibit obvious differences when analyzed for precipitation amounts, change trends, intensities, and regional differences [24,27,30,31]. For example, Li et al. [24] concluded that the required correction amounts for annual precipitation were less than 100 mm in northwestern China, but more than 150 mm in southeastern China. Zhang et al. [27] found that annual precipitation amounts and intensities increased by varying degrees after precipitation bias correction, with the maximum percentage increase being about 35%. Ding et al. [30] found that the monthly/annual trends of Pc were stronger than those in the Po data. Despite the recognition of the bias in gauge-measured precipitation, most recent wet and dry spell studies use Po at various timescales or in different regions, which may lead to erroneous conclusions [5,7,19,20,32].
Southwest China is a typical climate-sensitive region and fragile ecological area that has a complex meteorological environment due to the tropical ocean effect, low latitudes, and highly variable topography [33]. However, little is known about the spatiotemporal variability in wet/dry spells in Southwest China. To date, only the study by Huang et al. [19] has investigated changes in wet and dry spells from 1961–2008 in Sichuan Province, Southwest China, but their work was based on Po data and no research has compared Po and Pc data when examining changes in wet and dry spells in this region. Therefore, it is important to investigate the effects of bias correction on the spatial and temporal characteristics of wet/dry spells, as well as on the responses to large-scale circulation anomalies, to better understand regional climate extremes. The aims of this study were as follows: (1) to compare the spatial and temporal variability in wet and dry spells based on Po and Pc; and (2) to reveal how Po- and Pc-based wet/dry spells correlate with large-scale circulation patterns.
2. Data and Methods
2.1. Study Area
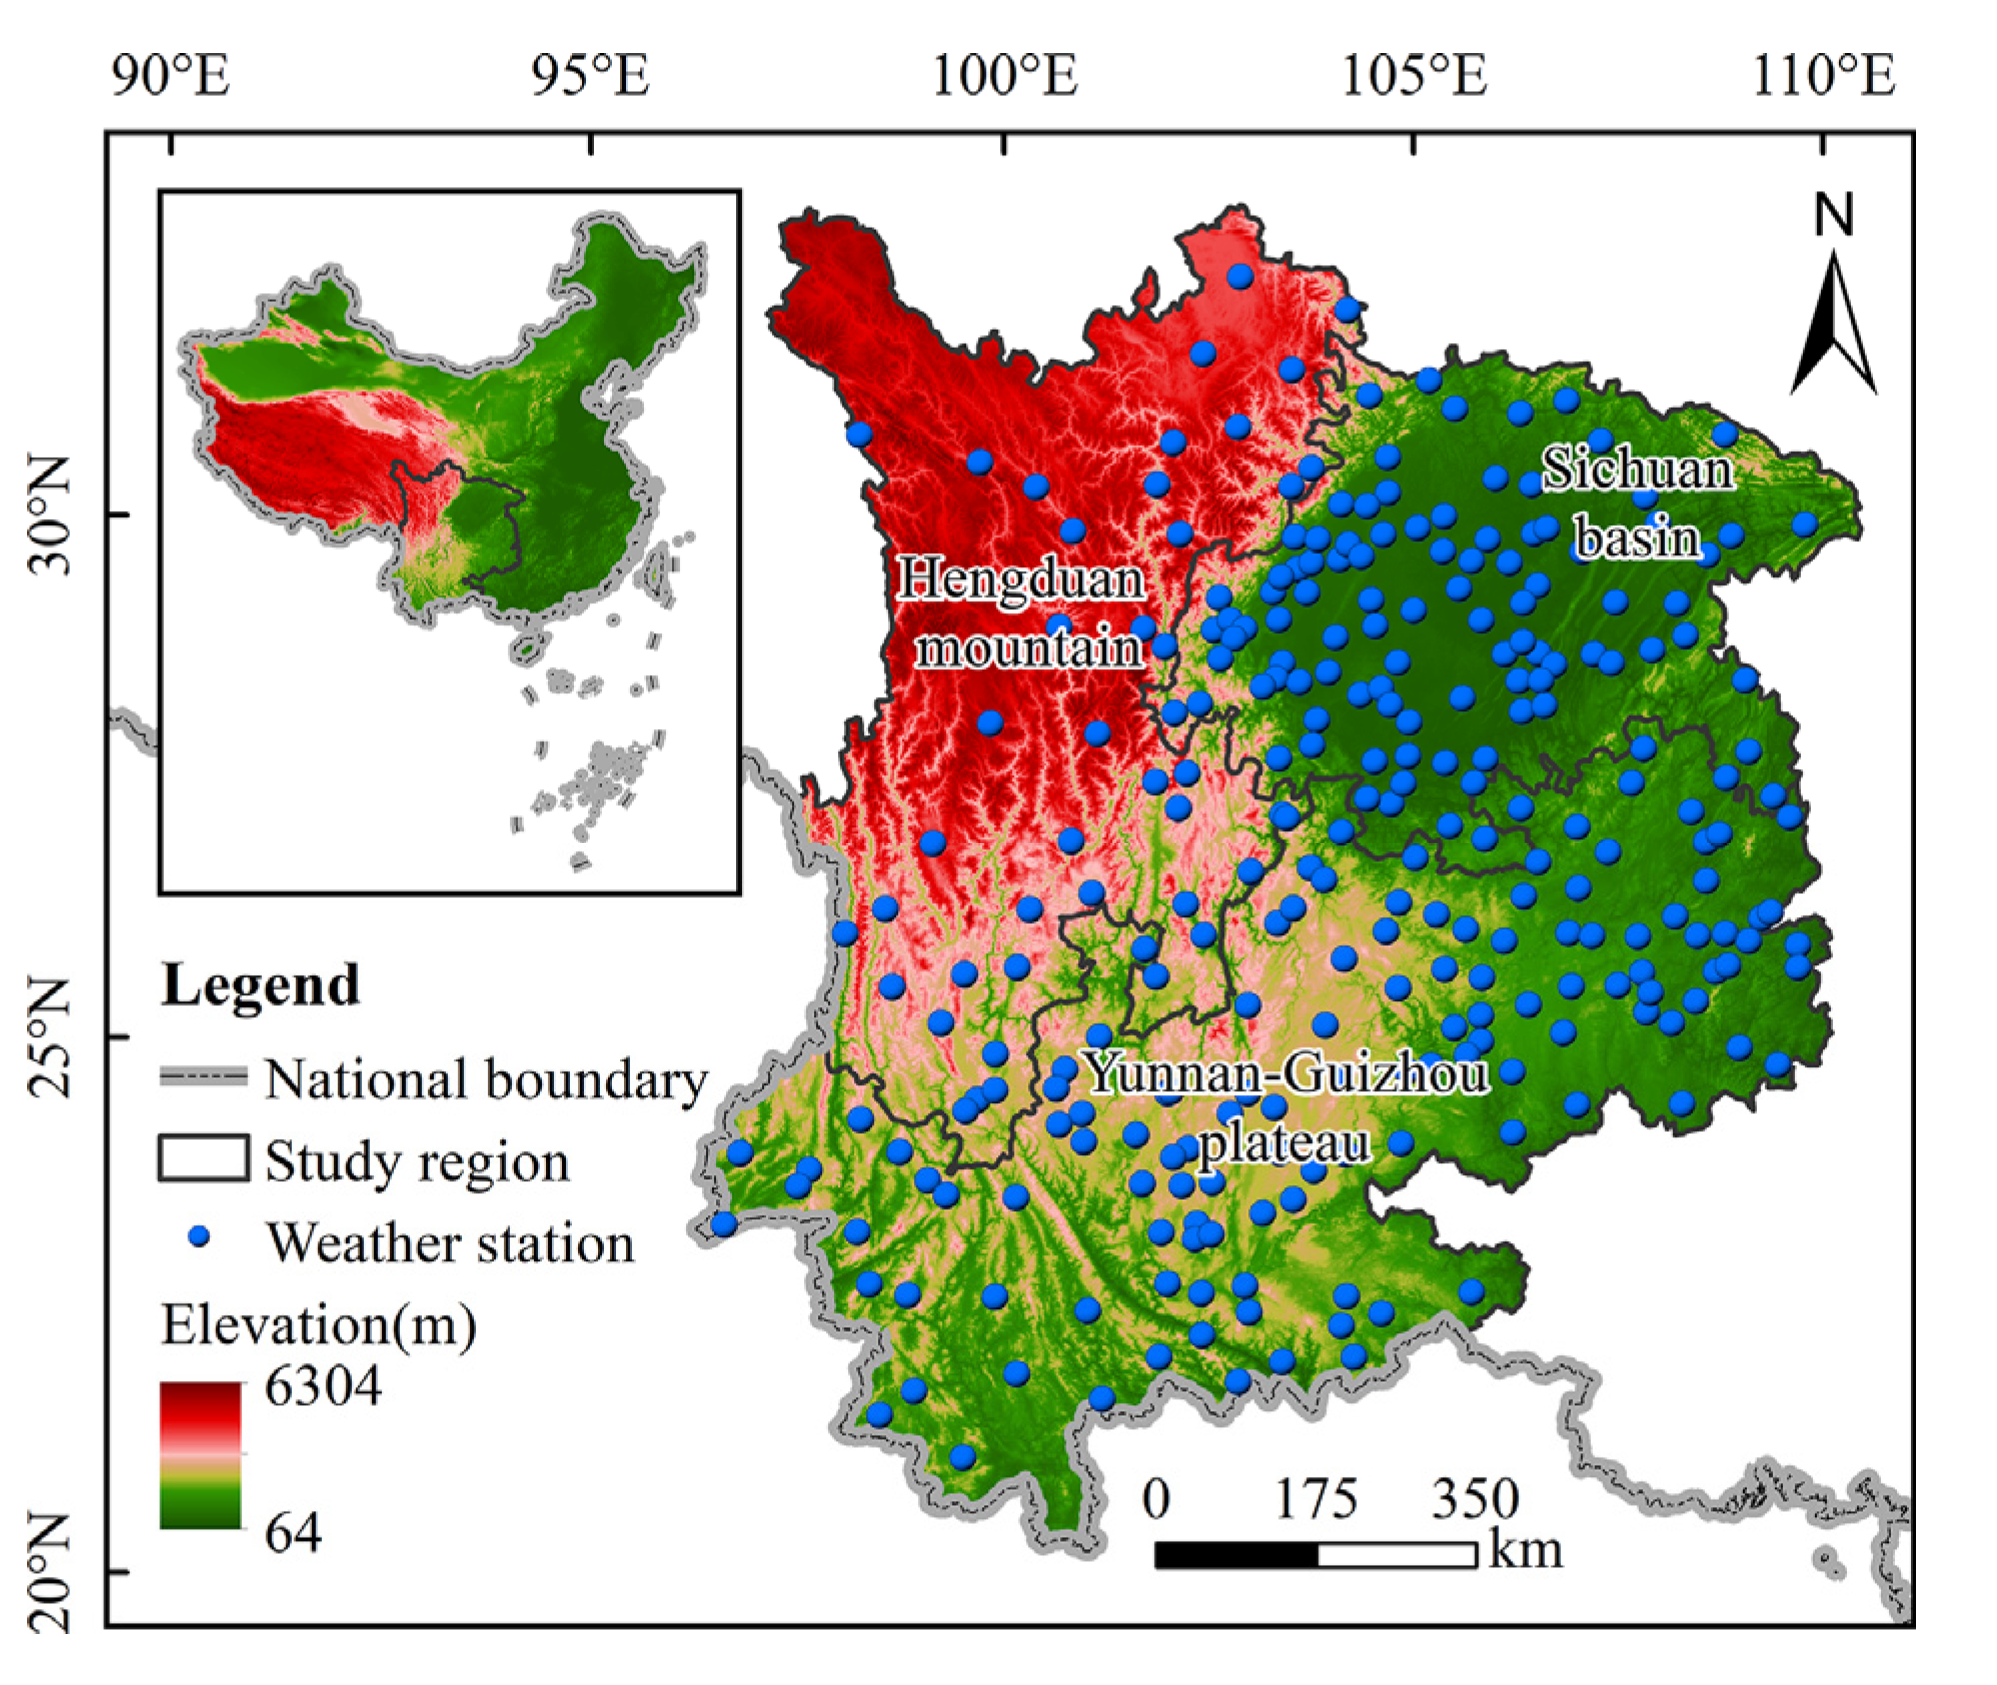
Southwest China (20~35° N, 98~110° E) lies between China’s first altitudinal step—the Tibetan Plateau (≥4000 m above sea level, hereafter m)—and the third step, the middle-lower Yangtze Plain (≤500 m); the regional elevation generally increases from the southeast to the northwest [34]. Using geomorphic classifications, the region can be partitioned into three sub-regions: the Sichuan Basin, the Hengduan Mountains, and the Yunnan-Guizhou Plateau (Figure 1). The Sichuan Basin is ringed by mountains ranging from 1000~3000 m in elevation and the floor of the basin is at an average elevation of 500 m; Hengduan mountains are an important part of the longitudinal ridge valley area with a 300~6000 m elevation range; Yunnan-Guizhou Plateau is known for its limestone karst landscape and has an average elevation of 2000 m [35,36]. The climate is driven by the East Asian monsoon and the Indian monsoon, and altitudinal climates range from subtropical to temperate, alpine, and frigid [33,37,38]. Across this expansive region, the mean precipitation varies strongly depending on the geographical region [36].
2.2. Data Sets
Daily precipitation data from 264 weather stations covering 1961–2019 were obtained from the National Climate Center (NCC) of the China Meteorological Administration (CMA) (Figure 1). Weather stations were selected according to three criteria: (1) the observation period should cover 1961–2019 to facilitate the comparison of results across the whole study area; (2) stations missing >5% of the data during the observation period were excluded, otherwise missing data from a station were filled in using the average value of the preceding 2 days from that station; and (3) stations with a straight-line site migration distance exceeding 20 km or a vertical site migration distance exceeding 100 m were removed [39]. Overall, 26 of the 290 sites were removed from this study to ensure that missing data and weather station relocation did not impact the results.
The large-scale circulation indices (LSCIs) used in this paper were acquired from the NOAA Earth System Research Laboratories (https://www.esrl.noaa.gov/ accessed on 2 May 2022), National Climate Center (China, http://ncc-cma.net/cn/ accessed on 2 May 2022), and Li’s Monsoon index data set (http://lijianping.cn/dct/page/1 accessed on 2 May 2022). The LSCIs are shown in Table 1.
2.3. Methods
2.3.1. Definition of Wet and Dry Spells
According to Expert Team on Climate Change Detection and Indices (ETCCDI), if the daily precipitation ≥1 mm, the day is considered as a wet day; otherwise, it is regarded as a dry day [40]. The wet/dry spells with length x is defined as a period of x consecutive wet/dry days, the minimum length of the single wet/dry spells are both 1 day [19,41]. To comprehensively quantify the spatial and temporal characteristics of wet/dry spells, based on four aspects of wet/dry spells frequency, extremes, structural characteristics, and conversion frequency (i.e., wet spell interrupts to dry spell or dry spell interrupts to wet spell), 9 wet/dry spell indices were selected, with a total of 18 indices, as shown in Table 2.
2.3.2. Precipitation Bias Correction Method
Bias correction for Po mainly accounts for wetting losses (), evaporation losses (), trace precipitation (), and wind under-catch errors () [27]. The general formula for precipitation bias correction was modified as follows [42]:
where is the gauge-measured precipitation; is the correction coefficient for wind-induced errors, defined as ; is trace precipitation, set at =0.1 mm in this research [24]; and is wetting loss of the bucket, when > 0.1 mm, = 0.30 mm for daily < −2 °C, = 0.29 mm for > 2 °C, and = 0.23 mm for −2 °C ≤ ≤ 2 °C [26]. Considering the difficulty of direct monitoring and small value of , no correction for was made here [24,26,43].
where , , and are the catch ratios for snow, rain, and mixed precipitation, respectively; is the wind speed at 10 m height (m/s); is the daily average temperature; and is the corrected , where < −2 °C is snowfall ( = −2 °C), > 2 °C is rainfall ( = 2 °C); and −2 °C ≤ ≤ 2 °C is mixed precipitation ( = ).
In this paper, the trend relative errors of wet/dry spell indices were calculated using the following formula:
2.3.3. Other Methods
The trend analysis adopted Sen’s slope + modified Mann–Kendall [44,45] and Spearman correlation [46] to reveal the correlations between wet/dry spell indices and LSCIs. Based on the Spearman correlation analysis, wavelet transform coherence (WTC) and partial wavelet coherence (PWC) were used to further analyze the relationship between wet/dry spell indices and LSCIs, with 3000 Monte Carlo simulations to calculate the average wavelet coherence value (AWC) and significant coherence area percentage (%, PASC) of wet/dry spell indices and LSCIs, and to calculate the wavelet significant coherence area difference (%, PASCG) according to PWC PASC and WTC PASC. If PASCG ≥ 5%, the interpretation degree of LSCI1 to the wet/dry spell indices under the influence of eliminating variable LSCI2 is considered effective [47]. For more details, please see Torrence and Compo [48], Grinsted et al. [49,50], Hu and Si [47], and Ng and Chan [51].
3. Results
3.1. Spatial and Temporal Variability in Wet and Dry Spell Indices
3.1.1. Temporal Variability
As shown in Table 3, the Po- and Pc- based MWS, MLWS, MPWS, PWS95, and FWW all exhibited significant decreasing trends, FDW exhibited a significant increasing trend, and only NWS had no significant trend, but it did appear to decrease. Compared with Po-based trends, the Pc-based trends in NWS, MWS, MLWS, MPWS, PWS95, FWW, and FDW were all more pronounced with slope relative error of 2.51~41.44%. In the Sichuan Basin, the Po- and Pc-based MWS, MLWS, PWS95, and FWW tended to decrease significantly and FDW tended to increase significantly, while NWS and MPWS had no significant change but appeared to decrease. The Pc-based trends in the NWS had slope relative errors that were −62.34% of the Po-based trends, while the trends in MWS, MLWS, MPWS, PWS95, FWW, and FDW became more pronounced with slope relative error of 6.45~60.39%. In the Hengduan Mountains, Po- and Pc-based MWS and MLWS tended to significantly decrease, while all others had no significant trends, but NWS and FDW appeared to increase and MPWS, PWS95, and FWW appeared to decrease. The Pc-based trends of NWS and MLWS diminished with slope relative error of −22.22~−13.46%, while the changes in MWS, MPWS, PWS95, FWW, and FDW were more pronounced with slope relative errors of 17.21~114.71%. In the Yunnan-Guizhou Plateau, Po- and Pc-based MWS, MLWS, PWS95, and FWW significantly decreased and FDW significantly increased, while NWS and MPWS showed no significant change but appeared to decrease. The Pc-based trend in NWS was weaker than its Po-based trend, with a slope relative error of −17.83%, the trends in MWS, MLWS, MPWS, PWS95, FWW, and FDW became more pronounced when Pc-based, with slope relative errors of 14.44~27.14%.
As shown in Table 3, Po- and Pc-based MDS and Pc-based DDS95 showed significant increasing trends; Pc-based NLDS showed a significant decreasing trend; Po- and Pc-based NDS, FWD, and FDD and Po-based NLDS showed no significant change but appeared to decrease; Po- and Pc-based MLDS and Po-based DDS95 showed no significant change but appeared to increase. Pc-based trends in NDS and FDD were less obvious than Po-based, with slope relative errors of −2.78~−1.54%, while the trends in MDS, MLDS, NLDS, DDS95, and FWD became more pronounced with slope relative errors of 1.49%, 2.99%, 351.53%, 25.98%, and 3.27%, respectively. In the Sichuan Basin, none of the Po- and Pc-based dry spell indices tended to change significantly, but the Po- and Pc-based NDS, NLDS, FDD and Po-based FWD appeared to decrease, and the Po- and Pc-based trends in MDS, MLDS, DDS95, Pc-based FWD appeared to increase. Pc-based trends in NDS and FDD were less pronounced compared to Po-based trends, with slope relative errors of −40.29~−39.69%, respectively, while those the trends in MDS, MLDS, NLDS, DDS95 became more obvious with slope relative errors of 2.16%, 36.9%, 183.2%, and 37.56%, and FWD showed the opposite trend. In the Hengduan Mountains, the Po- and Pc-based NLDS exhibited significant decreasing trends, while NDS, MDS, MLDS, DDS95, FWD, and FDD exhibited no significant changes but appeared to increase. The Pc-based trends in NDS, MLDS, DDS95, FWD, and FDD were less pronounced than the Po-based, with slope relative errors of −25%, −6.62%, −16.67%, −17.64%, and −21.37%, respectively, while those of MDS and NLDS became more obvious, with slope relative errors of 35.52% and 266.34%. In the Yunnan-Guizhou Plateau, the Po- and Pc-based MDS and Pc-based MLDS and DDS95 exhibited significant increasing trends, Po- and Pc-based NLDS exhibited significant decreasing trends, Po- and Pc-based NDS, FWD, and FDD did not significantly change but appeared to decrease, and Po-based MLDS and DDS95 did not significantly change but appeared to increase. The Pc-based trends of NDS, MDS, and FWD were less pronounced than their Po-based trends, with slope relative errors of −3.45%, −3.19%, and −13.96%, respectively, while MLDS, NLDS, DDS95, and FDD became more obvious with slope relative errors of 11.2%, 201.86%, 30.69%, and 0.56%.
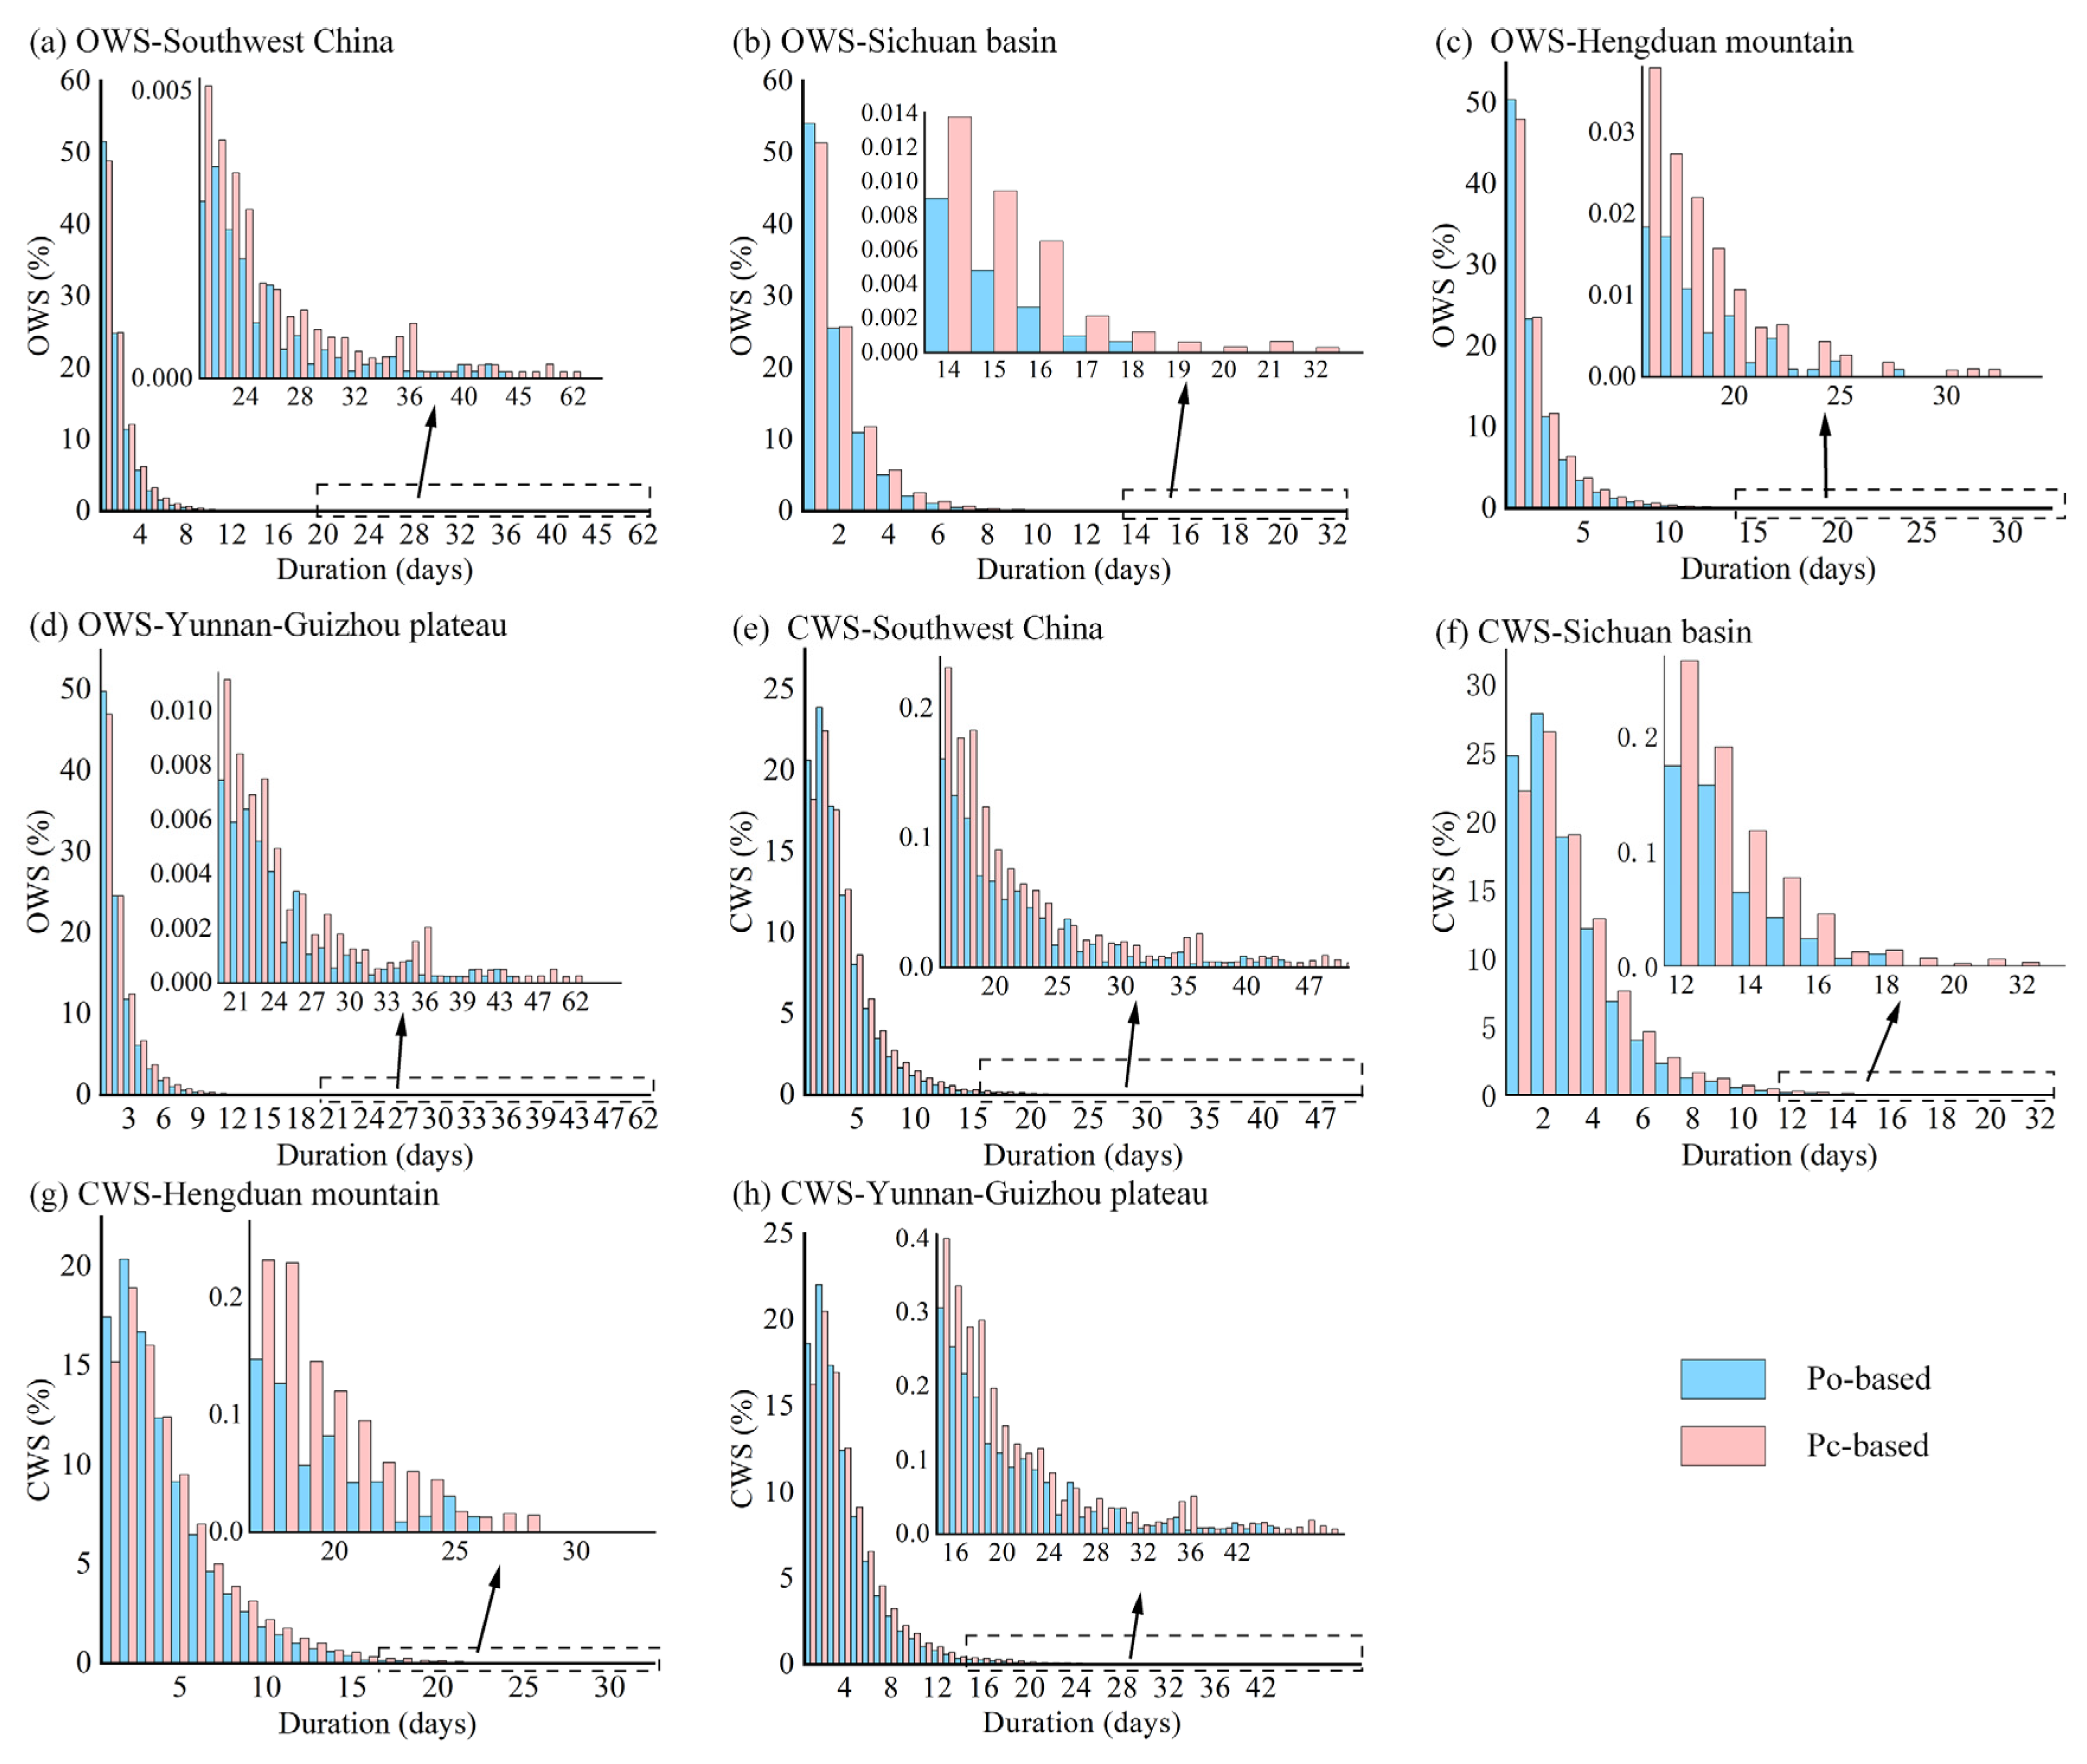
Figure 2 shows OWS and CWS of the study area, which reflect relative proportions and rainfall contribution rates of different lengths of wet spells, respectively. Pc-based OWS identified longer wet spells than Po-based, with maximum durations extended from 44 to 62 days (Figure 2a). In the Sichuan Basin, Hengduan Mountains, and Yunnan-Guizhou Plateau, the maximum durations of wet spells were extended from 18 to 32 days, 28 to 32 days, and 44 to 62 days, respectively (Figure 2b–d). This was because more 1-day wet spells were combined into longer wet spells.
After precipitation correction, correspondingly, Pc-based CWS with short wet spells (1–3 days) were lower with differences of −2.42~−0.23%, while middle length and long wet spells (≥4 days) were generally higher, with the maximum difference reaching 0.59% compared with Po-based CWS (Figure 2e). In the Sichuan Basin, Pc-based CWS with 1–2-day wet spells were lower than Po-based, with differences of −2.57~−1.34%, and wet spells >3 days were higher than Po-based, with the maximum difference reaching 0.76% (Figure 2f). In the Hengduan Mountains and Yunnan-Guizhou Plateau, Pc-based short wet spells were lower than Po-based, with differences of −2.28~−0.68% and −2.37~−0.4%, while Pc-based middle-length and long wet spells were both higher than Po-based, with maximum differences reaching 0.54% and 0.58%, respectively (Figure 2g,h).
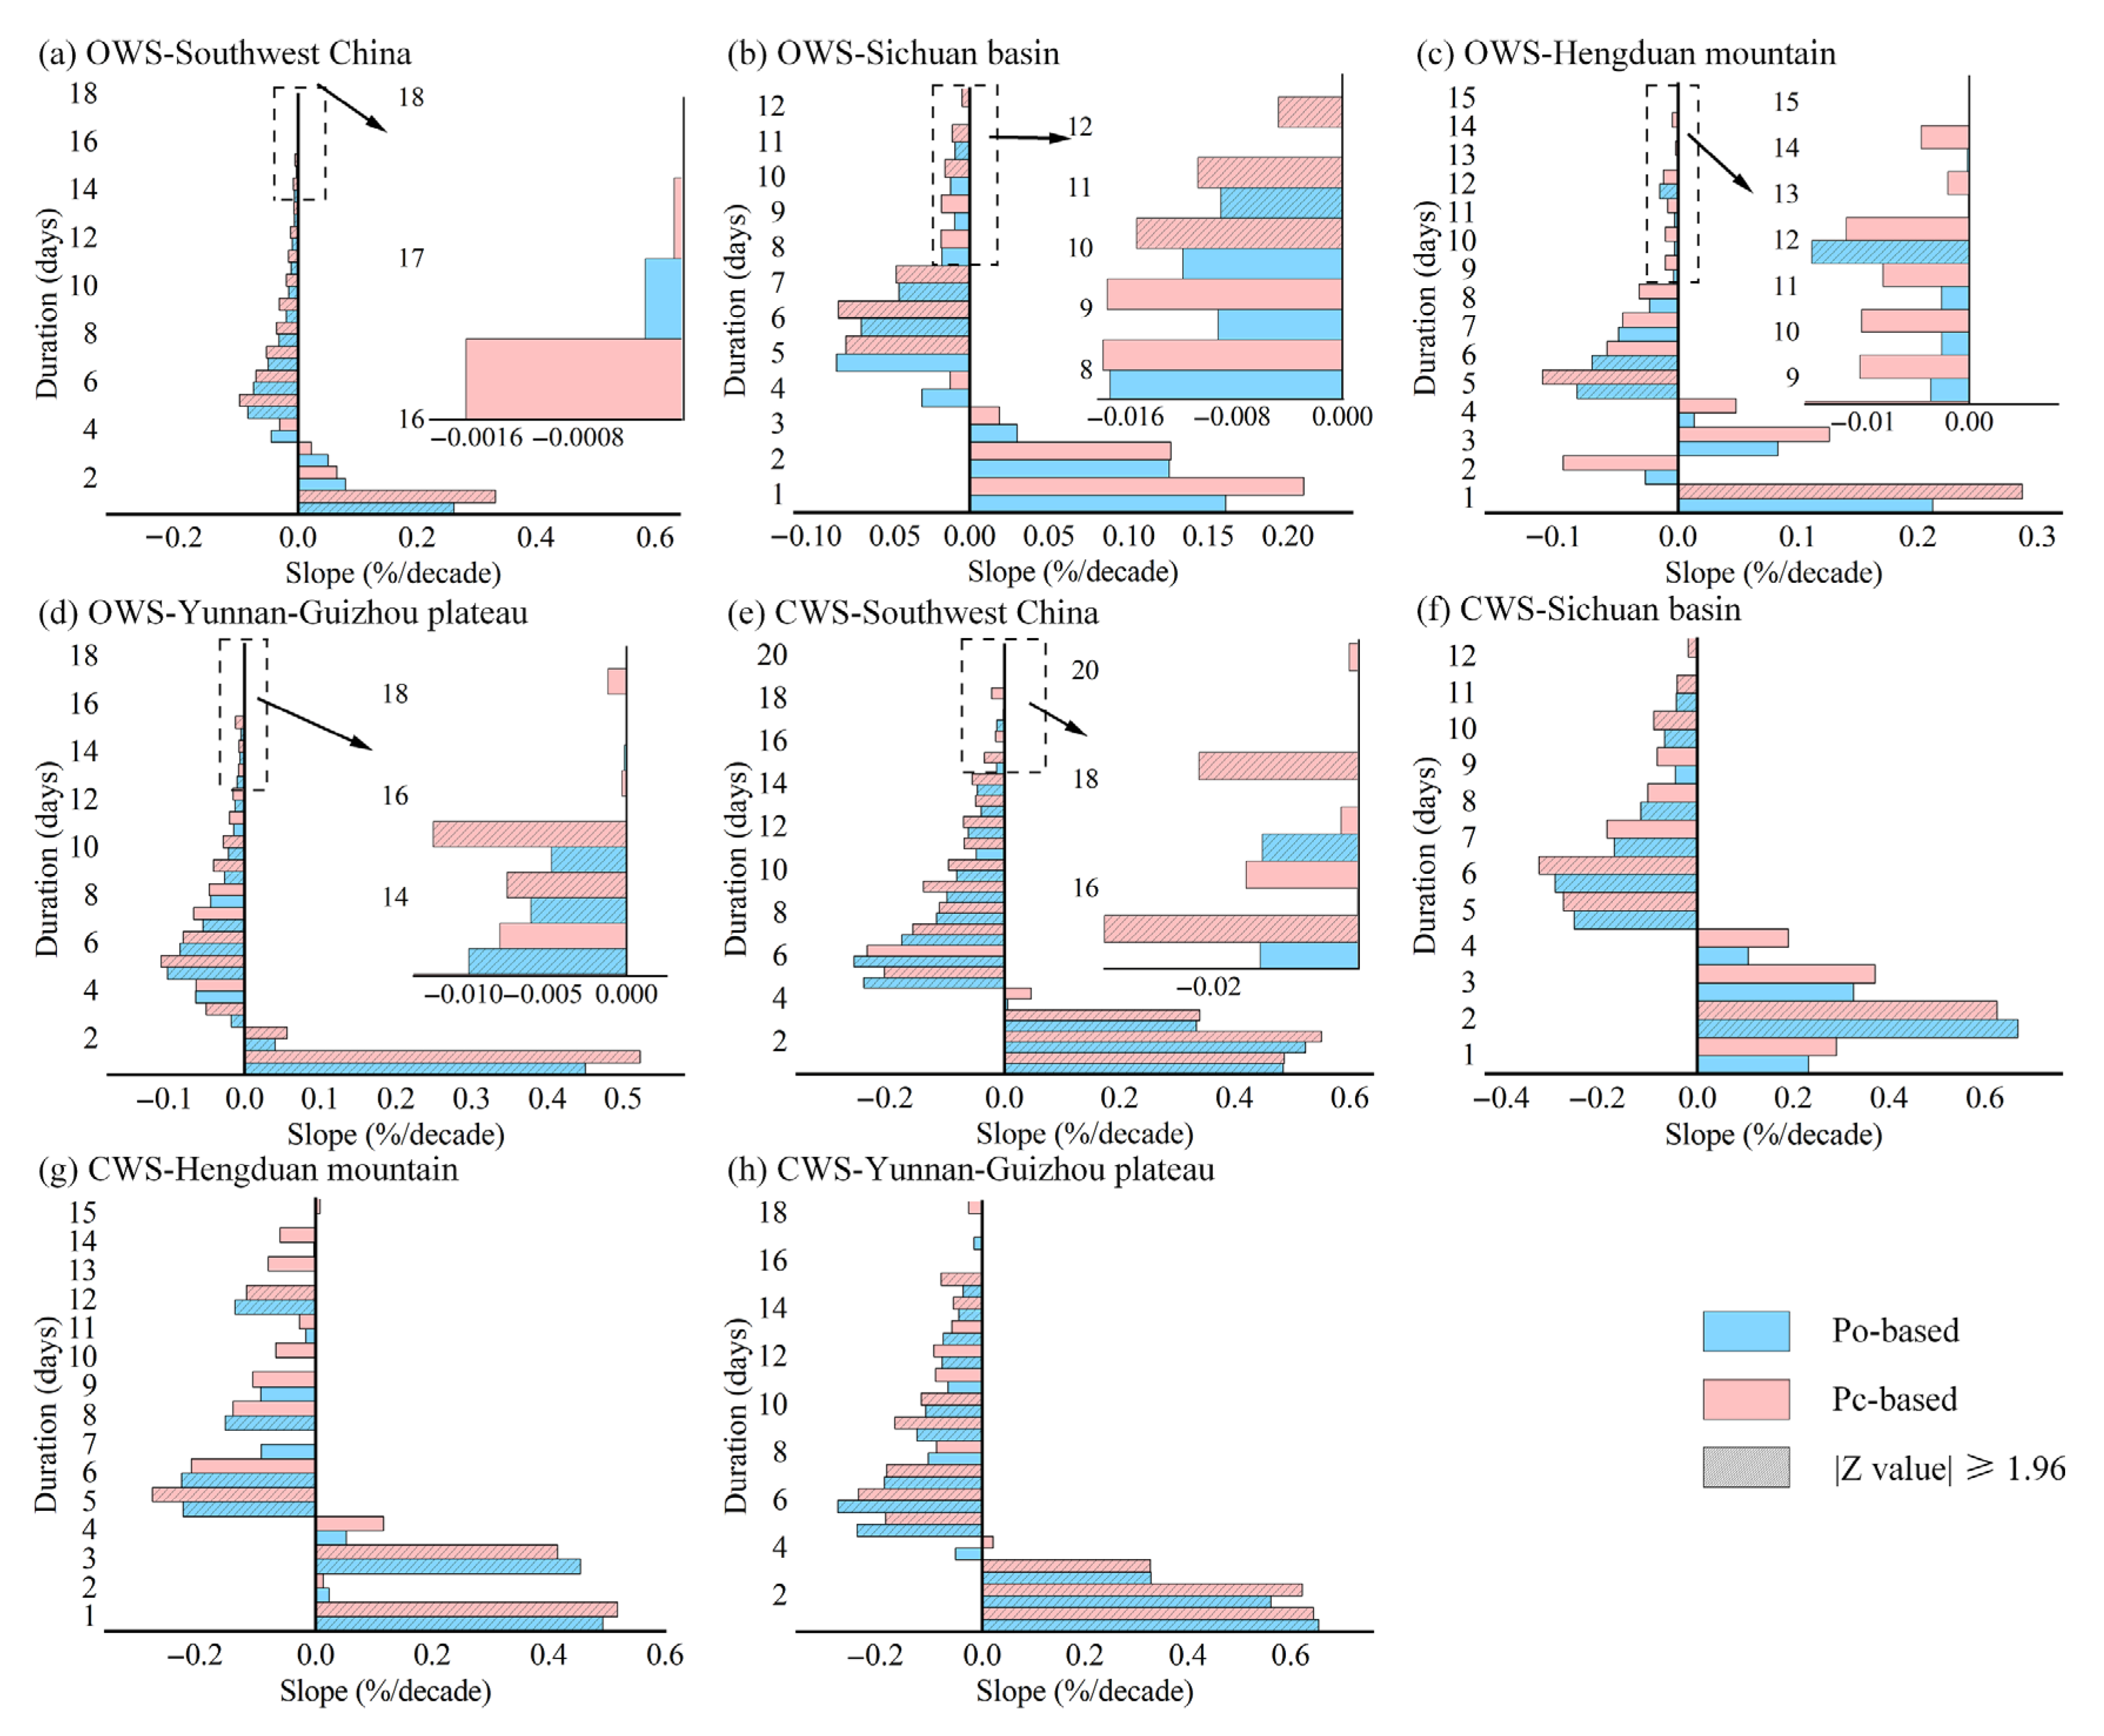
Figure 3 shows the trends in characteristics of OWS and CWS with different duration wet spells. Po- and Pc-based OWS trends with 1–17-day wet spells identified. Po- and Pc-based OWS with 1-day wet spells tended to increase significantly, while 5–15-day wet spells tended to significantly decrease (Figure 3a). In the Sichuan Basin (Figure 3b), Pc-based OWS with 5-, 10-, and 12-day wet spells and Po- and Pc-based OWS with 6-, 7-, and 11-day wet spells tended to significantly decrease. In the Hengduan Mountains (Figure 3c), Pc-based OWS with 1-day wet spells tended to significantly increase, Po-based OWS with 6- and 12-day wet spells and Po- and Pc-based OWS with 6-day wet spells tended to significantly decrease. In the Yunnan-Guizhou Plateau (Figure 3d), Po- and Pc-based OWS with 1–2-day wet spells tended to significantly increase, with 3–15–day wet spells generally tending to significantly decrease. As shown in Figure 3e, The Po-based trends in CWS with 1–18-day wet spells and Pc-based CWS trends with 1–20-day wet spells were also examined. Po- and Pc-based CWS with 1–3-day wet spells tended to significantly increase, but with 1–18-day wet spells tended to significantly decrease. In the Sichuan Basin (Figure 3f), Po- and Pc-based CWS with 2-day wet spells tended to significantly increase, while Po- and Pc-based CWS with 5-, 6-, 10-, and 11-day wet spells, Po-based CWS with 8-day wet spells, and Pc-based CWS with 12-day wet spells tended to significantly decrease. In the Hengduan mountain (Figure 3g), Po- and Pc-based CWS with 1–3-day wet spells tended to significantly increase, while Po- and Pc-based CWS with 5–12-day wet spells and Po-based CWS with 6–8-day wet spells tended to significantly decrease. In the Yunnan-Guizhou Plateau (Figure 3h), Po- and Pc based CWS with 1–3-day wet spells tended significantly increase, but with 5–16-day wet spells they tended to significantly decrease.
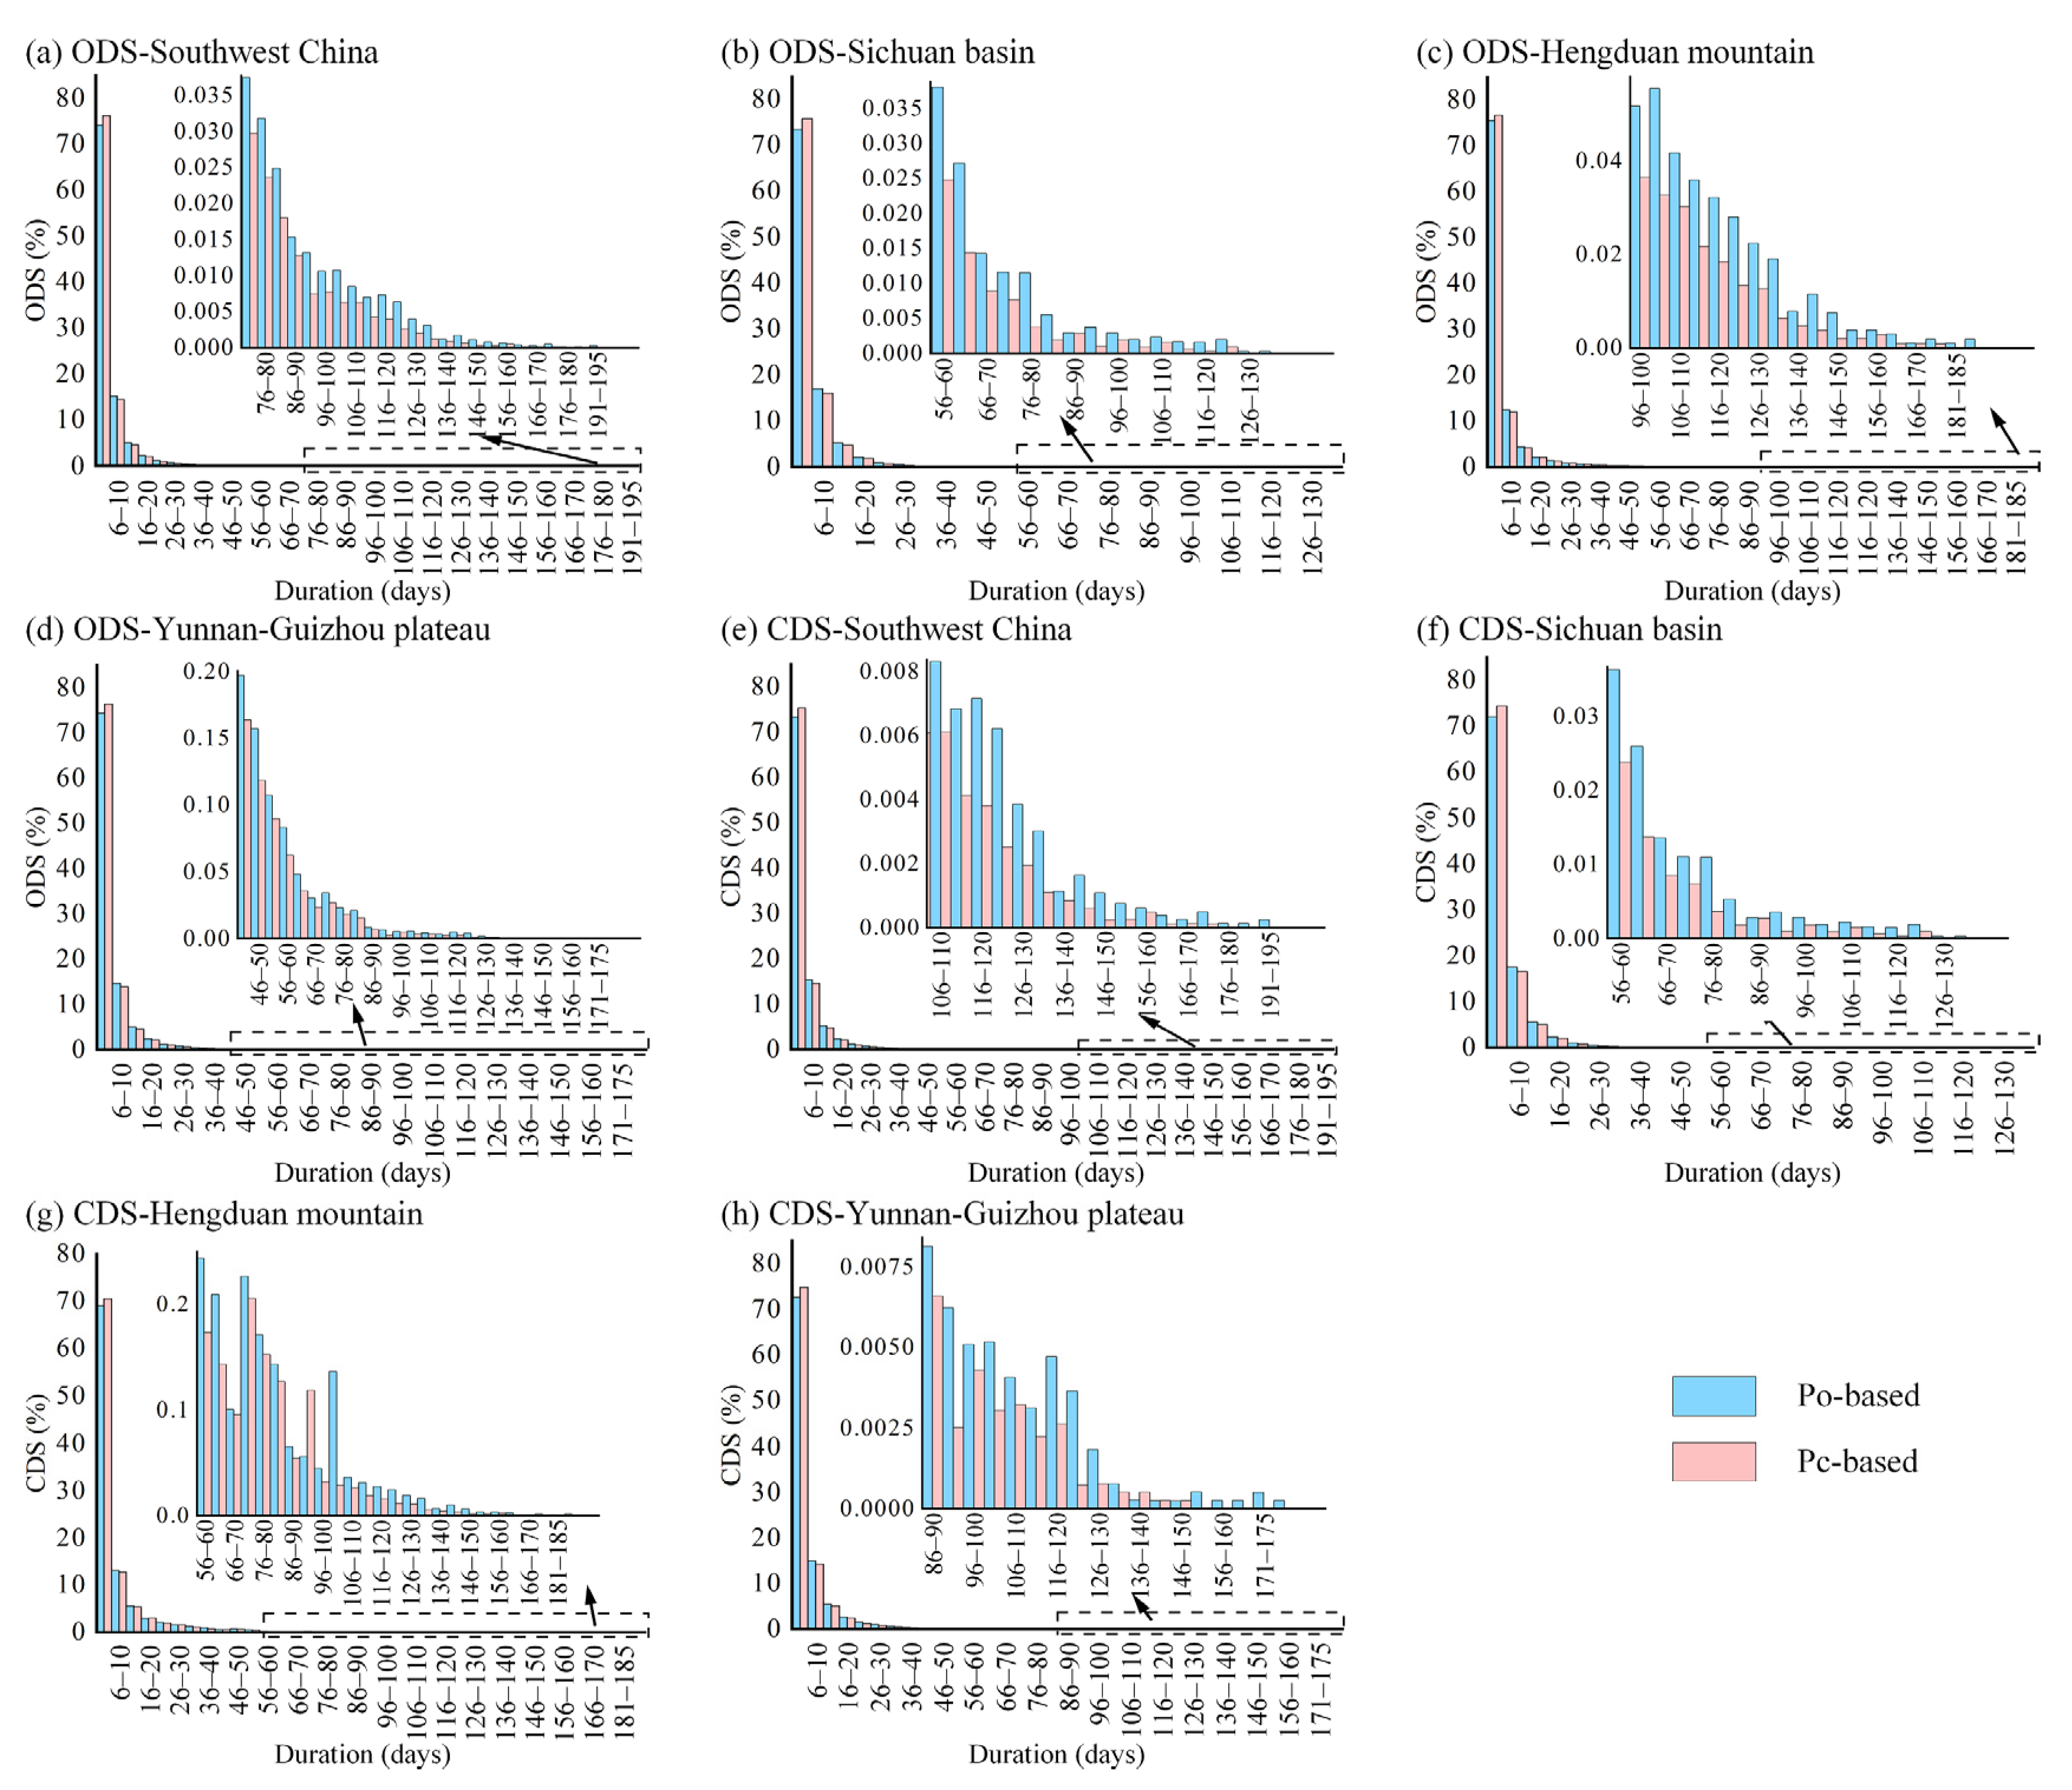
Figure 4 shows the ODS and CDS with different duration dry spells, which reflect proportion and dry-day contribution rates, respectively. The ODS identified shorter dry spells when using Pc-based data than Po-based, with the maximum dry spell duration being shortened from 191–195 to 171–175 days (Figure 4a). In the Sichuan Basin, Hengduan Mountains, and Yunnan-Guizhou Plateau, the maximum durations were shortened from 131–135 to 121–125 days, 191–195 to 171–175 days, 126–130 to 116–120 days, respectively (Figure 4b–d). Correspondingly, Pc-based CDS with short dry spells (1–5 days) were higher than Po-based with differences of 2.06%, while Pc-based CDS with middle-length and long dry spells (≥6 days) were generally lower with maximum differences reaching 0.74% (Figure 4e). In the Sichuan Basin, Hengduan Mountains, and Yunnan-Guizhou Plateau, Pc-based CDS with short dry spells were higher by 2.41%, 1.54%, and 2.14% than Po-based, while Pc-based CDS with middle-length and long dry spells were lower with maximum differences reaching 0.94%, 0.3%, and 0.71%, respectively (Figure 4f–h).
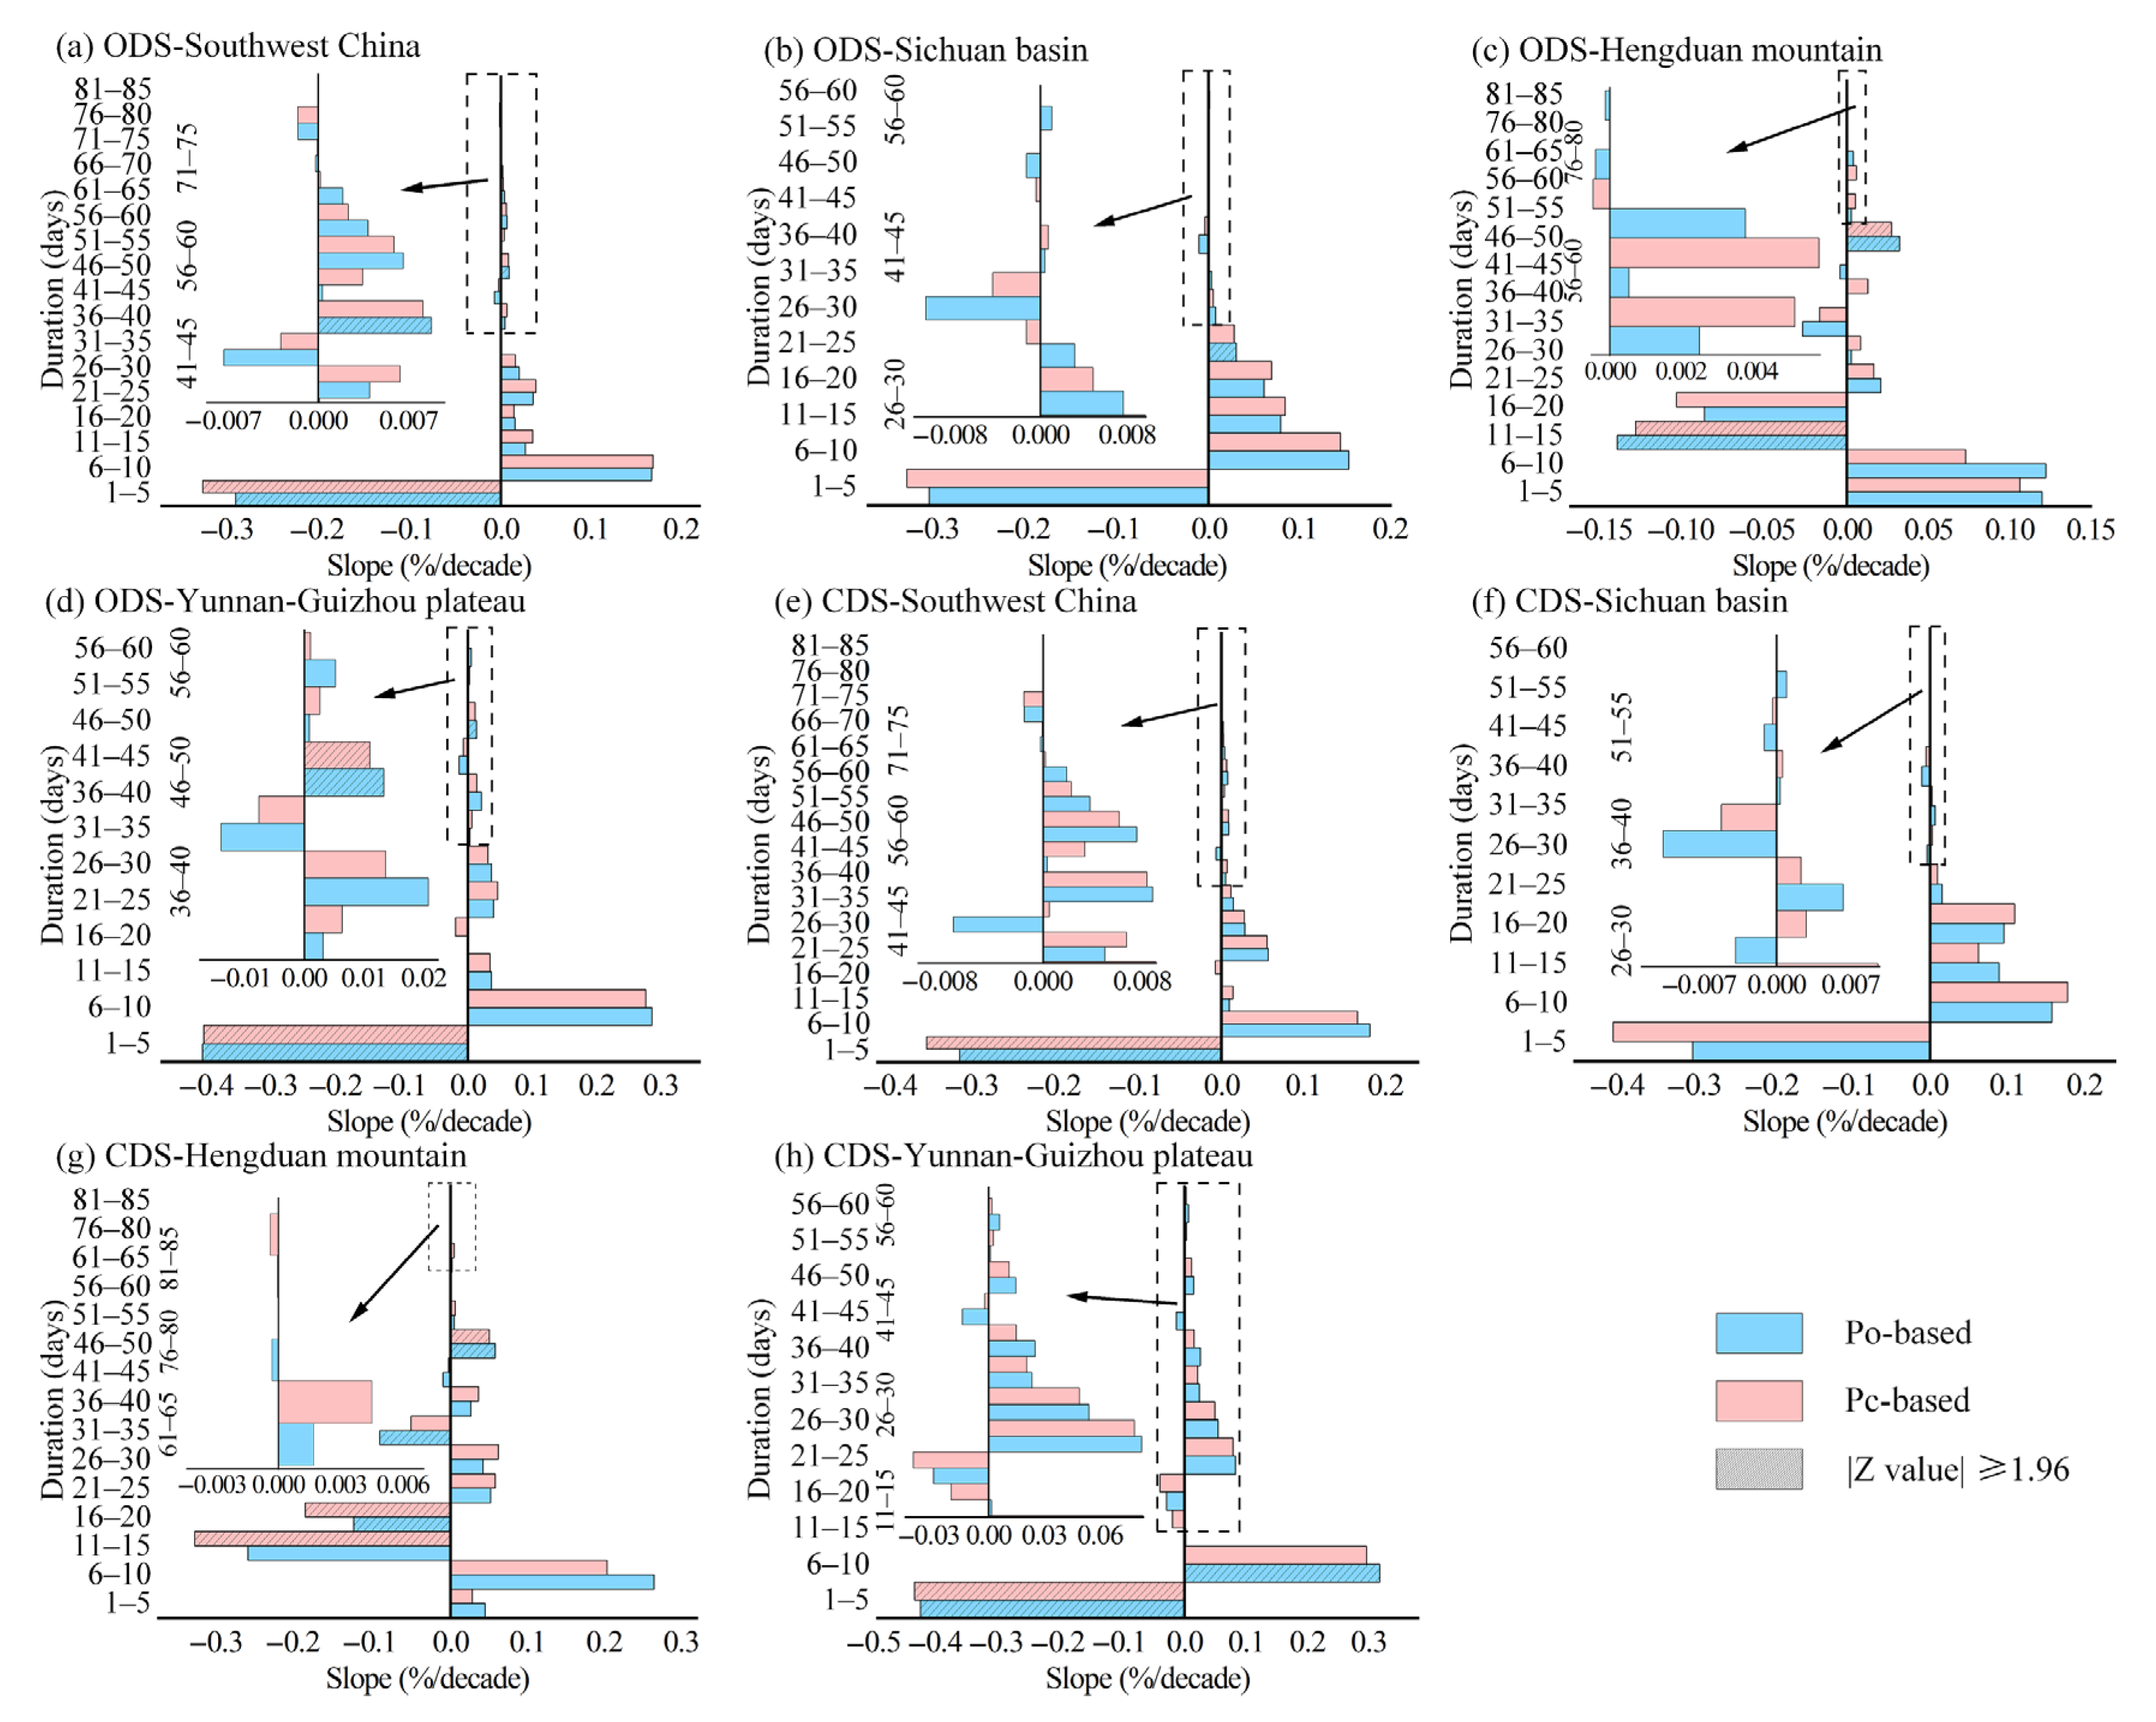
Figure 5 shows the trends in ODS and CDS with different durations of dry spells. As shown in Figure 5a, Po- and Pc-based ODS trends with 1–80-day dry spells were identified. Po- and Pc-based ODS with 1–5-day dry spells and Po-based ODS with 46–50-day dry spells tended to significantly decrease. In the Sichuan Basin (Figure 5b), almost no Po- and Pc-based ODS trends with apparent differences passed the significance test. In the Hengduan Mountains (Figure 5c), Po- and Pc-based ODS with 11–15-day dry spells tended to significantly decrease, but with 46–50-day dry spells they tended to significantly increase. In the Yunnan-Guizhou Plateau (Figure 5d), Po- and Pc-based ODS with 1–5-day dry spells tended to significantly decrease, with 46–50-day dry spells tending to significantly increase. As shown in Figure 5e, Po- and Pc-based CDS with 1–80-day dry spells were identified, but only with 1–5-day dry spells did they pass the significant test. In the Sichuan Masin (Figure 5f), none of the Po- and Pc-based CDS with different duration dry spells passed the significant test. In the Hengduan Mountains (Figure 5g), Po- and Pc-based CDS with 16–20-day dry spells, Pc-based CDS with 11–15-day dry spells, and Po-based CDS with 31–35-day dry spells tended to significantly decrease, while Po- and Pc-based CDS with 46–50-day dry spells tended to significantly increase. In the Yunnan-Guizhou Plateau (Figure 5h), Po- and Pc-based CDS with 1–5-day dry spells tended to significantly decrease, while Po-based CDS with 6–10-day dry spells tended to significantly increase.
3.1.2. Spatial Variability
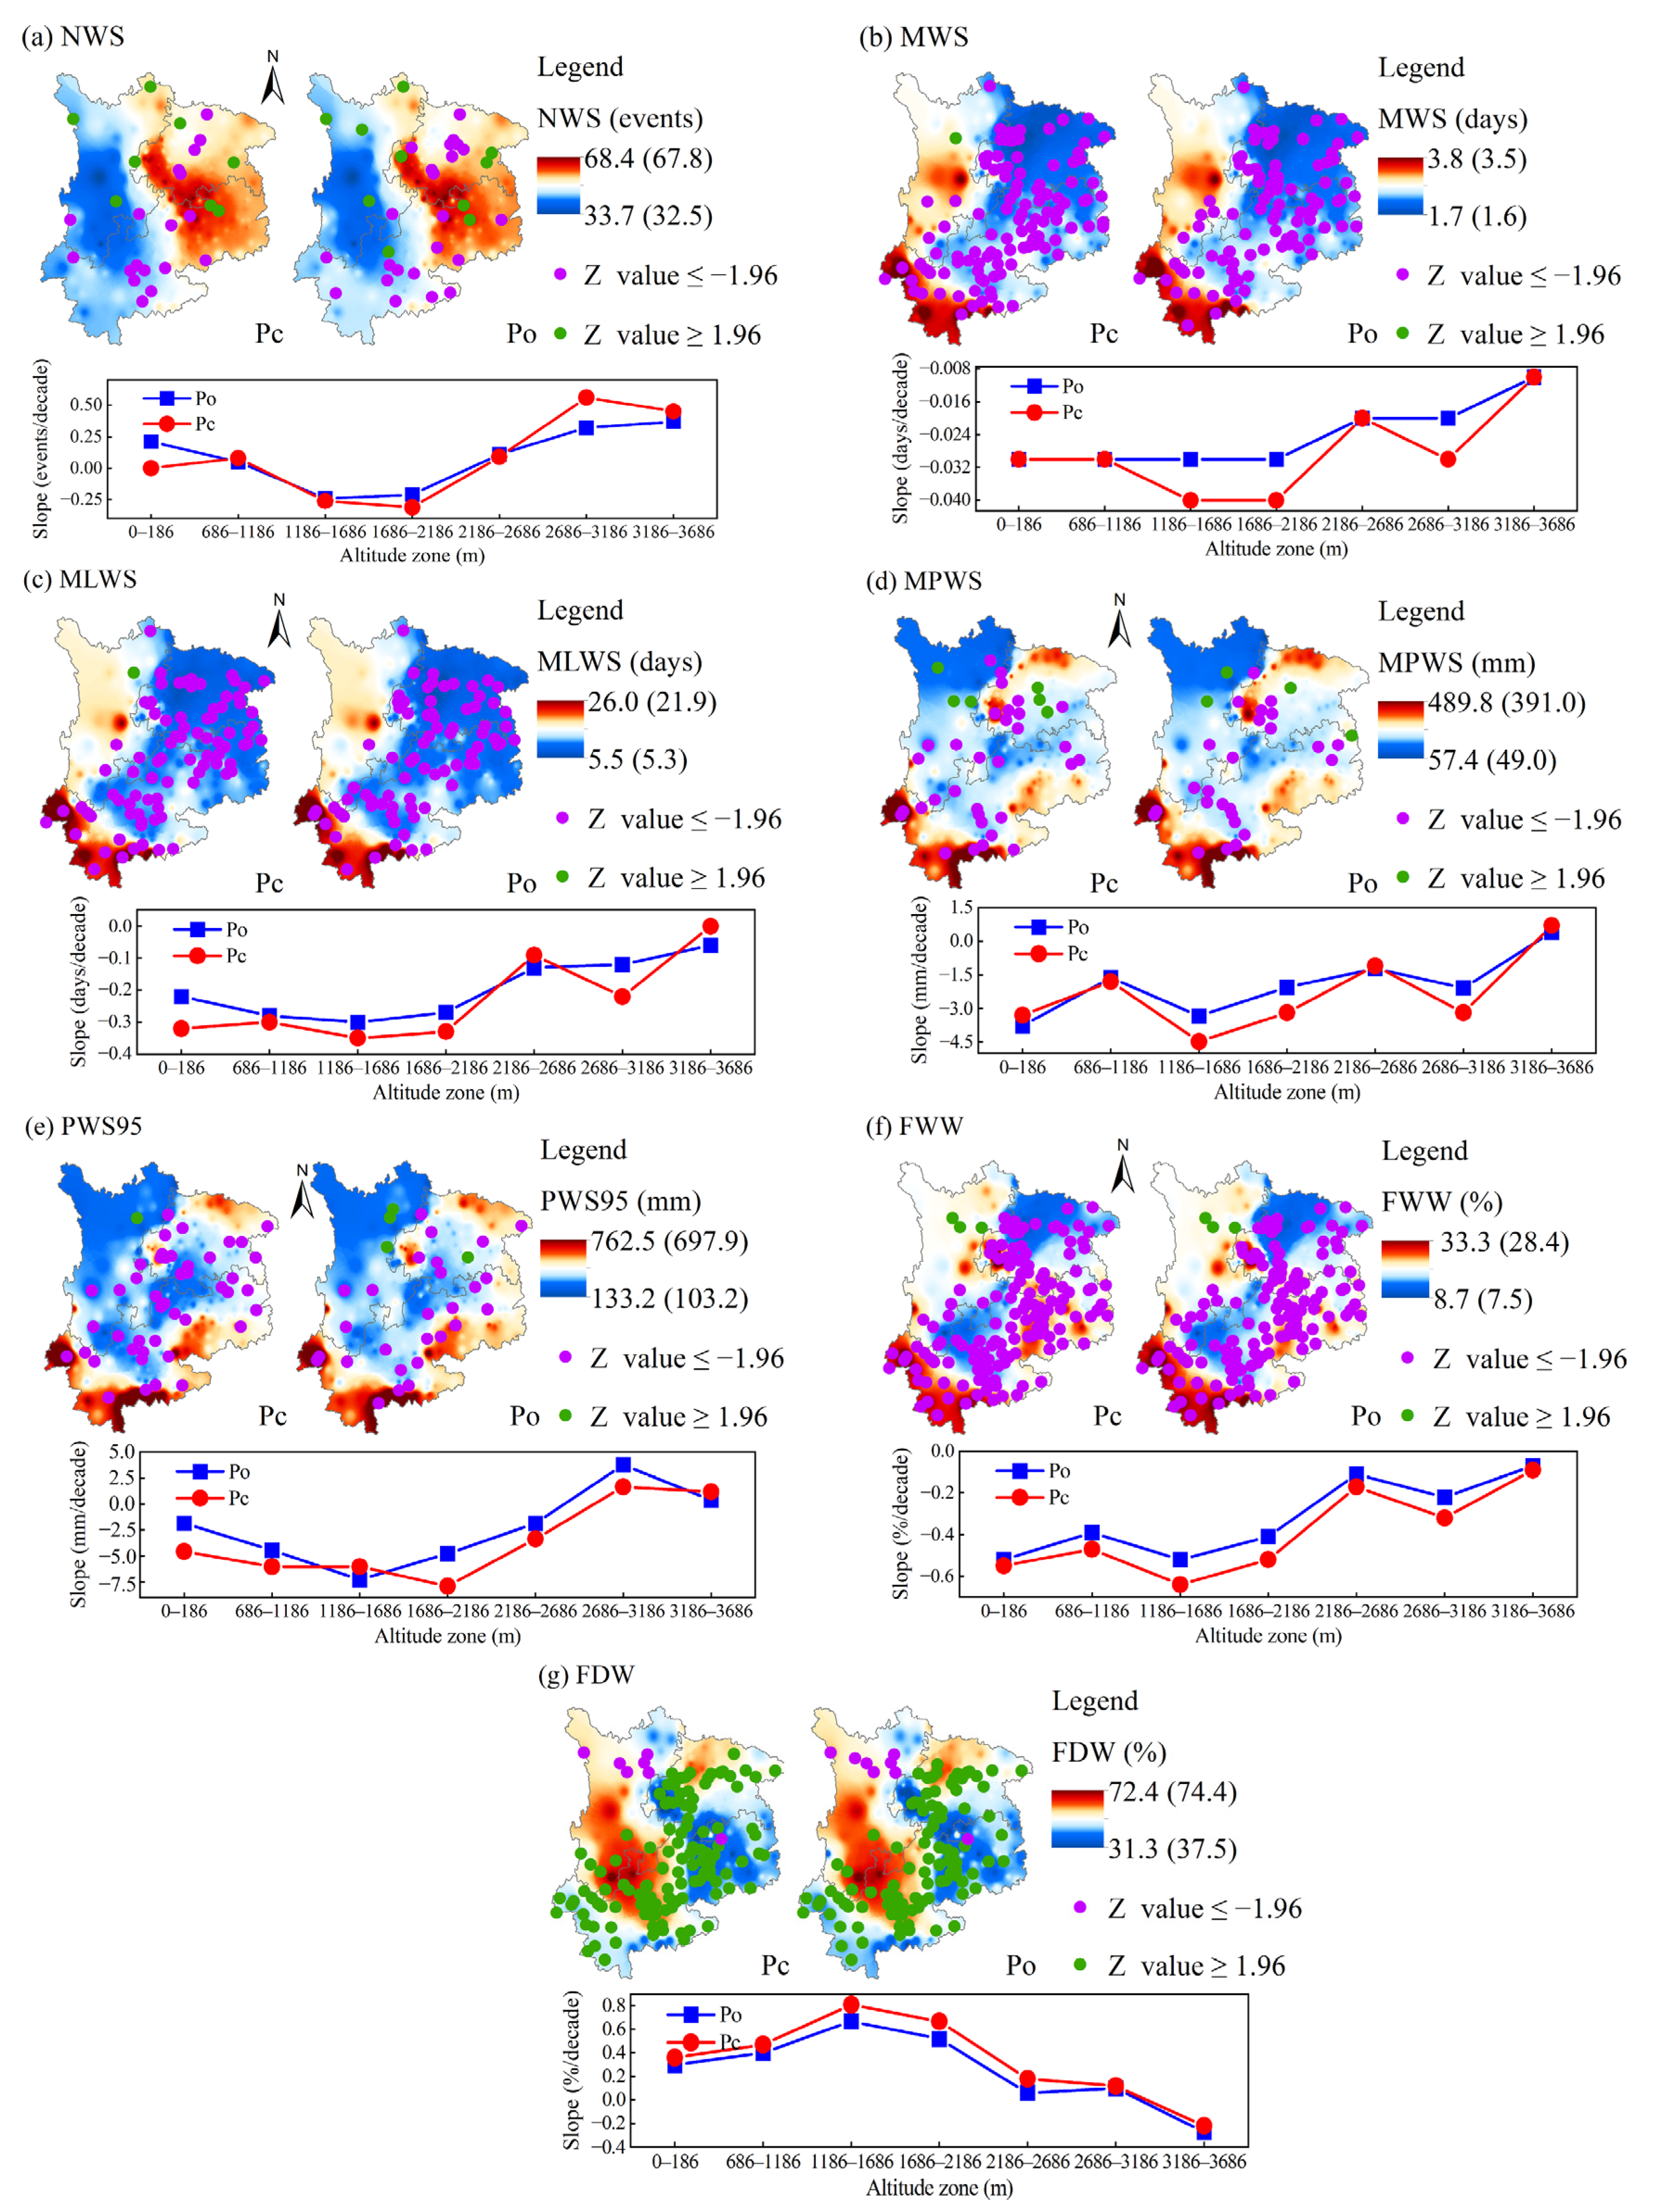
As shown in Figure 6, the spatial distributions of the annual mean wet spell indices identified using Pc were generally consistent with those identified using Po. The MWS generally increased from east to west. MWS and MLWS decreased from west to east. MPWS and PWS95 decreased from southeast to northwest. FWW was higher in the Hengduan Mountains, as well as in the eastern region of the Yunnan-Guizhou Plateau and the southwest edge of Yunnan-Guizhou Plateau, but lower in the Sichuan Basin and the middle of the Yunnan-Guizhou Plateau. FDW was higher in the Hengduan Mountains, northwest Sichuan Basin, and western central Yunnan-Guizhou Plateau, but lower in southwest and east Yunnan-Guizhou Plateau and south Sichuan Basin. Before and after precipitation correction, NWS, MWS, MLWS, MPWS, PWS95, and FWW showed increases at 60.61~91.29% of stations, while the trends at 2.65~21.69% of stations were reversed after precipitation correction; FDW showed decreases at 85.61~88.26% of stations, and about 3.03% of the stations had opposite trends after precipitation correction. After precipitation correction, NWS, MWS, MLWS, MPWS, PWS95, and FWW tended to significantly decrease at 6.82%, 40.91%, 32.2%, 12.12%, 17.05%, and 54.17% of stations, respectively, with differences of −1.89%, 6.06%, 2.65%, 2.65%, 6.82%, and 6.06% compared with Po. FDW tended to significantly decrease at 43.94% of stations, which were mainly located in the Sichuan Basin and Yunnan-Guizhou Plateau, with a difference of 6.82% compared with Po. NWS, MWS, MLWS, MPWS, PWS95, and FWW tended to significantly increase at 3.03%, 0.38%, 0.38%, 2.27%, 0.76%, and 1.14% of stations, with differences of −0.76%, 0.38%, 0.38%, 0.75%, −0.76%, and 0 compared with Po, while FDW tended to significantly decrease at 2.65% of stations, which were concentrated in the northern part of Southwest China and especially in the northern Hengduan Mountains, with a difference of −0.38% compared with Po.
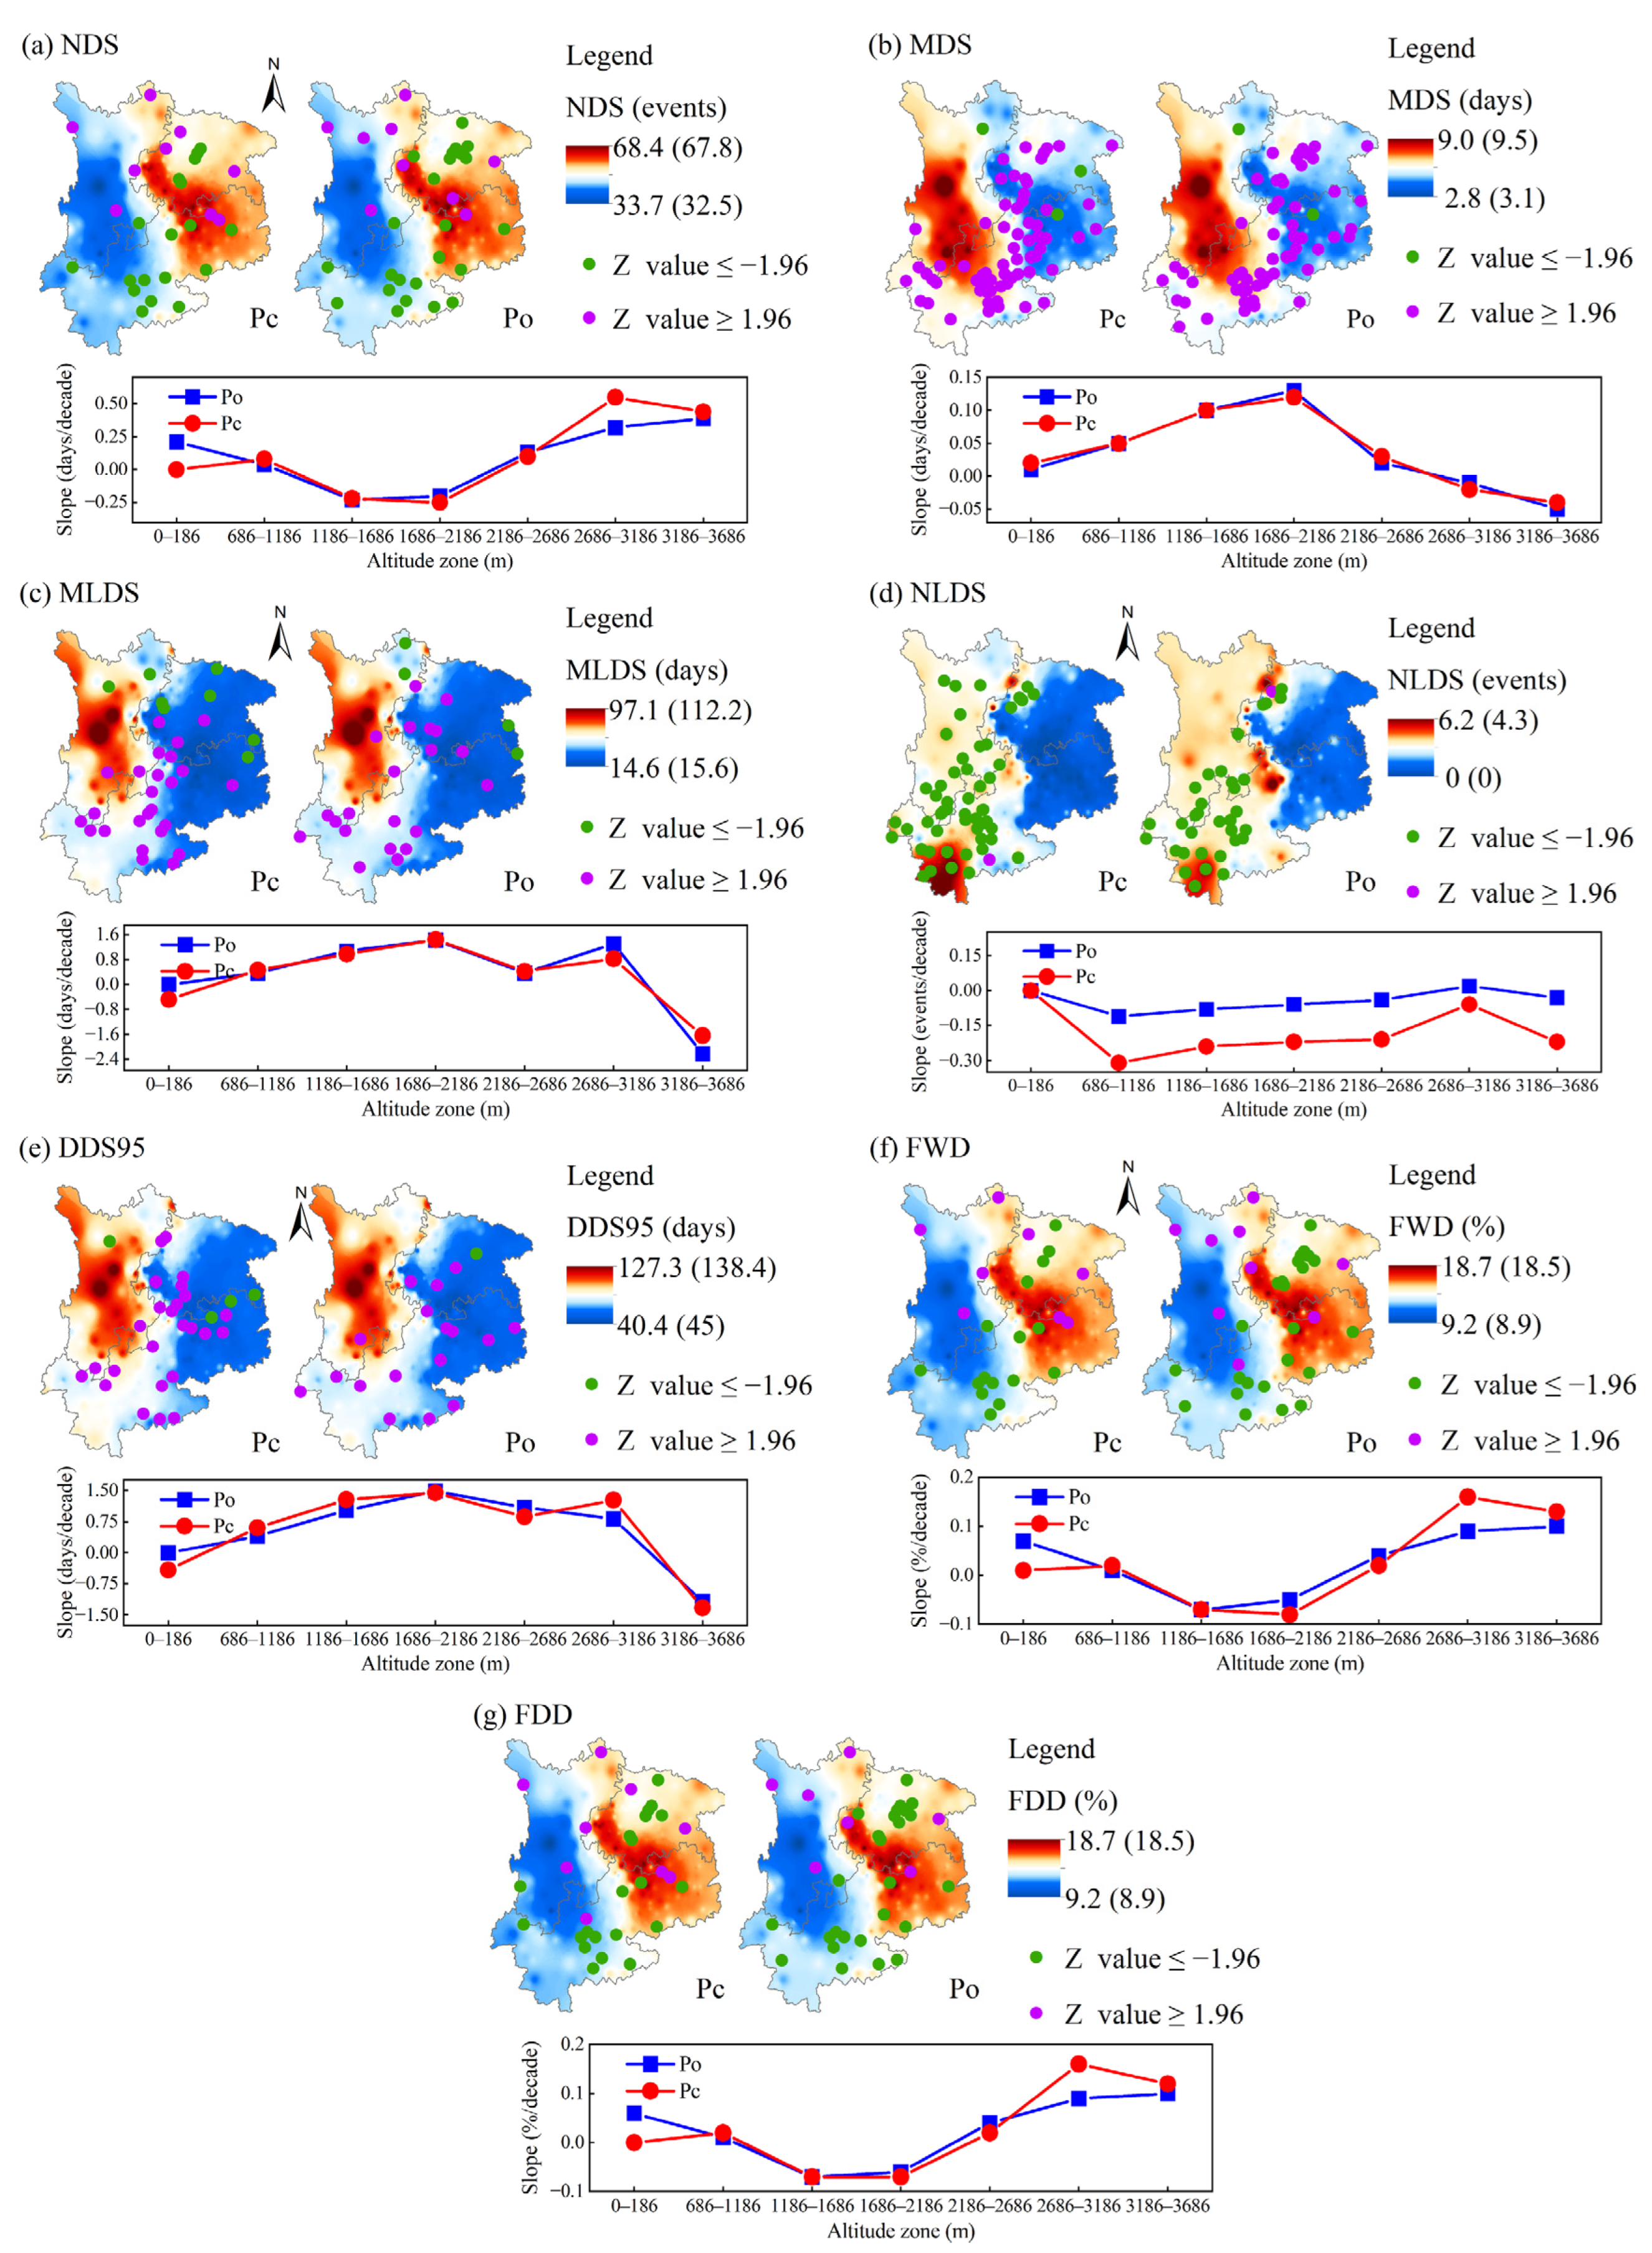
As shown in Figure 7, the spatial distributions of the annual mean dry spell indices identified by Pc were generally consistent with Po: NDS, FWD, and FDD generally showed distributions that decreased from east to west; MDS, MLDS, NLDS, and DDS95 generally showed distributions with high values in the west and low in the east. After precipitation correction, NDS, NLDS, FWD, and FDD showed increases at 59.85~70.08% of stations and decreases at 26.89~38.26% of stations, and the trends at about 12.12~21.97% of stations were reversed compared with Po. MDS, MLDS, and DDS95 showed increases at 62.12~82.58% of stations and decreases at 17.05~34.85% of stations, and the trends at about 6.82~19.69% of stations were reversed compared with Po. After precipitation correction, NDS, FWD, and FDD showed significant decreases at 6.44%, 19.7%, 6.06%, and 7.95% of stations, MDS, MLDS, and DDS95 showed significant increases at 25%, 9.09%, 9.47% of stations, and most of the significantly changed stations were located in the Sichuan Basin and Yunnan-Guizhou Plateau, with differences of −2.65%, −3.03%, −1.9%, 3.03%, 1.14%, and 3.03% compared to Po. Moreover, NDS, FWD, and FDD showed significant increases at 3.41%, 3.03%, and 3.41% of stations, which were concentrated in the northern part of Southwest China, with differences of 0, −0.38%, and 0.76% compared to Po; and MDS, MLDS, and DDS95 showed significant decreases at 1.14%, 3.03%, and 1.52% of stations, which were concentrated in the northeast part of Southwest China, with differences of 0.38%, 1.51%, and 1.14% compared to Po. NLDS was different, 19.7% of stations showed significant decreases, with most concentrated in the Hengduan Mountains and the eastern part of Yunnan-Guizhou Plateau, with an average difference of 7.9% compared with Po; few sites tended to show significant increases.
The trends in wet and dry spell indices were assessed within different altitude ranges (500 m intervals) (Figure 6 and Figure 7). After precipitation correction, the differences in trends of wet/dry spell indices at different altitudes were generally more pronounced. For most wet (except MWS, MLWS, and FWW) and dry (except NLDS) spell indices in the 2186–2686 m or 2686–3186 m altitude ranges, the trends were reversed (i.e., negative to positive or positive to negative) (Figure 6a,d,e,g; Figure 7a–c,e–g). The trends in MWS (NLDS) increased (decreased) initially and then decreased (increased) with altitude; the MLWS (FWW) trends decreased (increased) with altitude (Figure 6b,c,f; Figure 7d).
3.2. Correlations between Wet and Dry Spell Indices and Large-Scale Circulation Indices
3.2.1. Spearman Correlation Analysis
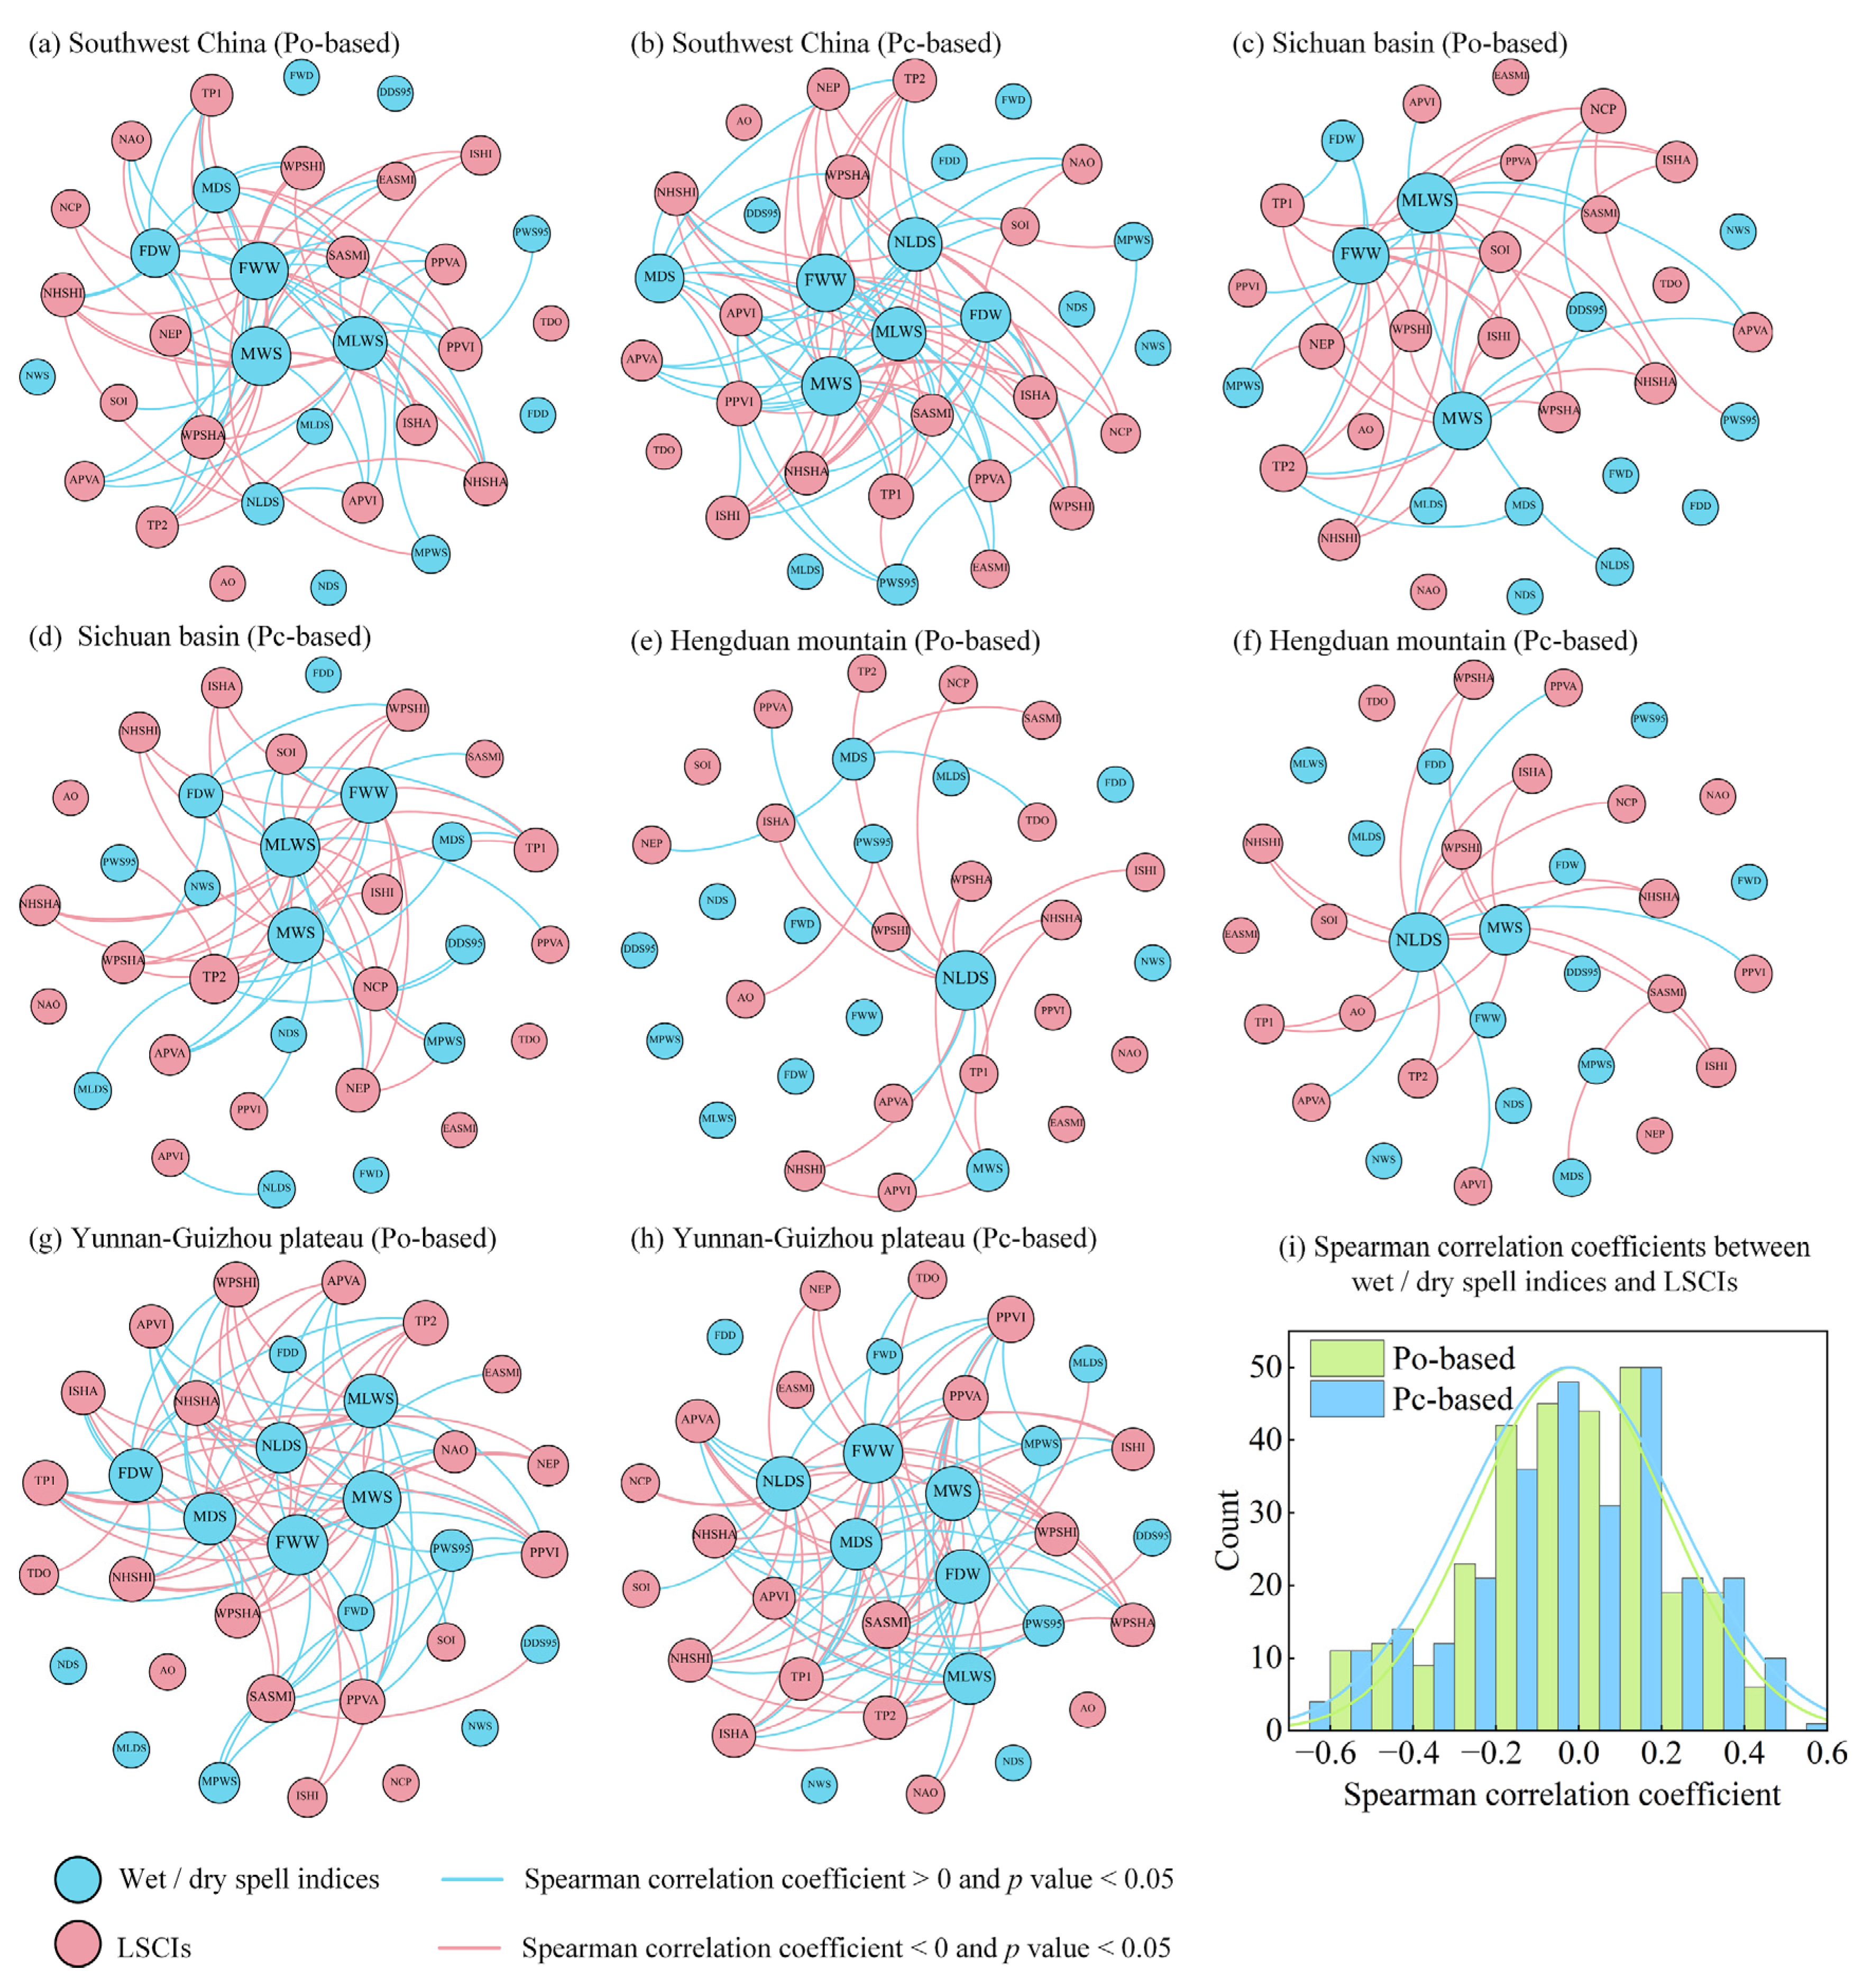
After precipitation correction (Figure 8a,b), MWS, MLWS, FWW, MPWS, PWS95, FWW, FDW, MDS, and NLDS were significantly correlated with at least one large-scale circulation index (LSCI), but NWS, NDS, and MLDS were not. Compared with before precipitation correction, PWS95, FDW, MDS, and NLDS increased by 3, 1, 2, and 9 significantly related LSCIs, respectively, including PPVA, PPVI, TP1, ISHI, ISHA, APVA, TP2, NEP, NCP, and SOI.
In the Sichuan Basin (Figure 8c,d) after precipitation correction, MWS, MLWS, MPWS, PWS95, FWW, FDW, MDS, MLDS, NLDS, and DDS95 were significantly correlated with at least one LSCI, but NWS, NDS, FWD, and FDD were not. Compared with the before precipitation correction, MLWS, MPWS, PWS95, FWW, FDW, MDS, and MLDS increased by 1, 1, 1, 1, 2, 1, and 1, significantly related LSCIs, respectively, which included PPVA, NCP, TP2, APVA, WPSHA, WPSHI, TP1, and TP2. PWS95 deceased by 1 significantly related LSCI (NCP).
In the Hengduan Mountains (Figure 8e,f) after precipitation correction, only MWS, MDS, and NLDS were significantly correlated with at least one LSCI. Compared with before precipitation correction, MWS and NLDS increased by 5 and 1 significantly related LSCIs, including ISHA, ISHI, WPSHI, TP1, TP2, and PPVI; PWS95 and MDS decreased by 1 and 2 significantly related LSCIs, including AO, NEP, and TDO.
In the Yunnan-Guizhou Plateau (Figure 8g,h) after precipitation correction, MWS, MLWS, MPWS, PWS95, FWW, FDW, MDS, MLDS, NLDS, and DDS95 were significantly correlated with at least one LSCI. Compared with before precipitation correction, FWW, FDW, MDS, MLDS, and NLDS increased by 1, 2, 1, 1, and 5 significantly related LSCIs, including NCP, ISHI, PPVA, SASMI, ISHA, APVA, PPVI, and NCP; MWS and NLDS both decreased by 1 significantly related LSCIs, and both were NAO.
In summary, the wet and dry spell indices based on Pc were significantly correlated with more LSCIs compared to those based on Po. This was due to the increased strength of the overall absolute correlation coefficients (i.e., >0.15) of wet and dry spell indices with LSCIs when based on Pc (Figure 8i).
3.2.2. Wavelet Transform Coherence (WTC) and Partial Wavelet Coherence (PWC) Results
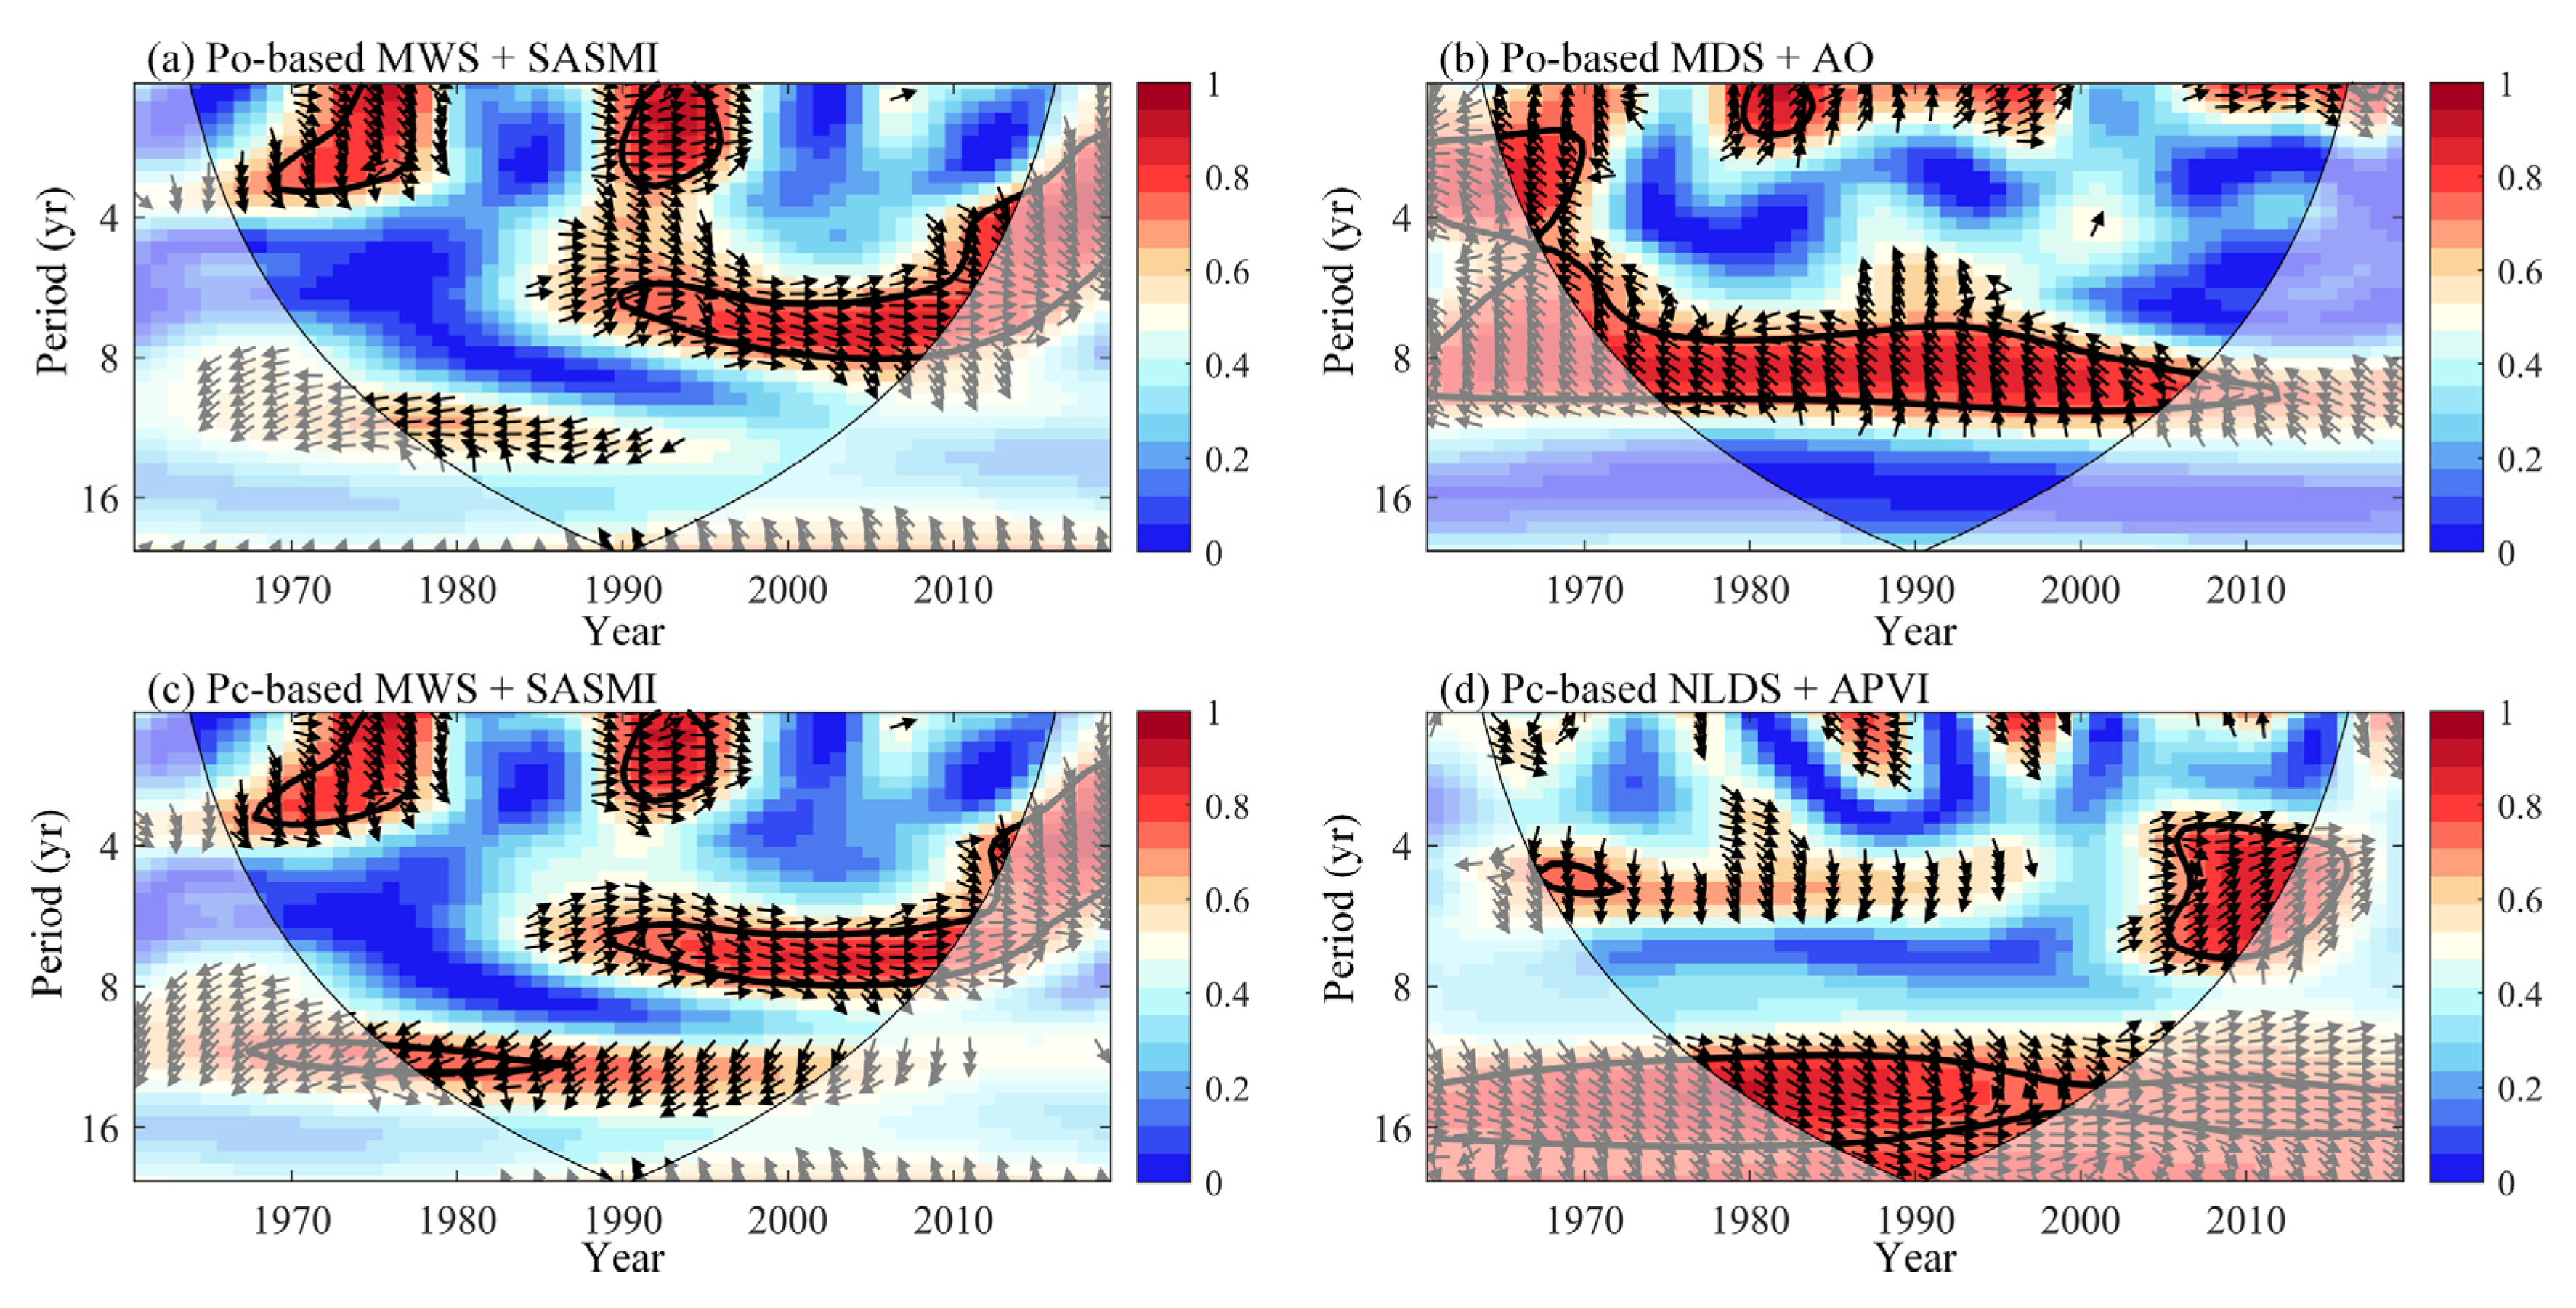
Based on Spearman results, the wet/dry spell indices that were significantly related to the most LSCIs before and after precipitation correction were selected as examples to further analyze the periodic resonance between wet/dry spell indices and LSCIs which shows the highest possible degree of interpretation. Figure 9 shows the WTC results, Po-based MWS + SASMI showed a significant phase-consistent high-energy positive coherence at a period of 2.13~2.2 year between 1969–1996, but it was not continuous, and after 1990 the resonance period was 3.68~7.8 year (Figure 9a). Pc-based MWS + SASMI showed a similar resonance period to Po-based MWS + SASMI, but before 1990 the resonance period was 10.41~12.13 year, additionally (Figure 9c). Po-based MDS + AO showed a negative coherence period of 2.19~4.38 year before 1990 and 5.11~10.41 year during the whole study period (Figure 9b). Pc-based NLDS + APVI showed a positive coherence period of 11.03~18.56 year during the whole study period and 2.75~6.74 year after 2006 (Figure 9d).
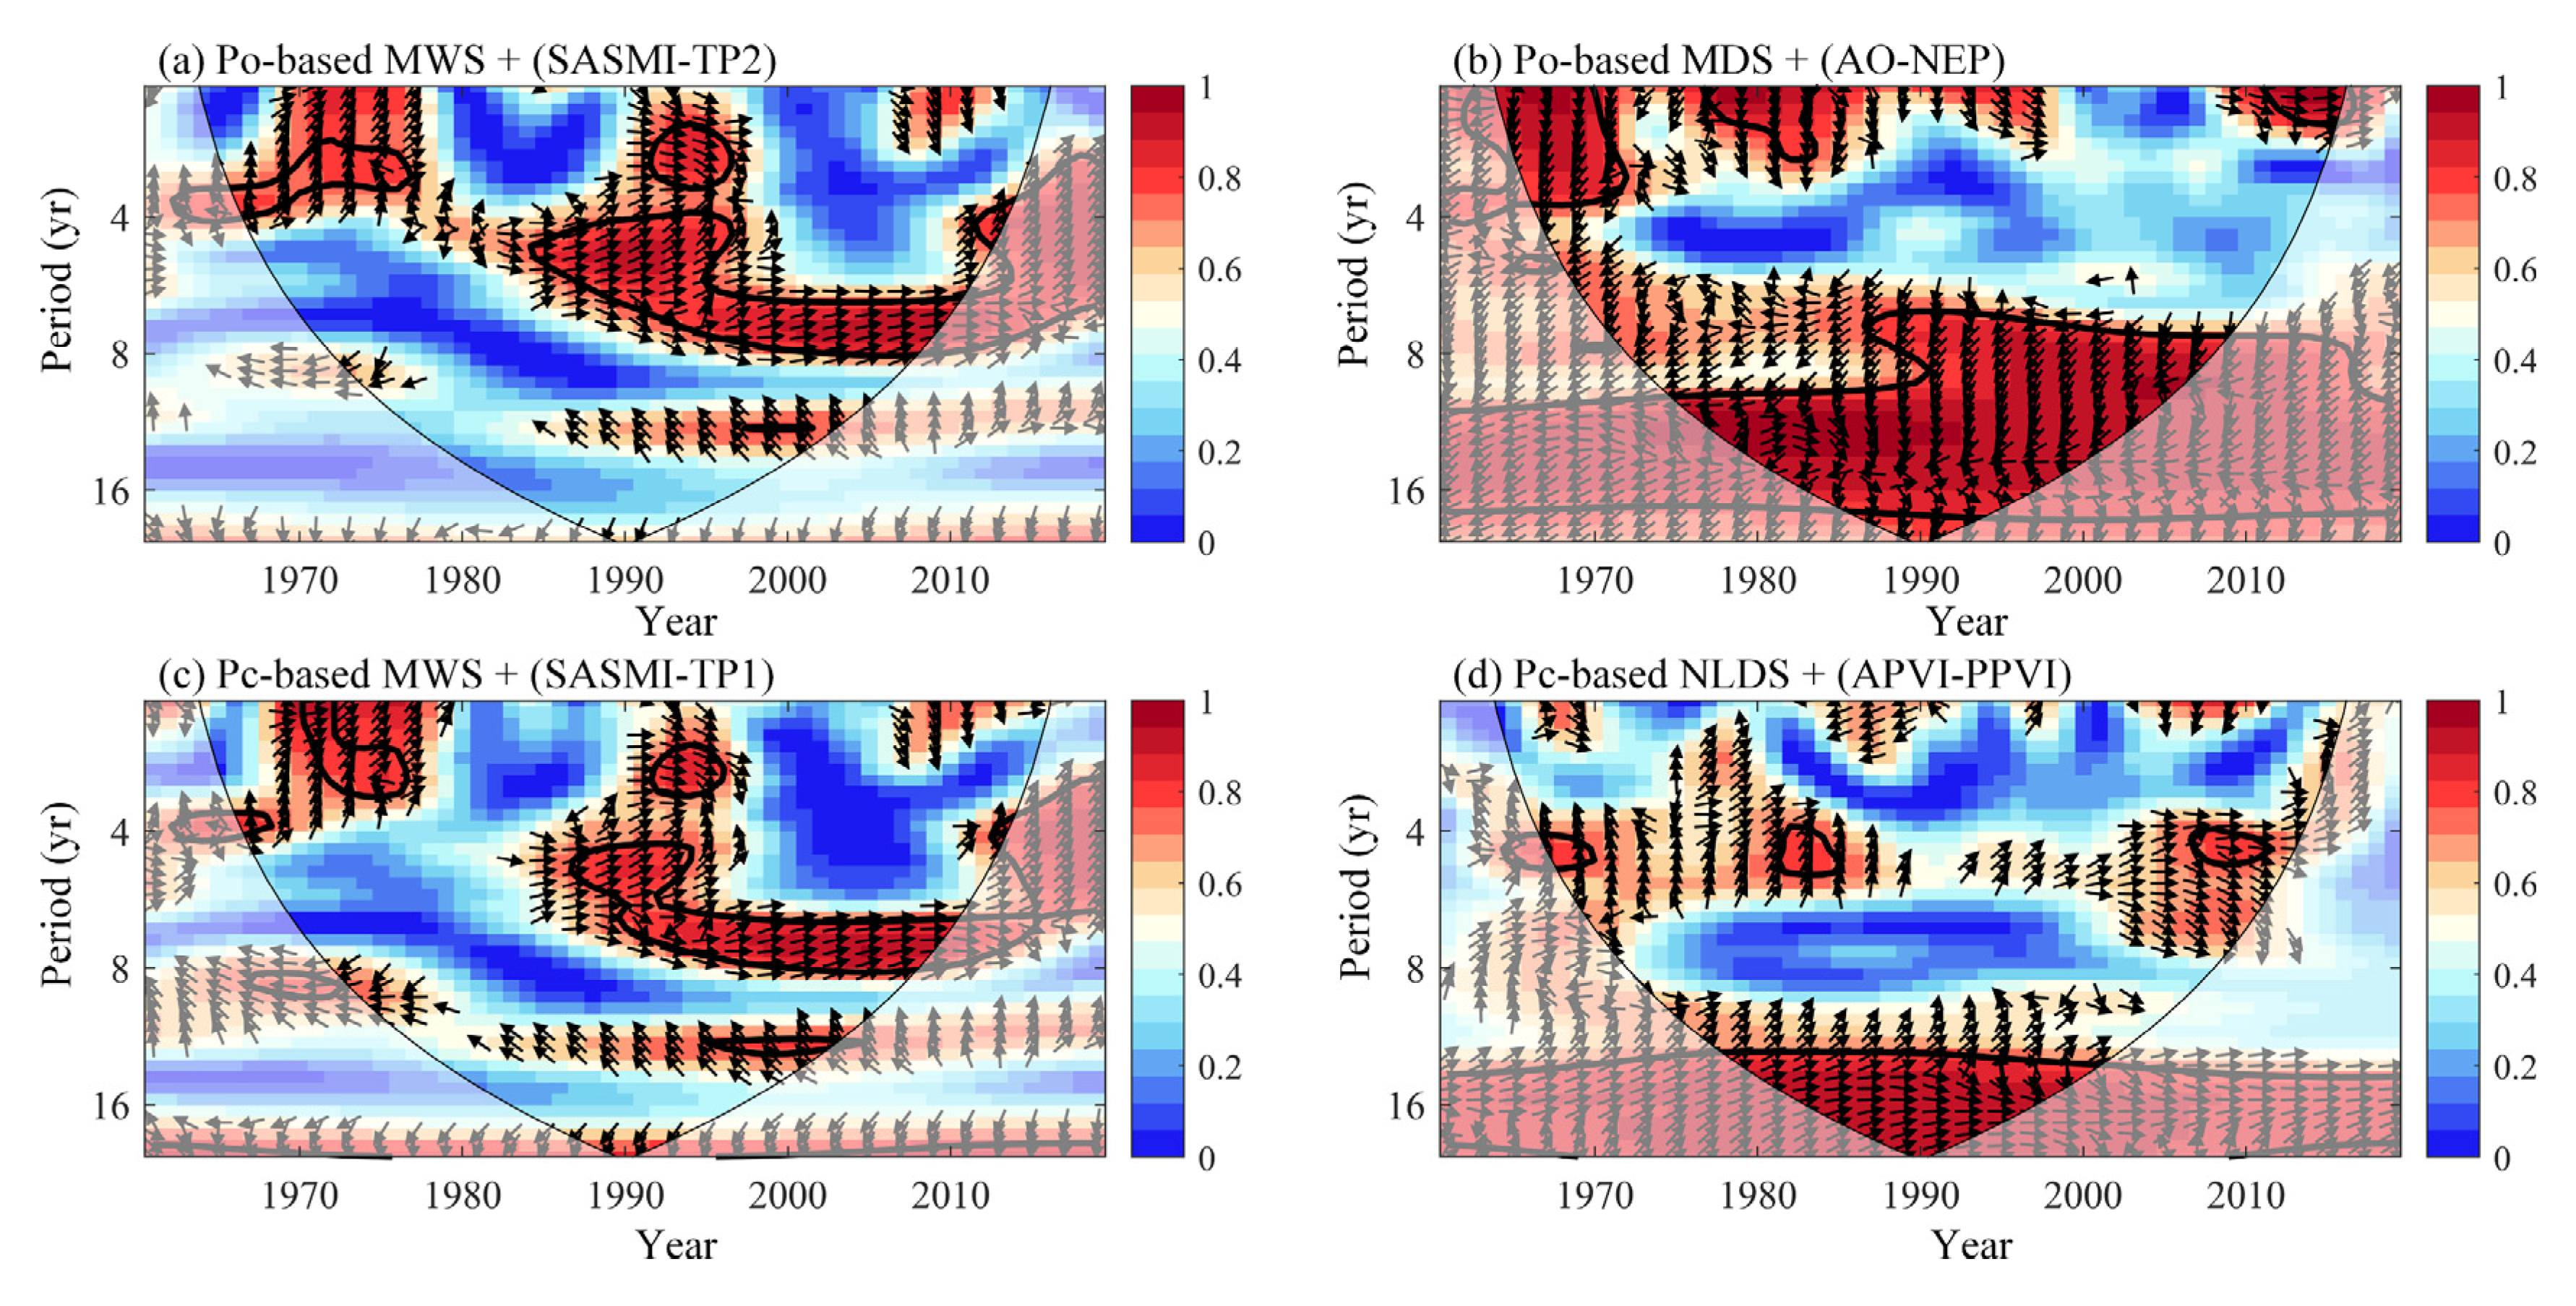
The aforementioned analysis revealed the possible effects of LSCI on wet/dry spell indices via WTC analysis. However, it should be highlighted that their effects may only be apparent because of cross-correlations between the LSCIs themselves [52]; thus, PWC must be used to detect the degree of interpretation of the LSCIs towards the wet/dry spell indices under conditions wherein the partial correlations between LSCIs are eliminated. As shown in Figure 10a, Po-based MWS + (SASMI-TP2; i.e., when the possible influence of TP2 is eliminated from SASMI), Pc-based MWS + (SASMI-TP1), Po-based MDS + (AO-NEP), and Pc-based NLDS + (APVI-PPVI) had the maximum coherence areas. Po-based MWS + (SASMI-TP2) showed a positive coherence at a period of 2.08~2.49 year in 1966–1998, but it was not continuous, and a period of 2.9~7.94 year after 1984. Pc-based MWS + (SASMI-TP1) showed a similar coherence period to Po-based MWS + (SASMI-TP2) (Figure 10c). Po-based MDS + (AO-NEP) showed a negative coherence period of 6.56~18.56 year, and 1.04~2.07 year, but was discontinuous throughout the study period (Figure 10b). Pc-based NLDS + (APVI-PPVI) showed a positive coherence period of 3.9~4.62 year, but it was not continuous and a period of 12.38~19.95 year during the whole time (Figure 10d).
From the observations by Hu et al. [53], eliminating the effects of an additional factor can be considered significant when it results in an >5% increase in the significant coherence area of the wavelet. Only AO was most effective in explaining Po-based MDS when the possible influence of NEP was eliminated (Table 4).
4. Discussion
4.1. Wet and Dry Spells between Original and Corrected Precipitation Data
Previous studies have revealed obvious differences between Po and Pc in terms of change trends, amounts, days, frequencies, and intensities [27,30,31]. Li et al. [24] applied Po and Pc to identify geoclimatic divisions and compared their differences; Yao et al. [26] evaluated the differences in drought degree using Erinc’s index based on Po and Pc and found that the degree of drought was actually reduced in some areas of China after precipitation correction. Clearly, correcting precipitation data for gauge bias can affect the results of climatology and hydrological analyses. However, taking wet/dry spells as the important climatic parameters, the differences between Po- and Pc-based spatiotemporal characteristics of wet/dry spells remain relatively understudied [4,9,11,16,17,19,20,31,32,54,55,56,57]. Our study found that Po- and Pc-based MWS, MLWS, MPWS, PWS95, and FWW and Pc-based NLDS tended to significantly decrease, and Po- and Pc-based FDW and MDS and Pc-based DDS95 tended to significantly increase, while Po- and Pc-based NWS, NDS, FWD, and FDD, and Po-based NLDS showed no significant change, but appeared to decrease, and Po- and Pc-based MLDS and Po-based DDS95 also showed no significant change but appeared to increase. In summary, before and after precipitation correction, the significant trends in wet spell indices were stronger than those of dry spell indices. Pc did change the directions of the trends in wet/dry spell indices at 3.03~21.97% of stations. This was especially true for NLDS and PWS95, indicating that Pc had the most obvious impact on extreme wet/dry spells.
4.2. Correlations of Wet and Dry Spell Indices with Large-Scale Circulation Indices
Po- and Pc-based MWS, MLWS, MPWS, PWS95, FWW, FDW, MDS, and NLDS were all significantly correlated with at least one LSCI. Notably, the correlations between wet/dry spell indices and PPVA, NCP, TP2, APVA, TP1, and TP2 changed from being insignificant to significant after precipitation correction. Furthermore, Po- and Pc-based MWS, Po-based MDS, and Pc-based NLDS were significantly correlated with the most LSCIs and were therefore used for WTC and PWC analysis. SASMI was the best explanatory factor for Po- and Pc-based MWS, AO with NEP influence eliminated was the best explanatory factor for Po-based MDS, and APVI with PPVI influence eliminated was the best explanatory factor for Pc-based NLDS. From the above results, by comparing before and after precipitation correction, it is clear that the responses of wet spell indices to large-scale circulation anomalies can be affected by precipitation gauge bias.
4.3. Limitations and Uncertainties
To ensure uniformity in the precipitation data [58,59], 26 relocated sites (site migration straight-line distance exceeded 20 km or vertical distance exceeded 100 m) were removed, but this may have affected the results by changing of number and density of meteorological stations [31,60,61]. Furthermore, when extending the observation data using automatic stations (in recent years, China has gradually been increasing coverage using automatic weather stations), it is necessary to account for the inclusion of automatic and national stations in further analyses of the differences between Pc and Po in time and space. Meanwhile, the method (i.e., fixed threshold or dynamic threshold) used to distinguish wet/dry days directly affects research results [10,57]. In China, the fixed thresholds of 1 mm and 0.1 mm have been commonly used in precipitation and drought studies [17,19,32,62,63,64]. In this study, considering the ETCCDI recommended standards [65], 1 mm was selected as the threshold for determining wet/dry days. However, the effect of Pc on the trends and structures of wet/dry spell indices under different fixed thresholds or dynamic thresholds will be investigated in the future.
Due to limited space, we only considered the wet and dry spell indices which were significantly related to the most LSCIs as examples when analyzing resonance periods with the LSCIs which showed the highest degree of interpretation towards the wet/dry spell indices. In the future, a comprehensive analysis of the periodic resonance of all wet/dry spell indices and LSCIs, with the influence of LSCI interactions controlled for to more thoroughly examine the effect of precipitation correction.
Finally, we focused on Southwest China as a case study area, but future work will need to expand to the whole of China and include more LSCIs. The effects of all these limitations should be investigated fully to ensure that they are accounted for.
5. Conclusions
Gauge estimates of precipitation have various sources of biases, such as trace precipitation, wetting losses, and wind-induced under-catch. It is necessary to account for these sources of error to more accurately characterize and identify wet and dry spells. Using data from 264 stations throughout Southwest China, we analyzed and compared the spatial and temporal variability in wet and dry spell indices based on Po and Pc data and examined their correlations with LSCIs. The main conclusions were as follows:
(1) The trends in NWS, MWS, MLWS, MPWS, PWS95, FWW, FDW, MDS, MLDS, NLDS, DDS95, and FWD were more pronounced when Pc based than when Po-based; NLDS had the largest change (slope relative error: 351.53%) and MDS had the smallest (slope relative error: 1.49%); Pc-based NDS and FDD showed weaker trends than Po-based, with slope differences of −2.78~−1.54%. Specifically, more than 2.65~7.2% of the stations had significant trends in MWS, MLWS, MPWS, PWS95, FWW, FDW, MDS, MLDS, NLDS, and DDS95 when Pc based. Less than 1.14~3.41% of the stations in Pc-based NWS, NDS, FDD, and FWD significantly changed.
(2) Spearman analysis showed that Pc-based FWW, FDW, MDS, MLDS, and NLDS were significantly correlated with 1~5 more LSCIs than when Po-based, and only Pc-based MWS and NLDS were significantly correlated with one fewer LSCI than when Po-based. Po- and Pc-based MWS, Po-based MDS, and Pc-based NLDS, which were significantly related to the most LSCIs, were selected as examples for further analysis to explore the periodic resonance relationship between the four wet/dry spell indices and the LSCIs. They were chosen to obtain the highest possible degree of interpretation. Without considering the interaction between LSCIs, there was significant periodic resonance with LSCIs and the Po-based MWS, Pc-based MWS, Po-based MDS, and Pc-based NLDS had resonance periods of 3.68~7.80 year, 6.3~7.80 year, 4.75~10.41 year, and 11.03~18.56 year, respectively. Considering the interactions between LSCIs, only AO-NEP significantly improved the interpretation of Po-based MDS, with a resonance period of 6.56~18.56 year.
In summary, due to the superiority of Pc data for capturing and identifying regional wet and dry spells and their relationships with LSCIs, Pc data should always be used in future wet and dry spell–related research.
Author Contributions
Conceptualization, Q.C.; methodology, Q.C.; software, Y.R.; validation, H.J.; formal analysis, Q.C. and Y.R.; writing—original draft preparation, Q.C. and Y.R.; writing—review and editing, Q.C.; visualization, Y.R. All authors have read and agreed to the published version of the manuscript.
Funding
This study was supported by the supported by Yunnan Fundamental Research Projects (grant No. 202201AU070064), Yunnan Innovative Research Team (No.202005AE160017), Strategic Priority Research Program of the Chinese Academy of Sciences (Grant No. XDA20100104).
Data Availability Statement
The data presented in this study are available on request from the corresponding author.
Conflicts of Interest
The authors declare no conflict of interest.
References
- Konapala, G.; Mishra, A.K.; Wada, Y.; Mann, M.E. Climate Change Will Affect Global Water Availability through Compounding Changes in Seasonal Precipitation and Evaporation. Nat. Commun. 2020, 11, 3044. [Google Scholar] [CrossRef]
- Liu, C.; Allan, R.P. Observed and Simulated Precipitation Responses in Wet and Dry Regions 1850–2100. Environ. Res. Lett. 2013, 8, 34002. [Google Scholar] [CrossRef]
- Schurer, A.; Ballinger, A.; Friedman, A.; Hegerl, G. Human Influence Strengthens the Contrast between Tropical Wet and Dry Regions. Environ. Res. Lett. 2020, 15, 104026. [Google Scholar] [CrossRef]
- Wainwright, C.; Allan, R.; Black, E. Consistent Trends in Dry Spell Length in Recent Observations and Future Projections. Geophys. Res. Lett. 2022, 49, e2021GL097231. [Google Scholar] [CrossRef]
- Gobin, A.; Van de Vyver, H. Spatio-Temporal Variability of Dry and Wet Spells and Their Influence on Crop Yields. Agric. For. Meteorol. 2021, 308–309, 108565. [Google Scholar] [CrossRef]
- Thoithi, W.; Blamey, R.; Reason, C. Dry Spells, Wet Days, and Their Trends Across Southern Africa During the Summer Rainy Season. Geophys. Res. Lett. 2021, 48, e2020GL091041. [Google Scholar] [CrossRef]
- Vaittinada-Ayar, P.; Mailhot, A. Evolution of Dry and Wet Spells Under Climate Change Over North-Eastern North America. J. Geophys. Res. Atmos. 2021, 126, e33740. [Google Scholar] [CrossRef]
- Singh, D.; Tsiang, M.; Rajaratnam, B.; Diffenbaugh, N.S. Observed Changes in Extreme Wet and Dry Spells during the South Asian Summer Monsoon Season. Nat. Clim. Chang. 2014, 4, 456–461. [Google Scholar] [CrossRef]
- Zolina, O.; Simmer, C.; Belyaev, K.; Gulev, S.; Koltermann, K. Changes in the Duration of European Wet and Dry Spells during the Last 60 Years. J. Clim. 2022, 26, 5943. [Google Scholar] [CrossRef]
- Rivoire, P.; Tramblay, Y.; Neppel, L.; Hertig, E.; Vicente-Serrano, S. Impact of the Dry Day Definition on Mediterranean Extreme Dry Spells Analysis. Nat. Hazards Earth Syst. Sci. Discuss. 2019, 19, 1629–1638. [Google Scholar] [CrossRef] [Green Version]
- Espinoza, J.; Segura, H.; Ronchail, J.; Drapeau, G.; Gutierrez-Cori, O. Evolution of Wet- and Dry-Day Frequency in the Western Amazon Basin: Relationship with Atmospheric Circulation and Impacts on Vegetation. Water Resour. Res. 2016, 52, 8546–8560. [Google Scholar] [CrossRef] [Green Version]
- Rademacher-Schulz, C.; Schraven, B.; Mahama, E.S. Time Matters: Shifting Seasonal Migration in Northern Ghana in Response to Rainfall Variability and Food Insecurity. Clim. Dev. 2014, 6, 46–52. [Google Scholar] [CrossRef] [Green Version]
- Singh, N.; Ranade, A. The Wet and Dry Spells across India during 1951–2007. J. Hydrometeorol. 2010, 11, 26–45. [Google Scholar] [CrossRef]
- Wu, X.; Yang, D.; Shang, K. Temporal and Spatial Characteristic of Rainless Days in Mainland China in Recent 50 Years. Arid L. Geogr. 2011, 34, 596–603. [Google Scholar] [CrossRef]
- Zhang, Q.; Singh, V.; Li, J.; Chen, X. Analysis of the Periods of Maximum Consecutive Wet Days in China. J. Geophys. Res. 2011, 116, D23106. [Google Scholar] [CrossRef]
- Cheng, Q.; Gao, L.; Zuo, X.; Zhong, F. Statistical Analyses of Spatial and Temporal Variabilities in Total, Daytime, and Nighttime Precipitation Indices and of Extreme Dry/Wet Association with Large-Scale Circulations of Southwest China, 1961–2016. Atmos. Res. 2019, 219, 166–182. [Google Scholar] [CrossRef]
- Zeng, Z.; Sun, J. Decadal Change of Extreme Consecutive Dry Days in Spring over the Middle and Lower Reaches of the Yangtze River around the Early 2000s: The Synergistic Effect of Mega-El Niño/Southern Oscillation, Atlantic Multidecadal Oscillation, and Arctic Sea Ice. Atmos. Res. 2021, 266, 105936. [Google Scholar] [CrossRef]
- Zhang, Q.; Singh, V.; Peng, J.; Chen, Y.; Li, J. Spatial-Temporal Changes of Precipitation Structure across the Pearl River Basin, China. J. Hydrol. 2012, 440–441, 113–122. [Google Scholar] [CrossRef]
- Huang, J.; Chen, X.; Xue, Y.; Lin, J.; Zhang, J. Changing Characteristics of Wet/Dry Spells during 1961–2008 in Sichuan Province, Southwest China. Theor. Appl. Climatol. 2017, 127, 129–141. [Google Scholar] [CrossRef]
- Wang, Y.; Gao, R.; Wang, X.; Duan, L.; Liu, T.; Li, D. Long-Term Spatiotemporal Variability in Occurrences of Wet and Dry Days across South Mongolian Plateau. Atmos. Res. 2021, 262, 105795. [Google Scholar] [CrossRef]
- Liu, G.; Wu, R. Spatial and Temporal Characteristics of Summer Precipitation Events Spanning Different Numbers of Days over Asia. Int. J. Climatol. 2015, 36, 2288–2302. [Google Scholar] [CrossRef]
- Osei, M.; Amekudzi, L.; Quansah, E. Characterisation of Wet and Dry Spells and Associated Atmospheric Dynamics at the Pra River Catchment of Ghana, West Africa. J. Hydrol. Reg. Stud. 2021, 34, 100801. [Google Scholar] [CrossRef]
- Groisman, P.Y.; Koknaeva, V.V.; Belokrylova, T.A.; Karl, T.R. Overcoming Biases of Precipitation Measurement: A History of the USSR Experience. Bull. Am. Meteorol. Soc. 1991, 72, 1725–1733. [Google Scholar] [CrossRef]
- Li, N.; Li, Y.; Yao, N. Bias Correction of the Observed Daily Precipitation and Re-Division of Climatic Zones in China. Int. J. Climatol. 2018, 38, 3369–3387. [Google Scholar] [CrossRef]
- Nitu, R.; Roulet, Y.A.; Wolff, M.; Earle, M.E.; Reverdin, A.; Smith, C.D.; Kochendorfer, J.; Morin, S.; Rasmussen, R.; Wong, K.; et al. WMO Solid Precipitation Intercomparison Experiment (SPICE) (2012–2015); WMO: Geneva, Switzerland, 2018. [Google Scholar]
- Yao, N.; Li, Y.; Li, N.; Yang, D.; Ayantobo, O.O. Bias Correction of Precipitation Data and Its Effects on Aridity and Drought Assessment in China over 1961–2015. Sci. Total Environ. 2018, 639, 1015–1027. [Google Scholar] [CrossRef]
- Zhang, Y.; Ren, Y.; Ren, G.; Wang, G. Bias Correction of Gauge Data and Its Effect on Precipitation Climatology over Mainland China. J. Appl. Meteorol. Climatol. 2019, 58, 2177–2196. [Google Scholar] [CrossRef]
- Ostad-Ali-Askari, K. Investigation of Meteorological Variables on Runoff Archetypal Using SWAT: Basic Concepts and Fundamentals. Appl. Water Sci. 2022, 12, 177. [Google Scholar] [CrossRef]
- Abedi-Koupai, J.; Dorafshan, M.-M.; Javadi, A.; Ostad-Ali-Askari, K. Estimating Potential Reference Evapotranspiration Using Time Series Models (Case Study: Synoptic Station of Tabriz in Northwestern Iran). Appl. Water Sci. 2022, 12, 212. [Google Scholar] [CrossRef]
- Ding, Y.; Yang, D.; Ye, B.; Wang, N. Effects of Bias Correction on Precipitation Trend over China. J. Geophys. Res. 2007, 112, D13116. [Google Scholar] [CrossRef]
- Zhang, Y.; Ren, Y.; Ren, G.; Wang, G. Precipitation Trends Over Mainland China From 1961–2016 After Removal of Measurement Biases. J. Geophys. Res. Atmos. 2020, 125, e2019JD031728. [Google Scholar] [CrossRef]
- Zeng, Z.; Sun, J. Characteristics of Spring Consecutive Dry Days with Different Durations across China Based on the Objective Zoning Approach. Atmos. Sci. Lett. 2021, 22, e1035. [Google Scholar] [CrossRef]
- Zhao, D.; Zhang, J.; Deng, S.; Guo, C. Spatio-Temporal Characteristics of Drought-Flood Abrupt Alternation in Southwest China from 1960 to 2018. Sci. Geogr. Sin. 2021, 41, 2222–2231. [Google Scholar]
- Cao, C.X.; Zhao, J.; Gong, P.; Ma, G.R.; Bao, D.M.; Tian, K.; Tian, R.; Niu, Z.G.; Zhang, H.; Xu, M.; et al. Wetland Changes and Droughts in Southwestern China. Geomat. Nat. Hazards Risk 2012, 3, 79–95. [Google Scholar] [CrossRef]
- Yin, L.; Dai, E.; Zheng, D.; Wang, Y.; Ma, L.; Tong, M. Spatio-Temporal Analysis of the Human Footprint in the Hengduan Mountain Region: Assessing the Effectiveness of Nature Reserves in Reducing Human Impacts. J. Geogr. Sci. 2020, 30, 1140–1154. [Google Scholar] [CrossRef]
- Mokhtar, A.; He, H.; Alsafadi, K.; Li, Y.; Zhao, H.; Keo, S.; Bai, C.; Abuarab, M.; Zhang, C.; Elbagoury, K.; et al. Evapotranspiration as a Response to Climate Variability and Ecosystem Changes in Southwest, China. Environ. Earth Sci. 2020, 79, 312. [Google Scholar] [CrossRef]
- Zhang, M.; He, J.; Wang, B.; Wang, S.; Li, S.; Liu, W.; Ma, X. Extreme Drought Changes in Southwest China from 1960 to 2009. J. Geogr. Sci. 2013, 23, 3–16. [Google Scholar] [CrossRef]
- Jiang, S.; Smettem, K.; Wang, T. Climate and Land Use Influences on Changing Spatiotemporal Patterns of Mountain Vegetation Cover in Southwest China. Ecol. Indic. 2021, 121, 107193. [Google Scholar] [CrossRef]
- An, N.; Zuo, Z. Changing Structures of Summertime Heatwaves over China during 1961–2017. Sci. China Earth Sci. 2021, 64, 1242–1253. [Google Scholar] [CrossRef]
- Zhang, X.; Hegerl, G.; Zwiers, F.; Kenyon, J. Avoiding Inhomogeneity in Percentile-Based Indices of Temperature Extremes. J. Clim. 2005, 18, 1641–1651. [Google Scholar] [CrossRef] [Green Version]
- Deni, S.M.; Jemain, A.A. Fitting the Distribution of Dry and Wet Spells with Alternative Probability Models. Meteorol. Atmos. Phys. 2009, 104, 13–27. [Google Scholar] [CrossRef]
- Sevruk, B. Method of Correction for Systematic Error in Point Precipitation Measurement for Operational Use; WMO: Geneva, Switzerland, 1982; ISBN 978-92-63-10589-9. [Google Scholar]
- Ye, B.; Yang, D.; Ding, Y.; Han, T.; Koike, T. A Bias-Corrected Precipitation Climatology for China. J. Hydrol. 2004, 5, 1147–1160. [Google Scholar] [CrossRef]
- Hamed, K.H.; Rao, A.R. A Modified Mann-Kendall Trend Test for Autocorrelated Data. J. Hydrol. 1998, 204, 182–196. [Google Scholar] [CrossRef]
- Theil, H. A Rank-Invariant Method of Linear and Polynomial Regression Analysis BT-Henri Theil’s Contributions to Economics and Econometrics: Econometric Theory and Methodology. In Henri Theil’s Contributions to Economics and Econometrics; Raj, B., Koerts, J., Eds.; Springer: Dordrecht, The Netherlands, 1992; pp. 345–381. ISBN 978-94-011-2546-8. [Google Scholar]
- Kruskal, W.H. Ordinal Measures of Association. J. Am. Stat. Assoc. 1958, 53, 814–861. [Google Scholar] [CrossRef]
- Hu, W.; Si, B. Technical Note: Improved Partial Wavelet Coherency for Understanding Scale-Specific and Localized Bivariate Relationships in Geosciences. Hydrol. Earth Syst. Sci. 2021, 25, 321–331. [Google Scholar] [CrossRef]
- Torrence, C.; Compo, G.P. A Practical Guide to Wavelet Analysis. Bull. Am. Meteorol. Soc. 1998, 79, 61–78. [Google Scholar] [CrossRef]
- Grinsted, A.; Moore, J.C.; Jevrejeva, S. Application of the Cross Wavelet Transform and Wavelet Coherence to Geophysical Time Series. Nonlinear Process. Geophys. 2004, 11, 561–566. [Google Scholar] [CrossRef]
- Grinsted, A.; Jevrejeva, S.; Moore, J. Influence of the Arctic Oscillation and ENSO on Ice Conditions in the Baltic Sea: The Wavelet Approach. J. Geophys. Res. 2003, 108, D214677. [Google Scholar] [CrossRef] [Green Version]
- Ng, E.K.W.; Chan, J.C.L. Geophysical Applications of Partial Wavelet Coherence and Multiple Wavelet Coherence. J. Atmos. Ocean. Technol. 2012, 29, 1845–1853. [Google Scholar] [CrossRef]
- Song, X.; Zhang, C.; Zhang, J.; Zou, X.; Mo, Y.; Tian, Y. Potential Linkages of Precipitation Extremes in Beijing-Tianjin-Hebei Region, China, with Large-Scale Climate Patterns Using Wavelet-Based Approaches. Theor. Appl. Climatol. 2020, 141, 1251–1269. [Google Scholar] [CrossRef]
- Hu, W.; Si, B.C.; Biswas, A.; Chau, H.W. Temporally Stable Patterns but Seasonal Dependent Controls of Soil Water Content: Evidence from Wavelet Analyses. Hydrol. Process. 2017, 31, 3697–3707. [Google Scholar] [CrossRef]
- Duan, Y.; Ma, Z.; Yang, Q. Characteristics of Consecutive Dry Days Variations in China. Theor. Appl. Climatol. 2017, 130, 701–709. [Google Scholar] [CrossRef] [Green Version]
- Irannezhad, M.; Liu, J.; Chen, D. Extreme Precipitation Variability Across the Lancang-Mekong River Basin during 1952-2015 in Relation to Teleconnections and Summer Monsoons. Int. J. Climatol. 2021, 42, 2614–2638. [Google Scholar] [CrossRef]
- Mandapaka, P.; Qin, X.; Lo, E. Seasonal and Interannual Variability of Wet and Dry Spells over Two Urban Regions in the Western Maritime Continent. J. Hydrometeorol. 2016, 17, 1579–1600. [Google Scholar] [CrossRef]
- Raymond, F.; Ullmann, A.; Tramblay, Y.; Drobinski, P.; Camberlin, P. Evolution of Mediterranean Extreme Dry Spells during the Wet Season under Climate Change. Reg. Environ. Chang. 2019, 19, 2339–2351. [Google Scholar] [CrossRef]
- Alexandersson, H. A Homogeneity Test Applied to Precipitation Data. Int. J. Climatol. 1986, 6, 661–675. [Google Scholar] [CrossRef]
- Reeves, J.; Chen, J.; Wang, X.; Lund, R.; Lu, Q. A Review and Comparison of Changepoint Detection Techniques for Climate Data. J. Appl. Meteorol. Climatol. 2007, 46, 900–915. [Google Scholar] [CrossRef]
- He, Y.; Wang, K. Contrast Patterns and Trends of Lapse Rates Calculated from Near-Surface Air and Land Surface Temperatures in China from 1961 to 2014. Sci. Bull. 2020, 65, 1217–1224. [Google Scholar] [CrossRef]
- Shope, C.L.; Maharjan, G.R. Modeling Spatiotemporal Precipitation: Effects of Density, Interpolation, and Land Use Distribution. Adv. Meteorol. 2015, 2015, 174196. [Google Scholar] [CrossRef] [Green Version]
- Greve, P.; Seneviratne, S.I. Assessment of Future Changes in Water Availability and Aridity. Geophys. Res. Lett. 2015, 42, 5493–5499. [Google Scholar] [CrossRef] [Green Version]
- Huang, J.; Liu, F.; Xue, Y.; Sun, S. The Spatial and Temporal Analysis of Precipitation Concentration and Dry Spell in Qinghai, Northwest China. Stoch. Environ. Res. Risk Assess. 2015, 29, 1403–1411. [Google Scholar] [CrossRef]
- Wu, G.; Li, Y.; Li, T.; Ma, Z.; Shi, C. The Unevenness in Observed Daily Precipitation in Mainland China. Theor. Appl. Climatol. 2021, 146, 1031–1041. [Google Scholar] [CrossRef]
- Zhang, K.; Pan, S.; Cao, L.; Wang, Y.; Zhao, Y.; Zhang, W. Spatial Distribution and Temporal Trends in Precipitation Extremes over the Hengduan Mountains Region, China, from 1961 to 2012. Quat. Int. 2014, 349, 346–356. [Google Scholar] [CrossRef]
Figure 1.
The locational distribution of weather stations in Southwest China.

Figure 2.
Occurrences (OWS, a–d) and fractional contributions (CWS, e–h) of wet spells of different durations using corrected (Pc) and original (Po) precipitation data during 1961–2019 in Southwest China.
Figure 2.
Occurrences (OWS, a–d) and fractional contributions (CWS, e–h) of wet spells of different durations using corrected (Pc) and original (Po) precipitation data during 1961–2019 in Southwest China.

Figure 3.
Slope in the occurrence (OWS, a–d) and fractional contributions (CWS, e–h) of wet spells using corrected (Pc) and original (Po) precipitation data during 1961–2019 in Southwest China.
Figure 3.
Slope in the occurrence (OWS, a–d) and fractional contributions (CWS, e–h) of wet spells using corrected (Pc) and original (Po) precipitation data during 1961–2019 in Southwest China.

Figure 4.
Occurrences (ODS, a–d) and fractional contributions (CDS, e–h) of dry spells of different durations for corrected (Pc) and original (Po) precipitation data during 1961–2019 in Southwest China.
Figure 4.
Occurrences (ODS, a–d) and fractional contributions (CDS, e–h) of dry spells of different durations for corrected (Pc) and original (Po) precipitation data during 1961–2019 in Southwest China.

Figure 5.
Slope in the occurrence (ODS, a–d) and fractional contributions (CDS, e–h) of dry spells for corrected (Pc) and original (Po) precipitation data during 1961–2019 in Southwest China.
Figure 5.
Slope in the occurrence (ODS, a–d) and fractional contributions (CDS, e–h) of dry spells for corrected (Pc) and original (Po) precipitation data during 1961–2019 in Southwest China.

Figure 6.
Spatial characteristics of wet spell indices NWS (a), MWS (b), MLWS (c), MPWS (d), PWS95 (e), FWW (f), FDW (g) for corrected (Pc) and original (Po) precipitation data during 1961–2019 in Southwest China. In the legend display, outside the bracket is the multi-year average value of the Pc-based wet spell indices, and inside the bracket is the multi-year average value of the Po-based wet spell indices.

Figure 7.
Spatial characteristics of dry spell indices NDS (a), MDS (b), MLDS (c), NLDS (d), DDS95 (e), FWD (f), FDD (g) for corrected (Pc) and original (Po) precipitation data during 1961–2019 in Southwest China. In the legend display, outside the bracket is the multi-year average value of the Pc-based dry spell indices, and inside the bracket is the multi-year average value of the Po-based dry spell indices.

Figure 8.
Network diagram of significant Spearman coefficients between wet/dry spell indices and LSCIs (a–h), the probability distribution of all Spearman coefficients (i) for corrected (Pc) and original (Po) precipitation data during 1961–2019 in Southwest China.
Figure 8.
Network diagram of significant Spearman coefficients between wet/dry spell indices and LSCIs (a–h), the probability distribution of all Spearman coefficients (i) for corrected (Pc) and original (Po) precipitation data during 1961–2019 in Southwest China.

Figure 9.
Wavelet transform coherence (WTC) of the MWS (Po, Pc) (a,c), MDS (Po) (b), and NLDS (Pc) (d) during 1961–2019 in Southwest China. The thick, black solid line represents the 5% significance level against red noise background. The gray areas with square grids indicate the cones of influence (COI), which may be influenced by edge effects. The direction of an arrow indicates the phase angle, and the arrow to the right indicates the positive coherence of the same phase. The arrow to the left indicates negative phase coherence, and the darker the color, the stronger the negative coherence.

Figure 10.
Partial wavelet coherence (PWC) of the MWS (Po, Pc) (a,c), MDS (Po) (b), and NLDS (Pc) (d) during 1961–2019 in Southwest China. The thick, black solid line represents the 5% significance level against red noise background. The gray areas with square grids indicate the cones of influence (COI), which may be influenced by edge effects. The direction of an arrow indicates the phase angle, and the arrow to the right indicates the positive coherence of the same phase. The arrow to the left indicates negative phase coherence, and the darker the color, the stronger the negative coherence.


Table 1.
Large-scale circulation indices (LSCIs) used in the study.
| LSCIs | Abbreviations |
|---|---|
| Northern Hemisphere Subtropical High Area Index | NHSHA |
| Indian Subtropical High Area Index | ISHA |
| Western Pacific Subtropical High Area Index | WPSHA |
| Northern Hemisphere Subtropical High Intensity Index | NHSHI |
| Indian Subtropical High Intensity Index | ISHI |
| Western Pacific Subtropical High Intensity Index | WPSHI |
| Asia Polar Vortex Area Index | APVA |
| Pacific Polar Vortex Area Index | PPVA |
| Asia Polar Vortex Intensity Index | APVI |
| Pacific Polar Vortex Intensity Index | PPVI |
| Tibet Plateau Region 1 Index | TP1 |
| Tibet Plateau Region 2 Index | TP2 |
| Arctic Oscillation | AO |
| North Atlantic Oscillation | NAO |
| Nino Eastern Pacific index | NEP |
| Nino Central Pacific index | NCP |
| Tropic Indian Ocean Dipole Index | TDO |
| Southern Oscillation Index | SOI |
| South Asian Summer Monsoon Index | SASMI |
| East Asian Summer Monsoon Index | EASMI |
Table 2.
Definition of wet and dry spell indices.
| Type | Indices | Definitions | Units |
|---|---|---|---|
| Wet spell | NWS | Number of wet spells | Events |
| MWS | Mean length of wet spells | Days | |
| MPWS | Annual maximum precipitation of wet spells | mm | |
| MLWS | Annual maximum length of wet spells | Days | |
| PWS95 | Total precipitation amount of extreme wet spells (an extreme wet spell can be defined as a wet spell with the days exceeding 95th percentile of length of WS during a year) | mm | |
| FWW | Fractional contribution of times when a wet day is preceded by a wet day to the annual days | % | |
| FDW | Fractional contribution of times when a wet day is preceded by a dry day to the annual days | % | |
| OWS | Occurrence frequency of wet spells with different durations | % | |
| CWS | Fractional contribution of wet spells with different durations to the annual total precipitation amount | % | |
| Dry spell | NDS | Number of dry spells | Events |
| MDS | Mean length of dry spells | Days | |
| MLDS | Annual maximum length of dry spells | Days | |
| NLDS | Annual number of long dry spells (annual number of dry spells with length ≥30 days) | Events | |
| DDS95 | Total days of extreme dry spells (an extreme dry spell can be defined as a dry spell with the days exceeding 95th percentile of length of DS during a year) | Days | |
| FWD | Fractional contribution of times when a dry day is preceded by a wet day to the annual days | % | |
| FDD | Fractional contribution of times when a dry day is preceded by a dry day to the annual days | % | |
| ODS | Occurrence frequency of dry spells with different durations | % | |
| CDS | Fractional contribution of dry spells with different durations to the annual total dry days | % |
Table 3.
Slopes and slope relative errors in wet/dry spell indices using corrected (Pc) and original (Po) precipitation data during 1961–2019 in Southwest China.
Table 3.
Slopes and slope relative errors in wet/dry spell indices using corrected (Pc) and original (Po) precipitation data during 1961–2019 in Southwest China.
| Southwest China | Sichuan Basin | Hengduan Mountains | Yunnan-Guizhou Plateau | |||||
|---|---|---|---|---|---|---|---|---|
| Slope (Decade) | Relative Error (%) | Slope (Decade) | Relative Error (%) | Slope (Decade) | Relative Error (%) | Slope (Decade) | Relative Error (%) | |
| NWS | −0.15 (−0.15) | 2.51 | −0.05 (−0.02) | −62.34 | 0.21 (0.17) | −22.22 | −0.25 (−0.2) | −17.83 |
| MWS | −0.02 * (−0.03 *) | 18.50 | −0.02 * (−0.02 *) | 28.32 | −0.01 * (−0.02 *) | 17.21 | −0.03 * (−0.04 *) | 19.25 |
| MLWS | −0.21 * (−0.27 *) | 28.68 | −0.18 * (−0.22 *) | 23.53 | −0.11 * (−0.09 *) | −13.46 | −0.29 * (−0.35 *) | 19.85 |
| MPWS | −2.1 * (−2.97 *) | 41.44 | −1.73 (−2.77) | 60.39 | −0.57 (−0.66) | 15.95 | −2.7 (−3.35) | 24.17 |
| PWS95 | −5.46 * (−6.62 *) | 21.22 | −5.21 * (−8.08 *) | 55.10 | −0.76 (−1.13) | 47.34 | −5.6 * (−7.12 *) | 27.14 |
| FWW | −0.37 * (−0.47 *) | 27.26 | −0.3 * (−0.37 *) | 21.20 | −0.1 (−0.14) | 33.20 | −0.49 * (−0.61 *) | 24.34 |
| FDW | 0.48 * (0.56*) | 14.56 | 0.36 * (0.38 *) | 6.45 | 0.06 (0.14) | 114.71 | 0.64 * (0.73 *) | 14.44 |
| NDS | −0.13 (−0.13) | −2.78 | −0.05 (−0.03) | −39.69 | 0.24 (0.18) | −25.00 | −0.23 (−0.22) | −3.45 |
| MDS | 0.07 * (0.07 *) | 1.49 | 0.03 (0.03) | 2.16 | 0.02 (0.03) | 35.52 | 0.1 * (0.09 *) | −3.19 |
| MLDS | 0.51 (0.52) | 2.99 | 0.13 (0.17) | 36.90 | 0.22 (0.2) | −6.62 | 0.83 (0.92 *) | 11.20 |
| NLDS | −0.03 (−0.15 *) | 351.53 | −0.03 (−0.07) | 183.20 | −0.06 * (−0.23 *) | 266.34 | −0.08 * (−0.23 *) | 201.86 |
| DDS95 | 0.53 (0.67 *) | 25.98 | 0.29 (0.4) | 37.56 | 0.88 (0.73) | −16.67 | 0.87 (1.14) * | 30.69 |
| FWD | −0.04 (−0.04) | 3.27 | −0.01 (0.01) | 151.57 | 0.06 (0.05) | −17.64 | −0.06 (−0.05) | −13.96 |
| FDD | −0.04 (−0.04) | −1.54 | −0.02 (−0.01) | −40.29 | 0.06 (0.05) | −21.37 | −0.06 (−0.06) | 0.56 |
Note: * indicates |Z value| ≥ 1.96.
Table 4.
Average wavelet coherence value (AWC) and significant coherence area percentage (PASC) for the wavelet transform coherence (WTC) and partial wavelet coherence (PWC).
Table 4.
Average wavelet coherence value (AWC) and significant coherence area percentage (PASC) for the wavelet transform coherence (WTC) and partial wavelet coherence (PWC).
| Methods | Type | Wet Spell Indices | Dry Spell Indices | |||||
|---|---|---|---|---|---|---|---|---|
| Variables | AWC | PASC | PASCG | Variables | AWC | PASC | PASCG | |
| WTC | MWS(Po) + SASMI | 0.80 | 12.24% | - | MDS(Po) + AO | 0.80 | 16.78% | - |
| MWS(Pc) + SASMI | 0.79 | 12.44% | - | NLDS(Pc) + APVI | 0.79 | 18.07% | - | |
| PWC | MWS(Po) + (SASMI-TP2) | 0.84 | 12.82% | 0.58% | MDS(Po) + (AO-NEP) | 0.89 | 38.4% | 21.62% |
| MWS(Pc) + (SASMI-TP1) | 0.84 | 12.36% | −0.08% | NLDS(Pc) + (APVI-PPVI) | 0.87 | 22.45% | 4.38% | |
Publisher’s Note: MDPI stays neutral with regard to jurisdictional claims in published maps and institutional affiliations. |
© 2022 by the authors. Licensee MDPI, Basel, Switzerland. This article is an open access article distributed under the terms and conditions of the Creative Commons Attribution (CC BY) license (https://creativecommons.org/licenses/by/4.0/).
Share and Cite
MDPI and ACS Style
Ren, Y.; Cheng, Q.; Jin, H. Evolution of Wet and Dry Spells Based on Original and Corrected Precipitation Data in Southwest China, 1961–2019. Water 2022, 14, 3090. https://doi.org/10.3390/w14193090
AMA Style
Ren Y, Cheng Q, Jin H. Evolution of Wet and Dry Spells Based on Original and Corrected Precipitation Data in Southwest China, 1961–2019. Water. 2022; 14(19):3090. https://doi.org/10.3390/w14193090
Chicago/Turabian StyleRen, Yitong, Qingping Cheng, and Hanyu Jin. 2022. "Evolution of Wet and Dry Spells Based on Original and Corrected Precipitation Data in Southwest China, 1961–2019" Water 14, no. 19: 3090. https://doi.org/10.3390/w14193090
Note that from the first issue of 2016, this journal uses article numbers instead of page numbers. See further details here.