

From Sponge Cities to Sponge Watersheds: Enhancing Flood Resilience in the Sishui River Basin in Zhengzhou, China
1
College of Urban and Environmental Sciences, Peking University, Beijing 100871, China
2
Turenscape Urban Planning and Design Co., Ltd., Beijing 100080, China
3
College of Architecture and Landscape Architecture, Peking University, Beijing 100871, China
*
Author to whom correspondence should be addressed.
Water 2022, 14(19), 3084; https://doi.org/10.3390/w14193084
Submission received: 18 August 2022
/
Revised: 20 September 2022
/
Accepted: 26 September 2022
/
Published: 1 October 2022
(This article belongs to the Special Issue Natural Flood Management as an Adaptive Pathway to Climate-Resilient Communities)
Abstract
:Increasing extreme rainfall and increasingly severe flood disasters worldwide make it essential to enhance flood resilience research and practice. The Sponge City Approach (SCA) has been proposed as a nature-based solution for solving pressing water problems in cities, but there is an urgent need to apply the approach at the broader catchment scale to address the rising challenges driven by climate change. This study established a Sponge Watershed Approach (SWA) using the “Source-Flow-Sink” framework and applied it in the Sishui River Basin in Zhengzhou, China, to reconstruct a town after a heavy rainfall disaster and enhance its resilience to future floods. An integrated modeling approach utilizing hydrologic, hydraulic, and flood-loss curve models was used to analyze and evaluate the flood-reduction effects of different strategies under multiple scenarios. The results show that: (1) a strategy focusing solely on interventions at the source of runoff cannot adequately cope with extreme rainfall, and a whole-system approach to managing floods is necessary instead; (2) the effectiveness of the flow strategy depends on the intervention magnitude and the location where interventions are made; (3) the sink strategy offers the most effective way (approximately 30% decrease in flood loss) to adapt to extreme rainfall; (4) the risk and impact of flood disaster in the town was significantly reduced with the SWA (approximately 35–50% decrease in flood loss) compared to those without any interventions; (5) the effects of these strategies are interactive, and the optimal strategy depends on the rainfall condition. These results demonstrate the practicability of SWA by integrating the source, flow, and sink strategy at the whole-catchment scale, which will help promote natural flood management and enhance the climate resilience of catchments worldwide.
1. Introduction
Increasingly frequent extreme rainfall events induced by climate change are causing more severe flood disasters worldwide [1,2]. For example, in July 2021, record levels of rainfall, with more than a month’s worth of rain falling in 24 h, caused catastrophic flooding throughout large swaths of western Europe and killed hundreds of people [3]. Extreme rainfall events are becoming more common and will cause more severe flood disasters; thus, it is critical to build “flood-resilient” cities [4] and countries that can resist, absorb, and recover from flood disasters [5] using methods such as nature-based green infrastructure and the climate-adaptive Sponge City Approach [6].
In East-Central China, Zhengzhou City, the capital of Henan province, experienced a rare heavy rainstorm and severe floods and suffered heavy casualties and property losses on 20 July 2021. In the city’s downtown area, 14 people died and nearly 1000 people were trapped in the city’s Subway Line 5. The hilly regions to the west, which faced high peak flow and fast-moving floods in a steep mountainous environment, were also seriously impacted—for example, a county-level city called Gongyi suffered a disaster in which more than 20,000 people had to flee their homes and 84 died or disappeared [7]. The extreme rainfall, with a daily precipitation (624.1 mm on July 20, 2021) close to the total average annual rainfall in Zhengzhou (640.8 mm), and the existing drainage system being incapable of handling such heavy rainfall are the two most direct reasons [7].
However, the Chinese government selected Zhengzhou City as a pilot project for the national sponge city program in 2016, and the failures in Zhengzhou City during the “7·20” heavy rainfall event raised questions about the effectiveness of the sponge city. As disclosed in the official disaster investigation report, of the CNY 19.63 billion (USD 3 billion) invested in sponge city construction, only 32% was directly related to sponge city measures, while nearly 56% was used for landscaping and greening more generally, which caused the sponge city measures implemented in Zhengzhou to fall far short of the standard [7].
In the flood management literature, the Sponge City Approach (SCA) is a comprehensive, nature-based solution to managing flooding, water-logging, and other significant water problems in urban and rural areas [8]. There are many concepts related to sustainable flood management worldwide, such as Best Management Practices (BMPs) and Low-Impact Development (LID) in America, Sustainable Urban Drainage Systems (SUDS) in England, and Water-Sensitive Urban Design (WSUD) in Australia [9]. Green Infrastructure (GI) is also considered an effective way to mitigate urban surface water flooding risk [10]. The potential of these measures to mitigate and adapt to climate change is evidenced by multiple studies [11,12].
As an inheritor of the water management wisdom of thousands of years of Chinese experience [13], a city is designed to act like a sponge under SCA, which increases its resilience in adapting to environmental changes and coping with natural disasters [14]. Three components are key to a successful sponge city: retention, attenuation, and adaptation [15]. The retention strategy addresses problems at the source by reducing runoff from all kinds of buildings, roads, and other impervious surfaces and simultaneously improving runoff pollution control. The attenuation strategy focuses on process control, delaying and reducing peak runoff while employing surface drainage, pipe drainage, and other water-management techniques. The adaptation strategy focuses on enhancing the resilience of rivers and built structures, allowing them to more flexibly adapt to extreme disasters [15,16]. Current sponge city construction standards in China are informed by the Low-Impact Development (LID) perspective [17] and focus on strategies and intervention measures to manage runoff at or near the source. Thus, a whole-system perspective tying together the source, process, and sink components is necessary, and this trend is reflected in the third round of sponge city pilot projects that began in May 2021, emphasizing the LID-inspired approach to construction throughout the whole region [18] rather than localized construction and evaluation [19].
The shift to the whole-system approach has been discussed in the literature of the watershed management and flood reduction fields, which have gradually evolved from standards-based management to risk-based management and, currently, resilience-based management approaches [20]. The focus of flood defense has shifted from protecting facilities such as dams and dikes to conserving, restoring, and protecting the entire watershed, including rivers, lands, and other landscape elements, and this new paradigm is called Integrated Water Resource Management [21]. Related frameworks such as the SPR (source-pathway-receptor), usually applied to environmental risk management [22], are developed to analyze the flood disaster from the system perspective. In SPR, “sources” refer to weather or other conditions that may cause flooding, such as heavy rain, rising sea levels, etc. The “pathways” are mechanisms for moving floodwaters from their sources to places that may affect receptors, including river flows, slope flows, the failures of flood defense facilities or urban drainage systems, etc. “Receptors” refer to entities such as people, industries, and natural or built environments that may be affected by flooding [23]. Another framework, SPRC (source-pathway-response-consequence), is further developed and combined with risk analysis techniques to emphasize consequences such as the extent of flooding, insurance coverage, and the loss of life [24].
Thus, there are compelling reasons to reconceptualize the current Sponge City Approach as a Sponge Watershed Approach (SWA) that analyzes problems and formulates responses at the broader watershed scale. One study defines a sponge watershed as one that absorbs rainfall to reduce runoff when precipitation is high and releases it to maintain baseflow when precipitation is low, thus strengthening the overall water storage capacity of the watershed [25]. A framework consisting of six indicators for sponge watershed construction was proposed and applied to compare the performance of six sponge city pilots in southern China [26]. In practice, China’s Shenzhen-Shantou Special Cooperation Zone is attempting to expand sponge city construction strategies from the regional scale to the watershed scale in the sponge system layout, urban water system planning, and land development mode aspects [27]. In this emerging field, exactly how to establish an analytic and practical framework, and how to borrow from the existing SCA experience and extend it to the watershed scale to enhance overall resilience, remains unsettled.
To fill this gap, this study focuses on the post-disaster re-construction of Mihe Town in Gongyi to develop and apply the SWA approach at the catchment scale. As previously noted, Mihe was one of the hardest-hit locations in the “7·20” disaster. The town sits approximately 36 km (22 miles) west of downtown Zhengzhou, within the Sishui River Basin (SRB). To simulate a watershed sponge system and evaluate its performance in extreme rainfall events, a “Source-Flow-Sink” framework was established, and the hydrologic, hydraulic, and flood-loss models were combined.
The remainder of the paper is organized as follows. Section 2 describes the SWA framework proposed for constructing sponge systems at the whole-watershed scale. Section 3 introduces the study area, data, and the methods integrating hydrologic, hydraulic, and flood loss evaluation modeling. Section 4 provides the results and validation of the modeling, the effects of the source, flow, and sink strategies, and the evaluations of their combined impacts under different scenarios. Section 5 concludes the study and highlights future implications.
2. The SWA Framework and Strategies
2.1. Framework
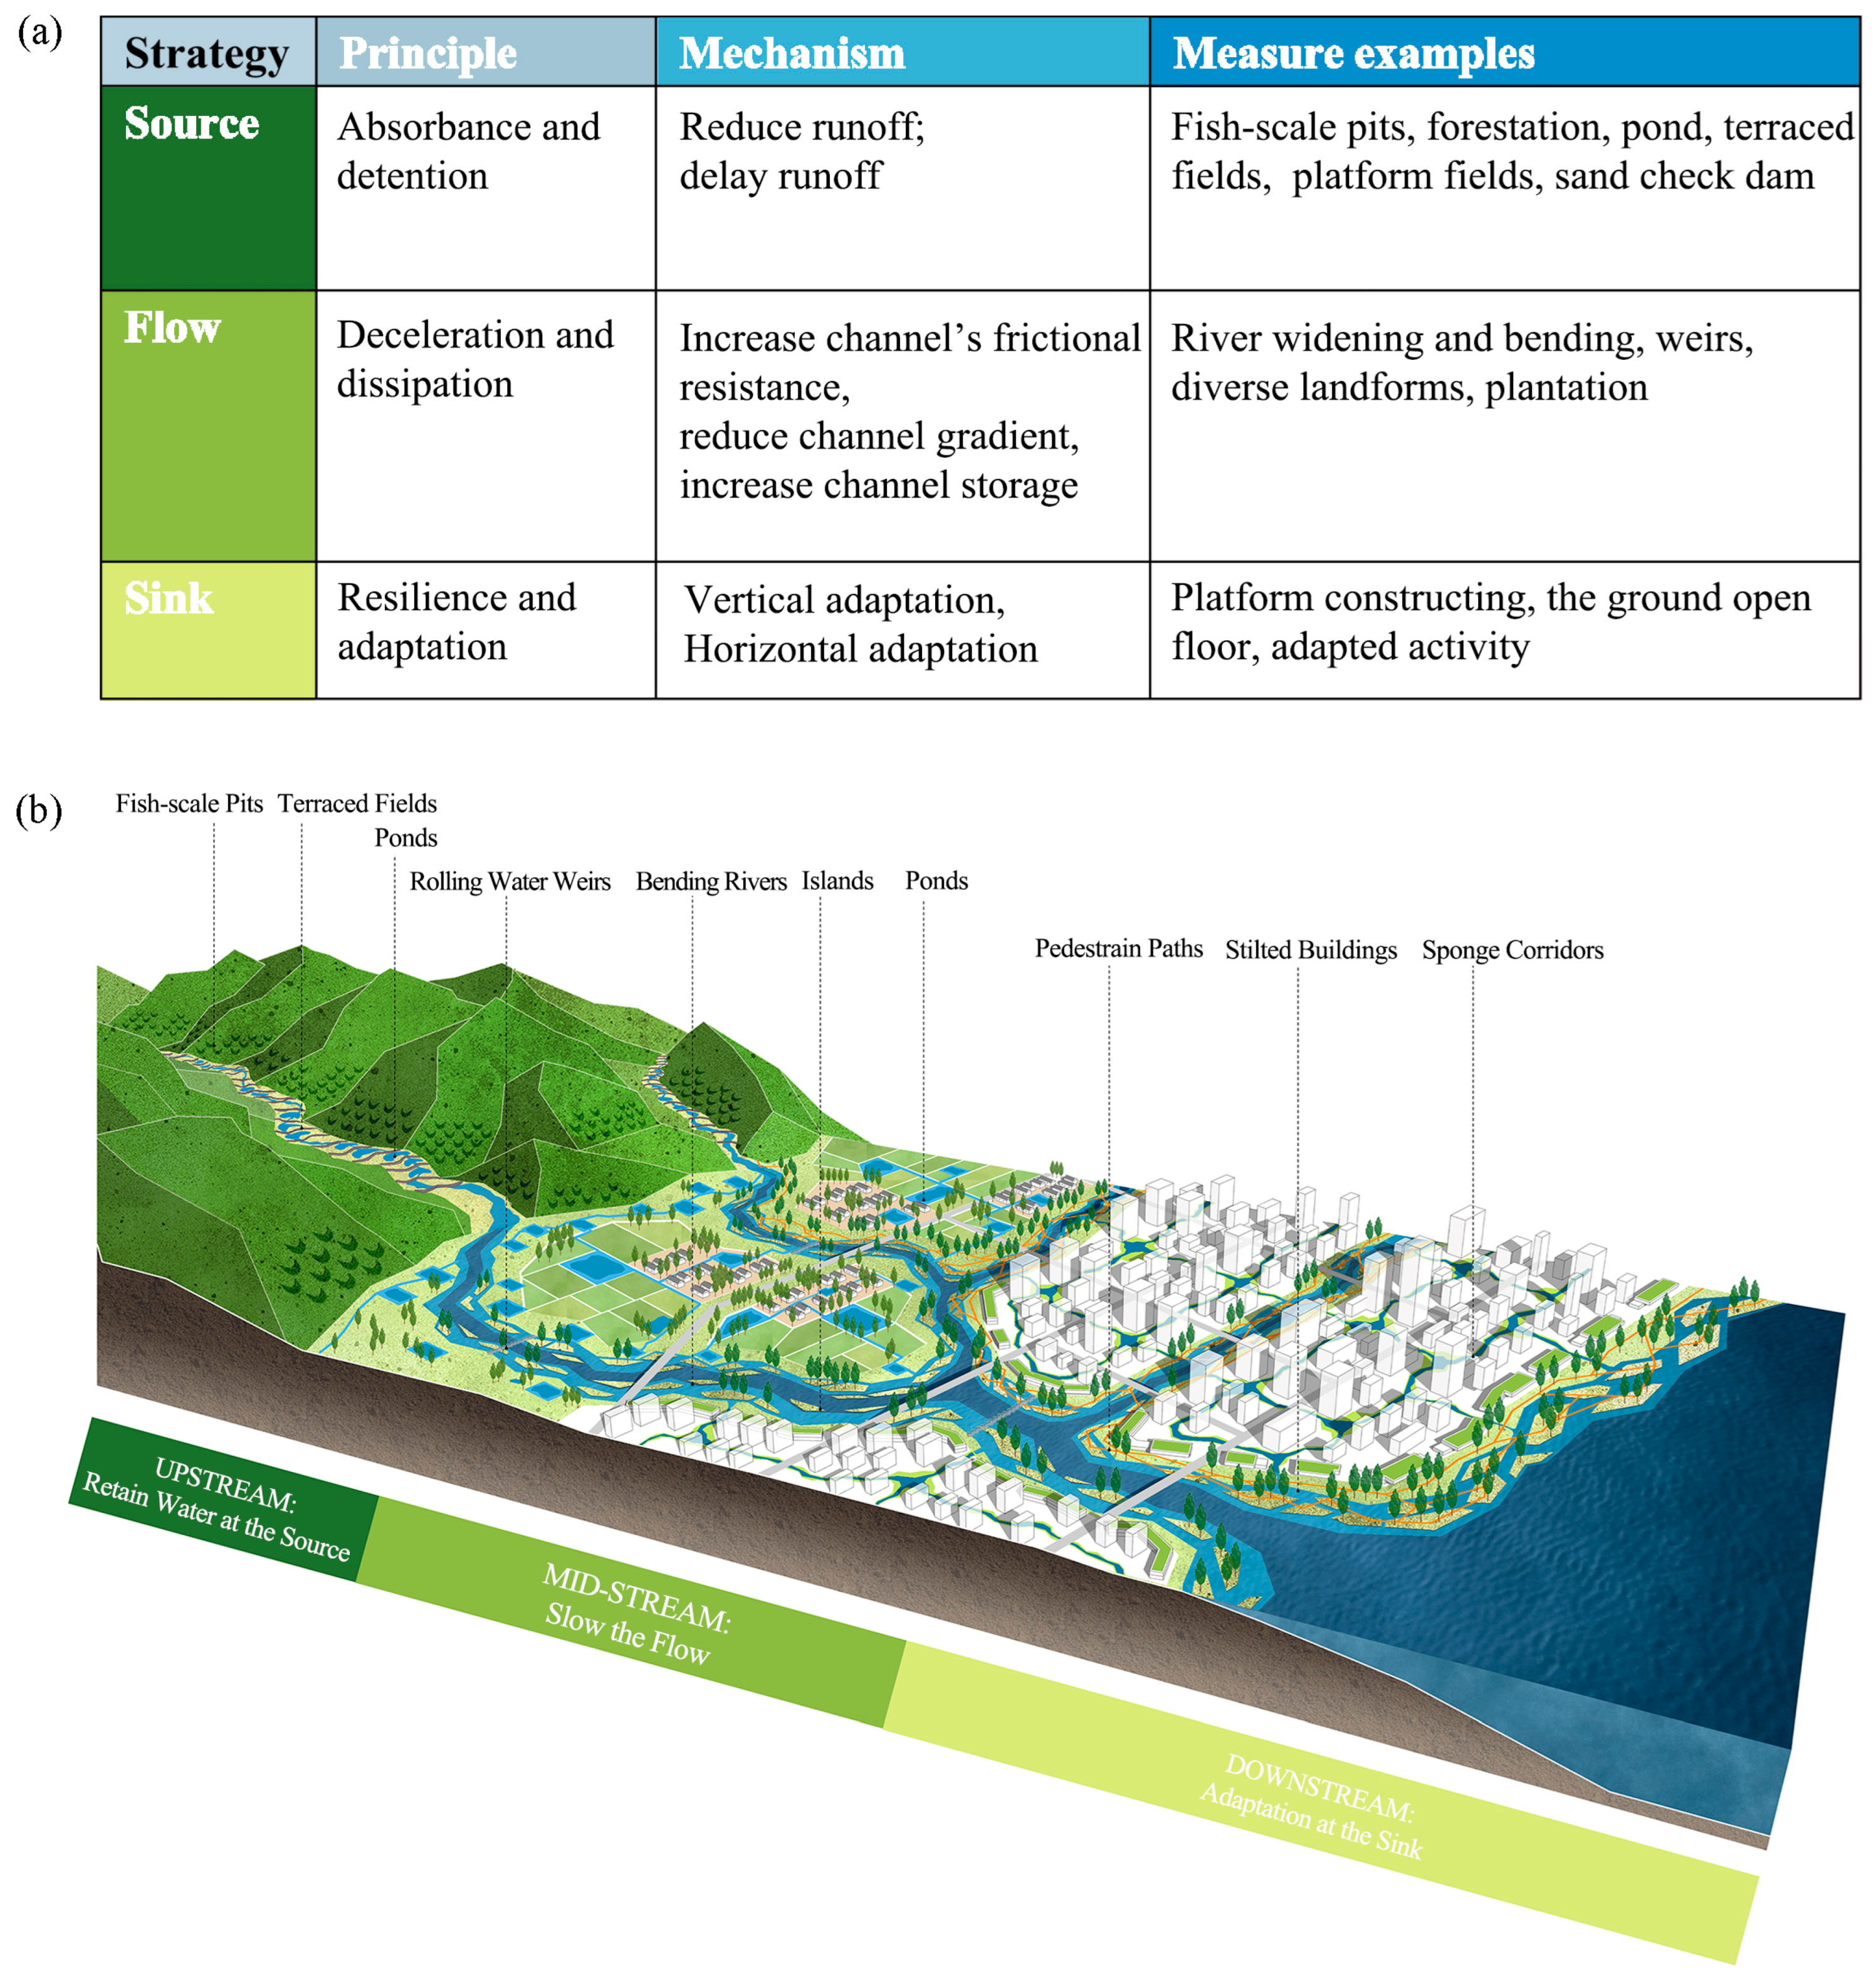
Adopting a “holistic system” perspective of the watershed, we propose a “source-flow-sink” framework, i.e., the Sponge Watershed Approach (SWA), which consists of three primary strategies and corresponding intervention measures (Figure 1).
In the SWA, the source, flow, and sink components are used to organize different facilities for different purposes [15]. Absorption and detention are the main strategies to “keep the water in situ” by reducing and delaying runoff, with multiple facilities such as fish-scale pits, forestation, terraced fields, sand check dams, and ponds. Deceleration and dissipation are the primary flow strategies to reduce water speed and force, employing measures such as widening stream channels and reintroducing meanders, building weirs, and constructing diverse landforms. Finally, resilience and adaptation are the sink strategies to enhance a city’s capacity to cope with flooding through vertical and horizontal interventions. They rely primarily on using fill to create elevated earthen benches upon which structures can be built, constructing buildings with open, floodable ground floors, and carrying out appropriate activities adapted to flooding.
The intervention measures from the source to the sink component in the watershed are not randomly located. They are organized according to a watershed’s slope, land use type, and gravity gradient. While the broad strategies remain the same, the specific measures employed in any given watershed are determined by the regional climate and local landforms of the watershed. For example, in South China, terraces are usually constructed of soil, while in North China, the construction material is usually stone. The study case, the SRB, is located in the mountainous area with a monsoon climate in North China, so the following part mainly uses the measures suitable for the SRB to demonstrate the source, flow, and sink strategy, while some of the flood mitigation measures in other regions are also mentioned.
2.2. Source Strategy: Absorption and Detention
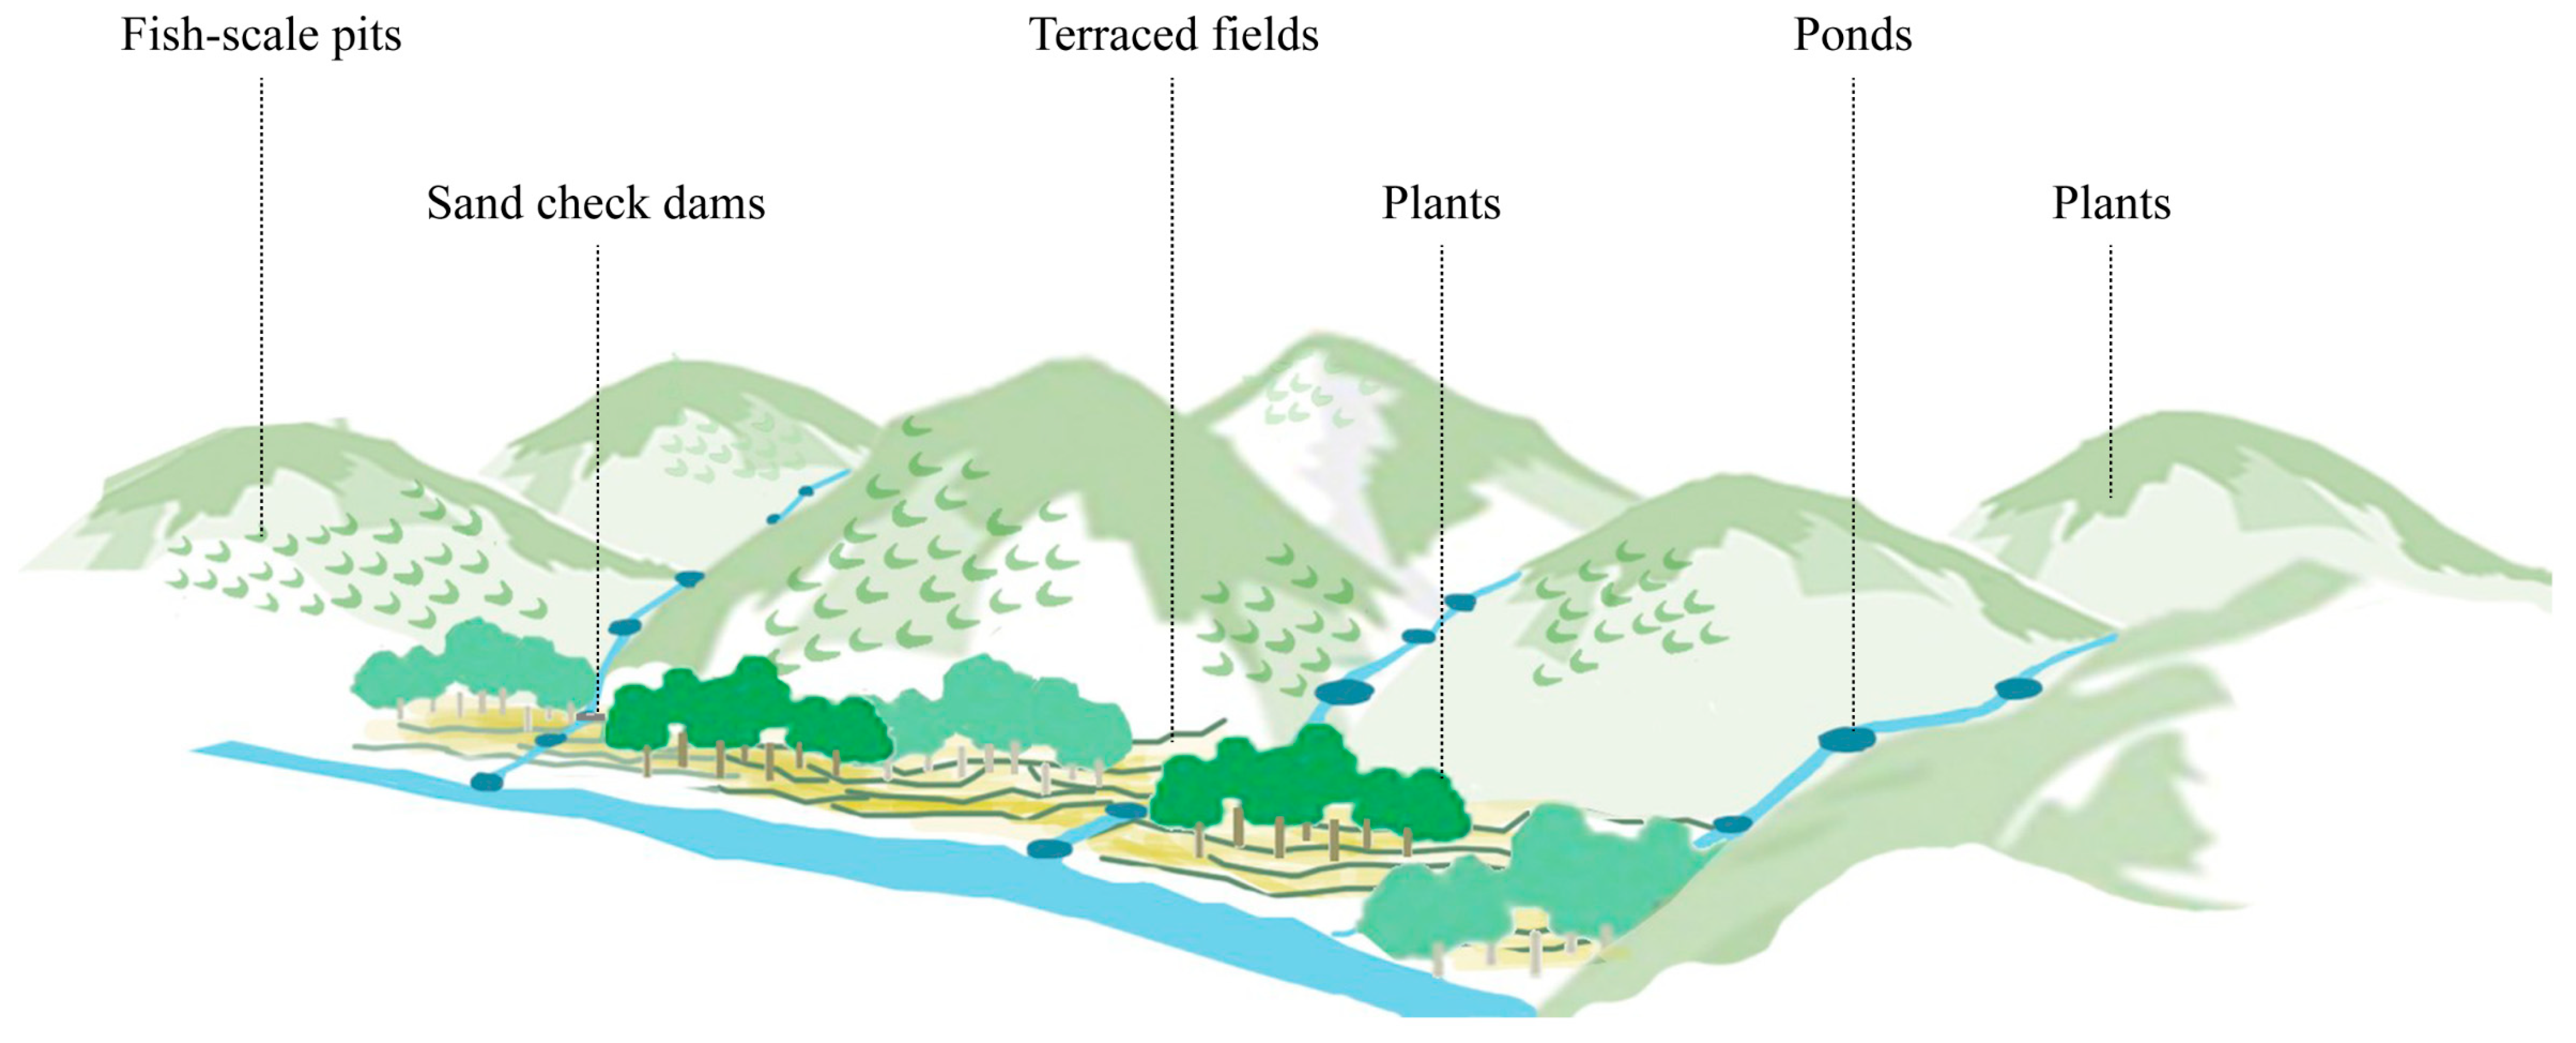
The primary strategy of SWA is to enhance the absorption and detention capacity at the source, which can significantly relieve the pressure of river flooding. The source control measures mainly work on reducing runoff or delaying runoff, and the former could be divided into intercepting runoff by extra storage and increasing the infiltration of the catchment. Three measures are proposed at the catchment scale to enhance storage and absorption capacity (Figure 2).
2.2.1. Fish-Scale Pits + Forestation
Conventional vegetation restoration strategies are difficult to effectively implement on steep mountain slopes of 15–45 degrees, where soil exposure is relatively severe. The fish-scale pit, a semicircular or crescent-shaped pit staggered down slopes, is a traditional soil and water conservation practice in China’s northern region and is effective in intercepting sediment, retaining soil and water, and reducing the runoff on the slope, as well as in increasing forestation [28].
2.2.2. Terraced Fields + Check Dam
Hillsides with slopes below 15 degrees can potentially be used for farming. Terraces, a technique employed worldwide, can play a highly effective role in water conservation, vegetation restoration, and agricultural production [29]. The construction of terraces can store more rainwater, reduce the flow speed of runoff, and provide more agricultural land in an area where arable land is scarce.
In areas where significant results cannot be achieved even after fish-scale pits and terraces are constructed, sand check dams can be installed at the base of the hillsides. These check dams can intercept runoff or sediment washed from the hillside or terraces under extreme precipitation conditions, acting as a barrier before the runoff or sediment enters the river valley [30]. After severe erosion events caused by heavy rainfall or an extended period of use, the sediment accumulated in check dams must be excavated to ensure the dams’ continued viability.
2.2.3. Ponds and Benches
In the low-lying valley bottom, where water may not be available all year round, earthen benches can be constructed for agricultural production. Pond systems can also be built in the river valleys to retain water during the rainy season and release it during the dry season, thereby allowing for more effective irrigation. In addition to agricultural purposes, storage facilities such as ponds and small reservoirs installed at the valley outlet can intercept the stream water flowing into the main river to alleviate flooding during heavy rainfall.
The above measures are strategically employed on steep slopes, gentle slopes, valley bottoms, and valley outlets to transform small mountain basins into small sponge basins, which store rainwater, enhance infiltration, increase agricultural production, and restore ecological functions.
Other source control measures could also be used to reduce and delay runoff. For example, green roofs, rainwater harvesting techniques, changing cultivation practices, and rice paddies provide storage and delay runoff, and land use control is an approach to increase the infiltration capacity of the catchments other than by intercepting the runoff [31].
2.3. Flow Strategy: Deceleration and Dissipation
Conventional river management approaches adopt a “fast drainage” approach, i.e., the water in the river is quickly discharged downstream by shortening the flow path through cutting and straightening, channelization and riverbank hardening. Although this strategy effectively protects targeted portions of the watershed by passing floodwater through quickly, the accelerated flow would become dangerously powerful downstream and cause more severe damage when applied to the entire basin. The connection and exchange between surface water and groundwater is lost, and the river’s purification capacity and ecological functions are lost.
In contrast, flood losses could be decreased by using specific techniques to reduce water velocity and weaken the flood’s power, i.e., the attenuation or “slow the water” strategy [32]. For example, in a town inundated by a relatively slow flood, damage would be relatively minimal—and thus more quickly repaired—compared to damage caused by a fast flood. Based on this principle, deceleration and energy dissipation are the main objectives for the modification and design of the river channel.
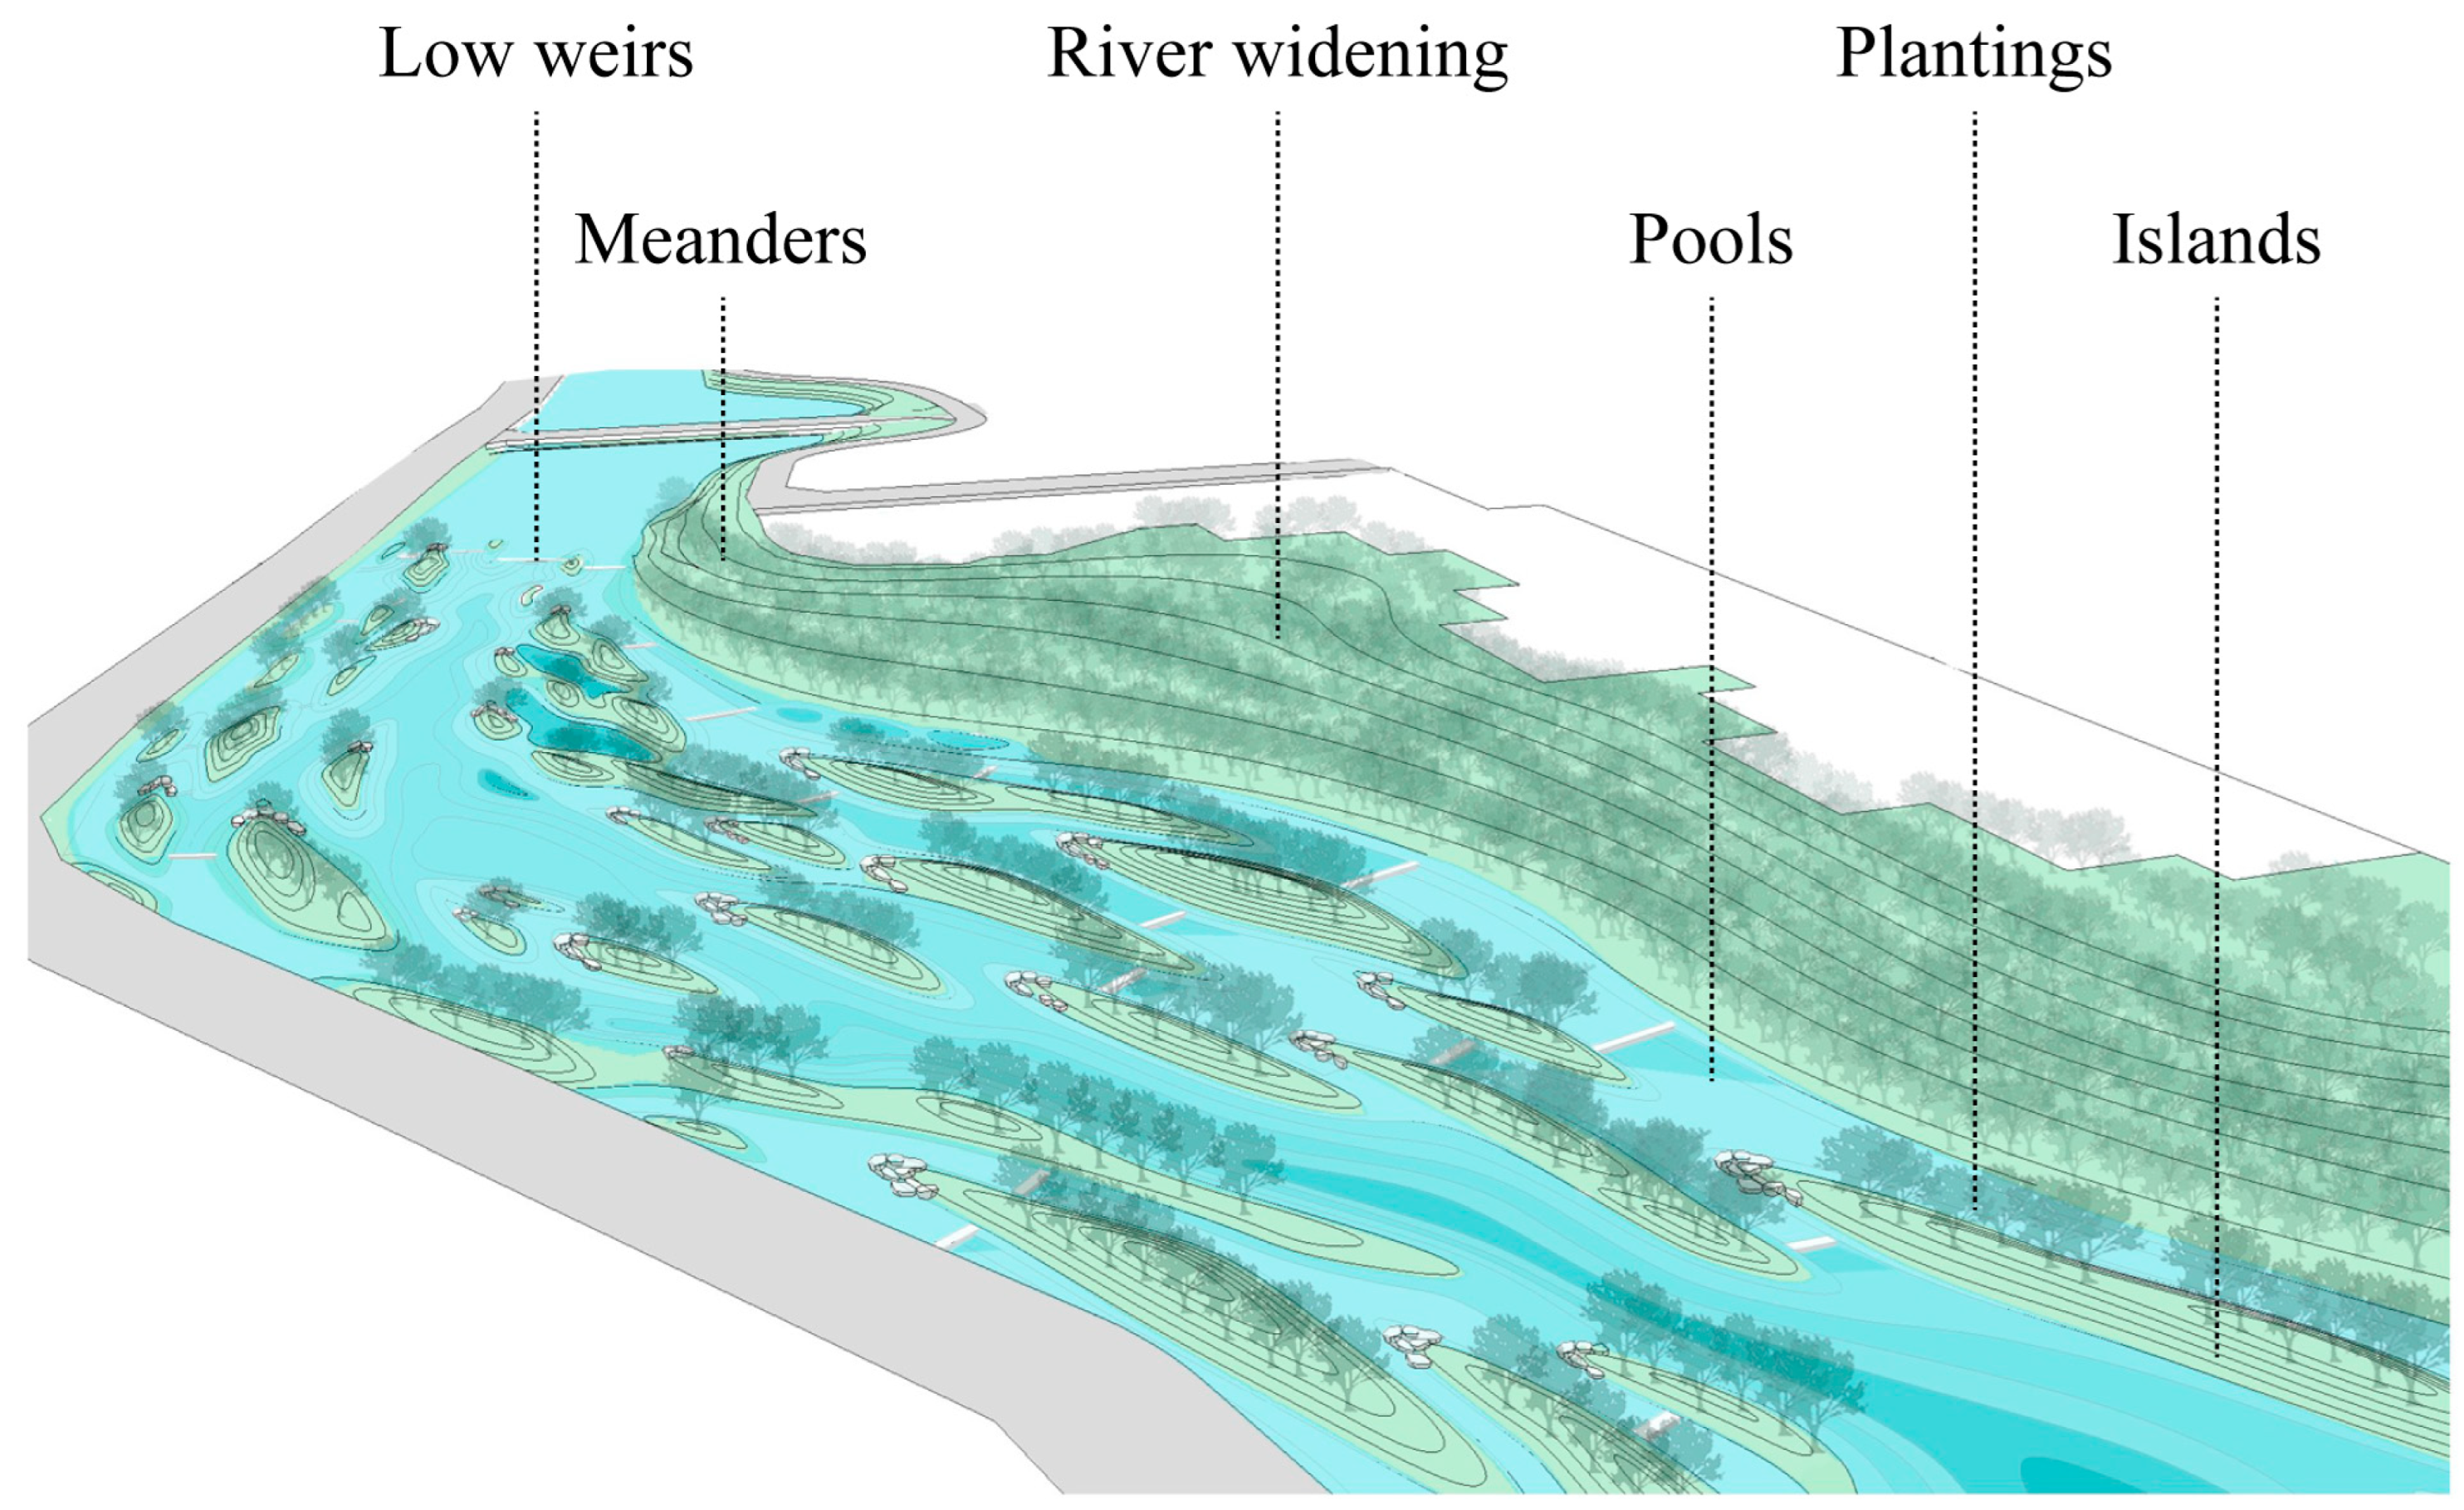
Many measures could slow down stream flow and increase the capacity of the channel, such as increasing the frictional resistance of the channel with floodplain forests, reducing the channel gradient by natural meanders, increasing channel storage by wetlands or ponds either in the stream or out of the stream, and widening and deepening the channel [31]. Considering the status of the SRB, three measures are proposed as the key interventions (Figure 3).
2.3.1. Widen the River and Reintroduce Meanders
Widening the river course can increase the floodable cross-section area, which reduces flow velocity and decreases water depth; reintroducing meanders to the river course can slow flood flows and increase head loss/resistance, further ensuring the city’s safety. In addition, non-uniform riverbanks and lower-speed water flows can provide richer river habitats.
2.3.2. Build Weirs and Construct Diverse Landforms
The second measure is building weirs and dams and creating ponds, islands, and other riparian terrain. Low weirs and dams can capture and store floodwater, and diverse river landforms shaped by ponding, islanding, and diking can increase head loss/resistance, further slowing the water. Additionally, the stored water can be released downstream during the dry season to guarantee minimum water levels in the river and meet environmental and recreational needs.
2.3.3. Planting to Stabilize the Landforms
By itself, the created terrain may not be stable enough to withstand the river’s scouring, so the river’s landform needs to be stabilized by planting ground cover and trees, which has the added benefit of improving landscape value and recreational functions.
2.4. Sink Strategy: Resilience and Adaptation
The sink strategy is intended to enhance towns and cities’ resilience to flooding in order to supplement or even replace the conventional flood control engineering such as dikes and levees, which could function well within the designed standards but may collapse once the standards are exceeded, i.e., transforming the “resistant city” to a “resilient city” [33]. The adaptation measures mainly include two kinds: the first is vertical interventions such as raising houses and other structures, and the second is horizontal interventions such as avoiding development on parts of the floodplain [31]. Specifically, three measures are proposed to improve the adaptive capacities of the settled areas in the SRB (Figure 4).
2.4.1. Site Buildings on Constructed Earthen Benches
Drawing on the historical practice of building houses on high ground along the Yellow River, elevated benches are constructed using the earthen fill excavated during the construction of storage ponds. These uplands provide protection from floodwaters and offer a safer spot to build houses.
2.4.2. Build Structures with Open, Floodable Ground Floors
In addition to siting structures in higher areas, building houses with open, floodable ground floors could improve adaptability to flooding and inundation. Even if the flooding exceeds design standards, it would still be possible to ensure the building’s safety to some extent, further enhancing the settlements’ resilience.
2.4.3. Activity Adaptation
Despite the fact that a widened river channel may lead to a loss of “usable” land in the riparian zone, it can still bring benefits to the community. A resilient adaptation approach could transform riparian space into a stormwater park. For example, erecting floodable waterfront facilities such as trestles linking the river’s edge with built-up areas in the upland is an effective way to meet daily recreational needs during the dry season while still remaining floodable during the wet season.
It is noted that the adaptation measures largely depend on the type and location of the protected settlement. For example, the coastal cities can use ecosystem-based defenses such as marshes, mangroves, and reefs to reduce flood risks in addition to conventional engineering such as sea walls—for example, the man-made marshes in the Scheldt estuary, Belgium protect densely populated areas from storm surge flooding [34].
3. Materials and Methods
3.1. Study Area and Data
3.1.1. Study Area
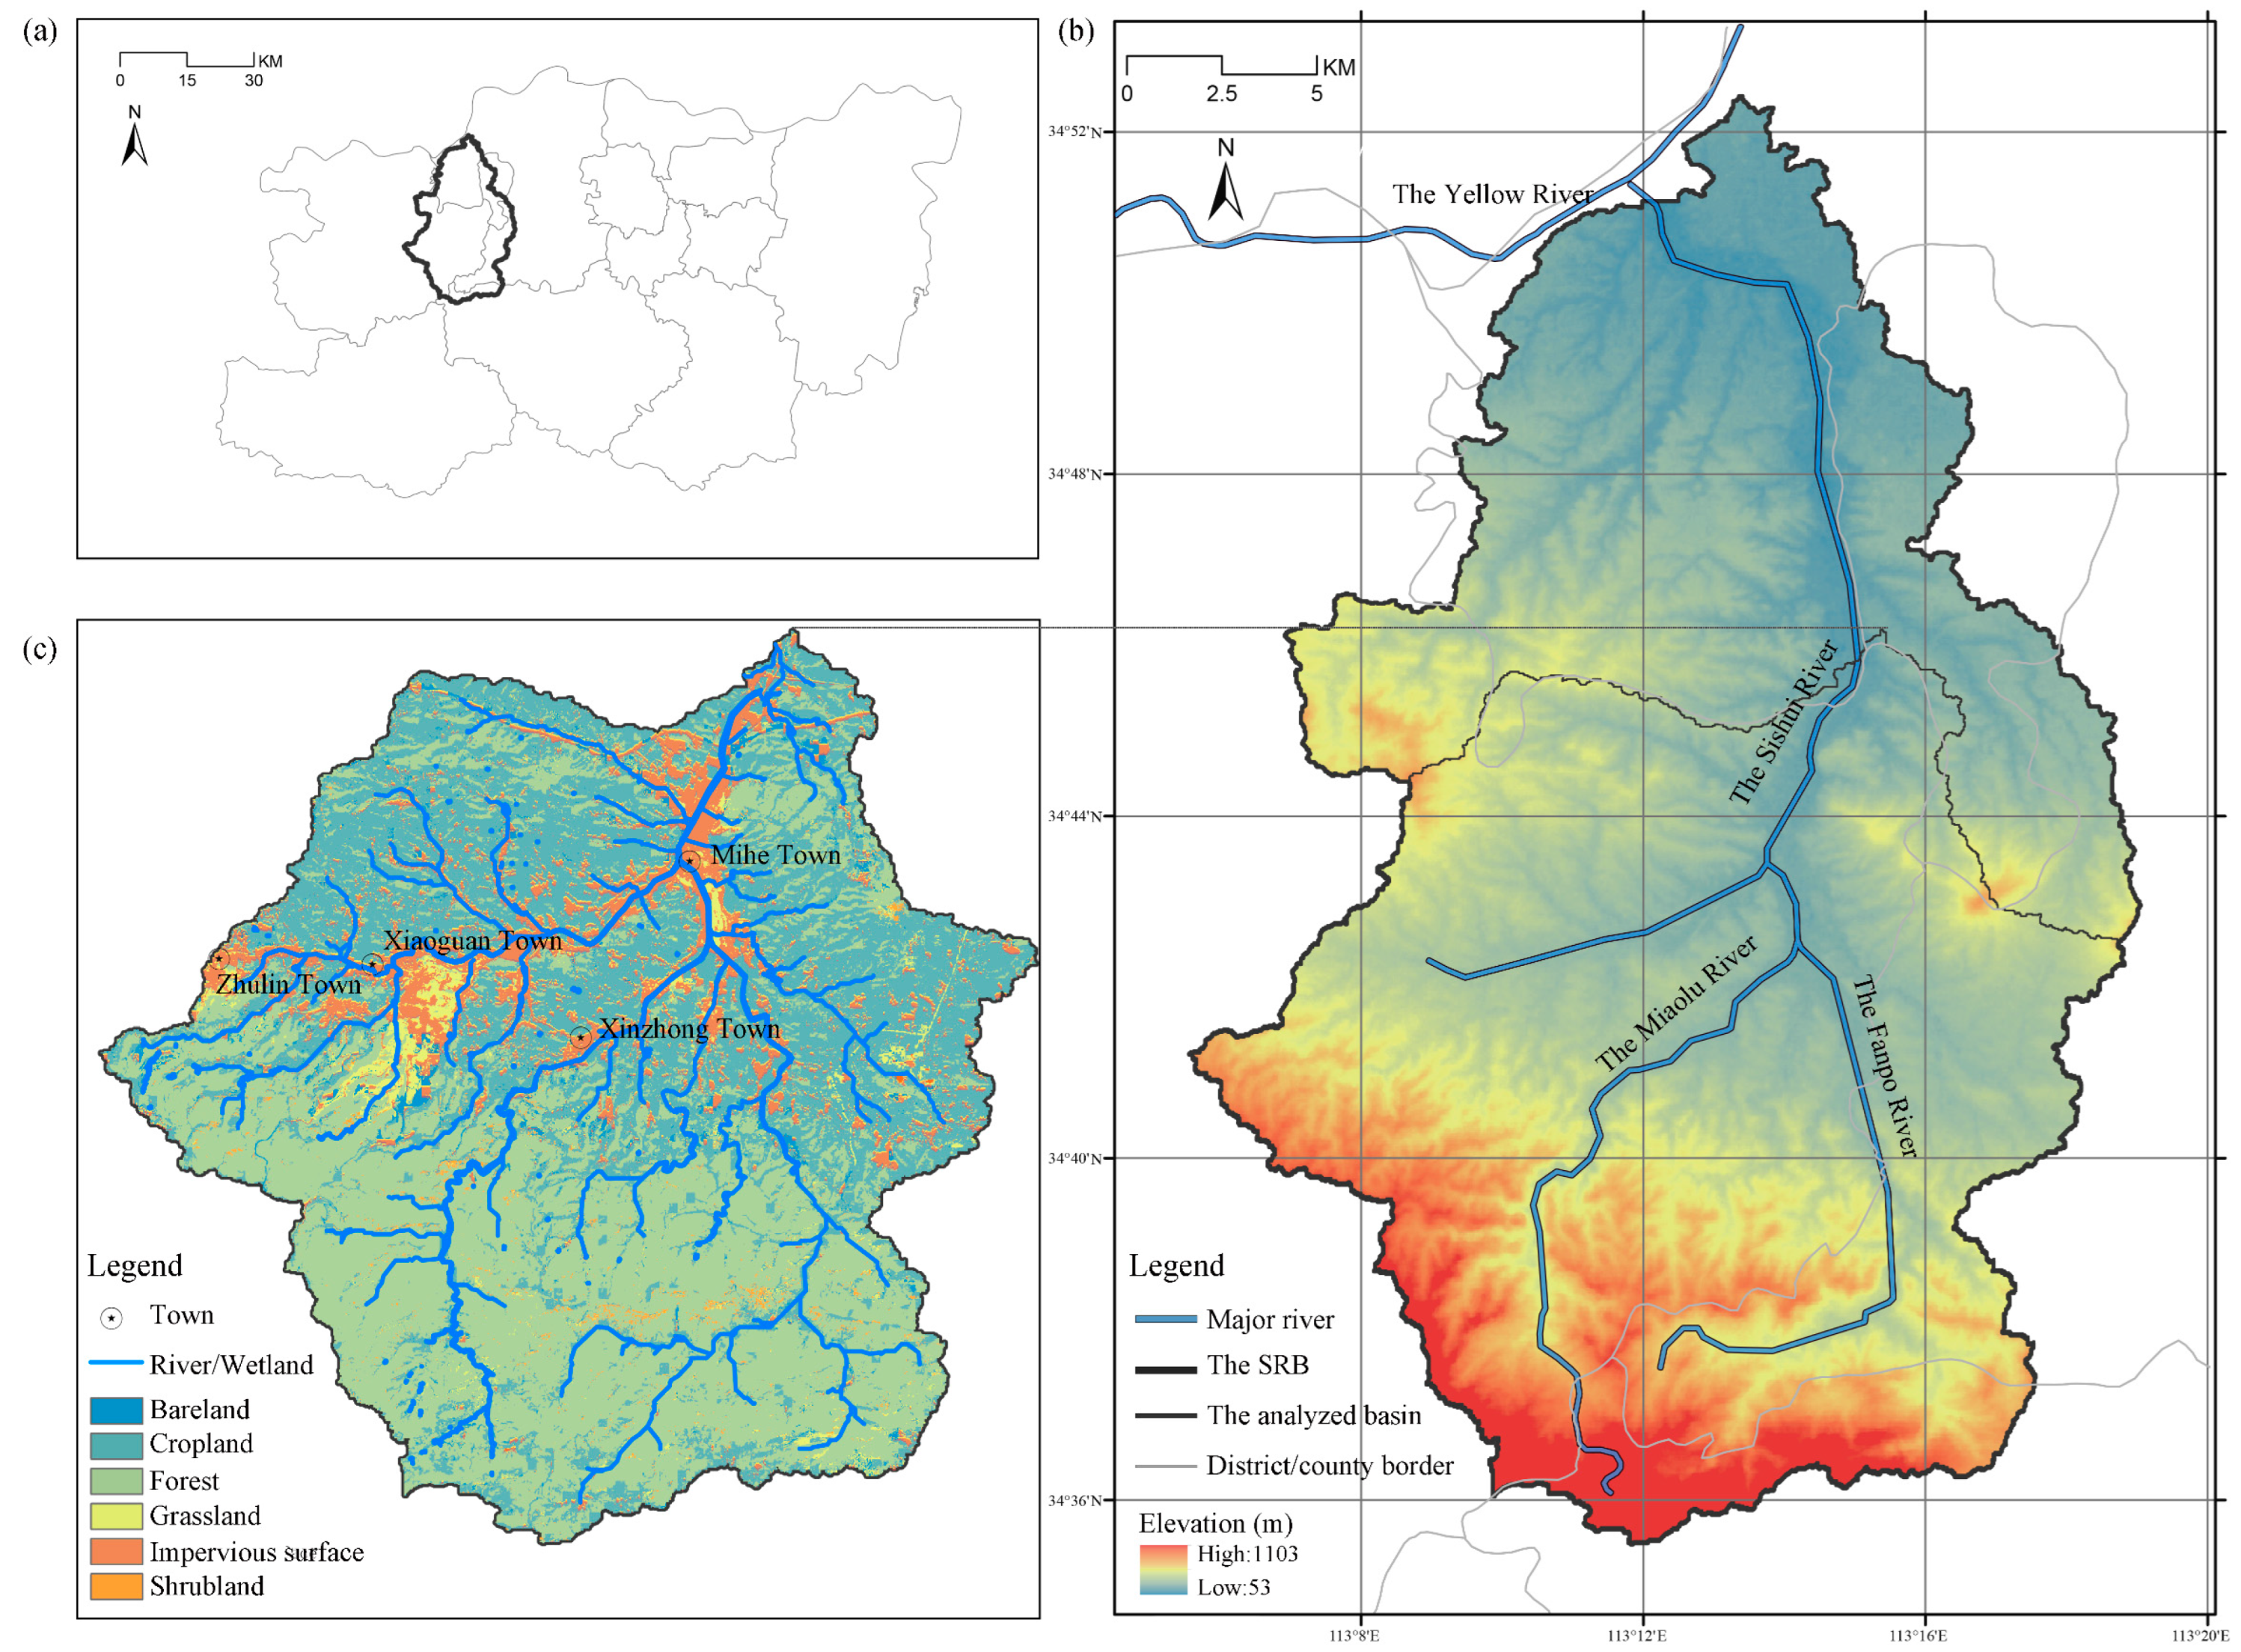
The Sishui River Basin (SRB) is located in a mountainous area west of Zhengzhou City, and the Sishui River is a first-class tributary of the Yellow River (Figure 5). Of the entire 373.28 km2 watershed, about 70% is mountainous, and only about 20% is flatland, distributed along the narrow valleys, particularly above Mihe Town, which we chose to analyze through modeling.
The built-up area of Mihe Town is concentrated in the narrow valley bottoms, with its center located at the confluence of the Sishui, Miaolu, and Fanpo rivers. In the continental temperate monsoon climate with an average rainfall of 583 mm, 70% of this region’s total annual precipitation falls from June to September, and it is usually short in duration, high in intensity, and causes severe flood damage [35]. Moreover, because the region’s soil is mainly collapsible loess, floods carry away considerable amounts of soil and cause severe damage.
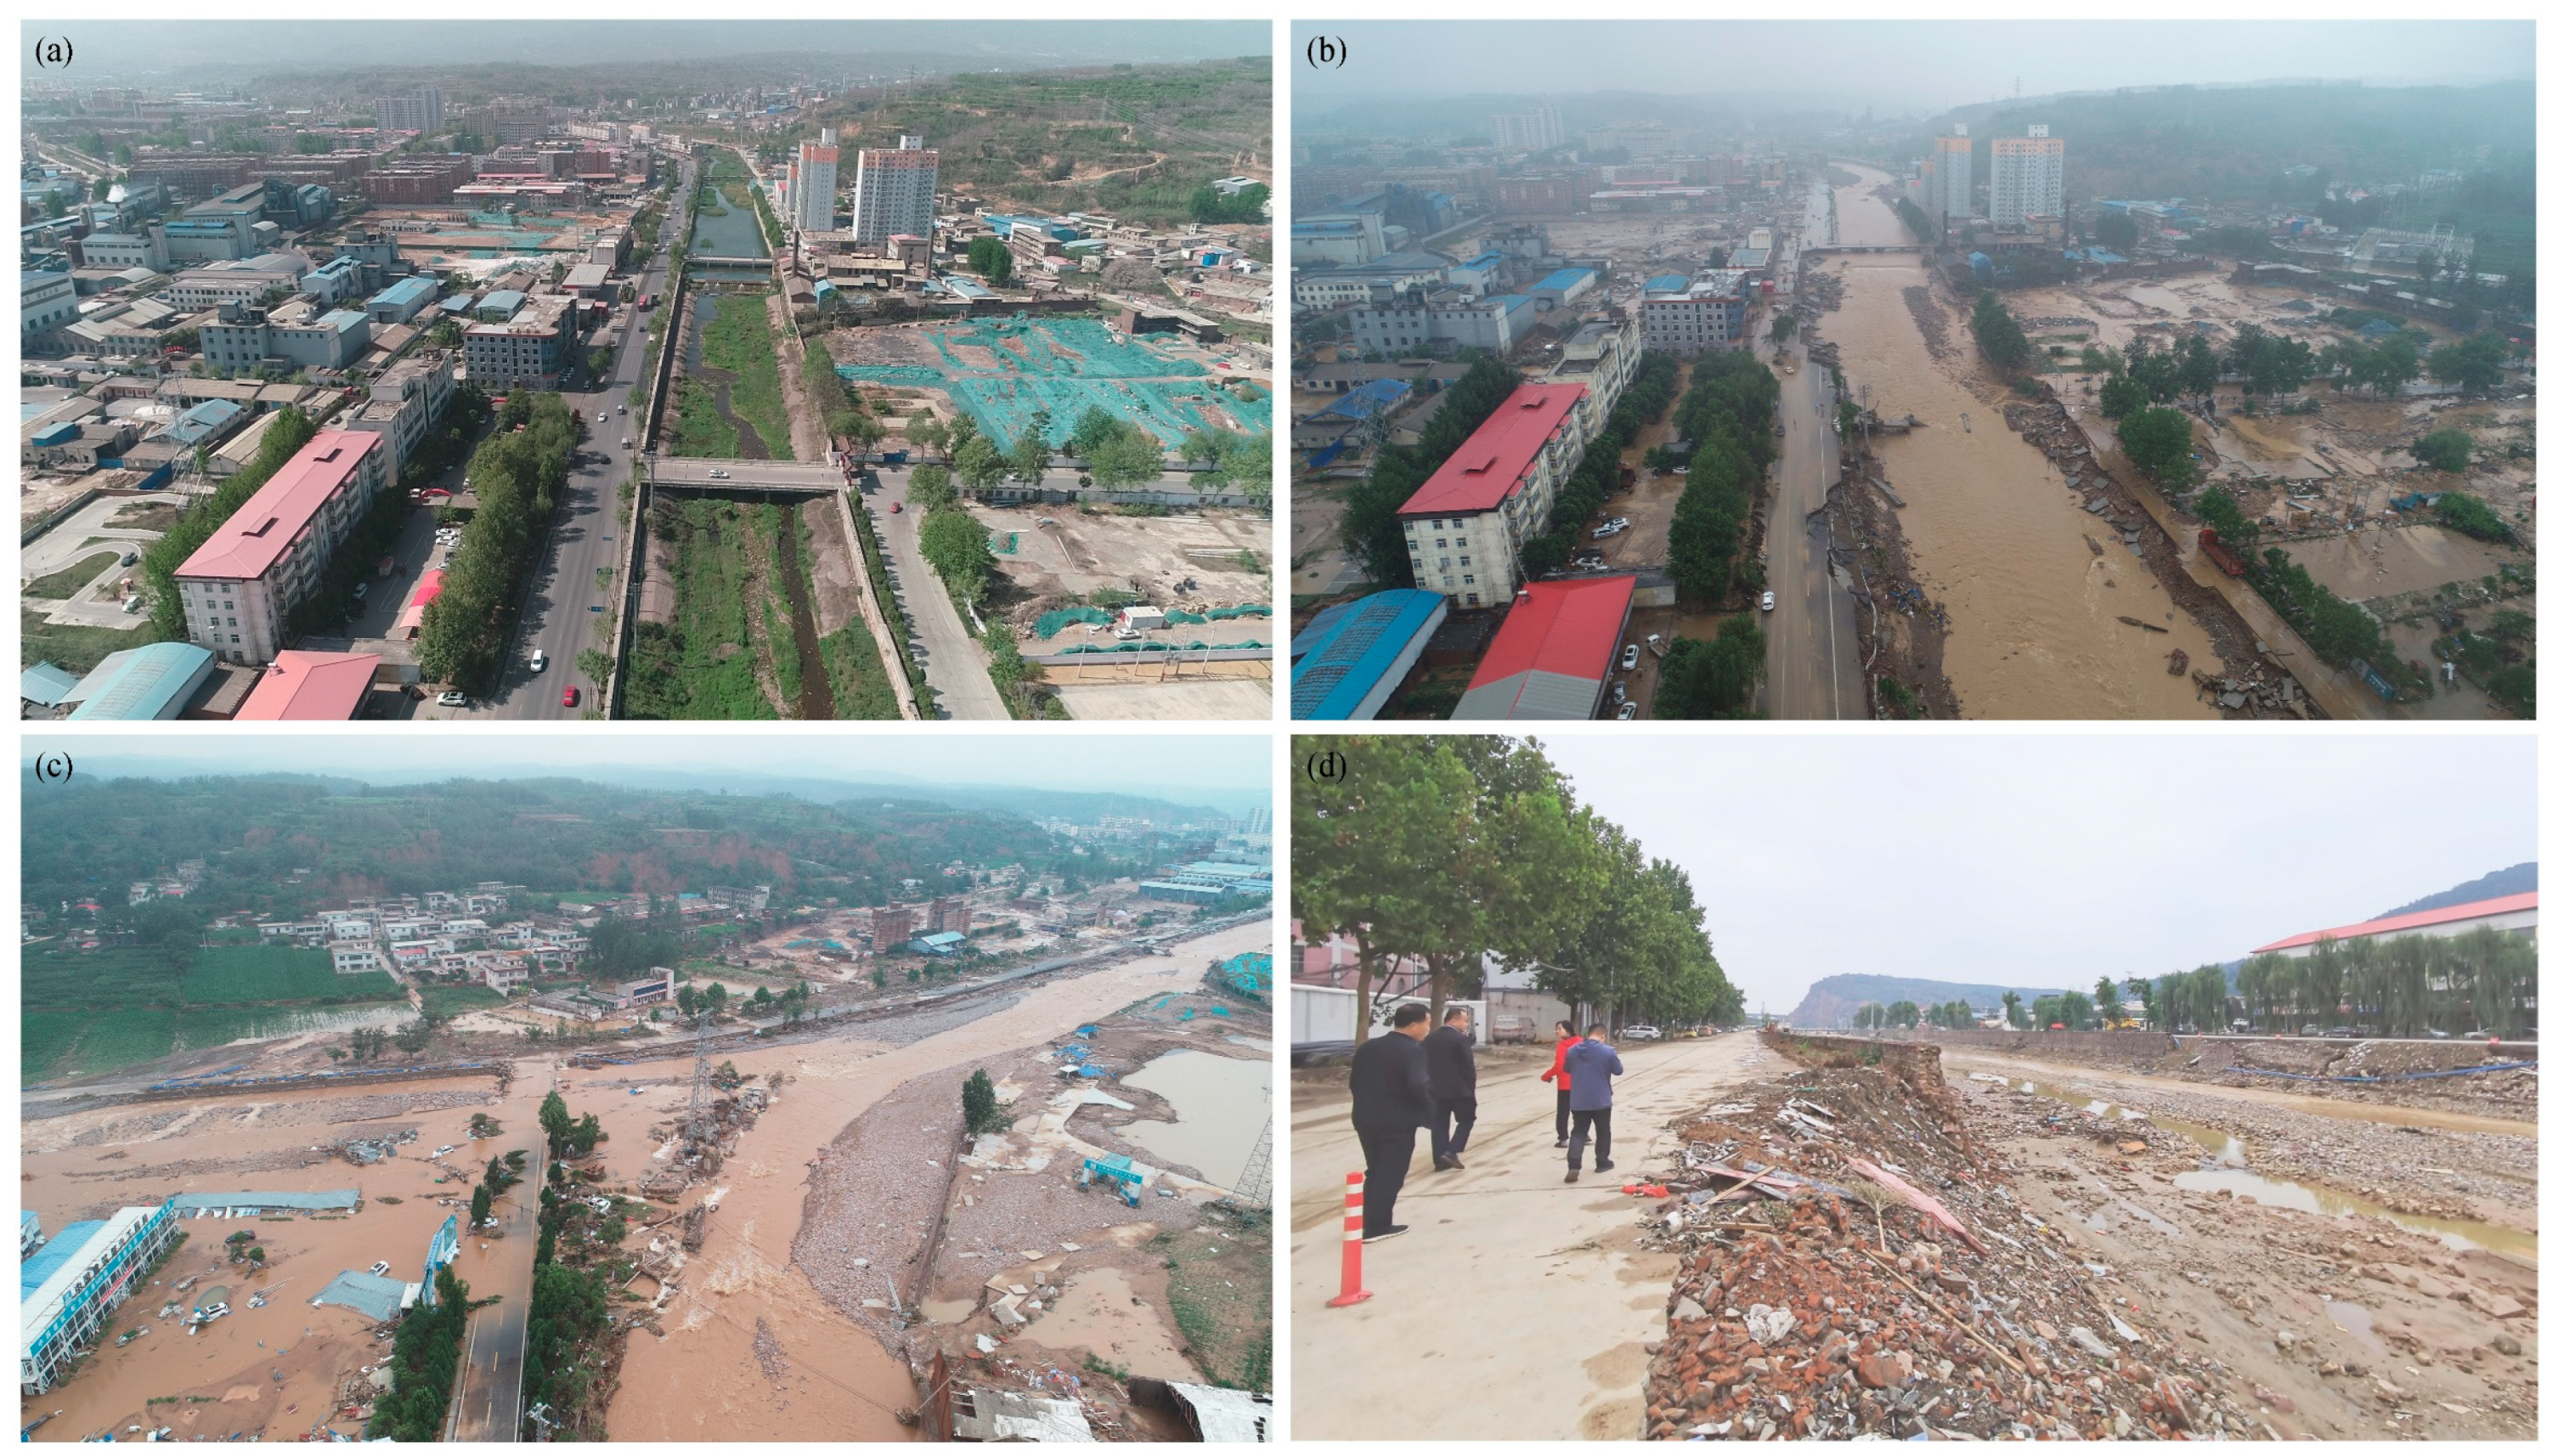
In the “7·20” heavy rainfall event, fast, powerful, and destructive flooding hit Mihe Town, causing significant damage (Figure 6). For example, 28 roads and bridges were washed out; 16 schools, 1 health center, and 1 nursing home were inundated; 406 houses were destroyed; and water supply and drainage, electricity, gas, and communication facilities were damaged to different degrees [36].
Following the disaster, reconstructing the town and enhancing its capacity to cope with increasingly unpredictable and extreme rainfalls in the future was a serious challenge. Thus, this paper adopts the SWA framework to consider this problem from the whole-basin perspective and compares the effect of various combinations of interventions within the analytical region’s source, flow, and sink components. The influences of the source and flow strategies are considered at the catchment level using a hydrologic framework, while the sink strategy is viewed from the site level using a hydraulic framework. The core region of Mihe Town, which begins at the river confluence and has a 9 km river course, is chosen as the modeling site in the sink strategy analysis.
3.1.2. Data Collection
DEM data for this region, with a 30 m resolution, were acquired from the Geospatial Data Cloud (http://www.gscloud.cn/, accessed on 17 June 2022), while the local government provided the elevation points and contour data of Mihe Town. Land use data with a 30 m resolution and soil type data with a 1 km resolution were acquired from the Resource and Environment Science and Data Center (https://www.resdc.cn/, accessed on 17 June 2022). Related hydrologic and hydraulic parameters needed in the modeling were obtained from the HEC-HMS [37] and HEC-RAS [38] technical manuals, based on the GIS and remote sensing images and field survey. The CN value map was produced from the land use and soil type maps using the methods detailed in the SCS-CN method manual [39]. The measured rainfall data were acquired from the China Meteorological Data Service Center (http://data.cma.cn, accessed on 17 June 2022), and the parameters for calculating the designed rainfall event were obtained from the technical manual, Design Storm and Flood Atlas for Small and Medium-sized Watersheds in Henan Province [40].
3.2. Modeling Process and Model Setup
The modeling process integrates hydrologic, hydraulic, and flood-loss curve models, as indicated in the process diagram of this study (Figure 7).
3.2.1. Hydrologic Modeling Process
The hydrologic model is to transform the hyetograph to the hydrograph of a specific location, and the source and flow strategies will influence this transforming process.
- (1)
- The hyetograph
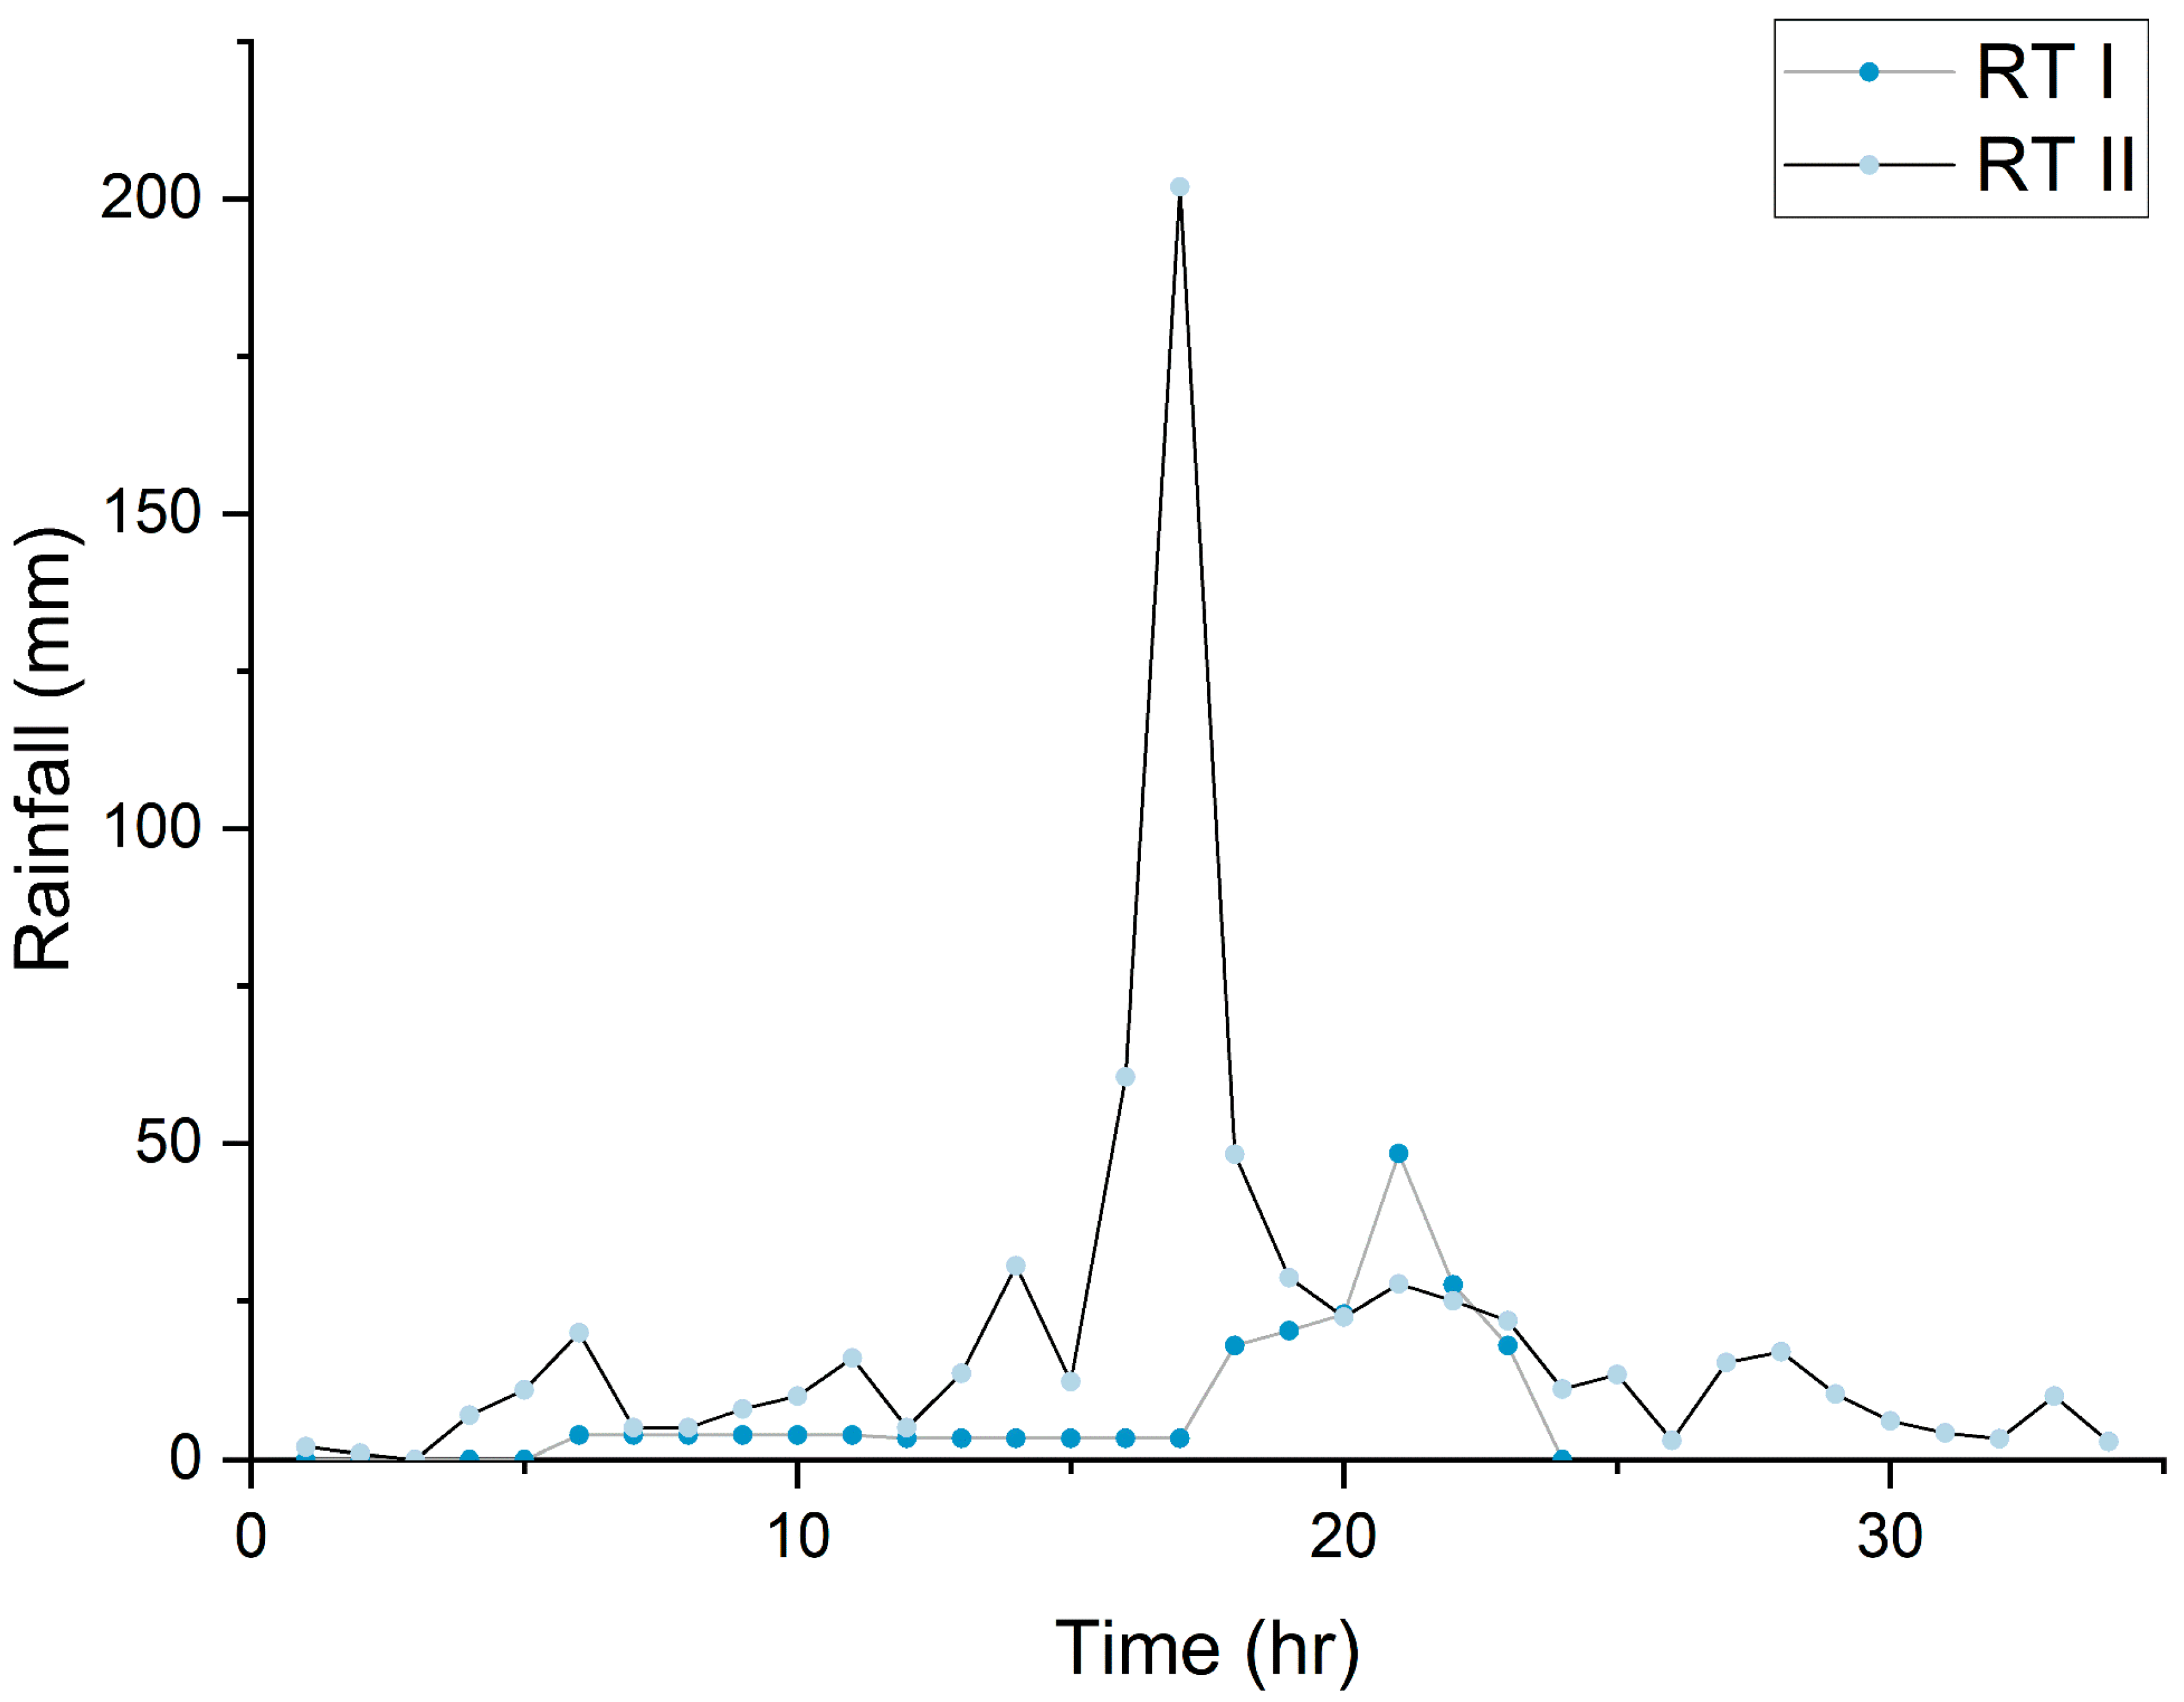
For the hyetograph, the rainfall data consist of two kinds (Figure 8). The rainfall type I (RT I) is the hyetograph of the 50-year recurrence period, which was calculated according to the possible maximum storm distribution pattern in 24 h, with a total rainfall of 198.6 mm. The rainfall type II (RT II) is the hyetograph of Zhengzhou Station in the “7·20” heavy rainfall event, with a maximum rainfall in one hour of 201.9 mm.
- (2)
- The hydrologic model setup
For watershed modeling, HEC-HMS (Hydrologic Modelling System) was used as the modeling environment. This software was developed by the U.S. Army Corps of Engineers’ Hydrologic Engineering Center (HEC) [37] and is widely applied to simulate the rainfall–runoff process in ungauged agricultural watersheds [41], assess the impact of arid area urbanization on flash floods [42], and investigate the effects of land use change on flood hydrographs [43]. Many studies in China have demonstrated that HEC-HMS is suitable for forecasting floods in mountainous watersheds [44,45], and the interflow and subsurface flow can be ignored, owing to their slow speed compared to the surface flow [46].
The area of the SRB above Mihe Town was chosen as the modeling region. In HEC-HMS, this analytic region was divided into 33 sub-basins based on the DEM data to balance watershed heterogeneity and processing capacity. The SCS-CN loss method and SCS unit hydrograph as the transform method were applied to calculate the excess rainfall from the total rainfall and convert the excess precipitation to direct runoff in the watershed. The Muskingum–Cunge model was used as the channel routing method, as its parameters could be directly acquired from GIS and remote sensing images. Base flow was ignored. Further discussion of the modeling details of these methods can be found in Ibrahim–Bathis and Ahmed’s research [41].
- (3)
- Development of the source and flow interventions
The source and flow strategies will influence the hydrograph with different types and intervention magnitudes; thus, an investigation of their effects on the hydrograph, especially on the peak flow value, was conducted. The optimal results of these interventions could be adopted in the following watershed management process.
For simplicity, the effects of the various source interventions such as fish-scale pits, terraced fields, sediment storage dams, and ponds were grouped together and generalized into the detention effects of a single, theoretical pond/reservoir at the outlet of the sub-basin. Doing so arose out of two considerations. First, it is a lumped modeling approach for the sub-basin, while the storage and detention effects could be further investigated using the semi-lumped or distributed models such as the SWAT [47]. Second, the purpose of this modeling is to evaluate the effectiveness of these interventions and make more effective re-construction plans quickly; thus, it is essential to keep the model simple. In the HMS model, the pond/reservoir at the outlet of the sub-basin is modeled using the reservoir component with an outflow structure, which means that if the upstream runoff fills the pool, the water will spill over the dam-top to the downstream river, and no back-water effect is considered [48].
The detention volume in RT I (DV50yr) is used to reflect the effects of source interventions under the 50-year recurrence period rainfall condition, which is represented by the pond/reservoir storage in the sub-basin and calculated using the following formula:
where DV50yr is the designed detention volume of a sub-basin; P50yr is the precipitation in the 50-year occurrence rainfall event, with a value of 200 mm for the simplicity of the calculation; A is the area of the sub-basin; and Cr is the control rate of the sub-basin to the rainfall falling into it, expressed in terms of the percentage of total rainfall. For comparison, Cr ranges from 1% to 80% and stays the same in all the sub-basins, and DV50yr is also used as the detention volume of the sub-basins in RT II to determine the effects of basin storage under different climate conditions.
DV50yr = P50yr × A × Cr
For the flow interventions, the two most practical measures—widening the river course and replacing the riverbank materials—are modeled to conduct a comparison. For the former, the river width is changed; for the latter, the roughness of the bank in the Muskingum–Cunge method is changed. These interventions are applied to all the river courses in the watershed, with the widening ratio from 0.1 to 5 and the Manning’s n from 0.01 to 0.05.
3.2.2. Hydraulic Modeling at the Sink and Its Validation
This study focused on the flood inundation situation of the core region of Mihe Town along the major stream, i.e., the sink area. With the hydrograph produced by the above hydrologic model, the flood inundation status of the sink area could be acquired through hydraulic modeling.
A hydraulic model of the main river course along Mihe Town was set up with HEC-RAS. The HEC-RAS (River Analysis System) model was also developed by the HEC institute [38] and is widely used to produce flood inundation maps based on digital elevation models (DEMs), river cross-section characteristics, and other related information in a 1D manner [49], while a 2D simulation function has been developed recently [38]. The 1D mode was applied in this study, for the width of the floodplain is larger than three times the width of the main river channel in the core region, and the channel/overbank systems were well-defined, which is in accordance with the general rule of thumb of choosing a 1D model [50]. The steps in 1D modeling mainly included plotting the river centerline, the cross-sections of the river course, and other elements required in HEC-RAS software based on the DEM and Manning’s n map data and running the model with the peak flow output from the HEC-HMS as the input [51]. This integrated modeling using HEC-HMS and HEC-RAS is widely applied to forecast optimal flow releases in the watersheds for flood control [51] and to compare the effects of storage facilities in the upstream, midstream, and downstream portions of the watershed on downstream flooding [48], among other things.
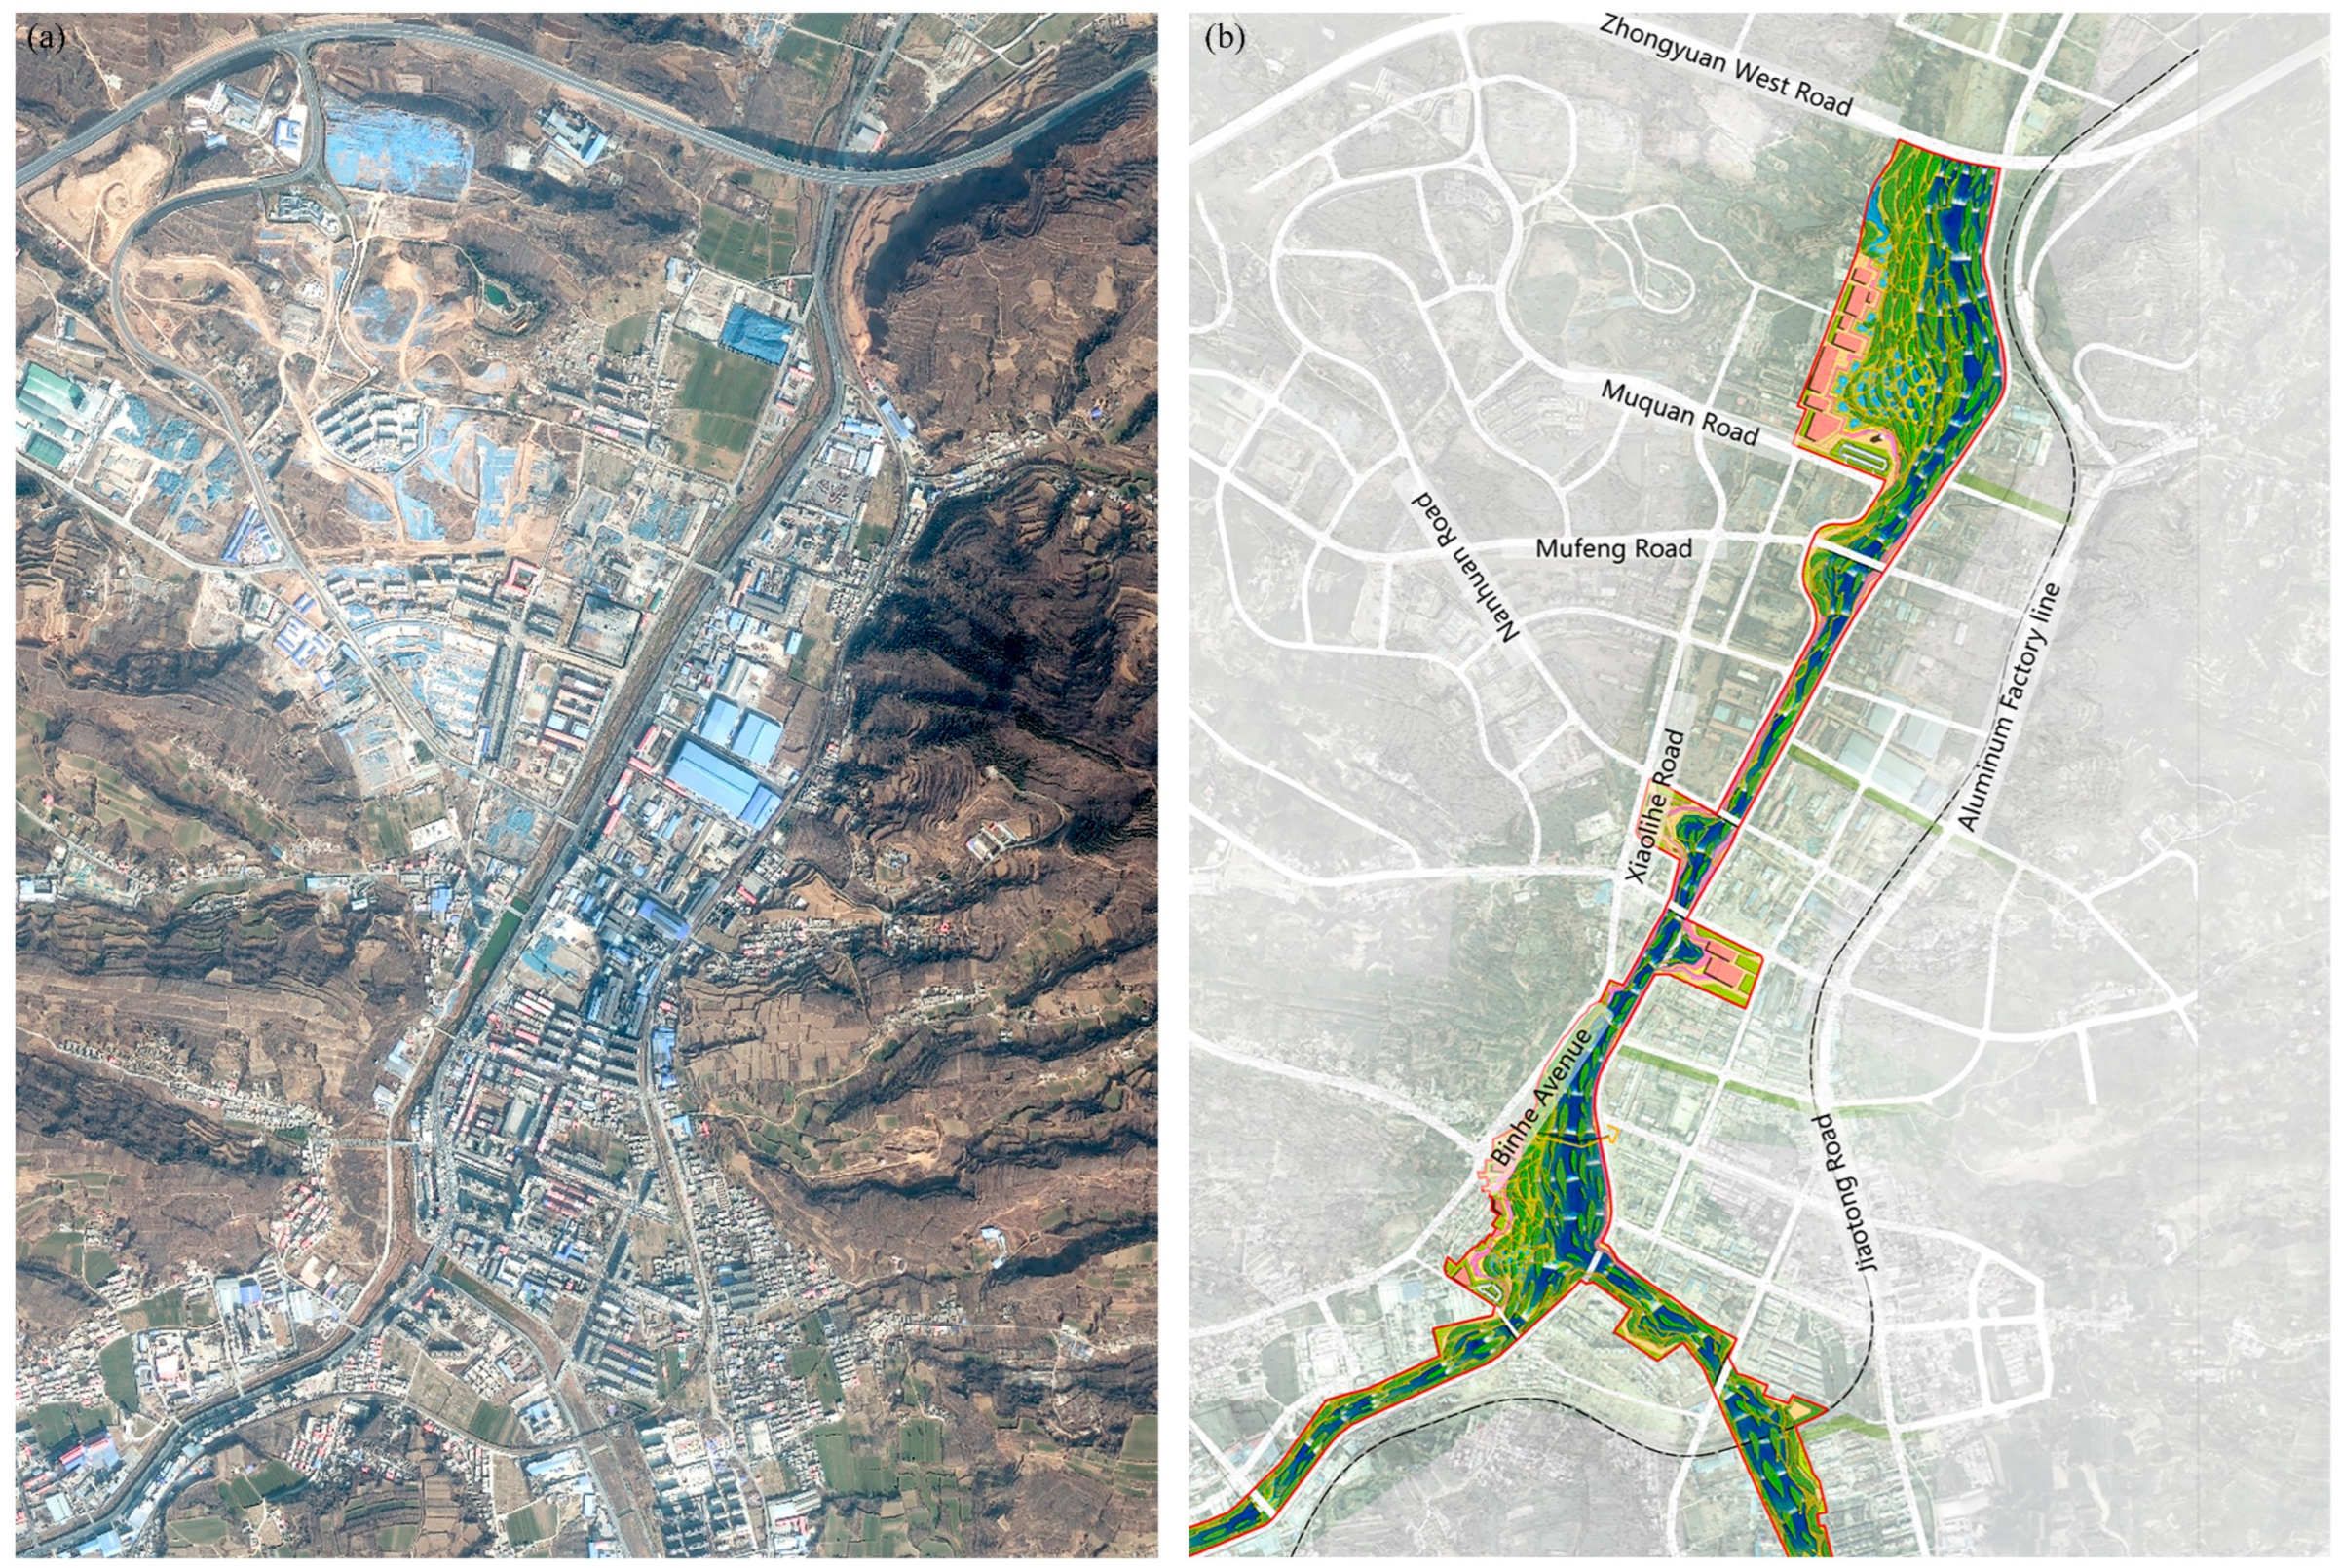
The intervention measures at the sink would influence the flood inundation status; thus, the core region after the intervention (Figure 9), which the experienced designers generated according to the primary “leaving room for water” principle, was modeled following the above process and compared with the flood inundation areas without the sink adaptation interventions.
The above models could not be calibrated because there is no hydrological monitoring station in the SRB. To address this issue, the inundation area generated by the HEC-RAS model in the RT II condition was compared with the flooded area drawn from the satellite map after the “7·20” rainfall event. If these two areas matched well, then both the HEC-HMS and HEC-RAS models could be validated.
3.2.3. Flood-Loss Calculation
Although the coupled hydrologic and hydraulic models with the GIS tool are powerful ways to forecast flood hazards and their magnitude, they cannot directly evaluate the damage related to flood disasters. Several empirical models have been developed to calculate property and life flood losses, such as the HEC-FIA and HEC-LifeSim models [52] and the depth-damage relation method [20].
In the depth-damage relation method, increasing flood depth increases flood damage; thus, it is a straightforward way to calculate flood losses, and it is adopted here. The formula is as follows:
Flood Loss = Inundation building area (m2) × Flood depth (m)
Focusing on the site scale, the sink interventions take two main forms. The first is widening some portions of the floodplain to make more room for floodwater, and the river and floodplain widening plan is developed according to the core region’s existing condition and local residents’ needs for recreation and leisure opportunities, as shown in Figure 9. This intervention would change the inundation building area and flood depth at the same time. The second is raising the base of buildings and roads, which would only change the flood inundation depth of the buildings. The base-raising effects on flood-loss reduction were calculated by decreasing the flood inundation depth of a building if it raised its base in the above formula.
3.3. Simulation Scenarios of SWA Strategies
To fully understand the effects of different interventions under varying rainfall conditions, scenario analysis is used, and the peak flow, inundation area, and flood loss in various scenarios are compared. Based on the facilities for the sponge watershed described above, eight intervention scenarios were proposed (Table 1). Each intervention scenario has two rainfall scenarios: RT I and RT II.
In these scenarios, is the existing situation without any interventions, providing a reference point for all other scenarios. and are the optimal strategies determined by their effects on peak flow value reduction. means adopting the sink area after the intervention in the hydraulic modeling.
and will influence the peak flow value, thus changing the inundation area and flood depth, while will not change the peak flow value upstream of the control point but will influence the inundation area and flood depth. Other than , elevating the base of buildings and roads is also a kind of sink strategy, which only influences the flood depth; thus, this strategy was not included in the scenarios but was chosen as the variable to compare the intervention magnitude at the sink, and the height series include 0.5 m, 1 m, 1.5 m, and 2 m.
4. Results
4.1. Model Validation Using Flood Conditions
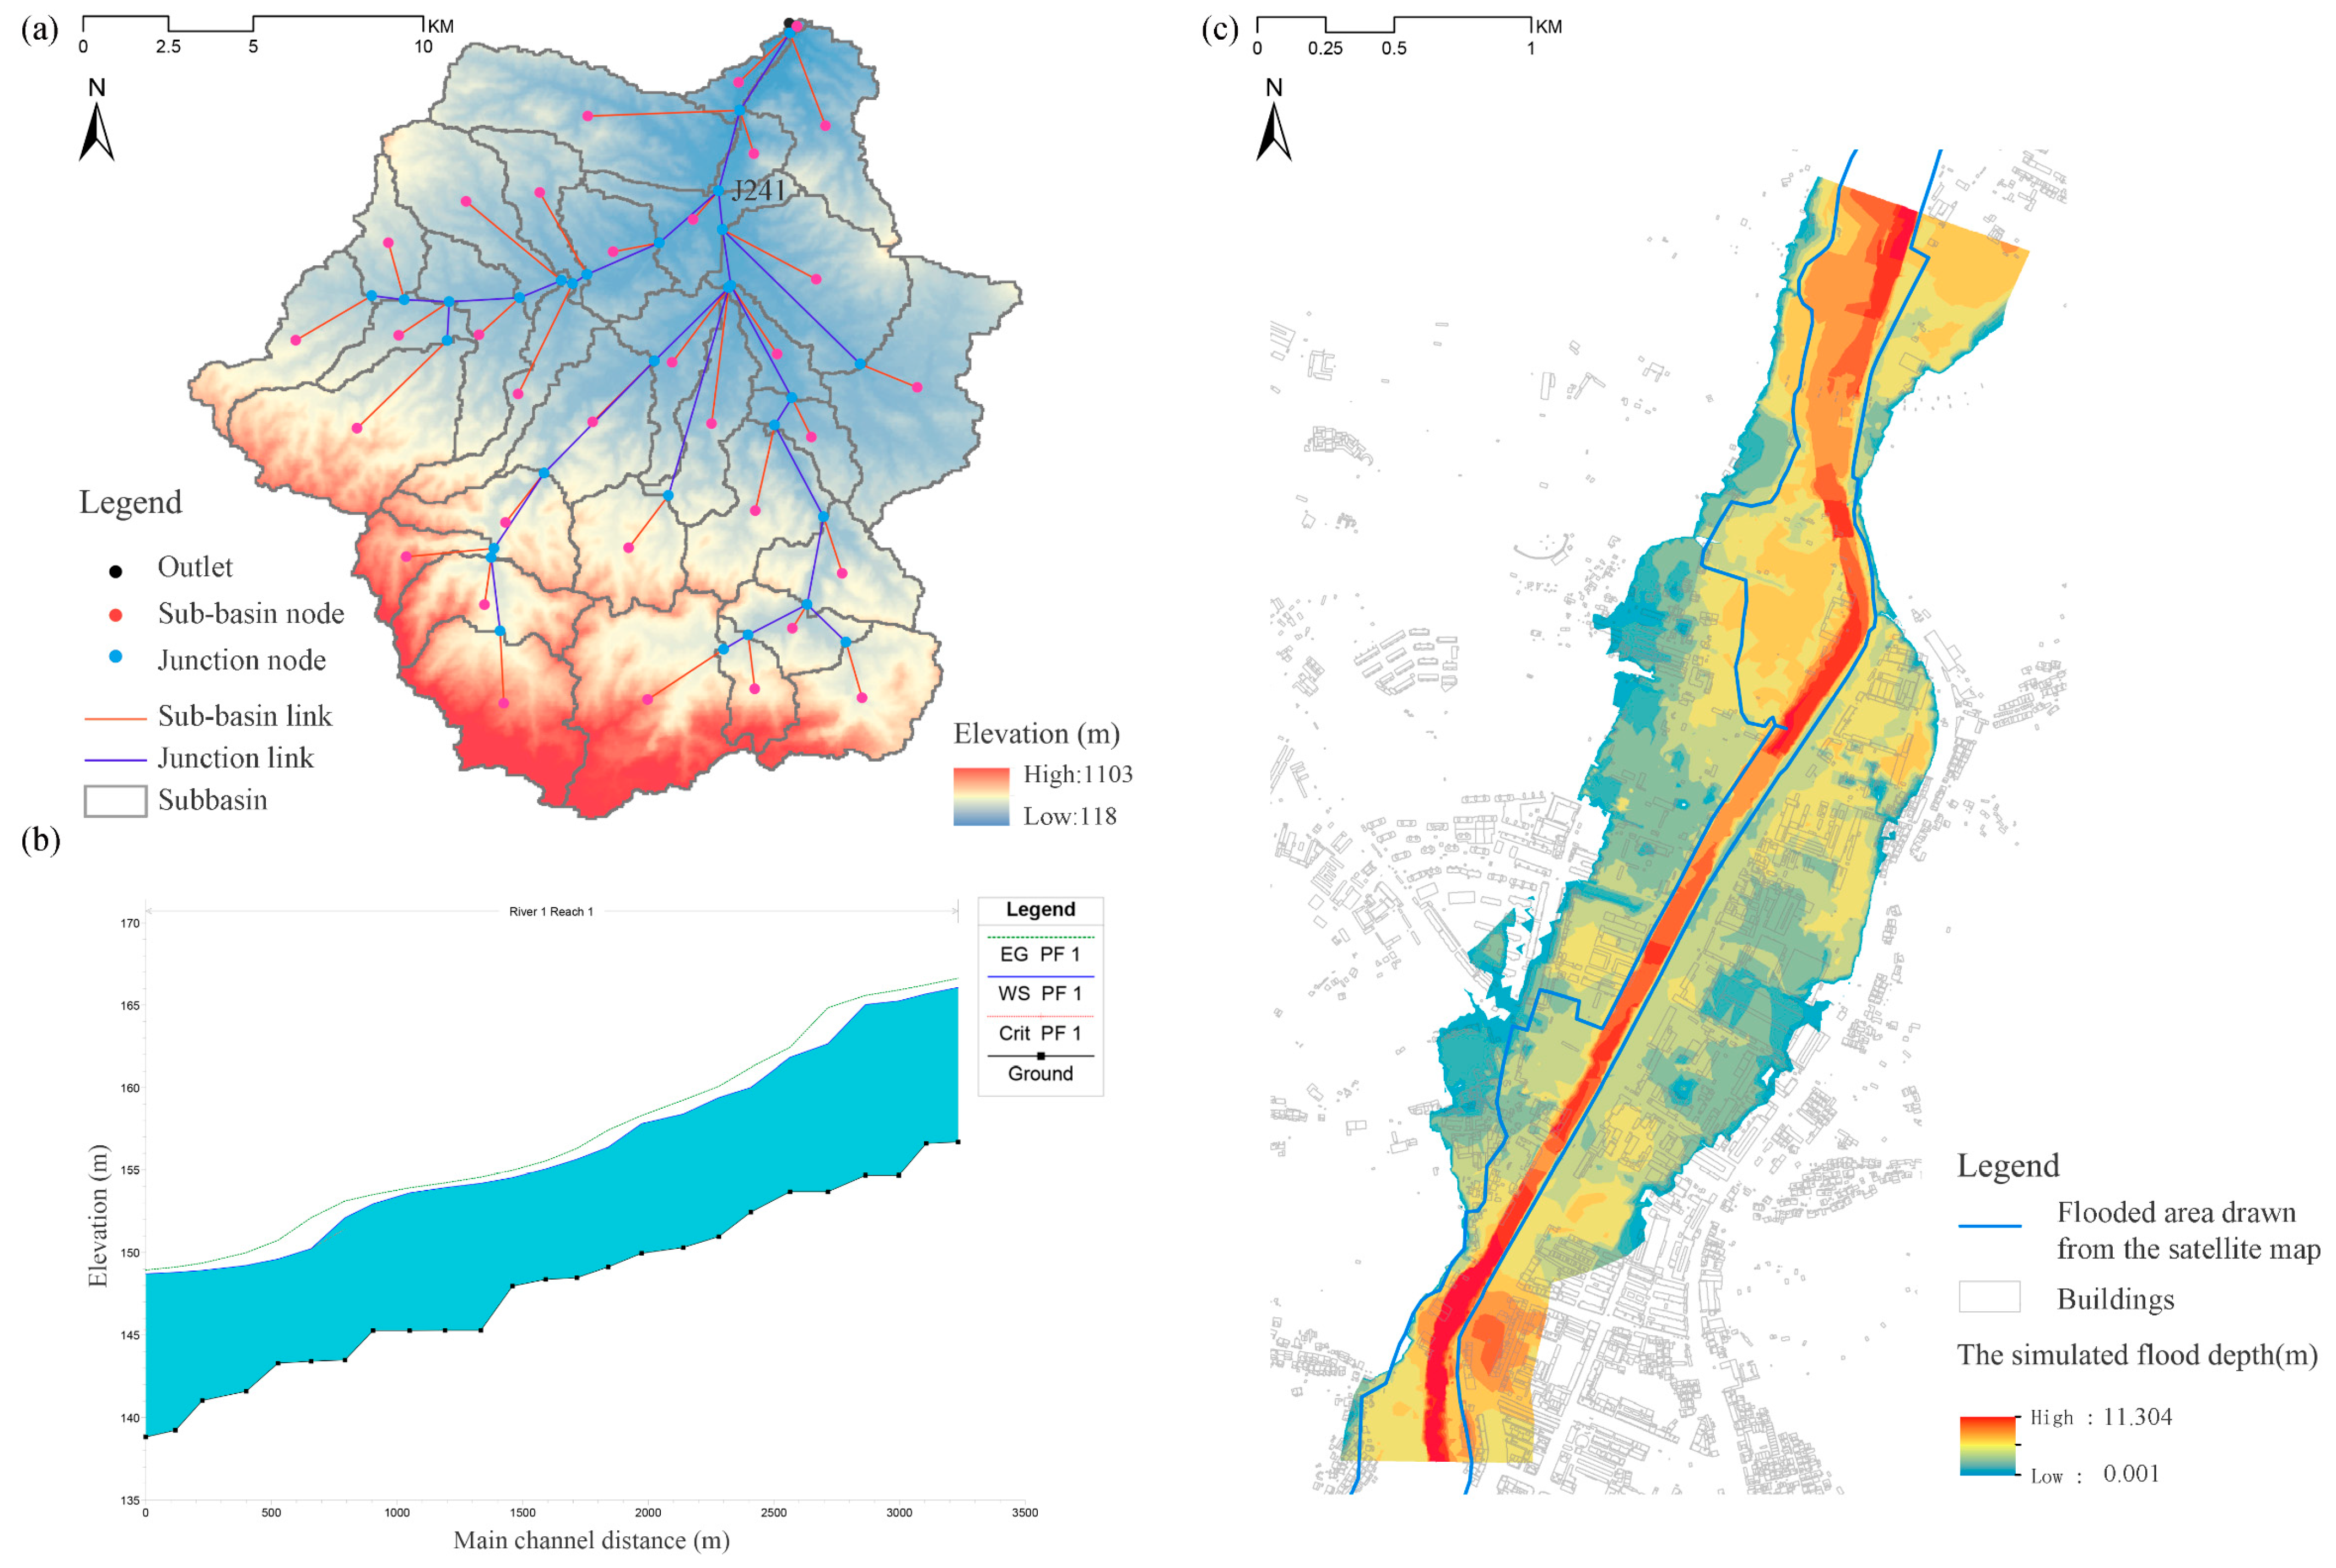
HEC-HMS modeling with 33 sub-basins was set up, and the river confluence point, junction J241 in the model, was chosen as the control point to compare the model’s accuracy and effects. From the water table profile from J241 to the outlet of the analyzed basin, it could be seen that the river slope is large; thus, the flow speed is high, with a correspondingly high destructive power (Figure 10).
For J241, the peak flow value acquired from the HEC-HMS is 7272.5 m3/s in RT II. Using this value to drive the HEC-RAS, the simulated inundation area of the core region of Mihe Town presents a similar trend as the actual flooded area in the “7·20” rainfall event, which is drawn from the satellite map (Figure 10). The most severely hit regions, such as the area downstream of the J241 where the river bends, overlap to a certain extent; thus, the modeling structure and parameters seem to reflect the actual situation of this analyzed region. Further investigations could be promoted based on current modeling.
It should be noted that the simulated inundation area is larger than the flooded area shown in the satellite map of the actual disaster. This is because the flooded area drawn from the satellite map is comprised of those areas that suffered the greatest damage, such as buildings, roads, or bridges, while other sites that saw only minor inundation are not included; the simulated inundation area reflects all areas that could possibly be inundated, which results in a greater total area. Ultimately, the precautionary principle suggests that overestimating the total extent of flooded areas will ensure a higher safety standard.
4.2. The Effects of the Source and Flow Strategies on Peak Flow
4.2.1. The Effects of the Source Strategy
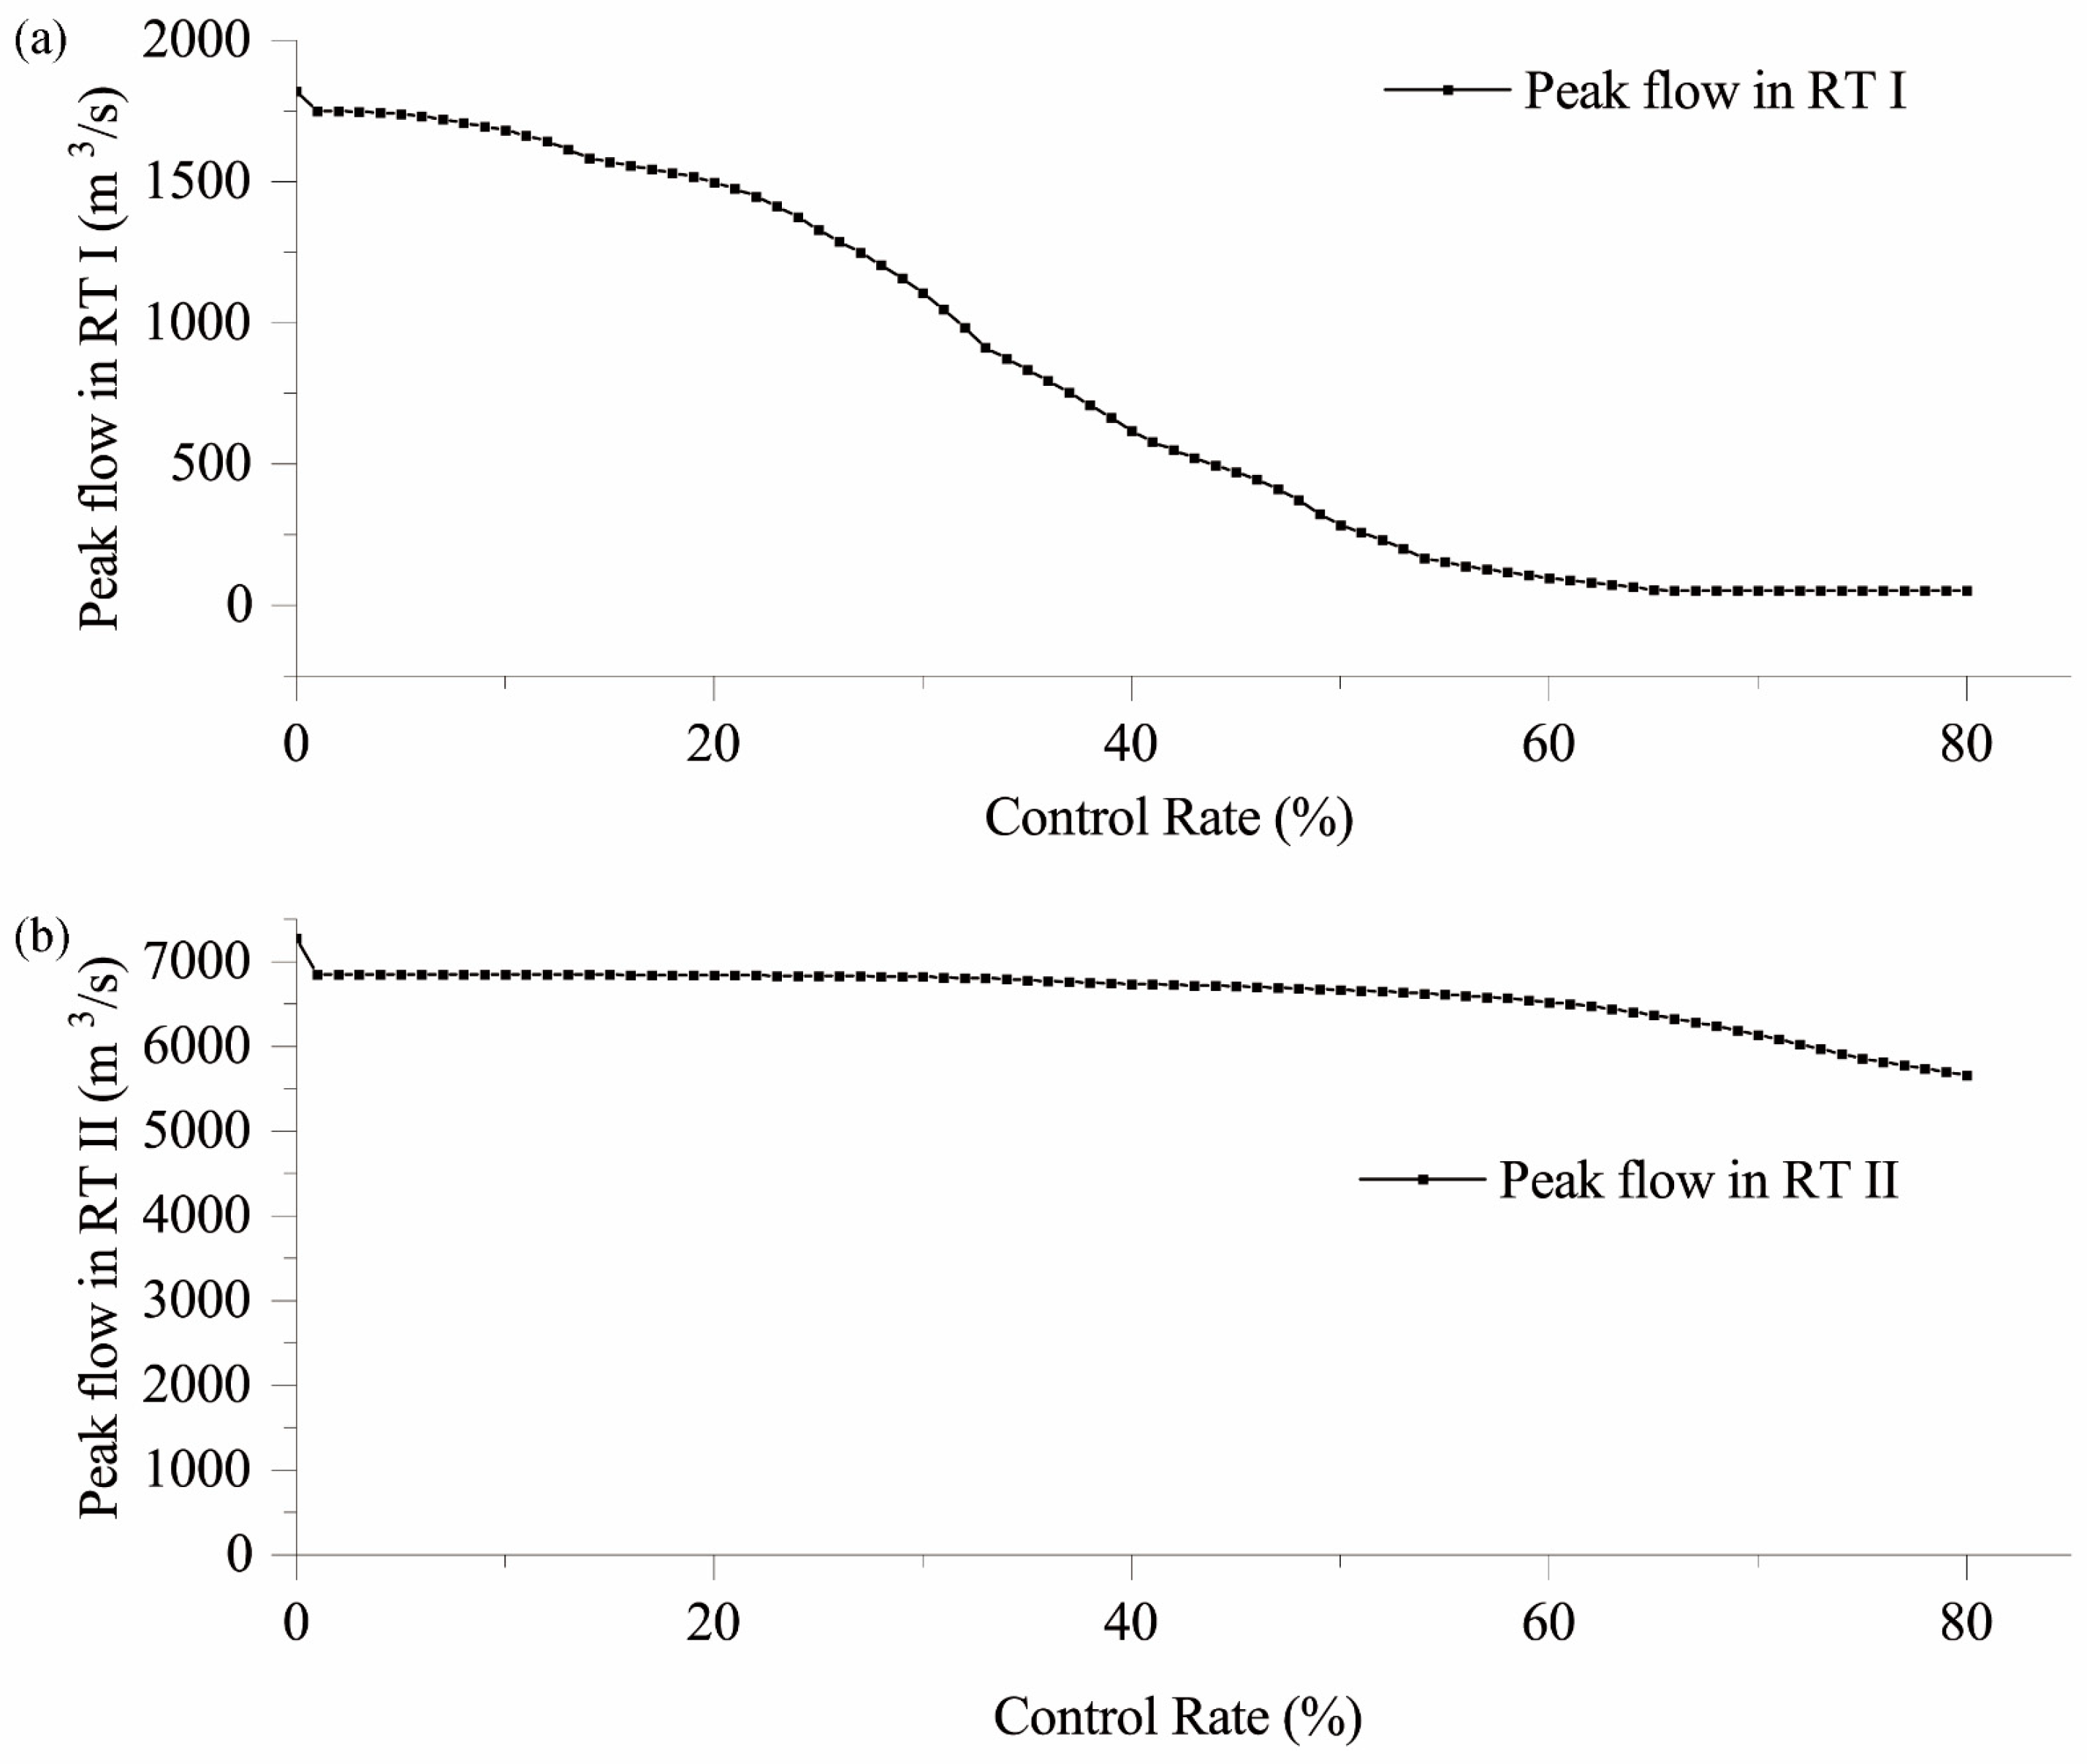
The peak flow at the control point, J241, was simulated and compared under two rainfall conditions (Figure 11). Without any SWA interventions, the peak flow value was 1820.5 m3/s in RT I and 7272.5 m3/s in RT II; the latter is four times more than the former. With the increase in Cr, i.e., the DV50yr of each sub-basin, the peak flow in RT I presents a non-linear effect, while the peak flow in RT II does not change significantly. In RT I, the peak flow curve decreases largely then slowly, with the first two thresholds at 14% and 33% and the third threshold at 60%. In RT II, the peak flow curve changes only slightly compared to its high original value. For example, it only decreases from 6846 m3/s to 6818 m3/s as Cr increases from 1% to 30%, and until Cr reaches 60%, the peak flow value presents a more significant decreasing trend. It should be noted that the considerable decrease in peak flow as Cr increases from 0 to 1% in these two rainfall conditions is caused by the modeling process. The introduced reservoir component changes the model structure, but this has little influence on the general trend of the peak flow curve.
The above analysis indicates that the design storage facilities aiming to adapt to RT I greatly attenuate the floods but have little influence on floods in RT II. In RT II, unless the DV50yr is quite high, storage facilities at the source alone are insufficient to cope with the flood disaster; thus, flow and sink interventions are needed. For practical purposes, Cr is determined as 15%, with a peak flow value of 1570 m3/s in RT I and 6844 m3/s in RT II. Therefore, each sub-basin would retain an additional 15% rainfall in RT I over its existing inception and infiltration capacity.
These additional storage capacities are provided through the intervention measures mentioned in Section 2, such as fish-scale pits, terraced fields, ponds, forestation, and check dams. In each sub-basin, the size and location of these measures would be determined according to slope, soil type, and other land use characteristics.
4.2.2. The Effects of the Flow Strategies
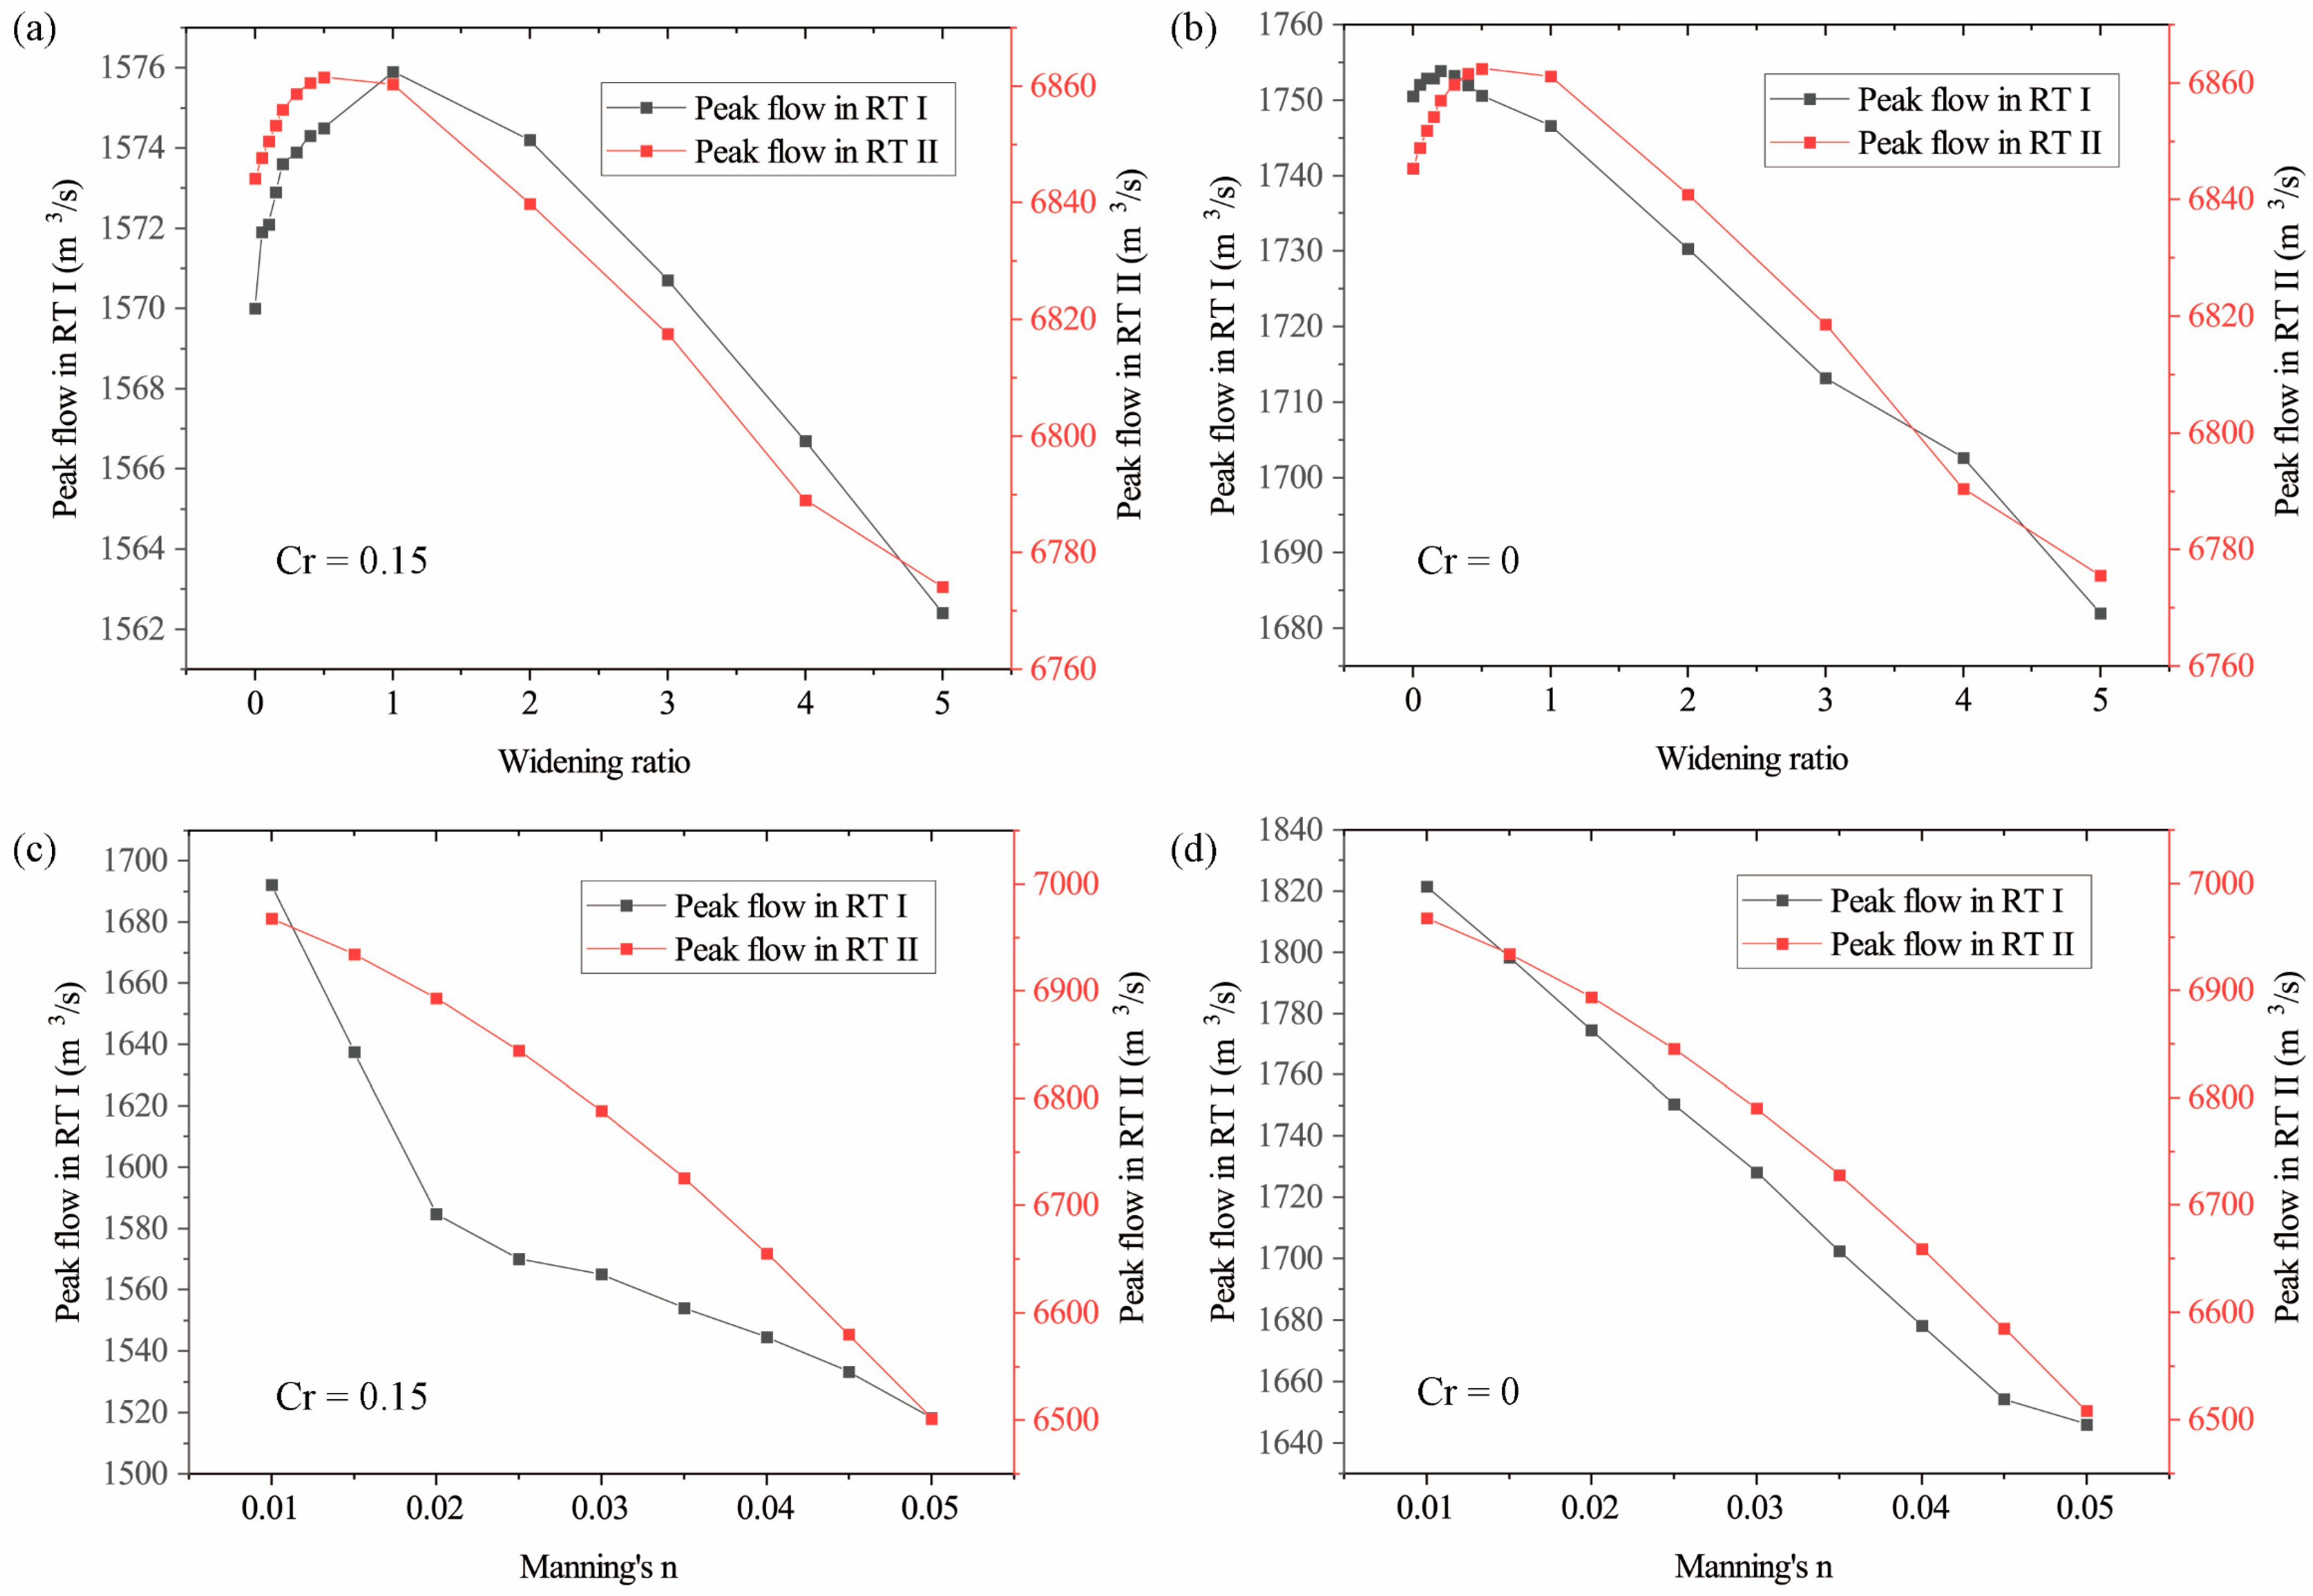
Flow intervention measures are implemented throughout the basin. Two main measures with different parameters are compared to determine the relationship between peak flow and flow strategy and to determine the optimal parameters that could be adopted in following analytics and practice (Figure 12). This section’s simulations are based on two conditions, i.e., with the optimal 15% Cr in the above source strategy step and without detention facilities at the source, with the climate conditions of RT I and RT II.
For the first flow-intervention measure, widening the river, the peak flow at the control point J241 is not directly proportional to the widening ratio of the river course. In RT I, with the Cr as 15%, when the widening proportion is less than 1×, the peak flow increases as the river width increases; when the widening ratio is more than 3×, the peak flow is less than its initial value. The peak flow in RT II with the Cr as 15% presents a similar trend, with the thresholds varying a little. The effects also hold on when the Cr changes to 0, although the thresholds vary. This phenomenon may be caused by the enhancement of the discharge capacity of the rivers upstream of the control point. Widening the river course downstream of J241 would reduce the flood peak value by attenuating the back-water effect downstream. So, in practice, river widening will only be necessary downstream of the control point rather than throughout the whole basin.
For the second flow-intervention measure, the effects of changing the riverbank material and construction method are reflected in the Manning’s n parameter. It can be seen that Manning’s n presents an inversely proportional effect on the peak flow at J241, whether in RT I or RT II. There exists a threshold of approximately 0.02 in RT I when the Cr is 15%. As the Manning’s n value of the riverbank reaches 0.05, which is the usual value for a natural bank with shrubs, the peak flow decreases from 1570 m3/s to 1518 m3/s in RT I and decreases from 6844 m3/s to 6502 m3/s in RT II with the optimal detention volume. In practice, the optimal strategy for the riverbanks would be to restore them to natural conditions in order to bring the Manning’s n up to 0.05.
4.3. The Assessments of SWA Strategies for Flood Mitigation
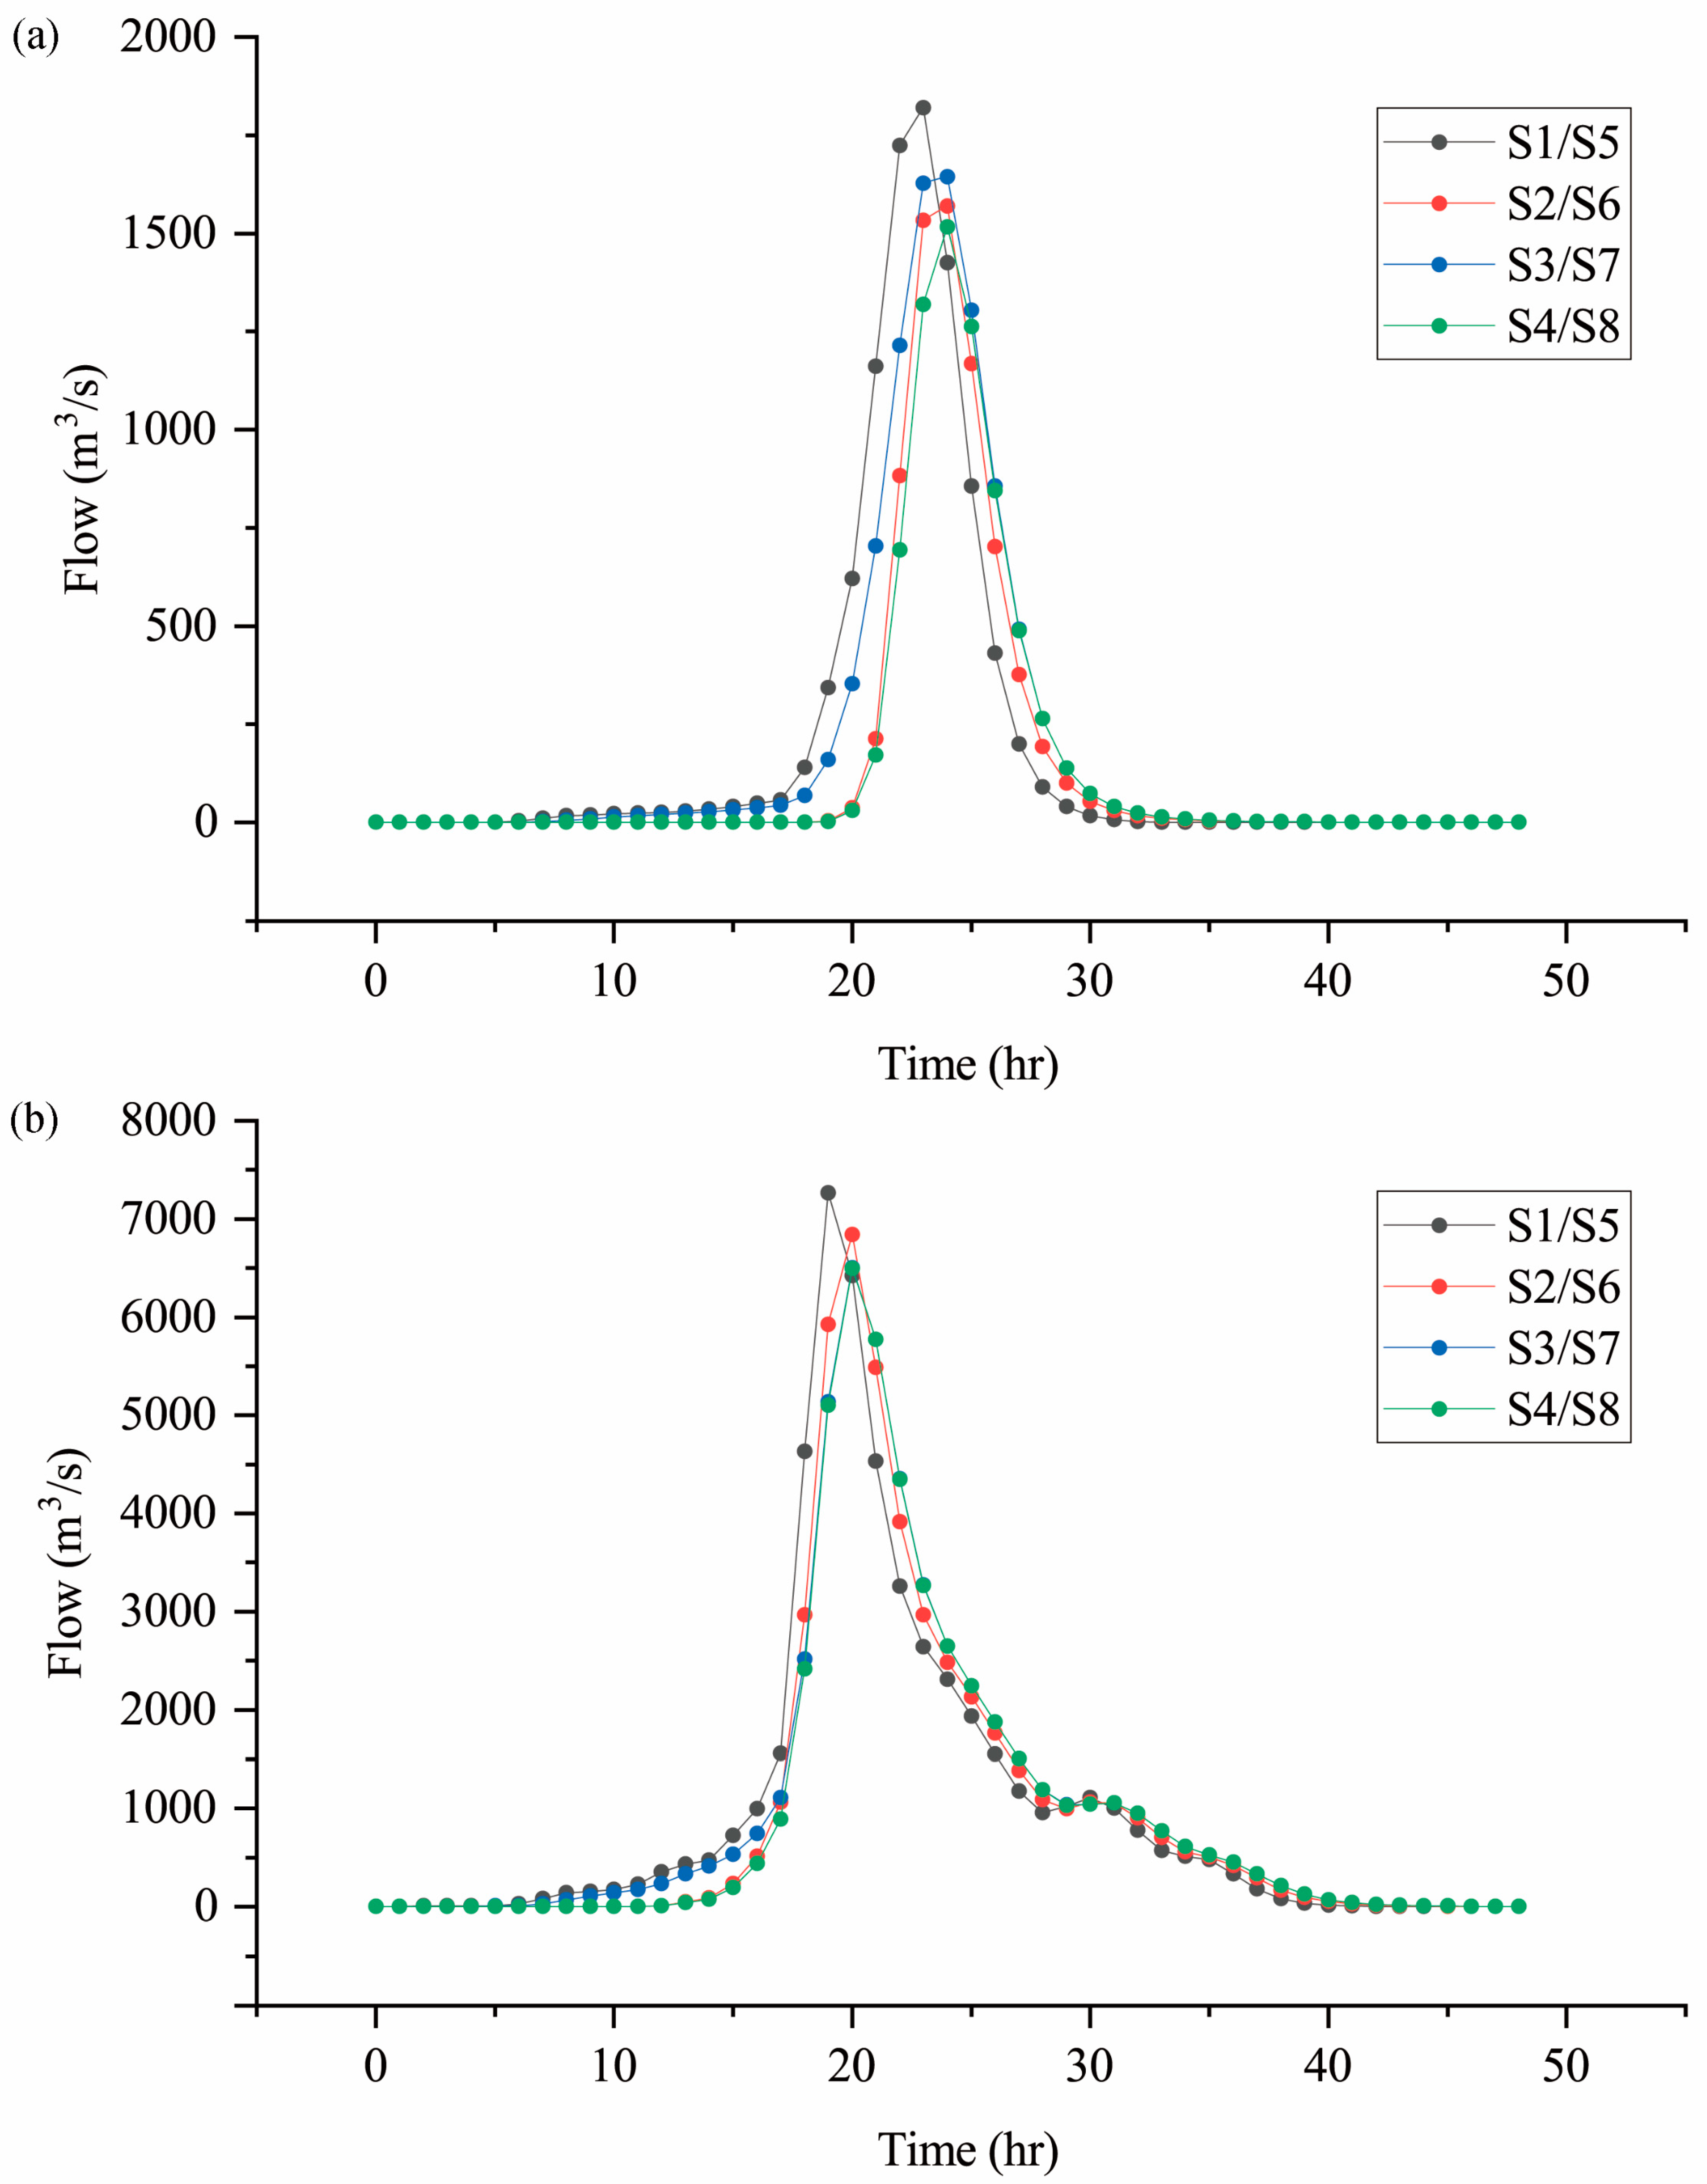
4.3.1. The Effects on Hydrograph and Peak Value
Different intervention measures have different influences on the hydrograph of the control point (Figure 13). As implementing the sink strategy would not change the flow process upstream of the control point, in the scenarios, S5 has the same hydrograph as S1, and so does S6 and S2, S7 and S3, and S8 and S4. It could be seen that the optimal source strategy (1570.1 m3/s) is more effective compared to the optimal flow strategy (1645.9 m3/s) in RT I in terms of the peak flow value reduction, while the optimal flow strategy (6508.3 m3/s) is more effective than the optimal source strategy (6844 m3/s) in RT II. The combination of S2 and S3, i.e., S4, performs better than each.
4.3.2. The Effects on Inundation Area and Flood Loss
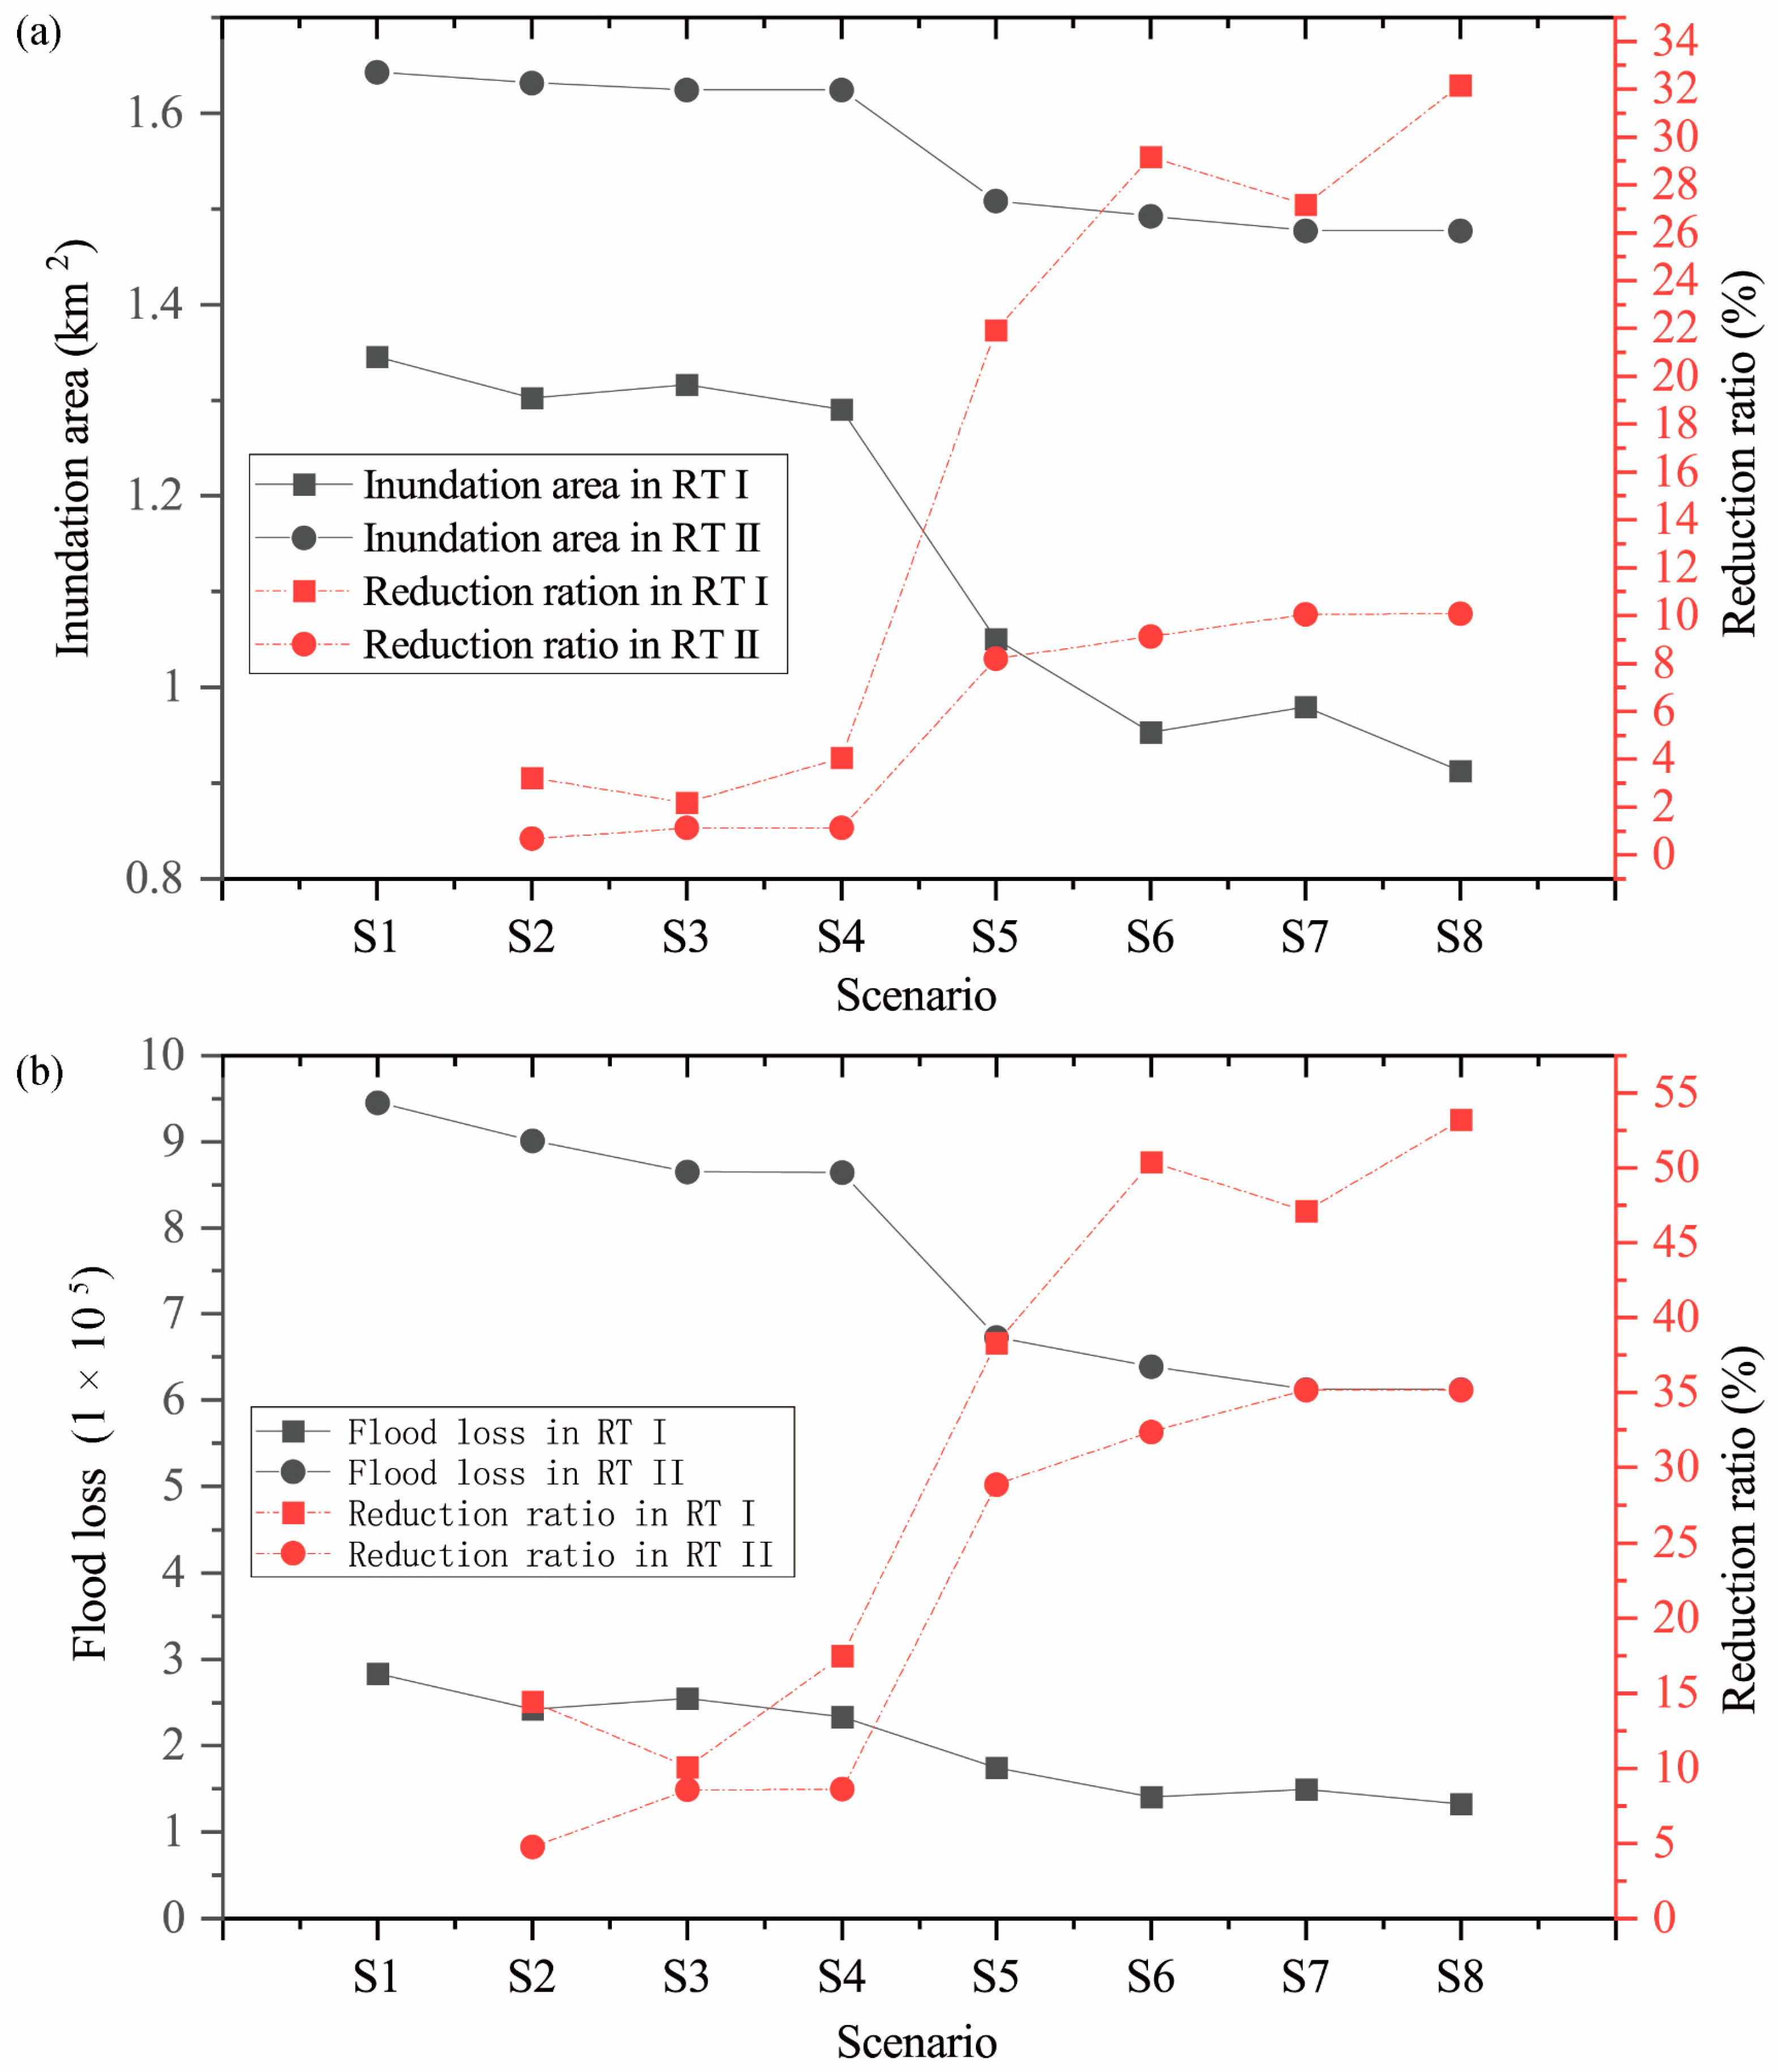
Two indexes are used to compare the flood disaster reduction effects under different scenarios (Figure 14). It can be seen that, when implementing interventions at the sink, the curves of these two indexes drop drastically, i.e., the reduction ratio increases rapidly from S4 to S5. This indicates that, regarding the current intervention and parameter settings, adaptive and resilient measures at the sink could reduce the flooding disaster and protect the built area more effectively than source and flow interventions. The reduction ratio of the inundation area (32.2% in S8, RT I) is less than that of flood loss (53.2% in S8, RT I), and the reduction of RT I is higher than that of RT II in all scenarios.
Specifically, the reduction ratio of flood loss in S3 is the lowest value (10.1%) compared to other scenarios in RT I, while the lowest value appears in S2 (4.7%) in RT II. This indicates that, if only one intervention measure is chosen, the source strategy is suitable for coping with the designed rainfall condition as RT I, and the flow strategy is suitable for coping with the unexpected extreme rainfall condition as RT II.
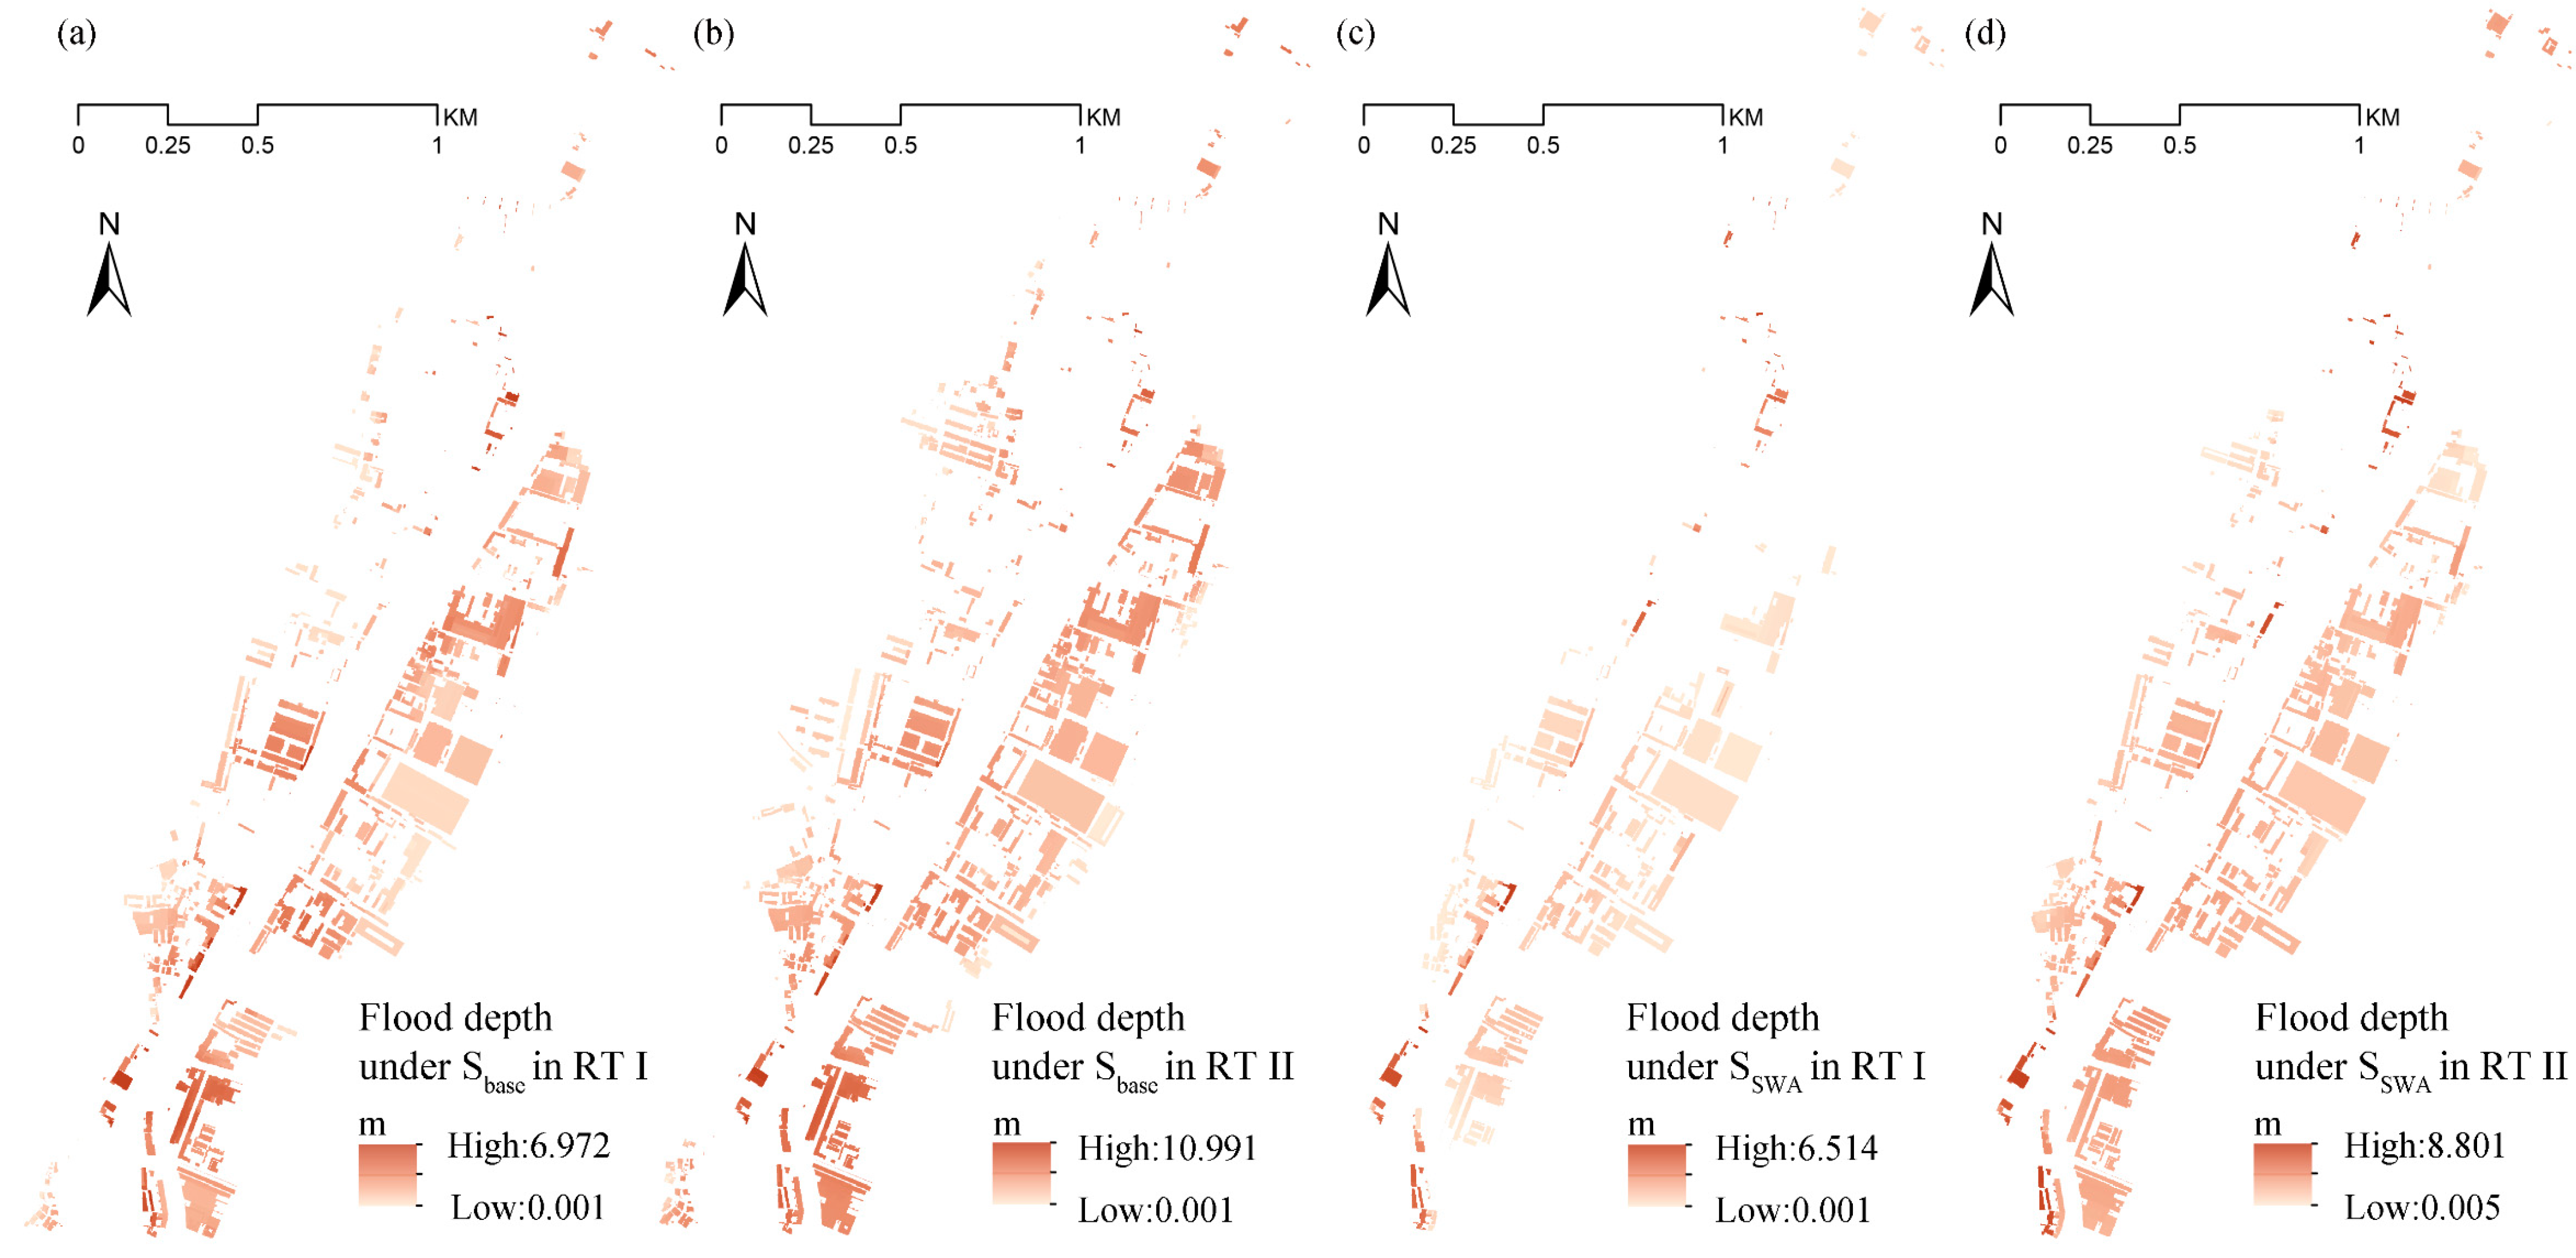
More insights could be acquired from analyzing the spatial distribution of flood loss (Figure 15). For example, the inundated area of SSWA is much smaller than that of Sbase, and some structures always suffer serious inundations with or without interventions in these two rainfall conditions. Thus, these structures’ placement should be adjusted. In conclusion, these SWA interventions significantly reduce flood impact and enhance the city’s resilience to extreme weather.
4.3.3. The Effects of Elevating Structures’ Bases
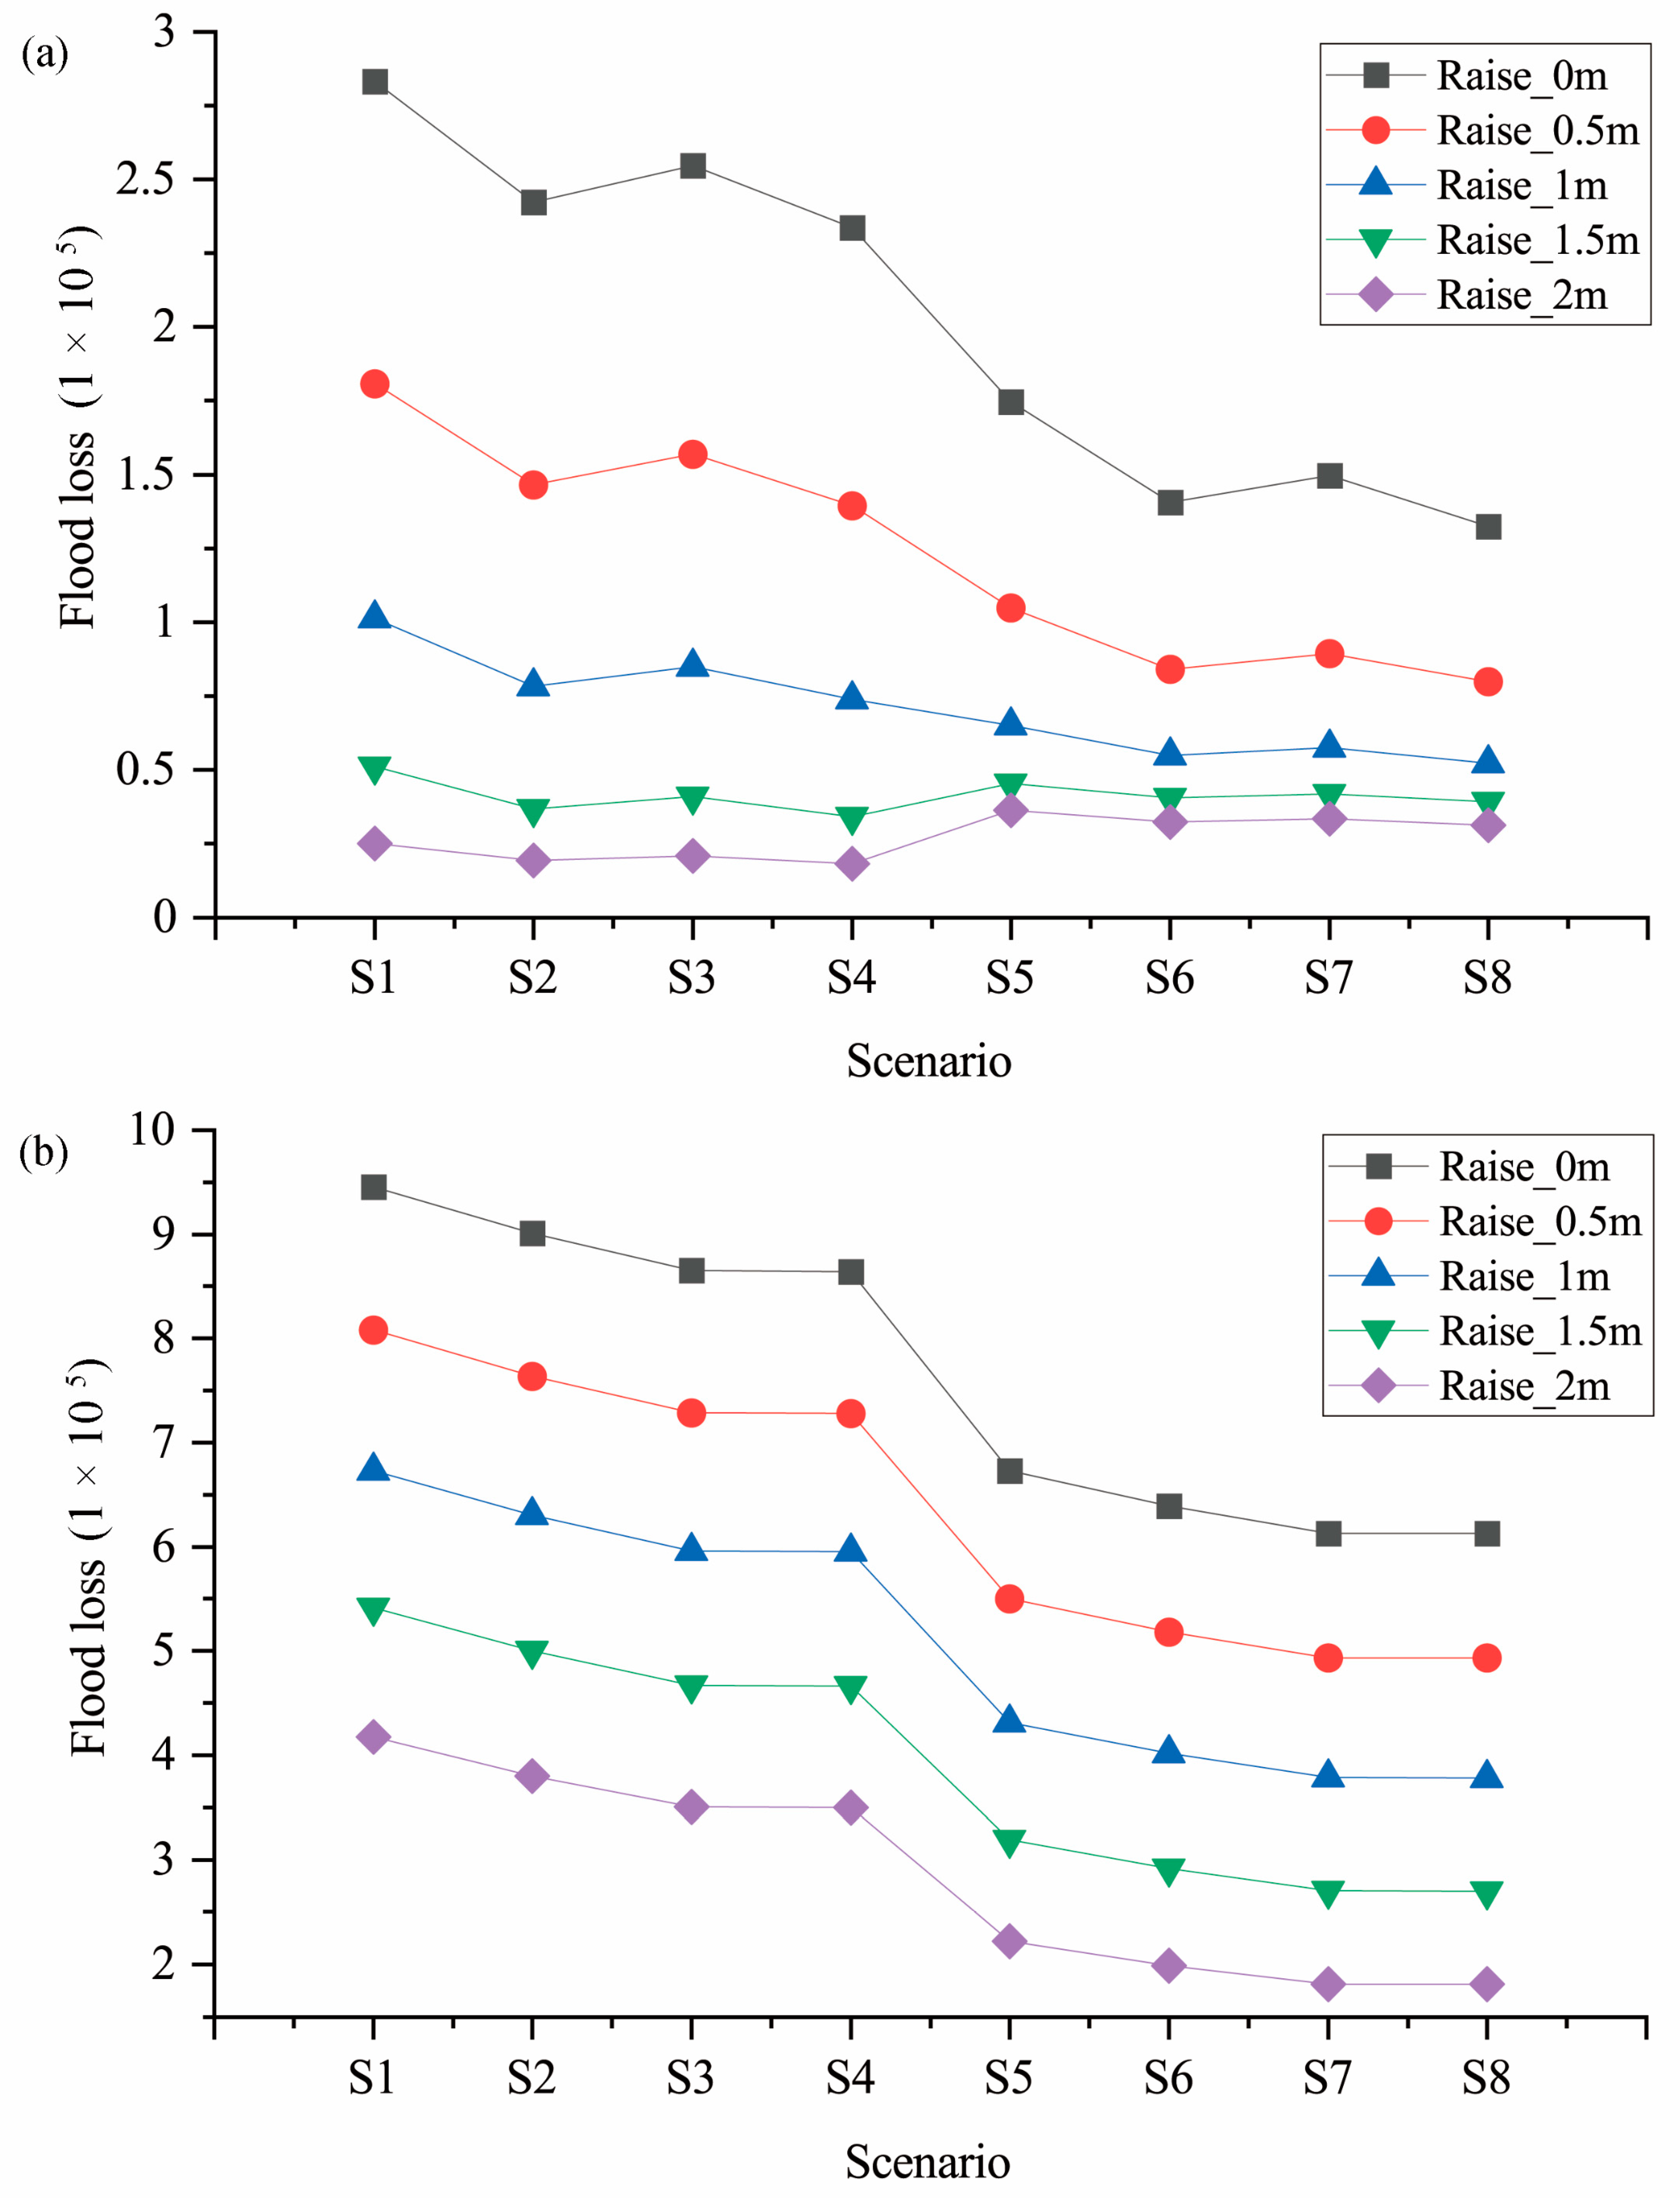
Another sink strategy is to elevate the base of buildings and roads, and the height also influences flood loss (Figure 16). As expected, the flood loss decreases in each scenario with the height increase. However, in RT I, when the base is raised to 1.5 m, the interventions at the sink as S5 would not be a suitable choice, as its flood loss is more than that yielded by adopting the source or flow strategy. This indicates that when the rainfall condition is not extreme, the intervention measures at the sink do not need too much, while the sink strategies are most effective in coping with extreme rainfall conditions.
5. Conclusions and Future Research
Utilizing the “Source-Flow-Sink” framework, this paper proposed the Sponge Watershed Approach (SWA), which implements flood-resilience measures throughout the entire basin, rather than the traditional engineering approach, which generally focuses on the built-up, urban core of the system. The construction plan for Mihe Town after the Zhengzhou “7·20” heavy rain disaster using the SWA, and the analysis of its effects on flood reduction, have shown that the SWA is effective and promising.
In the source strategy simulation, it has been demonstrated that increasing pond/reservoir storage can effectively reduce floodwater releases—but if rainfall is too heavy, the effect will become insignificant. The same conclusion is stated in previous literature: “Many of those practices make use of storage either in the soil or by other means and so their primary effect is to delay runoff. A limitation is that given sufficient precipitation over a long enough period, storage capacity is exhausted. Hence, these measures will be least effective in the most extreme events” [31]. This problem helps to explain why the Low-Impact Development (LID) measures at the source or current Sponge City practice could not handle the heavy rain condition. These facilities work well within their designed standards, but their performance deteriorates quickly once rainfall exceeds their tolerances. Thus, it is imperative to treat the basin as a whole and integrate different SWA measures across the entire basin.
In the flow strategy simulation, it is interesting that the influence of widening the river course to peak flow is an inverted “U-shape” as the widening ratio increases. A study on the influence of different river widening schemes on rivers points out that, after the channel was widened, the flood discharge section of the channel increased, and the overall water level decreased; however, the flow velocity of the river would accelerate [53] until the water storage capacity of the river increased to a certain extent as the widening ratio increased. Another study on the role of river widening in restoring riparian habitats and plant species finds that it would increase the in-stream habitat heterogeneity and local plant diversity [52]; thus, it is useful to widen the river in the proper location for restoring watershed ecology. Based on the simulation results in this study, the “slow the water” principle is always an effective selection, as reflected by the relationship between the peak flow and Manning’s n.
In the sink strategy simulation, it is practical to leave room for the water by widening the river and some portions of the floodplain and raising the base of buildings. Elevating structures’ bases is most effective when facing extreme rainfall, which demonstrates the continuing utility of the traditional adaptive experience of building houses on the high ground along the Yellow River [54].
Furthermore, most of the strategies discussed above are considered regardless of the constraints of costs and actual site conditions, and this simplifying treatment is to construct comparable scenarios which could penetrate the mechanisms of different strategies. Although the parameter values of these strategies in this study are ideal to some extent, these strategies are all feasible in actual practice. Adding detention facilities in the watershed, restoring the riverbanks to natural or semi-natural states, and widening the river course are widely used measures worldwide. As for elevating structures’ bases, the raising of settlement levels is a common measure in many of China’s ancient cities to mitigate the impact of floods [55], the floating garden (Chinampas) constructed on elevated benches in the old lakes of Mexico is still in use today [56], and the houses affected by the tides are raised with round pillars to avoid suffering from flooding in Dordrecht, the Netherlands [57]. In the case of Mihe Town, it is still applicable in the re-construction process to elevate the bases of the roads and buildings affected or washed out by the floods.
Because the simulation results in this paper are primarily intended as a methodological illustration, the parameters used in this paper’s simulations and the accuracy of the results could be further improved by a more detailed field survey. In addition, further research could be carried out based on this paper’s framework, with more improved and mature methods. Remaining issues for investigation include: (1) determining the optimal storage capacity for each sub-basin, rather than using a fixed percentage in all sub-basins, as was done in this paper, and optimizing the spatial allocation of detention facilities; (2) finding optimal locations to widen rivers using different widening ratios so their combination can maximally reduce the peak flow; (3) comparing different sink intervention plans to determine the optimal design of the core region; (4) further investigating the interactive effects of the source, flow and sink strategies; (5) incorporating money and land constraints into a cost–benefit analysis.
As a general approach, the proposed SWA framework could be further developed and supplemented to adapt to the local conditions of other places, which will help promote natural flood management at the whole-catchment scale and enhance the climate resilience of catchments worldwide.
Author Contributions
Conceptualization, X.P. and K.Y.; data curation, X.H., Q.L. and J.L.; formal analysis, X.P.; methodology, X.P. and K.Y.; Project administration, Q.L.; software, X.P. and X.H.; supervision, K.Y.; visualization, J.L.; writing—original draft, X.P.; writing—review & editing, X.P. All authors have read and agreed to the published version of the manuscript.
Funding
This research was founded by the National Key Research and Development Project of China (Grant No: 2016YFC0401108) and the National Natural Science Foundation of China (Grant No: 51678002).
Data Availability Statement
Not applicable.
Acknowledgments
We would like to thank all editors and reviewers for their insightful comments, which helped us improve the quality of this paper. And we want to thank Guolin Zhang from the Sponge Land Laboratory, College of Architecture and Landscape Architecture at Peking University, who offered much assistance in developing the modeling methods for sponge watersheds.
Conflicts of Interest
The authors declare no conflict of interest.
References
- Wasko, C.; Nathan, R.; Stein, L.; O’Shea, D. Evidence of Shorter More Extreme Rainfalls and Increased Flood Variability under Climate Change. J. Hydrol. 2021, 603, 126994. [Google Scholar] [CrossRef]
- Blöschl, G.; Kiss, A.; Viglione, A.; Barriendos, M.; Böhm, O.; Brázdil, R.; Coeur, D.; Demarée, G.; Llasat, M.C.; Macdonald, N.; et al. Current European Flood-Rich Period Exceptional Compared with Past 500 Years. Nature 2020, 583, 560–566. [Google Scholar] [CrossRef] [PubMed]
- Kottasová, I. Enormous Scale of Destruction Is Revealed as Water Subsides after Historic Western Europe Flooding. Available online: https://edition.cnn.com/2021/07/18/europe/western-europe-floods-sunday-intl/index.html (accessed on 17 July 2022).
- Leandro, J. Title of Special Issue: Towards More Flood Resilient Cities. Urban Water J. 2015, 12, 1–2. [Google Scholar] [CrossRef]
- Driessen, P.P.J.; Hegger, D.L.T.; Kundzewicz, Z.W.; Rijswick, H.F.M.W.V.; Crabbé, A.; Larrue, C.; Matczak, P.; Pettersson, M.; Priest, S.; Suykens, C.; et al. Governance Strategies for Improving Flood Resilience in the Face of Climate Change. Water 2018, 10, 1595. [Google Scholar] [CrossRef] [Green Version]
- Yu, K. Climate Adaptation and Resilience. Landsc. Archit. Front. 2021, 9, 4–7. [Google Scholar]
- Disaster Investigation Group of the State Council. The Investigation Report on the “7·20” Heavy Rainfall Disaster of Zhengzhou, Henan; Disaster Investigation Group of the State Council: China, 2022. [Google Scholar]
- Yu, K.; Li, D.; Yuan, H.; Fu, W.; Qiao, Q.; Wang, S. “Sponge City”: Theory and Practice. City Plan. Rev. 2015, 39, 26–36. [Google Scholar]
- Fletcher, T.D.; Shuster, W.; Hunt, W.F.; Ashley, R.; Butler, D.; Arthur, S.; Trowsdale, S.; Barraud, S.; Semadeni-Davies, A.; Bertrand-Krajewski, J.-L.; et al. SUDS, LID, BMPs, WSUD and More–The Evolution and Application of Terminology Surrounding Urban Drainage. Urban Water J. 2014, 12, 525–542. [Google Scholar] [CrossRef]
- Li, L.; Uyttenhove, P.; Van Eetvelde, V. Planning Green Infrastructure to Mitigate Urban Surface Water Flooding Risk–A Methodology to Identify Priority Areas Applied in the City of Ghent. Landsc. Urban Plan. 2020, 194, 103703. [Google Scholar] [CrossRef]
- Pour, S.H.; Abd Wahab, A.K.; Shahid, S.; Asaduzzaman, M.; Dewan, A. Low Impact Development Techniques to Mitigate the Impacts of Climate-Change-Induced Urban Floods: Current Trends, Issues and Challenges. Sustain. Cities Soc. 2020, 62, 102373. [Google Scholar] [CrossRef]
- Demuzere, M.; Orru, K.; Heidrich, O.; Olazabal, E.; Geneletti, D.; Orru, H.; Bhave, A.G.; Mittal, N.; Feliu, E.; Faehnle, M. Mitigating and Adapting to Climate Change: Multi-Functional and Multi-Scale Assessment of Green Urban Infrastructure. J. Environ. Manag. 2014, 146, 107–115. [Google Scholar] [CrossRef]
- Yin, D.; Xu, C.; Jia, H.; Yang, Y.; Sun, C.; Wang, Q.; Liu, S. Sponge City Practices in China: From Pilot Exploration to Systemic Demonstration. Water 2022, 14, 1531. [Google Scholar] [CrossRef]
- Li, F.; Zhang, J. A Review of the Progress in Chinese Sponge City Programme: Challenges and Opportunities for Urban Stormwater Management. Water Supply 2021, 22, 1638–1651. [Google Scholar] [CrossRef]
- Yu, K. Three Key Strategies to Achieve A Sponge City: Retention, Slow Down and Adaptation. South Archit. 2015, 4–7. [Google Scholar]
- Yu, K. Sponge Philosophy. Landsc. Archit. Front. 2015, 3, 0. [Google Scholar]
- The Ministry of Housing and Urban-Rural Development. Technical Guide for Sponge City Construction—Construction of Rainwater System with Low Impact Development (Trial Implementation); Architecture& Building Press: Beijing, China, 2014. [Google Scholar]
- The Ministry of Finance; The Ministry of Housing and Urban-Rural Development; The Ministry of Water Resources. Notice on the Demonstration Projects of Promoting Sponge City Construction from the System and Regional Perspective. Available online: http://www.gov.cn/zhengce/zhengceku/2021-04/26/content_5602408.htm (accessed on 26 April 2021).
- Golden, H.E.; Hoghooghi, N. Green Infrastructure and Its Catchment-Scale Effects: An Emerging Science. WIREs Water 2018, 5, 1254. [Google Scholar] [CrossRef] [Green Version]
- Sayers, P.B.; Hall, J.W.; Meadowcroft, I.C. Towards Risk-Based Flood Hazard Management in the UK. Civ. Eng. 2002, 150, 36–42. [Google Scholar] [CrossRef]
- GWP (Global Water Partnership Technical Advisory Committee). Integrated Water Resources Management (TAC Background Paper 4); Global Water Partnership: Stockholm, Sweden, 2000. [Google Scholar]
- Department of the Environment, Transport and Regions; Environment Agency; Institute for Environment and Health. Guidelines for Environmental Risk Assessment and Management; The Stationery Office: London, UK, 2000. [Google Scholar]
- Evans, E.; Hall, J.; Penning-Rowsell, E.; Sayers, P.; Thorne, C.; Watkinson, A. Future Flood Risk Management in the UK. Proc. Inst. Civ. Eng.-Water Manag. 2006, 159, 53–61. [Google Scholar] [CrossRef] [Green Version]
- Holdgate, M.W. A Perspective of Environmental Pollution; Cambridge University Press: Cambridge, UK, 1979. [Google Scholar]
- Zhang, Y.; Wang, H. Study on the Concept and Simulation Evaluation Method of Sponge Watershed. Master’s Thesis, China Institute of Water Resources and Hydropower Research, Beijing, China, 2017. [Google Scholar]
- Wang, J.; Xue, F.; Jing, R.; Lu, Q.; Huang, Y.; Sun, X.; Zhu, W. Regenerating Sponge City to Sponge Watershed through an Innovative Framework for Urban Water Resilience. Sustainability 2021, 13, 5358. [Google Scholar] [CrossRef]
- Li, Y.; Xue, F.; Jing, R.; Wang, Y.; Wang, J. Study on Water-City Pattern Strategies of Shenshan Special Cooperation Zone, China With Sponge City Construction at the Watershed Scale. Landsc. Archit. Front. 2019, 7, 104–113. [Google Scholar] [CrossRef]
- Guo, H.; Zhang, B.; Hill, R.L.; Wu, S.; Dong, Q.; Sun, L.; Zhang, K. Fish-Scale Pit Effects on Erosion and Water Runoff Dynamics When Positioned on a Soil Slope in the Loess Plateau Region, China. Land Degrad. Dev. 2019, 30, 1813–1827. [Google Scholar] [CrossRef]
- Wei, W.; Pan, D.; Yang, Y. Effects of Terracing Measures on Water Retention of Pinus Tabulaeformis Forest in the Dryland Loess Hilly Region of China. Agric. For. Meteorol. 2021, 308–309, 108544. [Google Scholar] [CrossRef]
- Vaezi, A.R.; Abbasi, M.; Keesstra, S.; Cerdà, A. Assessment of Soil Particle Erodibility and Sediment Trapping Using Check Dams in Small Semi-Arid Catchments. CATENA 2017, 157, 227–240. [Google Scholar] [CrossRef] [Green Version]
- Green, C. Towards Sustainable Flood Risk Management. Int. J. Disaster Risk Sci. 2010, 1, 33–43. [Google Scholar] [CrossRef]
- Yu, K.; Yu, W.; Lin, G.; Zhang, J.; Bai, Z. Slowing Down Nutrient Flows—Ecological Design of the Fengxiang Park. Landsc. Archit. Front. 2019, 7, 102–115. [Google Scholar]
- Liao, K.-H. A Theory on Urban Resilience to Floods—A Basis for Alternative Planning Practices. Ecol. Soc. 2012, 17, 48. [Google Scholar] [CrossRef]
- Temmerman, S.; Meire, P.; Bouma, T.J.; Herman, P.M.J.; Ysebaert, T.; De Vriend, H.J. Ecosystem-Based Coastal Defence in the Face of Global Change. Nature 2013, 504, 79–83. [Google Scholar] [CrossRef]
- Zhengzhou Water Conservancy Construction Survey and Design Institute. Special Report on Flood Control Planning in Mihe Town, Gongyi City; Zhengzhou Water Conservancy Construction Survey and Design Institute: Zhengzhou, China, 2021. [Google Scholar]
- Gongyi Municipal People’s Government. Post-Disaster Restoration and Reconstruction Planning in Mihe Town, Gongyi City; Gongyi Municipal People’s Government: Zhengzhou, China, 2021. [Google Scholar]
- William, A.S.; Matthew, J.F. HEC-HMS User’s Manual; Version 4.10; US Army Corps of Engineers Hydrologic Engineering Center (HEC): Washington, DC, USA, 2013. [Google Scholar]
- Brunner, G.W. HEC-RAS River Analysis System User’s Manual; Version 5.0; US Army Corps of Engineers Hydrologic Engineering Center (HEC): Davis, CA, USA, 2016. [Google Scholar]
- Cronshey, R.; McCuen, R.H.; Miller, N.; Rawls, W.; Robbins, S.; Woodward, D. Urban Hydrology for Small Watersheds (TR-55); Natural Resources Conservation Service: Washington, DC, USA, 1986. [Google Scholar]
- Henan Water Conservancy Survey and Design Institute. Design Storm and Flood Atlas for Small and Medium-Sized Watersheds in Henan Province; Henan Water Conservancy Survey and Design Institute: Zhengzhou, China, 1984. [Google Scholar]
- Ibrahim-Bathis, K.; Ahmed, S.A. Rainfall-Runoff Modelling of Doddahalla Watershed—An Application of HEC-HMS and SCN-CN in Ungauged Agricultural Watershed. Arab. J. Geosci. 2016, 9, 170. [Google Scholar] [CrossRef]
- El Alfy, M. Assessing the Impact of Arid Area Urbanization on Flash Floods Using GIS, Remote Sensing, and HEC-HMS Rainfall–Runoff Modeling. Hydrol. Res. 2016, 47, 1142–1160. [Google Scholar] [CrossRef] [Green Version]
- Azizi, S.; Ilderomi, A.R.; Noori, H. Investigating the Effects of Land Use Change on Flood Hydrograph Using HEC-HMS Hydrologic Model (Case Study: Ekbatan Dam). Nat. Hazards 2021, 109, 145–160. [Google Scholar] [CrossRef]
- Yuan, W.; Fu, L.; Gao, Q. Research on Rainfall Threshold of Flash Flood Based on HEC-HMS Model. Yellow River 2019, 41, 22–27+31. [Google Scholar]
- Yong, B.; Zhang, W.; Zhao, D.; Zhu, Q. Application of Hydrological Modeling System HEC-HMS to Baohe Catchment of Hanjiang Basin. Bull. Soil Water Conserv. 2006, 26, 86–90. [Google Scholar] [CrossRef]
- Xing, Z.; Ma, M.; Wen, L.; Liu, C.; Lv, J.; Su, Z. Application of HEC-HMS Model in Mountain Flood Forecasting in Data Deficient Areas. J. China Inst. Water Resour. Hydropower Res. 2020, 18, 54–61. [Google Scholar] [CrossRef]
- Niazi, M.; Nietch, C.; Maghrebi, M.; Jackson, N.; Bennett, B.R.; Tryby, M.; Massoudieh, A. Storm Water Management Model: Performance Review and Gap Analysis. J. Sustain. Water Built Environ. 2017, 3, 04017002. [Google Scholar] [CrossRef] [PubMed] [Green Version]
- Tang, Y.; Leon, A.S.; Kavvas, M.L. Impact of Size and Location of Wetlands on Watershed-Scale Flood Control. Water Resour. Manag. 2020, 34, 1693–1707. [Google Scholar] [CrossRef]
- Salman, A.; Hassan, S.S.; Khan, G.D.; Goheer, M.A.; Khan, A.A.; Sheraz, K. HEC-RAS and GIS-Based Flood Plain Mapping: A Case Study of Narai Drain Peshawar. Acta Geophys. 2021, 69, 1383–1393. [Google Scholar] [CrossRef]
- Néelz, S.; Pender, G. Desktop Review of 2D Hydraulic Modelling Packages; Joint UK Defra/Environment Agency Flood and Coastal Erosion: Bristol, UK, 2009. [Google Scholar]
- Leon, A.S.; Tang, Y.; Qin, L.; Chen, D. A MATLAB Framework for Forecasting Optimal Flow Releases in a Multi-Storage System for Flood Control. Environ. Model. Softw. 2020, 125, 104618. [Google Scholar] [CrossRef]
- El Bilali, A.; Taleb, A.; Boutahri, I. Application of HEC-RAS and HEC-LifeSim Models for Flood Risk Assessment. J. Appl. Water Eng. Res. 2021, 9, 336–351. [Google Scholar] [CrossRef]
- Liu, J.; Zhu, M.; Li, X.; Hu, Z. Study on the Influence of Different River Widening Schemes on River. In Proceedings of the 2021 3rd International Academic Exchange Conference on Science and Technology Innovation (IAECST), Guangzhou, China, 10–12 December 2021; pp. 2037–2041. [Google Scholar]
- Yu, K.; Zhang, L. The Flood and Waterlog Adaptive Landscapes in Ancient Chinese Cities in the Yellow River Basin. Urban Plan. Forum 2007, 85–91. [Google Scholar]
- Wu, Q. The Protection of China’s Ancient Cities from Flood Damage. Disasters 1989, 13, 193–227. [Google Scholar] [CrossRef]
- Armillas, P. Gardens on Swamps: Archeological Research Verifies Historical Data on Aztec Land Reclamation in the Valley of Mexico. Science 1971, 174, 653–661. [Google Scholar] [CrossRef] [Green Version]
- Architecten, K.; Stijlgroep, D. Plan Tide, Dordrecht, The Netherlands. Available online: https://www.urbangreenbluegrids.com/projects/plan-tide-dordrecht-the-netherlands/ (accessed on 19 September 2022).
Figure 1.
Conceptual framework of the Sponge Watershed Approach for a flood-resilient city. (a) Strategy and example intervention measures of the source, flow, and sink components. (b) Diagram of these example measures distributed from the mountain to the sea.
Figure 1.
Conceptual framework of the Sponge Watershed Approach for a flood-resilient city. (a) Strategy and example intervention measures of the source, flow, and sink components. (b) Diagram of these example measures distributed from the mountain to the sea.

Figure 2.
Source-focused strategies include digging fish-scale pits and planting trees on steep slopes, constructing terraced fields on gentle slopes, building sand check dams in the foothills, constructing ponds and earthen benches in low-lying areas, and so on.
Figure 2.
Source-focused strategies include digging fish-scale pits and planting trees on steep slopes, constructing terraced fields on gentle slopes, building sand check dams in the foothills, constructing ponds and earthen benches in low-lying areas, and so on.

Figure 3.
Flow strategies include building low weirs to slow the water without breaking the river continuum, widening the river and reintroducing meanders, constructing diverse landforms such as islands and pools, stabilizing landforms with plantings, and so on.
Figure 3.
Flow strategies include building low weirs to slow the water without breaking the river continuum, widening the river and reintroducing meanders, constructing diverse landforms such as islands and pools, stabilizing landforms with plantings, and so on.

Figure 4.
Sink strategies include constructing earthen benches atop which future construction can take place, building houses with open, floodable ground floors and raising roadbeds, employing floodable facilities in riparian areas, and so on.
Figure 4.
Sink strategies include constructing earthen benches atop which future construction can take place, building houses with open, floodable ground floors and raising roadbeds, employing floodable facilities in riparian areas, and so on.

Figure 5.
Basic geographic characteristics of the study area. (a) The location of the Sishui River Basin (SRB) in Zhengzhou; (b) Basic information of the SRB; (c) Basic information of the analyzed sub-basin.
Figure 5.
Basic geographic characteristics of the study area. (a) The location of the Sishui River Basin (SRB) in Zhengzhou; (b) Basic information of the SRB; (c) Basic information of the analyzed sub-basin.

Figure 6.
Scenes from Mihe Town before, during, and after the “7·20” flood disaster. (a) The core region of Mihe Town before the disaster; (b) The core region of Mihe Town during the disaster; (c) Damaged road and buildings at the river confluence; (d) Damaged riverbank after the disaster. (Source: Turenscape Urban Planning and Design Co., Ltd.).

Figure 7.
The integrated modeling process diagram of this study.

Figure 8.
The hyetographs of rainfall type I (RT I) and rainfall type II (RT II), with a time interval of 1 h.
Figure 8.
The hyetographs of rainfall type I (RT I) and rainfall type II (RT II), with a time interval of 1 h.

Figure 9.
Master plan of the core region before (a) and after (b) the intervention. (Source: Turenscape Urban Planning and Design Co., Ltd.).
Figure 9.
Master plan of the core region before (a) and after (b) the intervention. (Source: Turenscape Urban Planning and Design Co., Ltd.).

Figure 10.
Model and results of HEC-HMS and HEC-RAS. (a) Schematic map of the HEC-HMS and Junction J241 as the control point; (b) Water table profile diagram of HEC-RAS; (c) Comparison between the actual flooded area drawn from the satellite map after the disaster and the simulated inundation area in RT II.

Figure 11.
The relationship between the control point’s peak flow and the detention facilities’ control rate in RT I (a) and RT II (b).
Figure 11.
The relationship between the control point’s peak flow and the detention facilities’ control rate in RT I (a) and RT II (b).

Figure 12.
The relationships between flow interventions and peak flow at the control point: Widening all rivers in the watershed in equal proportion, with Cr = 0.15 (a) and Cr = 0 (b); Changing the Manning’s n of all river courses, with Cr = 0.15 (c) and Cr = 0 (d).
Figure 12.
The relationships between flow interventions and peak flow at the control point: Widening all rivers in the watershed in equal proportion, with Cr = 0.15 (a) and Cr = 0 (b); Changing the Manning’s n of all river courses, with Cr = 0.15 (c) and Cr = 0 (d).

Figure 13.
The hydrographs of different scenarios in RT I (a) and RT II (b).

Figure 14.
Evaluations of the flood disaster reduction effects of different intervention scenarios in the RT I and RT II conditions. (a) Index1: Inundation area; (b) Index2: Flood loss.
Figure 14.
Evaluations of the flood disaster reduction effects of different intervention scenarios in the RT I and RT II conditions. (a) Index1: Inundation area; (b) Index2: Flood loss.

Figure 15.
The inundation depth of each building under different scenarios in RT I and RT II. (a) Sbase in RT I; (b) Sbase in RT II; (c) SSWA in RT I; (d) SSWA in RT II.
Figure 15.
The inundation depth of each building under different scenarios in RT I and RT II. (a) Sbase in RT I; (b) Sbase in RT II; (c) SSWA in RT I; (d) SSWA in RT II.

Figure 16.
Flood loss under different scenarios when elevating structures’ bases in RT I (a) and RT II (b).
Figure 16.
Flood loss under different scenarios when elevating structures’ bases in RT I (a) and RT II (b).


Table 1.
Details of the eight intervention scenarios modeled in this study.
| Number | Scenario | Interventions |
|---|---|---|
| S1 | None | |
| S2 | The optimal Cr value | |
| S3 | The optimal flow strategies | |
| S4 | Combination of and | |
| S5 | The sink area after intervention | |
| S6 | Combination of and | |
| S7 | Combination of and | |
| S8 | Combination of , , and |
Publisher’s Note: MDPI stays neutral with regard to jurisdictional claims in published maps and institutional affiliations. |
© 2022 by the authors. Licensee MDPI, Basel, Switzerland. This article is an open access article distributed under the terms and conditions of the Creative Commons Attribution (CC BY) license (https://creativecommons.org/licenses/by/4.0/).
Share and Cite
MDPI and ACS Style
Peng, X.; Heng, X.; Li, Q.; Li, J.; Yu, K. From Sponge Cities to Sponge Watersheds: Enhancing Flood Resilience in the Sishui River Basin in Zhengzhou, China. Water 2022, 14, 3084. https://doi.org/10.3390/w14193084
AMA Style
Peng X, Heng X, Li Q, Li J, Yu K. From Sponge Cities to Sponge Watersheds: Enhancing Flood Resilience in the Sishui River Basin in Zhengzhou, China. Water. 2022; 14(19):3084. https://doi.org/10.3390/w14193084
Chicago/Turabian StylePeng, Xiao, Xianpei Heng, Qing Li, Jianxia Li, and Kongjian Yu. 2022. "From Sponge Cities to Sponge Watersheds: Enhancing Flood Resilience in the Sishui River Basin in Zhengzhou, China" Water 14, no. 19: 3084. https://doi.org/10.3390/w14193084
Note that from the first issue of 2016, this journal uses article numbers instead of page numbers. See further details here.