
The Mobility of Landslides in Pumice: Insights from a Flume Experiment
by
 , ,
, ,
Rozaqqa Noviandi
1,* ,
,
Takashi Gomi
2,3,
Hefryan S. Kharismalatri
3,
Roy C. Sidle
3,4,
Rasis P. Ritonga
1 and
Katsushige Shiraki
2 1
United Graduate School of Agricultural Science, Tokyo University of Agriculture and Technology, Fuchu, Tokyo 183-8509, Japan
2
Graduate School of Agriculture, Tokyo University of Agriculture and Technology, Fuchu, Tokyo 183-8509, Japan
3
Institute of Global Innovation Research, Tokyo University of Agriculture and Technology, Fuchu, Tokyo 183-8538, Japan
4
Mountain Societies Research Institute, University of Central Asia, Bishkek 720001, Kyrgyzstan
*
Author to whom correspondence should be addressed.
Water 2022, 14(19), 3083; https://doi.org/10.3390/w14193083
Submission received: 30 August 2022
/
Revised: 24 September 2022
/
Accepted: 25 September 2022
/
Published: 30 September 2022
(This article belongs to the Special Issue Natural Disasters Occurrence, Reduction, and Restoration in Mountain Regions)
Abstract
:Risk of landslide hazards strongly depends on how far landslide sediment travels, known as landslide mobility. Previous studies mentioned enhanced mobility of earthquake-induced landslides in volcanic deposits compared to those from other geologic/soil settings. A flume apparatus constructed at a 1:300 scale was used to examine the mobility of landslides with pumice. Four pumice samples were collected from landslides induced by the 2018 Eastern Iburi earthquake, Hokkaido, Japan. Laboratory tests confirmed the unique low specific gravity of the pumice (1.29–1.33), indicating numerous voids within pumice particles. These voids allowed pumice to absorb a substantial amount of water (95–143%), about 9–15 times higher than other coarse-grained soils. Our flume experiments using various saturation levels (0–1) confirmed the influence of this inner-particle water absorption on pumice mobility. Because a low value of specific gravity indicates a low strength of soil, grain crushing may occur on the pumice layer, causing water from the internal voids to discharge and fluidize the transported landslide mass. Our findings indicate that such earthquake-induced landslides can be as mobile as those induced by rainfall, depending on the initial water content of the pumice layers. These conditions might be associated with water accumulation from previous rainfall events and the water-holding capability on pumice layers.
1. Introduction
Landslides are common natural hazards that occur in hilly and mountainous terrain due to intense rainfall and earthquakes [1]. Landslide impacts strongly depend on how far landslide sediment travels, widely known as landslide mobility [2]. With increasing mobility, landslides are more likely to affect community life systems [3]. For instance, the 2005 La Conchita landslide destroyed 13 houses within the 350 m landslide mobility path, causing more than 10 fatalities in California [4]. The 2006 Leyte landslide with a 3800 m travel distance destroyed more than 500 houses and caused 1126 fatalities on Leyte Island, Philippines [5]. The 2014 Oso earthquake-induced landslide crossed the entire 1-km-wide floodplain of the North Fork Stillaguamish River, causing more than 42 fatalities in Oso, Washington [2].
Landslide mobility is largely affected by topographic factors as these parameters alter landslide momentum. GIS analysis on 33 deep-seated landslides in Kii Peninsula, Japan, noted high variability in landslide mobility that depended on tributary junction angle and stream gradient [6]. A small-scale laboratory experiment confirmed this finding and suggested that a tributary junction angle of >60° had a high risk of landslide dam formation, whereas junction angles < 30° potentially generate debris flows [7]. Field investigation and GIS analysis reported that the 46 landslides caused by the 2008 Wenchuan earthquake traveled 347–4170 m depending on slope gradient [8]. Because landslide momentum depends strongly on landslide mass, previous studies suggested volume-dependent landslide mobility, which is widely viewed as a key mechanism for landslide sediment movement in the Earth and other planetary bodies [9,10,11].
In addition to topographic factors, landslide mobility is strongly controlled by soil water condition during landslide initiation [12]. Here, water facilitates the downslope fluidization of the collapsed landslide mass [13], where higher soil water content causes greater landslide mobility [14]. For instance, a numerical simulation of landslide mobility in Yining, China, suggested that landslides with saturation levels > 85.7% travelled 25% longer than those with lower water contents [15]. A flume experiment showed that a 40% increase in water content elevated landslide travel distance 2-fold due to the reduction of soil strength [16]. Similarly, a laboratory experiment showed that landslides transformed into debris flows at water contents exceeding saturated condition [7].
The mobility of rainfall and earthquake-induced landslides may differ because of the diverse triggering mechanisms, leading to a dissimilar soil-water contents during landslide initiation. In general, rainfall drives water pressure within a slope to a critical level, significantly reducing the shear resistance of slope materials [17]. In contrast, earthquakes initiate landslides by altering gravitational forces on slopes, which surpass the critical stability threshold [18]. Thus, landslides induced by earthquakes are typically less mobile than those induced by rainfall because they are less influenced by soil-water fluxes. Indeed, previous studies showed that 95% of landslides (of similar volume) induced by the 2015 Gorkha earthquake had 1.5–2 times lower mobility compared to those induced by the September 2011 Typhoon Talas [3,6,19]. Only a few of these earthquake-induced landslides in the Himalaya were as mobile as rainfall-induced landslides because of the steep topography [3]. Hence, the mobility of earthquake-induced landslides has been neglected or not strongly considered in many landslide studies.
Nevertheless, some earlier studies found exceptional mobility of earthquake-induced landslides, particularly those in volcanic deposits. For instance, landslides triggered by the 1968 Tokachi-Oki earthquake occurred in pumice and volcanic ash soils with 1.3–3 times greater mobility compared to other landslides around the globe of similar volume (e.g., [10,19,20]). This pattern also occurred in landslides during the 2001 El Salvador earthquake, transporting > 106 m3 of pumice and volcanic ash [21]. A global investigation of 132 non-volcanic and 50 volcanic landslides triggered by rainfall and earthquakes suggested much higher mobility of landslides in volcanic deposits compared to those in other geologic settings [10]. Such a high mobility of these earthquake-induced landslides might be associated with water content in volcanic deposit layers [20,21].
Volcanic areas are typically covered by tephra-volcanic ejecta that contains various silicates with different sizes [22,23]. Among tephra, pumice has a vesicular texture formed due to the rapid cooling of ejected volcanic rock [22]. Pumice typically has lower density (0.2–0.9 g/cm3) and higher porosity (50–90%) compared to non-volcanic soils (density > 0.9 g/cm3, porosity < 60%) [22,23,24]. This uniqueness is associated with voids inside pumice particles [25]. These voids may also allow pumice to hold a substantial amount of water, depending on pore size and connectivity [22,23]. Because water content is one of the most influential factors for mobility [12], such unique pumice characteristics may influence landslide mobility. Thus, the presence of pumice may control the mobility of earthquake-induced landslides that failed in volcanic deposits. Nevertheless, the effect of pumice on landslide mobility has not been systematically investigated.
Numerous landslides with a density of 326 landslides/km2 occurred during the Eastern Iburi earthquake, Hokkaido, on 6 September 2018 [26]. Approximately 6000 landslides and debris flow were reported; mobilized distances ranged from 20 to 450 m [27]. The mean distance of transported landslide sediments was 154 m, while the distances varied significantly depending on locations [28]. For instance, a 170 × 85 m2 landslide in the Towa River catchment travelled from 20 to 30 m [29], whereas a larger landslide (850 × 400 m2) in the Hidaka-horonai River catchment travelled 350 m forming a landslide dam [30]. Sliding surfaces of landslides occurred along volcanic deposit layers that originated from the eruption of Mt. Tarumae (Ta-d: 9 ka) and Mt. Eniwa (En: 20 ka) [28]. Hence, materials transported by these landslides consisted primarily of volcanic deposits, i.e., pumice and volcanic ash.
Field and remote sensing studies of the influence of pumice on landslide mobility are difficult due to complex topography and other variable site factors. As such, flume experiment can be effective to consider the range of factors affecting landslide mobility within a simplified configuration. Indeed, a previous study mentioned the effectiveness of flume experiments in demonstrating landslide dam and debris flow formation for various geologic (i.e., soil types) and hydrologic (i.e., water contents) conditions (e.g., [7]). Therefore, the objectives of this study are to: (1) investigate physical characteristics affecting water content of pumice within hillslopes impacted by the Eastern Iburi earthquake and (2) examine the influence of pumice physical characteristics on landslide mobility using a flume experiment. Based on the findings of this study, we then discuss possible mechanisms controlling the mobility of landslides in pumice. This study provides insights to improve landslide risk assessment in volcanic areas.
2. Methodology
2.1. Soil Sampling
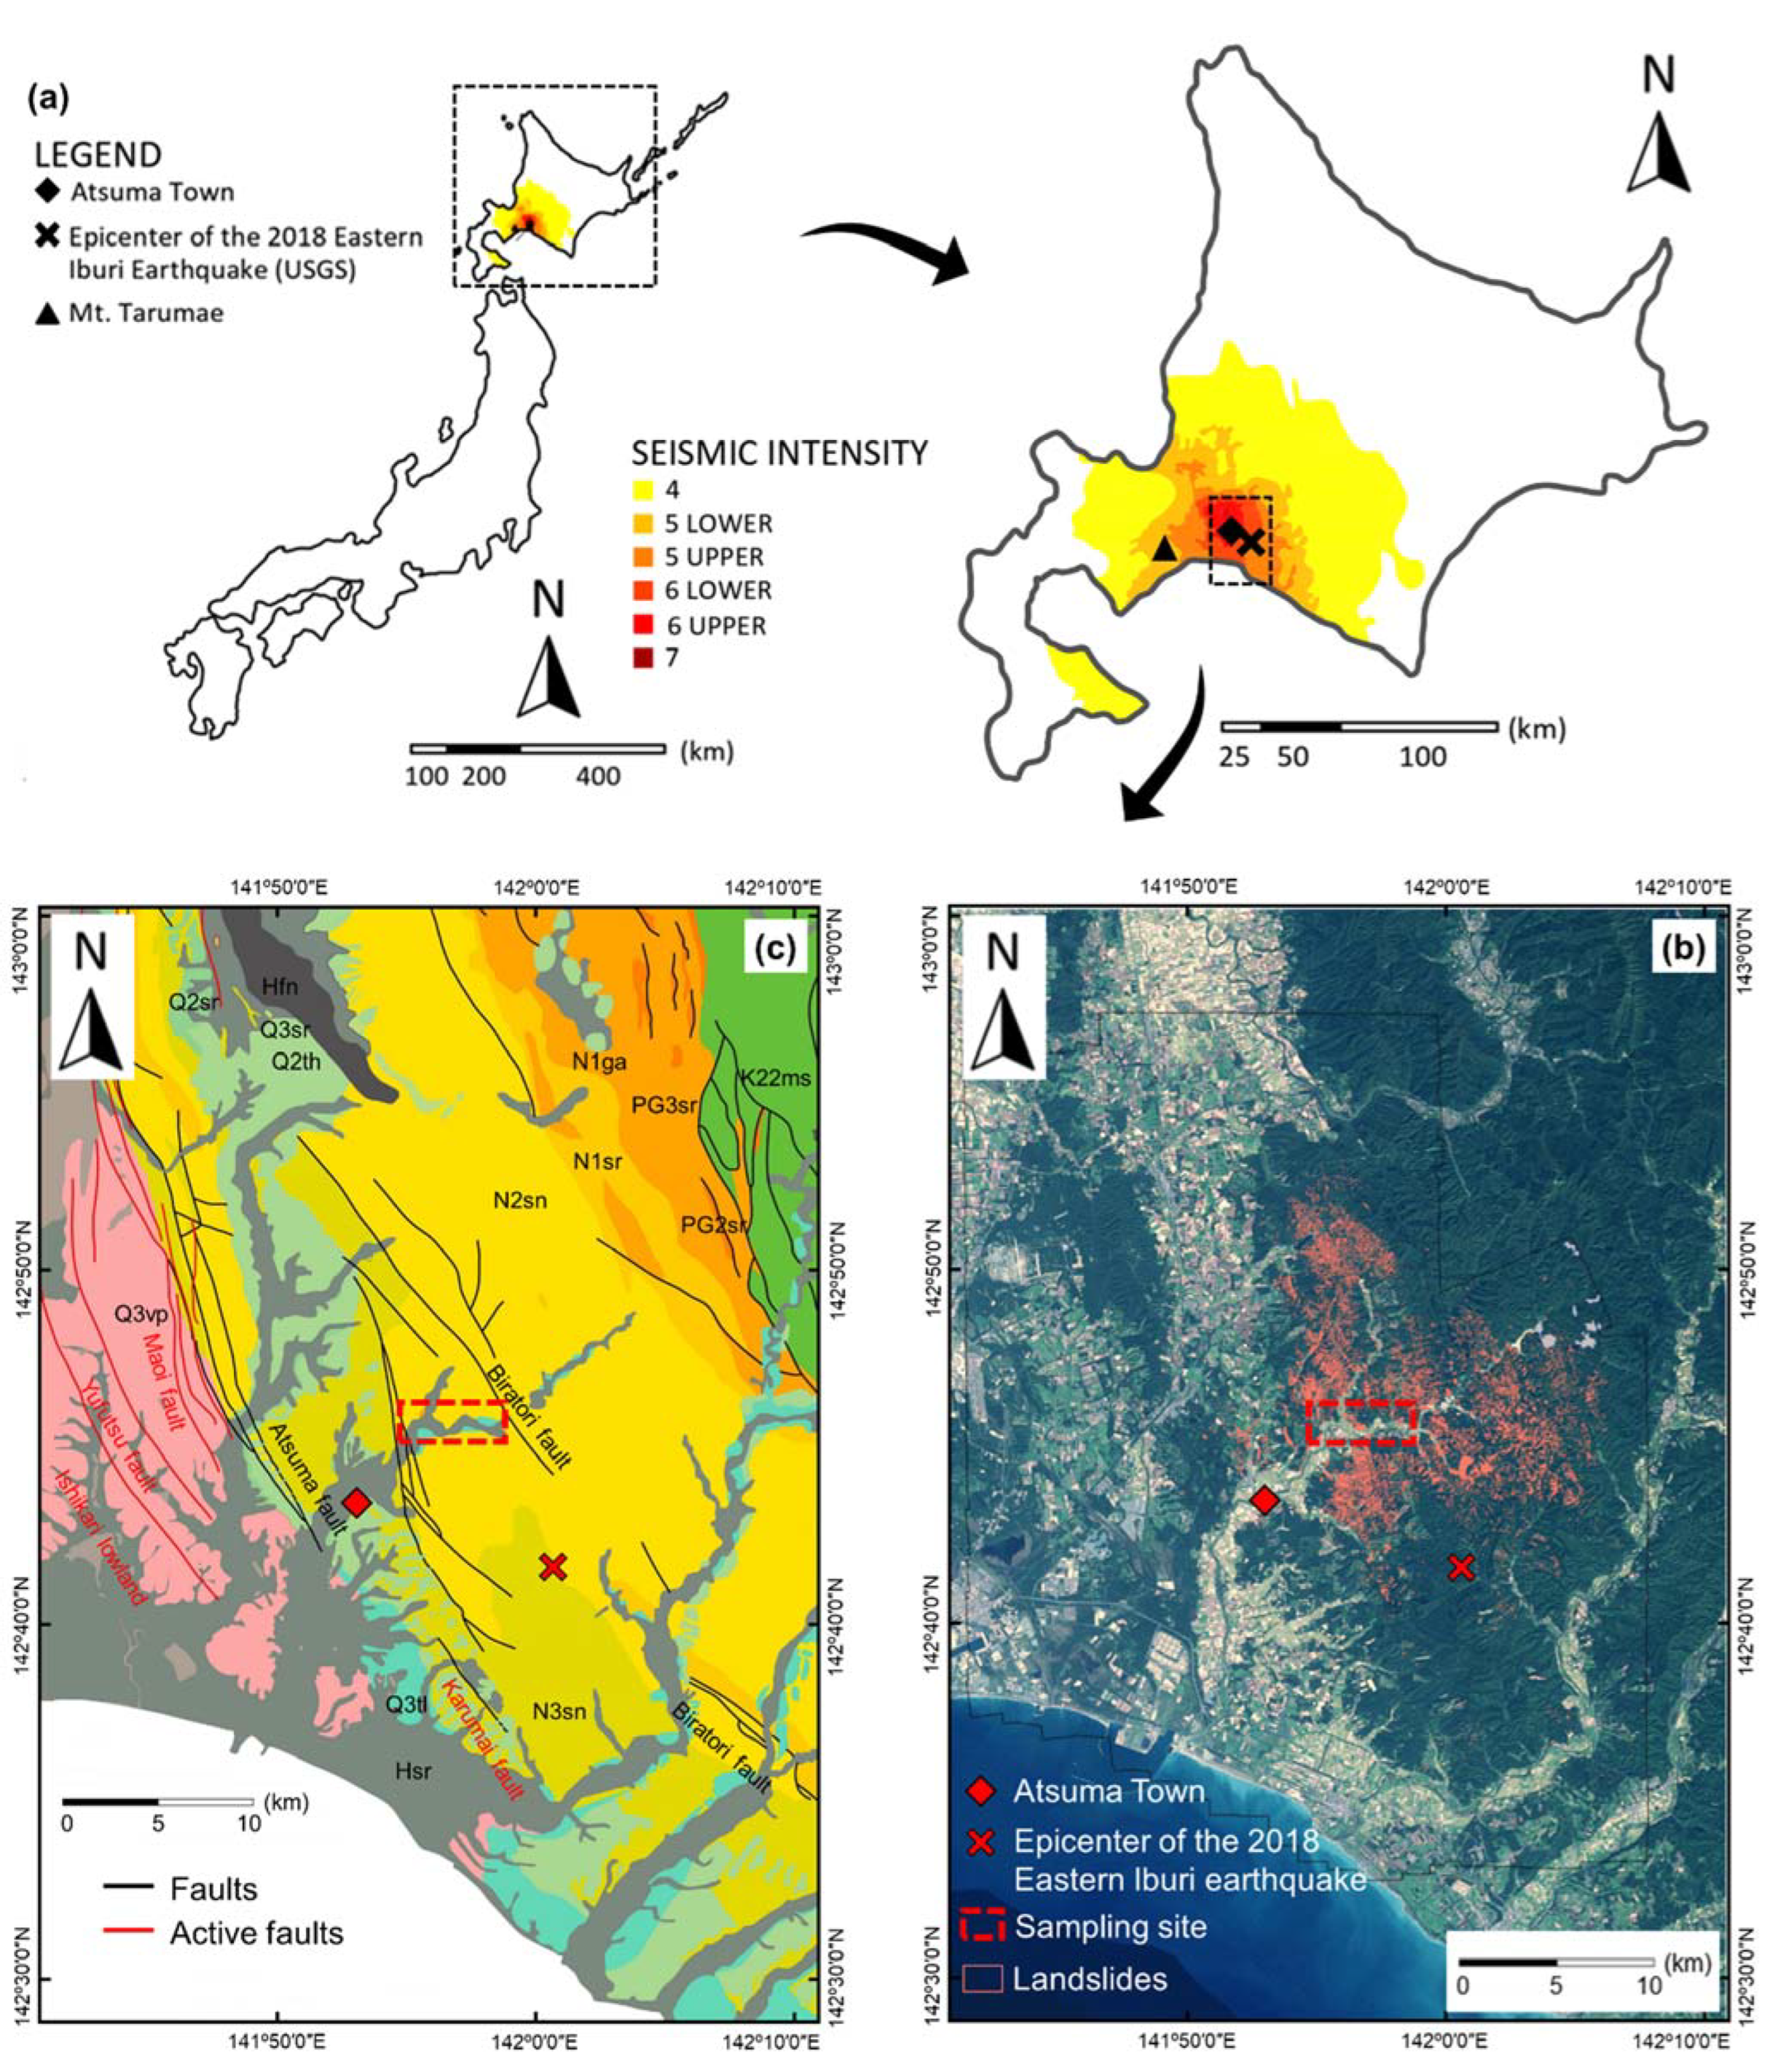
Soil samples were collected from three landslide locations in Yosino and Tomisato areas of Atsuma Town, Hokkaido, where a maximum seismic intensity of 7 was recorded (Japan Meteorological Agency scale). These sites are 5 km west of Atsuma Town (Figure 1a,b). Mean annual precipitation and temperature recorded in Atsuma Town is 997 mm and 6.7 °C, respectively (AMeDAS Atsuma based on data from 1976 to 2019). The topography of these sites is hilly with altitudes ranging from 100 to 200 m. Dominant vegetation cover is secondary deciduous forest (e.g., Betula platyphylla, Quercus mongolica) and mixed-conifer plantations, such as larch (Larix kaempferi) and Todo fir (Abies sachalinensis).
These landslide sites are surrounded by a well-developed fault system (Figure 1c). The eastern boundary fault zone is located in the Ishikari lowland that originates at Bibai and terminates at Yufutsu, located 7 km northwest and 67 km north of Atsuma town, respectively. Within this fault zone, two active faults (Yusufu and Maoi) strike from NNE/SSW to NNW/SSE [31]. Another active fault, the Karumai fault, is located southwest of the epicenter of the Iburi earthquake (Figure 1c). Two major faults (Atsuma and Biratori) are located 7 km west and next to landslide sites generating a NNW/SSE trend [31].
Thirteen geological units were identified based on a 1:200,000 geological map published by the Geological Survey of Japan (Table 1). The basement complex of these landslide sites is mainly composed of sandstone, mudstone, conglomerate, and sandstone (with tuff) from the middle to late Pliocene periods. This geology is covered by pyroclastic fall deposits, originated from the eruption of Mt. Eniwa (20 ka) and Mt. Tarumae (9 ka) [27]. Tarumae (Ta) is the most recent pyroclastic fall deposit, consisting of Ta-a (1739 A.D.), Ta-b (1667 A.D.), Ta-c (2.5 ka), and Ta-d (8.7–9.2 ka) [30]. Among all Tarumae deposits, Ta-d consists of dark red pumice with a coarse-grained texture and numerous vesicles, whereas other tephra has various size ranges. In all landslide sites, volcanic ash soil was formed between Tarumae deposits creating alternate soil layers. Total depth of surface geology (including soil) is approximately 4–5 m [32].
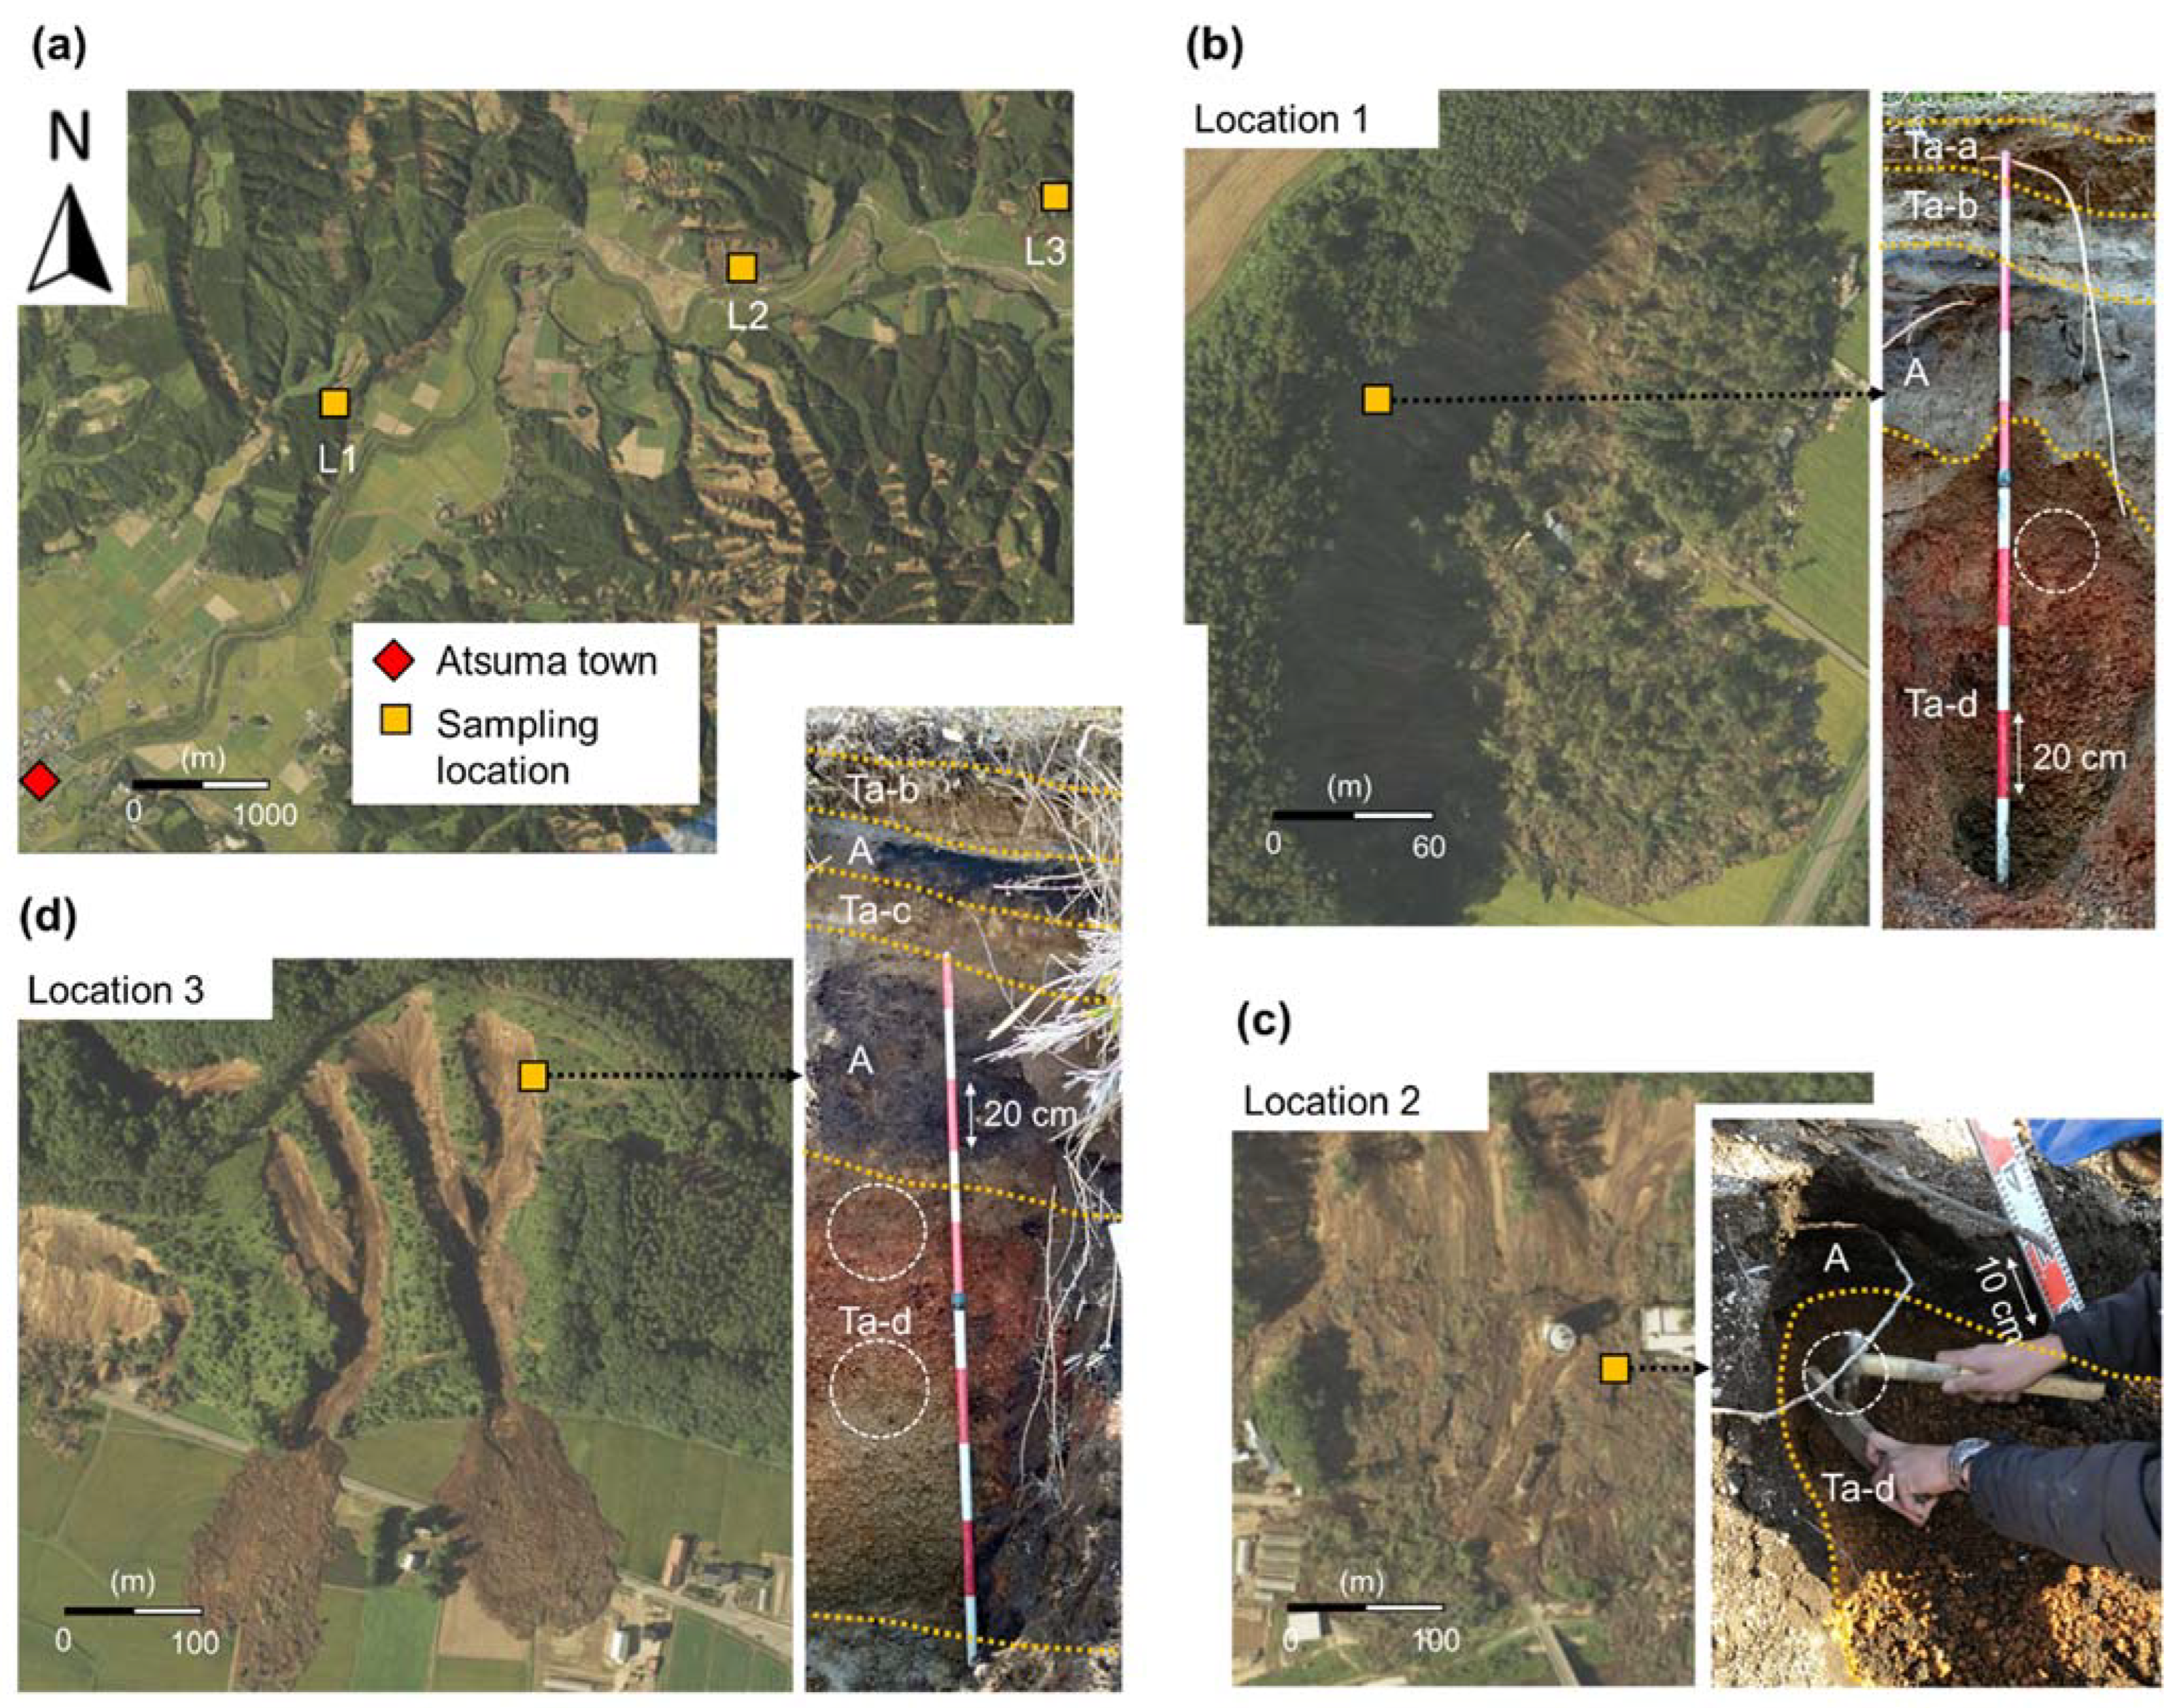
Field investigations showed that Ta-d (hereafter referred to as pumice) became the major slip surface of landslides [28,30]. Therefore, we collected pumice from our landslide sites. Four disturbed (400 cc volume) and two bulk (disturbed, volume unmeasured) pumice samples were collected in two periods. The first samples were collected at locations 1 and 2 on 3–4 November 2018 (Figure 2). The 30 days antecedent precipitation index (API30), representing the catchment wetness based on the rainfall that occurred over 30 preceding days, was about 104 mm during this sampling dates (measured from AMeDAS Atsuma). At location 1, we collected disturbed and bulk pumice samples at a depth of 130 cm in the landslide scarp (S1) (Figure 2b). Disturbed and bulk pumice samples were also collected from the 60 cm depth in the landslide depositional zone at location 2 (S2) (Figure 2c). The second soil sampling was conducted on 14 June 2019 (API30 = 64 mm). During this time, two disturbed samples were collected from depths of 125 and 175 cm in the landslide scarp (location 3; S3 and S4, respectively) (Figure 2d). Since soil surfaces that were exposed after the landslides might be vulnerable to soil erosion, it is possible that the surface soil properties could change between the first and second sampling periods. Thus, the upper 20 cm of exposed surface soil was removed when collecting samples, and soil samples were also collected from excavated trenches.
Disturbed samples were collected using 400 cc stainless tubes; 11.3 cm diameter and 4 cm long. These samples were used for analyzing water content, density, particle size distribution, specific gravity, porosity, and water absorption limit of pumice. Bulk samples were collected in a 650 × 850 mm plastic bag for laboratory experiments. All collected samples were stored in closed containers to minimize the change in soil properties due to direct solar radiation. The samples were then tested one week after sampling dates, 12–16 November 2018 and 24–30 June 2019 for those collected during the first and second sampling periods, respectively. Bulk samples were oven-dried at 105 °C for 24 h and then stored in sealed plastic bags for later use in laboratory experiments.
2.2. Soil Characterization
Laboratory tests were conducted according to American Standard for Testing Materials (ASTM). Dry density and water content were examined using ASTM D7263-09 and ASTM D4643-17 by oven-drying the specimen at 105–110 °C for 24 h. Dry density was estimated based on the ratio of dry weight divided by the volume, while the gravimetric water content was based on the weight of water divided by dry sediment weight.
Particle size distribution was analyzed based on ASTM D6913-04 using sieve opening sizes of 19 mm, 9.5 mm, 4.75 mm, 2 mm, 0.85 mm, 0.425 mm, 0.25 mm, 106 μm, and 75 μm. Dry soils were placed into sieves and then vibrated using a FRITSCH automatic sieve shaker for 10 min. The number of particles retained in each sieve was then weighed. For particles smaller than 75 μm, particle size distribution was analyzed by a laser diffraction particle size analyzer SALD-2300. The soil was classified based on ASTM D2487-06 and USCS Classification. The coefficient of curvature (Cc) and coefficient of uniformity (Cu) representing soil gradation were calculated based on the cumulative percentages of particle size distribution. The coefficient of curvature and coefficient of uniformity were estimated as:
where D10, D30, and D50 indicate particle diameters finer than 10%, 30%, and 60% of the total mass, respectively.
Specific gravity (Gs), representing particle density, was estimated based on ASTM D854-05 for particles finer than 4.75 mm and ASTM C127-07 for particles larger than 4.75 mm. This test was conducted without crushing pumice particles to maintain their original characteristics. The average specific gravity was estimated based on ASTM C127-07. Porosity (n) and saturated water content (wSr) were calculated from specific gravity. Porosity represents total voids in the soil, whereas saturated water content represents the water content when all voids are filled with water. Because pumice may contain unconnected voids [23], which could prevent water diffusion [25], we estimated the water absorption limit (WA) based on the maximum absorbed water that generates a constant mass of pumice particles.
Since specific gravity (Gs) was measured without crushing pumice particles, the volume used in our Gs calculation includes dead-end pores (Vvd) and solid fraction of pumice (Vs). We then measured the specific gravity of crushed pumice particles (Gsc) to estimate the volume of solid fraction (Vs). By assuming that all active pores can effectively store the water, we estimated the volume of active pores (Vva) from the water absorption limit (WA). Thus, the dead-end to active pore ratio (Rv), representing pore connectivity within pumice, is estimated as follows:
2.3. Laboratory Experiment for Examining Landslide Mobility
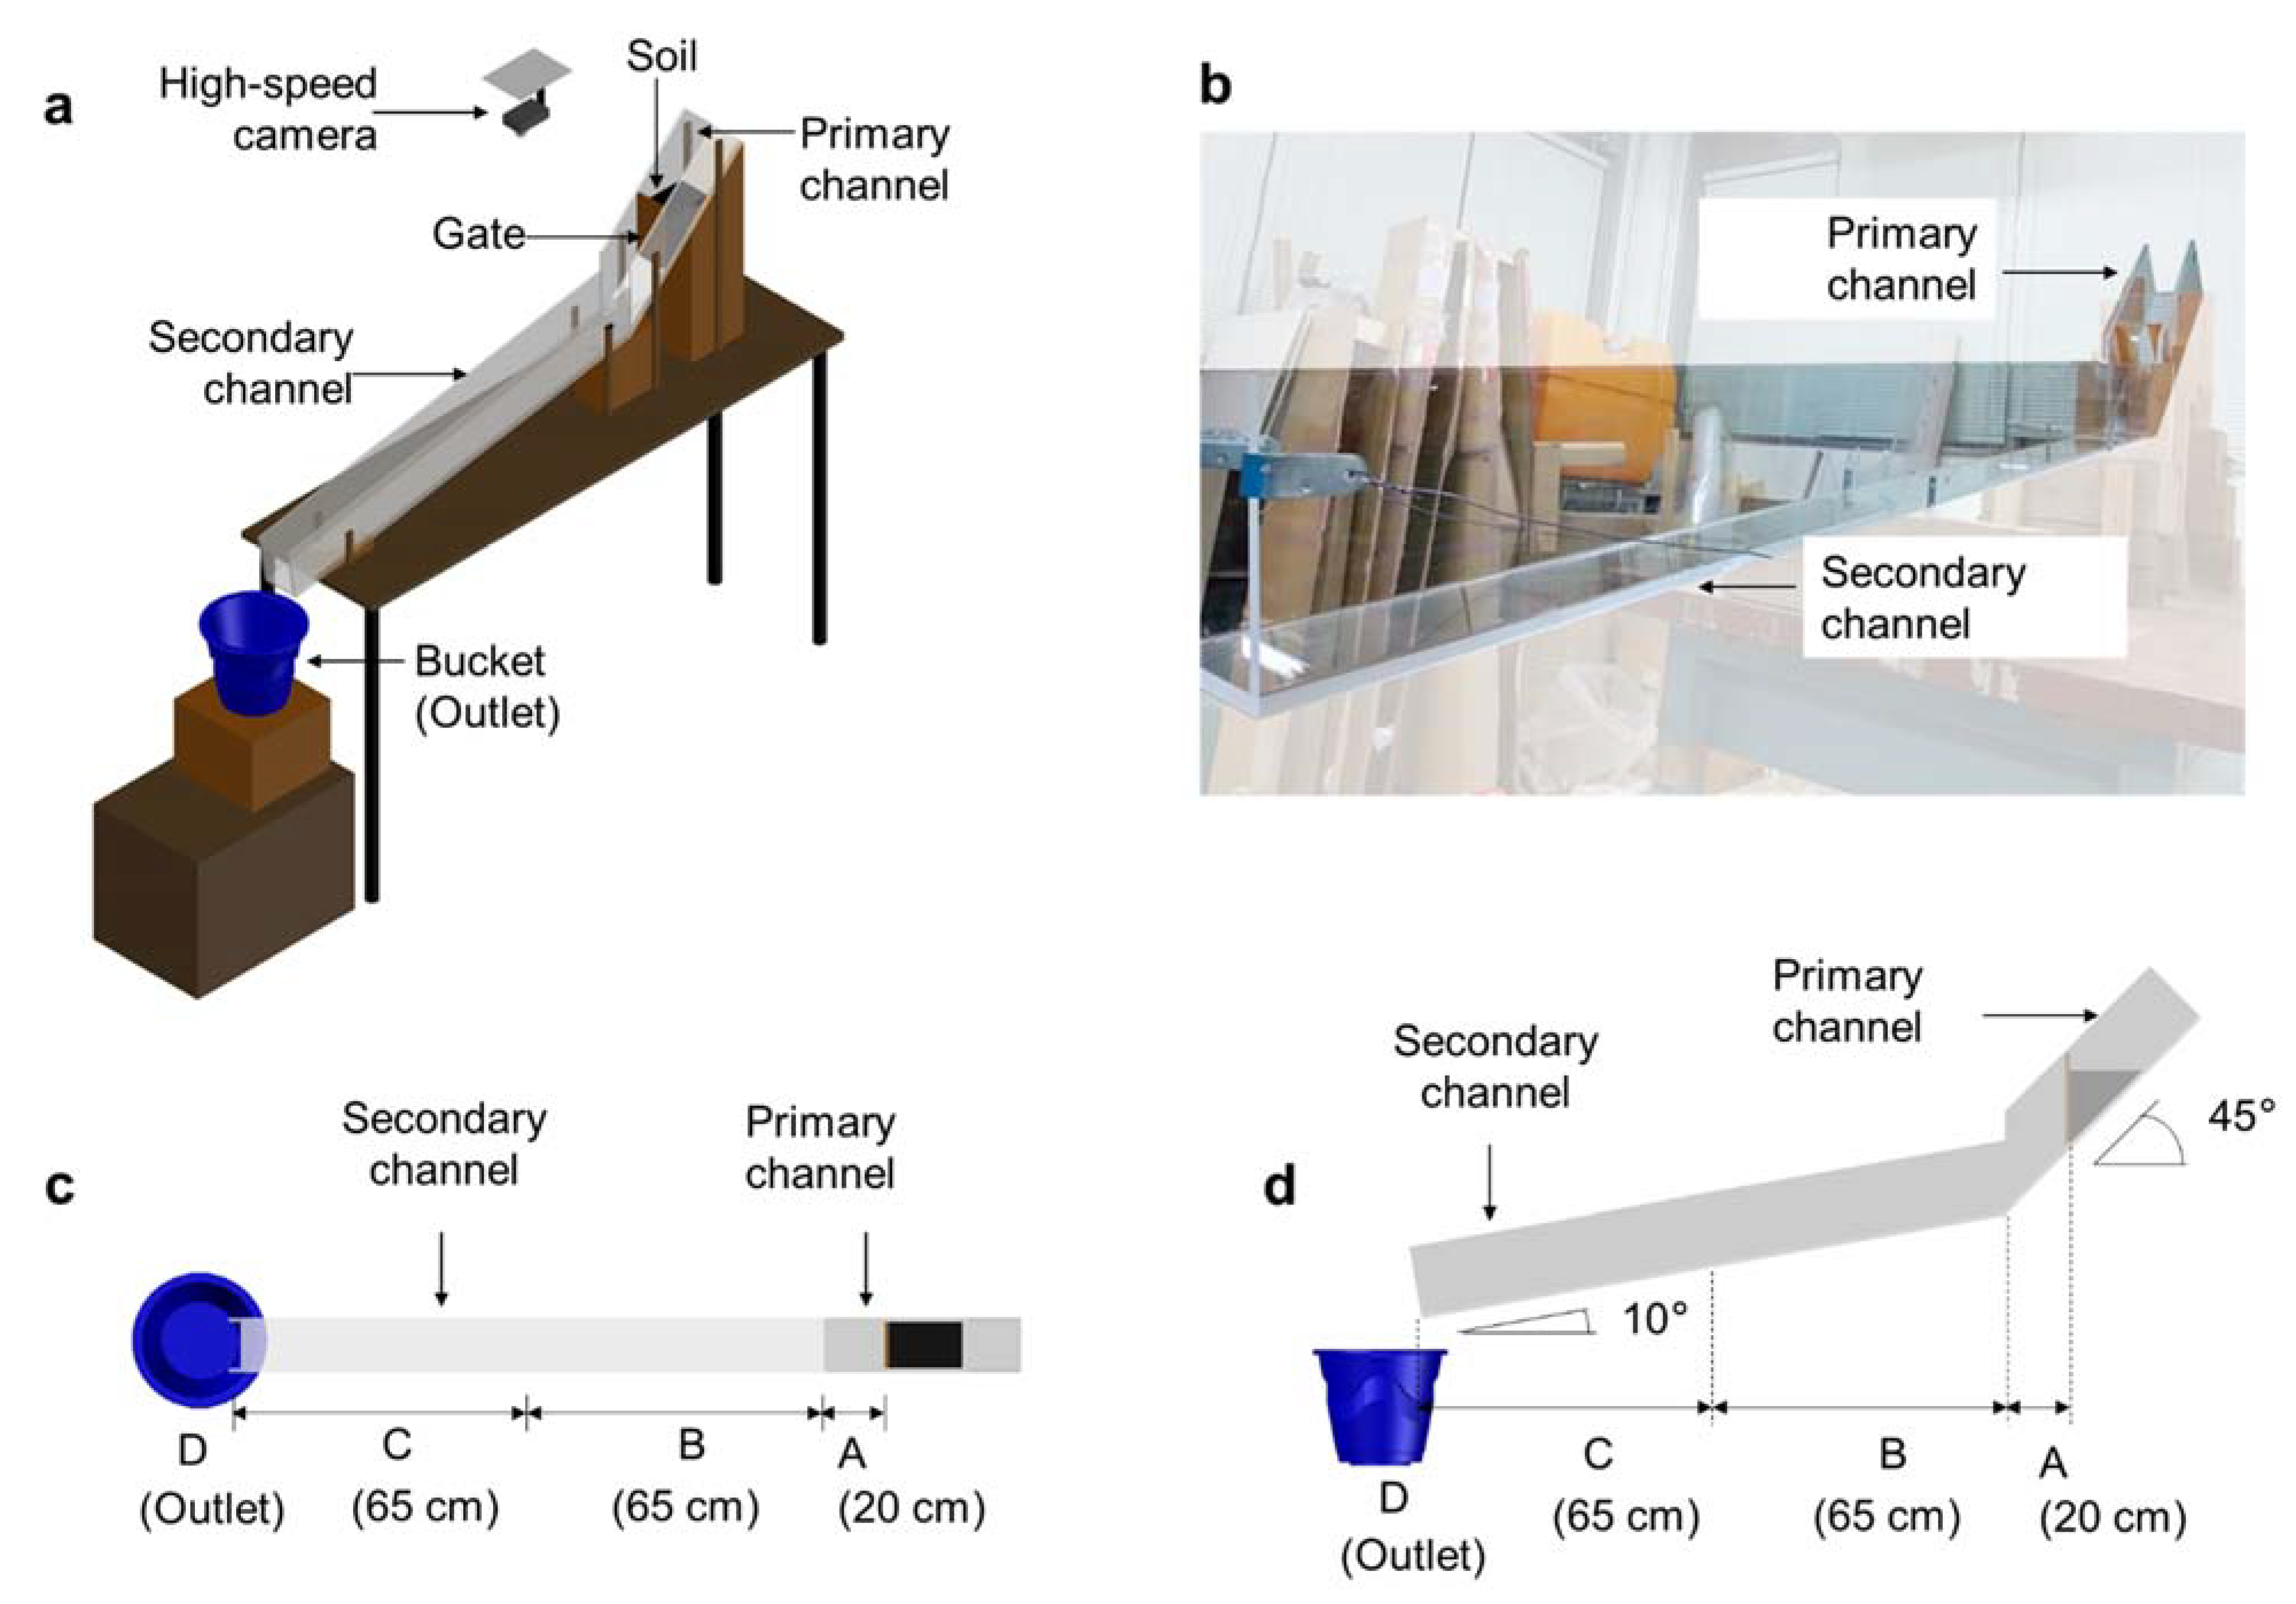
A flume constructed at a 1:300 scale was used to examine the mobility of landslides with pumice. The flume consisted of two segments that represent landslide initiation and deposition (Figure 3a,b). All segments were 10 cm wide, 15 cm high, and constructed with 1-cm thick acrylic material. The primary segment was set to 45° with a total length of 50 cm. This condition represented a 45° slope with a length of 150 m. Because most landslides occurred on slopes between 25° and 30° [26], we focused on a relatively steeper slope, e.g., in headwater catchment. The secondary segment had an inclination of 10° and a total length of 130 cm. This represents a valley; 30 m wide, 390 m long, and a 10° gradient. A bucket was placed at the end of the secondary channel to collect transported sediment. To quantify mobility, we divided the flume into four segments, i.e., A (20 cm), B (65 cm), C (65 cm), and D (Outlet) (Figure 3c,d).
We used pumice collected from the landslide at location 2 in the experiment to represent sediment characteristics during transport and deposition. Transported materials by the 2018 Eastern Iburi earthquake may consist not only of pumice but also other tephra and volcanic ash with different physical properties. Despite various types of soil transported during the slope failures, we assumed that soil at the landslide slip surface has the most influence on landslide mobility because it controls basal friction resistance. Because landslides occurred mostly at pumice layers [31], we used pumice to represent landslide mobility during the Eastern Iburi earthquake. The sample volume of pumice that we used was 500 cc, representing a large landslide (13,500 m3) based on our 300× scaling. Since the Eastern Iburi earthquake generated > 6000 landslides with total sediment production of 30 million m3 [31,34], the mean landslide volume was about 5000 m3.
Because water content is an influential factor for landslide mobility [12], we applied eight saturation levels (S = 0.0, 0.15, 0.3, 0.45, 0.6, 0.7, 0.8, and 1.0), where S = 0 represents completely dry conditions and S = 1 represents saturated conditions. These different saturation levels represent the variability of initial water content during earthquake-induced landslides. We situated the water-sediment mixture 20 cm upstream of the channel junction behind an acrylic gate (Figure 3c). The gate was then abruptly opened to allow the sediment to flow downstream. Such an abrupt gate opening represents a condition where the slope already collapsed, and movement was mainly driven by gravity. This experimental process was also intended to lessen the variability of initial mobility, similar to a study examining the mobility of debris flows in a large-scale flume [35].
After the movement of sediment stopped, we estimated the L/H ratio based on the total travel distance (L) and total drop height (H) of sediment. This parameter is widely used to quantify the mobility of landslide sediment [3,9,10,20]. L/H is derived from the law of energy conservation by assuming a constant moving mass without a progressive mass loss [9]. We then collected the sediment from all segments. All collected sediment samples were oven-dried at 105 °C for 24 h and weighed. The same procedure was repeated four times for each level of saturation. A total of 32 experiments were conducted during this study, from 26 March 2019 to 13 April 2019.
3. Results
3.1. Physical Characteristics of Pumice
Dry density, water content, and specific gravity of the four pumice samples varied by sampling locations (Table 2). Dry density ranged from 0.33 to 0.45 g/cm3; lowest in S2 and highest in S3. Gravimetric water content was highest in S2 (172%), followed by S4 (160%), S1 (147%), and S3 (139%). Specific gravity ranged from 1.29 to 1.33, with the lowest value in S1 and the highest in S3. Similar to the previously mentioned parameters, the particle size of pumice differed depending on sampling locations. The mean diameter of particle size distribution (D50) ranged between 1.7 to 6.3 mm, with the lowest in S3 and the highest in S1. Since more than 50% of pumice was retained on the 75 µm sieve, pumice was classified as coarse-grained soil according to ASTM D2487-06. S1 and S2 were classified as gravel, whereas S3 and S4 were classified as sand because more than 50% of their particles passed through the 4.75 µm but were retained on the 75 µm sieves. All samples except S3 were poorly graded with a narrow size range; Cu ranged from 4.8 to 6.3, whereas Cc ranged from 0.4 to 7. S3 was classified as well-graded with Cu > 6 and 1 < Cc < 3.
Because soil particle size affects soil physical properties [36], void ratio, porosity, saturated water content, and water absorption limit of the four pumice samples differed depending on particle size distributions, yet followed a similar pattern. In general, S2 had the highest values of these parameters (e = 3.3, n = 77%, wSr = 256%, WA = 143%), whereas the lowest ones were for S3 (e = 2.2, n = 70%, wSr = 167%, WA = 95%). In contrast, the dead-end to active pores ratio (Rv) was the highest for S4 and the lowest for S2 (Table 2).
3.2. Characteristics of Mobility
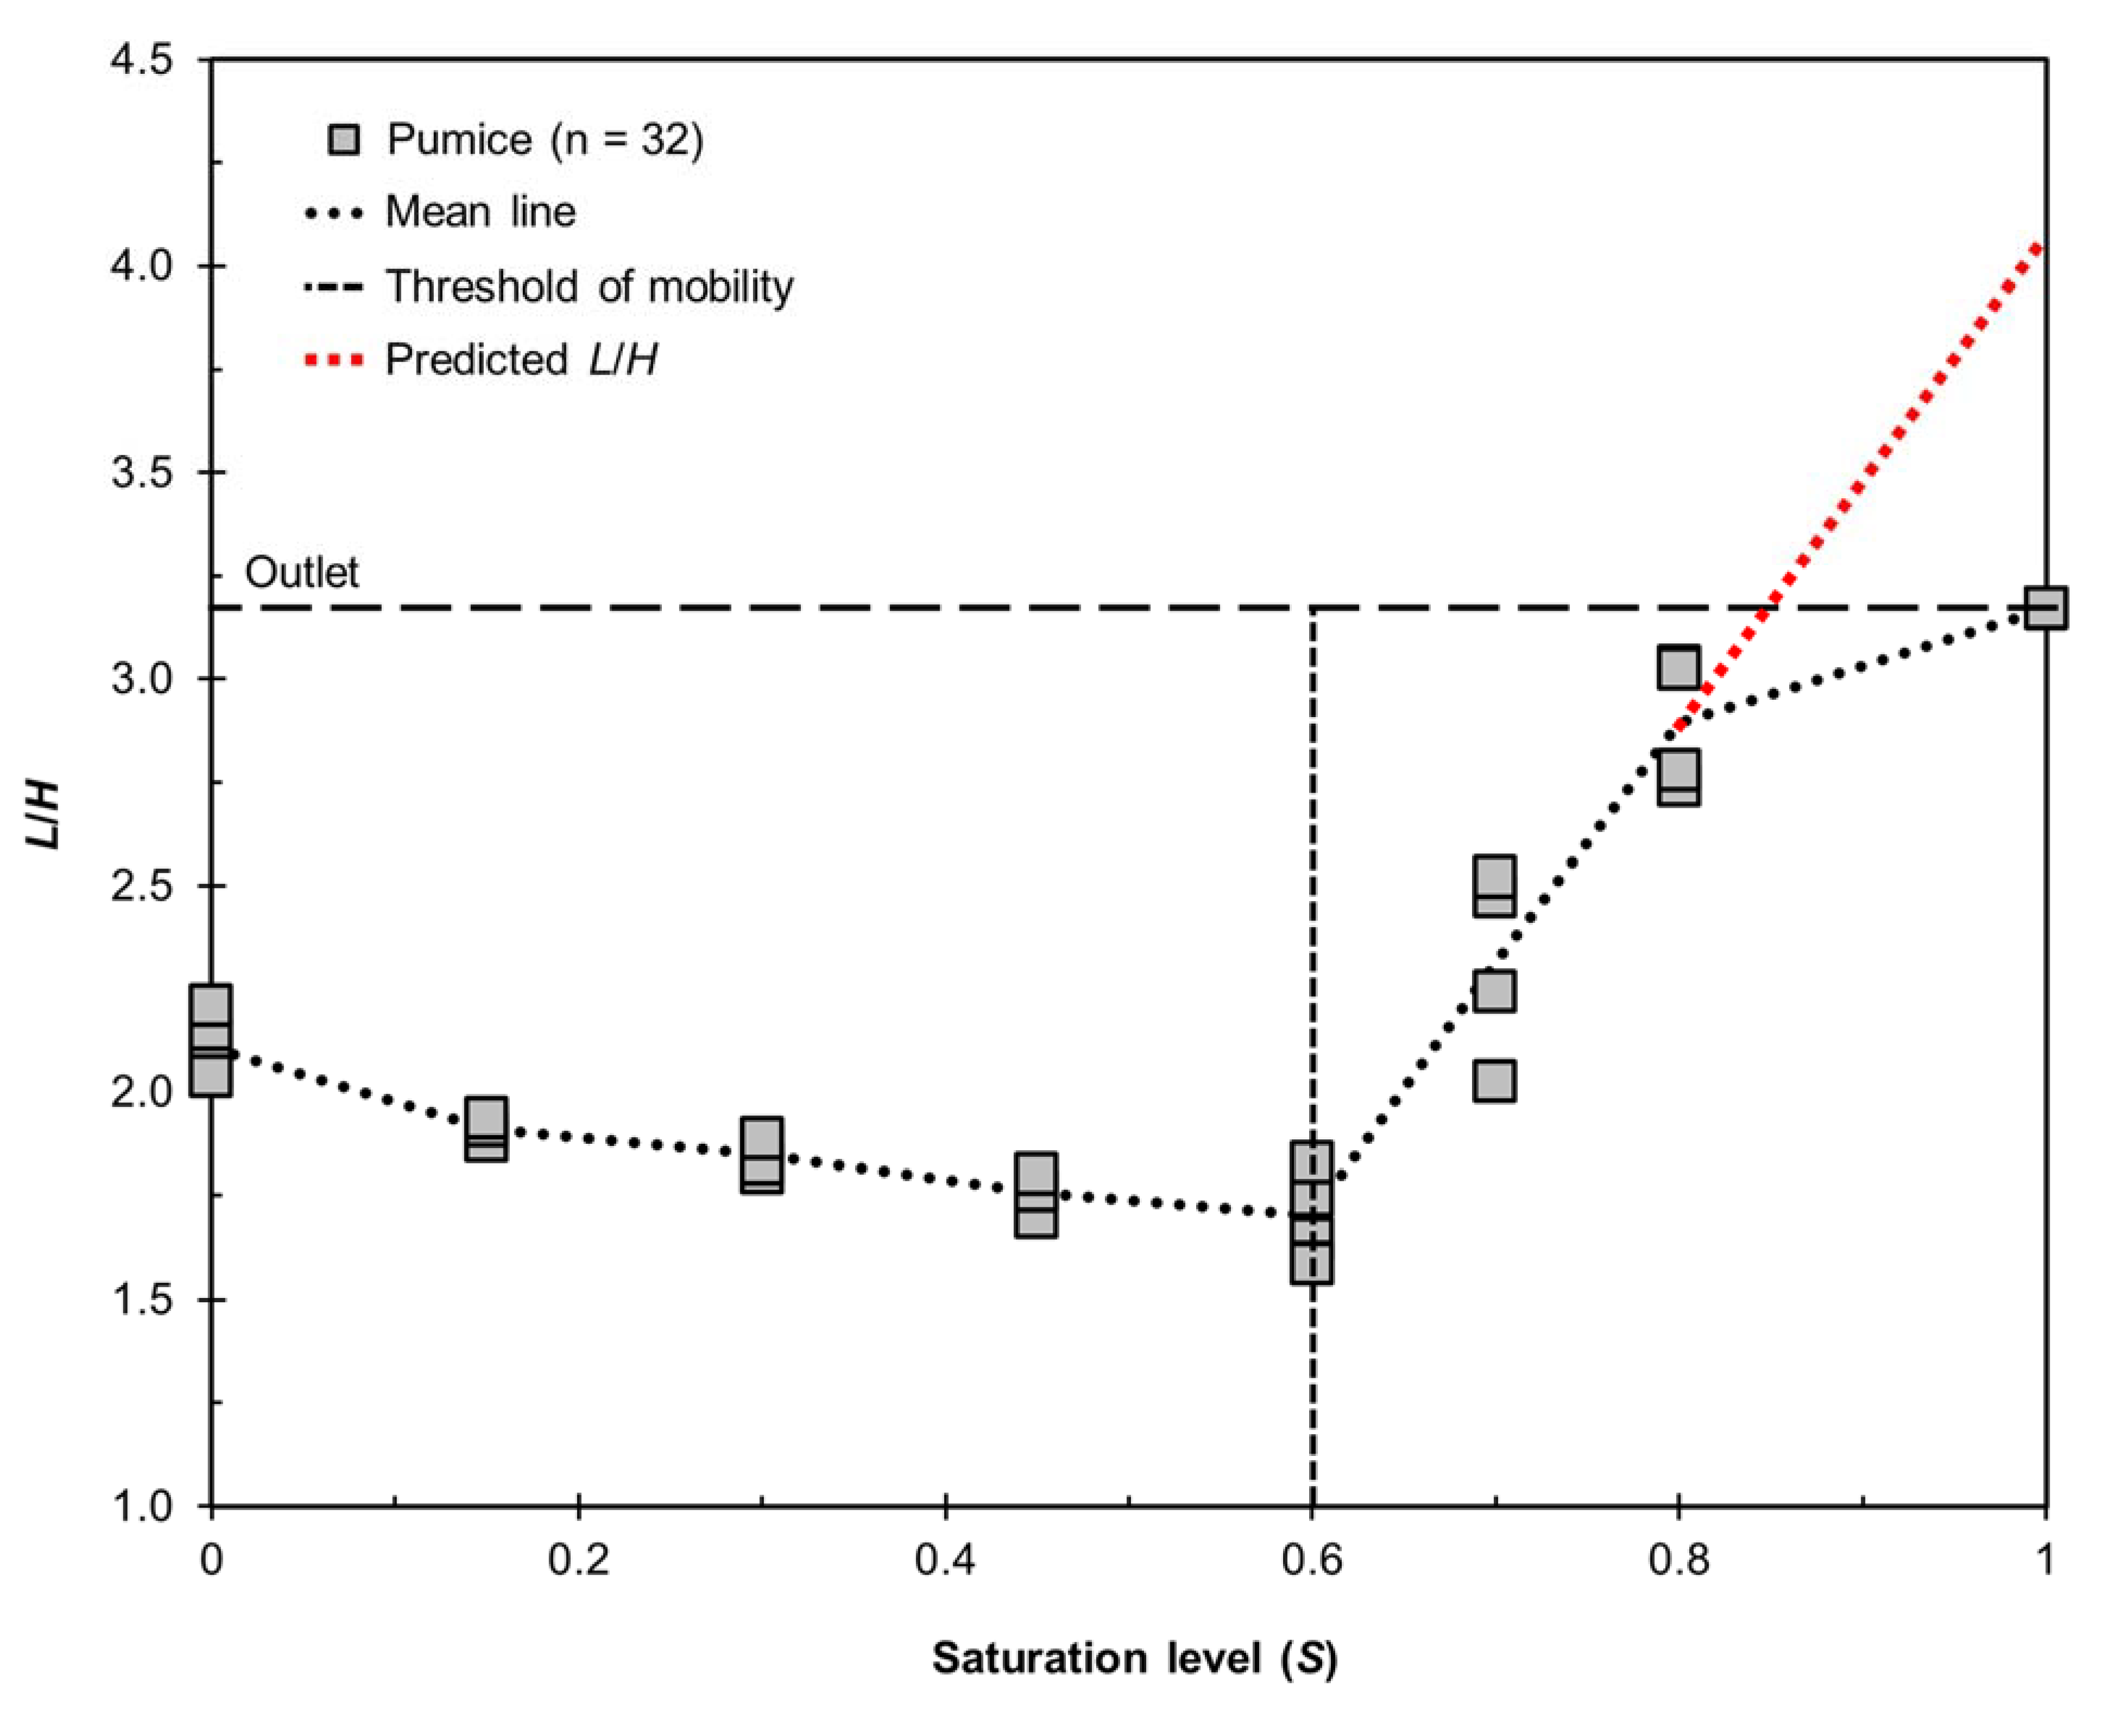
The L/H varied depending on the saturation level (S) (Figure 4). For dry soil (S = 0), L/H ranged between 2–2.2 (mean = 2.1; SD = 0.07). As pumice became wetter, L/H progressively decreased up to S = 0.6. Then L/H began to increase above S = 0.6 and peaked at S = 1 (mean = 3.2; SD = 0). Thus, S = 0.6 marks the threshold for landslide mobility change; the lowest L/H among all conditions, ranging between 1.6 and 1.8 (mean = 1.7; SD = 0.1). Nevertheless, because the sediment entered the bucket (segment D) during the S = 1 experiment, the actual travel distance for this condition could not be measured. Hence, the L/H under S = 1 conditions was the same in all four repetitions (L/H = 3.2) and underestimates mobility. Therefore, we projected the slope of the mean L/H value at S = 0.6–0.8 to S = 0.8–0.1 to predict the mobility under saturated conditions (S = 1) (Figure 4).
3.3. Characteristics of Sediment Deposition
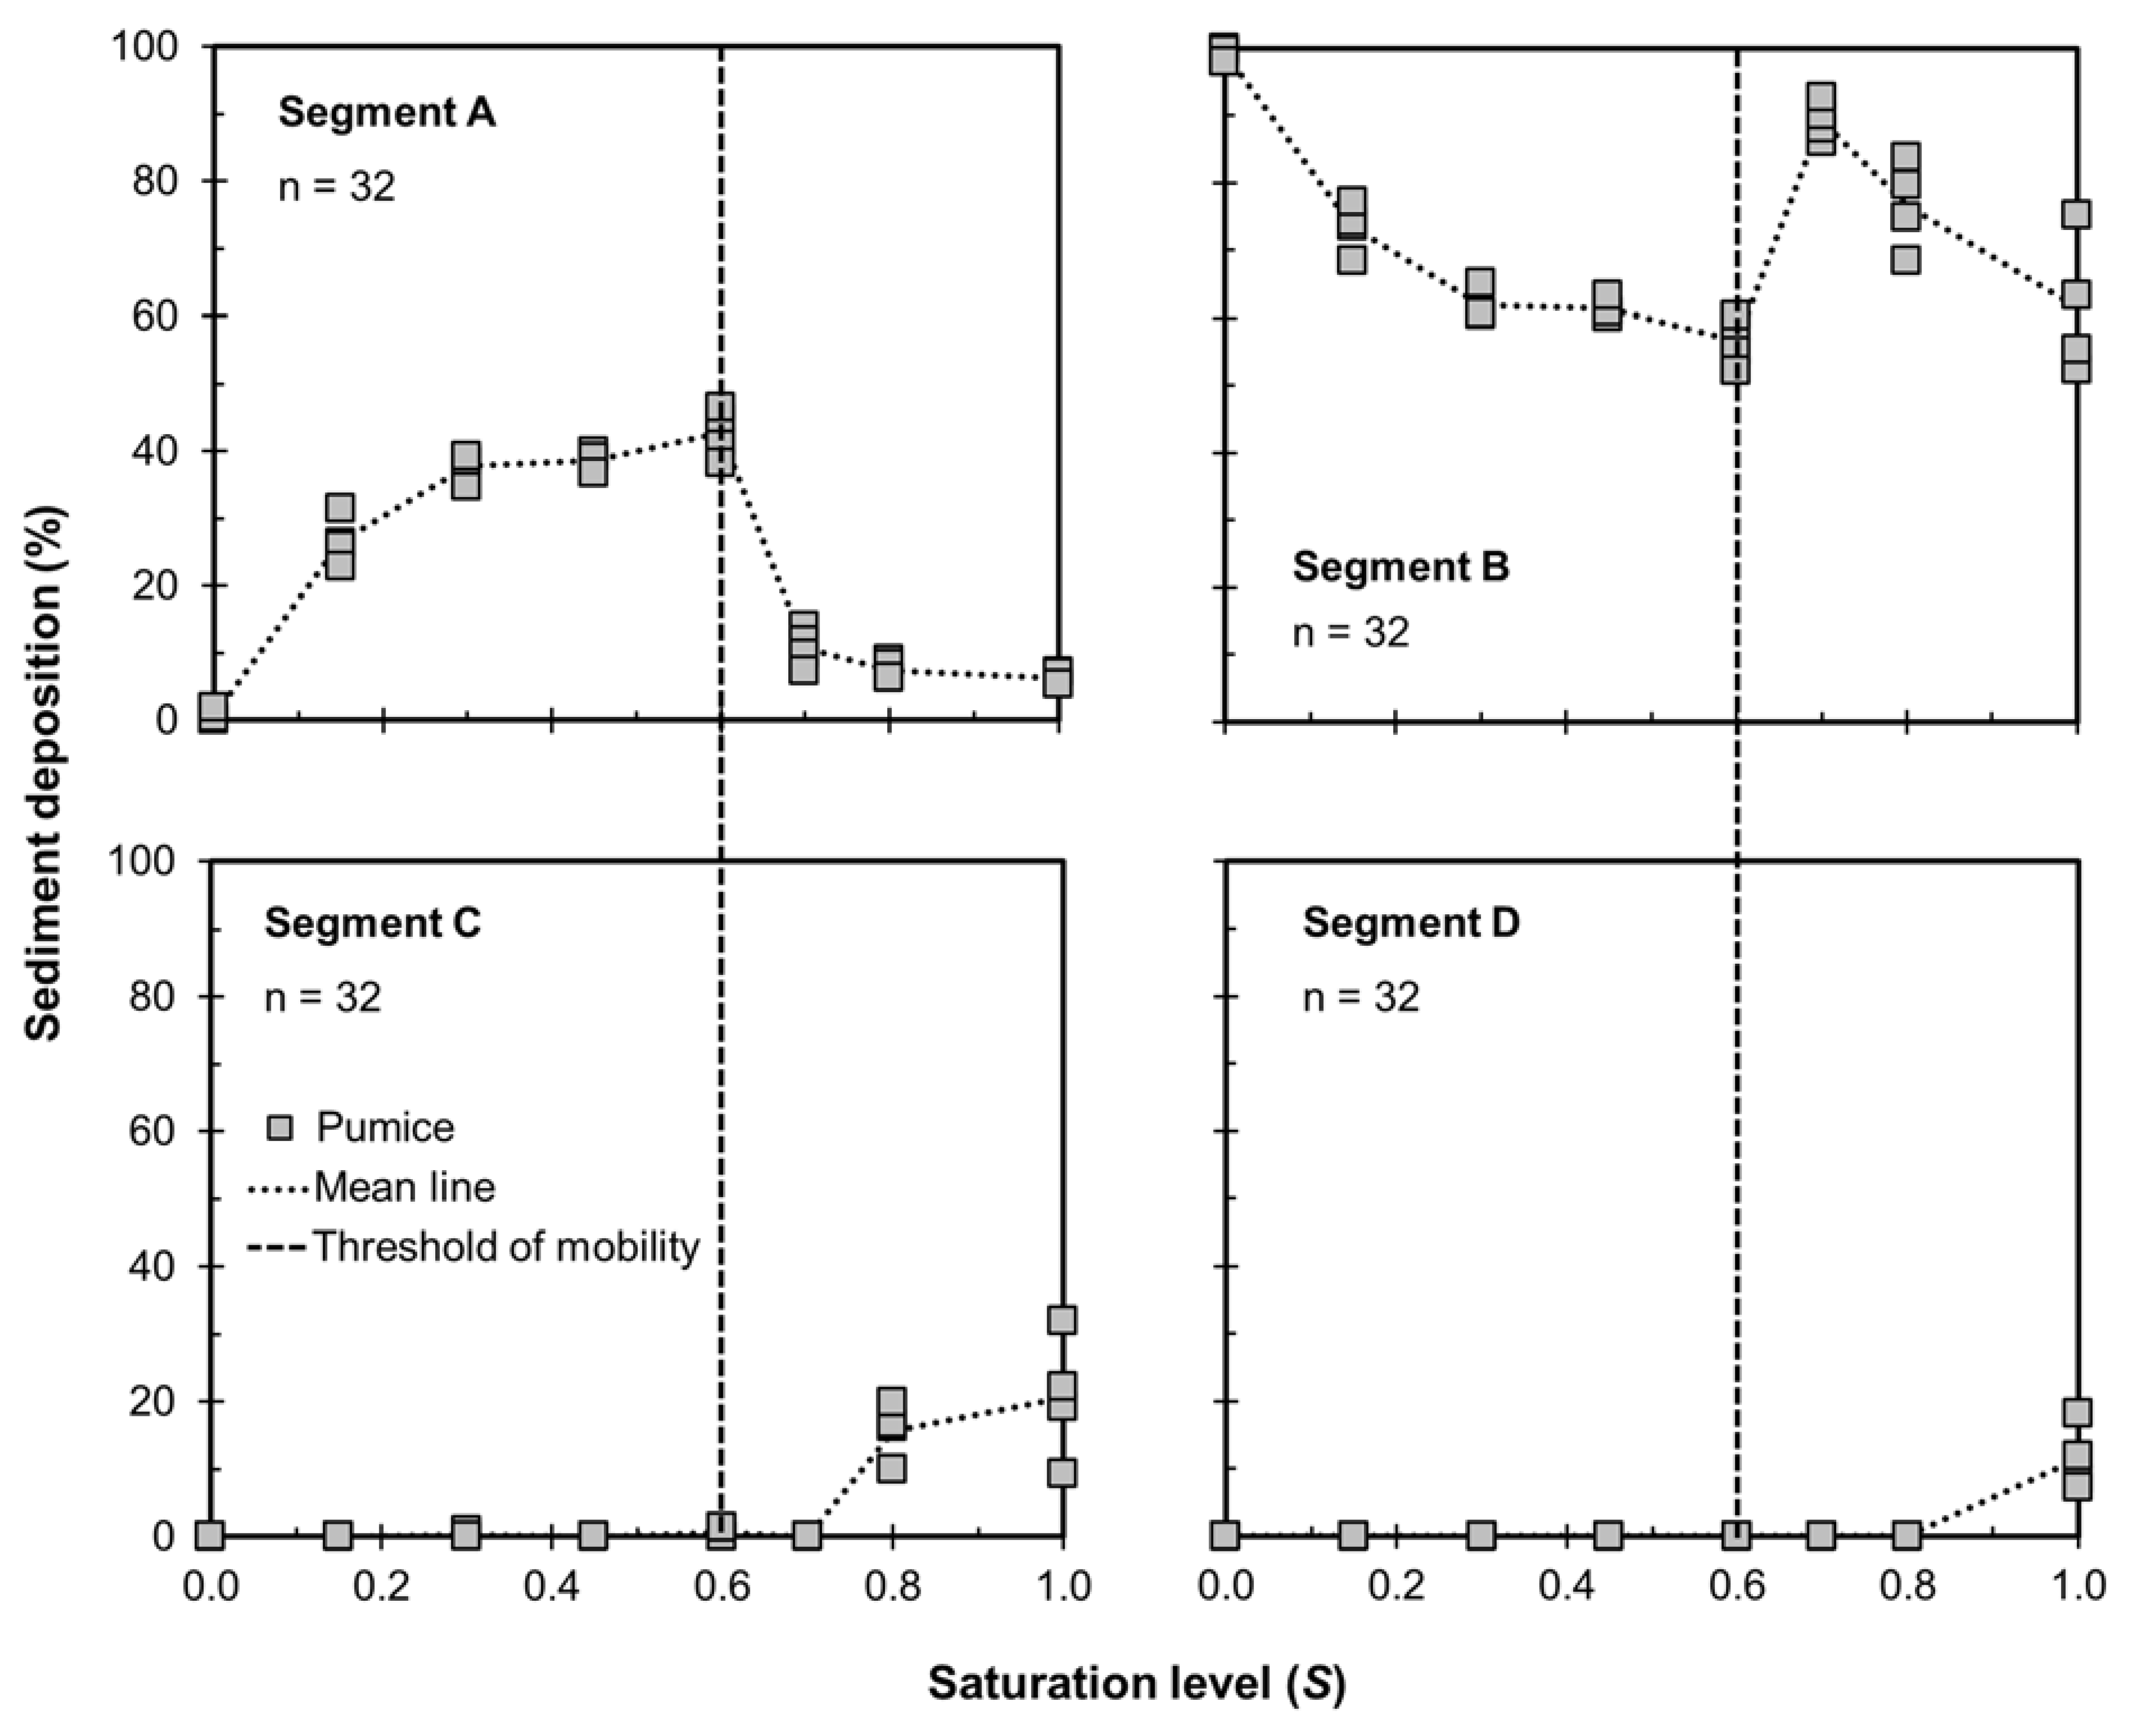
Sediment deposition in all segments differed depending on the saturation level (Figure 5). For all dry sediments (S = 0), deposition was highest in segment B, followed by segment A, and no sediment reached segments C and D. With increasing saturation (up to S = 0.6), sediment deposition increased in segment A and decreased in segment B. For S > 0.6, sediment deposition occurred in downstream segments C and D. Further increases in the saturation level caused a gradual increase in sediment deposition in segments C and D, whereas deposition in segments A and B gradually decreased. This increasing pattern of sediment deposition in segments C and D indicates greater sediment movement downslope.
4. Discussion
4.1. Uniqueness of Pumice
Pumice is characterized by a low specific gravity, representing particle density. The specific gravity of soils typically ranges between 2.6 and 2.8 [37], whereas that in the four pumice samples we collected was 1.29–1.33. Since particle density influences soil strength [38], such a low specific gravity indicates a low strength of pumice. Indeed, changes in particle size distribution after triaxial tests indicated a low shear strength of pumice [39], and grain crushing due to overburden pressure [31]. The low specific gravity of pumice might be associated with numerous voids inside these volcanic particles (e.g., [25]).
Internal voids within pumice greatly influence pumice density because soil is a three-phase material consisting of solids, voids, and water. The four pumice samples had a dry bulk densities of 0.3–0.41 g/cm3, lower than that of typical non-volcanic soils (>0.9 g/cm3) [22,23,24]. Our findings were similar to those derived from the Plinian deposit of the Minoan eruption of Santorini, Greece (0.19–0.32 g/cm3 pumice bulk density) [22]. Similarly, pumice derived from the 79 AD Mount Vesuvius eruption had a low dry bulk density, ranging from 0.6 to 0.7 g/cm3 [23].
The presence of internal voids in pumice also enhances porosity compared to non-volcanic soils. The porosity of the four pumice samples was 70–75%, whereas for non-volcanic soils, porosity values are typically <60% [22,23,24]. Our porosity values agreed with previous studies in Santa Maria, Guatemala and Medicine Lake, California (63–73% porosity) [25]. Moreover, the internal voids in pumice may result in a high matric potential (suction) [23]. Such a condition enables pumice to absorb and possibly hold a substantial amount of water. Indeed, the inner-particle water absorption limit for pumice was 95–143%, which is 9–15 times higher than that suggested by ASTM C127, with the absorption limit ranging between 8–10% for typical coarse-grained soils. Such a high-water absorption limit on pumice was also found in previous studies (e.g., [23]), ranging from 67 to 70%.
This high-water absorption limit on pumice might also be associated with its pore connectivity. Dead-end to active pore ratios (Rv) among four pumice samples ranged from 26.5% to 38.1%, indicating that voids inside pumice particles are composed of 72.4–79.1% active pores and 20.9–27.6% dead-end pores. Our finding of a predominance of active versus dead-end pores is similar to findings of pumice originating from the eruption of Montagne Pele’e volcano in France, i.e., >75% active pores inside pumice particles [40]. Previous studies at the mountaintop lake of Changbaishan, China, and Mount Mazama, USA similarly reported >80% of interconnected porosity in pumice [41,42].
4.2. Landslide Mobility among Various Water Content
The presence of water within soil particle contacts strongly influences soil strength [43], affecting the mobility of geophysical gravitational flows [44]. For sand-sized particles, a significant increase in cohesion occurred at water contents < 5% because of the formation of a liquid bridge at soil particle contacts [45]. Similarly, a laboratory experiment indicated that water surface tension was the highest at a water content of <20% for particles < 110 µm, attributed to inter-particle cohesion [43]. This liquid cohesion weakened when particle size exceeded 150 µm because the effect of gravitational forces was larger than water surface tension [46]. Moreover, most studies confirmed a significant reduction of shear strength at high water content (e.g., saturated conditions) because of high pore-water pressure (e.g., [10,12,43,45,47]).
Similar to previous studies (e.g., [7,15,44]), the variability of sediment mobility in our experiment might be associated with the availability of water at soil particle contacts. Indeed, completely dry conditions generated the highest L/H for conditions under S ≤ 0.6 because lightweight materials with no liquid cohesion between particles promoted individual mobility for granular materials (e.g., [48]). The continuous decrease in L/H for 0 < S ≤ 0.6 might be associated with the liquid bridge that was generated by inter-particle cohesion [45]. Nearly saturated conditions caused much sediment transport to the outlet because of high pore-water pressure [47].
4.3. The Effect of Soil Characteristics on Landslide Mobility
Soil porosity is an important geotechnical factor for landslide mobility [2,7], because it defines water storage on soils [49]. A numerical simulation suggested that a 2% increase in soil porosity may elevate the travel distance of the 2014 Oso landslide because the porous, water-saturated media potentially liquefied during transport. A laboratory experiment confirmed this finding and found that sediment with the highest porosity generated the greatest sediment transport downstream in saturated conditions [7].
Although the porosity of pumice samples was high, the inner-particle absorption of water in these samples was also high, affecting inter-particle water availability. Compared to a previous study in the same flume configuration [7], pumice in our study had higher porosity and generated greater sediment transport to the outlet (7–18%) than their sediments under saturated conditions (used in [7]). However, this pumice is less mobile compared to weathered sedimentary rock (mean sediment transport to outlet = 61.3%) despite having 28% larger porosity. Because inner-particle water absorption (WA) on pumice was equal to S = 0.56, only about 44% of saturated water was retained in inter-particle voids. Although pumice had high porosity, since their WA is also high, the inter-particle water availability might be less than that in weathered sedimentary rock. Such conditions imply that higher porosity does not always represent higher mobility.
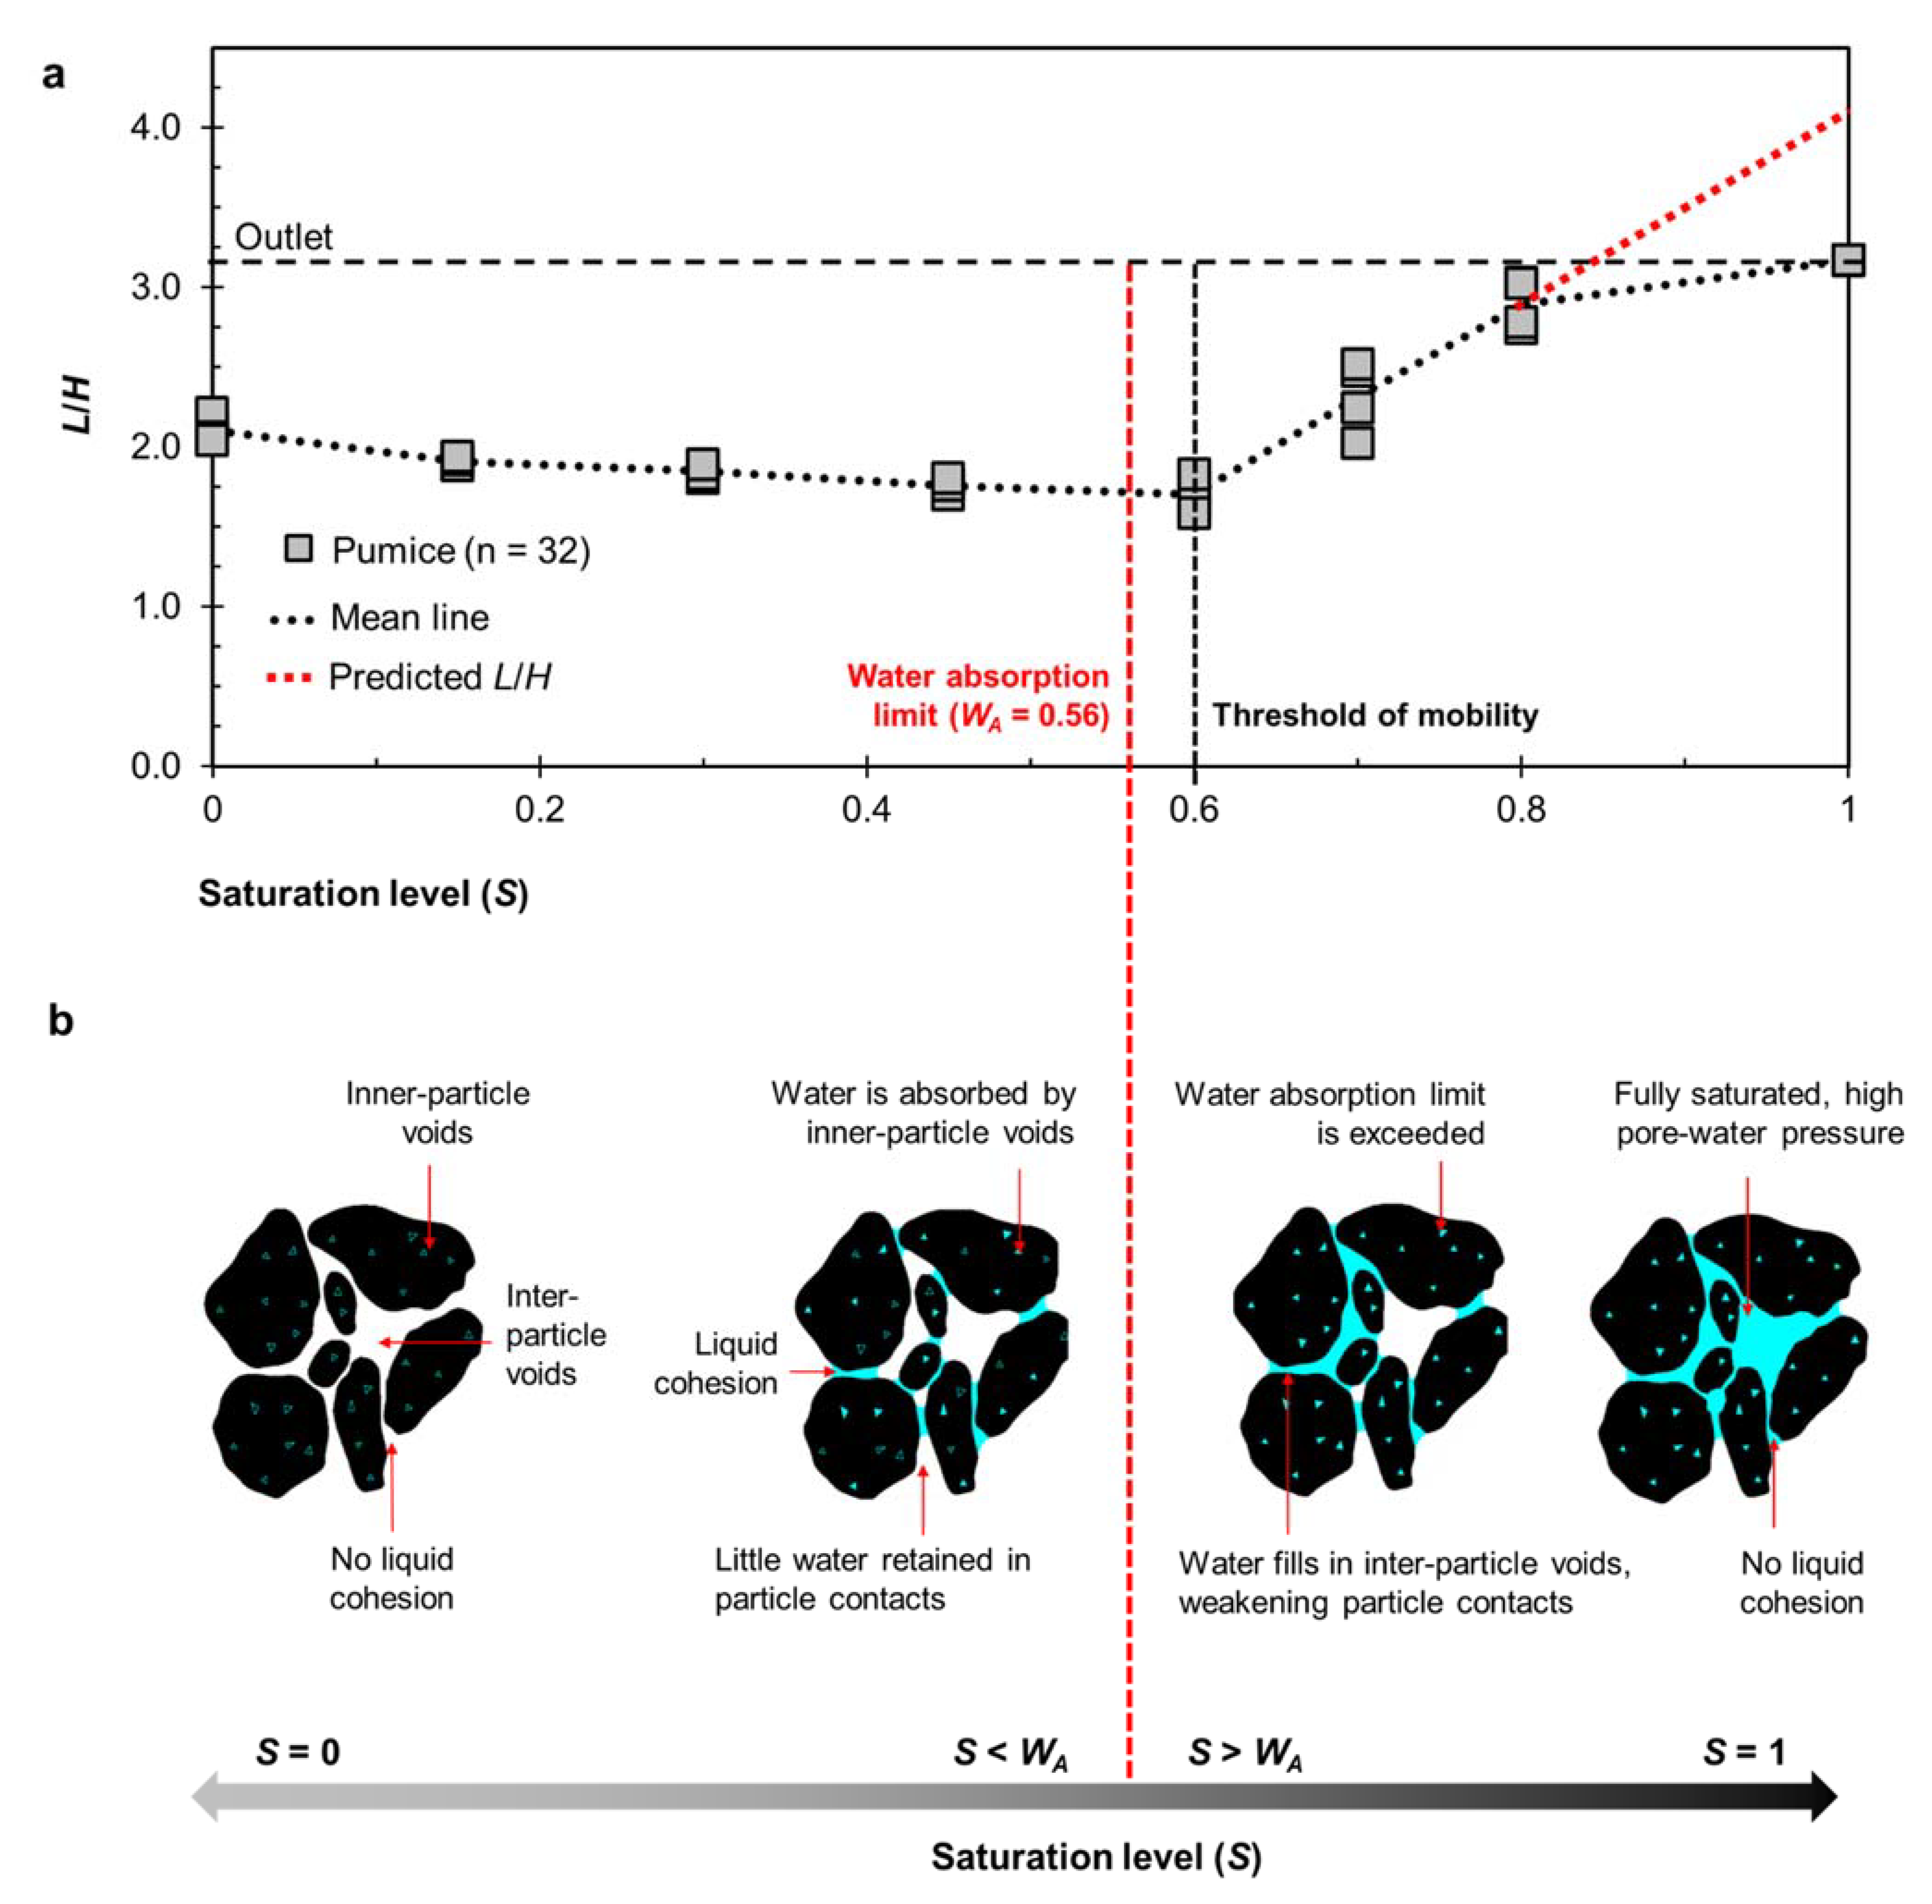
Water absorption within pumice particles also controls the pattern of L/H (Figure 6a). Indeed, since the water absorption limit for pumice corresponded to S = 0.56, water less than S < 0.56 may be absorbed by the internal voids with little water on particle contacts. Such a condition enhances inter-particle cohesion and thereby reduces L/H. Hence, S = 0.6 became the threshold of L/H, and S > 0.6 generated much higher sediment transport because water exceeding water absorption limit may weaken particle contacts (Figure 6b).
4.4. The Mobility of Landslides in Pumice
The water content of our four pumice samples was high, with saturation level (S) ranging between 0.5 and 0.6. Based on our experiments, values of L/H using S = 0.6 were 1.6–1.8, with a scaled-up volume of 13,500 m3. These values of L/H were low compared to those from field investigations in the same area that ranged from 4.2 to 5.2 for volumes of 10,000–15,000 m3 [30]. Similarly, GIS analysis of landslides triggered during the 1968 Tokachi-Oki earthquake had higher values of L/H for landslides in pumice, ranging between 2.7–7 for similar ranges of volume [20]. This condition implies that the actual landslides were more mobile than those in our experiment, which may indicate a higher water content in the field during the actual landslides. These differences in water content might be associated with water accumulation from previous rainfall events. Indeed, API30 on the date when landslides occurred was 230 mm (measured from AMeDAS Atsuma), which was 2.2–3.6 times larger than that during field investigations.
These differences in L/H might also be associated with scaling effects. A previous study suggested that small-scale experiments generated much larger effects of shear resistance from liquid cohesion and smaller effects of pore-water pressure compared to the actual phenomena, which is proportional to h3, where h represents landslide thickness [50]. As such, small scale experiments with much smaller h compared to the full-scale natural events potentially underestimate landslide mobility. Additionally, since overburden pressure depends strongly on h, the actual landslides may generate much larger overburden pressure than those in small-scale experiments, potentially crushing soil particles during transport. As soil particles are crushed, more soil mass occupies the same soil volume, elevating pore-water pressure, which consequently fluidizes the landslide mass, thus enhancing landslide mobility (L/H) [51]. Previous studies mentioned that this grain-crushing-induced fluidization not only occurs in completely saturated conditions [52], but also in partially saturated soils [53].
Although we did not observe any grain crushing in our experiments, which may be attributed to the much smaller h compared to actual landslides, our findings indicate that such unique pumice characteristics can facilitate landslide fluidization. Since a low value of specific gravity indicates a low soil strength [38], pumice can be easily crushed during transport. Indeed, the change in particle size distribution after triaxial testing indicates crushability of pumice under overburden pressure [39]. Field investigation confirmed that grain crushing occurred on landslides in pumice [21,31]. Because internal voids in pumice can absorb and possibly hold a substantial amount of water, such grain crushing may allow water to escape from internal voids thereby fluidizing the landslide mass during transport.
Therefore, our findings concur with previous studies that water content is a key factor controlling the mobility of landslides in pumice (e.g., [20]). Gravimetric water contents of pumice samples based on laboratory tests were high, ranging between 95 and 143%. However, we highlight that unique pumice characteristics such as high water absorption may facilitate water fluidization in pumice layers, enhancing landslide mobility. Variability of mobility might be associated with the variability of initial water content in pumice layers influenced by topography and water-holding capability.
5. Conclusions
We conducted a flume experiment to examine the mobility of earthquake-induced landslides in pumice soils. Pumice used in this experiment was derived from landslides induced by the 2018 Eastern Iburi Earthquake, Japan. This pumice was unique because of the low specific gravity compared to non-volcanic soils, which indicated a low soil strength [38]. Since this low value of specific gravity might be associated with numerous voids inside pumice particles, pumice can absorb and possibly hold a substantial amount of water; 9–15 times higher than for typical coarse-grained soils. Using various saturation levels, our flume experiment confirmed that this inner-particle water absorption influences pumice mobility (L/H ratio).
Since grain crushing may occur on landslides in pumice [21,31], our findings indicated that unique pumice characteristics (i.e., high water absorption) potentially enhance their mobility. Therefore, although the initiation of earthquake-induced landslides is less influenced by soil-water conditions, they can be as mobile as those induced by rainfall, depending on the initial water content of pumice layers. Since pumice can absorb a substantial amount of water, this initial water content can be influenced by topography and water-holding capability in pumice layers, as well as water accumulation during antecedent rainfall. We believe that these findings provide insights for improving landslide risk assessment in catchments underlain by volcanic deposits.
Author Contributions
Conceptualization, resources, and supervision, T.G.; Methodology, T.G., H.S.K. and R.N.; Investigation, T.G., H.S.K., R.N. and R.P.R.; Data curation and writing—original draft preparation, R.N.; Validation, T.G., R.C.S. and K.S.; Writing—review and editing, all co-authors. All authors have read and agreed to the published version of the manuscript.
Funding
This research received no external funding.
Acknowledgments
We thank the FLOuRISH Institute (Institute for Fostering Leadership to create future value through Outstanding Research, Innovation and Sustainable Higher education), Tokyo University of Agriculture and Technology, Japan, for supporting this study. We also thank Yoshiharu Ishikawa and Yohei Arata for valuable discussions and constructive feedbacks on conducting field investigations.
Conflicts of Interest
The authors declare no conflict of interest.
References
- Sidle, R.C. Mass Movement. In Encyclopedia of Natural Hazards, Encyclopedia of Earth Sciences Series; Bobrowsky, P.T., Ed.; Springer: Dordrecht, The Netherlands, 2013. [Google Scholar] [CrossRef]
- Iverson, R.; George, D.; Allstadt, K.; Reid, M.; Collins, B.; Vallance, J.; Schilling, S.; Godt, J.; Cannon, C.; Magirl, C.; et al. Landslide mobility and hazards: Implications of the 2014 Oso disaster. Earth Planet. Sci. Lett. 2015, 412, 197–208. [Google Scholar] [CrossRef]
- Roback, K.; Clark, M.K.; West, A.J.; Zekkos, D.; Li, G.; Gallen, S.F.; Chamlagain, D.; Godt, J.W. The size, Distribution, and Mobility of Landslides Caused by the 2015 M. 7.8 Gorkha Earthquake, Nepal. Geomorphology 2018, 301, 121–138. [Google Scholar] [CrossRef]
- Jibson, R.W. The 2005 La Conchita, California, Landslide. Landslides 2006, 3, 73–78. [Google Scholar] [CrossRef]
- Evans, S.G.; Guthrie, R.H.; Roberts, N.J.; Bishop, N.F. The Disastrous 17 February 2006 Rockslide-debris Avalanche on Leyte Island, Philippines: A Catastrophic Landslide in Tropical Mountain Terrain. Nat. Hazards Earth Syst. Sci. 2007, 7, 89–101. [Google Scholar] [CrossRef]
- Kharismalatri, H.S.; Ishikawa, Y.; Gomi, T.; Shiraki, K.; Wakahara, T. Collapsed material movement of deep-seated landslides caused by Typhoon Talas 2011 on the Kii Peninsula, Japan. Int. J. Eros. Control Eng. 2017, 10, 108–119. [Google Scholar] [CrossRef]
- Kharismalatri, H.S.; Ishikawa, Y.; Gomi, T.; Sidle, R.C.; Shiraki, K. Evaluating Factors for Controlling Sediment Connectivity of Landslide Materials: A Flume Experiment. Water 2019, 11, 17. [Google Scholar] [CrossRef]
- Guo, D.; Hamada, M.; He, C.; Wang, Y.; Zou, Y. An empirical model for landslide travel distance prediction in Wenchuan earthquake area. Landslides 2014, 11, 281–291. [Google Scholar] [CrossRef]
- Hayashi, J.N.; Self, S. A comparison of pyroclastic flow and debris avalanche mobility. J. Geophys. Res. Solid Earth 1992, 97, 9063–9071. [Google Scholar] [CrossRef]
- Legros, F. The Mobility of Long Run-out Landslides. Eng. Geol. 2002, 63, 301–331. [Google Scholar] [CrossRef]
- Lucas, A.; Mangeney, A.; Ampuero, J.P. Frictional velocity-weakening in landslides on Earth and on other planetary bodies. Nat. Commun. 2014, 5, 3417. [Google Scholar] [CrossRef]
- Legros, F. Landslide Mobility and the Role of Water. In Landslides from Massive Rock Slope Failure, Earth and Environmental Sciences; Evans, S.G., Mugnozza, G.S., Strom, A., Hermanns, R.L., Eds.; Springer: Dordrecht, The Netherlands, 2006; Volume 49, pp. 233–242. [Google Scholar] [CrossRef]
- Ochiai, H.; Okada, Y.; Furuya, G.; Okura, Y.; Matsui, T.; Sammori, T.; Terajima, T.; Sassa, K. A fluidized landslide on a natural slope by artificial rainfall. Landslides 2004, 1, 211–219. [Google Scholar] [CrossRef]
- Bessette-Kirton, E.K.; Coe, J.A.; Schulz, W.H.; Cerovski-Darriau, C.; Einbund, M.M. Mobility characteristics of debris slides and flows triggered by Hurricane Maria in Puerto Rico. Landslides 2020, 17, 2795–2809. [Google Scholar] [CrossRef]
- Yang, L.; Wei, Y.; Wang, W.; Zhu, S. Numerical Runout Modeling Analysis of the Loess Landslide at Yining, Xinjiang, China. Water 2019, 11, 1324. [Google Scholar] [CrossRef]
- Zhou, G.G.D.; Hu, H.S.; Song, D.; Zhao, T.; Chen, X.Q. Experimental study on the regulation function of slit dam against debris flows. Landslides 2019, 16, 75–90. [Google Scholar] [CrossRef]
- McColl, S.T. Landslide Causes and Triggers. In Landslide Hazards, Risks and Disasters; Shroder, J.F., Davies, T., Eds.; Academic Press: Cambridge, MA, USA, 2015; pp. 17–42. [Google Scholar] [CrossRef]
- Zhang, Y. Earthquake-Induced Landslides; Springer Nature: Singapore, 2018; pp. 1–31. [Google Scholar] [CrossRef]
- Chigira, M.; Tsou, C.-Y.; Matsushi, Y.; Hiraishi, N.; Matsuzawa, M. Topographic precursors and geological structures of deep-seated catastrophic landslides caused by Typhoon Talas. Geomorphology 2013, 201, 479–493. [Google Scholar] [CrossRef]
- Ling, S.; Chigira, M. Characteristics and triggers of earthquake-induced landslides of pyroclastic fall deposits: An example from Hachinohe during the 1968 M7.9 Tokachi-Oki earthquake, Japan. Eng. Geol. 2020, 264, 105301. [Google Scholar] [CrossRef]
- Crosta, G.B.; Imposimato, S.; Roddeman, D.; Chiesa, S.; Moia, F. Small Fast-moving Flow-like Landslides in Volcanic Deposits: The 2001 Las Colinas Lanslide (El Salvador). Eng. Geol. 2005, 79, 185–214. [Google Scholar] [CrossRef]
- Esposito, L.; Guadagno, F.M. Some special geotechnical properties of pumice deposits. Bull. Eng. Geol. Environ. 1998, 57, 41–50. [Google Scholar] [CrossRef]
- Whitham, A.G.; Sparks, R.S.J. Pumice. Bull. Volcanol. 1986, 48, 209–223. [Google Scholar] [CrossRef]
- Maeda, T.; Soma, K.; Warkentin, B.P. Physical and Engineering Characteristics of Volcanic Soils in Japan Compared in Other Countries. Irrig. Eng. Rural. Plan. 1983, 3, 16–31. [Google Scholar] [CrossRef]
- Fauria, K.E.; Manga, M.; Wei, Z. Trapped bubbles keep pumice afloat and gas diffusion makes pumice sink. Earth Planet. Sci. Lett. 2017, 460, 50–59. [Google Scholar] [CrossRef]
- Wang, F.; Fan, X.; Yunus, A.P.; Subramanian, S.S.; Alonso-Rodriguez, A.; Dai, L.; Xu, Q.; Huang, R. Coseismic landslides triggered by the 2018 Hokkaido, Japan (Mw 6.6), earthquake: Spatial distribution, controlling factors, and possible failure mechanism. Landslides 2019, 16, 1551–1566. [Google Scholar] [CrossRef]
- Konagai, K.; Nishiyama, S.; Ohishi, K.; Kodama, D.; Nanno, Y. Large Ground Deformations Caused by the 2018 Hokkaido Eastern Iburi Earthquake. JSCE J. Disaster Factsheets 2018, FS2018-E-0003, 1–9. [Google Scholar]
- Ritonga, R.P.; Gomi, T.; Tarigan, S.D.; Kaswanto, R.L.; Kharismalatri, H.S.; Noviandi, R.; Arata, Y.; Ishikawa, Y. Land Cover and Characteristics of Landslides Induced by the 2018 Mw 6.7 Eastern Iburi Earthquake, Hokkaido. Int. J. Eros. Control Eng. 2020, 13, 76–83. [Google Scholar] [CrossRef]
- Ito, Y.; Yamazaki, S.; Kurahashi, T. Geological features of landslides caused by the 2018 Hokkaido Eastern Iburi Earthquake in Japan. Geol. Soc. London Spéc. Publ. 2020, 501, 171–183. [Google Scholar] [CrossRef]
- Osanai, N.; Yamada, T.; Hayashi, S.-I.; Kastura, S.; Furuichi, T.; Yanai, S.; Murakami, Y.; Miyazaki, T.; Tanioka, Y.; Takiguchi, S.; et al. Characteristics of landslides caused by the 2018 Hokkaido Eastern Iburi Earthquake. Landslides 2019, 16, 1517–1528. [Google Scholar] [CrossRef]
- Zhang, S.; Li, R.; Wang, F.; Iio, A. Characteristics of landslides triggered by the 2018 Hokkaido Eastern Iburi earthquake, Northern Japan. Landslides 2019, 16, 1691–1708. [Google Scholar] [CrossRef]
- Yamagishi, H.; Yamazaki, F. Landslides by the 2018 Hokkaido Iburi-Tobu Earthquake on September 6. Landslides 2018, 15, 2521–2524. [Google Scholar] [CrossRef]
- Japan Meteorological Agency (JMA). Monthly Report on Earthquakes and Volcanoes in Japan September 2018. Available online: https://www.data.jma.go.jp/svd/eqev/data/gaikyo/monthly/201809/201809monthly.pdf (accessed on 20 September 2022).
- Ministry of Land Infrastructure, Transport, and Tourism (MLIT). The Collapse Area of the 2018 Hokkaido Eastern Iburi Earthquake was the Largest Since the Meiji Era. Available online: http://www.mlit.go.jp/river/sabo/h30_iburitobu/181005_sediment_volume.pdf (accessed on 7 April 2019).
- Iverson, R.M.; Logan, M.; Lahusen, R.G.; Berti, M. The perfect debris flow? Aggregated results from 28 large-scale experiments. J. Geophys. Res. Earth Surf. 2010, 115, F03005. [Google Scholar] [CrossRef]
- Nicholson, P.G. Soil Improvement and Ground Modification Methods; Elsevier: Amsterdam, The Netherlands, 2015; pp. 231–234. [Google Scholar] [CrossRef]
- Bowles, J.E. Foundation Analysis and Design, 5th ed.; The McGraw-Hill Companies, Inc.: Singapore, 1997; pp. 1–29. [Google Scholar]
- Roy, S.; Bhalla, S.K. Role of Geotechnical Properties of Soil on Civil Engineering Structures. Resour. Environ. 2017, 7, 103–109. [Google Scholar]
- Li, R.; Wang, F.; Zhang, S. Controlling role of Ta-d pumice on the coseismic landslides triggered by 2018 Hokkaido Eastern Iburi Earthquake. Landslides 2020, 17, 1233–1250. [Google Scholar] [CrossRef]
- Bernard, M.-L.; Zamora, M.; Géraud, Y.; Boudon, G. Transport properties of pyroclastic rocks from Montagne Pelée volcano (Martinique, Lesser Antilles). J. Geophys. Res. 2007, 112, B05205. [Google Scholar] [CrossRef]
- Klug, C.; Cashman, K.V.; Bacon, C.R. Structure and physical characteristics of pumice from the climactic eruption of Mount Mazama (Crater Lake), Oregon. Bull Volcanol. 2002, 64, 486–501. [Google Scholar] [CrossRef]
- Li, X.; Yang, W.; Zou, Q.; Zuo, Y. Investigation on Microstructure, Composition, and Cytocompatibility of Natural Pumice for Potential Biomedical Application. Tissue Eng. Part C Methods 2010, 16, 427–434. [Google Scholar] [CrossRef] [PubMed]
- Louati, H.; Oulahna, D.; de Ryck, A. Effect of the Particle Size and the Liquid Content on the Shear Behavior of Wet Granular Material. Powder Technol. 2017, 315, 398–409. [Google Scholar] [CrossRef]
- Roche, O.; Attali, M.; Mangeney, A.; Lucas, A. On the run-out distance of geophysical gravitational flows: Insight from fluidized granular collapse experiments. Earth Planet. Sci. Lett. 2011, 311, 375–385. [Google Scholar] [CrossRef]
- Mitarai, N.; Nori, F. Wet Granular Materials. Adv. Phys. 2006, 55, 1–45. [Google Scholar] [CrossRef] [Green Version]
- Shi, H.; Mohanty, R.; Chakravarty, S.; Cabiscol, R.; Morgeneyer, M.; Zetzener, H.; Ooi, J.Y.; Kwade, A.; Luding, S.; Magnanimo, V. Effect of Particle Size and Cohesion on Powder Yielding and Flow. KONA Powder Part. J. 2018, 35, 226–250. [Google Scholar] [CrossRef]
- Wang, G.; Sassa, K. Pore-pressure generation and movement of rainfall-induced landslides: Effects of grain size and fine-particle content. Eng. Geol. 2003, 69, 109–125. [Google Scholar] [CrossRef]
- Staron, L.; Lajeunesse, E. Understanding how volume affects the mobility of dry debris flows. Geophys. Res. Lett. 2009, 36, L12402. [Google Scholar] [CrossRef]
- Du, J.; Fan, Z.-J.; Xu, W.-T.; Dong, L.-Y. Research Progress of Initial Mechanism on Debris Flow and Related Discrimination Methods: A Review. Front. Earth Sci. 2021, 9, 629527. [Google Scholar] [CrossRef]
- Iverson, R.M. Scaling and design of landslide and debris-flow experiments. Geomorphology 2015, 244, 9–20. [Google Scholar] [CrossRef]
- Gerolymos, N.; Gazetas, G. A model for grain-crushing-induced landslides—Application to Nikawa, Kobe 1995. Soil Dyn. Earthq. Eng. 2007, 27, 803–817. [Google Scholar] [CrossRef]
- Sassa, K.; Fukuoka, H.; Wang, F.; Wang, G. Dynamic properties of earthquake-induced large-scale rapid landslides within past landslide masses. Landslides 2005, 2, 125–134. [Google Scholar] [CrossRef]
- Sassa, K.; Fukuoka, H.; Scarascia-Mugnozza, G.; Evans, S. Earthquake induced landslides: Distribution, motion and mechanisms. Soils Found 1996, 36, 53–64. [Google Scholar] [CrossRef] [Green Version]
Figure 1.
(a) Distribution of seismic intensity during the 2018 Eastern Iburi earthquake, Hokkaido, Japan (Modified from Japan Meteorological Agency [33]); (b) Landslide distribution provided by the Geospatial Authority of Japan; (c) Geological settings within the area affected by landslides derived from a 1:200,000 geological map published by the Geological Survey of Japan (adapted with permission from Ref. [31]. 2019, Shuai Zhang et al.). Geological units are described in (Table 1). Red dotted box in (b,c) indicates location where soil samples were collected.

Figure 2.
(a) General location of soil sampling. Landslide and soil conditions at (b) sampling location 1, (c) sampling location 2, and (d) sampling location 3. Ta is the Tarumae deposit that consists of Ta-a (1739 A.D.), Ta-b (1667 A.D.), Ta-c (2.5 ka), and Ta-d (8.7–9.2 ka). “A” represents volcanic ash soil. The white-dashed circle indicates the location where soil samples were collected.

Figure 3.
(a) Schematic illustration of the experimental setting; (b) Flume apparatus; (c) Flume segments (top); (d) Flume segments (side).
Figure 3.
(a) Schematic illustration of the experimental setting; (b) Flume apparatus; (c) Flume segments (top); (d) Flume segments (side).

Figure 4.
The L/H of pumice for various saturation levels. X-axis shows saturation levels (S), where S = 0 represents completely dry conditions, whereas S = 1 represents completely saturated conditions. Y-axis shows L/H, the ratio between total travel distance (L, cm) and total drop height (H, cm) of sediment. Both S and L/H are dimensionless parameters.

Figure 5.
Sediment deposition in all flume segments. X-axis shows saturation levels, where S = 0 represents completely dry conditions and S = 1 represents completely saturated conditions. Y-axis shows the percentage of sediment deposition in all flume segments (%). Segments A, B, C, and D represent the initiation, upper deposition, lower deposition, and outlet segments, respectively.

Figure 6.
(a) Effects of inner-particle water absorption (WA) on pumice mobility. X-axis shows saturation levels (S), where S = 0 represents completely dry conditions and S = 1 represents completely saturated conditions. Y-axis shows L/H, representing the ratio between total travel distance (L, cm) and total drop height (H, cm) of sediment. (b) Schematic illustration of possible soil-water interactions on pumice. Water absorption limit (WA, %) is converted to the saturation level (S) by dividing WA (%) by the saturated water content (wSr, %).


Table 1.
Geological unit classification.
| Codes | Lithology | Age |
|---|---|---|
| N2sn | Sandstone, mudstone, conglomerate, and sandstone (with tuff) | Middle to Late Miocene |
| N3sn | Diatomaceous siltstone with sandstone and conglomerate | Late Miocene to Pliocene |
| N1sr | Mudstone, sandstone, and conglomerate (with tuff) | Early Miocene to Middle Miocene |
| Q2th | Mud, sand, gravel, and peat | Middle Pleistocene |
| Q2sr | Mud, sand, gravel, and peat | Middle Pleistocene |
| Q3tl | Mud, sand, gravel, peat, and volcanic materials | Late Pleistocene |
| Q3vp | Rhyolite pumice block, lapilli, and ash | Late Pleistocene |
| Q3sr | Sand and volcanic ash sand | Late Pleistocene |
| PG2sr | Sandstone, mudstone, and conglomerate (with coal and tuff) | Middle Eocene |
| PG3sr | Tuffaceous siltstone with sandstone and conglomerate | Late Eocene to Early Oligocene |
| Hfn | Fan deposits gravel, sand, and mud (with peat and volcanic ash) | Late Pleistocene to Holocene |
| Hsr | Clay, silt, sand, gravel, and peat | Late Pleistocene to Holocene |
| K22ms | Marine sandstone | Late Cretaceous |
Table 2.
Physical characteristics of pumice.
| Physical Characteristics | Sample | |||
|---|---|---|---|---|
| S1 | S2 * | S3 | S4 | |
| Dry density (ρ, g/cm3) | 0.33 | 0.3 | 0.41 | 0.35 |
| Water content (w, %) | 147 | 172 | 139 | 160 |
| Specific gravity (Gs) | 1.29 | 1.3 | 1.33 | 1.19 |
| Mean particle size (D50, mm) | 6.3 | 4.8 | 1.7 | 4.5 |
| Coefficient of uniformity (Cc) | 6.3 | 4.8 | 6.1 | 5.2 |
| Coefficient of curvature (Cu) | 7.0 | 6.1 | 1.2 | 0.4 |
| Void ratio (e) | 2.9 | 3.3 | 2.2 | 2.4 |
| Porosity (n, %) | 75 | 77 | 70 | 74 |
| Saturated water content (wSr, %) | 221 | 256 | 167 | 200 |
| Water absorption limit (WA, %) | 113 | 143 | 95 | 118 |
| Dead-end to active pore ratio (Rv, %) | 34.0 | 26.5 | 38.0 | 38.1 |
| Soil classification | GP | GP | SW | SP |
Notes: * Sample used for flume experiment, GP is poorly graded gavel, SP is poorly-graded sand, and SW is well-graded sand.
Publisher’s Note: MDPI stays neutral with regard to jurisdictional claims in published maps and institutional affiliations. |
© 2022 by the authors. Licensee MDPI, Basel, Switzerland. This article is an open access article distributed under the terms and conditions of the Creative Commons Attribution (CC BY) license (https://creativecommons.org/licenses/by/4.0/).
Share and Cite
MDPI and ACS Style
Noviandi, R.; Gomi, T.; Kharismalatri, H.S.; Sidle, R.C.; Ritonga, R.P.; Shiraki, K. The Mobility of Landslides in Pumice: Insights from a Flume Experiment. Water 2022, 14, 3083. https://doi.org/10.3390/w14193083
AMA Style
Noviandi R, Gomi T, Kharismalatri HS, Sidle RC, Ritonga RP, Shiraki K. The Mobility of Landslides in Pumice: Insights from a Flume Experiment. Water. 2022; 14(19):3083. https://doi.org/10.3390/w14193083
Chicago/Turabian StyleNoviandi, Rozaqqa, Takashi Gomi, Hefryan S. Kharismalatri, Roy C. Sidle, Rasis P. Ritonga, and Katsushige Shiraki. 2022. "The Mobility of Landslides in Pumice: Insights from a Flume Experiment" Water 14, no. 19: 3083. https://doi.org/10.3390/w14193083
Note that from the first issue of 2016, this journal uses article numbers instead of page numbers. See further details here.