
Study on Nitrogen Loss Rules of Paddy Fields under Different Irrigation and Drainage Modes in Southern China


College of Agricultural Science and Engineering, Hohai University, Nanjing 210098, China
*
Authors to whom correspondence should be addressed.
Water 2022, 14(19), 3071; https://doi.org/10.3390/w14193071
Submission received: 18 August 2022
/
Revised: 15 September 2022
/
Accepted: 24 September 2022
/
Published: 29 September 2022
(This article belongs to the Section Water, Agriculture and Aquaculture)
Abstract
:With the growing problem of agricultural nonpoint source pollution, it is an urgent issue to explore irrigation and drainage modes suitable for rice-growing areas in southern China. Barrel experiments were conducted to study the variation of NH4+-N, NO3−-N and TN concentrations in surface drainage and deep percolation water, as well as the rules of nitrogen runoff losses and leaching losses. Treatments included frequent and shallow irrigation (FSI), drought planting with straw mulching (DPS) and water catching and controlled irrigation (WC-CI). The results showed that the trends of NH4+-N, NO3−-N and TN concentrations in surface drainage were similar, and the N concentration gradually decreased with increasing drainage frequency. The trends of NH4+-N, NO3−-N and TN concentrations in deep percolation water were similar, rising to a peak within 5~7 days after fertilization and then gradually decreasing. NH4+-N loss load was the main form of N loss load in surface drainage and deep percolation water, which accounted for 42.06~89.16%. Compared with FSI, DPS significantly increased surface drainage and N runoff loss loads by 98.67% and 125.86%, respectively, while WC-CI significantly reduced them by 59.21% and 66.38%, respectively. Deep percolation water was reduced by 68.59% and 37.99% for DPS and WC-CI, respectively, and N leaching loss loads were reduced by 74.69% and 43.23%, respectively. Compared with FSI, the total TN loss load was significantly reduced by 76.69% and 43.34% for DPS and WC-CI, respectively, and the pollution control was better for DPS. WC-CI significantly increased rice yield by 7.31%, while DPS decreased by 0.95 % due to long-term water stress. Comprehensively considered, WC-CI has obvious advantages, which can reduce nitrogen loss and maintaining a high yield.
1. Introduction
Rice is one of the essential food crops, and more than half of the world’s population depends on rice as a staple food [1]. China is the world’s largest rice country and has the most significant total rice production. Rice uses a lot of irrigation water, accounting for more than one-third of the total agricultural water used in China [2]. Precipitation is abundant in southern China, but spatial and temporal distribution is uneven, and seasonal droughts occur from time to time [3]. Nitrogen is an essential nutrient for rice growth and development. The fertilization systems, rainfall, irrigation and drainage systems are the influencing factors for the loss of nitrogen and other nutrients [4].
On the one hand, nitrogen loss leads to low fertilizer utilization and crop growth inhibition; on the other hand, nitrogen loss with drainage is a significant source of agricultural nonpoint-source pollution [5]. In addition, the amount of fertilizer applied to paddy fields in China is relatively high, while rainfall during rice growth in southern China is mainly in the form of heavy rainfall with a significant splash erosion of raindrops. The high frequency of fertilizer application and rainfall superimposed intensifies the nitrogen loss [6]. Therefore, it is of great practical significance to explore the variation law of paddy water quality under different irrigation and drainage modes and to promote suitable high-yielding rice abatement techniques to scientifically reduce nitrogen loss and protect the farmland ecological environment.
China produces nearly 1.04 billion tons of crop straw, but the utilization rate is only 33% [7]. Therefore, Chinese governments at all levels have strongly advocated and regulated the requirement of a straw return to the field, which is vital for cultivating soil fertility [8], improving crop quality and yield [9,10] and promoting straw utilization. Under traditional flooding irrigation, the straw decomposes rapidly in the flooded environment, decomposing and releasing agricultural nonpoint source pollutants, such as nitrogen and phosphorus. Ammonium nitrogen (NH4+-N) from straw decomposition volatilizes the ammonia, producing malodorous gases such as ammonia gas (NH3) [11]. At the same time, the decomposition activity of straw that is buried and submerged in an anaerobic environment can interfere with the nitrification and denitrification reactions in the paddy soil itself, which in turn affects the production and transformation of nitrogen [12]. Considering that straw mulching increases ground cover, effectively reduces inter-tree evaporation and creates conditions for dry cropping [13], scholars have proposed drought planting with straw mulching (DPS). After straw mulching, water, fertilizer, air and heat in the soil are affected. The fields change from continuously flooded to long-term anhydrous layers, and soil permeability and redox properties are changed [14,15].
The growth stages of rice in southern China highly overlap with the rainy season. Climate change has led to uneven spatial and temporal distribution of water resources, frequent heavy rainfall and increased frequency and intensity of droughts and the alternation of floods [16]. Research into water-saving irrigation has focused on the lower limit indicators for soil-moisture control. At the same time, rice is a semi-aquatic plant with some adaptability to drought and flood stresses. Therefore, scholars have proposed water catching and controlled irrigation (WC-CI) to reduce the lower limit of irrigation while increasing the upper limit of rainwater storage to intercept more rainwater resources and reduce irrigation and drainage quotas [17]. The gradual change of water management from the traditional continuous irrigation mode to alternating wet and dry modes has improved the soil reduction environment caused by excessive irrigation, which further affects nitrogen migration and loss [18,19,20].
Can the high yield and environmental effects of rice be synergized? This has been a hot topic at home and abroad. In this experiment, super rice Nanjing 9108 was used as the experimental material. We integrated and compared drought planting with straw mulching and water catching and controlled irrigation, with frequent and shallow irrigation as controls. Rice yield, drainage and nitrogen concentration were measured for different irrigation and drainage modes. Further, the amount of nitrogen loss and loss rules were analyzed, and the environmental effects of different irrigation and drainage modes were discussed to determine the suitable irrigation and drainage mode in southern China.
2. Materials and Methods
2.1. Description of Study Area and Climate Conditions
The experiments were conducted from June to October 2020 at the water-saving park of Hohai University (latitude 31°86′ N, longitude 118°60′ E), Nanjing, China. The study area has a humid subtropical monsoon climate, influenced by the East Asia Monsoon, with an average annual temperature of 15.7 °C and average annual water evaporation of 900 mm. The average annual rainfall is 1021.30 mm, and the flood season from June to September accounts for about 60% of the annual rainfall. The studied soil was taken from the clay soil in the cultivation layer of the water-saving park, with a soil bulk weight of 1.31 g/cm3, a saturation capacity of 38.70%, a pH value of 7.2 and an organic matter of 2.40%. The contents of total nitrogen, total phosphorus, available nitrogen, available phosphorus and available potassium were 0.91 g/kg, 0.32 g/kg, 47.40 mg/kg, 10.37 mg/kg and 90.00 mg/kg, respectively. The layout of the test site and the structure of the barrel are shown in Figure 1.
2.2. Experimental Design
The rice variety tested was Nanjing 9108. Seedlings were raised on 25 May 2020, transplanted on 29 June and harvested on 26 October. At the three leaf–one heart stage, seedlings with the same growth were selected for transplanting at four hills per bucket with three seedlings per hill.
The experiment was designed in a Randomized Complete Block Design, consisting of three treatments with five replications, including frequent and shallow irrigation (FSI), drought planting with straw mulching (DPS) and water catching and controlled irrigation (WC-CI). The DPS treatment was covered with semi-decomposed straw mulch about 20 mm thick on the soil surface, and the covered straw converted into dry matter weight was 6000 kg/ha.
A local high-yield fertilization method was adopted in the experiment (Table 1). The amount, timing and method of fertilizer application were consistent under different irrigation and drainage modes. The water management for different irrigation and drainage patterns is shown in Table 2. The irrigation water was obtained from the tap water system of the lab and the irrigation method was sprinkler irrigation. In addition to irrigation and drainage measures, the other agronomic techniques were the same.
The surface drainage samples were collected after the surface water depth had reached higher than the upper limit of the precipitation storage. The percolation water samples were collected one day before and 1, 3, 5 and 7 days after the application of tillering and panicle fertilizers, and every 3~6 days for the rest of the time. TN, NH4+-N and NO3−-N concentrations were determined by Alkaline potassium persulfate digestion UV spectrophotometry, Nessler’s reagent colorimetric method and phenol disulfonic acid spectrophotometry, respectively.
Data were analyzed by one-way analysis of variance (ANOVA) and least significant difference (Duncan) test at the 0.05 probability level (SPSS 22.0; Chicago, IL, USA). Data for each treatment were the means of five replicates. All statistical analyses were performed using standard procedures for randomized plot designs.
3. Results and Analysis
3.1. Water Condition and Paddy Yield
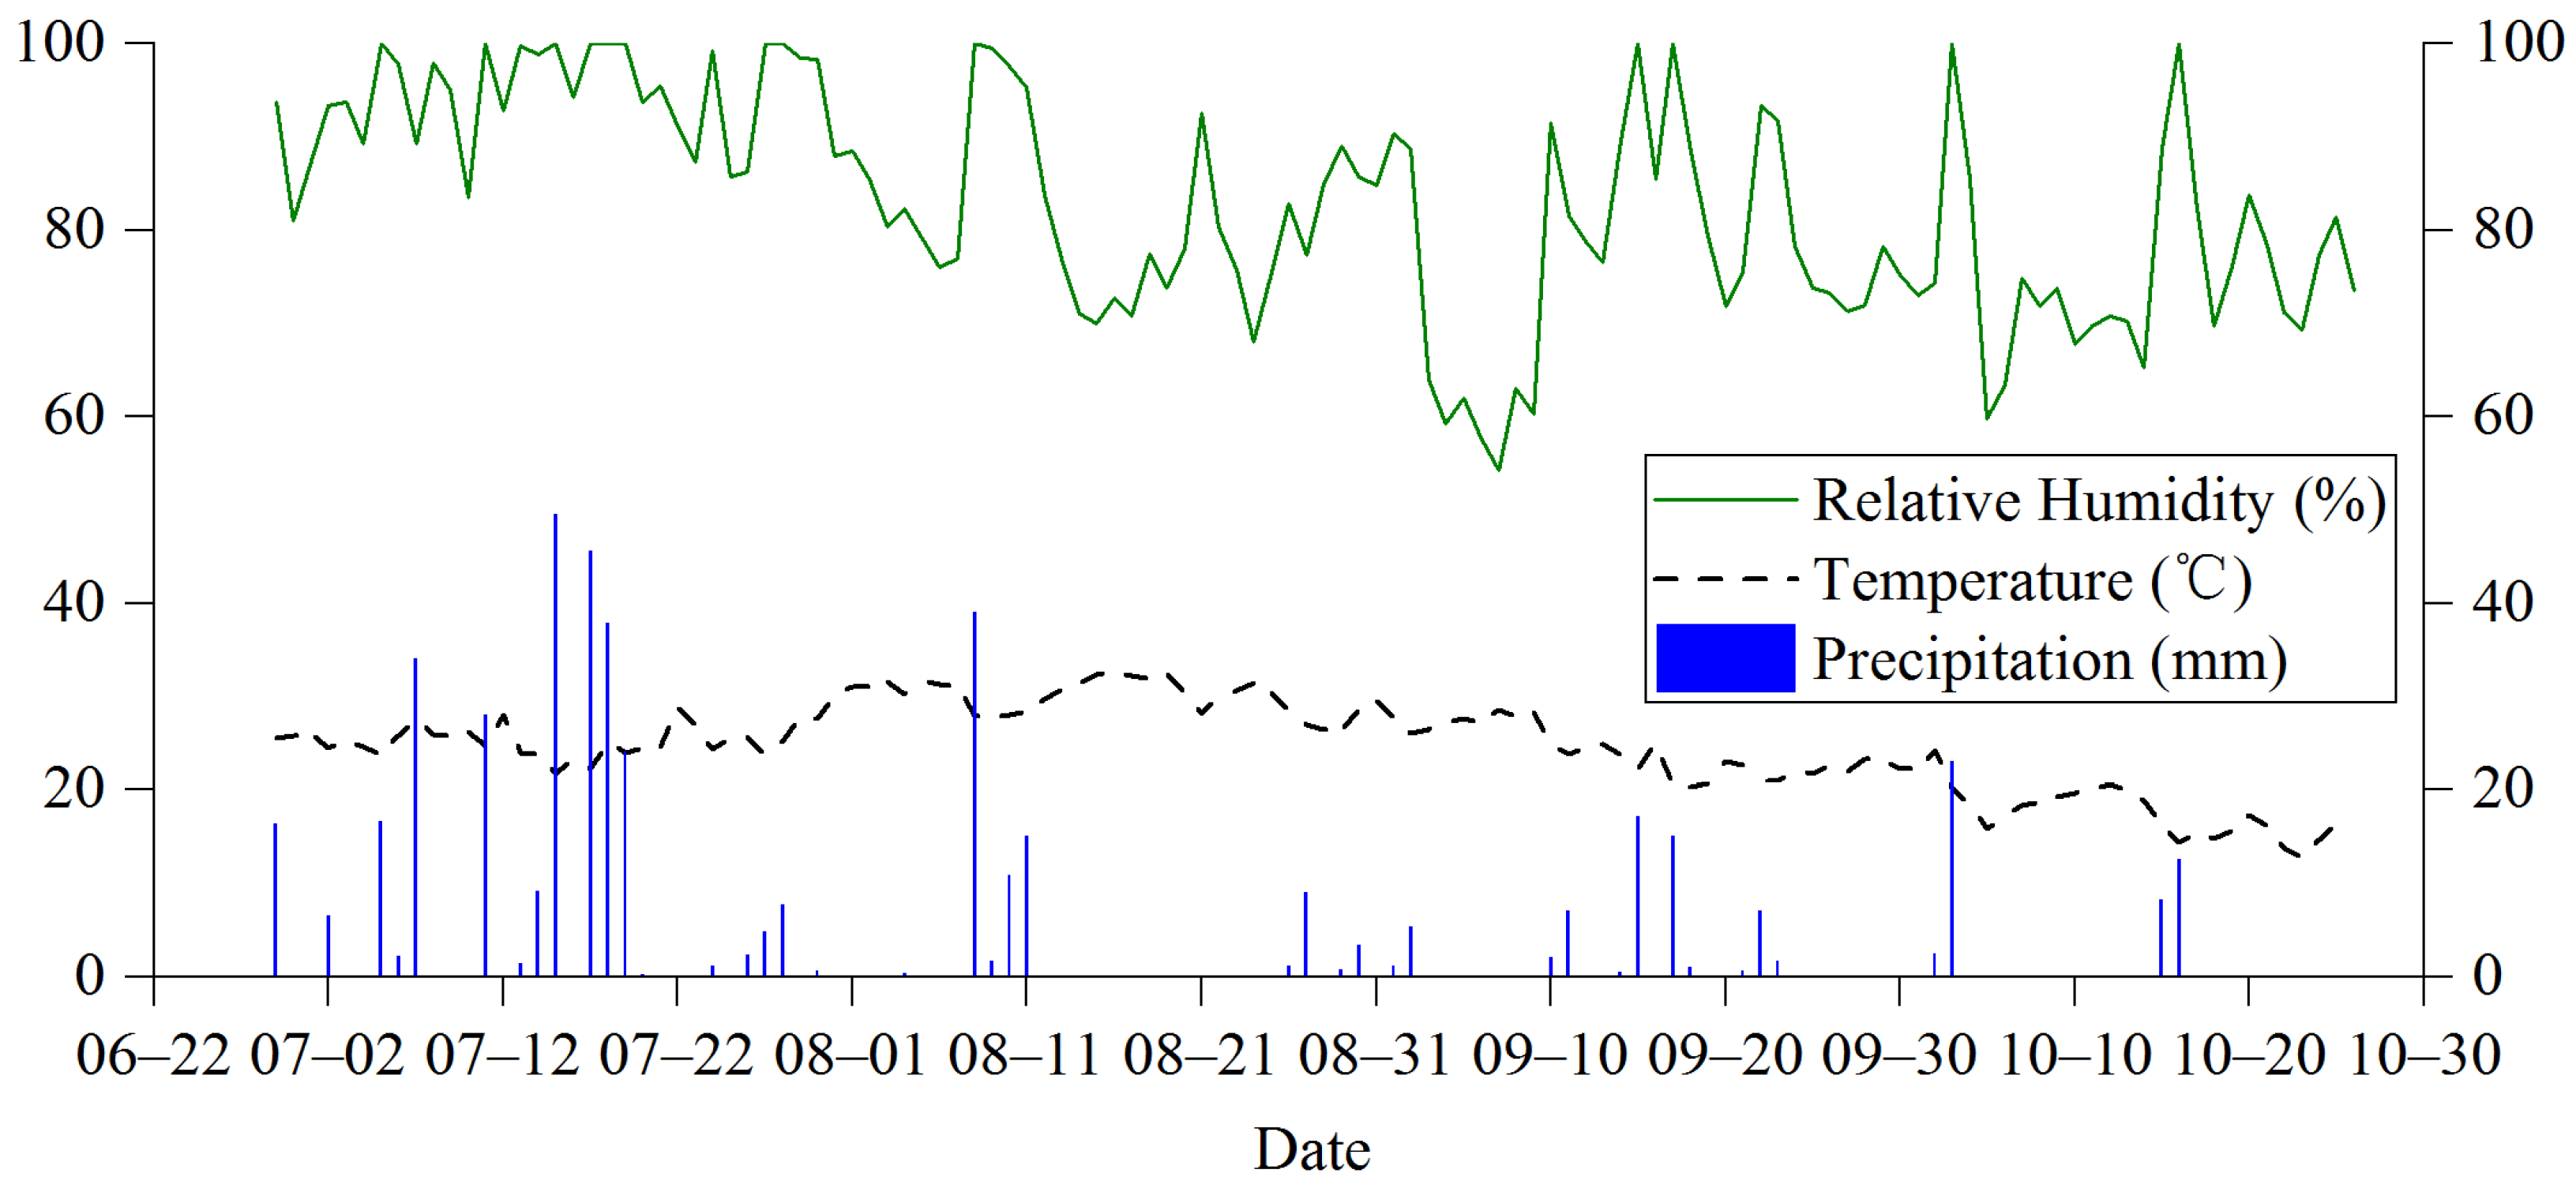
The precipitation, temperature and relative humidity of the rice growing season are shown in Figure 2. The total precipitation during the rice growing season was 474.80 mm, and the precipitation was mainly concentrated in the tillering stage, accounting for 62.89%.
The surface drainage under different irrigation and drainage modes is shown in Table 3. Precipitation and water management are the main factors determining the surface drainage and frequency. Compared with FSI, the surface drainage of DPS increased significantly by 98.67%, and that of WC-CI decreased significantly by 59.21%.
The amount of deep percolation water under different irrigation and drainage modes is shown in Table 4. Compared with FSI, DPS and WC-CI significantly reduced the amount of deep percolation water by 68.59% and 37.99%. Precipitation was concentrated in the tillering stage, when the surface water depth was considerable, and deep percolation water accounted for 38.56~41.39%. The amount of deep percolation water was the lowest in the yellow maturity stage, and only accounted for 1.99~6.02%.
The rice yields under different irrigation and drainage modes are shown in Table 5. Due to water stress, the theoretical and measured yields for DPS decreased by 3.65% and 0.31% compared with FSI, but the difference was insignificant. WC-CI has an obvious yield increase effect, through which theoretical and measured yields were 12.44% and 7.59% higher than FSI.
3.2. The Variation of NH4+-N, NO3−-N and TN Concentration in Surface Drainage
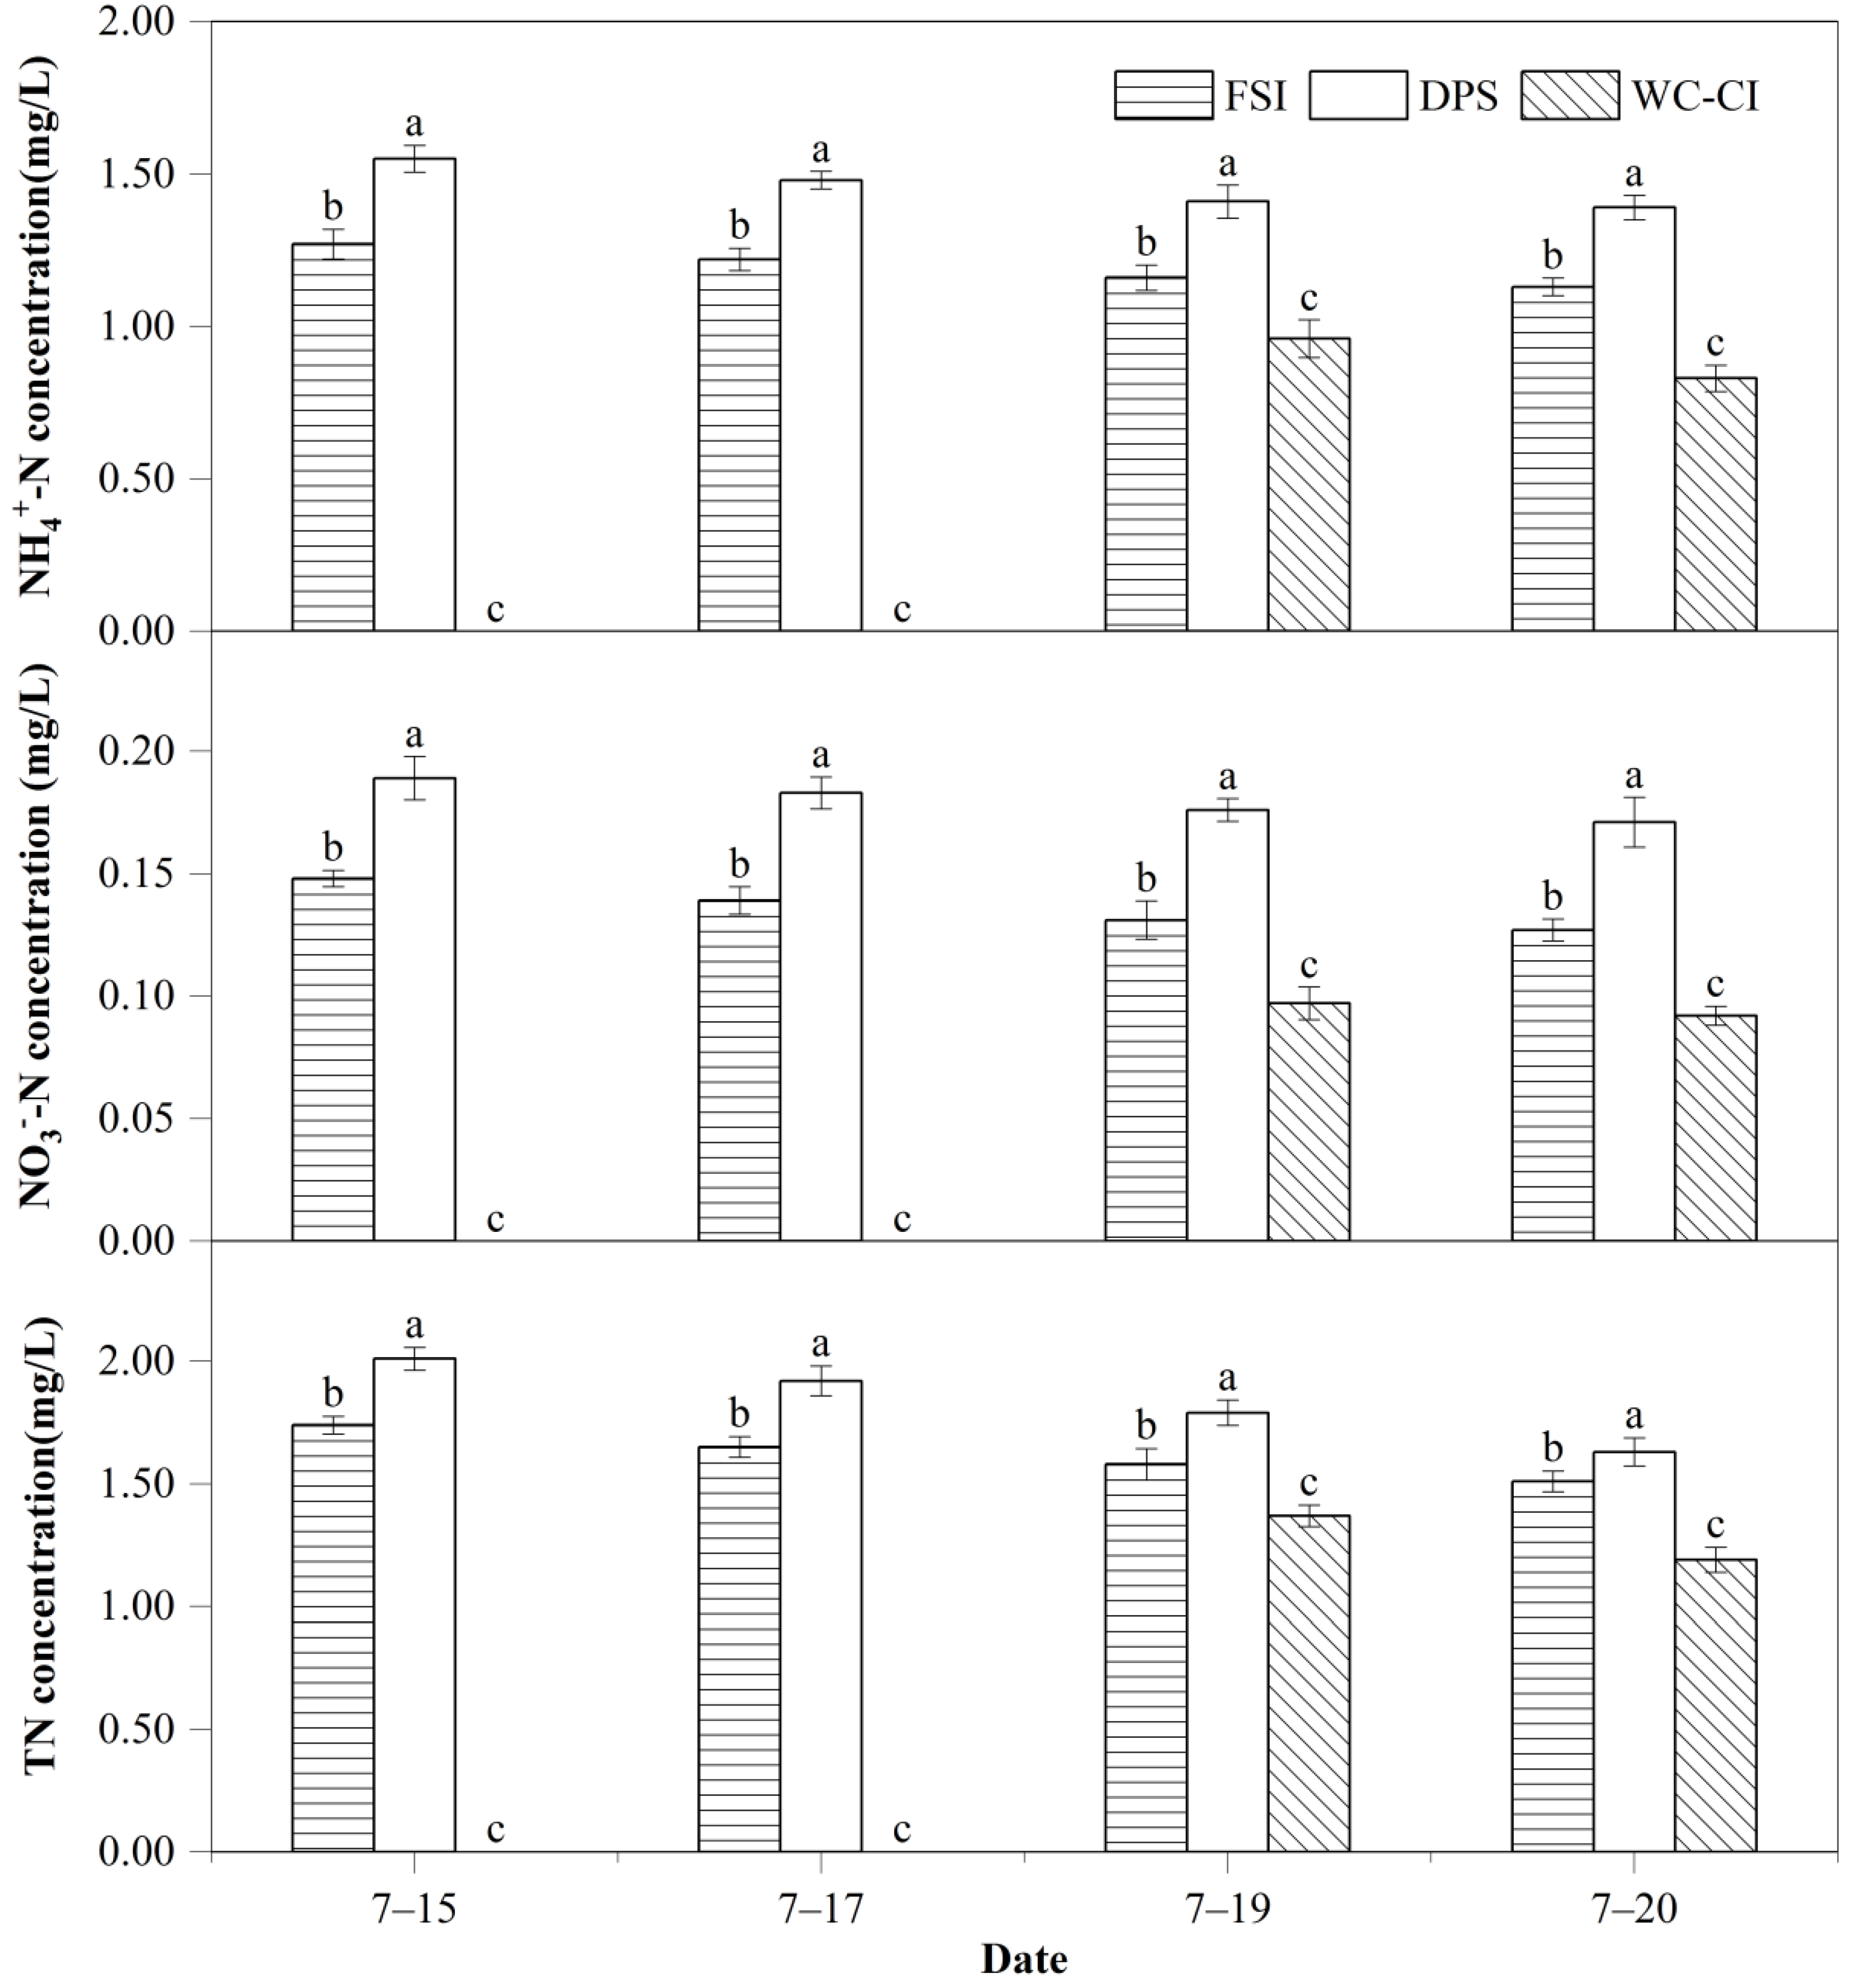
The concentrations of N in surface drainage under different irrigation and drainage modes are shown in Figure 3. The N concentration of each treatment was the highest at the first time. The main form of N in surface drainage was NH4+-N, and the concentrations of NH4+-N accounted for 69.75~85.27% of the TN concentrations, and that of NO3−-N accounted for 7.08~10.49%.
N concentrations in surface drainage varied greatly between different modes. Compared with FSI, DPS significantly reduced the average concentrations of NH4+-N, NO3−-N and TN by 68.59% and 37.99%, and WC-CI by 25.10%, 30.64% and 20.99%.
3.3. The Variation of NH4+-N, NO3−-N and TN Concentration in Deep Percolation Water
The concentrations of N in deep percolation water under different irrigation and drainage modes are shown in Figure 4. N concentrations appeared as two peaks with the application of tillering fertilizer and panicle fertilizer. The peak of tillering fertilizer was higher than that of panicle fertilizer, and NO3−-N reached its peak slightly later than NH4+-N and TN. The main N form in the deep percolation water was NH4+-N, and the concentration of NH4+-N accounted for 42.06~89.16% of TN concentration, and that of NO3−-N accounted for 6.02~30.61%.
N concentrations in deep percolation water differed significantly between irrigation and drainage modes. Compared with FSI, the first peak concentrations of NH4+-N, NO3−-N and TN for DPS changed significantly by −10.67%, 10.71% and −10.59%, and the WC-CI increased significantly, by 18.97%, 14.29% and 16.54%, respectively. Compared to FSI, the second peak concentrations of NH4+-N, NO3−-N and TN for DPS significantly changed by −19.72%, 17.50% and −5.12%, and the WC-CI significantly increased to 16.20%, 37.50% and 13.95%.
3.4. The Amount of Nitrogen Losses under Different Irrigation and Drainage Modes
The nitrogen losses under different irrigation and drainage modes are shown in Table 6. This experiment focused on nitrogen losses from surface drainage and deep percolation water, and did not consider nitrogen losses due to ammonia volatilization. Therefore, the sum of the runoff loss load and percolation loss load was considered as the total loss load. Compared with FSI, the total loss loads of NH4+-N, NO3−-N and TN were reduced by 47.04% and 42.86%, 58.08% and 49.07%, and 52.58% and 45.82% for DPS and WC-CI, respectively. It can be seen that DPS and WC-CI can effectively reduce the nitrogen losses with sound environmental effects.
The main form of N loss load in surface drainage and deep percolation water was NH4+-N. The loss load of NH4+-N in surface drainage accounted for 69.75~85.28%, and that of NO3−-N accounted for 7.08~10.49%. The loss of NH4+-N in deep percolation accounted for 42.06~89.16%, and that of NO3−-N accounted for 6.02~30.61%.
4. Discussions
4.1. Effects of Different Irrigation and Drainage Modes on Surface Drainage and Deep Percolation Water
Precipitation was concentrated in the initial tillering stage, accompanied by shorter rice plants and lower rainfall-storage upper limits, so surface drainage was performed in all treatments. In other growth stages, with little precipitation, no surface drainage was performed. Surface runoff from DPS increased significantly (Table 3), mainly because DPS had the lowest rainfall-storage upper limits. Under heavy rainfall conditions, the surface water depth quickly reached the upper rainfall-storage limit, and surface drainage occurred. In response to the characteristics of frequent flooding in southern China, WC-CI gives full play to the storage capacity and water retention capacity of paddy fields by increasing the upper limit of precipitation storage, which effectively reduces the frequency and amount of surface drainage, which is especially important in Southern China where labor costs are high [21]. The deep percolation of WC-CI was significantly higher than that of DPS and significantly lower than that of FSI, mainly due to the higher water storage depth and higher percolation rate after rain. Meanwhile, WC-CI maintained a low irrigation upper limit, and the field had no water layer on the surface for a long time, so its total seepage was still lower than that of FSI, which is consistent with the findings of Peng et al. [22] and Guo et al. [23].
4.2. Effects of Different Irrigation and Drainage Modes on the Concentration of Nitrogen in Surface Drainage
The N concentration in surface drainage was highest at the beginning, and then gradually decreased with the increase in drainage (Figure 3), mainly related to fertilizer application and rainfall. During rice growth in southern China, rainfall was mainly heavy with evident splash erosion. Especially at the early stage, when rice plants are shorter, with fewer tillers and more surface exposed, heavy rainfall can easily lead to the loss of soluble nutrients from the surface soil and the loss of nutrients adsorbed on the surface of sediment particles in the surface water [24,25]. When the soil is exposed, or the depth of surface water is shallow, the impact of storm raindrops is more intense, and surface runoff in a short period will bring a large amount of nitrogen into the surrounding water bodies, resulting in severe eutrophication of water bodies [26,27]. Ye et al. [28] showed that urea rapidly hydrolyzed after applying nitrogen fertilizer to paddy fields, and the N concentration in surface water increased rapidly and peaked on the first day. Then, the concentration decreased with time. In this experiment, the interval of surface drainage was very short, and no fertilizer was applied during these four periods. In addition, the treatments maintained a certain depth of water layer due to continuous rainfall, which diluted the nitrogen concentration.
When continuous rainfall was encountered, WC-CI took advantage of the highest rainfall-storage upper limit to store the runoff formed by the initial rainfall, reducing the splash erosion of raindrops and water turbulence and cutting the risk of nitrogen loss from surface runoff with sound ecological effects. Similar conclusions were reached by Guo et al. [29]. In addition, the upper limit of rainfall storage in WC-CI was up to 150 mm, which diluted the N concentration to some extent. DPS significantly increased the N concentration in surface drainage, probably because the semi-decayed straw mulched on the surface of DPS increased the N content in surface soil. Liu et al. [11] showed that the straw mulch imported fresh organic matter into paddy field-soil enhanced microbial activity and promoted the soil decomposition of organic matter. In addition, semi-decomposed straw undergoes decomposition and fermentation by soil microorganisms, producing some N and increasing the mineral N residue in the soil layer. Wang et al. [30] found that straw enhances microbial N fixation due to its high C/N ratio.
4.3. Effects of Different Irrigation and Drainage Modes on the Concentration of Nitrogen in Deep Percolation Water
After applying tillering fertilizer and panicle fertilizer, the N concentration in the deep percolation water increased and then decreased (Figure 4). This is because tillering and panicle fertilizers mainly applied urea, which was gradually hydrolyzed to inorganic N after application to the paddy field. Inorganic N migrated vertically with the soil solution, increasing the N concentration in the deep percolation water. Subsequently, the N concentration gradually decreased due to crop uptake and utilization, ammonia volatilization and other factors [31]. In addition, it was found that the peak nitrogen concentration after panicle fertilizer was significantly lower than that after tillering fertilizer, which was related to the difference in soil nitrogen levels before the fertilizer and the growth stage of rice [32]. During the re-greening and pre-tillering stage, rice plants are short, and the root system is not well developed, which results in a slow and small uptake of nitrogen, leading to more residual base fertilizer nitrogen in the soil. When tillering fertilizer was applied, the NH4+-N content in the soil remained at a high level. However, there was a 42-day interval between the application of panicle fertilizer and tillering fertilizer, during which the plants had already grown and developed, and the rate of N uptake was faster, and the amount of nitrogen uptake was larger.
The TN concentration in deep percolation water in WC-CI reached the maximum value because the irrigation amount and surface water depth decreased, resulting in a decrease in deep percolation water and an increase in N concentration, which is similar to the findings of Wang et al. [31] and Zhao et al. [33]. As a result of the largest deep leakage and long-term leaching of soil, deep percolation water in FSI had the maximum amount and the lowest N concentration. After transplanting, there was no water layer in DPS except for the water layer not higher than the upper limit of water storage reserved for a short period after rainfall, so N was enriched in the upper part of the soil and lacked downward mobility. As a result, the peak TN concentration in the deep percolated water was the lowest. It was also found that the peak concentration of NO3−-N in the deep percolation water of DPS was significantly higher than that of FSI, which may be due to the limit on the upper water storage during the lowest rainfall and the dry–wet cycle creating a more aerobic environment, increasing the oxygen flux from the atmosphere to the soil and accelerating the nitrification process [34].
4.4. Effects of Different Irrigation and Drainage Modes on the Amount of Nitrogen Losses
Earlier studies have shown that water management can significantly affect water transport and thus affect N losses. Therefore, N losses under different irrigation and drainage modes have shown different characteristics [35,36]. Liang et al. [37] and Yu et al. [25] reported that, although N concentrations in surface drainage were higher in the water-saving irrigation mode than in the diffuse irrigation mode, nitrogen runoff losses were still lower in the water-saving irrigation mode with a reduced surface water depth and surface drainage. Katsura et al. [38] and Yang et al. [36] reported that the N concentration in deep percolation water was significantly higher in the water-saving irrigation mode than in the diffuse irrigation mode. However, the amount of deep percolation water was significantly reduced, which was the main reason for the reduction in N leaching losses. In this study, the surface drainage and deep percolation of WC-CI were small, effectively reducing the risk of nitrogen runoff loss and leaching loss. The surface drainage of DPS was the largest, which greatly increased the risk of nitrogen runoff loss. However, DPS had the lowest irrigation upper and lower limits with a significant reduction in TN leaching loss load. Yang et al. [39] found that straw application can increase soil organic matter and total nitrogen in 30 cm depth soil layer, and reduce the leaching of soil nitrogen, which may be related to the competition between straw and crop plants for nitrogen sources and slowing down the migration of inorganic nitrogen in soil solution.
The tillering stage is critical for N runoff loss. During this period, the frequency of heavy rainfall is high in southern China, and fertilizer application overlaps with the high-frequency period of rainfall, exacerbating N loss. It is vital to adjust fertilizer application timing appropriately according to weather forecasts, increase the upper storage limit of rainfall and delay surface drainage to reduce N loss with runoff [40,41]. TN leaching losses at the tillering and jointing and booting stage accounted for 49.89% to 52.32% and 26.03% to 39.36% of the total leaching, respectively. This is due to the high N concentration in these two growth stages and the limited ability of plants to absorb nitrogen [42]. Therefore, effective measures should be taken to reduce N leaching at the tillering and jointing and booting stages. Ren’s research results show that after long-term precipitation increases, nitrogen supply limits the promotion of water on plant productivity. Denitrification is likely to be an important means of nitrogen loss, thus exacerbating the limitation of nitrogen supply on plant growth. Long-term precipitation increases will lead to a shift from early co-limitation by water and nitrogen to perhaps limitation by nitrogen only later [43].
In addition, it was found that the ratio of NH4+-N loss load to TN loss load for surface drainage was higher than that of NH4+-N loss load to TN loss load for deep seepage, which was mainly related to the degree of sorption saturation of NH4+-N by soil colloids and the difference in soil water movement. In general, NH4+-N is less likely to leach than NO3−-N because of the strong sorption capacity of soil to NH4+-N and the short migration distance of NH4+-N [44]. However, when soil saturation of NH4+-N sorption is reached, a large amount of NH4+-N will rapidly move down [22,34].
4.5. Effects of Different Irrigation and Drainage Modes on Rice Yields
Due to the lowest irrigation lower limits and rainfall storage upper limits, the field surface for DPS was in the state of anhydrous layer for most of the time, and the growth period was severely affected by drought, which significantly affected the rice yield. Early water stress significantly delayed the growth and development of rice, and the photosynthetic production capacity at heading stage was greatly reduced, resulting in short panicles, few grains and small storage capacity. Although re-watering after drought had a certain compensatory effect, the compensation had an obvious lag effect. The photosynthetic rate of leaves at milk maturity stage was higher, and the 1000-grain weight was increased, but it could not compensate for the restriction of heading stage on storage capacity [45,46,47]. Through field water regulation, WC-CI not only has larger effective panicles, grain numbers per panicle and 1000-grain weight, but also has stronger storage capacity and grain-filling capacity, which makes the accumulation and distribution of photosynthetic products in a direction conducive to yield formation, and lays a good foundation for high yield [48].
Previous studies have shown that the availability of water and nitrogen are key constraints to primary productivity in arid and semiarid ecosystems [49,50], and it is of great significance to study how these factors, independently or in combination, affect crop growth and productivity [51]. N-use efficiency (NUE) and water-use efficiency (WUE) in small grain cereals increases with the degree of co-limitation. Meanwhile, reduction in the difference between maximum attainable yield and actual yield with increased degree of co-limitation was mainly due to a positive effect of this variable on WUE [49,52].Sadras found that productivity gains associated with intensification of cropping practices are interpreted in terms of a trade-off, whereby water-use efficiency is improved at the expense of nitrogen-use efficiency, thus leading to a higher degree of resource co-limitation [53]. At the same time, nitrogen-use efficiency is more affected by nitrogen recovery and uptake efficiency, which reflects the importance of soil water availability and crop utilization of soil water and nitrogen storage, and so a better utilization of subsoil moisture may be an avenue for a further increase in yield [54]. Based on this, it is necessary to set a combination of different nitrogen gradients and irrigation modes in future studies to better understand the rules of plant growth and nitrogen loss in paddy fields under the co-limitation of nitrogen and water.
5. Conclusions
- The tillering stage is a critical period for N runoff loss. During this period, fertilizer application overlaps with the high-frequency period of rainfall, intensifying the nitrogen loss. It is necessary to adjust the fertilizer application time appropriately according to the weather forecast and increase the upper storage limit of rainfall. WC-CI improved paddy fields’ water storage capacity, significantly reducing the surface drainage and N runoff loss load. DPS’s surface drainage and TN runoff loss load significantly increased. In the future, the rainfall storage depth of DPS can be increased appropriately to reduce N runoff losses;
- After applying N fertilizer, the N concentrations in deep percolation rapidly increased to the peak within 5~7 d and then gradually decreased. The deep percolation water during the tillering stage and jointing and booting stage accounted for 38.56~41.39% and 24.65~35.35%. At the same time, the higher concentrations of N caused an enormous loss of N leaching. Therefore, effective measures should be taken to reduce the N leaching load and groundwater pollution during the tillering stage, jointing and booting stage and after fertilizer application;
- The main form of nitrogen loss load in surface drainage and deep percolation water is NH4+-N. The loss load of NH4+-N in surface drainage water accounts for 69.75~85.28%, and the loss load of NH4+-N in deep percolation water accounts for 42.06~89.16%;
- DPS and WC-CI can significantly reduce the total TN loss load by 52.58% and 45.82%, which can reduce the total N loss load, and DPS has a better reduction effect;
- On balance, WC-CI can make full use of natural precipitation, reduce nitrogen emission to a greater extent and maintain high yields, which is suitable for promotion in humid areas with high rainfall. Because of the high surface drainage and nitrogen-runoff loss load, DPS is more suitable for promotion in areas with low rainfall.
Author Contributions
Conceptualization, S.H. and X.W.; methodology, S.H.; software, X.W. and W.Z.; validation, X.W. and T.D.; data curation, X.W., W.Z. and T.D.; writing—original draft preparation, X.W.; writing—review and editing, S.H. and X.W. All authors have read and agreed to the published version of the manuscript.
Funding
This research was funded by the Water Conservancy Science and Technology Project of Jiangsu Province (2016007).
Institutional Review Board Statement
Not applicable.
Informed Consent Statement
Not applicable.
Data Availability Statement
All data included in this study are available upon request by contact with the corresponding author.
Acknowledgments
We are grateful to the help of Zixin Wang, Chengxin Zheng and Yi Xie in the design and implementation of the experiment, as well as the reviewers and editors for their valuable comments about the manuscript.
Conflicts of Interest
The authors declare no conflict of interest.
References
- FAO (Food and Agriculture Organization of the United Nations). FAOSTAT-Food and Agriculture Data[EB/OL]. 2021. Available online: http://www.fao.org/faostat/zh/#data/QC (accessed on 17 February 2022).
- Ministry of Water Resources. China Water Resources Bulletin 2020, the Global Seabuckthorn Research and Development; China Water&Power Press: Beijing, China, 2021. (In Chinese) [Google Scholar]
- Li, M.; Zhao, R.X.; Wang, G.W.; Chai, X.R. Precipitation Regionalization in the Middle and Lower Reaches of the Yangtze River and Temporal Evolution of Meteorological Drought in Each Sub-region. Resour. Environ. Yangtze Basin 2020, 29, 2719–2726. (In Chinese) [Google Scholar]
- Li, L.; Tian, H.; Zhang, M.; Fan, P.S.; Umair, A.; Liu, H.D.; Chen, X.F.; Duan, M.Y.; Tang, X.R.; Wang, Z.M.; et al. Deep placement of nitrogen fertilizer increases rice yield and nitrogen use efficiency with fewer greenhouse gas emissions in a mechanical direct-seeded cropping system. Crop J. 2021, 9, 1386–1396. [Google Scholar] [CrossRef]
- Liu, J.; Ouyang, X.Q.; Shen, J.L.; Li, Y.; Sun, W.R.; Jiang, W.Q.; Wu, J.S. Nitrogen and phosphorus runoff losses were influenced by chemical fertilization but not by pesticide application in a double rice-cropping system in the subtropical hilly region of China. Sci. Total Environ. 2020; 715, prepublish. [Google Scholar] [CrossRef]
- Xiao, M.H.; Yu, S.E.; Zhang, Y.L. Changes of nitrogen concentration for surface and groundwater in flooding paddy field under controlled drainage. Trans. Chin. Soc. Agric. Eng. 2011, 27, 180–186. [Google Scholar]
- Li, H.; Dai, M.W.; Dai, S.L.; Dong, X.J. Current status and environment impact of direct straw return in China’s cropland—A review. Ecotoxicol. Environ. Saf. 2018, 159, 293–300. [Google Scholar] [CrossRef]
- Dai, W.; Wang, J.; Fang, K.; Cao, L.; Sha, Z.; Cao, L. Wheat Straw Incorporation Affecting Soil Carbon and Nitrogen Fractions in Chinese Paddy Soil. Agriculture 2021, 11, 803. [Google Scholar] [CrossRef]
- Sun, H.F.; Zhou, S.; Zhang, J.N.; Zhang, X.X.; Wang, C. Effects of controlled-release fertilizer on rice grain yield, nitrogen use efficiency, and greenhouse gas emissions in a paddy field with straw incorporation. Field Crops Res. 2020, 253, 107814. [Google Scholar] [CrossRef]
- Wang, H.H.; Shen, M.X.; Hui, D.F.; Chen, J.; Sun, G.F.; Wang, X.; Lu, C.Y.; Sheng, J.; Chen, L.J.; Luo, Y.Q.; et al. Straw incorporation influences soil organic carbon sequestration, greenhouse gas emission, and crop yields in a Chinese rice (Oryza sativa L.)–wheat (Triticum aestivum L.) cropping system. Soil Tillage Res. 2019, 195, 104377. [Google Scholar] [CrossRef]
- Liu, Y.; Li, J.; Jiao., X.Y.; Li, H.D.; Hu, T.S.; Jiang, H.Z.; Ali, M. Effects of Straw Returning Combine with Biochar on Water Quality under Flooded Condition. Water 2020, 12, 1633. [Google Scholar] [CrossRef]
- Han, R.Y.; Chen, Z.; Yang, S.Q. Effect of Straw-returning on Nitrogen and Phosphorus and Water of Soil. Chin. Agric. Sci. Bull. 2016, 32, 148–154. (In Chinese) [Google Scholar]
- Zhao, X.J.; Zhang, Z.T.; Zhang, Z.L.; Ma, Y.F.; Wu, Z.D. Soil evaporation for summer maize under no -tillage with straw mulching. J. Drain. Irrig. Mach. Eng. 2015, 33, 1085–1090. (In Chinese) [Google Scholar]
- Chen, P.; Xu, J.Z.; Zhang, Z.X.; Wang, K.C.; Li, T.C.; Wei, Q.; Li, Y.W. Carbon pathways in aggregates and density fractions in Mollisols under water and straw management: Evidence from 13C natural abundance. Soil Biol. Biochem. 2022, 169, 108684. [Google Scholar] [CrossRef]
- Jin, Y.T.; Liu, Y.F.; Hu, H.X.; Mu, J.; Gao, M.Y.; Li, X.F.; Xue, Z.J.; Gong, J.J. Effects of Continuous Straw Returning with Chemical Fertilizer on Annual Runoff Loss of Nitrogen and Phosphorus in Rice-Rape Rotation. Sci. Agric. Sin. 2021, 54, 1937–1951. (In Chinese) [Google Scholar]
- Yin, J.; Xu, Z.X.; Yan, D.H.; Yuan, Z.; Yuan, Y.; Yang, Z.Y. Simulation and projection of extreme climate events in China under RCP4.5 scenario. Arab. J. Geosci. 2016, 9, 89. [Google Scholar] [CrossRef]
- Wu, Q.J.; Shao, X.H.; Qiu, L.Y.; Guan, W.L.; Wang, J.L.; Ren, L. Investigations of water saving, yield increasing and soil fertility improving with three irrigation-drainage modes of rice. J. Chin. Agric. Mech. 2015, 36, 319–322. (In Chinese) [Google Scholar]
- Yang, S.H.; Sun, X.; Ding, J.; Jiang, Z.W.; Xu, J.Z. Effects of biochar addition on the NEE and soil organic carbon content of paddy fields under water-saving irrigation. Environ. Sci. Pollut. Res. Int. 2019, 26, 8303–8311. [Google Scholar] [CrossRef]
- Zhuang, Y.H.; Zhang, L.; Li, S.S.; Liu, H.B.; Zhai, L.M.; Zhou, F.; Ye, Y.S.; Ruan, S.H.; Wen, W.J. Effects and potential of water-saving irrigation for rice production in China. Agric. Water Manag. 2019, 217, 374–382. [Google Scholar] [CrossRef]
- Masuda, A.; Heleen, D.; Ahammad, M.K.; Mohammed, A.K.; Elizabeth, V.; Charlotte, D.; Pascal, B.; Steven, S. Impact of irrigation management on paddy soil N supply and depth distribution of abiotic drivers. Agric. Ecosyst. Environ. 2018, 261, 12–24. [Google Scholar]
- Guo, X.; Deng, F.; Chen, Z. Test Study on Water Saving and Environmental Effects of Rain-Catching and Controlled Irrigation of Rice. In Proceedings of the 2011 International Symposium on Water Resource and Environmental Protection (ISWREP 2011), Xi’an, China, 20 May 2011. [Google Scholar]
- Peng, S.Z.; He, Y.P.; Yang, S.H.; Xu, J.Z. Effect of controlled irrigation and drainage on nitrogen leaching losses from paddy fields. Paddy Water Environ. 2015, 13, 303–312. [Google Scholar] [CrossRef]
- Guo, X.P.; Yuan, J.; Guo, F.; Chen, Z.P. Preliminary study on water-catching and controlled irrigation technology of rice. Trans. Chin. Soc. Agric. Eng. 2009, 25, 70–73. (In Chinese) [Google Scholar]
- Xiao, M.H.; Yu, S.E.; Wang, Y.Y.; Huang, R. Nitrogen and phosphorus changes and optimal drainage time of flooded paddy field based on environmental factors. Water Sci. Eng. 2013, 6, 164–177. [Google Scholar]
- Yu, Y.M.; Xu, J.Z.; Zhang, P.C.; Meng, Y.; Xiong, Y.J. Controlled Irrigation and Drainage Reduce Rainfall Runoff and Nitrogen Loss in Paddy Fields. Int. J. Environ. Res. Public Health 2021, 18, 3348. [Google Scholar] [CrossRef]
- Yuan, Z.; Liao, Y.; Zheng, M.; Zhuo, M.; Huang, B.; Nie, X.; Wu, X.; Li, D. Relationships of nitrogen losses, phosphorus losses, and sediment under simulated rainfall conditions. J. Soil Water Conserv. 2020, 75, 231–241. [Google Scholar] [CrossRef]
- Wang, X.L.; Li, J.S.; Li, S.M.; Zheng, X.T. A study on removing nitrogen from paddy field rainfall runoff by an ecological ditch-zeolite barrier system. Environ. Sci. Pollut. Res. Int. 2017, 24, 27090–27103. [Google Scholar] [CrossRef]
- Ye, Y.S.; Liang, X.Q.; Chen, Y.X.; Liu, X.; Gu, J.T.; Guo, R.; Li, L. Alternate wetting and drying irrigation and controlled-release nitrogen fertilizer in late-season rice. Effects on dry matter accumulation, yield, water and nitrogen use. Field Crops Res. 2013, 144, 212–224. [Google Scholar] [CrossRef]
- Guo, X.P.; Zhang, Z.Y.; Yin, G.X. Effect of Controlled Drainage on Loss of Nitrogen and Phosphorous from Paddy Field. J. Shanghai Jiaotong Univ. (Agric. Sci.) 2006, 307–310. (In Chinese) [Google Scholar]
- Wang, J.; Wang, D.J.; Zhang, G.; Wang, Y.; Wang, C.; Teng, Y.; Christie, P. Nitrogen and phosphorus leaching losses from intensively managed paddy fields with straw retention. Agric. Water Manag. 2014, 141, 66–73. [Google Scholar] [CrossRef]
- Wang, Y.; Peng, S.Z.; Jiao, J.; Kong, W.L. Research on Nitrogen Dynamics in Paddy Field under Different Levels of Water and Fertilizer during Whole Growing Period. Water Sav. Irrig. 2009, 12–16. (In Chinese) [Google Scholar]
- Cao, Y.S.; Tian, Y.H.; Yin, B.; Zhu, Z.L. Improving agronomic practices to reduce nitrate leaching from the rice–wheat rotation system. Agric. Ecosyst. Environ. 2014, 195, 61–67. [Google Scholar] [CrossRef]
- Xu, Z.; Yang, Z.; Ju, M.; Wang, S.Q.; Shi, W.M.; Xing, G.X. Nitrogen runoff dominates water nitrogen pollution from rice-wheat rotation in the Taihu Lake region of China. Agric. Ecosyst. Environ. 2012, 156, 1–11. [Google Scholar]
- Tan, X.Z.; Shao, D.G.; Liu, H.H.; Yang, F.S.; Xiao, C.; Yang, H.D. Effects of alternate wetting and drying irrigation on percolation and nitrogen leaching in paddy fields. Paddy Water Environ. 2013, 11, 381–396. [Google Scholar] [CrossRef]
- Qi, D.; Wu, Q.; Zhu, J. Nitrogen and phosphorus losses from paddy fields and the yield of rice with different water and nitrogen management practices. Sci. Rep. 2020, 10, 9734. [Google Scholar] [CrossRef]
- Yang, S.H.; Peng, S.Z.; Xu, J.Z.; He, Y.P.; Wang, Y.J. Effects of water saving irrigation and controlled release nitrogen fertilizer managements on nitrogen losses from paddy fields. Paddy Water Environ. 2015, 13, 71–80. [Google Scholar] [CrossRef]
- Liang, X.Q.; Chen, Y.X.; Nie, Z.Y.; Ye, Y.S.; Liu, J.; Tian, G.M.; Wang, G.H.; Tuong, T.P. Mitigation of nutrient losses via surface runoff from rice cropping systems with alternate wetting and drying irrigation and site-specific nutrient management practices. Environ. Sci. Pollut. Res. Int. 2013, 20, 6980–6991. [Google Scholar] [CrossRef]
- Keisuke, K.; Midori, O.; Hiroaki, M.; Yoichiro, K. Radiation use efficiency, N accumulation and biomass production of high-yielding rice in aerobic culture. Field Crops Res. 2010, 117, 81–89. [Google Scholar]
- Yang, S.Q.; Han, R.Y.; Wang, Y.S.; Liu, R.L.; Xie, X.J.; Yang, Z.L. Effect of straw application to soil nitrate leaching of paddy-upland rotation in the Yellow River irrigation area. Acta Ecol. Sin. 2017, 37, 2926–2934. [Google Scholar]
- Cao, J.J.; Tan, J.W.; Cui, Y.L.; Luo, Y.F. Irrigation scheduling of paddy rice using short-term weather forecast data. Agric. Water Manag. 2019, 213, 714–723. [Google Scholar] [CrossRef]
- Garcia-Retamero, R.; Hoffrage, U. How causal knowledge simplifies decision-making. Minds Mach. 2006, 16, 365–380. [Google Scholar] [CrossRef]
- Lu, H.F.; Qi, X.B.; Guo, X.P.; Towa, J.J.; Zhen, B.; Qiao, D.M.; Wang, Z.C.; Yang, B.; Han, Y. Canopy Light Utilization and Yield of Rice under Rain-Catching and Controlled Irrigation. Water 2018, 10, 1340. [Google Scholar] [CrossRef]
- Ren, H.Y.; Xu, Z.W.; Isbell, F.; Huang, J.H.; Han, X.G.; Wan, S.Q.; Chen, S.P.; Wang, R.Z.; Zeng, D.H.; Jiang, Y.; et al. Exacerbated nitrogen limitation ends transient stimulation of grassland productivity by increased precipitation. Ecol. Monogr. 2017, 87, 457–469. [Google Scholar] [CrossRef]
- Shao, G.C.; Wang, M.H.; Yu, S.E.; Liu, N.; Xiao, M.H.; Yuan, M. Potential of Controlled Irrigation and Drainage for Reducing Nitrogen Emission from Rice Paddies in Southern China. J. Chem. 2015, 2015, 913470. [Google Scholar] [CrossRef]
- Mannan, M.; Bhuiya, M.; Akhand, M.; Saman, M. Growth and Yield of Basmati and Traditional Aromatic Rice As Influenced By Water Stress and Nitrogen Level. J. Sci. Found. 2012, 10, 52–62. [Google Scholar] [CrossRef]
- Mamun, M.; Islam, M.R.; Shahidullah, S.M. Effect of nitrogen source and water management on rice yield and nitrogen use efficiency. Agric. Adv. 2013, 2, 292–298. [Google Scholar]
- Hou, D.P.; Tan, J.S.; Bi, Q.Y.; Zhang, A.N.; Liu, Y.; Wang, F.M.; Liu, G.L.; Yu, X.Q.; Bi, J.G.; Luo, L.F. Effects of Water Stress on Yield Formation and Root Morphological and Physiological Characteristics of Water-saving and Drought-resistant Rice. Chin. J. Rice Sci. 2021, 35, 27–37. [Google Scholar]
- Guo, Y.M.; Guo, X.P.; Fan, J.J.; Zhang, X.L. Grain Yield and Water Production Efficiency of “Rain-water Storage and Controllable Irrigation(RSCI) Mode” of Rice. J. Irrig. Drain. 2010, 29, 61–63, 73. [Google Scholar]
- Cossani, C.M.; Slafer, G.A.; Savin, R. Co-limitation of nitrogen and water, and yield and resource-use efficiencies of wheat and barley. Crop Pasture Sci. 2010, 61, 844–851. [Google Scholar] [CrossRef]
- Sadras, V.O. Yield and water-use efficiency of water-and nitrogen-stressed wheat crops increase with degree of co-limitation. Eur. J. Agron. 2004, 21, 455–464. [Google Scholar] [CrossRef]
- Bracken, M.E.S.; Hillebrand, H.; Borer, E.T.; Seabloom, E.W.; Cebrian, J.; Cleland, E.E.; Elser, J.J.; Gruner, D.S.; Harpole, W.S.; Ngai, J.T.; et al. Signatures of nutrient limitation and co-limitation: Responses of autotroph internal nutrient concentrations to nitrogen and phosphorus additions. Oikos 2015, 124, 113–121. [Google Scholar] [CrossRef]
- Sadras, V.O. A quantitative top-down view of interactions between stresses: Theory and analysis of nitrogen–water co-limitation in Mediterranean agro-ecosystems. Crop Pasture Sci. 2005, 56, 1151–1157. [Google Scholar] [CrossRef]
- Riar, A.; Gill, G.; McDonald, G. Effect of post-sowing nitrogen management on co-limitation of nitrogen and water in canola and mustard. Field Crops Res. 2016, 198, 23–31. [Google Scholar] [CrossRef]
- Riar, A.; Gill, G.; McDonald, G.K. Rate of nitrogen rather than timing of application influence yield and NUE of canola in South Australian mediterranean environments. Agronomy 2020, 10, 1505. [Google Scholar] [CrossRef]
Figure 1.
The experimental cell arrangement and test barrel structure.

Figure 2.
The relative humidity, temperature and precipitation during the rice growing season.

Figure 3.
Variation of NH4+-N, NO3−-N and TN concentrations of surface drainage under different irrigation and drainage modes. (Note: The lowercase letters on the tops of columns in the figure represent significant difference among treatments at p < 0.05).
Figure 3.
Variation of NH4+-N, NO3−-N and TN concentrations of surface drainage under different irrigation and drainage modes. (Note: The lowercase letters on the tops of columns in the figure represent significant difference among treatments at p < 0.05).

Figure 4.
Variation of NH4+-N, NO3−-N and TN concentrations in deep percolation water under different irrigation and drainage modes. The two green lines in the Figure 4 represent the time of tillering fertilizer and panicle fertilizer.
Figure 4.
Variation of NH4+-N, NO3−-N and TN concentrations in deep percolation water under different irrigation and drainage modes. The two green lines in the Figure 4 represent the time of tillering fertilizer and panicle fertilizer.


Table 1.
Fertilizer Application.
| Fertilizer Application | Type | Amount (kg/ha) | Date |
|---|---|---|---|
| Base fertilizer | CO(NH2)2 | 212.17 | 6.25 |
| P2O5 | 100.80 | ||
| K2O | 117.00 | ||
| Tillering fertilizer | CO(NH2)2 | 106.09 | 7.6 |
| Panicle fertilizer | CO(NH2)2 | 212.17 | 8.17 |
| K2O | 78.00 |
Table 2.
The water management table of different irrigation and drainage patterns.
| Items | Re-Greening | Pre-Tillering | Late-Tillering | Jointing and Booting | Heading and Flowering | Milk Maturity | Yellow Maturity | |
|---|---|---|---|---|---|---|---|---|
| Growth Stage Division | 6–29~7–6 | 7–7~8–3 | 8–4~8–10 | 8–11~8–28 | 8–29~9–23 | 9–24~10–16 | 10–17~10–26 | |
| FSI | Irrigation lower limited | 30 mm | 30 mm | 0 | 40 mm | 40 mm | 40 mm | 0 |
| Irrigation upper limited | 10 mm | 10 mm | 60%θS | 10 mm | 10 mm | 10 mm | Naturally drying | |
| Rainfall storage upper limited | 40 mm | 100 mm | 0 | 150 mm | 150 mm | 150 mm | 0 | |
| DPS | Irrigation lower limited | 0 | 0 | 0 | 0 | 0 | 0 | 80%θS |
| Irrigation upper limited | 80%θS | 60%θS | 50%θS | 60%θS | 60%θS | 50%θS | Naturally drying | |
| Rainfall storage upper limited | 40 mm | 60 mm | 0 | 80 mm | 80 mm | 80 mm | 0 | |
| WC–CI | Irrigation lower limited | 30 mm | 0 | 0 | 0 | 0 | 0 | 80%θS |
| Irrigation upper limited | 10 mm | 70%θS | 60%θS | 70%θS | 80%θS | 70%θS | Naturally drying | |
| Rainfall storage upper limited | 80 mm | 150 mm | 0 | 200 mm | 200 mm | 200 mm | 0 | |
Note: The number unit in the table is mm. “mm” indicates the depth of water on the surface of the paddy field; “%θS” represents the percentage of soil moisture content in 0~30 cm soil layer in saturated moisture content.
Table 3.
The surface runoff under different irrigation and drainage modes (mm).
| Date | Growth Stage | FSI | DPS | WC-CI |
|---|---|---|---|---|
| 7–15 | Pre-tillering | 3.31 ± 0.24 b | 8.24 ± 0.56 a | 0.00 |
| 7–17 | Pre-tillering | 10.48 ± 0.33 b | 21.30 ± 0.42 b | 0.00 |
| 7–19 | Pre-tillering | 15.40 ± 2.04 b | 22.79 ± 1.67 a | 10.09 ± 1.28 c |
| 7–20 | Pre-tillering | 2.39 ± 0.18 c | 10.38 ± 1.29 a | 2.79 ± 0.33 b |
| Surface drainage outflow | 31.58 ± 0.76 b | 62.74 ± 1.03 a | 12.88 ± 0.67 c | |
Note: The lowercase letters after the data of the same column in the table represent significant difference among treatments at p < 0.05.
Table 4.
The deep percolation under different irrigation and drainage modes (mm).
| Treatments | Tillering | Jointing and Booting | Heading and Flowering | Milk Maturity | Yellow Maturity | Whole Growth Period |
|---|---|---|---|---|---|---|
| FSI | 122.12 ± 5.79 a | 72.72 ± 4.05 a | 62.82 ± 4.28 a | 31.54 ± 2.19 a | 5.86 ± 0.29 a | 295.06 ± 4.07 a |
| DPS | 35.78 ± 2.78 c | 32.76 ± 3.05 c | 12.37 ± 1.66 c | 6.19 ± 0.78 c | 5.58 ± 1.27 b | 92.68 ± 1.89 c |
| WC-CI | 70.55 ± 4.97 b | 47.14 ± 4.01 b | 37.58 ± 2.99 b | 24.89 ± 1.62 b | 5.77 ± 0.98 a | 182.98 ± 3.04 b |
Note: The lowercase letters after the data of the same column in the table represent significant difference among treatments at p < 0.05.
Table 5.
The rice yields of different irrigation and drainage modes.
| Treatments | Seed-Setting Rate (%) | Thousand-Grain Weight (g) | Theoretical Single Hole Yield (g) | Measured Single Hole Yield (g) |
|---|---|---|---|---|
| FSI | 93.22 ± 0.90 a | 25.97 ± 0.34 a | 47.41 ± 2.07 b | 41.38 ± 0.70 b |
| DPS | 92.93 ± 0.77 a | 25.85 ± 0.28 a | 45.68 ± 1.92 b | 41.25 ± 1.76 b |
| WC-CI | 94.03 ± 0.93 a | 26.05 ± 0.17 a | 53.31 ± 1.84 a | 44.52 ± 1.70 a |
Note: The lowercase letters after the data of the same column in the table represent significant difference among treatments at p < 0.05.
Table 6.
The amount of nitrogen losses under different irrigation and drainage modes (kg/ha).
| N Forms | N Loss Way | FSI | DPS | WC-CI |
|---|---|---|---|---|
| NH4+-N | Runoff loss | 0.38 ± 0.07 b | 0.91 ± 0.11 a | 0.12 ± 0.03 c |
| Leaching loss | 2.49 ± 0.15 a | 0.61 ± 0.06 c | 1.52 ± 0.09 b | |
| Total loss | 2.87 ± 0.13 a | 1.52 ± 0.05 c | 1.64 ± 0.11 b | |
| NO3−-N | Runoff loss | 0.04 ± 0.01 b | 0.11 ± 0.02 a | 0.01 ± 0.01 c |
| Leaching loss | 0.74 ± 0.08 a | 0.39 ± 0.03 b | 0.22 ± 0.05 c | |
| Total loss | 0.78 ± 0.04 a | 0.50 ± 0.07 b | 0.23 ± 0.02 c | |
| TN | Runoff loss | 0.51 ± 0.06 b | 1.15 ± 0.13 a | 0.17 ± 0.04 c |
| Leaching loss | 4.11 ± 0.24 a | 1.04 ± 0.09 c | 2.33 ± 0.11 b | |
| Total loss | 4.62 ± 0.18 a | 2.19 ± 0.17 c | 2.50 ± 0.09 b |
Note: The lowercase letters after the data of the same column in the table represent significant difference among treatments at p < 0.05.
Publisher’s Note: MDPI stays neutral with regard to jurisdictional claims in published maps and institutional affiliations. |
© 2022 by the authors. Licensee MDPI, Basel, Switzerland. This article is an open access article distributed under the terms and conditions of the Creative Commons Attribution (CC BY) license (https://creativecommons.org/licenses/by/4.0/).
Share and Cite
MDPI and ACS Style
Hao, S.; Wang, X.; Ding, T.; Zhu, W. Study on Nitrogen Loss Rules of Paddy Fields under Different Irrigation and Drainage Modes in Southern China. Water 2022, 14, 3071. https://doi.org/10.3390/w14193071
AMA Style
Hao S, Wang X, Ding T, Zhu W. Study on Nitrogen Loss Rules of Paddy Fields under Different Irrigation and Drainage Modes in Southern China. Water. 2022; 14(19):3071. https://doi.org/10.3390/w14193071
Chicago/Turabian StyleHao, Shurong, Xuan Wang, Ting Ding, and Wenyu Zhu. 2022. "Study on Nitrogen Loss Rules of Paddy Fields under Different Irrigation and Drainage Modes in Southern China" Water 14, no. 19: 3071. https://doi.org/10.3390/w14193071
Note that from the first issue of 2016, this journal uses article numbers instead of page numbers. See further details here.