1. Introduction
Variations of groundwater and surface water level influenced by natural fluctuations in atmospheric pressure (P) have been mentioned numerous times in the literature [
1,
2,
3,
4,
5,
6,
7], and others. For example, Shtengelov et al. [
6] considered baric effects (i.e., the cases of influence of atmospheric P fluctuations) in large artesian basins. Fomin [
8] studied the influence of tides and wind surges on variations of groundwater and surface water level (WL) in a coastal zone and referred to those effects as the
pumping effect. Several Russian publications [
9,
10,
11] have considered various aspects of the influence of atmospheric P drops on the runoff of small rivers and the flow rate of springs, as well as on groundwater level.
Hylckama [
1] revealed a close correlation between diurnal variations of phreatic WL and atmospheric P based on observation data obtained in Arizona, USA. Turk [
2] examined the diurnal dynamics of phreatic water levels in Bonneville County, Utah, USA, and identified atmospheric P variations as their most likely driver. Salama et al. [
3] reported differently directed diurnal variations of groundwater levels and atmospheric P in a study area in Australia. Lautz [
12], having analyzed the diurnal variations of phreatic water levels in the floodplain area of Red Canyon Creek, Wyoming, USA, mentioned the dynamics of air P and temperature (T), together with transpiration, among the possible causes of diurnal rhythms. Moraetis et al. [
5] identified a correlation between atmospheric P and groundwater levels in a karst massif on the island of Crete. In hydrogeology, Jacob introduced a term “barometric efficiency of an aquifer” in 1940 [
13]. It is the ratio of WL change to the atmospheric pressure change expressed in consistent terms of water height [
14].
In early publications, the main reason for the baric effect was assumed to be the relative isolation of the subsurface aeration zone from the free atmosphere, and more so, the lower air permeability [
15]. Both theoretical estimates of the propagation of pore P diffusion waves in saturated porous media [
16,
17,
18] and the capillary rise between elastic walls [
19,
20] are presented in the literature. Chatterjee et al. [
21] performed laboratory investigations of the capillary uptake in macroporous compressible sponges.
The conceptual basis of the present-day models of the hydrological regime of soils and river basins does not include a hypothesis regarding the effect of atmospheric P on water behavior, and the baric effects in hydrological processes are assumed negligible. However, their significant manifestations are possible considering the mechanical and hydrophysical properties of shallow peat-bog soils such as plasticity and elasticity, varying porosity and capillary properties, high moisture-retention capacity, the ability to swell and shrink, and the structuring ability of undecayed plant residuals [
22,
23,
24]. Such soils can be regarded as elastic bodies riddled with an extensive network of interconnected tube channels, wherein liquid moves under the influence of the superposition of gradients of P forces that can produce various baric effects, including the pumping effect.
In this article, we present some results of comprehensive short-term field studies into the river flow generation processes in tundra landscapes in the Anadyr Lowlands, Chukotka (Northeast Russia) in the summer of 2019. The field observations of the diurnal variations in surface water behavior revealed a distinct response of phreatic water levels to a 1.2 kPa drop in atmospheric P. Following this unexpected observation, the authors ran additional laboratory and field experiments to define the conditions of atmospheric P impact on the water storage of tundra peat soils and the suprapermafrost water flow.
We focus on how hydrophysical properties of peat and peaty soils and hydrological conditions in the seasonally thawed active layer underlain by frozen aquiclude influence this impact. To clarify the detected baric effect, a very simplistic conceptual model is proposed. It is based on an analysis of the dynamics of liquid equilibrium in an elastic capillary and reproduces the diverse responses of a hydrological system to baric impacts. It should be noted that the data obtained are quite limited, and the proposed model is far from being completed. Further studies of the given baric effect could be important for better understanding the hydrological regime of peat soils and swampy catchments in permafrost environments.
2. Objectives of the Study
The Anadyr Lowlands lie in the eastern part of the Chukot Peninsula and border the coast of Anadyr Liman (
Figure 1). They comprise the lower reaches of the rivers of Anadyr, Velikaya, and Kanchalan. The climate in the area is subarctic marine. From 1981–2010, the mean annual air T was −5 °C. For the same period, the mean annual precipitation total (mostly winter) was 380 mm/year. The average air T over the four warm months of 2019 was 10.1 °C. The rainfall total in that period was 95.6 mm, which corresponds to the mean value according to the observation data at the Anadyr weather station [
25].
The lowland area lies within the southern low-bush tundra subzone. Subshrub moss–cotton grass hummocky areas and hummocky tundra bogs, with subshrub sphagnous–sedge vegetation, are common there and underlain by permafrost with a thickness of 100–300 m and temperatures of −2 to −4.5 °C [
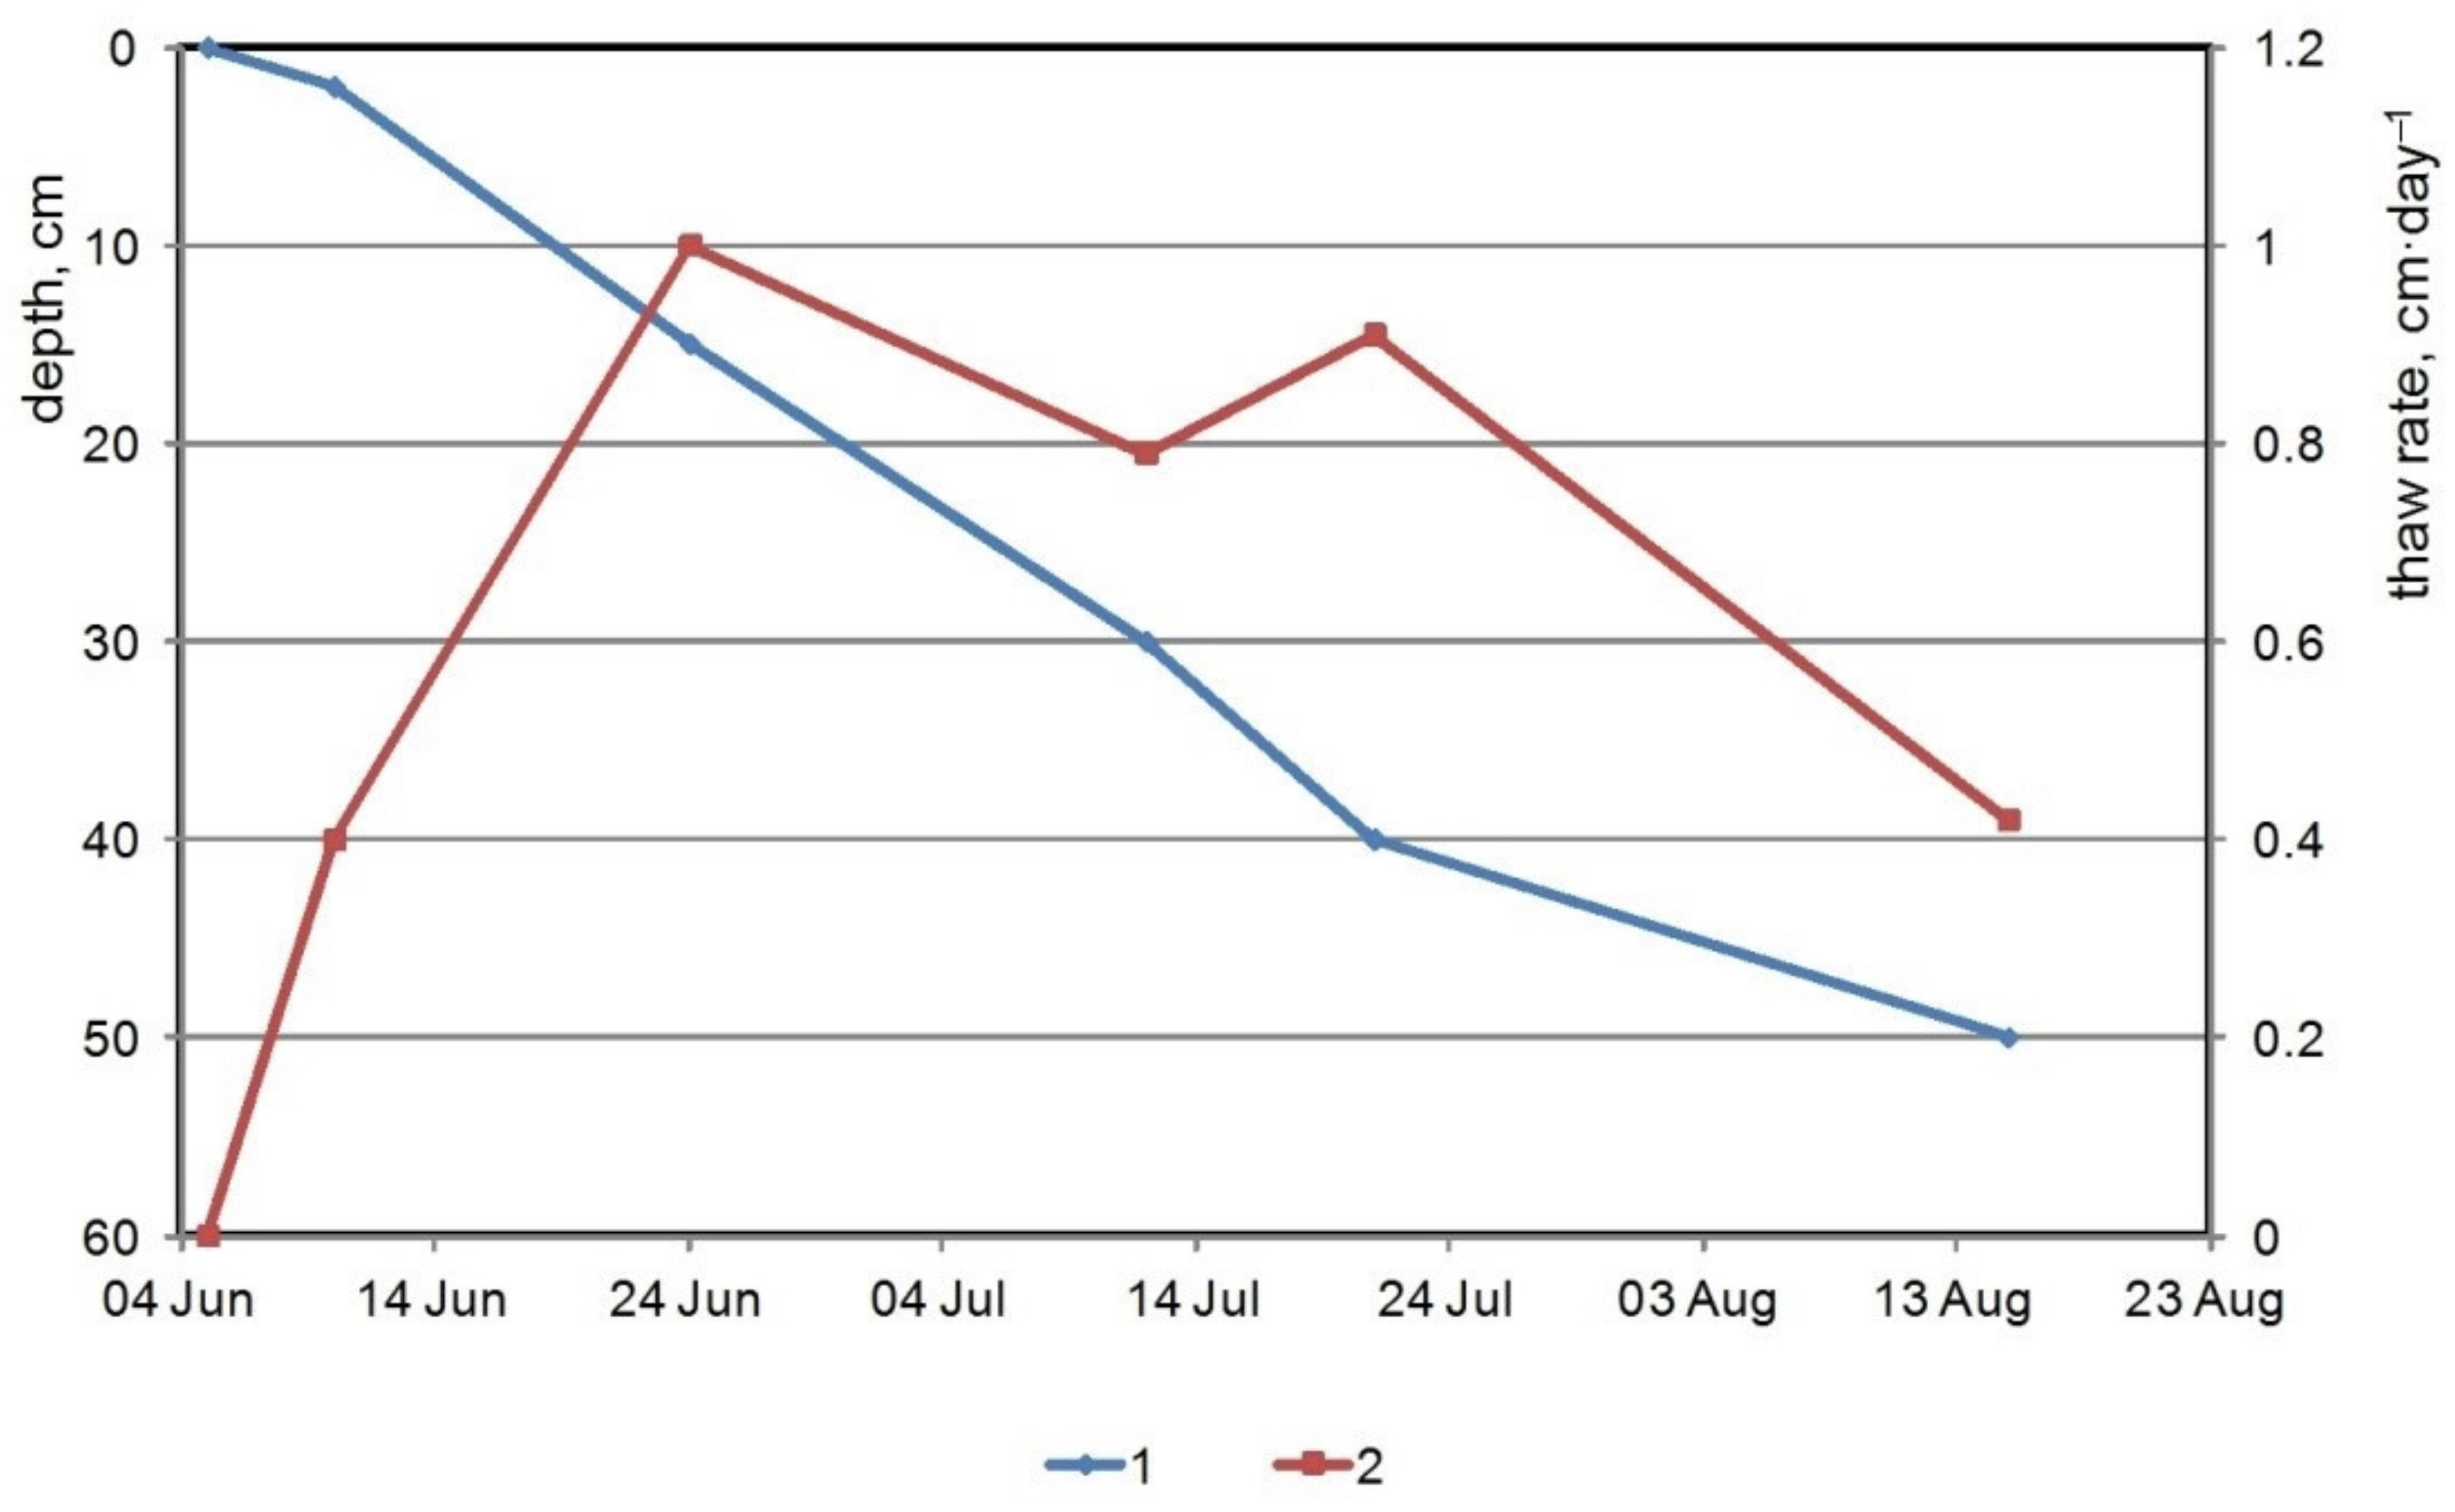
26,
27]. Typically, the plain and lowland landscapes thaw seasonally down to depths of 45–55 cm owing to the over-moistening of soils and the loamy and sandy-loamy icy deposits.
Figure 2 shows the dynamics of seasonal thawing of typical tundra soils in 2019.
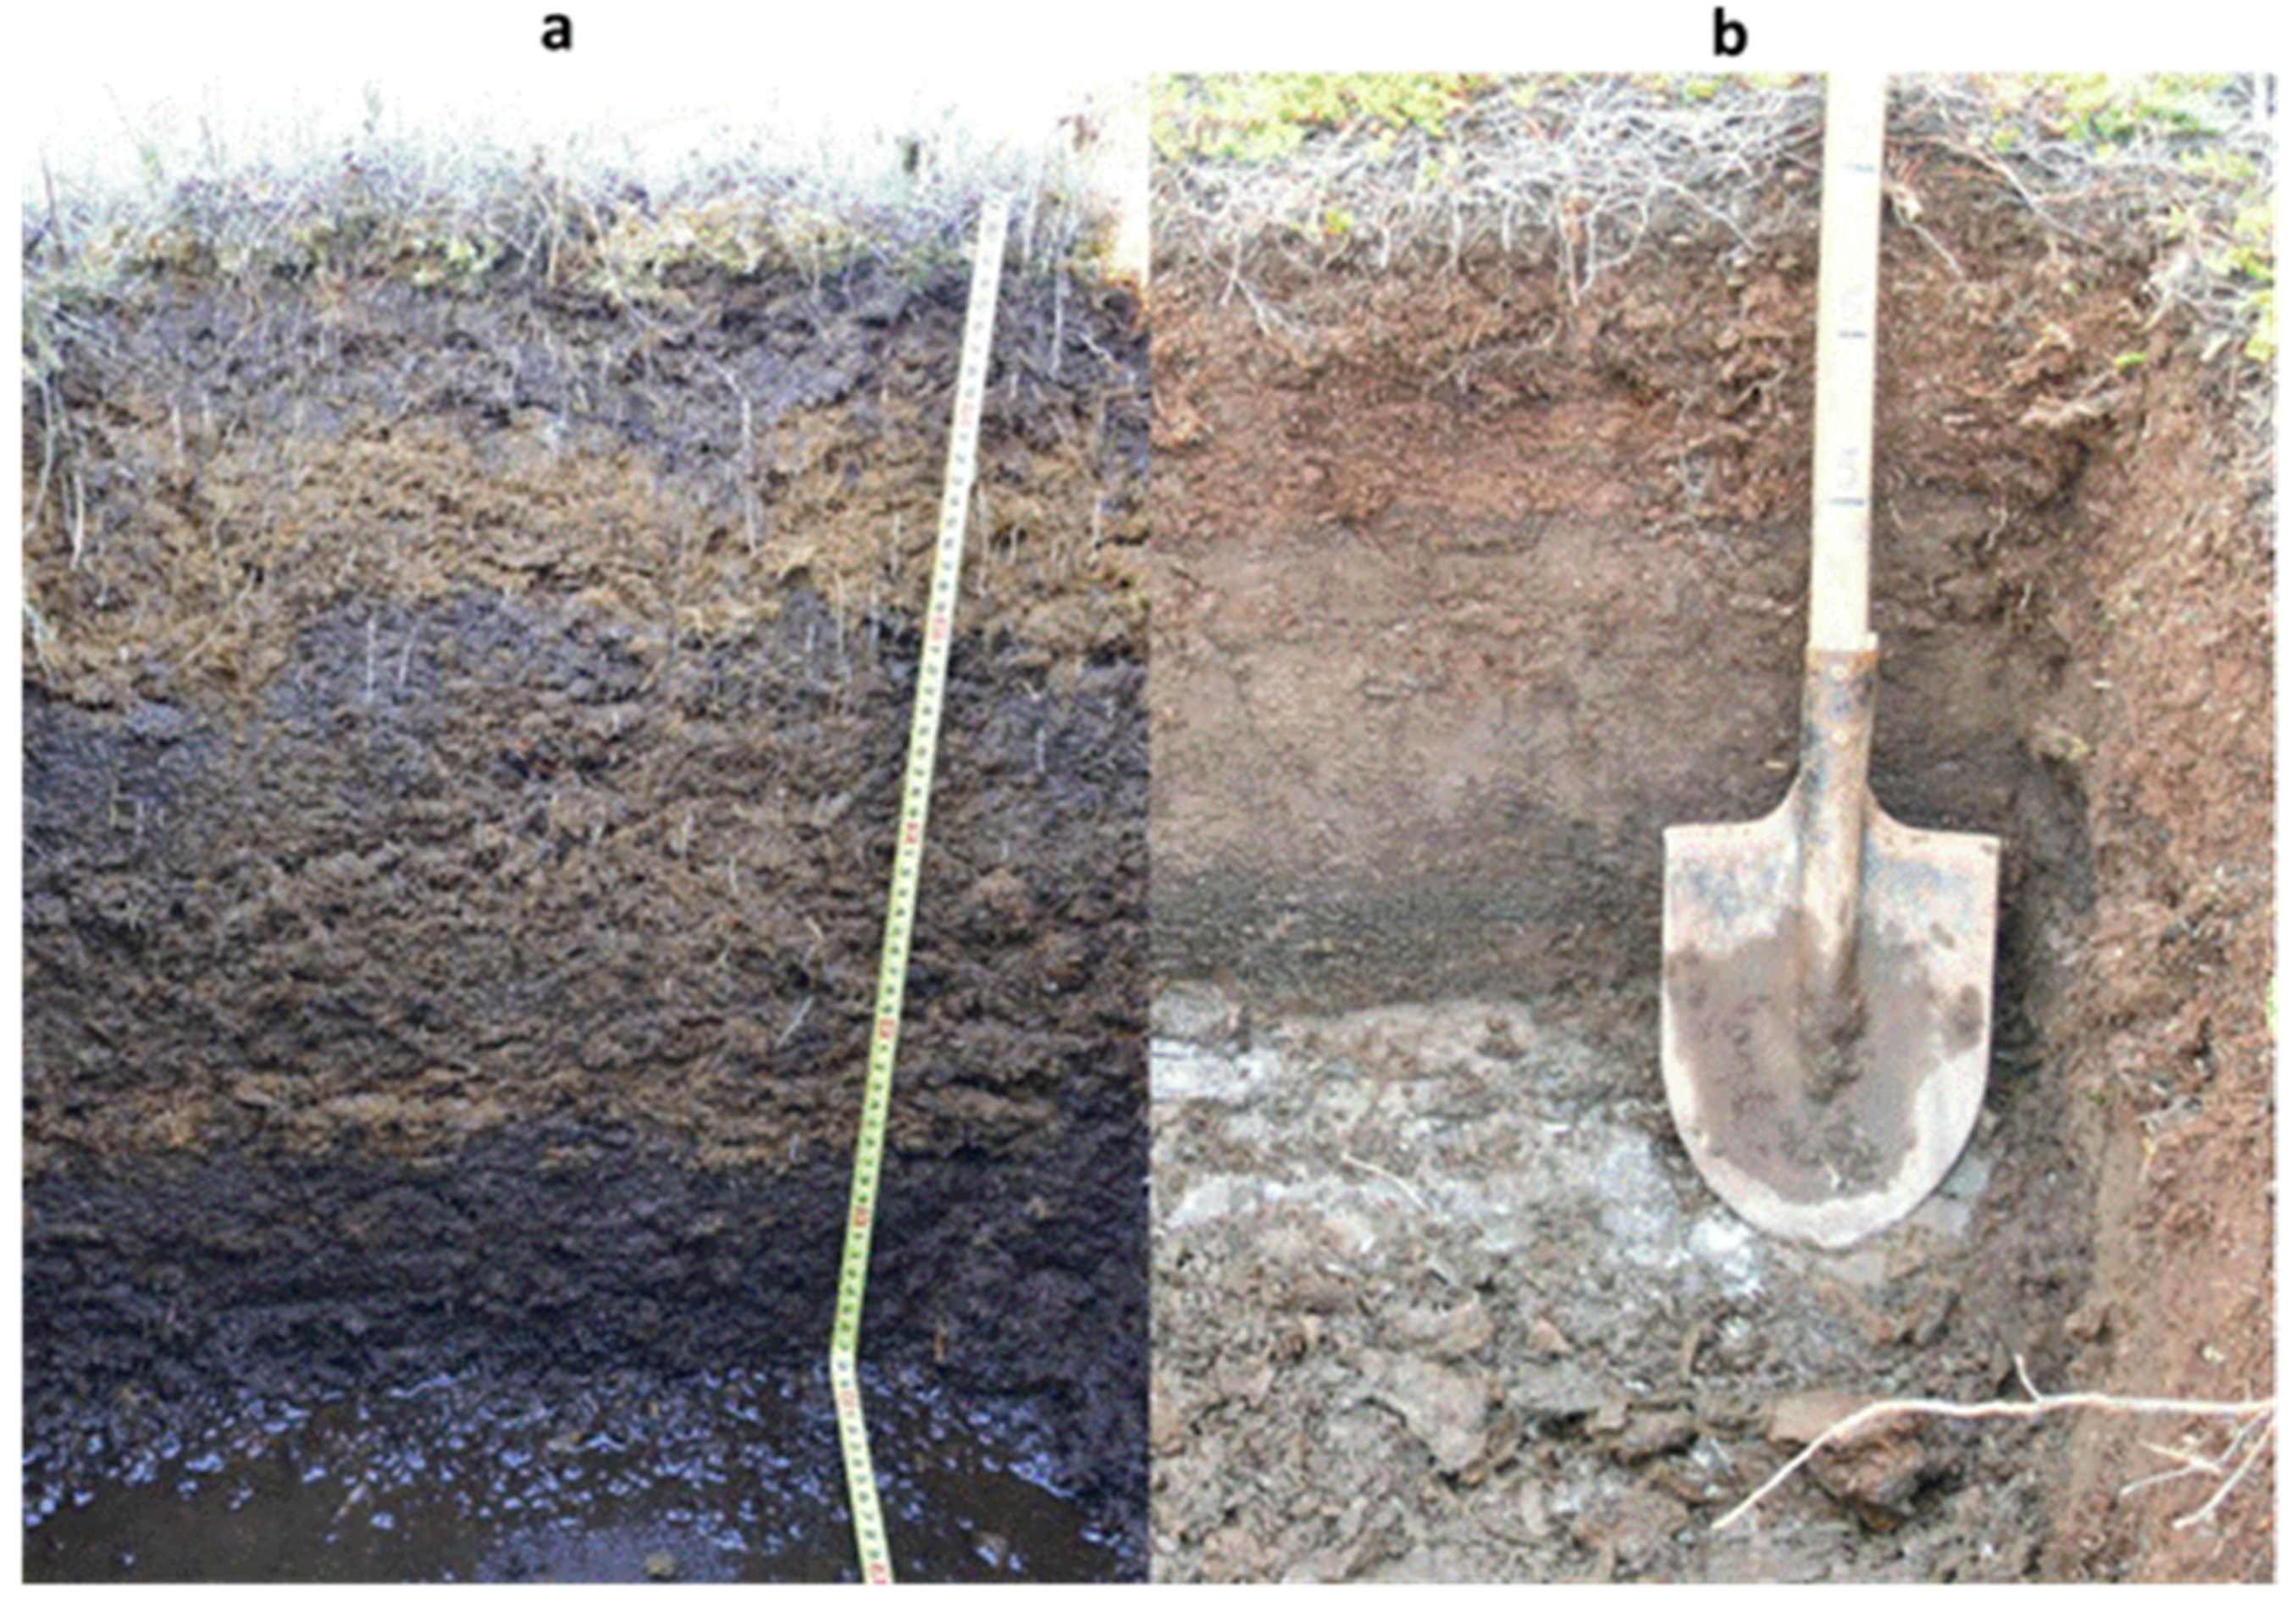
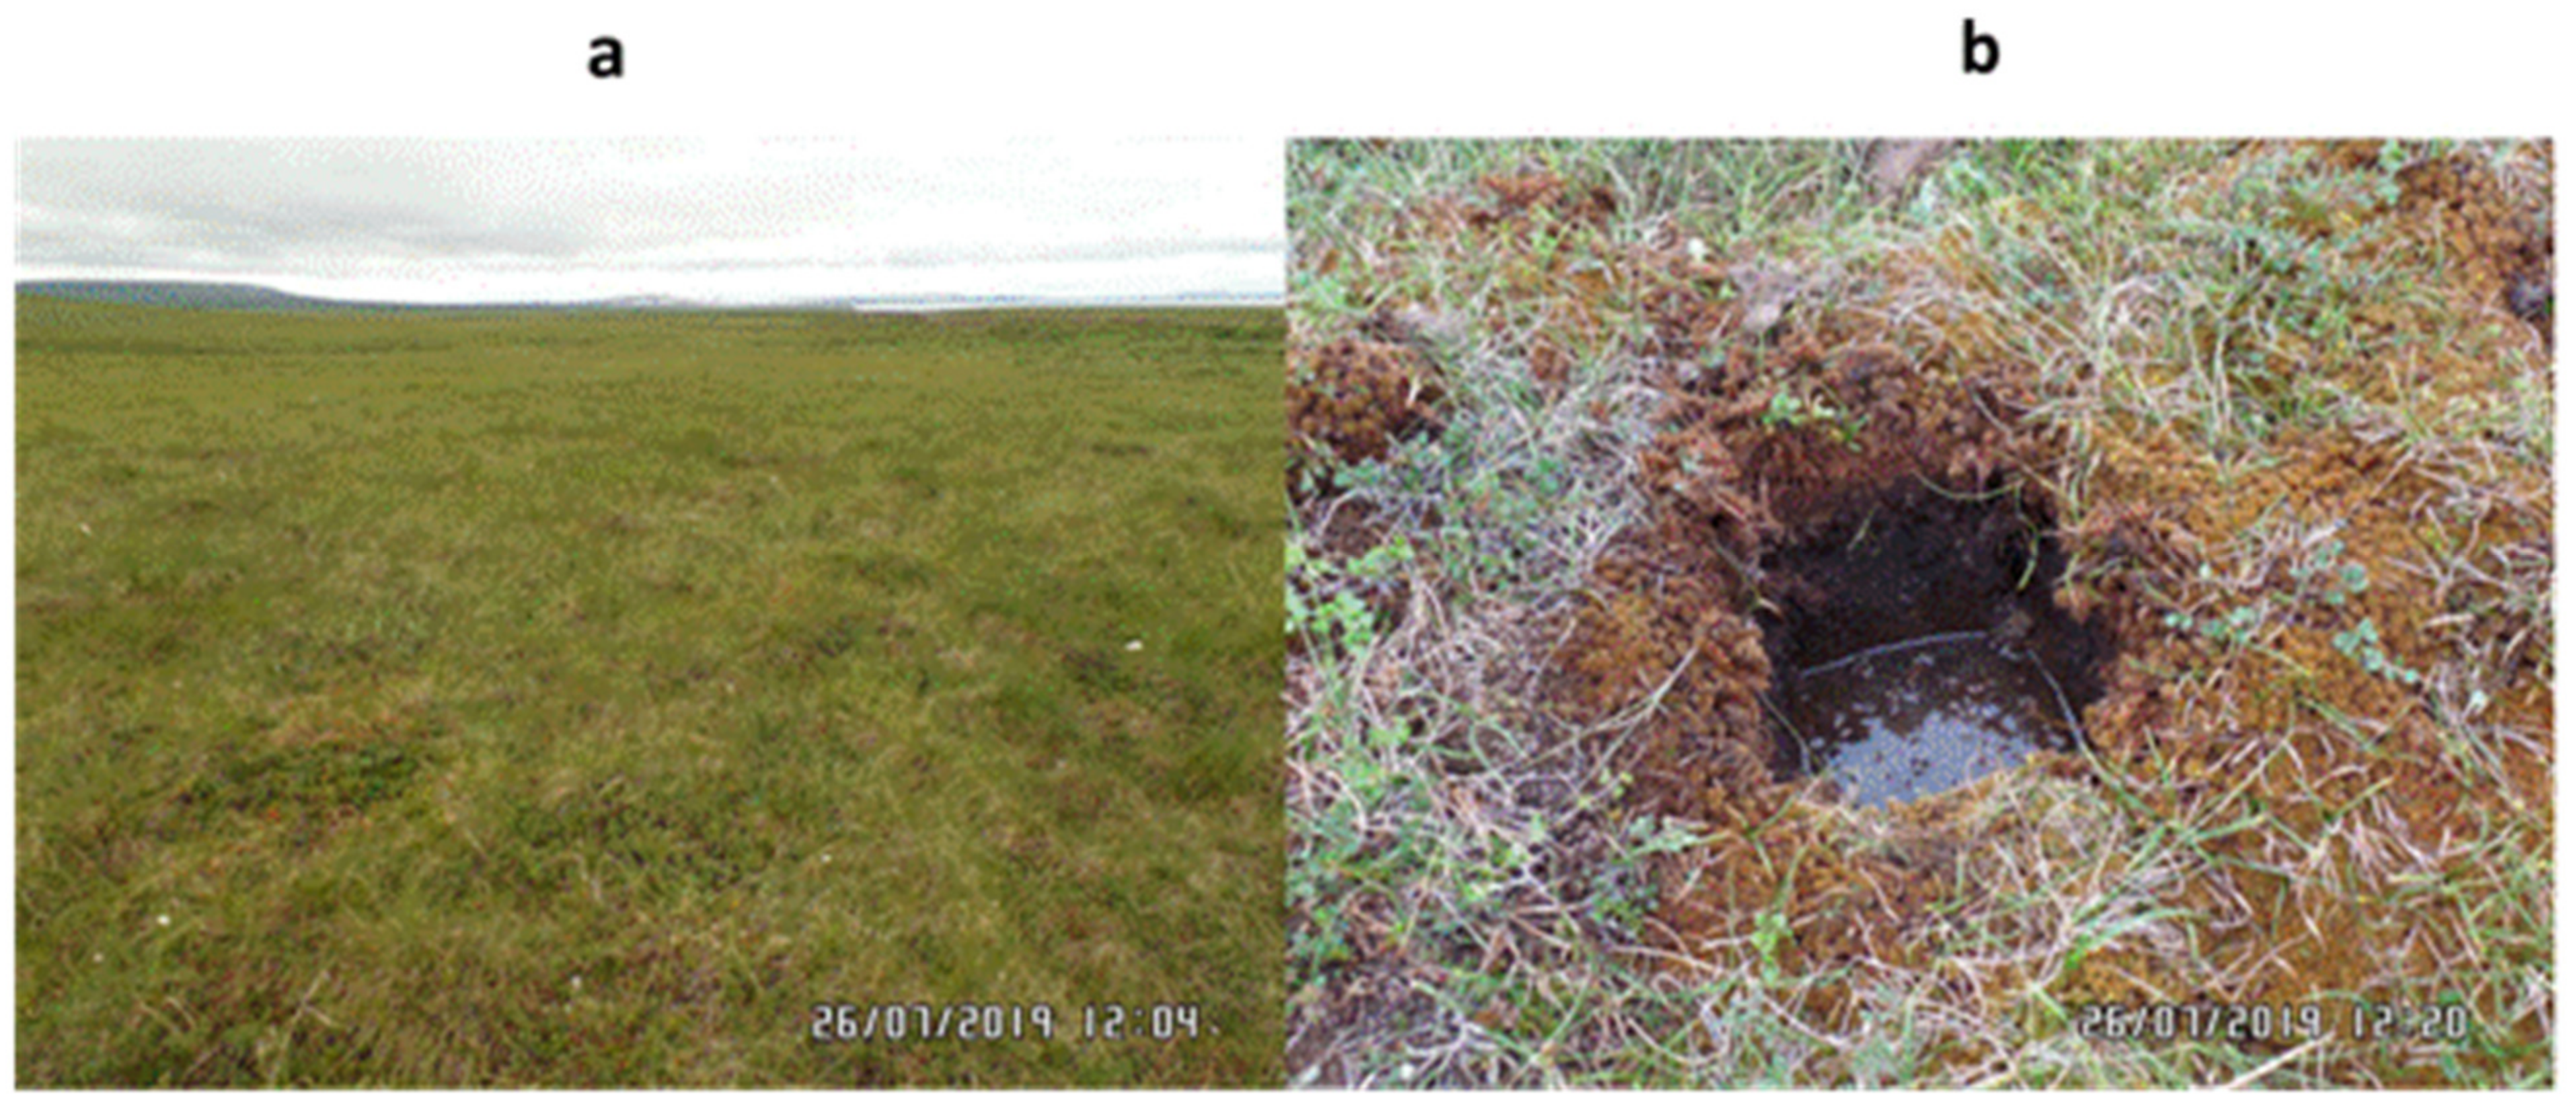
Two field experiments were conducted in plain hummock-ridge and hummocky tundra sites in the summertime when the active layer thawed down to depths of 20–30 and 50–55 cm, respectively. The soils in the study sites consist of tundra coarse-humus peat-like gley and peat gley. Under stagnant water conditions, peat bog soils are widespread and illuvial–humus (or peaty-humic) soils appear where the active layer is subject to frequent drying down [
26] (
Figure 3). The peat layer is covered everywhere by highly spongy tirr with a thickness of 15–20 to 40–60 cm. The decaying degree of peat plant residuals increases with depth from 20% near the surface to 45–50% at the seasonal thawing bottom [
27], and, simultaneously, the light brown color changes to a darker color and, where the highest saturation with humus, the black color occurs (see
Figure 3).
The botanical composition of peat plant residuals, as well as the ash contents of deposits vary depending on the site. On the slopes of tundra spurs, green moss and cotton grassroots residuals dominate compositions of the organic horizon, providing a specific rigid inherent structure of its substrate. The hummocky tundra bogs’ peat has a sedge and mixed moss composition with a higher share of residuals of the dwarf shrub stems and roots. The hummock-ridge tundra sphagnum-sedge peat bogs lie at the slopes’ feet. Sections with sheet (laminated) peats with various component compositions (moss, herb, and willow) can also be found there (see
Figure 3a).
Notably, in the landscape space, the organic horizon forms a relatively continuous soil body underlain by denser and less permeable soil horizons or, in the first half of the thawing period, by a frozen ground aquiclude. This is important since the examined peat deposits are subject to annual freezing-thawing cycles. The active layer volume increases and decreases by 6–12% yearly, owing to this cycle. The morphology of soil ice formations provides some information about the size and morphology of the soil macropores. These are 3–6 mm-thick schliers cutting through sub-vertical 1–2 mm-thick veins and inclusions up to 4–8 mm in diameter. As a result, the peaty horizon becomes loose annually and retains its high porosity.
To assess the hydrophysical properties of peat soil horizons in the study area, 32 soil samples from a depth of 5 cm above the seasonal thawing front in the Ugolnaya-Dionisiya R. catchment were obtained with a core sampler in July 2019; the sampling depths varied throughout within 15–25 cm below the day surface. The samples obtained were analysed in the laboratory using the thermostat-weight method (
Table 1).
The ash content and porosity of the peaty and peat horizons are given in
Table 1 according to the available data from earlier studies [
27]. The total deformation modulus can be found in Amaryan [
28]. The presented data agree, in general, with the characteristics of peat from bogs of convex, lowland, and intermediate types [
23].
The values of the parameter W3 (see
Table 1) suggest that the soil moisture contents above the thawing front are almost half the maximum moisture content. The total deformation modulus E
t accounts for both elastic and inelastic deformations. Tabular data and the surface peat compression tests show that under low P (up to 10–15 kPa), the peat deformation is fully elastic. Inelastic (residual) deformations were identified in laboratory tests of peat samples under P of 200 kPa and more [
28].
According to the thawing front observations in pits and clearing plots, intensive water inflow from walls started immediately after the cleaning of their bottom, resulting in the diggings rapidly becoming filled up to the piezometric level of suprapermafrost groundwater. The water-filling rate and level both depend on the thawing depth, the precipitation in the previous days, the size of the pit, and its position in the relief. As such, the WL stabilization in July 2019 occurred in the pits with depths of 30 cm and 625-cm2 outcrop area, dug on a slope of a tundra spur of 650 m in length and 40 m in relative height. In the upper part of the slope, the water stage 1–3 cm above the pit bottom had stabilized within several hours; in the middle part, the 6–9 cm stage had stabilized much faster; and at the foot of the slope, the 21–23 cm stage had stabilized in 3–15 min. Therefore, the suprapermafrost aquifer in highly permeable peat deposits exhibits strong catchment-scale hydraulic connectivity and considerable water flow velocities. However, this is more typical at the beginning of seasonal shallow thawing when the aquifer has no discontinuities within it.
3. Instruments and Methods of Field Observations
The experiments were carried out with an automatic recording of characteristics such as the WL; streamflow velocity; air, water, and soil T; air P and humidity; and soil moisture content. We used HOBO ONSET WL loggers U20L–04, thermometers U23–003 and soil moisture meters U23–002 manufactured by Onset Computer Corporation, Bourne, US. Also, a hydrometric propeller Potok GR21M manufactured by “Meteopribor” Co., Ltd., Omsk, Russia, and a field weather station Misol–Weather Station Model WH2310 manufactured by Jiaxing Misol Import & Export Co., Ltd., Jiaxing, China, were used. The time resolution of the data obtained was 30 min. A 5 × 1200 mm metal probe measured the thickness of the thawed layer and a 32 × 1000 mm core-sampling tube collected the soil samples. Soil moisture contents were episodically measured with a calibrated portable soil moisture meter TK100–01. The raw data were processed according to the instructions of the instrument’s producers. The data on WL and T, specific discharge, and shifts in phases of daily water and level variations were used in this study. The raw monitoring dataset was analyzed in MS Excel.
4. Description of the Experiments Performed and Their Results
The field observations were made nearby the CALM (Circumpolar Active Layer Monitoring Program) plots [
29].
The first field experiment was carried out at the Ugolnaya-Dionisiya River catchment from June 29 to 6 July 2019, in the summer low-water period when snow cover had disappeared, except for some isolated snowpack patches mostly in the stream headwaters and within nival terraces in river valleys and lake depressions. From the time of snow cover disappearance up to the start of the observations, the rainfall total was 9.5 mm. Within the observation period, the mean daily air T was 12.6 °C; the precipitation total was 3.5 mm, air humidity varied from 39 to 99% and atmospheric P—from 100.3 to 102.4 kPa. At the beginning of the experiment, the thawing depth under cotton-grass and green-moss hummocky tundra was 25–30 cm, and under sedge-sphagnum tundra, it was 20–25 cm, and during the experiment, the seasonal thawing became the deeper for 5–7 cm. The volumetric soil moisture content in the 5 cm layer above the thawing front varied within 50–85%.
We installed four WL and T loggers (LT-loggers) in the pits at 30 cm depths and in the river. Pit No. 1 was made in the thalweg of a water track (slight hollow with sedge vegetation and peat soil). The surface flow in it was initially low and discontinuous in the lengthwise direction: on 29 June 2019, the water discharge was 0.64 L/s with a mean flow velocity of about 5 cm/s.
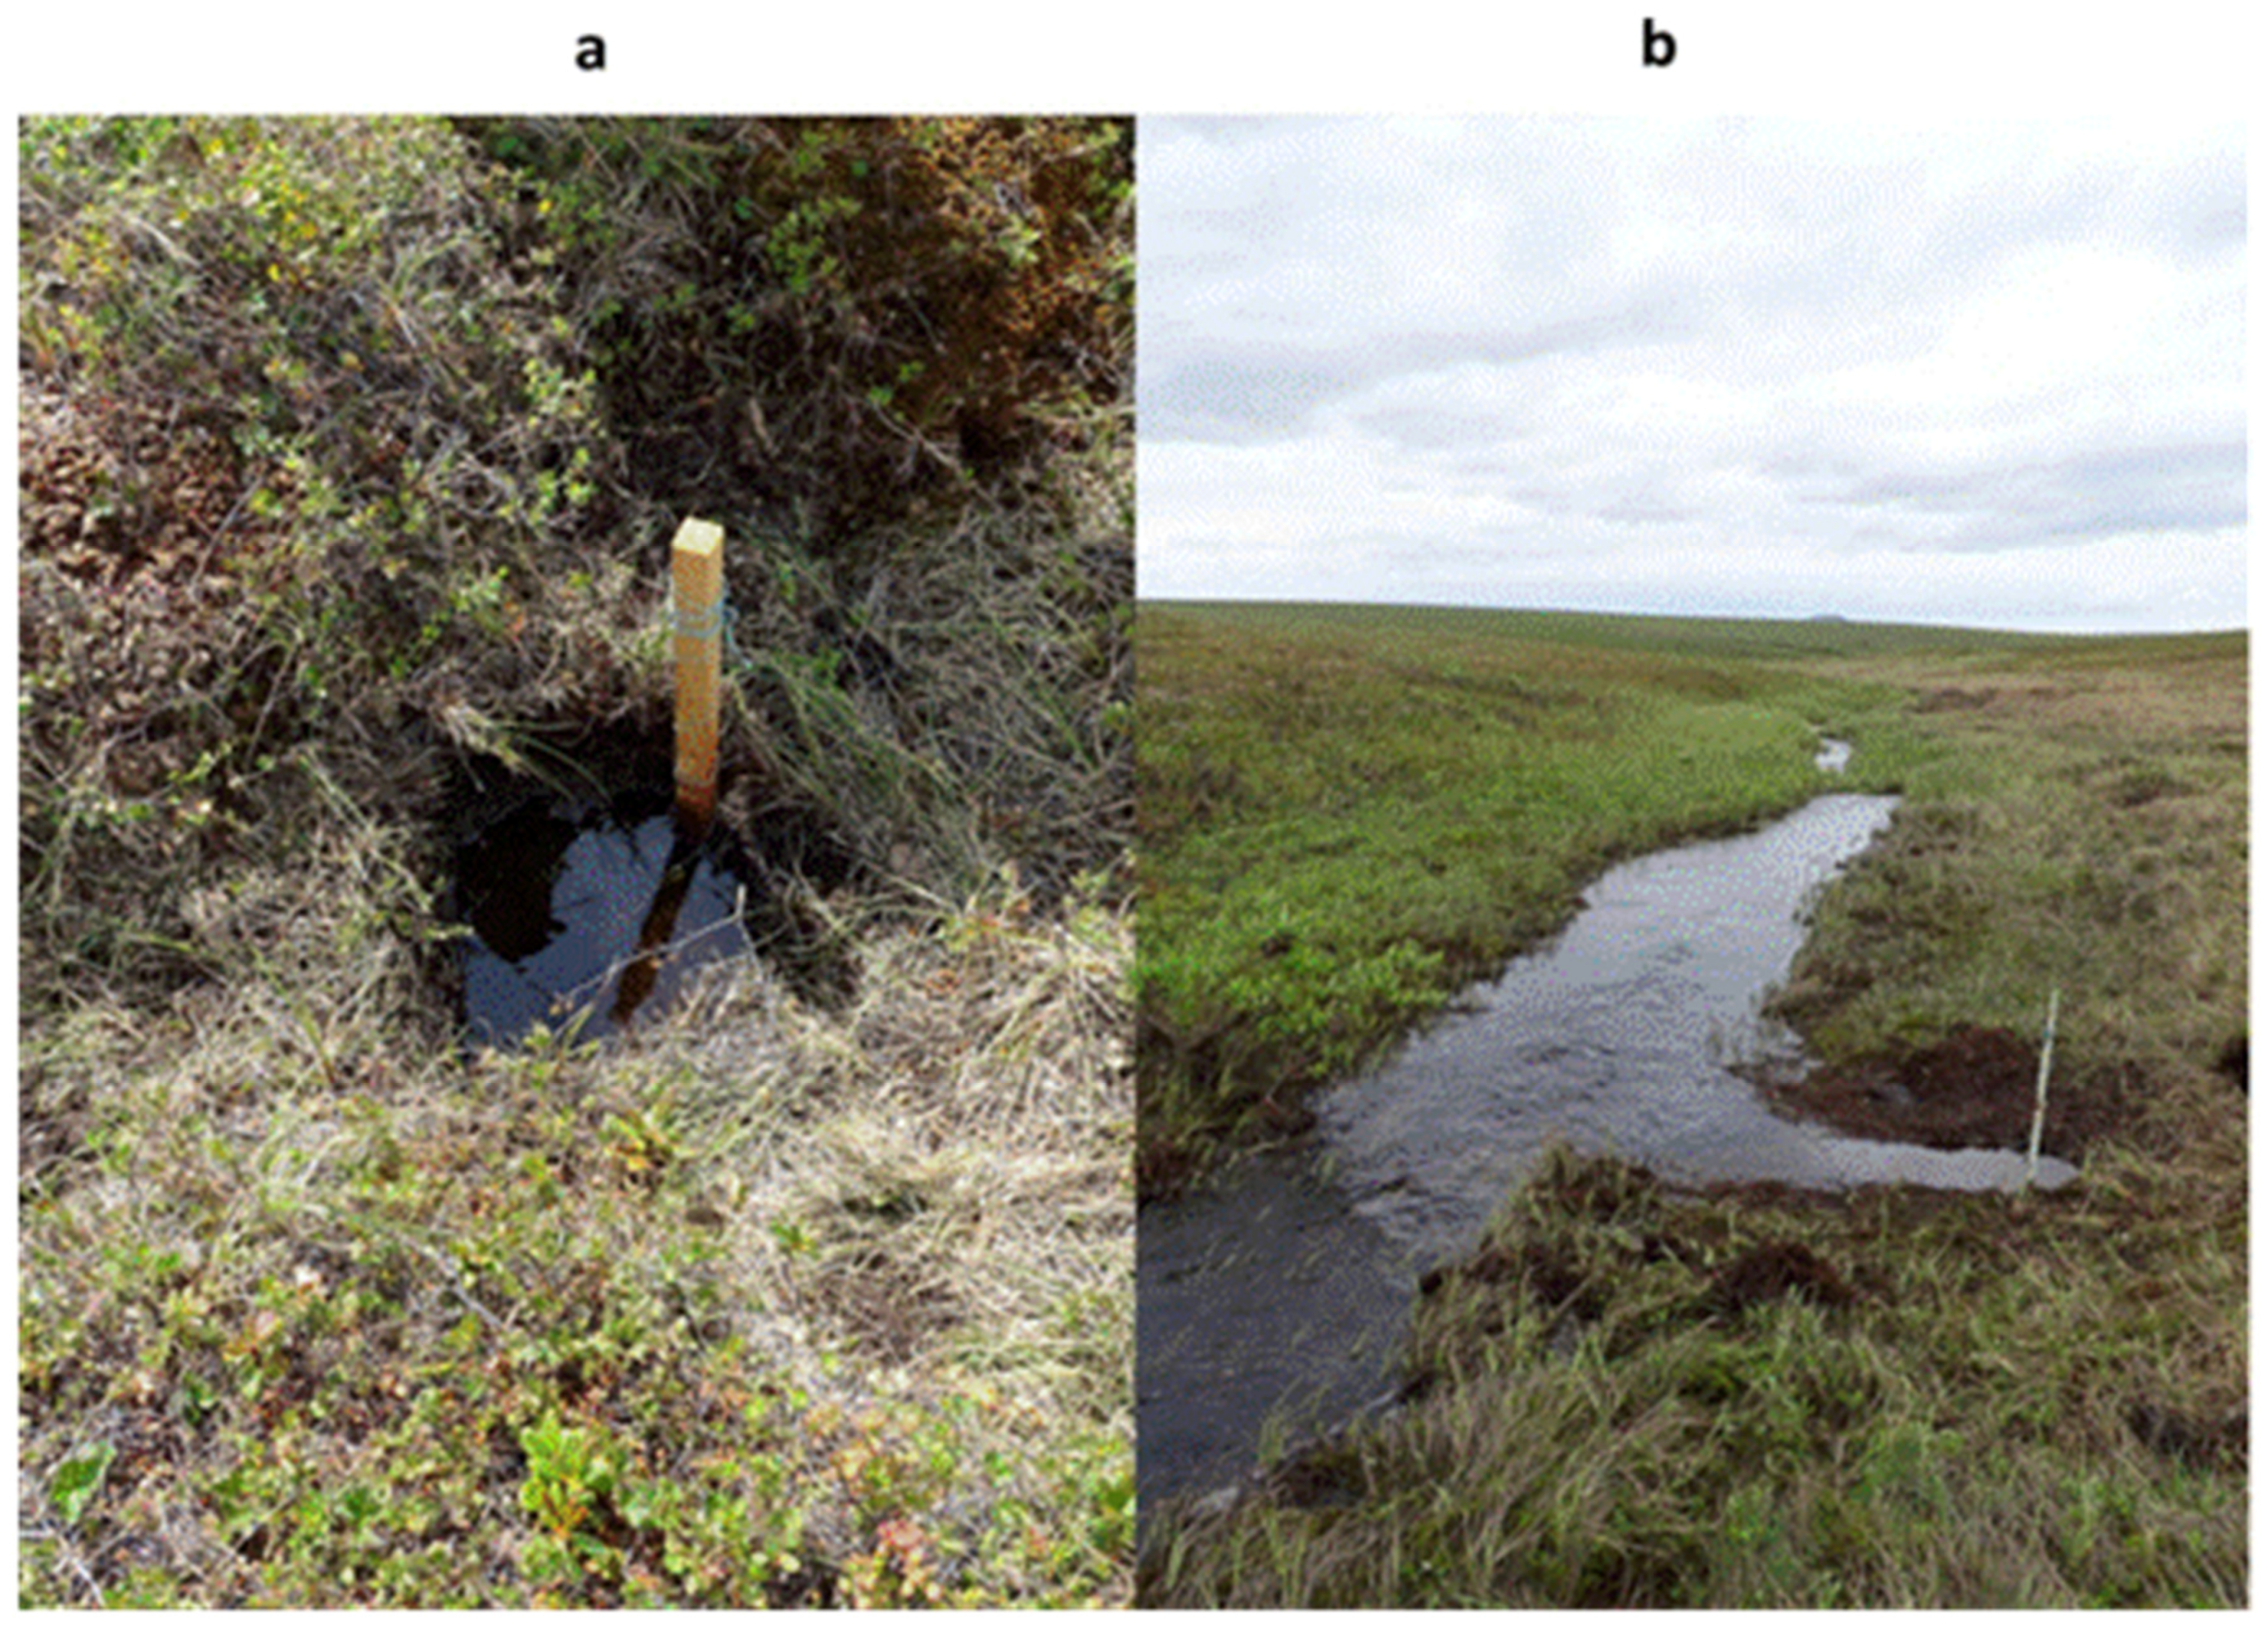
Pit No. 2 was dug on the right side of this water track among hummocky tundra, covered by subshrub–moss–cotton grass vegetation and peaty soil (
Figure 4a). Both pits, spaced 20 m apart, were made at the underside of a gentle slope about 1000 m in length and remote at less than 100 m from the channel of the 1st order draining stream—the Yagodny Creek.
Pit No. 3 was dug on the right bank of Yagodny Creek, 100 m downstream from the mouth of mentioned water track to detect the WL in the creek (
Figure 4b). The vegetation cover near pit No. 3 included a floodplain moss–herb association, the soil was peaty there, and the bed consisted of thawed rubble. The creek catchment area at the gauge was 3.34 km
2. On 6 September 2019, water discharge in the creek equaled 9 L/s.
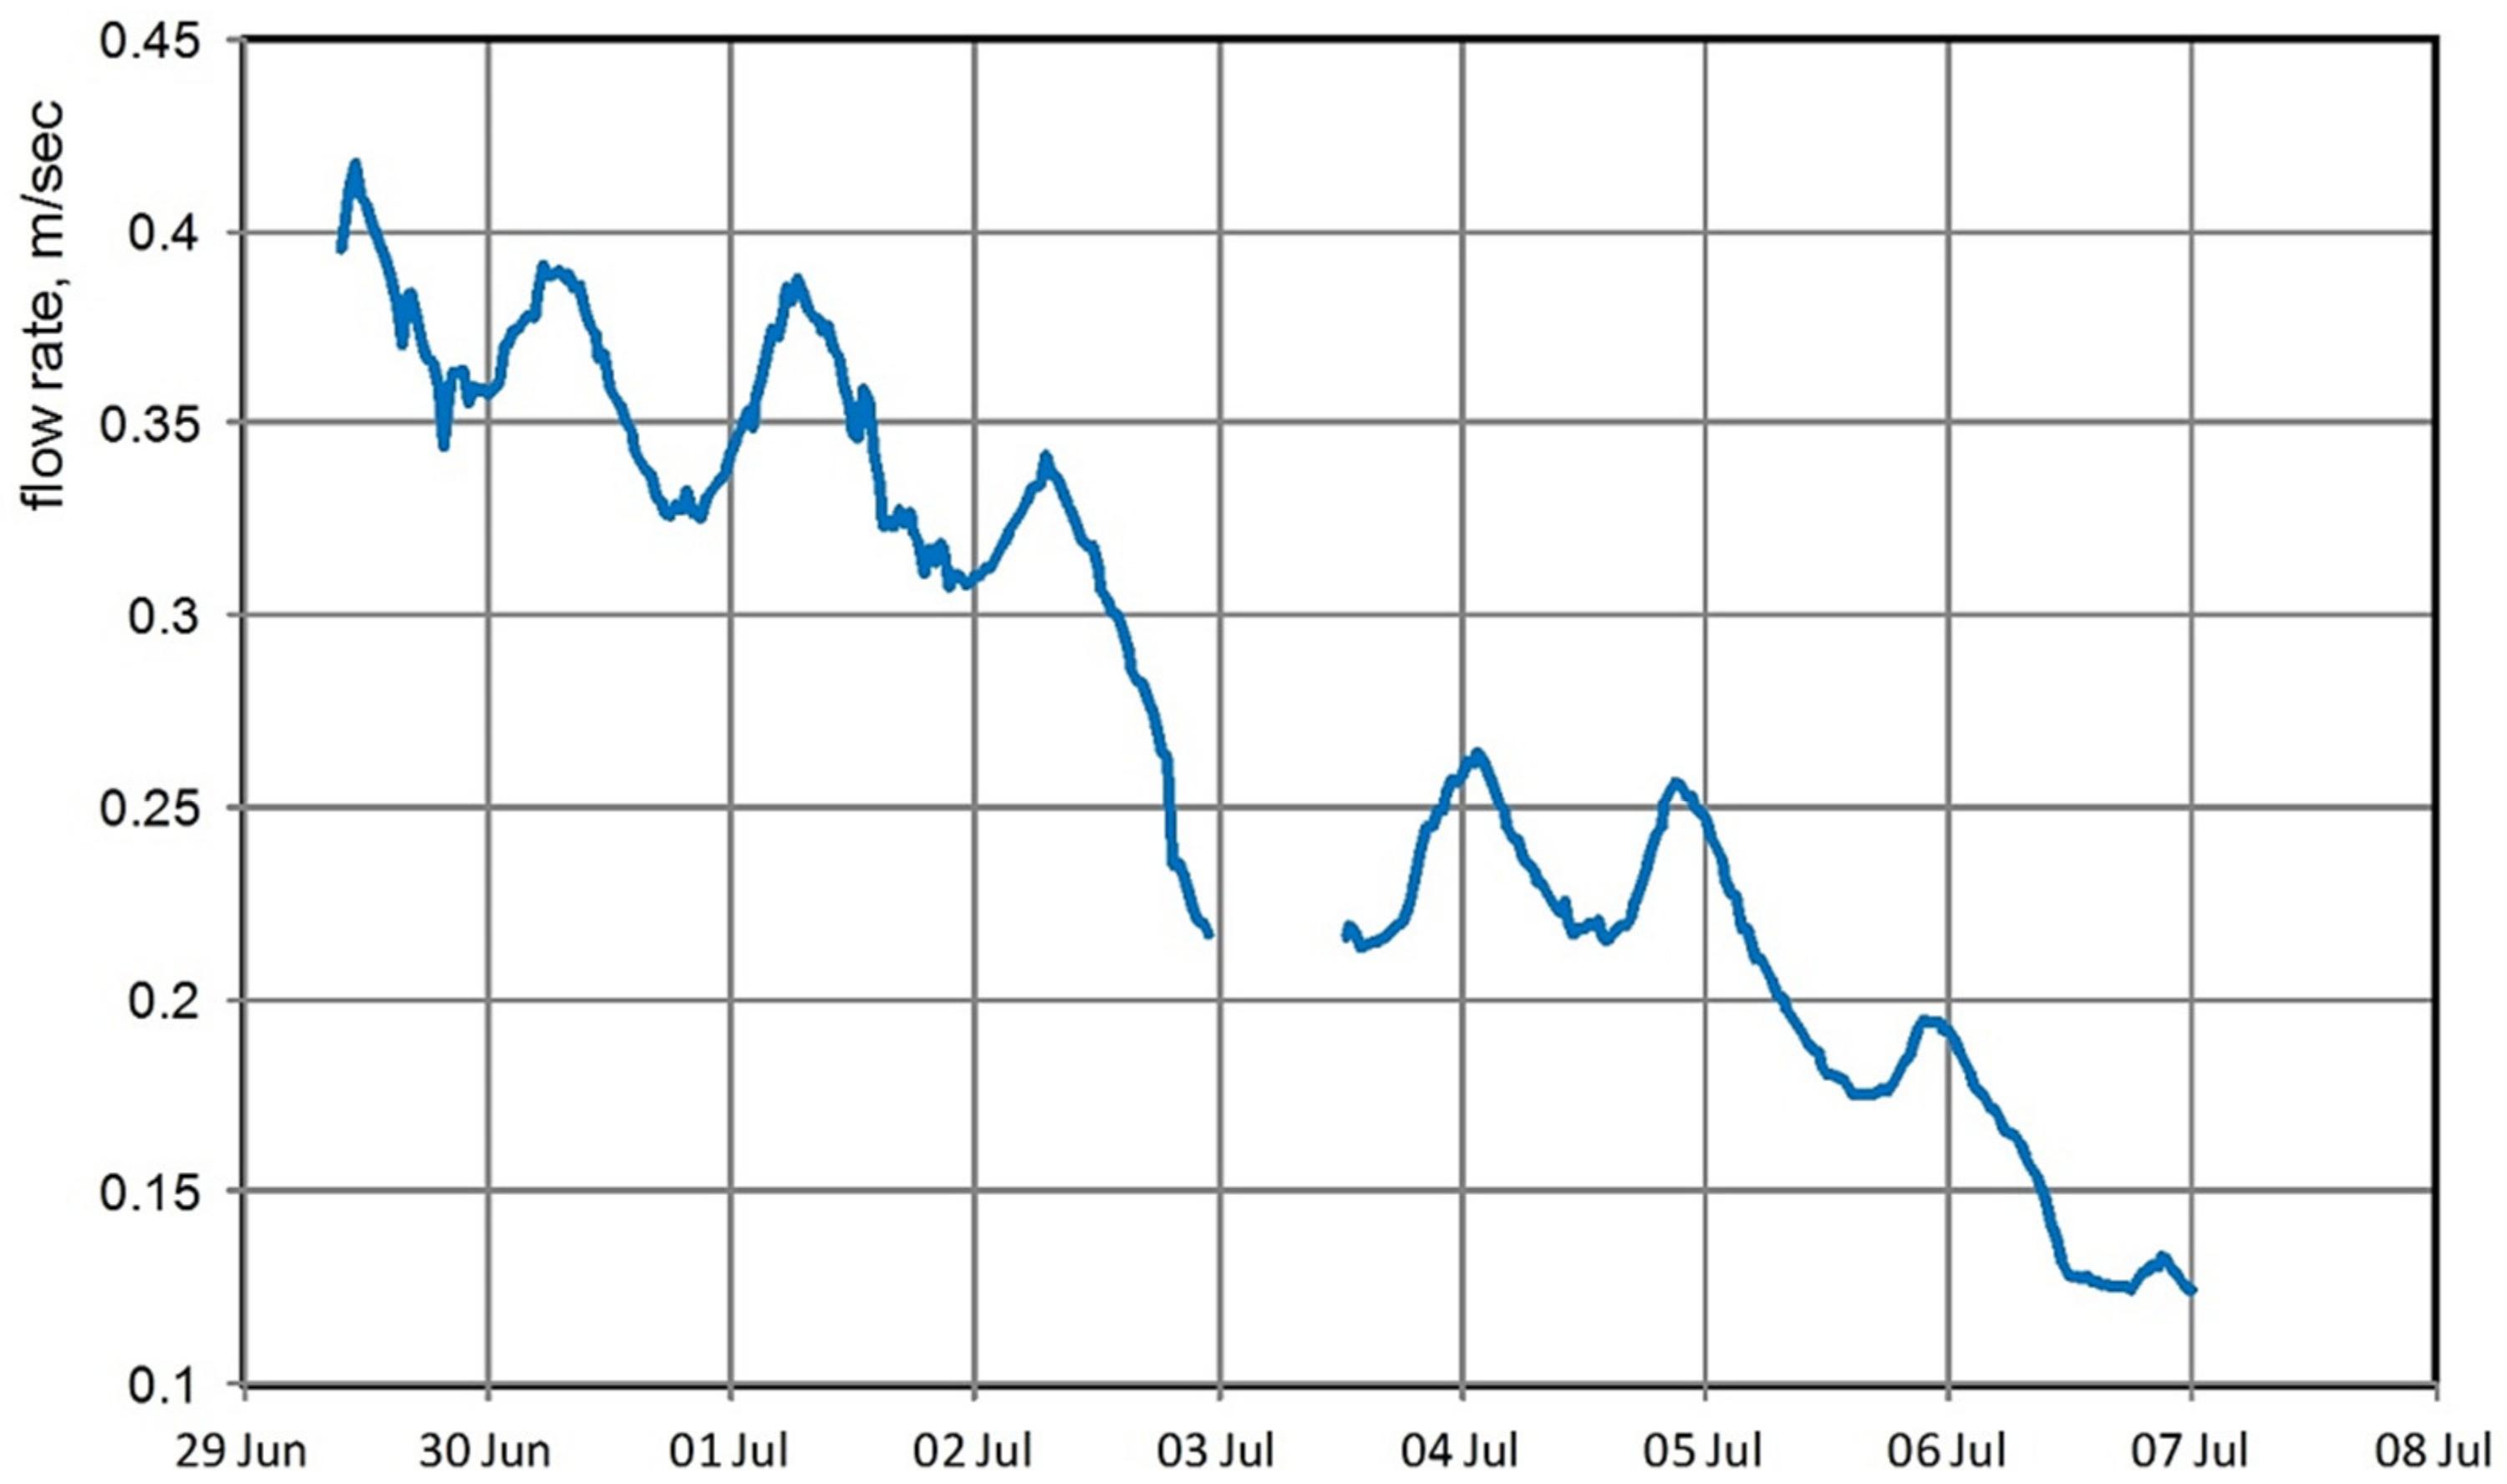
The fourth TL logger was installed at the outlet in the Ugolnaya-Dionisiya River’s channel (catchment area of 89.4 km2) at a depth of 25 cm, as well as a hydrometric propeller to record the flow velocity at halfway of the stream depth (~15 cm). The field weather station was installed near the outlet gauge.
All sensors recorded the WL (depth) continuously during the experiment. The propeller stopped recording on 2 June at 11 p.m. and resumed recording on 3 June at 11 a.m. (
Figure 5). Water discharge in the outlet site was measured every day; the discharge was lowered from 997 to 269 L/s over eight days of the experiment.
The experiment, in particular, confirmed the assumption regarding the in-phase daily dynamics of WL and T at the thawing front [
30]. WL variations of 2–3 cm in amplitude were found in phase opposition to the water T variations of 2–6 °C, such that the level maxima and the T minima of the pits, creek, and river simultaneously occurred at night. Variations in the flow velocity matched the level variations. The daily WL and velocity fluctuations were fading throughout the field observation period from June–July 2019.
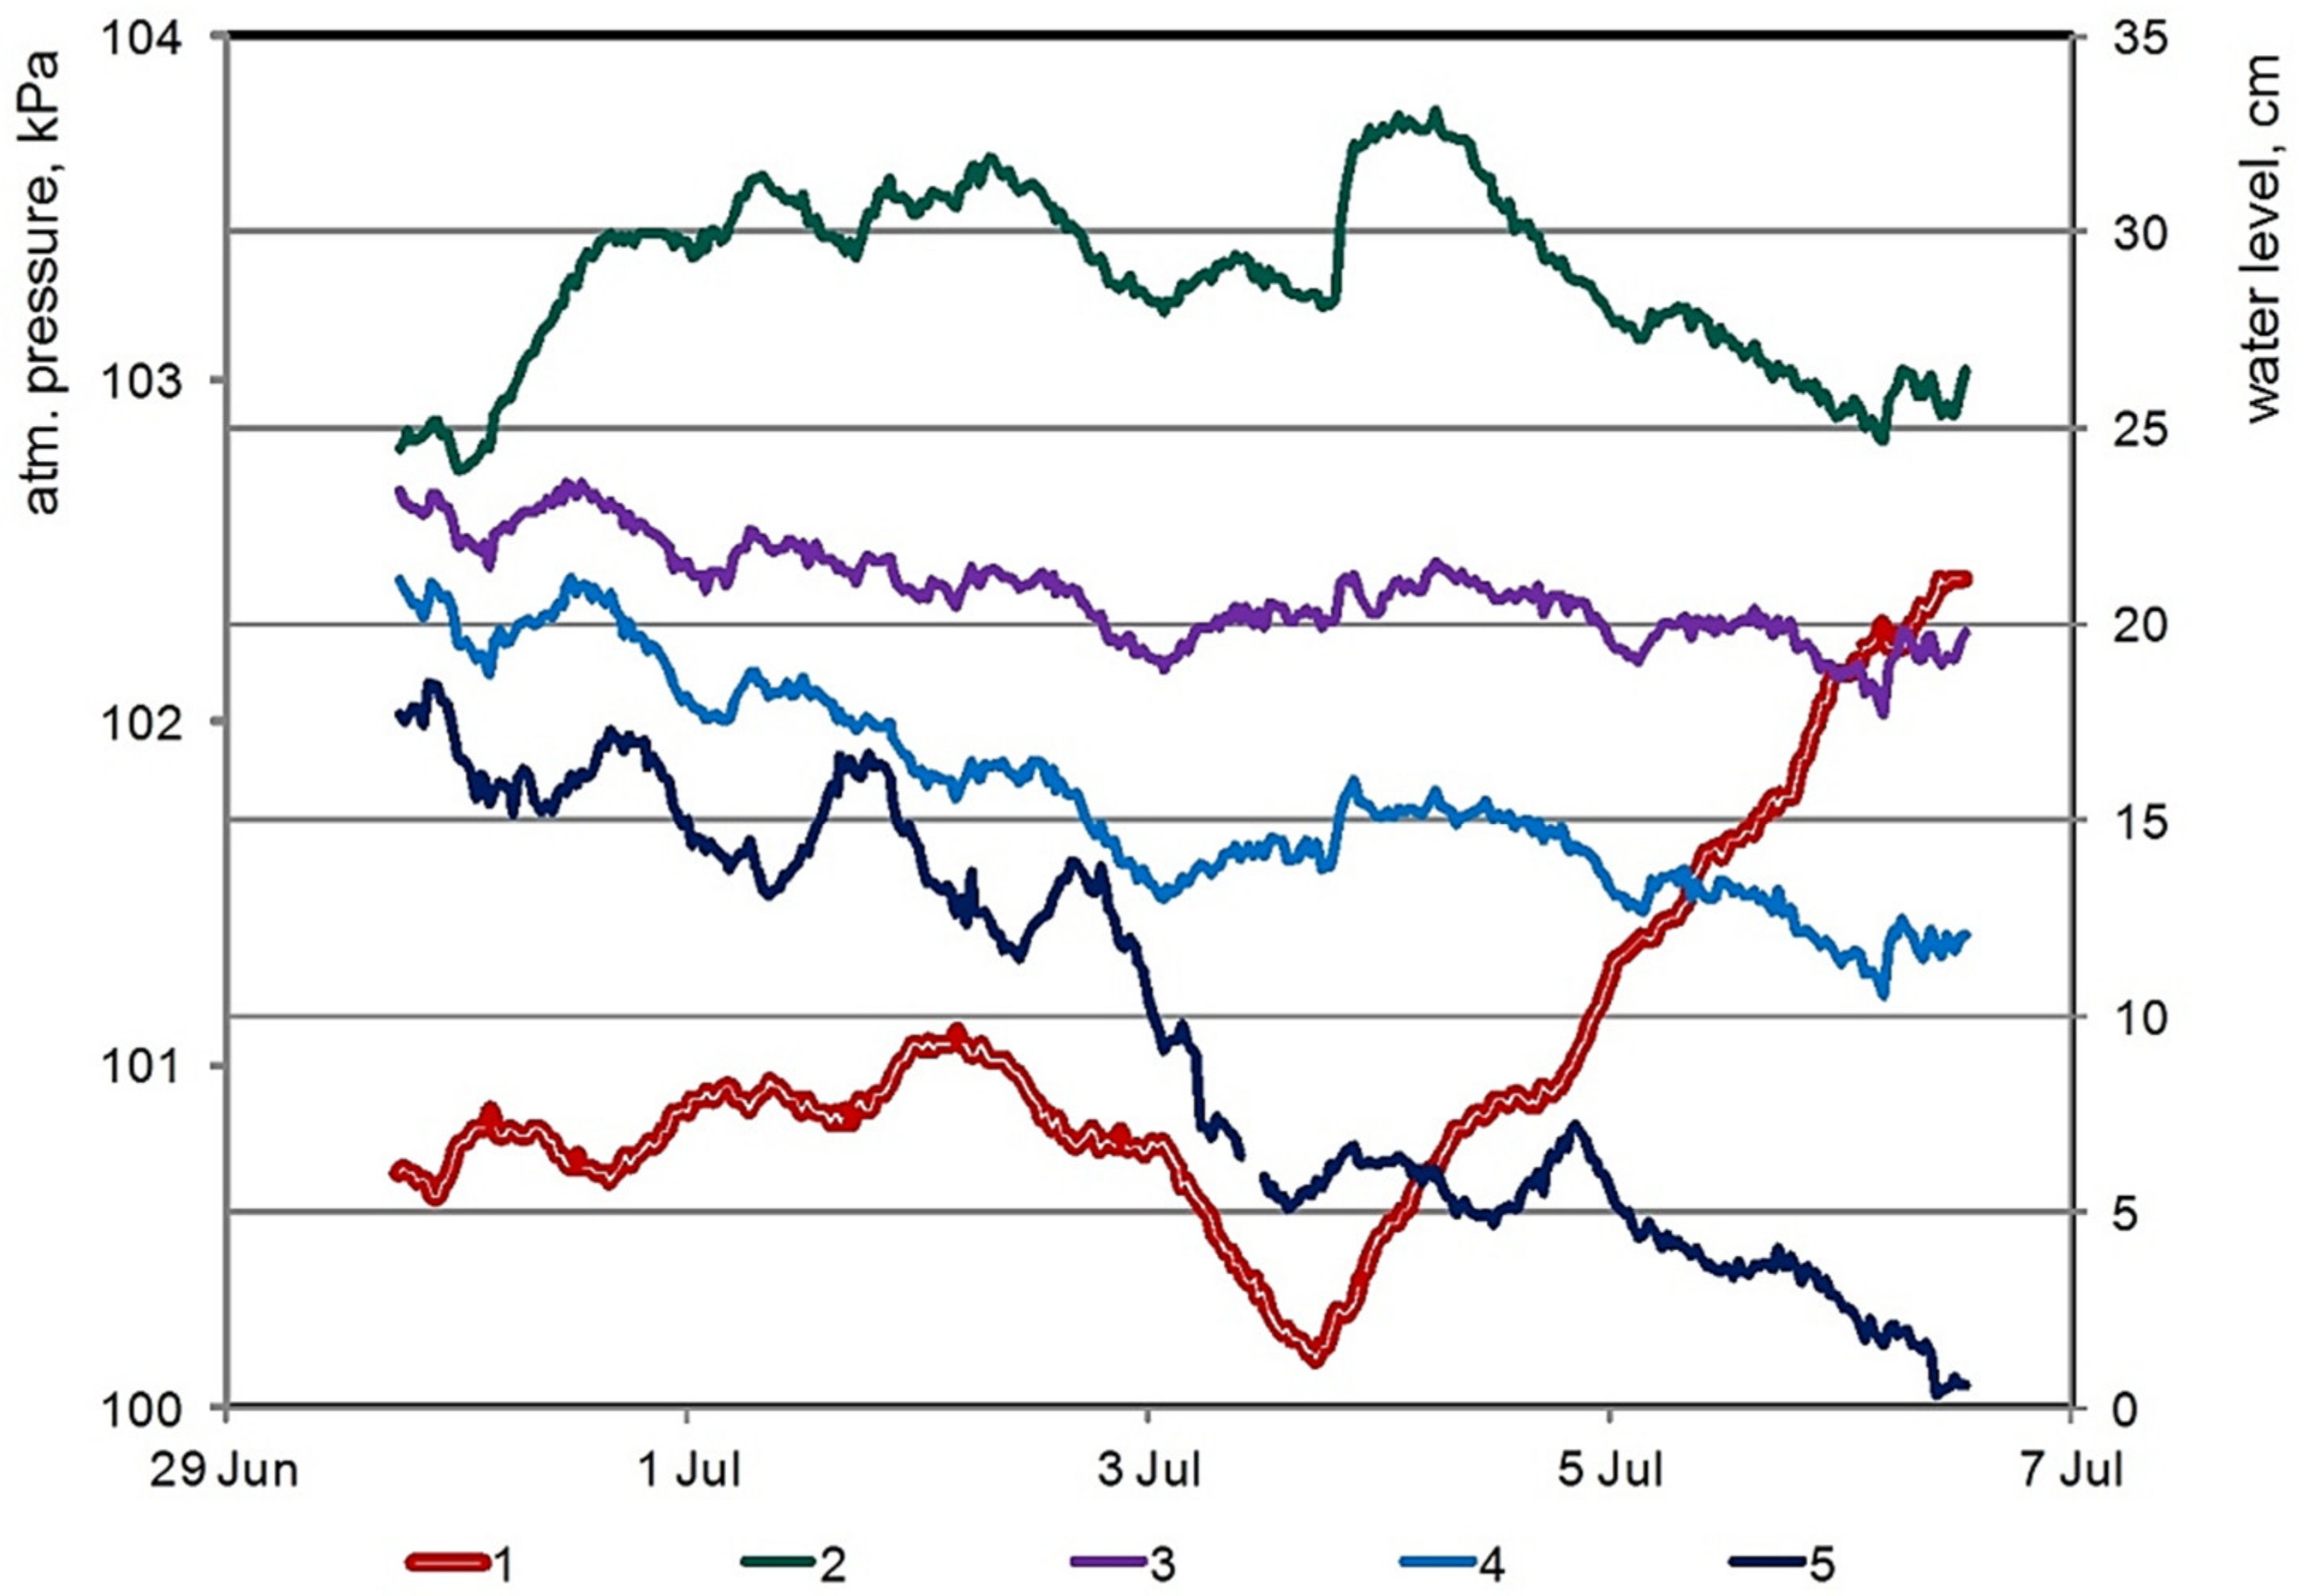
The measurement revealed an anomaly in WL variations on 2–3 July, which disagrees with subharmonic diurnal cycles (
Figure 6). Thus, within 15 h, the WL in the pits and on the slope (No. 1 and 2) dropped almost simultaneously by 2.5–4.4 cm, after which it increased by 2.6–5.2 cm during the following 28 h. In the Yagodny Creek (the pit No. 3), similar WL variations were occurring almost synchronously with those described above—a drop by about 3.5 cm and the following rise by 3 cm. This simultaneous drop in the WL occurred against the background of their pronounced diurnal variations with an amplitude of about half of the drop and against the total day-to-day decreasing trend in the WL, most prominently in Yagodny Creek.
A similar anomaly in level changes can be found in the records of the Ugolnaya-Dionisiya River’s outlet gauge. However, it occurred with a lag of about 12 h along the background of rapid total lowering in the river level, which produced a much more asymmetric anomaly shape. The WL in the river dropped by 7.8 cm, while the compensating level rose as little as 2.5 cm. The sharp WL drop was expected to be accompanied by an equally sharp drop in discharge, and, at about the same time, the failure in the flow velocity record mentioned above took place. Considering the specification of the hydrometric propeller, it was supposed that the failure in the record reflected a drop in the flow velocity below the sensitivity level of 0.03 m/s being kept for more than 5 min, after which the device turned itself off automatically.
The described anomalies in the WL variations in the vast area studied should have a common reason. In the time when the unusual changes in the WL took place, the weather station recorded a drop in the air P from 100.8 to 99.7 kPa, followed by an increase to 102.1 kPa. We hypothesized that a sharp and considerable change in atmospheric P disturbed the balance of forces governing the capillary moisture capacity of the peat soil. If so, a simultaneous and similar change in water levels in different water bodies over a large area of tundra can be supposed to be a peculiar baric effect, the study of which is of considerable importance. To test this hypothesis, additional experiments were carried out in the field and in the laboratory.
The second field experiment was accomplished on the test site at Rogozhny Cape (see
Figure 1) in 1–6 September 2019, when seasonal thawing of hummocky tundra was the deepest, 50–70 cm, the mean daily air T was 8.6 °C, and relative air humidity varied within 60–98%. Drizzle was observed on 2–4 September (2.1 mm in total).
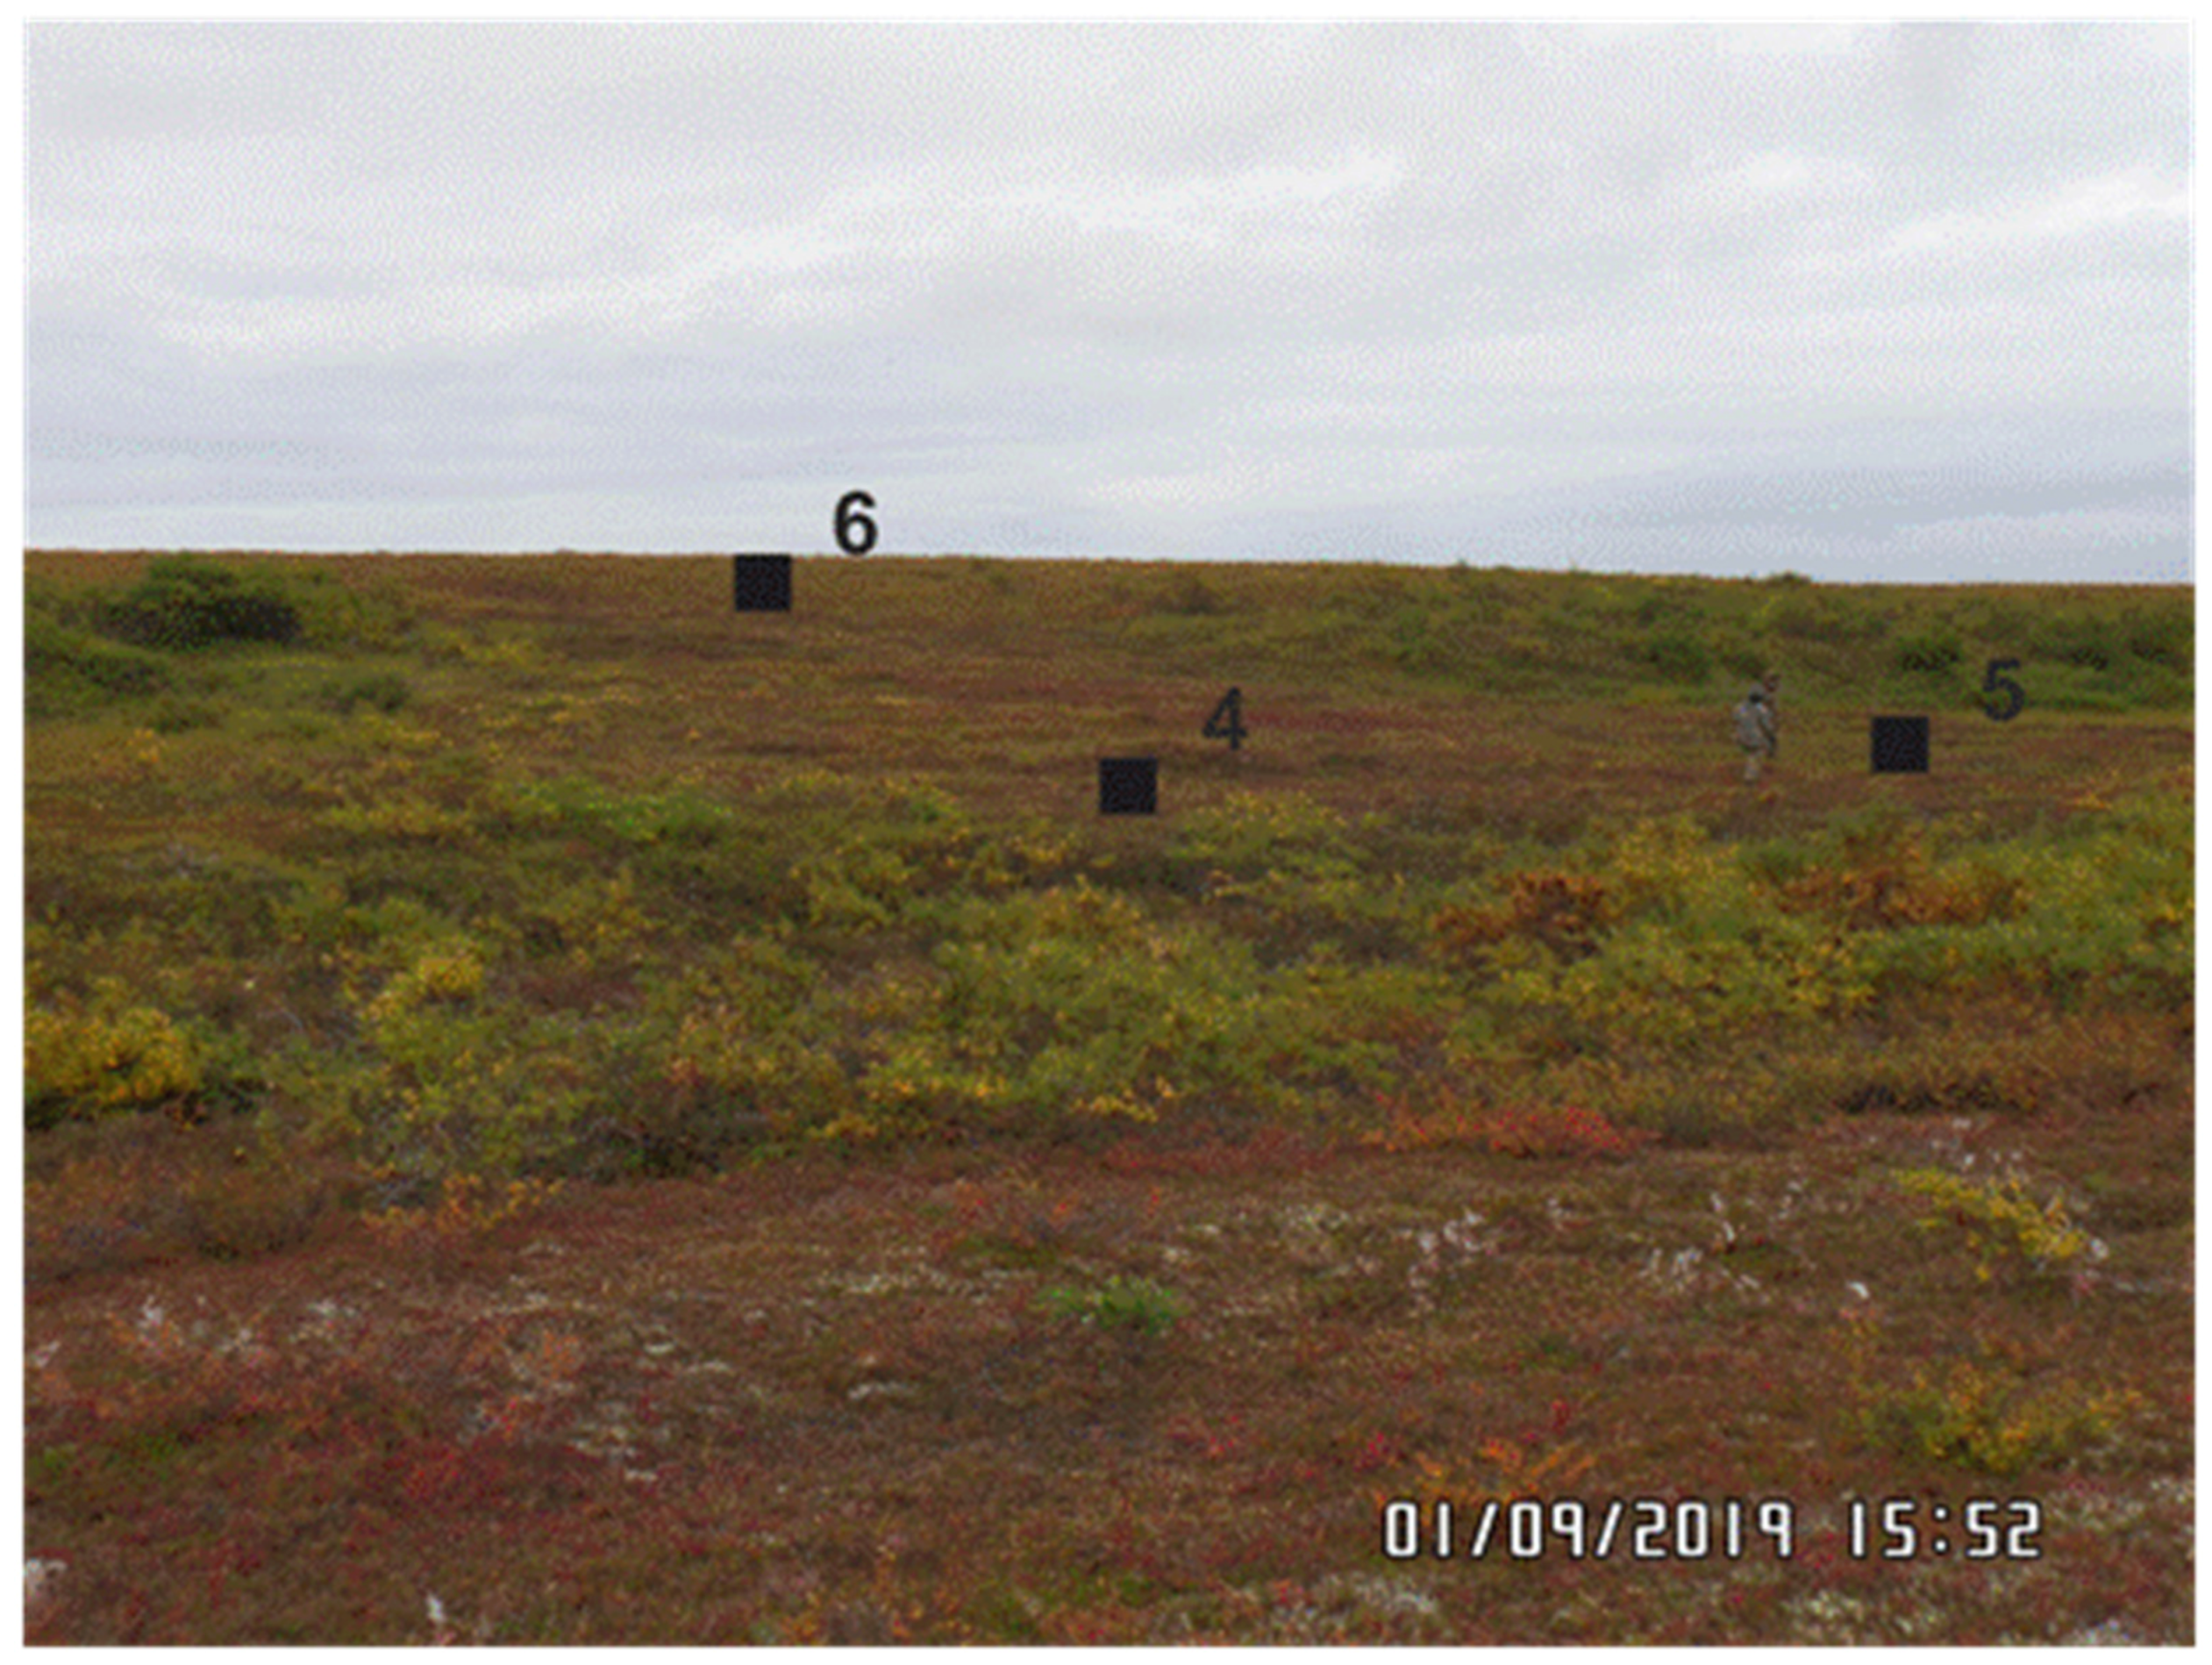
The experimental site was a water track at the foot of the tundra spur with a relative height of 27 m. The top and the gentle slopes of the spur were covered by hummocky moss–cotton grass tundra. Hummock and hummock-ridge tundra bogs with subshrub and sphagnum-sedge vegetation, and low willows with herbs covered the slope foot. The level gauges were installed in 40 cm-deep pits: No. 4 and No. 5—on the solifluvial-alluvial cone at the water track foot, and No. 6—on its top (
Figure 7).
The peat deposits contained a peat soil horizon with a thickness of 25–30 cm and a 5–10 cm-thick wet peaty-humic horizon. These were underlain by a saturated, thick (up to 15 cm deep), dark-grey-colored sandy loam or loam layer. An additional level gauge was installed at a 30 cm depth into the channel of a lower tundra creek of the 1st order with a typical hummocky boggy catchment area of about 1.7 km2, and its water discharge on September 1 was 3.9 L/s. The creek banks and bed were incised into the peat stratum.
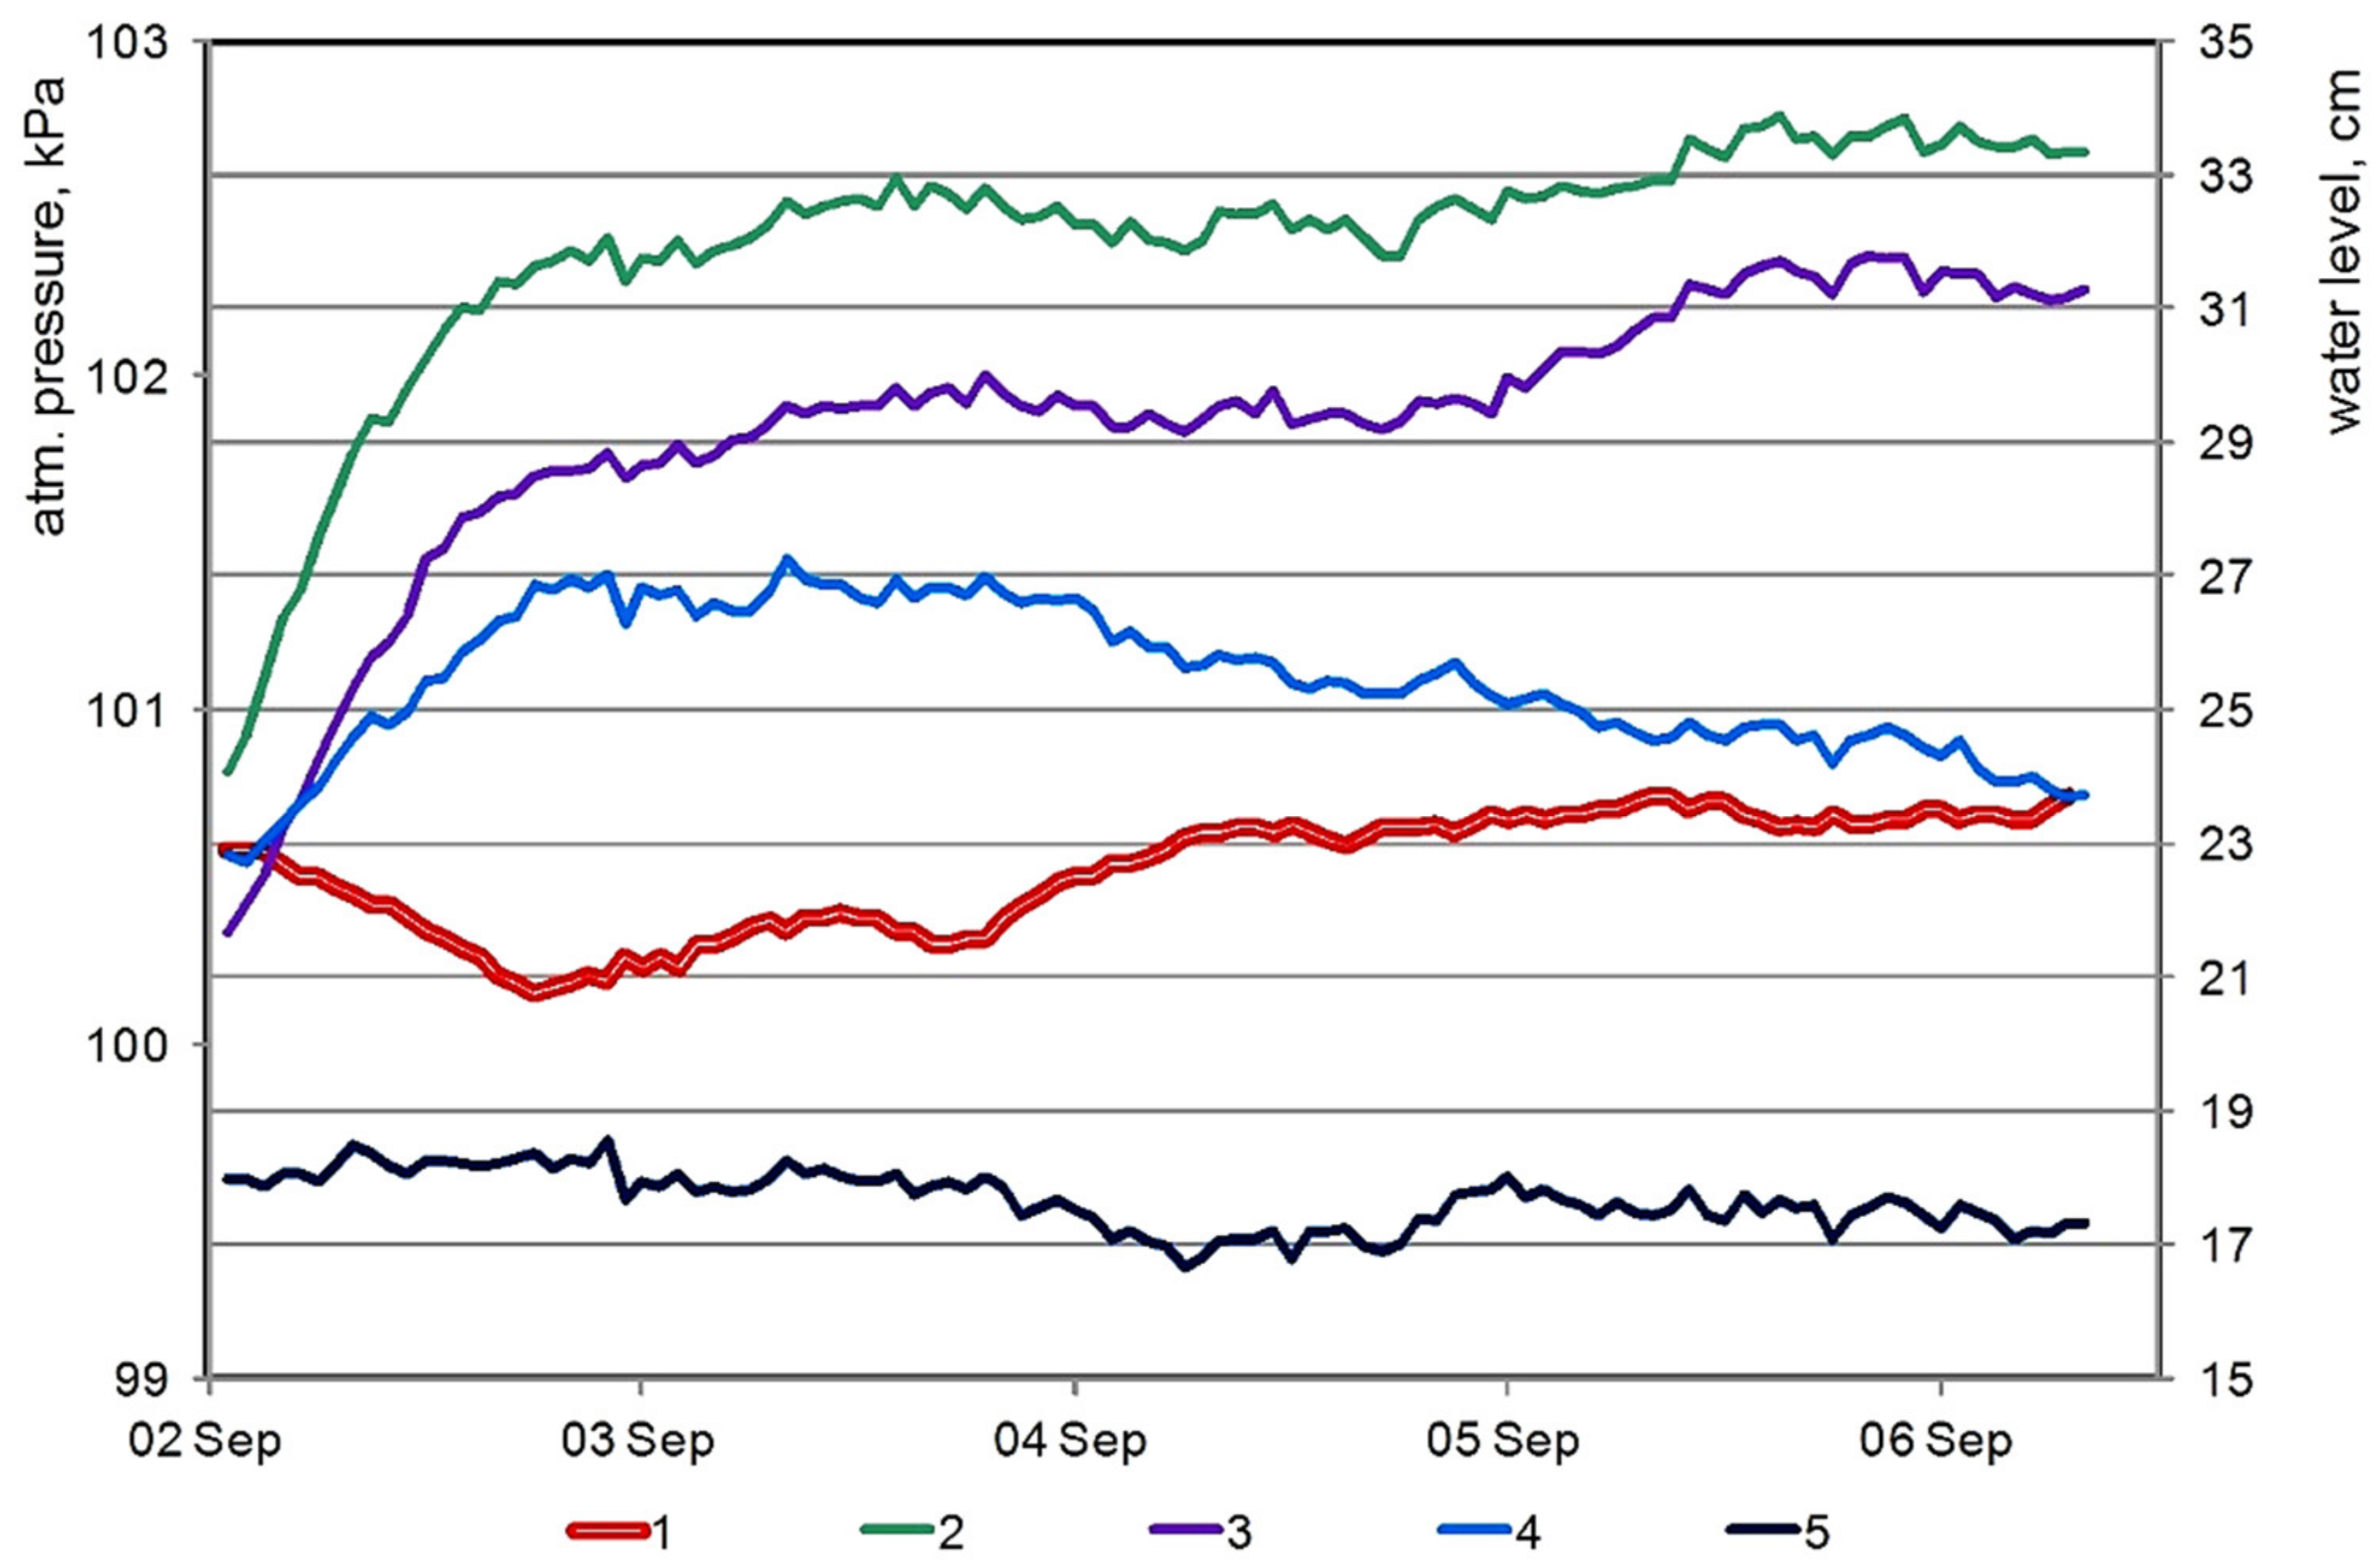
In the September experiment, the pits just dug up began to fill with water at the start of observations, then the level slightly rose or steadily dropped (
Figure 8). No diurnal cycles in WL change were detected. The moderate WL rising in pits No. 4 and No. 6, recorded on 3 and 5 September were due to rainfall.
During the experiment, the air P decreased by 0.43 kPa from 5 p.m. on 1 September to 7 p.m. on 2 September. After that, it increased by 0.56 kPa until 6 September. The air P change effect on the WL in the pits was complicated due to their filling with water during that period. Next, once the pits were filled with water, no level rise was recorded when the air P increased. No response of WL in the creek to atmospheric P changes. Therefore, when the deepest soil thawing and the suprapermafrost groundwater table lowers below peat horizons, no baric effect is expected to occur.
A laboratory experiment was performed indoors from 27 July to 21 August 2019, at T of 22.1 to 18.1 °C and air humidity of 50 to 58%. We obtained undisturbed peat soil samples, placed them in tubs filled with water up to the level simulating the groundwater table in the suprapermafrost aquifer, and observe the WL behavior in the tubs under natural air P changes. Two samples of 20 × 25 cm in horizontal size and 30 cm in height were obtained from the intertrack on spur surface of a slope of up to 2°, covered by typical hummocky moss–cotton grass tundra with sphagnum–sedge vegetation at the sites with higher moistening (
Figure 9a). The soil there consisted of peaty-gley with moss tirr and a peat horizon with a thickness of less than 30 cm. Sample No. 1 represents a peat layer from the soil covered by moss–cotton grass vegetation, and the peat sample No. 2 was extracted from the soil with sedge-sphagnum vegetation cover (
Figure 9b).
The volume of the sample No. 1 was 3900 cm
3 (weight—4300 g), and the volume of the sample No. 2 was 9828 cm
3 (weight—3834 g). The sample No. 2 had a larger volume and lesser density due to the top 5-cm-thick layer of sphagnum moss tirr. Both samples were isolated with a polyethylene film (
Figure 10a), and then placed into plastic tubs with a volume of 11,000 cm
3, filled with water up to few cm from the bottom (
Figure 10b).
During the laboratory experiment, in the tubs with samples No. 1 and No. 2, and in the additional vessel filled only with a water to control evaporation rate, three loggers registered the WL and T continuously. Air T and P were synchronously recorded with a 30 min resolution.
Throughout the 24 days of the experiment, the water layer decreased in all vessels (
Figure 11), the water T in the tubs decreased from 19.6 to 16.9 °C according to the air T in the room. The final weights of the samples No. 1 and No. 2 became 3942 g and 3737 g, respectively, i.e., 8.3 and 2.5% less than their initial field weights. The experiment revealed a drawback of its design, i.e., the effect of laboratory exhaust ventilation, which caused short-time air P variations due to windy weather. This resulted in the saw-tooth shape of WL records with a 0.2–0.6 mm noise range. An atmospheric P sensor installed in a neighboring room provided a more stable record.
Two cycles in air P oscillations with amplitudes of about 0.95 and 1.9 kPa were registered in two observation periods as 3–5 August and 12–17 August 2019, when low P was kept for three and six days, respectively. In both cases, after its maximal drop, the P rose up to the values exceeded the initial ones. At the end of the second cycle, on 17 August 2019, the P was extremely high (102.9 kPa).
On 3 and 14 August 2019, two cases of WL rise coinciding with atmospheric P drops were recorded in the experimental tubs. The WL increased by 0.2 for the first case, and by 1.2 cm for the second case in sample No. 1, and by 0.7 and 1.1 cm in sample No. 2, respectively for two cases. The peaks in the record for the sample obtained from moss–cotton grass tundra exhibited a stronger contrast, while those from sample No. 2 (with sedge-sphagnum tirr) was flatter. The decrease in WL was clearly correlated with the atmospheric P rise, though the WL response to an anomalous increment in atmospheric P at the end of the experiment was not pronounced. The control vessel showed only a gradual WL decrease due to evaporation.
Thus, we have established the phreatic WL response in two peat soil monoliths in a laboratory experiment. The shape of this response differed significantly from that observed in the field experiment. The reason for this difference is considered below in the discussion of results.
5. A Conceptual Model of the Baric Effect
What is a possible explanation for the observed impacts of atmospheric P changes on runoff in a river basin covered by shallow peat and peaty soils?
To answer this question, let us analyze the interactions of the capillary moisture and gravitational water in such a soil system within the framework of the simplest conceptual physical model. Herein, it is crucial to consider that the walls of the capillaries are at least partially formed by the soil organic material (plant fibers), and therefore, they must exhibit elastic properties to some extent.
As shown in the diagram (
Figure 12a), the equation of the equilibrium of a liquid in a capillary, which is connected to the level of gravitational water, looks as follows [
15]:
where
Pat—air P,
σ—liquid surface tension,
ρ—liquid density,
R—capillary radius,
g—acceleration of gravity,
h—the height of the capillary rise of the liquid above the free surface level. Let us consider the difference between the responses of an inelastic (rigid) capillary and an elastic (flexible) one to changes in air P.
In the case of a rigid capillary (
R ~ const), the solution of Equation (1) looks like:
Then, the volume
V of capillary moisture above the free surface level is:
According to Equations (1)–(3), the values of h and V do not depend on any changes in Pat, i.e., there should be no reaction of the single rigid capillary system to a change in air P.
Equations (1)–(3) are derived from considering the equilibrium of the liquid in a capillary in its vertical axis direction, that is, along the capillary walls. Of the three forces ensuring this equilibrium (see
Figure 12a and Equation (1), the force of air pressure
Pat and the liquid column weight
ρgh are pointed in all directions, as in, they have vertical and horizontal components.
On the contrary, the capillary tension force in the meniscus 2σ/R is directed tangentially to the wall and has no horizontal component. When considering the equilibrium along the horizontal axis at an arbitrary point on the capillary wall, we see that the values of P on different sides of the wall are not equal. This deficit of the P equilibrium is compensated by the stress state of the wall, which occurs without any deformations in a rigid capillary.
For a flexible capillary, the stress state of its walls is associated with their elastic deformation, which is proportional to the P deficit on the walls. A change in the balance of acting forces leads to a change in the shape of a flexible capillary. However, in the case shown in
Figure 12a, a change in the air P force acting equally inside and outside the capillary, does not alter the balance of forces on the wall. Equations (1)–(3) in this case remain valid, and the reaction of the values of
h and
V to a change in
Pat should not be observed, similar to the case of a rigid capillary.
The foregoing refers to the consideration of the system of forces in the classical quasi-equilibrium approximation, i.e., if external influences occur so slowly that at each moment the system maintains a state close to equilibrium. Let us consider (
Figure 12b) a more realistic scheme of a capillary, more or less flexible, in a peat massif, and its possible reactions to a change in air P when the quasi-equilibrium condition is violated. A significant difference of this scheme from the previous one is the designation of the P inside the peat as
Ppt, which in general may differ from
Pat (
Ppt =
Pat + Δ
Ppt) due to the relative isolation of the subsurface aeration zone from the free atmosphere, as mentioned above. However, for a constant value of Δ
Ppt, it is compensated by the height of the capillary rise and does not qualitatively affect the system dynamics considered below. Therefore, we restrict ourselves to the case of
Ppt =
Pat.
Since a capillary’s top is open to a free atmosphere, a change in air pressure
Pat has an immediate effect on the meniscus. At the same time, the peat stratum (due to its physical and mechanical properties) provides significant resistance to the movement of liquids, gases, and heat transfer within it. The peat stratum should provide some resistance to the transmission of changes in air P down to the depth of the aquifer surface. Indirect estimates of such transmission times are given by the aforementioned data (see
Section 4) on the duration of the static groundwater level stabilization in the pits, as well as time shifts of T fluctuations in deep soils to the daily fluctuations of surface T. The range of the time shift estimates is from tens of minutes to half a day.
There are also both the theoretical and laboratory estimations mentioned above [
16,
17,
21] that confirm the finiteness of the P wave propagation speed inside the saturated porous media. For the case of the considered low-frequency oscillations, the characteristic velocities of the P wave penetration are about 1 mm/s, which is in good agreement with the abovementioned period of wave penetration to a depth of about 50 cm over a few tens of minutes or few hours. It is reasonable to assume that the atmosphere P shock leads to a violation of the initial force balance of the capillary, which then relaxes gradually during the characteristic period of a few hours.
Then, a new equilibrium state of liquid in the capillary should correspond to the change in atmospheric P at the initial moment. For a rigid capillary case, the Equations (1)–(3) are to be rewritten as:
where Δ
Pat—the change in atmospheric P. Comparing the equations under Δ
Pat < 0, we see that on the right side of Equation (5) the first term coincides with the right side of Equation (2), while the second term has a positive value. The same applies to Equations (6) and (3). Therefore, the air P drop leads to an increase in both the WL rise height and the water volume in a rigid capillary.
Let us transfer from the system with a single capillary connected with an unlimited capacity of gravitational moisture, to a closed system that includes many capillaries and a limited aquifer capacity. In such a “limited” system, an increase in the capillary water volume should be accompanied by an equivalent decrease in the water volume in the aquifer, and the aquifer surface level depression. It is enough here to consider the water balance of this “limited” system in specific values, i.e., layers. Let us introduce the capillarity coefficient
ψ, which shows the fraction of the surface area of the “limited” system covered by the cross-sections of all capillaries. We neglect the cross-sectional area of the capillary walls. In this case, the initial layer of the capillary water volume above the aquifer surface level
H is:
If lowering the atmospheric P, the mean value of the capillary water layer above the aquifer surface level would increase by Δ
H, and the aquifer surface level would equivalently drop, which could be calculated using the following system of equations:
Thus, in the “limited” system with rigid capillaries, when air P decreases (ΔPat < 0), the calculated mean capillary water layer always increases (ΔH > 0), and the aquifer surface level decreases, and vice versa.
Returning to the system shown in
Figure 12b, let us consider the reaction of a single elastic capillary, which changes its shape when the balance of forces on the walls is disturbed. Following the scheme presented in
Figure 12b, with a drop in atmospheric P at the meniscus, the external P on the walls of the capillary inside the soil remains the same, and the elastic capillary should somewhat shrink as a result of this. To simplify as much as possible, we assume that the capillary’s deformation occurs only in the horizontal directions, i.e., only its diameter changes while its cylindrical shape is kept strictly the same. According to Hooke’s fundamental law, it should be assumed that small changes in air P correspond to small changes in the circumference (and diameter) of the capillary cross-section:
where
λ is a coefficient characterizing elasticity (the reciprocal of body rigidity after Landsberg [
31]). In this case, the analogs of Equations (4)–(6) are rewritten as follows:
Comparing Equations (11) and (5) at ΔPat < 0, we see that the capillary rise height in an elastic capillary is greater than in a rigid one, since the first term on the right-hand side of Equation (11) is greater than in Equation (5), and their second terms coincide. On the contrary, the volume of capillary water at ΔPat < 0 in an elastic capillary is always less than in a rigid one. On the right side of Equation (12), the first term coincides with the same in Equation (6), the second term has a negative value, and the third one corresponds to the second term in Equation (6), but its value is smaller.
A fundamental question is whether the volume in an elastic capillary at Δ
Pat < 0 can be less than the initial volume before the air P change. Comparing Equation (3) and Equation (12), we see that this condition takes place if the two last terms of Equation (12) are negative in the sum:
When applying the admissible simplifications, we obtain this condition in the form:
The left side of this inequality could be considered as a quadratic expression both for variable λ and for ΔPat. Relating to the expression coefficients, the corresponding quadratic equation has two roots separating three intervals of possible solutions with different signs. That is, in general, there is at least one interval where the condition of Equation (14) is fulfilled.
Thus, at certain values of the parameters, the reaction of a “closed” system with elastic capillaries to a change in atmospheric P can be reversed: a decrease in the volume of capillary water and an increase in the WL in an underlying aquifer. Moreover, such a reverse reaction is due to the capillary properties; a large initial diameter and high capillary elasticity are favorable for its manifestation. Finding the analytical solution for this condition in a form similar to Equations (7) and (8) seems to be impractical. This will require very complicated mathematical procedures, and the result would most likely not be realistic enough considering the applied schematization and simplifications.
In particular, the simplest schematization of elastic deformation in Equation (9) is valid only for small deformations; it would be more adequate to assume that the capillary rigidity increases as it contracts. In this case, the mathematical formulation of the solution would change, but the qualitative conclusion about the possibility of a reverse response—an increase in the groundwater level as a response to atmospheric P decrease—would remain. It seems enough to show here that even an extremely simplified system with elastic capillaries would exhibit relatively complicated dynamics with the possibility of direct and inverse responses to the same decrease in air P. For rigid capillaries, as shown above, only a direct response is allowed—a decrease in the WL in the underlying aquifer as a response to an air P drop.
6. Discussion
It should be emphasized that the schematic cases described above do not represent an exact physical model of the hydrophysical processes in peat and peaty soils. The construction of such models is a task of the highest degree of complexity. Our goal is to show that the extremely simplified model with elastic capillaries reveals complicated behaviors covering the range of observed manifestations of the baric effect. Of course, real and many times more complex hydrophysical systems would demonstrate behavior that is much more complicated. Therefore, the analysis presented in
Section 5 can be considered as a conceptual verification of the entire set of data obtained by the authors on the studied effect. Such a verification seems necessary due to the limitations, imperfections, and heterogeneity of these data. It has been established that the various observed reactions of aquifers in peat and peaty soils can be qualitatively explained based on a simple and physically grounded hypothesis. That is, the discussed baric effect should be considered a real phenomenon that requires further research.
At the same time, the degree of adequacy and practical usefulness of the presented concept of the effect is not yet clear, which determines the main direction of the further development of the problem. The proposed concept can be called strictly local, since it considers the change in the equilibrium state of a single capillary, rigid or elastic, i.e., the dynamics is literally “at the point”. Such a description could be generalized for spatially distributed objects, up to the river basin scale, by selecting the effective values of parameters. However, there are no grounds to assert this yet.
It is not excluded that the explanation of the observed aquifer reactions to changes in air P should be sought in processes of other scales—within an extended peat massif with spatially homogeneous properties, or within a whole slope, within which the suprapermafrost aquifer would retain continuity and hydraulic connectivity. In these cases, the effect of many additional factors should be considered [
30,
32,
33,
34] et al. They are the load from the overlying peat layers; soil gases migration; the complicated morphology and elastic properties of peat, and different values of density and permeability of peat layers; the fact of the horizontal compression of peat mass and hydraulic P from top to bottom along the slope; the presence of sealed pores that react to air P changes differently to open ones; the possibility of the transition of pores from capillary ones to macropores, and vice versa, during elastic deformations of a peat body; and others as well. The variable balance of forces in the peat bog aquifer has been described in detail, for example, by K.E. Ivanov [
23], but without applying it to the dynamics of runoff from mirelands.
The above enumeration provides a general idea of the considered system’s complexity and the effort required to develop a sufficiently complete model of the phenomenon. In this regard, let us consider the main contradictions in the baric effect manifestations we recorded, which are to be explained.
The first contradiction is seen in the results of the two field experiments. In the first, on 2–3 July, a significant, synchronous, or rationally linked (which is discussed in more detail below) cyclical change was recorded in the aquifer WL within a catchment area of several tens of km2. This in itself indicates that the likely cause of that change was a meteorological impact—a cyclonic drop in atmospheric P. In the second experiment, on 1–3 September, the suprapermafrost aquifer showed no response to a similar impact. The conceptual model of the baric effect described above admits, in principle, the absence of a WL response to air P changes, but only in the boundary state, which is unstable and unlikely even for a single capillary. Practically, it is impossible to reveal such a state for an extensive peat deposit; therefore, this is unlikely to be the reason behind the results of the second experiment.
The obvious cause behind the absence of the aquifer’s response to air P variations during the second experiment was the alteration of the experimental conditions. The completion of the soil thawing, followed by the subsidence and compaction of the active peat layer, led to a rupture of the suprapermafrost aquifer’s continuity due to increased spatial variability of the thawed soil depth from 3–5 cm in June to 15–20 cm in September. The aquifer WL also decreased below the peat horizon into sandy loam and loamy deposits that have low hydraulic permeability and hindered water seepage rate. Therefore, the varying groundwater table bounded by the peat deposits favors the baric effect in loose water-bearing sediments with a good seepage rate and with high moisture gradients in the peat soil profile.
The second and key contradiction in the observed data is the multidirectional response of the groundwater level to air P drops in field and laboratory experiments.
Section 5 demonstrates that a drop in the groundwater level with a drop in air P is a characteristic reaction of rigid capillaries, and the reverse reaction is possible for elastic capillaries and depends on the size and properties of the material of the capillaries. This explanation seems to be quite effective in the first approximation but is hardly complete.
A correct analysis of the causes of the opposite responses in field and laboratory experiments should consider the difference in conditions in which the peat body is found. In the natural state, the share of gravitational moisture in the suprapermafrost peat aquifer was small even when accounting for surface water bodies such as puddles, hollows, etc. The latter also included artificial pits in which level gauges were installed. In contrast, in laboratory experiments, a small, partially isolated peat monolith was lowered into a vessel with a larger cross-section filled with a significant volume of free water. The share of the gravitational water content in the laboratory experiment system was much greater than in a natural peat massif, both in terms of volume and in terms of the areas of free surfaces that can critically affect the results.
In addition, in a natural peat body, the rigidity and degree of peat mass fixation are significantly higher against the peat body used in laboratory experiments, due to the continuity and lateral compression of the peat cover in the natural occurrence. The laboratory peat sample was freed from lateral compression and in fact did not fully retain the shape and volume of its natural constitution. Therefore, rheological properties is important for this case, as well as the swelling of the substrate when moistened. This is frequently considered in soil engineering: a priority is given to field soil testing, and in laboratory soil testing, various devices are used [
28] to reproduce the lateral P. Indeed, the suggestion that the capillaries of peat soils in their natural bedding are more compressed and behave rigidly (weakly elastic), and under laboratory conditions “open up” with an enlargement of their diameters and elasticity, seems quite rational and deserves verification.
Certain features of the baric effect in the first field experiment are an indirect confirmation of its explanation described in this paper. As seen in
Figure 6, the WL response record was most prominent in pit No. 2, located in the hillside of the slope hollow. The other observations in the drainage network elements (hollow-stream-river) demonstrate a different degree of the blurring and transformation of this response. At the same time, a shift of the baric effect over time was observed at different points of the basin, which is naturally explained by the influence of flow travel times along the drainage network.
The calculation of the sliding correlation coefficients of the WL variations at the outlet and at the three upstream gauge points, allowed the time shift value corresponding to the correlation maxima to be estimated, that is, for the travel time values to be determined. The values from the Yagodny Creek gauge station down to the outlet in the Ugolnaya-Dionisia River were estimated as ten hours, those from pit No. 1 in the hollow down to the outlet were estimated as 12.5 h, and those from pit No. 2 on the hillslope down to the outlet were estimated as 17 h. Thus, the observation data corresponds to the image of the hydrological event that occurs “at the point” (soil profile), but synchronously over the entire catchment area. Indeed, the air-P-driven effect thus also occurs at the river basin level, in rational accordance with the regularities of water migration to the outlet section.
7. Conclusions
Within shallow peat and peaty tundra soils of the Anadyr Lowlands, Chukotka Peninsula (Northeast Russia), in a suprapermafrost aquifer, we detected the effects of atmospheric P variations on WL. In addition, this effect was revealed in the runoff dynamics of the lowland 1st–4th orders streams. This phenomenon’s manifestations can differ depending on the conditions; in particular, they can be differently directed. In any case, the changes in the level and storage of suprapermafrost water take place because of synchronous (in phase opposition) changes in the capillary water capacity of soil horizons above the groundwater table.
Our main hypothesis to explain the observed phenomena is presented as a conceptual model based on the analysis of force balance and water balance in a system of elastic capillaries. The model qualitatively reproduces the main observed cases of the response to air P changes. The model is not considered a complete and perfect one, but it still proves the effect itself and suggests the likely localization of its mechanisms; indeed, some relevant properties are typical for organic soil horizons.
The circumstances for the manifestation of a baric effect in subsurface tundra aquifers seem to include the shallow suprapermafrost groundwater table being in contact with the peat base, as well as the incomplete (below the full moisture capacity) water saturation of peat soil horizons. The conditions favoring the baric effect in a soil profile appear to involve a high elasticity, high and variable values of pore and capillary moisture capacity and water yield of peat and moss cover, and, at the catchment scale, a high proportion of coverage by these types of soil.
The significance of the identified phenomenon in river runoff formation is still unclear and requires additional studies. At the same time, since the properties of peat soils induce this mechanism, we can suppose a wide enough occurrence of the phenomenon over the tundra zone as well, i.e., in any river basins with significant peat wetland areas. The importance of such studies in terms of soil hydrology is evident because of its potential ecological significance. In peat soils, the baric effect can play an important role in the water regime of the root zone during vegetation and moss cover moistening periods.

 ,
, 


