
Validation of the Sustainable Development Goal 6 Monitoring Structures across East and Southern Africa Using Fuzzy Logic Analysis

1
UNICEF East and Southern Africa Regional Office (ESARO), Nairobi P.O. Box 44145-00100, Kenya
2
WASH Consultant, Nairobi P.O. Box 74163-00200, Kenya
3
Engineering for International Development Centre, Bartlett School of Sustainable Construction, University College London, London WC1E 6BT, UK
*
Author to whom correspondence should be addressed.
Water 2022, 14(19), 3065; https://doi.org/10.3390/w14193065
Submission received: 4 August 2022
/
Revised: 23 September 2022
/
Accepted: 26 September 2022
/
Published: 29 September 2022
(This article belongs to the Section Water Resources Management, Policy and Governance)
Abstract
:The United Nations Children’s Fund (UNICEF) and World Health Organisation (WHO) Joint Monitoring Programme (JMP) reports that only three African countries are on track to achieve universal access to at least basic water services by 2030 and only one country, Botswana, within the East and Southern Africa region (ESAR). Monitoring is crucial to advancing progress on SGD 6 in the region through providing reliable data to decision makers for policy, planning and much needed investment in the sector. This paper presents findings of the rapid assessment termed SDG 6 + 5 which relates to monitoring systems for Water Supply, Sanitation and Hygiene (WASH) in 21 countries of ESAR, five years into the SDGs. The paper presents the results of a fuzzy logic analysis applied to aspects and findings from the rapid assessment. Fuzzy logic benefits the study by managing unconscious bias from qualitative assessment and evaluating the strengths of countries’ WASH monitoring systems. The paper demonstrates similarities and variations between results from the rapid assessment and fuzzy analysis including Angola and Botswana scoring more favourably in enabling environments for monitoring from the analysis. The paper provides methods of rapid assessment of key aspects that impact on effective WASH monitoring and recommends the use of fuzzy logic to reduce data bias from qualitative methods. The methodology presented in the paper can be adapted and applied to other regions of the world and settings to enhance evaluations on the strength of systems within other sectors.
1. Introduction
The Sustainable Development Goal (SDG) for water and sanitation (SDG targets 6.1 and 6.2) states that service levels should ensure safe water and sanitation services for all, equitably and sustainably [1]. In Sub-Saharan Africa, 411 million people lack basic drinking water, 779 million lack basic sanitation and 839 million lack basic hygiene services [2]. Of the 21 countries of East and Southern Africa Region (ESAR) only one country, Botswana, is reported to be on track to achieve basic water, still short of the universal safe water target. No country is on track for safe sanitation targets [2]. These shortfalls deprive a significant portion of the region’s population a fundamental basic need and impact on other development areas including education and health. The inextricable link between water and sanitation and other SDGs, including evidence showing that sanitation can benefit all 17 Goals and 130 SDG targets [3] amplifies the pertinence of safe water and sanitation in overall sustainable development and wellbeing. Monitoring water and sanitation services is therefore critical, to not only measure progress, but also plan for asset investments and mobilise the resources and finance needed to address service provision gaps in ESAR.
Monitoring progress towards SDG 6 targets for water and sanitation, 6.1 and 6.2, requires robust data systems. Progress on WASH has been monitored and reported by the World Health Organisation (WHO) and United Nations Children’s Fund (UNICEF) globally through the Joint Monitoring Programme (JMP) for the past three decades [4]. While the global indicator framework is used to track SDG progress at the global level, the imperative is on countries to define their own national aggregate values for global SDG indicators and monitor progress on the same via their national monitoring systems [5]. The UN Global Analysis and Assessment of Sanitation and Drinking-Water (GLAAS) notes that though there is an increase in national WASH targets that echo SDG goals, monitoring progress remains constrained by factors including limited financial and human resources [5]. In Africa, the African Ministers Council on Water (AMCOW) has supported monitoring in the region under the 2015 Ngor Declaration on Sanitation and Hygiene. AMCOW notes that as of 2019, 31 countries had sanitation and hygiene monitoring systems, with 20 countries tracking SDG targets [6]. In addition to monitoring progress towards SDG6, measuring the sustainability of water and sanitation systems is essential. Using sustainability indicators such as the sanitation sustainability index (SSI) [7] affords flexibility by considering social, technical and economic aspects when evaluating service delivery systems for implementation.
The General Assembly resolution 75/212 has outlined the modalities of the outcomes of the UN 2023 Water Conference, scheduled for March 2023 [8]. Among the main outcomes is the proposed Water Action Agenda (an initiative of the conference co-hosts Tajikistan and the Netherlands) which is centred on supporting all member states and stakeholders to develop and implement voluntary commitments towards the water actions in the 2030 Agenda for Sustainable Development Goals, i.e., SDG 6. The Water Action Agenda will provide a mechanism for monitoring and follow-up of progress on the SDG commitments—member states and stakeholders reporting their progress.
Monitoring for WASH services at global and regional levels has evolved with the SDG era from a previously predominant focus on access. to now incorporate aspects that impact on sustainable service delivery including quantity, quality and reliability of services and managing the functionality of assets [9]. Infrastructure asset management (IAM), aimed at incorporating strategies to sustain public infrastructure such as roads, electricity grids, water supply and wastewater facilities relies on the availability, reliability, consistency and flow of information [10]. The purpose of asset management as a vital component of monitoring is reflected in various sectors and studies [10,11,12,13] including water and sanitation supply systems. Asset management allows utilities to understand present, near and future capital and operational investment requirements [14]. In many developed countries, ageing infrastructure is presenting a challenge to maintaining service delivery and placing financial strain on service providers. For example, the United States has in the recent past experienced problems in clean water supply in various states, owing to dilapidating infrastructure. The 2022 Clean Water and Drinking Water State Revolving Funds (SRFs) has earmarked funds targeted towards improving and upgrading the aging water systems. However, under the Clean Water Act, public utilities are required to develop a Fiscal Sustainability Plan (FSP), akin to an asset management plan.
In East and Southern Africa, these challenges and measures ought to provide foresight and corresponding action to incorporate asset management in WASH monitoring systems and structures. Africa is currently urbanising at a rapid rate-sub-Saharan Africa at 4.1%. As a result, water and sanitation services in primary cities are stressed by urban growth demands. The situation is more dire in secondary cities which often lack water and sanitation infrastructure [15]. Infrastructure development in the region is a necessity. It is estimated that infrastructure financing of between USD 55–66 billion per annum is required to meet the 2025 Africa vision of water security for all, though actual investment commitments are lagging far behind. Between 2016–2018, investment averaged USD 13 billion per year [16,17]. Securing safe drinking water, sanitation and hygiene for all in sub-Saharan Africa would require USD 35 billion per year in capital costs [18]. To balance sustaining present service delivery and future investments to extend service coverage to where it’s needed most, IAM depends on effective information management [13]. It is therefore essential for countries in ESAR to effect IAM of existing and future assets, in addition to the development of asset registries, as part of effective monitoring of WASH services in the region.
Monitoring WASH services cannot be comprehensive without consideration of global front challenges that threaten progress in realising access to safe water and sanitation, including climate change. Africa is vulnerable to the effects of climate change and there is need to understand how the region’s resilience can be improved. Certainly, there is evidence of effective climate-focussed monitoring for WASH in Africa. In Ethiopia, the Somali Functionality Inventory (SFI), initiated by UNICEF in response to emergency drought in the region in 2017, provided the underpinning for ongoing monitoring of boreholes in the region [19]. Ethiopia’s weaker water sector monitoring system coupled with its vulnerability to prolonged drought benefited from the SFI initiative that exemplified good monitoring for the sector and steered improvements in asset management. Howard et al., [20] further presents the challenge on how climate resilience is to be measured, noting the pertinence of simple monitoring frameworks in steering management systems and technologies that prioritise communities particularly in resource-poor areas.
For WASH services to be sustainable, the sector’s previous disproportionate focus on infrastructure is being reconfigured to view WASH as a system, which is comprised of a complex interaction of actors and factors [21]. The WASH system framework is composed of key building blocks and WASH systems strengthening involves ensuring these blocks are in place and functioning, to create a strong enabling environment for WASH services [21,22]. Considered as key building blocks in the WASH system, monitoring and financing are interdependent and intrinsically linked. Effective monitoring of service levels, operational performance and financial resource management provides evidence for water sector service providers to leverage for required additional financial investment to meet service deficits and expand WASH services to the unserved. Well-documented standards and targets portray viability of investment [23] yet, in many countries, resources for operational and financial monitoring are often limited.
With the SDG mid-term review at hand and only eight years left to 2030, it is important to assess how well progress is being measured and what challenges there are to monitoring progress and ultimately to securing finance for sustainable WASH services. Several previous studies have focussed on various aspects of SDG6 monitoring including the application of monitoring technologies such as remote sensing, institutional WASH and water resource monitoring for SDG 6 [24,25,26]. The challenges and opportunities for monitoring are also addressed in studies; da Silva Wells et al. [27] discusses the need for monitoring systems to apply learning processes to build capacity in the sector, Thomson and Koehler [28] note the potential to promote operational and financial sustainability of local water services through monitoring and surveillance systems. There is, however, limited published literature on the state of national monitoring systems for SDG targets 6.1 and 6.2 in the ESAR region. This paper therefore aims to contribute to addressing the literature gap in WASH monitoring, with a focus on ESAR region, but is proposed for contextual application in wider regions faced with similar challenges of inadequate access to safe and sustainable WASH services. This paper reports the outcomes of an assessment undertaken by UNICEF on ESAR countries’ WASH monitoring [29]. The study assessed how well ESAR countries are undertaking monitoring and what progress has been made towards SDG targets 6.1 and 6.2. The paper further presents the findings of the fuzzy logic analysis carried out on the assessment results and the application of the results on focus areas for effective WASH monitoring.
2. Materials and Methods
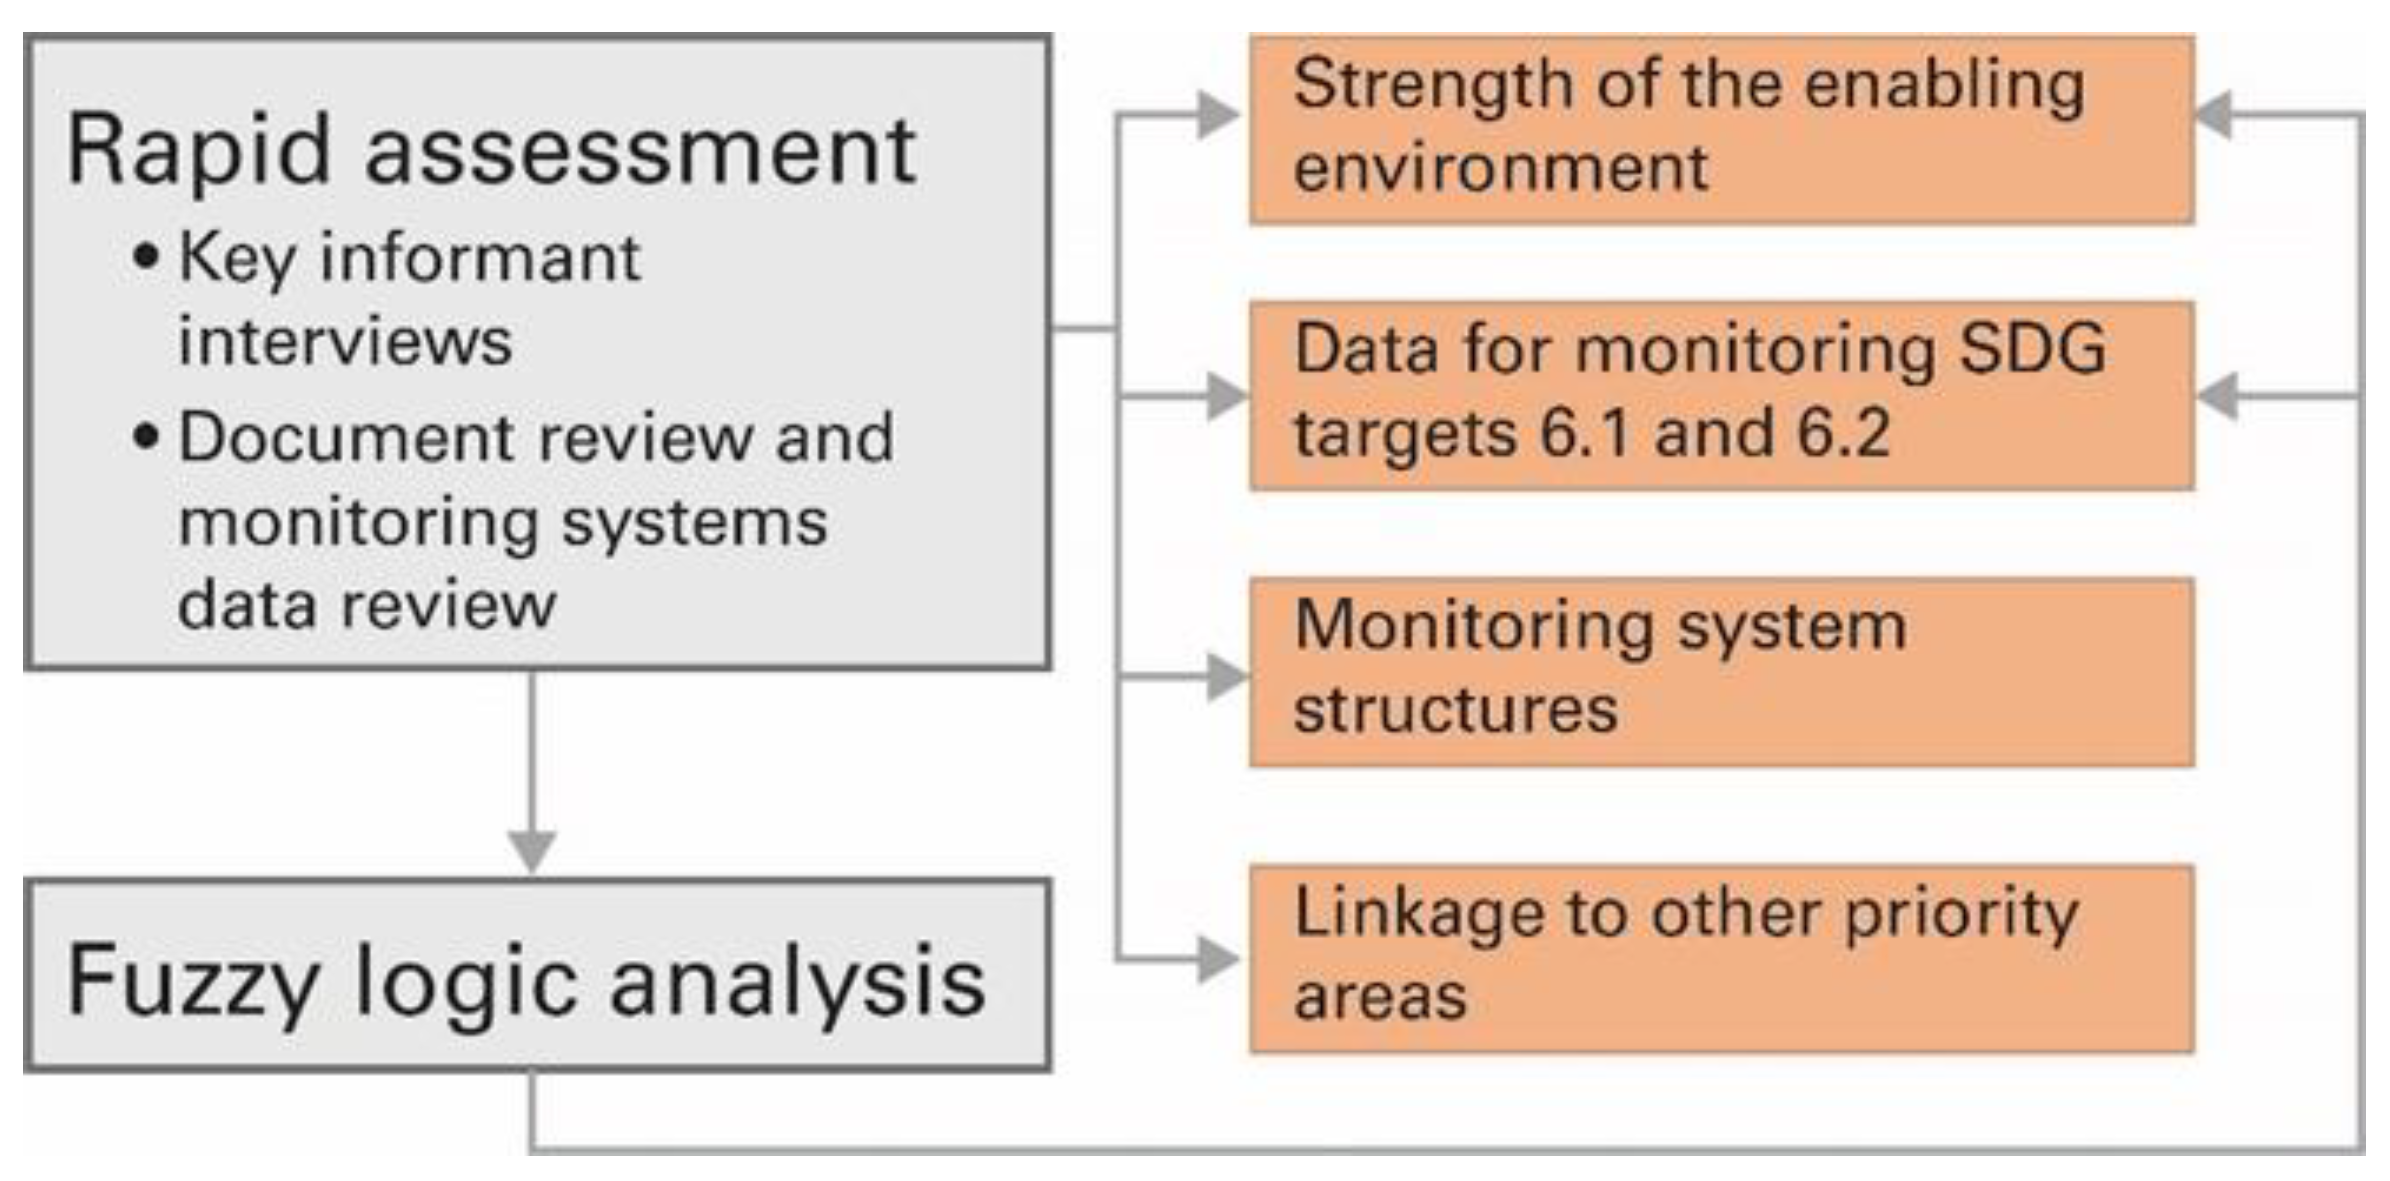
To review the progress against SDG 6 and how well this progress is being monitored in ESAR, the study reviewed the rapid assessment of monitoring systems across ESAR countries, undertaken five years into SDG implementation. The rapid assessment focussed on four main aspects:
- i.
- the strength of the enabling environment for WASH monitoring.
- ii.
- availability of WASH monitoring data along with SDG indicator alignment
- iii.
- monitoring system structures and
- iv.
- how WASH monitoring links to other priority areas.
Fuzzy logic analysis was then applied to the results from the four-aspect rapid assessment of the monitoring systems in ESAR. The analysis results were compared against those from the assessment findings. Figure 1 summarises the study’s methodology.
2.1. Rapid Assessment
The rapid assessment covered 20 of 21 ESAR countries, with Comoros’ data, which were collected later, not included in the analysis. Key informant interviews (KIIs) were conducted with in-country informants across the 20 ESAR countries for the rapid assessment data. This included government entities tasked with WASH monitoring and UNICEF country offices. To supplement data from the KIIs, document reviews of existing data in accessible monitoring systems were conducted. The documents included monitoring reports and documents on the design and operation of the existing monitoring systems.
For each of the four aspects, the rapid assessment collected information across elements, selected based on their relevance in understanding monitoring SDGs and the availability of data within the assessment timeframe. Table 1 presents a description of each aspect, the basis of element selection and the elements assessed under each aspect.
2.2. Fuzzy Logic Analysis
Fuzzy logic was applied to assess the aspects used in the rapid assessment in determining the strength of countries WASH monitoring systems. Conceptualised in the 1960s, fuzzy logic has been widely used in systems outputs and decision-making [11,31,32]. Fuzzy logic qualitative comparative analysis has also been used to explore collaborative approaches for WASH in East Africa [33]. Based on “degrees of truth”, fuzzy logic assigns to a linguistic statement a value between a specified range, usually 0 to 1, with 0 being fully false and 1 being fully true of the statement. Values between quantify the extent of truth or false of the statement. The four steps applied in fuzzy logic are (1): input variable fuzzification—the linguistic variables are defined, and membership functions are created. (2) rule construction using the IF-THEN logic, (3) aggregating the rules output and (4) defuzzification. The output of defuzzification is a crisp number [32,34].
The application of fuzzy logic in performance evaluation presents the approach’s advantage including the ability to utilise vague or subjective information to provide a statistically determined decision [35]. Similarly, the fuzzy analysis benefits this study by applying statistical methods, thus managing uncertainties and unconscious bias from the assessment.
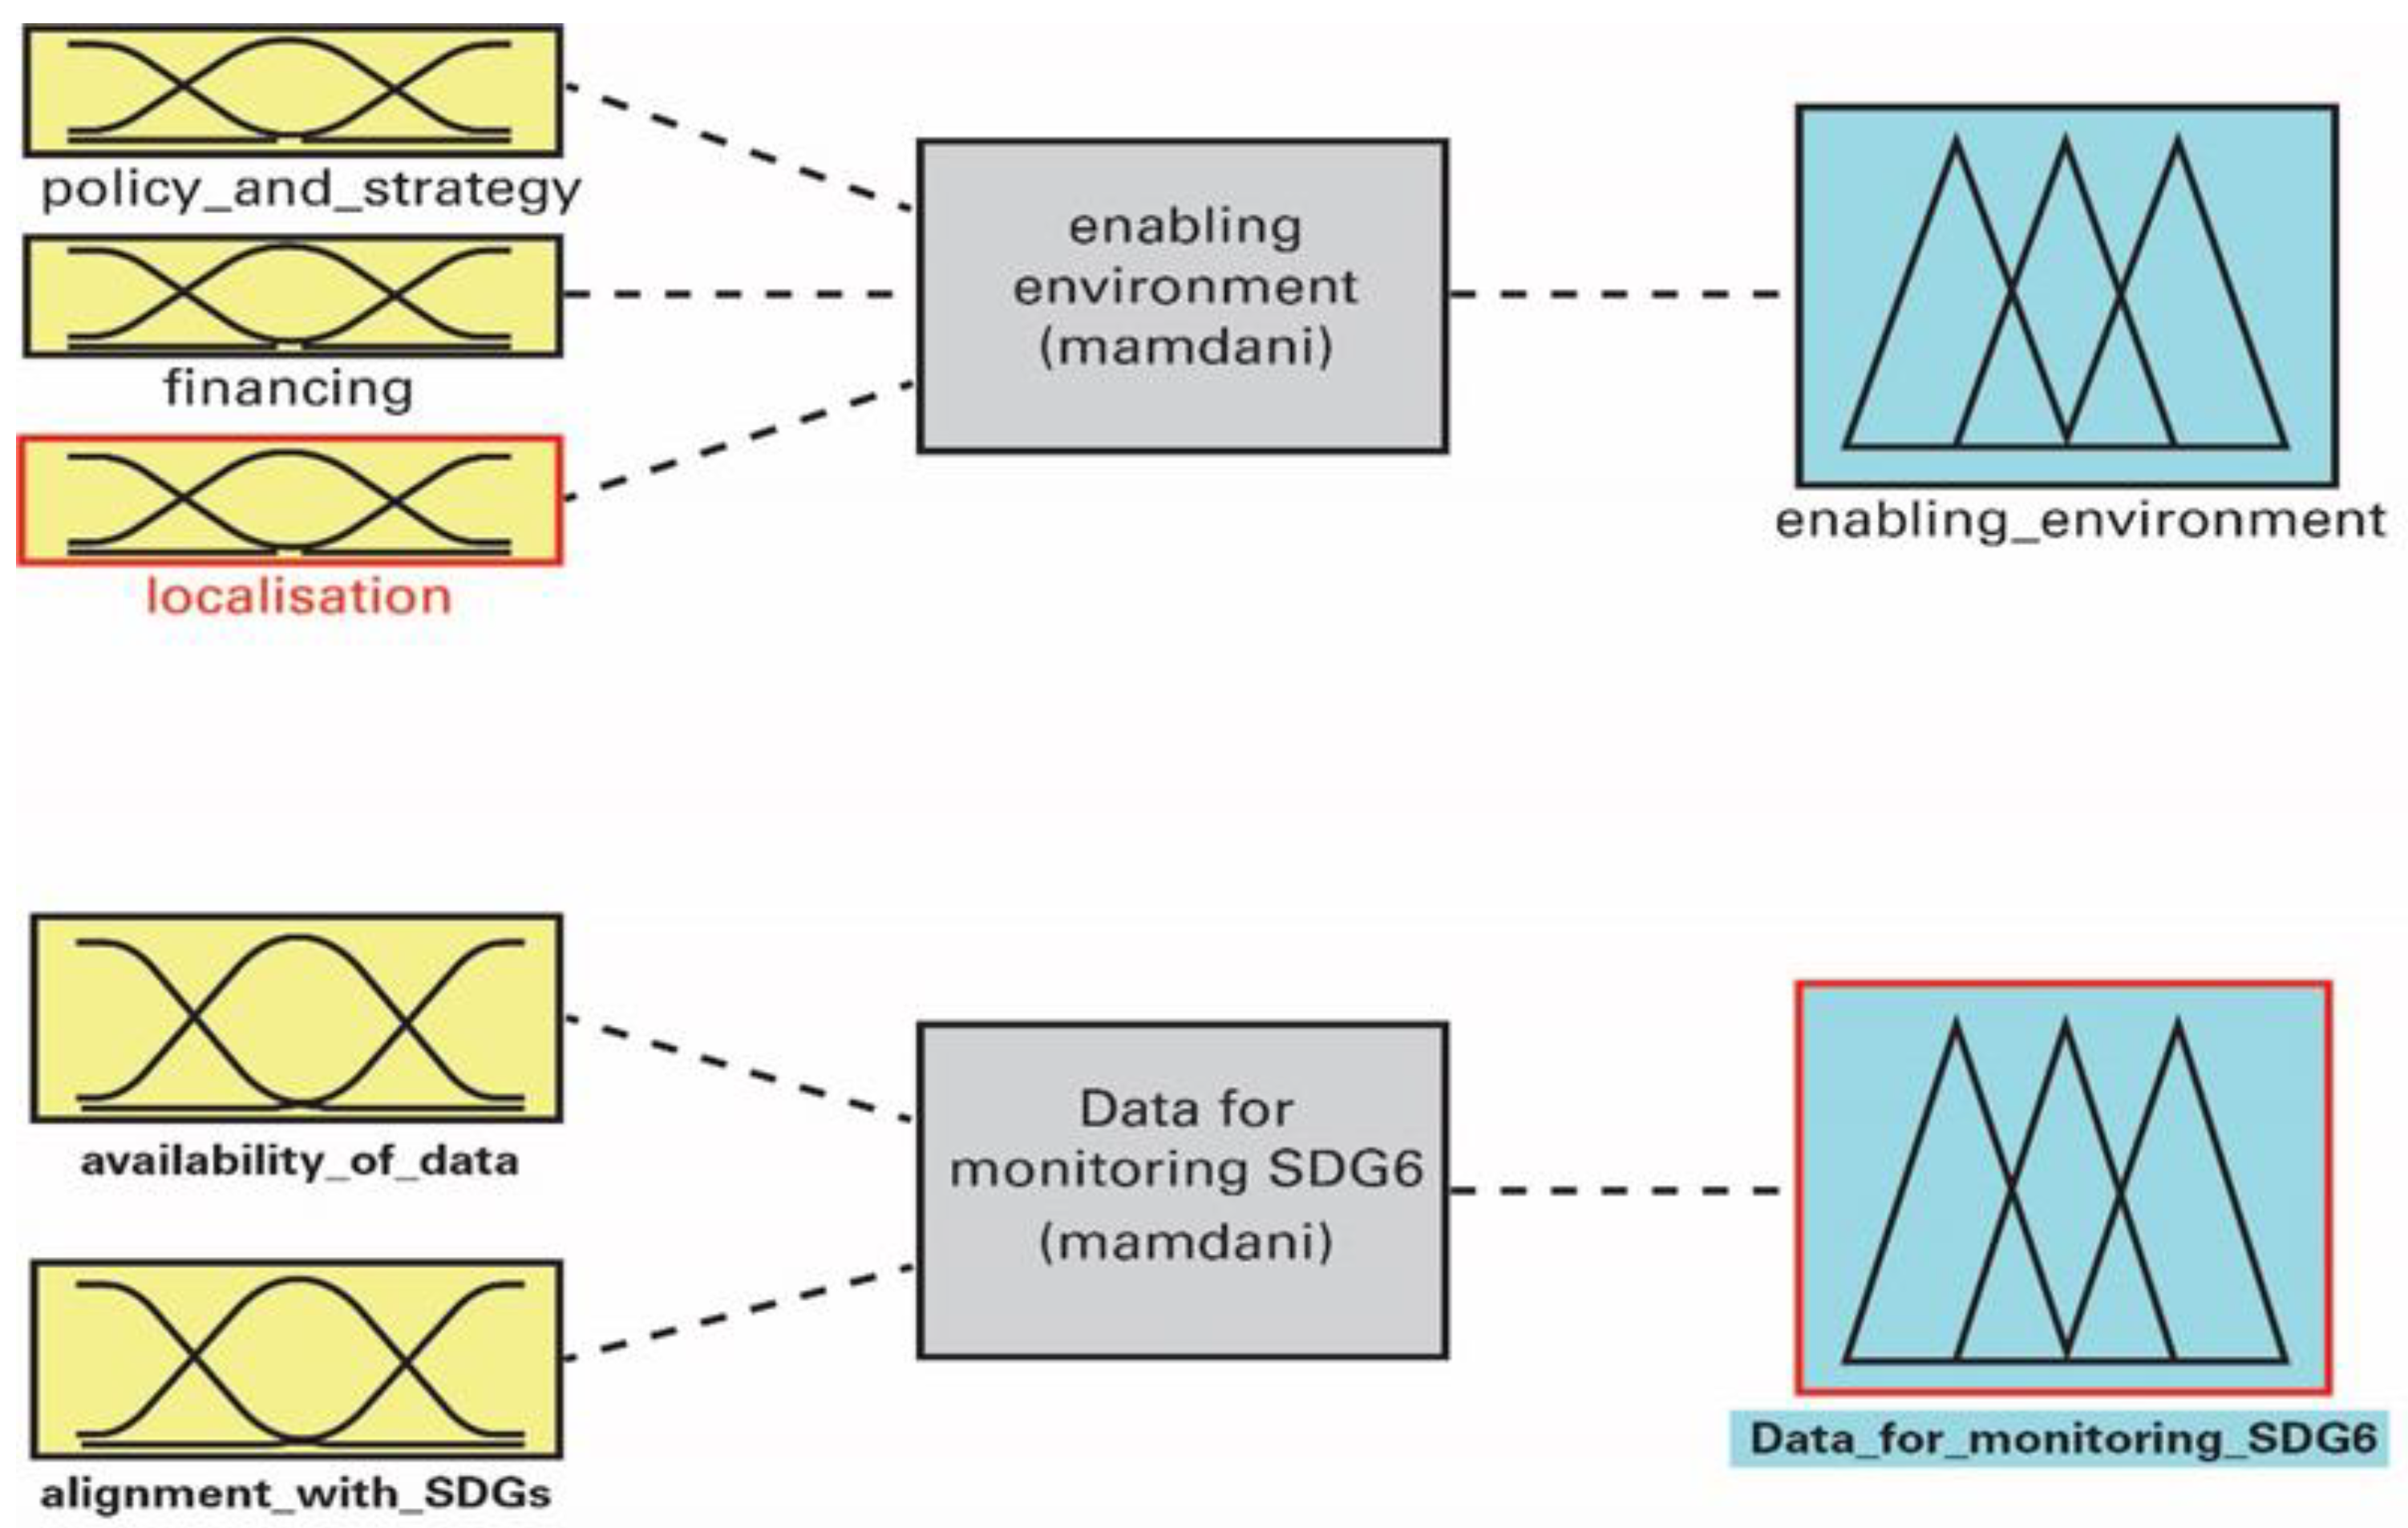
To determine the criteria and their corresponding input variables for the fuzzy logic analysis, the study initially considered all four assessment aspects as the four primary variables/factors for the fuzzy logic. However, owing to the limited data in scoring for the fourth factor—linkage to WASH priorities—this factor was rescinded. Hence, from the three remaining factors, a WASH monitoring hierarchy model was developed as shown in Figure 2.
Following review of the three factors, the study selected two factors for development of the fuzzy model and the fuzzy logic analysis on MATLAB. That is the enabling environment and data for monitoring SDG 6. For each factor, two to three priority elements from the rapid assessment were selected as sub-factors, termed input variables, for the analysis. To minimise complexity, the analysis applied triangular and trapezoidal membership functions. Each input variable (sub-factor) was assigned classifications and their membership functions plotted as trapezoidal or triangular functions. The classifications used were assimilated from the rapid assessment definitions and findings. Thus, for the enabling environment factor, classifications were assigned as limited, satisfactory, good. For the alignment with SDG variable factor, classifications were assigned as limited, partially aligned (for alignment with MDG shared/SDG limited or SDG basic) and fully aligned.
Two models were then developed—one for the enabling environment factor and the other for data for monitoring SDG 6 factor. For each model, a rule set was defined, and each variable assigned a weighting, based on sector expert experience input and sector requirements for effective WASH monitoring systems. The sum of weightings of variables being unity. For example, the sum of weightings allocated to the variables of sector policy and strategy, sector financing and localisation under the enabling environment factor is unity. The analysis was then run to develop the fuzzy models and fuzzy analysis for each of the two factors.
3. Results
3.1. Rapid Assessment
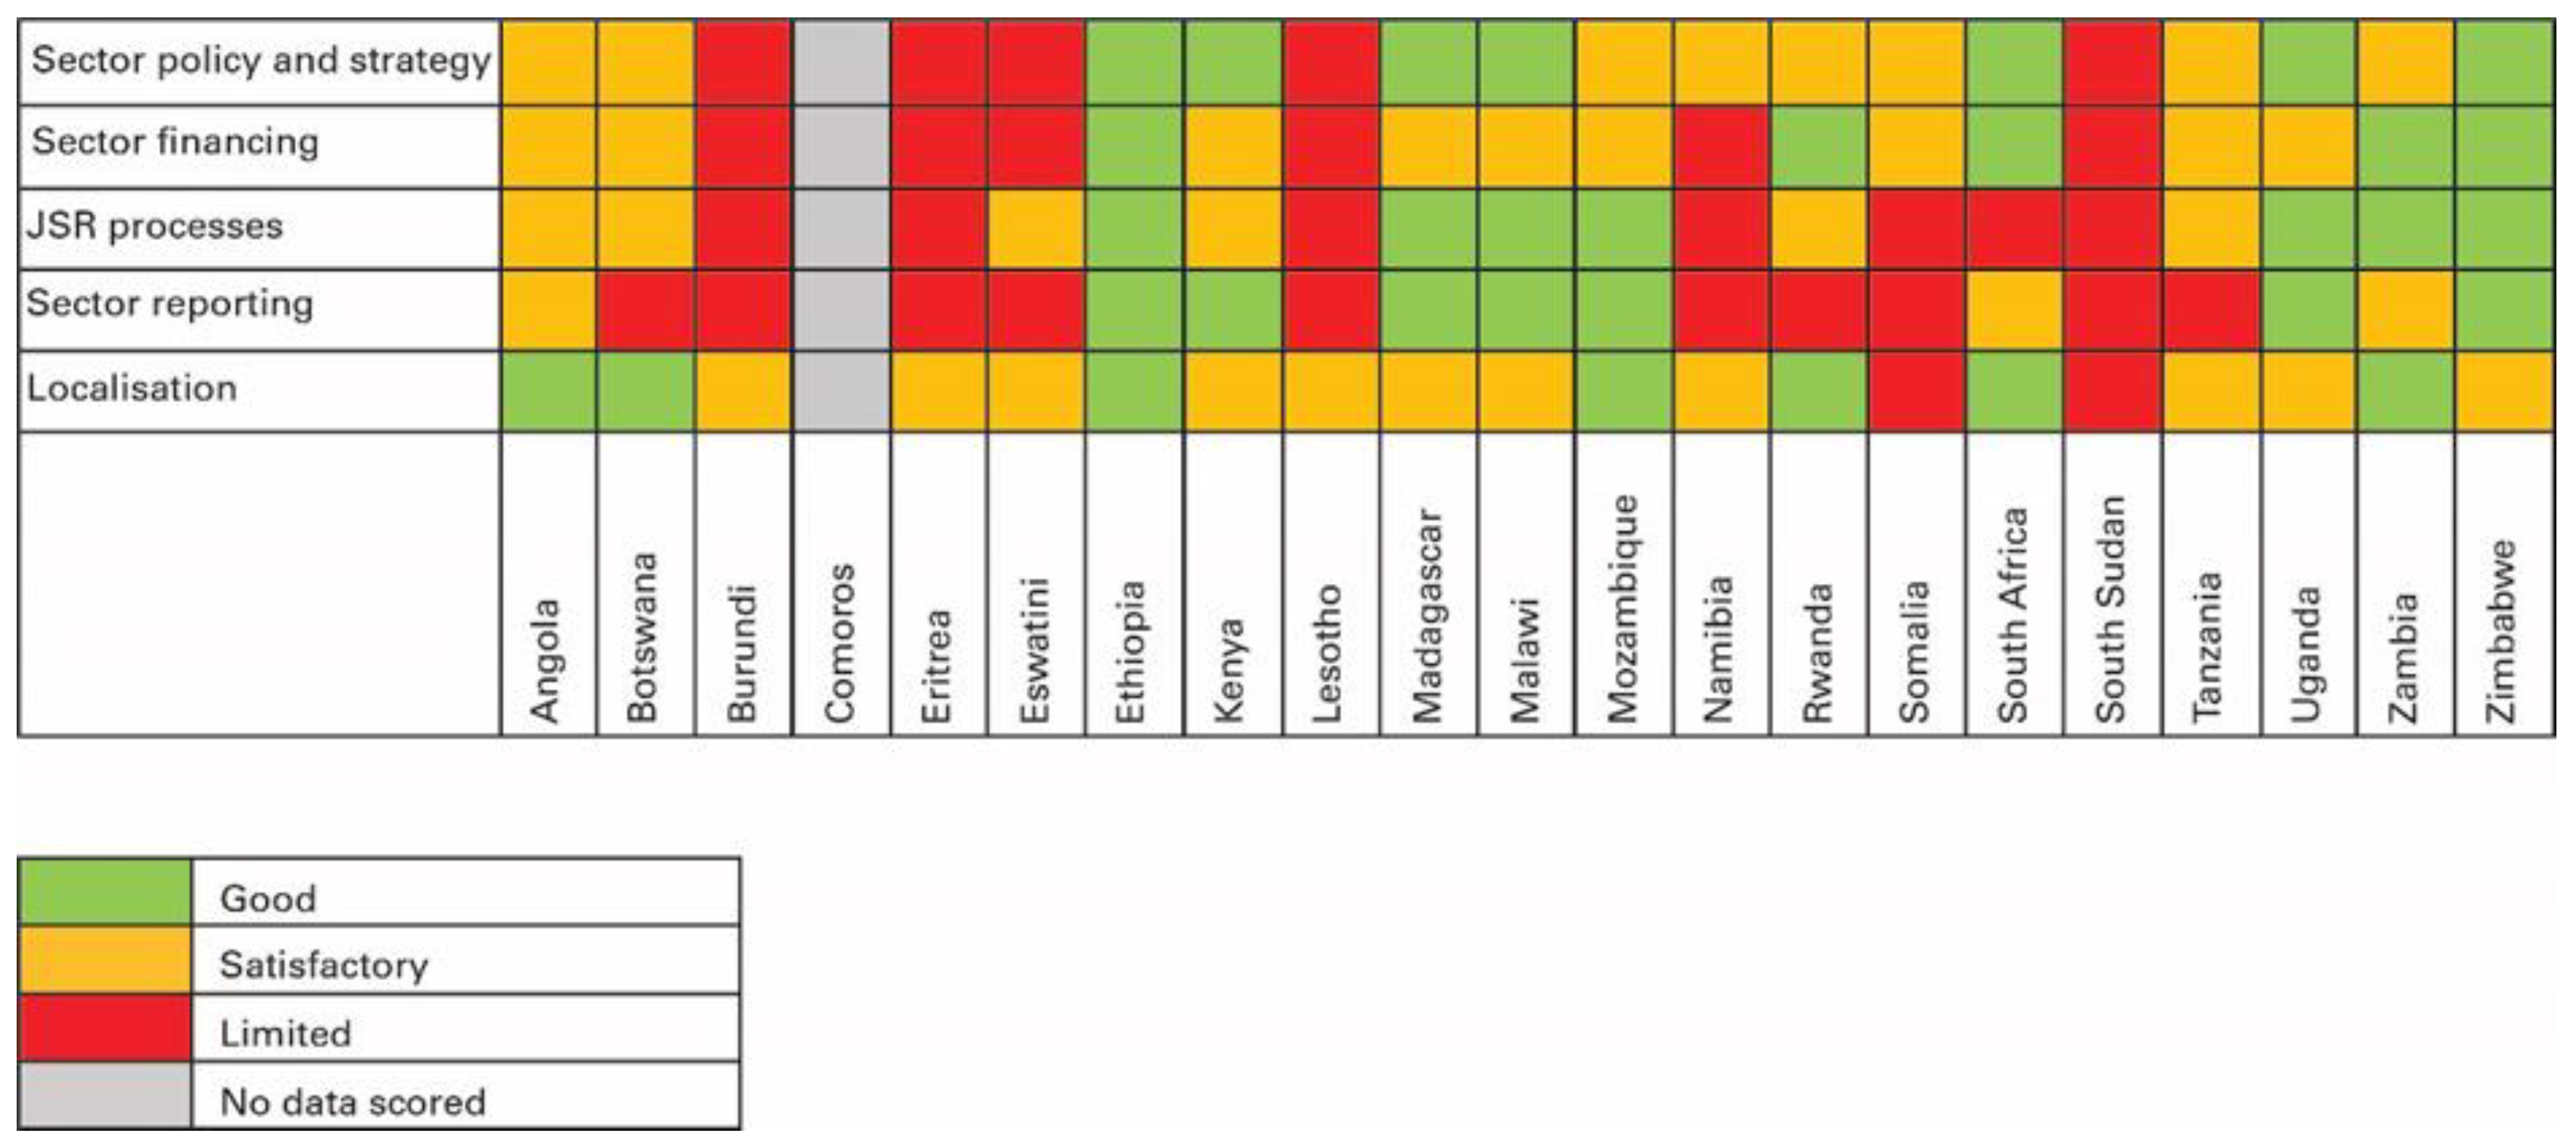
The results of 20 ESAR countries’ assessment of the enabling environment for WASH monitoring are summarised in Figure 3 and Figure 4.
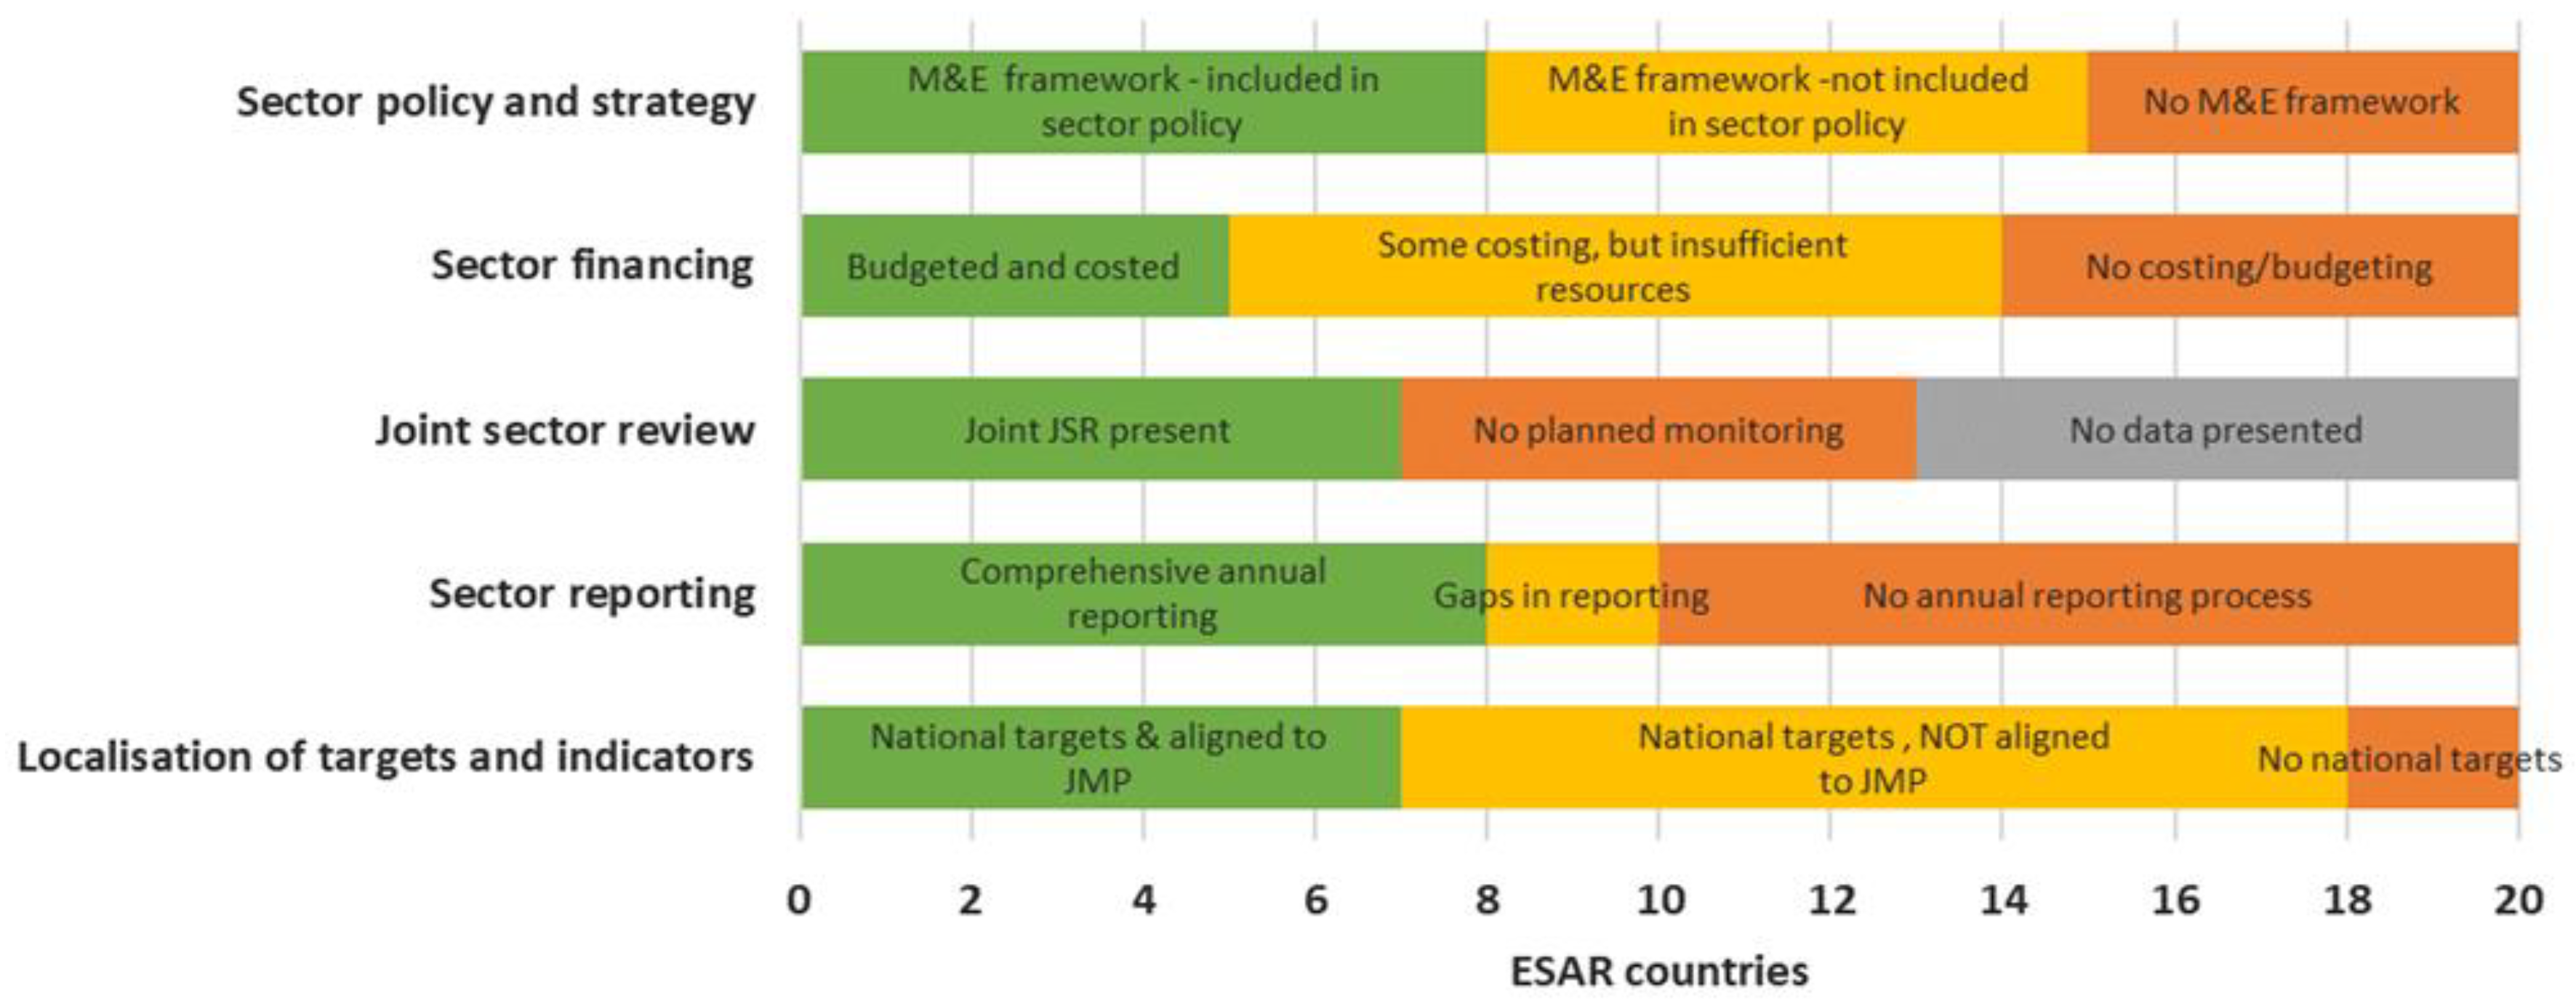
The assessment identified that 15 countries had a monitoring and evaluation framework for WASH; seven countries’ frameworks were updated and aligned with national policies for WASH—Ethiopia, Kenya, Madagascar, Malawi, South Africa, Uganda and Zimbabwe, and the remaining eight countries frameworks (Angola, Botswana, Mozambique, Namibia, Rwanda, Somalia, Tanzania and Zambia) were either out of date or not included in the national policy. However, five countries did not have a M&E framework for monitoring WASH under SDG 6.
In regard to sector financing for monitoring, five of the 21 ESAR countries had WASH monitoring budgeted for, with resources allocated. Nine countries, though having some form of budget towards monitoring were found to still lack sufficient resources for monitoring. Joint sector review (JSR) processes are instrumental as results from these reviews are used for planning and financial resource allocation. Only nine countries applied JSR for access to WASH. In Rwanda, JSR reviews as outlined by law, are conducted bi-annually.
Ten ESAR countries do not have annual reporting processes for WASH. Two countries report on some areas of WASH, albeit with gaps in reporting frequency and content. The study found that only eight ESAR countries have complete annually reporting processes. On localisation of SDG targets and indicators, most ESAR countries have national targets for SDG 6, except for two countries (Somalia and South Sudan) without national targets (Figure 3). This was largely corresponding with the findings of the 2019 Global Analysis and Assessment of Sanitation [5].
The second aspect, the availability of data and the extent to which the countries’ WASH monitoring systems data aligns with the JMP indicators was assessed for water, sanitation and hygiene. The results input to countries’ understanding of their progress towards SDG 6 at national and sub-national level. Figure 5 summarises per country findings on data monitoring for water, sanitation and hygiene. The rapid assessment used the term ‘Basic+’ for systems which presented all the elements of the basic service level and also included at least one element of safely managed services.
On the structure of monitoring systems, the study identified 22 routine monitoring systems across 15 ESAR countries—Botswana, Eswatini, Ethiopia, Kenya, Madagascar, Malawi, Mozambique, Rwanda, Somalia, South Africa, South Sudan, Tanzania, Uganda, Zambia and Zimbabwe. The remaining five ESAR countries did not have routine WASH monitoring systems. Of the identified routine monitoring systems, only two systems were survey-based, the rest being information management systems. Six systems covered water, sanitation and hygiene, ten cover water only, and five cover sanitation and hygiene Most systems covered both urban and rural areas, though only three systems incorporated WASH in non-community settings.
The assessment’s findings on accessibility, use, management and human and financial resource availability for the monitoring systems structures of 15 ESAR countries identified that data management scored high. As of 2020, at least 14 systems across 12 countries had updated data systems—Botswana, Ethiopia, Madagascar, Malawi, Rwanda (whose baseline data is from 2020), South Africa, South Sudan, Tanzania, Uganda, Zambia and Zimbabwe. Access to data is, however, still limited. Impacting on monitoring was the availability of adequate financial resources. In areas where resources are availed, monitoring systems were updated. Inversely, where resources were limited, the data were not up to date and/or of limited quality. Scoring poorly and presenting a significant challenge to monitoring was the availability of skilled human resource to manage the monitoring systems and effect reliable monitoring. Only four systems in Botswana, Ethiopia, South Sudan and South Africa, were observed to not be considerably limited in capacity.
The assessment’s fourth aspect looked into how monitoring systems linked with other WASH priorities. The assessment of the 20 ESAR countries found that 15 countries monitored humanitarian WASH. In three countries, South Sudan, South Africa and Uganda, monitoring for humanitarian contexts aligned with development contexts, the rest of the countries with humanitarian settings within being separately monitored. On IWRM, while ten countries highlighted water stress in their monitoring, only South Africa has incorporated this element into WASH monitoring.
3.2. Fuzzy Logic Analysis
Fuzzy logic analysis was applied to two aspects (factors)—the enabling environment and data for monitoring SDG 6—with a fuzzy model developed for each aspect. For each factor, two to three priority elements from the rapid assessment were selected as sub-factors for the analysis. These sub-factors were applied as the input variables for the fuzzy modelling in MATLAB. Hence, the input variables of sector policy, sector financing for monitoring and localisation of SDG 6 were used to determine the output variable- strength of the enabling environment for WASH monitoring. Similarly, input variables of data availability and data alignment with SDGs were analysed for the output—quality of data for monitoring SDG6 (Figure 6).
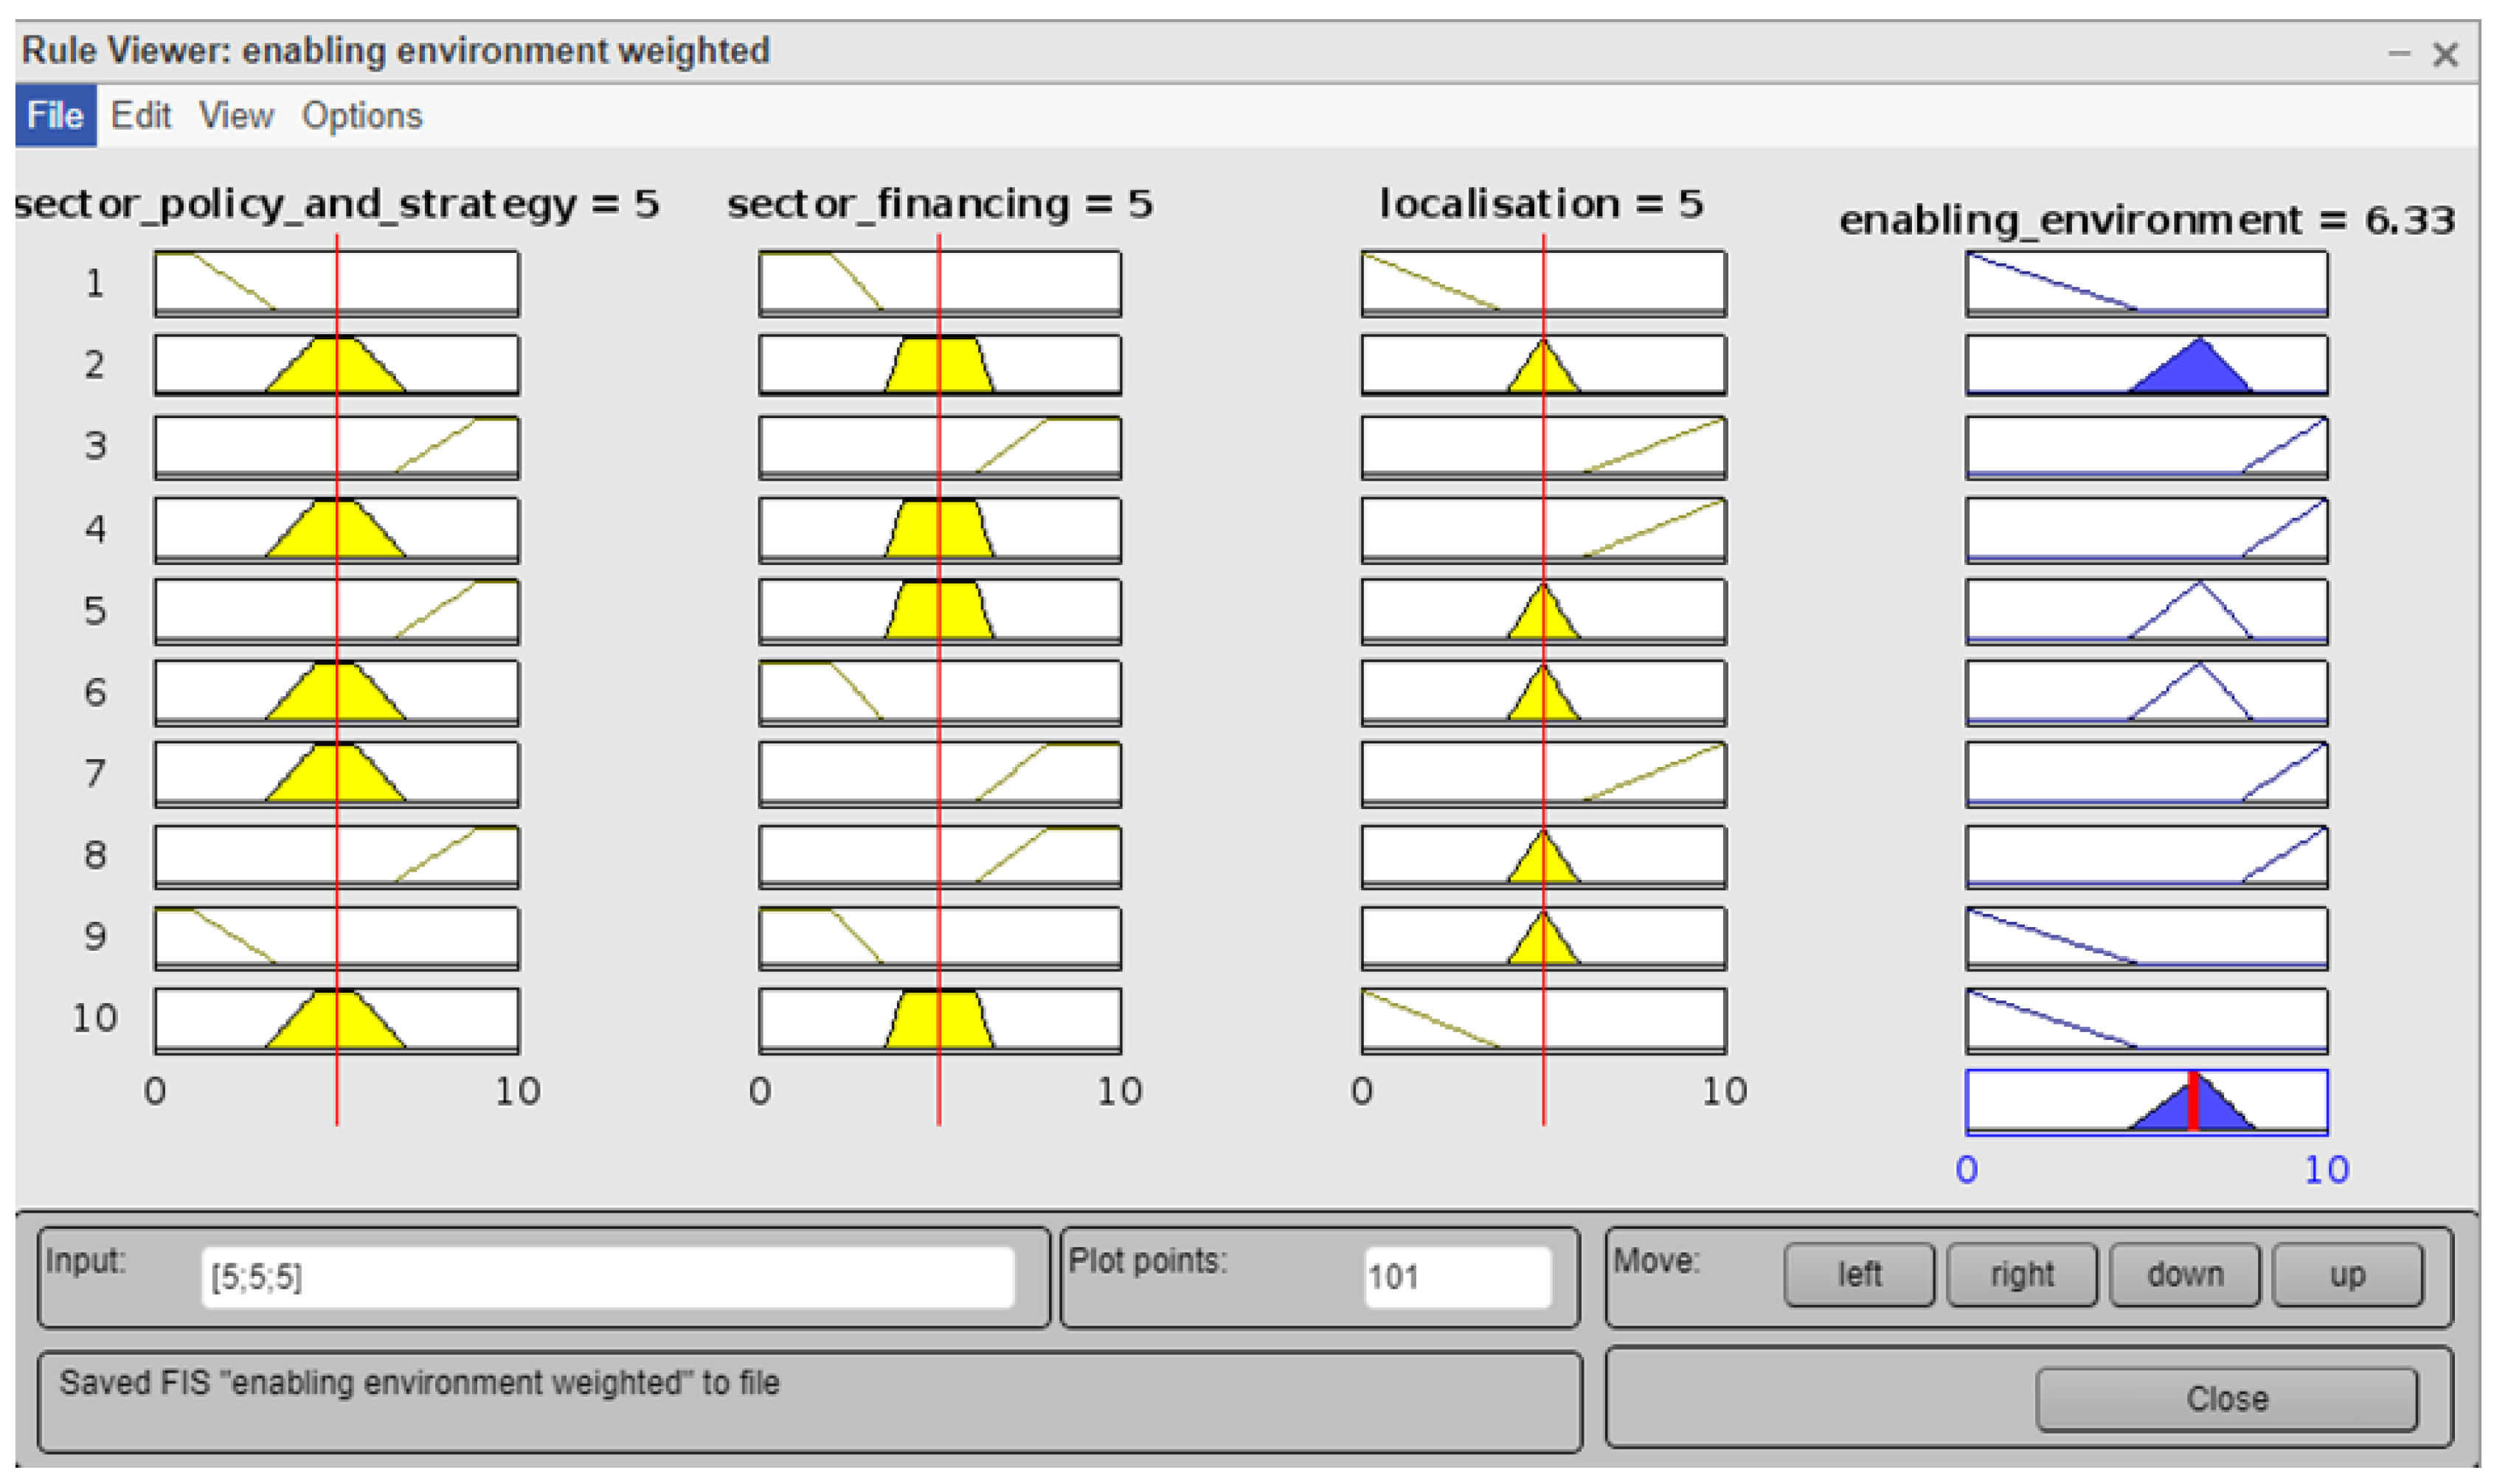
For each model, a set of rules was defined, and each variable assigned a weighting, based on sector expert input. An example of the 10 rules applied for the enabling environment analysis is shown in Table 2. The fuzzy logic models were then used to assess each ESAR country (Figure 7) applying the findings from the rapid assessment.
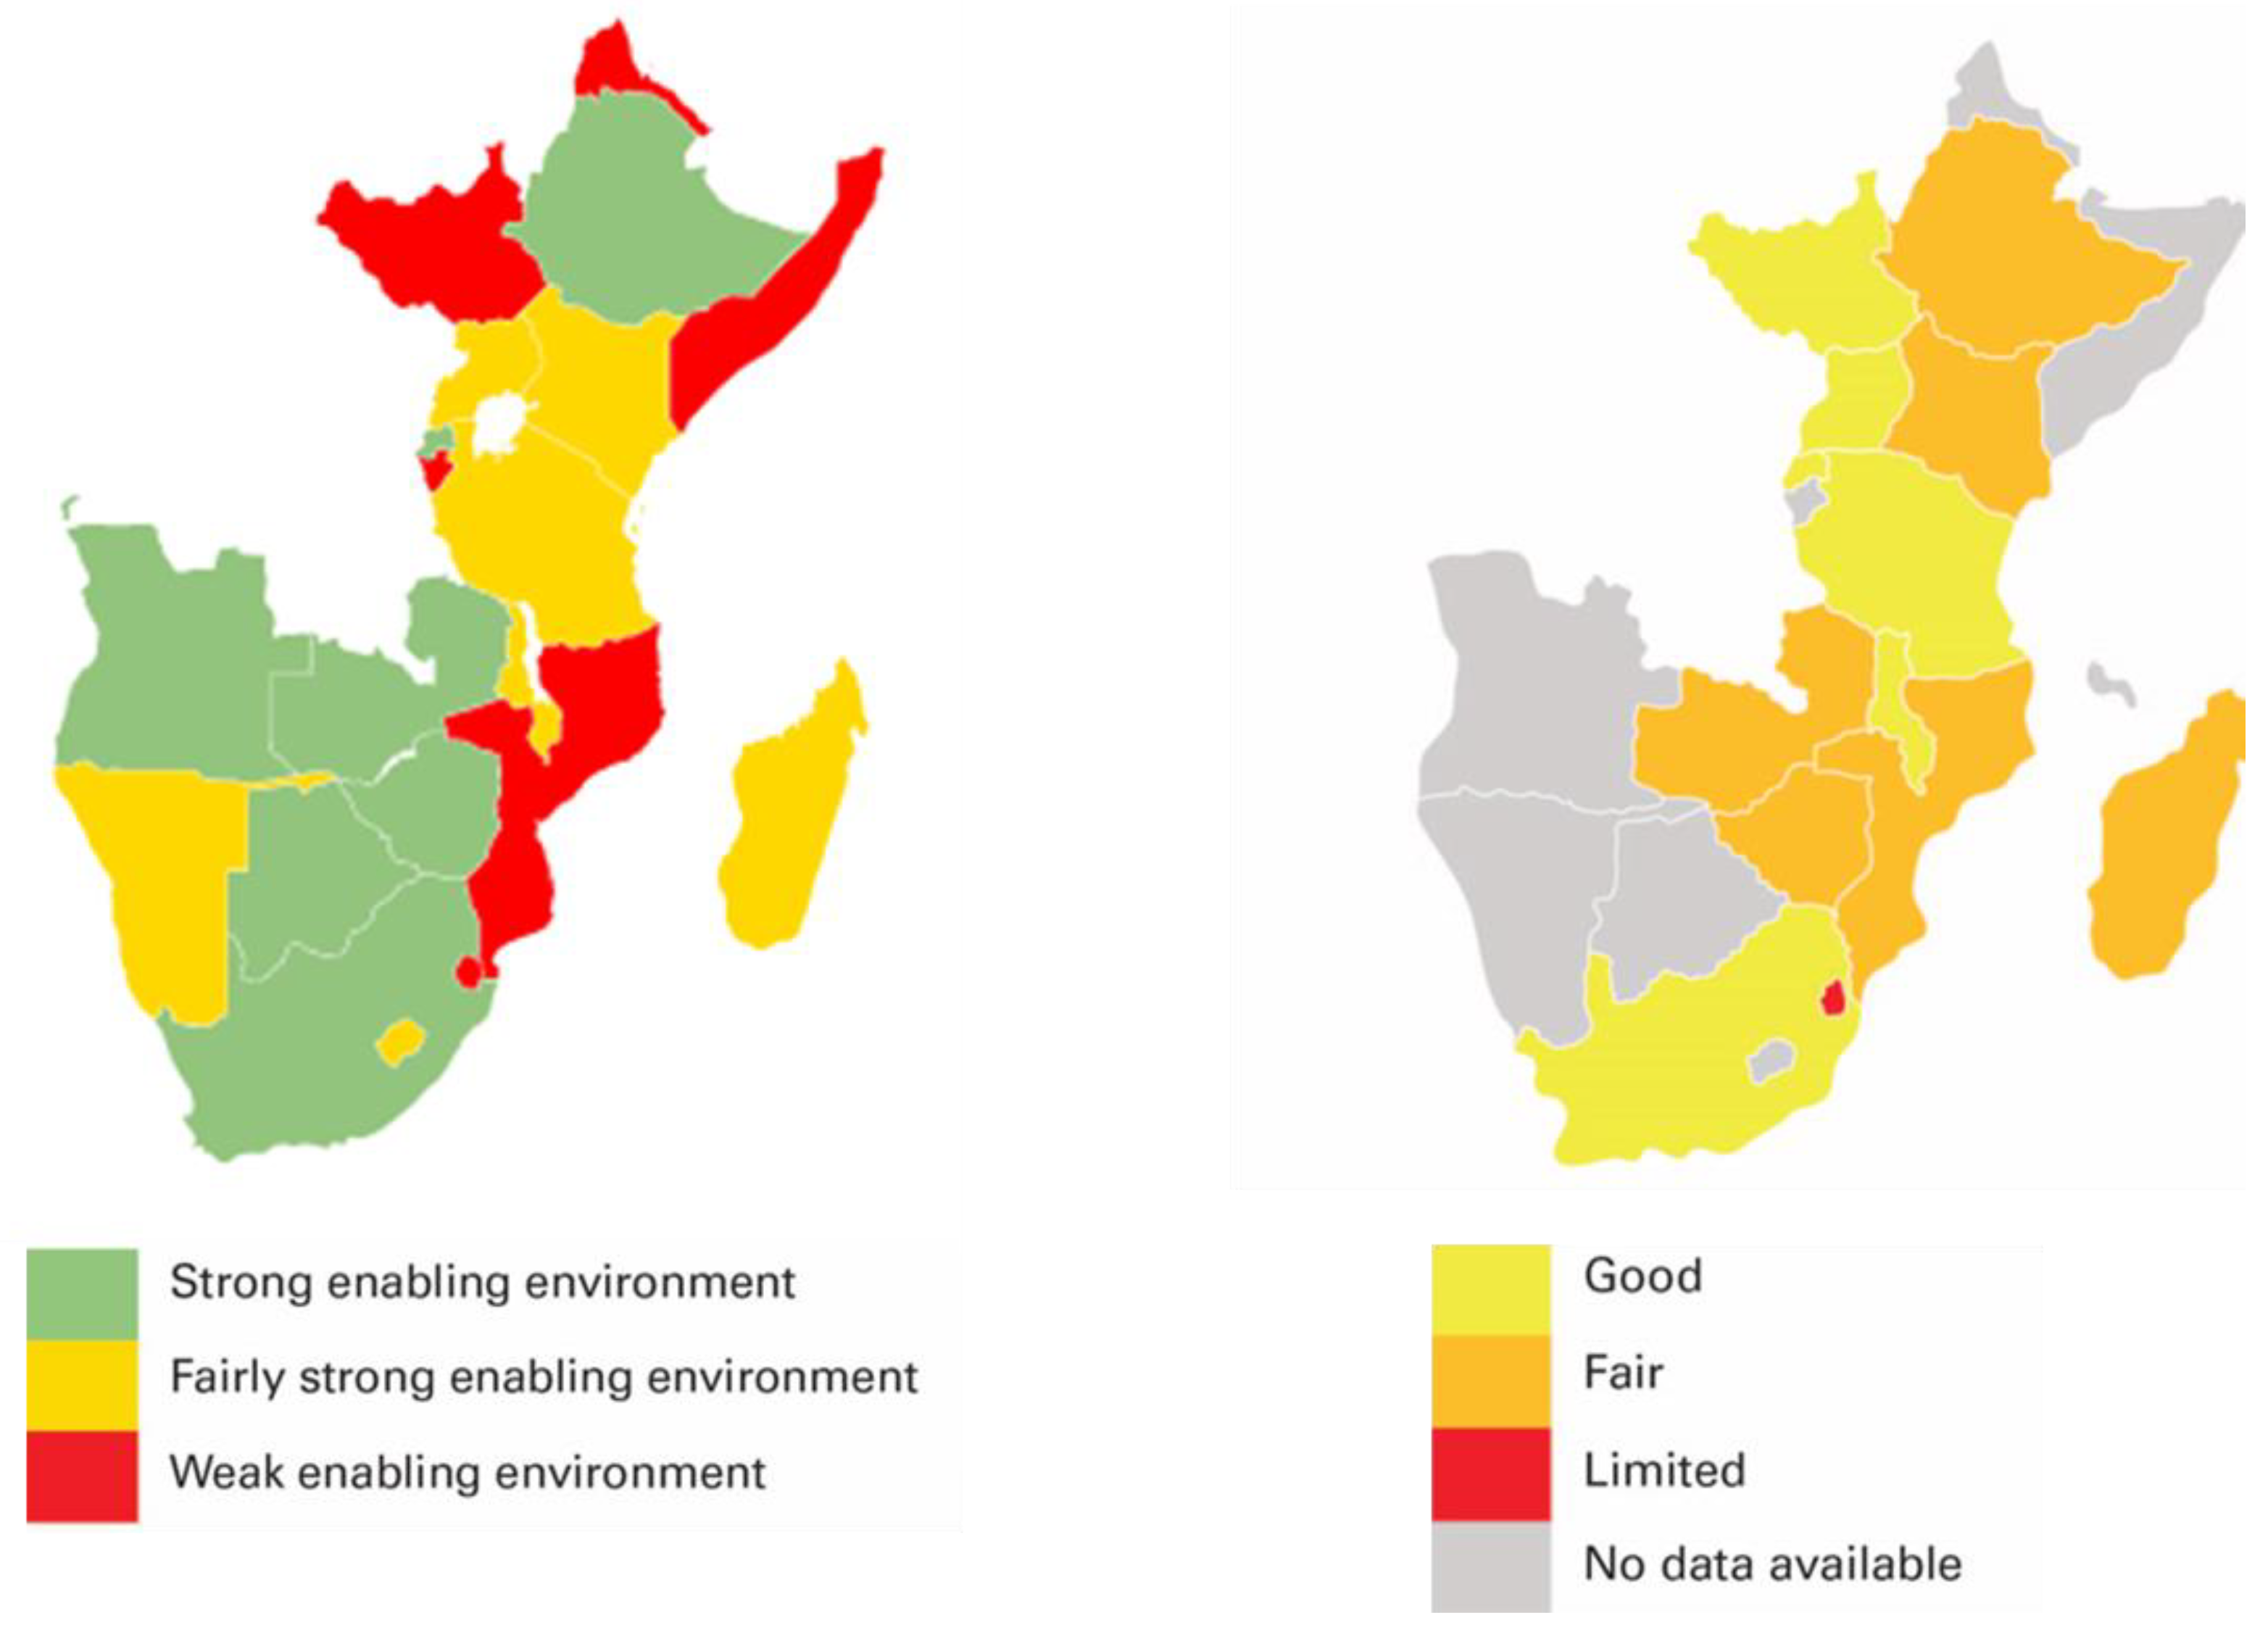
Based on the respective models and fuzzy logic analysis results, countries were then classified as either weak, fairly strong, or strong for the enabling environment factor and as limited, fair, or good for the data for monitoring SDG6 factor. The model results and classification assigned for the enabling environment are summarised in Table 3 below.
Ethiopia and South Africa ranked highest for strong enabling environments for WASH monitoring. Zimbabwe, Angola, Botswana, Mozambique, Rwanda, and Zambia ranked next, still within strong enabling environments. South Sudan had the weakest scoring, and along with Somalia, Burundi, Eritrea, Eswatini and Lesotho, ranked as having weak enabling environments for WASH monitoring. Kenya, Madagascar, Malawi, Uganda, Namibia, and Tanzania Uganda scored moderately, with fairly strong enabling environments. Figure 8 summarises the enabling environment and data for monitoring SDG 6 results from the fuzzy logic analysis.
On the availability of monitoring data and alignment with SDG6 indicators, the fuzzy analysis results (Figure 8) note that of the 15 countries examined, Tanzania and Uganda scored as good, followed by Rwanda, Malawi, South Africa and South Sudan. Eswatini scored lowest for data availability and SDG alignment. Six countries, Ethiopia, Kenya, Madagascar, Mozambique, Zambia and Zimbabwe scored fairly for the data for monitoring criteria. As no country’s data were fully aligned to JMP monitoring, none was scored higher than good.
4. Discussion
From the rapid assessment results, the strength of the enabling environment influenced the availability and strength of country monitoring systems. Countries with strong enabling environments- defined in the assessment as those with good sector policy, adequate sector financing, JSR reporting in place, annual performance reporting and localisation of SDGs—had strong monitoring systems. Those countries without monitoring systems are those that scored poorly in the enabling environment. The assessment did not establish which specific elements of the enabling environment were priority elements; however, the results infer that an overall strong enabling environment indicates a good WASH monitoring system.
The fuzzy logic analysis, however, presented varying results on some countries’ enabling environments, compared to the rapid assessment, as a result of weighting the three sub-factors used in the fuzzy analysis. Localisation of SDG targets was allocated a higher weighting than sector policy and strategy and sector financing; thus, countries with good localisation fared better in enabling environment scoring in comparison to their assessment results. For example, from the fuzzy analysis, Angola, Botswana and Rwanda listed among the eight countries having strong enabling environments. This varies from the rapid assessment where these countries are not included among countries with higher enabling environment ratings—Ethiopia, South Africa, Zambia, Uganda, Madagascar, Malawi Zimbabwe and Mozambique. Both assessment and analysis, however, presented South Sudan and Somalia having weak enabling environments for monitoring and weak monitoring systems.
Additionally, two countries that scored strongly in fuzzy analysis enabling environment results—Angola and Namibia—do not have routine monitoring systems. However, the results could be attributed to the satisfactory scoring in SDG localisation and policy and strategy. Owing to these dissimilarities in results, further analysis would be recommended, possibly incorporating other elements of the enabling environment building blocks, to develop a comprehensive prediction of priority elements that would support good monitoring.
The rapid assessment findings showed that data to monitor progress towards SDG 6 at national level in ESAR are insufficient. No country has fully incorporated JMP indicators reporting in their monitoring systems and only few countries reported for basic SDG service levels. This may indicate that majority of the countries, even those that have their sector policies and strategies aligned to SDG goals and targets, have yet to transition from MDG to SDG monitoring and reflect the SDG indicators in their monitoring systems. The infrequency in data collection also inhibits effective monitoring and the ability to track progress on national targets. The fuzzy logic analysis results aligned with the findings from the assessment, no country scored fully for data availability and SDG alignment. This affirms the need for technical support to countries to align their targets to the SDG indicators.
The lack of skilled capacity for monitoring was reported as a larger deterrent to WASH monitoring than availability of financial resources. Though the reason was not determined in the assessment, this is a useful observation to link to the role of international institutions in strengthening data management, through strengthening the capacity of monitoring staff in ESAR countries.
The assessment results showed that a large majority of monitoring systems were national monitoring information systems (MIS). However, the assessment also observed that both MIS and surveys can complement each other to strengthen monitoring data. MIS systems may be limited in data collection of some indicators under the SDGs such as water collection time or water quality at point of use but are better placed to inform on technical aspects such as access to a service level through mapping systems. Surveys, however, afford a greater flexibility and can be used to collect data where MIS is limited, thus closing the gap in availability of data.
Except for countries where sanitation and hygiene data are collected by HMIS, monitoring data for these is wanting, hygiene being the weakest. Yet, where present in routine monitoring systems, hygiene data were most aligned with JMP indicators than was observed for water and sanitation. Because hygiene monitoring elements are less multi-faceted than water and sanitation in regard to data collection, they can more easily be improved to strengthen WASH monitoring. The inclusion of data from non-household settings, that is schools and healthcare facilities also present opportunities to strengthen WASH monitoring.
5. Conclusions
Only one country in ESAR, Botswana, is noted to be on track to achieve universal basic access to water. The study’s assessment on the state of WASH monitoring in ESAR further observes the lack of sufficient data in countries to track gaps and progress towards SDGs. Additionally, countries’ monitoring systems are largely misaligned with JMP indicators for SDG targets 6.1 and 6.2. The fuzzy logic analysis provided a useful tool to preliminarily assess what aspects of the enabling environment would need to be prioritised to strengthen monitoring in the region, as well as country-specific evaluations on potential areas for strengthening. Localisation of SDGs in sector monitoring was noted as a key element to strengthening the enabling environment. Countries with existing good localisation such as Angola, Botswana and Mozambique require support to strengthen their sector policies and strategies towards strengthening their enabling environments. In addition to establishing a strong enabling environment for monitoring, the study proposes providing technical support to country-led design of monitoring systems, to strengthen WASH monitoring in the region. The study also proposes future WASH monitoring studies to incorporate assessment of asset management plans as constituent to monitoring.
The methodology used in the study further demonstrates the application and usefulness of fuzzy logic as a statistical method in reducing unconscious bias from qualitative methods. Thus, in addition to the evaluation of WASH monitoring systems in the region, the methods applied hold potential for contextual application in other regions and methods to enhance evaluations of varying aspects of enabling environments in other settings.
Author Contributions
Conceptualization, S.G. and F.T.; methodology, S.G. and F.T.; formal analysis, S.G., F.T. and M.W.; writing—original draft preparation, S.G., F.T., P.P. and M.W.; writing—review and editing, S.G., P.P., F.T. and M.W.; supervision, S.G. All authors have read and agreed to the published version of the manuscript.
Funding
This research was funded by UNICEF and the Government of the Netherlands ASWA programme.
Acknowledgments
The authors would like to acknowledge and thank the contribution of the SDG 6 + 5 review undertaken by an expert team led by Itad Ltd. The authors also thank Tom Slaymaker; Senior Statistics and Monitoring Specialist (WASH), UNICEF-JMP, Anu Paudyal Gautam; Knowledge Management Specialist, UNICEF HQ and Guy Hutton; Senior Adviser WASH HQ for their expertise and detailed review.
Conflicts of Interest
The authors declare no conflict of interest.
References
- United Nations (UN). The Sustainable Development Goals Report 2021; United Nations: New York, NY, USA, 2021. [Google Scholar]
- UNICEF; WHO. Progress on Drinking Water, Sanitation and Hygiene in Africa 2000–2020: Five Years into the SDGs; United Nations Children’s Fund (UNICEF): New York, NY, USA; World Health Organization (WHO): Geneva, Switzerland, 2022. [Google Scholar]
- Parikh, P.; Diep, L.; Hofmann, P.; Tomei, J.; Campos, L.C.; Teh, T.-H.; Mulugetta, Y.; Milligan, B.; Lakhanpaul, M. Synergies and Trade-Offs between Sanitation and the Sustainable Development Goals. UCL Open Environ. 2021, 2, 4. [Google Scholar] [CrossRef]
- WHO; UNICEF. About the JMP; World Health Organization (WHO): Geneva, Switzerland; United Nations Children’s Fund (UNICEF): New York, NY, USA, 2022; Available online: https://washdata.org/how-we-work/about-jmp (accessed on 9 June 2022).
- UN Water. National Systems to Support Drinking—Water, Sanitation and Hygiene: Global Status Report 2019; UN Water: Geneva, Switzerland, 2019. [Google Scholar]
- AMCOW. Is Africa on Track to Achieve the SDGs on Sanitation? A Review of Progress on the Ngor Declaration on Sanitation and Hygiene; African Ministers Council on Water (AMCOW): Abuja, Nigeria, 2019. [Google Scholar]
- Hashemi, S. Sanitation Sustainability Index: A Pilot Approach to Develop a Community-Based Indicator for Evaluating Sustainability of Sanitation Systems. Sustainability 2020, 12, 6937. [Google Scholar] [CrossRef]
- UN 2023 Water Conference. Available online: https://sdgs.un.org/conferences/water2023 (accessed on 13 June 2022).
- Smits, S.; Schouten, T.; Lockwood, H.; Fonseca, C. Background Paper for Monitoring Sustainable WASH Service Delivery Symposium; IRC International Water and Sanitation Centre: The Hague, The Netherlands, 2013; Available online: https://www.ircwash.org/sites/default/files/smits-2013-background.pdf (accessed on 8 June 2022).
- Parlikad, A.K.; Jafari, M. Challenges in Infrastructure Asset Management. IFAC-PapersOnLine 2016, 49, 185–190. [Google Scholar] [CrossRef]
- Marzouk, M.; Osama, A. Fuzzy-Based Methodology for Integrated Infrastructure Asset Management. Int. J. Comput. Intell. Syst. 2017, 10, 745–759. [Google Scholar] [CrossRef]
- Ugarelli, R.; Sægrov, S. Infrastructure Asset Management: Historic and Future Perspective for Tools, Risk Assessment, and Digitalization for Competence Building. Water 2022, 14, 1236. [Google Scholar] [CrossRef]
- Boulenouar, J.; Schweitzer, R. Infrastructure Asset Management for Rural Water Supply. In Briefing Note 2015; IRC International Water and Sanitation Centre: The Hague, The Netherlands, 2015; Available online: https://www.ircwash.org/sites/default/files/084-201502triple-s_bn09defweb_1.pdf (accessed on 9 June 2022).
- Environmental Protection Agency (EPA). Asset Management Plans and the Clean Water State Revolving Fund; EPA: Washington DC, USA, 2021. Available online: https://www.epa.gov/sites/default/files/2021-02/documents/asset_management_plans_and_the_clean_water_state_revolving_fund.pdf (accessed on 6 June 2022).
- UNICEF; UN Habitat. Analysis of Multiple Deprivations in Secondary Cities in Sub-Saharan Africa. 2020. Available online: https://www.unicef.org/esa/media/5561/file/Analysis%20of%20Multiple%20Deprivations%20in%20Secondary%20Cities%20-%20Analysis%20Report.pdf (accessed on 2 June 2022).
- African Development Bank Group. African Water Facility Strategy 2017–2025. 2021. Available online: https://www.afdb.org/en/documents/african-water-facility-strategy-2017-2025 (accessed on 19 June 2022).
- ICA. Infrastructure Financing Trends in Africa; The Infrastructure Consortium for Africa: Abidjan, Côte d’Ivoire, 2018; Available online: https://www.icafrica.org/fileadmin/documents/IFT_2018/ICA_Infrastructure_Financing_Trends_in_Africa_-_2018_Final_En.pdf (accessed on 19 June 2022).
- Hutton, G.; Varughese, M. The Costs of Meeting the 2030 Sustainable Development Goal Targets on Drinking Water, Sanitation, and Hygiene; Water and Sanitation Program Technical Paper; WSP/The World Bank: Washington, DC, USA, 2016; Available online: https://openknowledge.worldbank.org/handle/10986/23681 (accessed on 9 June 2022).
- Butterworth, J.; Godfrey, S.; Regah, A.; Short, S. Monitoring and Management of Climate Resilient Water Services in the Afar and Somali Regions of Ethiopia. In Proceedings of the 41st WEDC International Conference, Nakuru, Kenya, 9–13 July 2018. [Google Scholar]
- Howard, G.; Nijhawan, A.; Flint, A.; Baidya, M.; Pregnolato, M.; Ghimire, A.; Poudel, M.; Lo, E.; Sharma, S.; Mengustu, B.; et al. The How Tough Is WASH Framework for Assessing the Climate Resilience of Water and Sanitation. NPJ Clean Water 2021, 4, 39. [Google Scholar] [CrossRef]
- Tillett, W.; Huston, A.; Davis, S. Strengthening Water, Sanitation, and Hygiene Systems: Concepts, Examples, and Experiences; IRC and Agenda for Change: Washington DC, USA, 2020; Available online: https://washagendaforchange.org/wp-content/uploads/2020/04/20200227_agenda_for_change_systems_strengthening_experiences_final.pdf (accessed on 16 June 2022).
- Huston, A.; Moriarty, P. Understanding the WASH System and Its Building Blocks; IRC Working Paper; IRC: The Hague, The Netherlands, 2018; Available online: https://www.ircwash.org/sites/default/files/wash_system_and_building_blocks_wp2018.pdf (accessed on 16 June 2022).
- Pories, L.; Fonseca, C.; Delmon, V. Mobilising Finance for WASH: Getting the Foundations Right. Water 2019, 11, 2425. [Google Scholar] [CrossRef]
- Estoque, R.C. A Review of the Sustainability Concept and the State of SDG Monitoring Using Remote Sensing. Remote Sens. 2020, 12, 2512. [Google Scholar] [CrossRef]
- Hoekstra, A.Y.; Chapagain, A.K.; van Oel, P.R. Advancing Water Footprint Assessment Research: Challenges in Monitoring Progress towards Sustainable Development Goal 6. Water 2017, 9, 438. [Google Scholar] [CrossRef]
- Chatterley, C.; Slaymaker, T.; Badloe, C.; Nouvellon, A.; Bain, R.; Johnston, R. Institutional Wash in the SDGs: Data Gaps and Opportunities for National Monitoring. J. Water Sanit. Hyg. Dev. 2018, 8, 595–606. [Google Scholar] [CrossRef] [Green Version]
- Da Silva Wells, C.; van Lieshout, R.; Uytewaal, E. Monitoring for Learning and Developing Capacities in the WASH Sector. Water Policy 2013, 15, 206–225. [Google Scholar] [CrossRef]
- Thomson, P.; Koehler, J. Performance-Oriented Monitoring for the Water SDG—Challenges, Tensions and Opportunities. Aquat. Procedia 2016, 6, 87–95. [Google Scholar] [CrossRef]
- Harris, B.; Tunhuma, F.; Pearce, J.; Snoad, C.; Godfrey, S. Progress towards SDG6 and the State of Country-Led WASH Monitoring in Progress towards SDG6 and the State of Country-Led WASH Monitoring in Eastern and Southern Africa. In Proceedings of the 42nd WEDC International Conference, Online, 13–15 September 2021. [Google Scholar]
- Harris, B.; Pearce, J. Understanding Monitoring for SDG6 across Eastern and Southern Africa Regional Review. 2021. Available online: https://www.unicef.org/esa/documents/understanding-monitoring-sdg6-across-eastern-and-southern-africa (accessed on 2 June 2022).
- Godfrey, S.; Asmare, G.; Gossa, T.; Paba, M. Fuzzy Logic Analysis of the Build, Capacity Build and Transfer (B-CB-T) Modality for Urban Water Supply Service Delivery in Ethiopia. Water 2019, 11, 979. [Google Scholar] [CrossRef]
- Moorthi, P.V.P.; Singh, A.P.; Agnivesh, P. Regulation of Water Resources Systems Using Fuzzy Logic: A Case Study of Amaravathi Dam. Appl. Water Sci. 2018, 8, 132. [Google Scholar] [CrossRef]
- Pugel, K.; Javernick-Will, A.; Peabody, S.; Nyaga, C.; Mussa, M.; Mekonta, L.; Dimtse, D.; Watsisi, M.; Buhungiro, E.; Mulatu, T.; et al. Pathways for Collaboratively Strengthening Water and Sanitation Systems. Sci. Total Environ. 2022, 802, 149854. [Google Scholar] [CrossRef] [PubMed]
- Mathworks. Matlab—Fuzzy Inference Process. Available online: https://www.mathworks.com/help/fuzzy/fuzzy-inference-process.html (accessed on 19 September 2022).
- Beheshti, H.M.; Lollar, J.G. Fuzzy Logic and Performance Evaluation: Discussion and Application. Int. J. Product. Perform. Manag. 2008, 57, 237–246. [Google Scholar] [CrossRef]
Figure 1.
Methodology for study on monitoring for SDG targets 6.1 and 6.2 in ESAR.

Figure 2.
WASH monitoring system hierarchy model.

Figure 3.
WASH monitoring scoring for ESAR countries’ the enabling environment. Adapted from Harris and Pearce [30].
Figure 3.
WASH monitoring scoring for ESAR countries’ the enabling environment. Adapted from Harris and Pearce [30].

Figure 4.
Findings of enabling environment assessment of ESAR countries.

Figure 5.
Availability of data in routine monitoring systems, and extent of alignment with JMP indicators for access to drinking water services, access to sanitation services and access to hygiene [30].
Figure 5.
Availability of data in routine monitoring systems, and extent of alignment with JMP indicators for access to drinking water services, access to sanitation services and access to hygiene [30].

Figure 6.
Input variables for fuzzy logic analysis of enabling environment and data for monitoring SDG 6.
Figure 6.
Input variables for fuzzy logic analysis of enabling environment and data for monitoring SDG 6.

Figure 7.
Rule set for the enabling environment analysis applied to ESAR country.

Figure 8.
ESAR countries’ enabling environment and data for monitoring SDG 6 fuzzy logic analysis results.
Figure 8.
ESAR countries’ enabling environment and data for monitoring SDG 6 fuzzy logic analysis results.


Table 1.
Main aspects and key elements applied for the rapid assessment.
| Aspect | Element |
|---|---|
| Strength of the enabling environment Examined how other elements of ESAR countries’ WASH sector and system enable effective monitoring of SDG 6. Six elements were used, three adapted from the Sanitation and Water for All (SWA) WASH system building blocks (one element—institutional arrangements—was not scored) and three additional sector elements relevant to the enabling environment. |
|
| Data for monitoring SDG 6 Questioned what WASH data were available in routine monitoring systems and to what extent this data aligned with JMP indicators. Either WASH specific or health management information systems (HMIS) that capture sanitation and hygiene components included data on access to WASH. |
|
| Monitoring system structures Assessed the responsibility, extent and functionality of the monitoring systems identified. This included assessing who own the monitoring systems and data for WASH. Rural and urban coverage. |
|
| Linkage to other WASH priority areas How well the WASH monitoring links with other priority areas in WASH. |
|
Table 2.
Rule set for enabling environment factor for fuzzy modelling.
| Enabling Environment Rule Set | |||
|---|---|---|---|
| IF Sector Policy and Strategy | AND Sector Financing for Monitoring | AND Localisation | THEN Enabling Environment |
| Limited | Limited | Limited | Weak |
| Satisfactory | Satisfactory | Satisfactory | Fairly strong |
| Good | Good | Good | Strong |
| Satisfactory | Satisfactory | Good | Strong |
| Limited | Limited | Satisfactory | Weak |
| Good | Satisfactory | Satisfactory | Fairly strong |
| Satisfactory | Limited | Satisfactory | Fairly strong |
| Satisfactory | Good | Good | Strong |
| Good | Good | Satisfactory | Strong |
| Satisfactory | Satisfactory | Limited | Weak |
Table 3.
Fuzzy model results for enabling environment—ESAR countries.
| Country | Fuzzy Model Results | Enabling Environment Classification |
|---|---|---|
| Ethiopia, South Africa | 9.11 | Strong |
| Zimbabwe | 9.1 | Strong |
| Angola, Botswana, Mozambique, Rwanda, Zambia | 9.05 | Strong |
| Kenya, Madagascar, Malawi, Uganda | 6.31 | Fairly strong |
| Namibia, Tanzania, | 6.3 | Fairly strong |
| Burundi, Eritrea, Eswatini, Lesotho | 4.23 | Weak |
| Somalia, | 2.04 | Weak |
| South Sudan | 1.92 | Weak |
Publisher’s Note: MDPI stays neutral with regard to jurisdictional claims in published maps and institutional affiliations. |
© 2022 by the authors. Licensee MDPI, Basel, Switzerland. This article is an open access article distributed under the terms and conditions of the Creative Commons Attribution (CC BY) license (https://creativecommons.org/licenses/by/4.0/).
Share and Cite
MDPI and ACS Style
Godfrey, S.; Wambugu, M.; Parikh, P.; Tunhuma, F. Validation of the Sustainable Development Goal 6 Monitoring Structures across East and Southern Africa Using Fuzzy Logic Analysis. Water 2022, 14, 3065. https://doi.org/10.3390/w14193065
AMA Style
Godfrey S, Wambugu M, Parikh P, Tunhuma F. Validation of the Sustainable Development Goal 6 Monitoring Structures across East and Southern Africa Using Fuzzy Logic Analysis. Water. 2022; 14(19):3065. https://doi.org/10.3390/w14193065
Chicago/Turabian StyleGodfrey, Samuel, Mary Wambugu, Priti Parikh, and Farai Tunhuma. 2022. "Validation of the Sustainable Development Goal 6 Monitoring Structures across East and Southern Africa Using Fuzzy Logic Analysis" Water 14, no. 19: 3065. https://doi.org/10.3390/w14193065
Note that from the first issue of 2016, this journal uses article numbers instead of page numbers. See further details here.