
Ecohydrology of Green Stormwater Infrastructure in Shrinking Cities: A Two-Year Case Study of a Retrofitted Bioswale in Detroit, MI

1
Department of Environmental Science and Geology, Wayne State University, 4841 Cass Ave, Detroit, MI 48201, USA
2
Department of Hydrology and Atmospheric Science, University of Arizona, 1133 E. James E. Rogers Way, Tucson, AZ 85721, USA
3
Department of Mechanical Engineering, Wayne State University, 5050 Anthony Wayne Drive, Detroit, MI 48202, USA
4
Institute of Arctic and Alpine Research, University of Colorado Boulder, 4001 Discovery Drive, Boulder, CO 80303, USA
*
Authors to whom correspondence should be addressed.
Water 2022, 14(19), 3064; https://doi.org/10.3390/w14193064
Submission received: 25 August 2022
/
Revised: 21 September 2022
/
Accepted: 24 September 2022
/
Published: 29 September 2022
(This article belongs to the Section Urban Water Management)
Abstract
:Stormwater management is of great importance in large shrinking cities with aging and outdated infrastructure. Maintenance of vegetated areas, particularly referred to as green infrastructure, is often aimed at mitigating flooding and the urban heat island effect by stormwater storage and evaporative cooling, respectively. This approach has been applied in large cities as a cost-effective and eco-friendly solution. However, the ecohydrological processes and how the ecohydrology influences the function of green infrastructure and its potential to provide those ecosystem services are not well understood. In this study, continuous field measurements including air temperature, stomatal conductance, and phenocam images were taken in a 308 m2 bioswale retrofitted into a 4063 m2 parking lot on the Wayne State University campus in Detroit, Michigan over a two-year period. Our results suggest that plant characteristics such as water use efficiency impact the ecohydrological processes within bioswales and that retrofitted bioswales will need to be adapted over time to meet environmental demands to allow for full and sustained success. Therefore, projected shifts in precipitation regime change are expected to affect the performance of green infrastructure, and each bioswale needs to be developed and engineered to be able to adapt to changing rainfall patterns.
1. Introduction
Stormwater management is an increasingly pressing and complex urban problem [1,2]. This is especially true for post-industrial shrinking cities [3], which are generally characterized as having had a population loss of 25% or more in the last forty years and an excess of vacant lots [4,5]. Shrinking cities also tend to have aging and outdated gray stormwater infrastructure, with economies unable to support costly upgrades [6]. That infrastructure often includes a combined sewer system [6], which collects and treats rainwater runoff, domestic sewage, and industrial wastewater all together. During heavy rain events, these systems can get overloaded and dump sewage into the local waterways as combined sewer overflow [7], leading to a multitude of environmental consequences [8,9].
Green infrastructure (GI) has been identified as a cost-effective, environmentally friendly, and socially pleasing solution to stormwater management issues in these shrinking cities [9,10]. According to the US Clean Water Act (Section 503), GI refers to “the range of measures that use plant or soil systems, permeable pavement or other permeable surfaces or substrates, stormwater harvest and reuse, or landscaping to store, infiltrate, or evapotranspirate stormwater and reduce flows to sewer systems or to surface waters”. As an example, bioswales are small vegetated basins or channels integrated into existing impervious surfaces such as parking lots where rainwater is directed to capture it for flood prevention or stormwater filtration [11]. Green infrastructure can provide multiple additional societal benefits, i.e., ecosystem services, that range from providing for human survival and well-being [12,13] to dampening the urban heat island effect [14] to mitigating noise and air pollution [12] to supporting biodiversity [15]. Notably, GI is most effective when it is strategically placed based on the input of stakeholders [16,17] or widespread throughout a city [9]. Unfortunately, once GI is implemented, its sustainability is often compromised because the long-term maintenance and upkeep required can be underestimated [18].
All over the world, cities are implementing GI to varying extents for stormwater management purposes [19]. However, to design for proper functioning of the GI and for additional ecosystem services, these GI can vary regionally based on local climatology. For instance, more humid cities, such as in the northeastern US, might be characterized by uniformly distributed rainfall events, generally of an average size, resulting in high annual rainfall. GI may be designed to manage only the amount of precipitation for those average rainfall events [20]. The design and implementation of GI in cities with these conditions are likely to have important consequences for how effective they are at reducing the load on existing sewer systems and preventing combined sewer overflow [12,20]. On the other hand, semiarid cities, such as in the southwestern US, that might be characterized by low annual rainfall often falling as large events at discrete times of the year [21], have vegetation and soil characteristics that make them especially vulnerable to flash floods [22]. In these cities, GI must be designed to handle those heavy rainfall events that occur between long dry periods. Therefore, in semiarid cities, GI is often also optimized for additional between-rainfall-event ecosystem services such as reducing the urban heat island effect [14,23,24,25].
Notably, whether in mesic or semiarid environments, GI depends largely on healthy vegetation for its proper functioning. Therefore, the demand for water by the plants comprising GI must be considered for effective GI implementation [24]. Just as in natural ecosystems, the vegetation in urban GI ecosystems is subject to the local climatology and weather. This is their baseline condition, with additional inputs from either passive or active redirection of water during weather events [26]. Unfortunately, because GI is often installed by civil engineers, plant species are mainly selected because they are known for being fast growing, establishing quickly, and generating a lot of aboveground biomass and an extensive root system [27,28] without regard to their compatibility with the soil environment and hydrologic conditions [29]. This suggests that GI implementation may not be as effective as it could be.
Many factors contribute to the successful establishment and sustained success of plant species within an ecosystem under various hydrologic conditions. Ecohydrological interactions have been extensively studied in both natural humid [30,31] and semiarid [32,33] ecosystems as well as in agricultural ecosystems [34,35]. However, ecohydrological research in urban ecosystems remains limited, especially as it pertains to GI [36,37]. Of those, few make in situ ecohydrological measurements (Table 1), often instead presenting estimates of evapotranspiration (ET) from models based on meteorological data [38] or relying on data derived from greenhouse experiments [39]. Ecohydrological research in natural and managed ecosystems has suggested that it will be necessary to determine how climatic changes, especially changes in rainfall dynamics, will affect plant growth and water use [40].
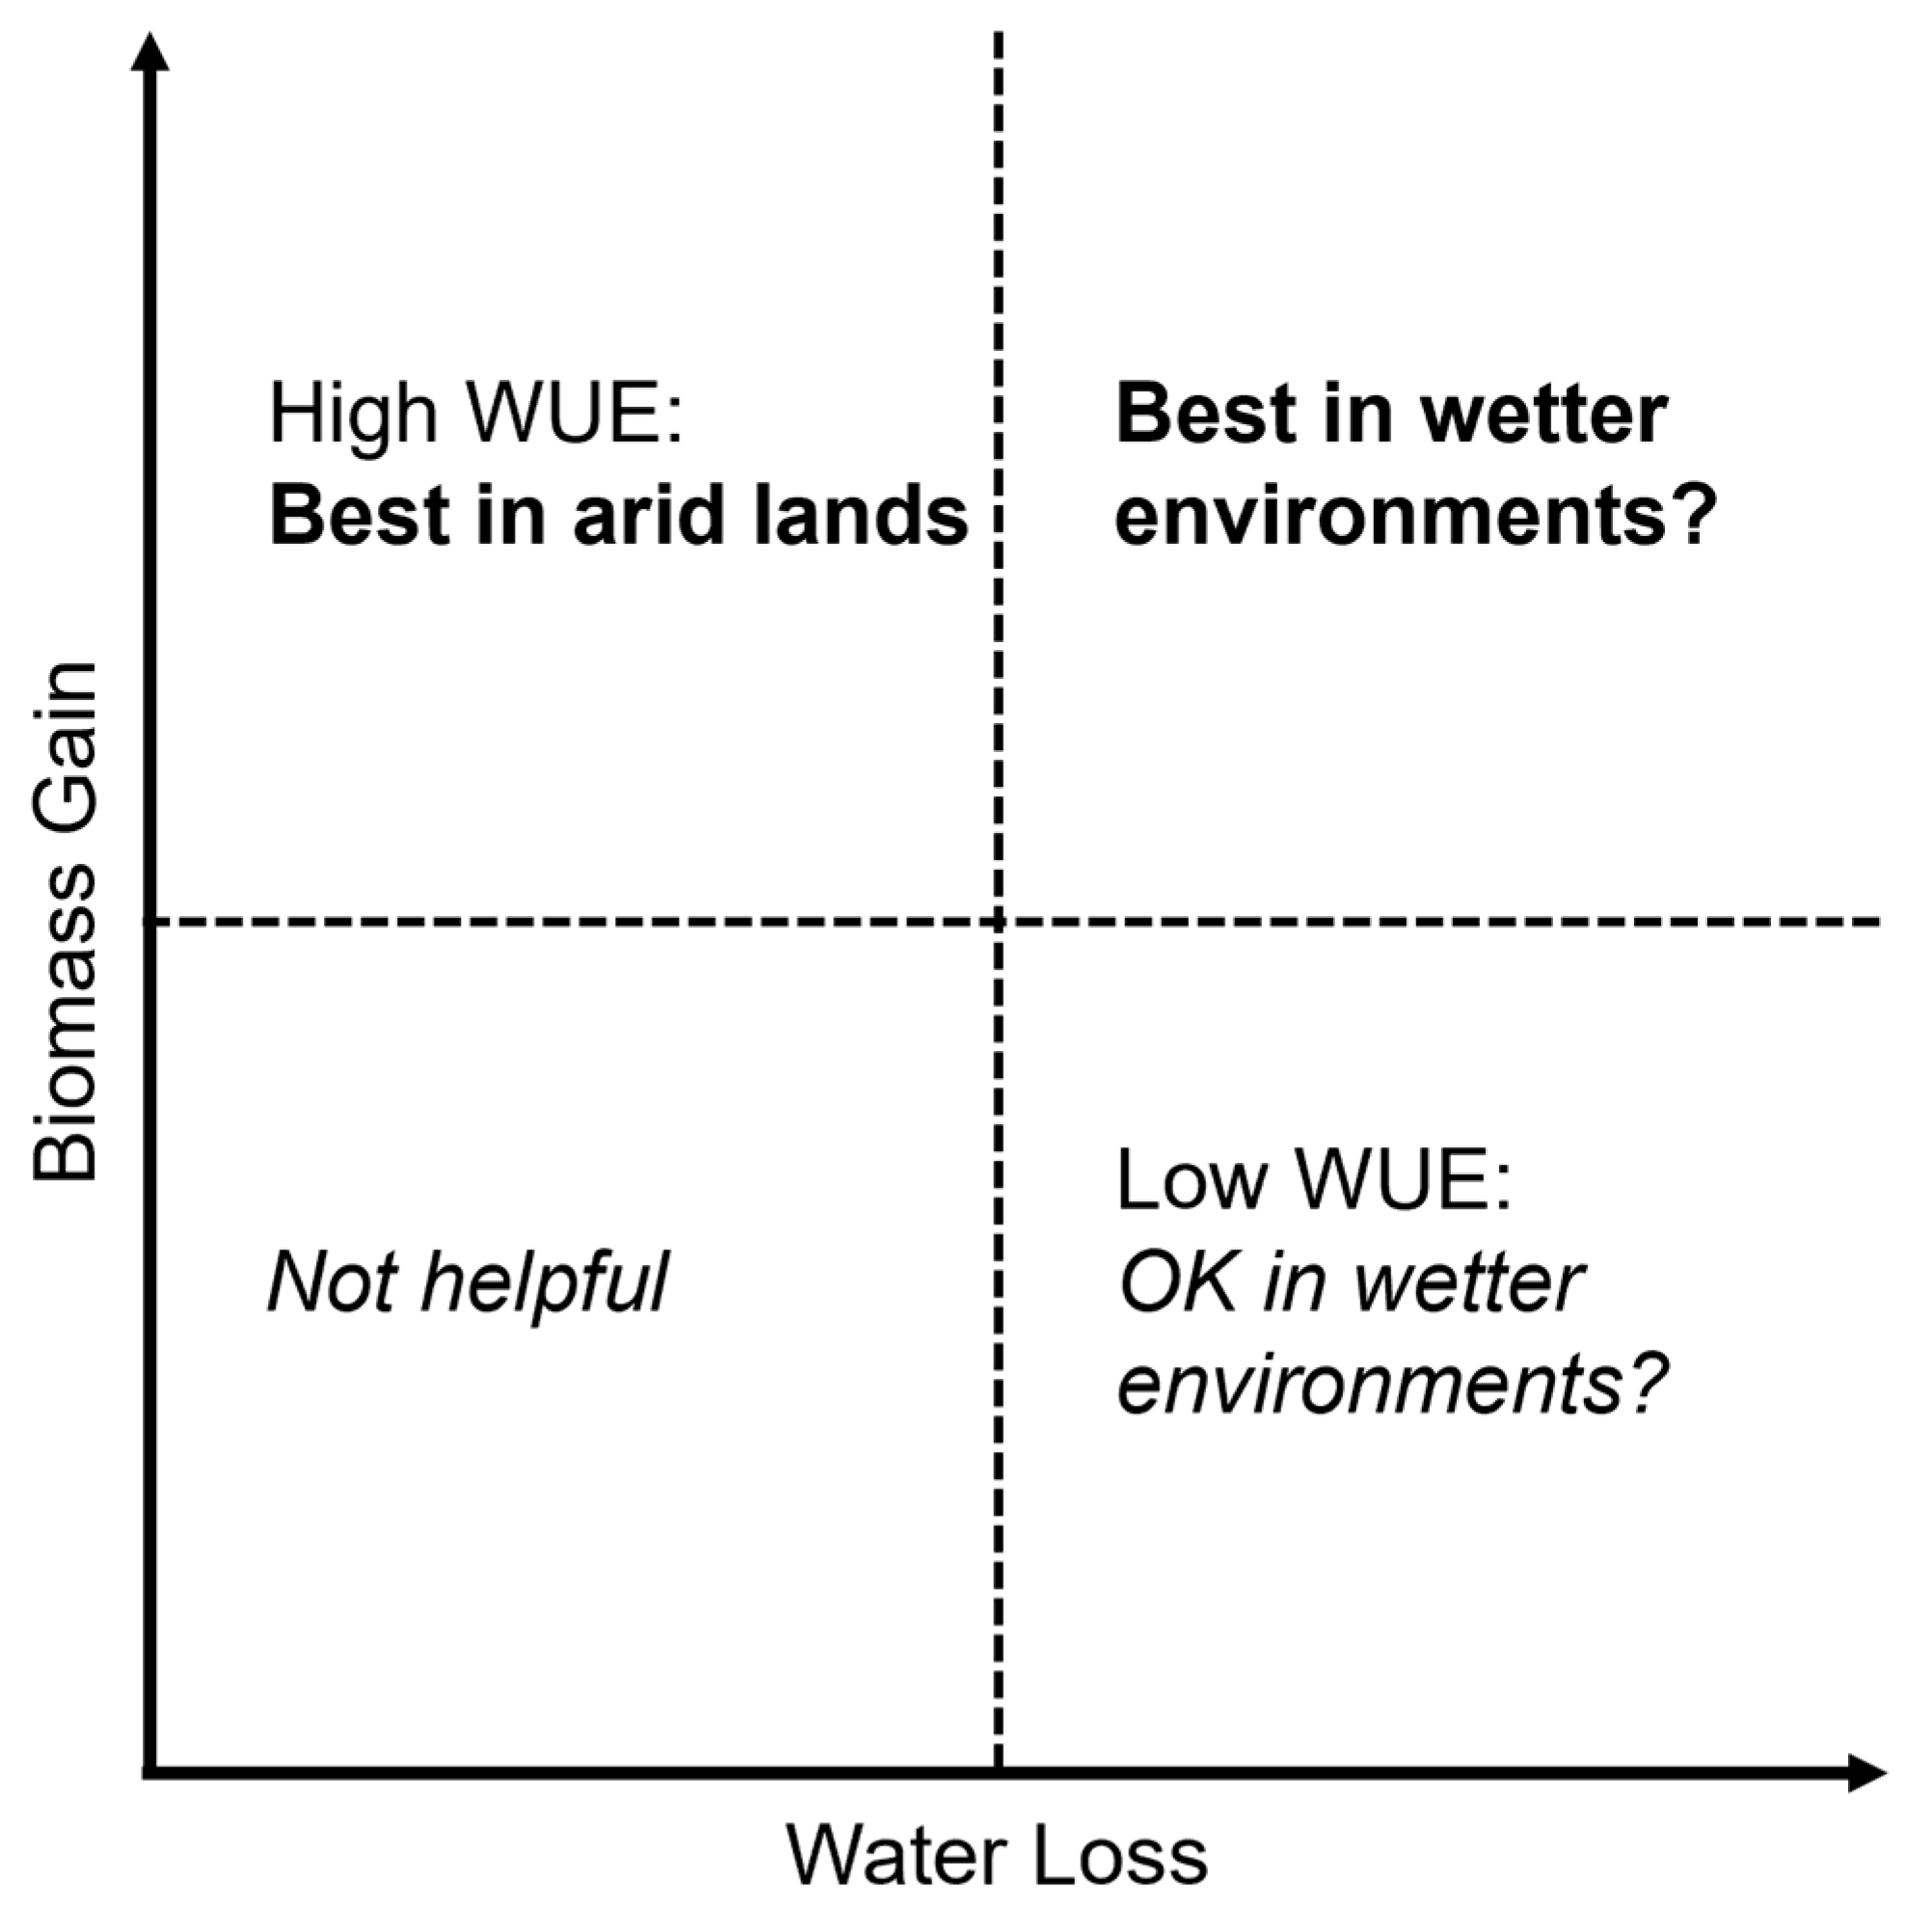
One way to evaluate the impact of ecohydrological consequences of climate change is by monitoring changes in the relationship between plant productivity and plant water use, i.e., water use efficiency (WUE). WUE has been defined as the amount of plant carbon uptake (as biomass produced) per unit of water used by the plant [40]; plants with a small biomass gain relative to water use would have a low WUE whereas plants with a high biomass gain relative to plant water use would have a high WUE (Figure 1). In semiarid ecosystems, the most successful plants tend to be those with high WUE, even when in urban GI systems [26]. This is because the sustained dry conditions limit water availability for the plants, necessitating they minimize their water usage while they are growing. Semiarid plants tend to keep their stomata tight to minimize their water usage even under wet soil conditions so that some moisture will be reserved or redistributed for continual use before it is lost as evaporation. An ideal plant for semiarid GI ecosystems is likely to fall in the upper left quadrat of the conceptual water use-productivity relationship (Figure 1), i.e., high WUE [26].
Recently in agricultural systems, maize plants have been shown to maintain the same high WUE under increased atmospheric demand without water supplements [49]. High WUE may be valuable where crop yield is a main objective. However, in humid cities where simply removing water from the system is a main goal, a high WUE plant species may not be the best choice. We hypothesize for humid GI ecosystems, especially those that are in cities that are managing aging combined sewer systems, ideal plants are likely to have WUEs associated with high water use with high carbon uptake and would fall in the upper right quadrat of our conceptual figure (Figure 1).
The objective of this study is to evaluate the ecohydrology of GI systems in humid cities. Many of these cities are experiencing urban decline, leaving managers with severely aging infrastructure, vast abandoned lots, stormwater management, and a suffering economy. In the 1950s, the population of Detroit, Michigan began declining after reaching a peak population of 1.8 million [50]. Approximately one-third of the houses in Detroit are vacant [50], with over 100,000 vacant lots [10]. In 2014, an Obama Administration task force urged Detroit to spend USD 850 million to tear down 40,000 buildings. Soon after, Mayor Duggan supported a “greening strategy” to turn vacant lots into “productive land”, and the Great Lakes Water Authority and Detroit Water and Sewerage Department committed USD 50 million for GI. This has ultimately resulted in a patchwork of GI systems strewn about the city (Figure 2) without any real understanding of the interactions between the vegetation and the hydrology of the GI. Our study helps to better understand the role of vegetation in GI systems in humid cities subject to urban decline so that they can be optimized for effectiveness and be sustained long term.
2. Materials and Methods
2.1. Site Description
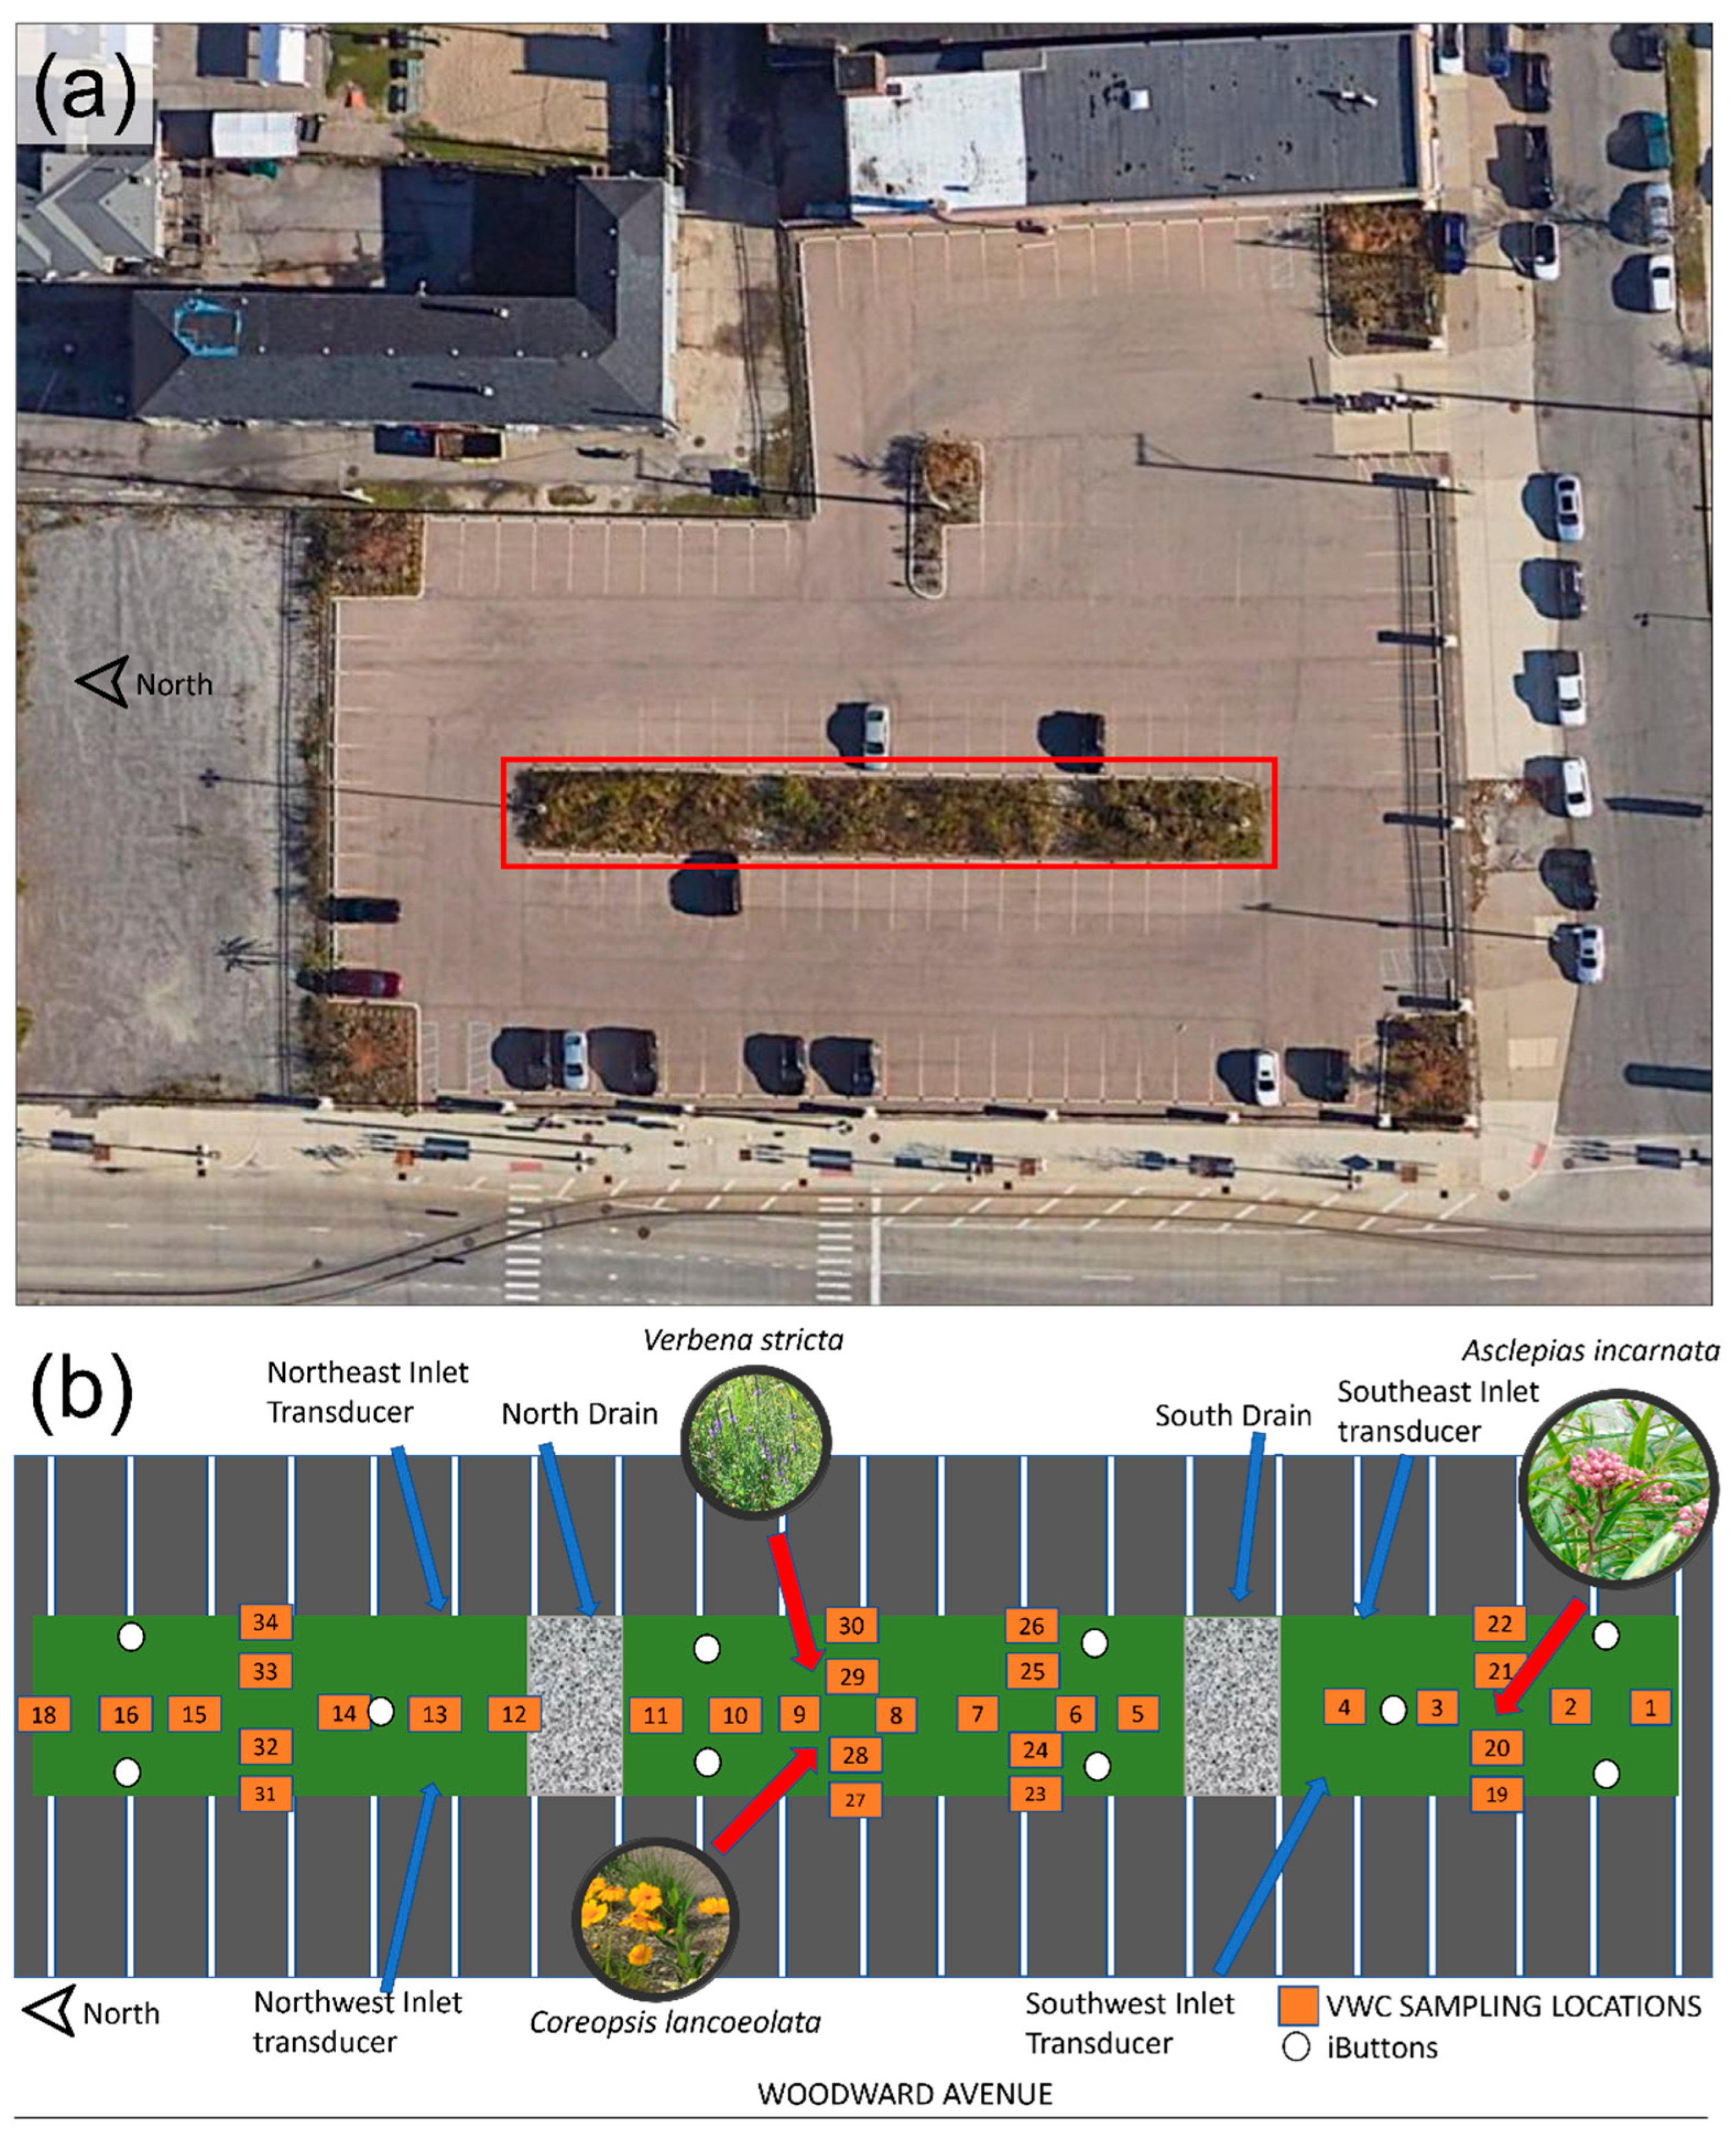
Our study site comprises a 308 m2 retrofitted bioswale located at the corner of Woodward Avenue and Harper Avenue in Parking Lot 12 of Wayne State University’s main campus in Detroit, Michigan (42.3658° N, 83.0698° W) (Figure 3a). The City of Detroit has a mesic, or humid-temperate climate; Köppen climate classification is Dfa [51]. The annual mean temperature and total precipitation are 9.0 °C and 990 mm, respectively (Howard & Shuster, 2015). Based on the local weather station data, the growing season lasts, on average, from late April to late October. The surrounding parking lot measures 4063 m2 and is composed of impervious asphalt (Figure 3a). In fall of 2017, a retrofitted bioswale was integrated into the existing impervious surface of the parking lot in an effort to mitigate stormwater drainage issues. As is typical of bioswales, the natural drainage path of the pavement moves excess stormwater into a swaled strip of vegetated area near the center of the parking lot, the ‘bioswale’ (Figure 3). From north to south the bioswale measures 55 m, while from east to west it measures approximately 6 m. Here the water is slowed and allowed to infiltrate into a fairly uniform construction fill dirt with a high clay content overlain with mulch and other organic material. Excess stormwater runs into one of two belowground drains that move the water off site. Occasionally, immediately following rainfall events, channelization would occur in the bioswale increasing the amount of coarse organic and soil material in the center of the bioswale over time. In the summer of 2019, we used a 30 cm double-ring infiltrometer (IN10-W Infiltration Rings, Turf Tec International, Tallahassee, FL, USA) to estimate infiltration within the bioswale at two accessible locations. This exercise showed that the infiltration rate is around 7 mm min−1.
The bioswale is maintained by the Detroit Biodiversity Network (DBN), a student organization at Wayne State University. DBN initially planted the bioswale in spring 2018 with a variety of native Michigan plants, including Swamp Milkweed (Asclepias incarnata), Hoary Verbena (Verbena stricta), Lanceleaf Coreopsis (Coreopsis lanceolata) (Figure 3b). Swamp milkweed is a wetland plant that can grow up to 2 m high and is an important resource to pollinators [52]. Hoary Verbena is a drier prairie plant with a tap-root structure that penetrates deep into the soil to access water. Lanceleaf Coreopsis is another drier prairie-based plant, but with a shallow and wider root structure that can prop up other visible plants from the same root structure. Of these three species, Swamp Milkweed generally has the most extensive root system; Hoary Verbena has a tap root; Lanceleaf Coreopsis has the least extensive root system.
2.2. Temperature
We acquired daily air temperature data for 2018 and 2019 from the National Weather Service (NWS) station at the nearby airport (Coleman A. Young International Airport; https://w2.weather.gov/climate/ (accessed on 24 August 2020)). In 2019, we transitioned to using 30 min air temperature data for daily means from the on-campus weather station using the CS215 Temperature/Humidity Probe and CR300 data logger (Campbell Scientific Inc., Logan, UT, USA). Daily mean temperatures from these two sources were similar with a high correlation coefficient (y = 0.9333x + 1.9773; R2 = 0.9752). Weekly (7-day) averages were calculated using the seven days preceding the day for which the value was reported.
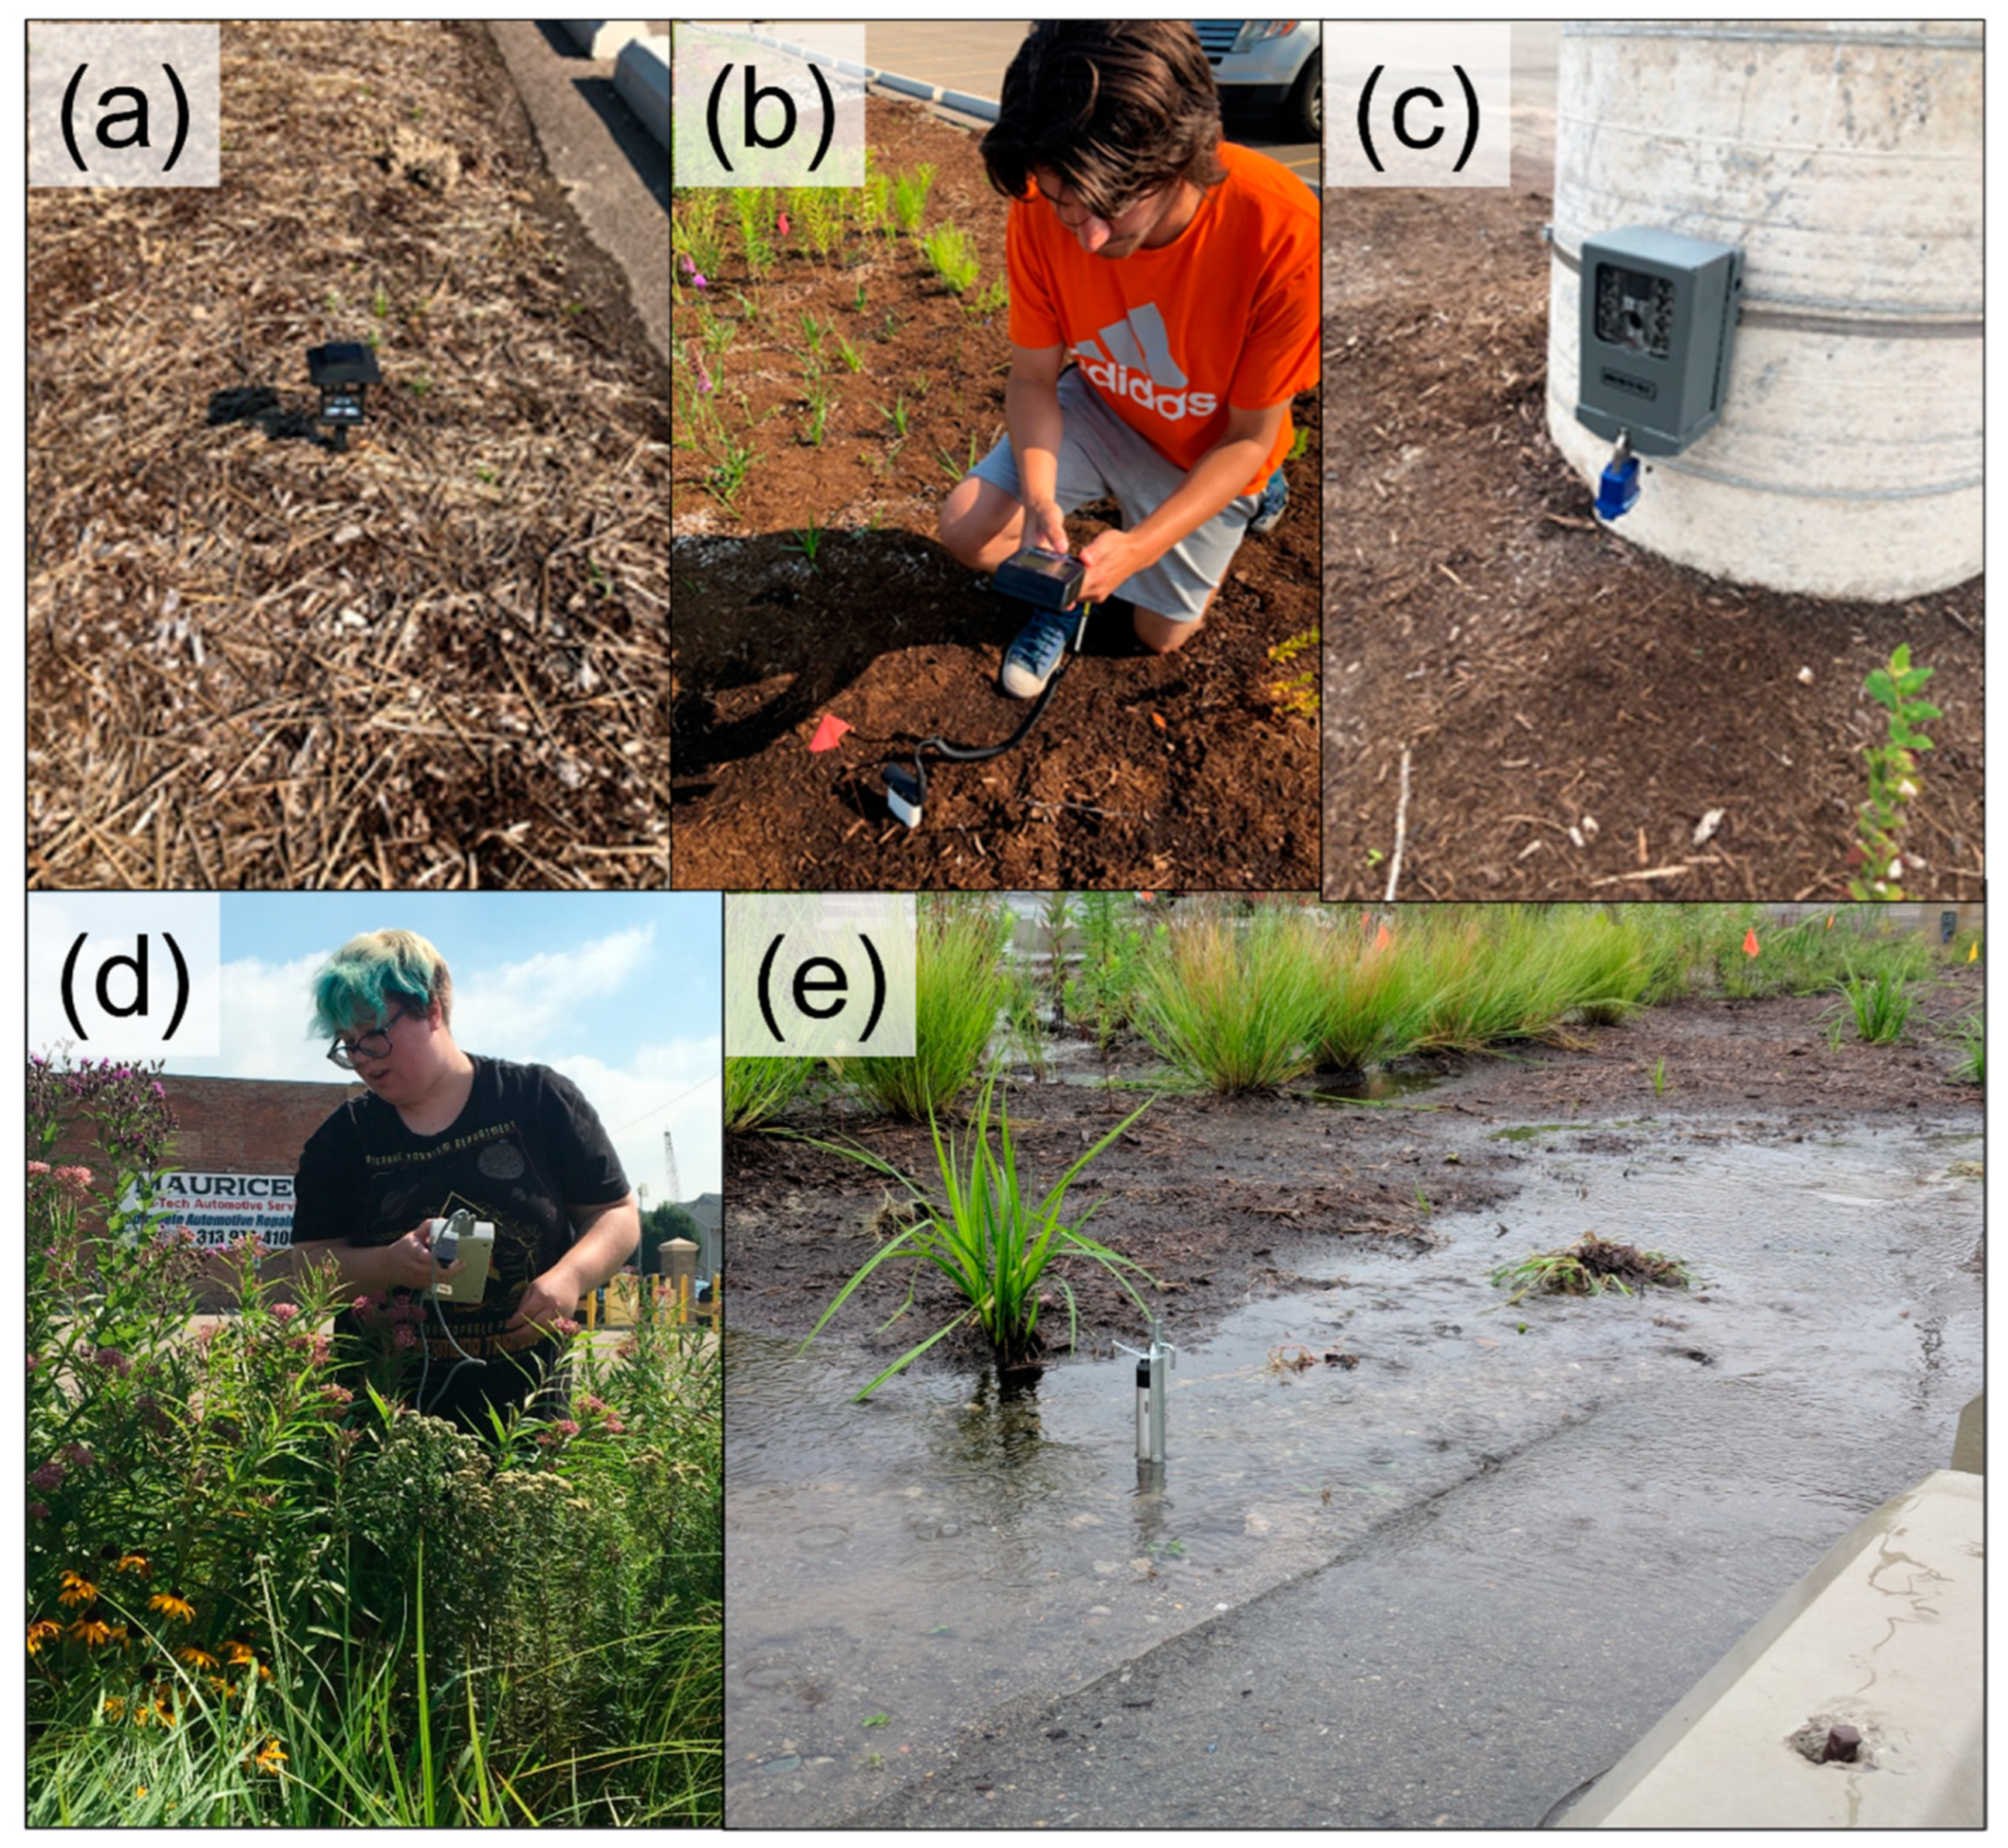
We measured 30 min near-surface temperatures using iButton temperature and humidity loggers (iButton Hygrochron DS1923-F5, Maxim Integrated Products Inc., Sunnyvale, CA, USA) placed in 10 cm tall individual solar-light housings with their batteries removed (Figure 4a). We installed 3 of these sensors in the north sections, 3 in the south section, and 4 in the center section of the bioswale (Figure 3b). Rainfall events led to the loss of half of these sensors before the end of 2019; therefore 7-day averages were calculated based on the sensors that were existing at the end of the study (Sensor 9 in north section; Sensors 1 and 3 in south section; Sensors 4 and 6 in center section).
2.3. Precipitation
We acquired daily precipitation data for 2018 and 2019 from the NWS station at Coleman A. Young International Airport. February 2018 and March 2019 were missing from this dataset and therefore were filled by using rainfall data for those two months from Detroit Metropolitan Wayne County Airport (https://w2.weather.gov/climate/ (accessed on 24 August 2020)). Weekly (7-day) totals were calculated using the 7 days preceding the day for which the value was reported.
2.4. Soil Moisture
We measured soil moisture on a weekly basis using the HydroSense II soil probe (Campbell Scientific Inc., Logan, UT, USA) (Figure 4b). Soil moisture measurements were taken at 33 sampling locations distributed throughout the bioswale and marked by numbered flags (Figure 3b). As feasible, measurements were taken between 10:30 a.m. and 2:30 p.m. local time, but always in daylight hours; measurements were not made on dates when soil was frozen. Data were recorded in a field notebook and subsequently entered into a spreadsheet. For standardization purposes, 7-day data preceded the measurement day. For example, a measurement taken on 3 January would be reported as 7 January, and a measurement taken on 13 January would be reported as 14 January.
2.5. Phenocams and Greenness
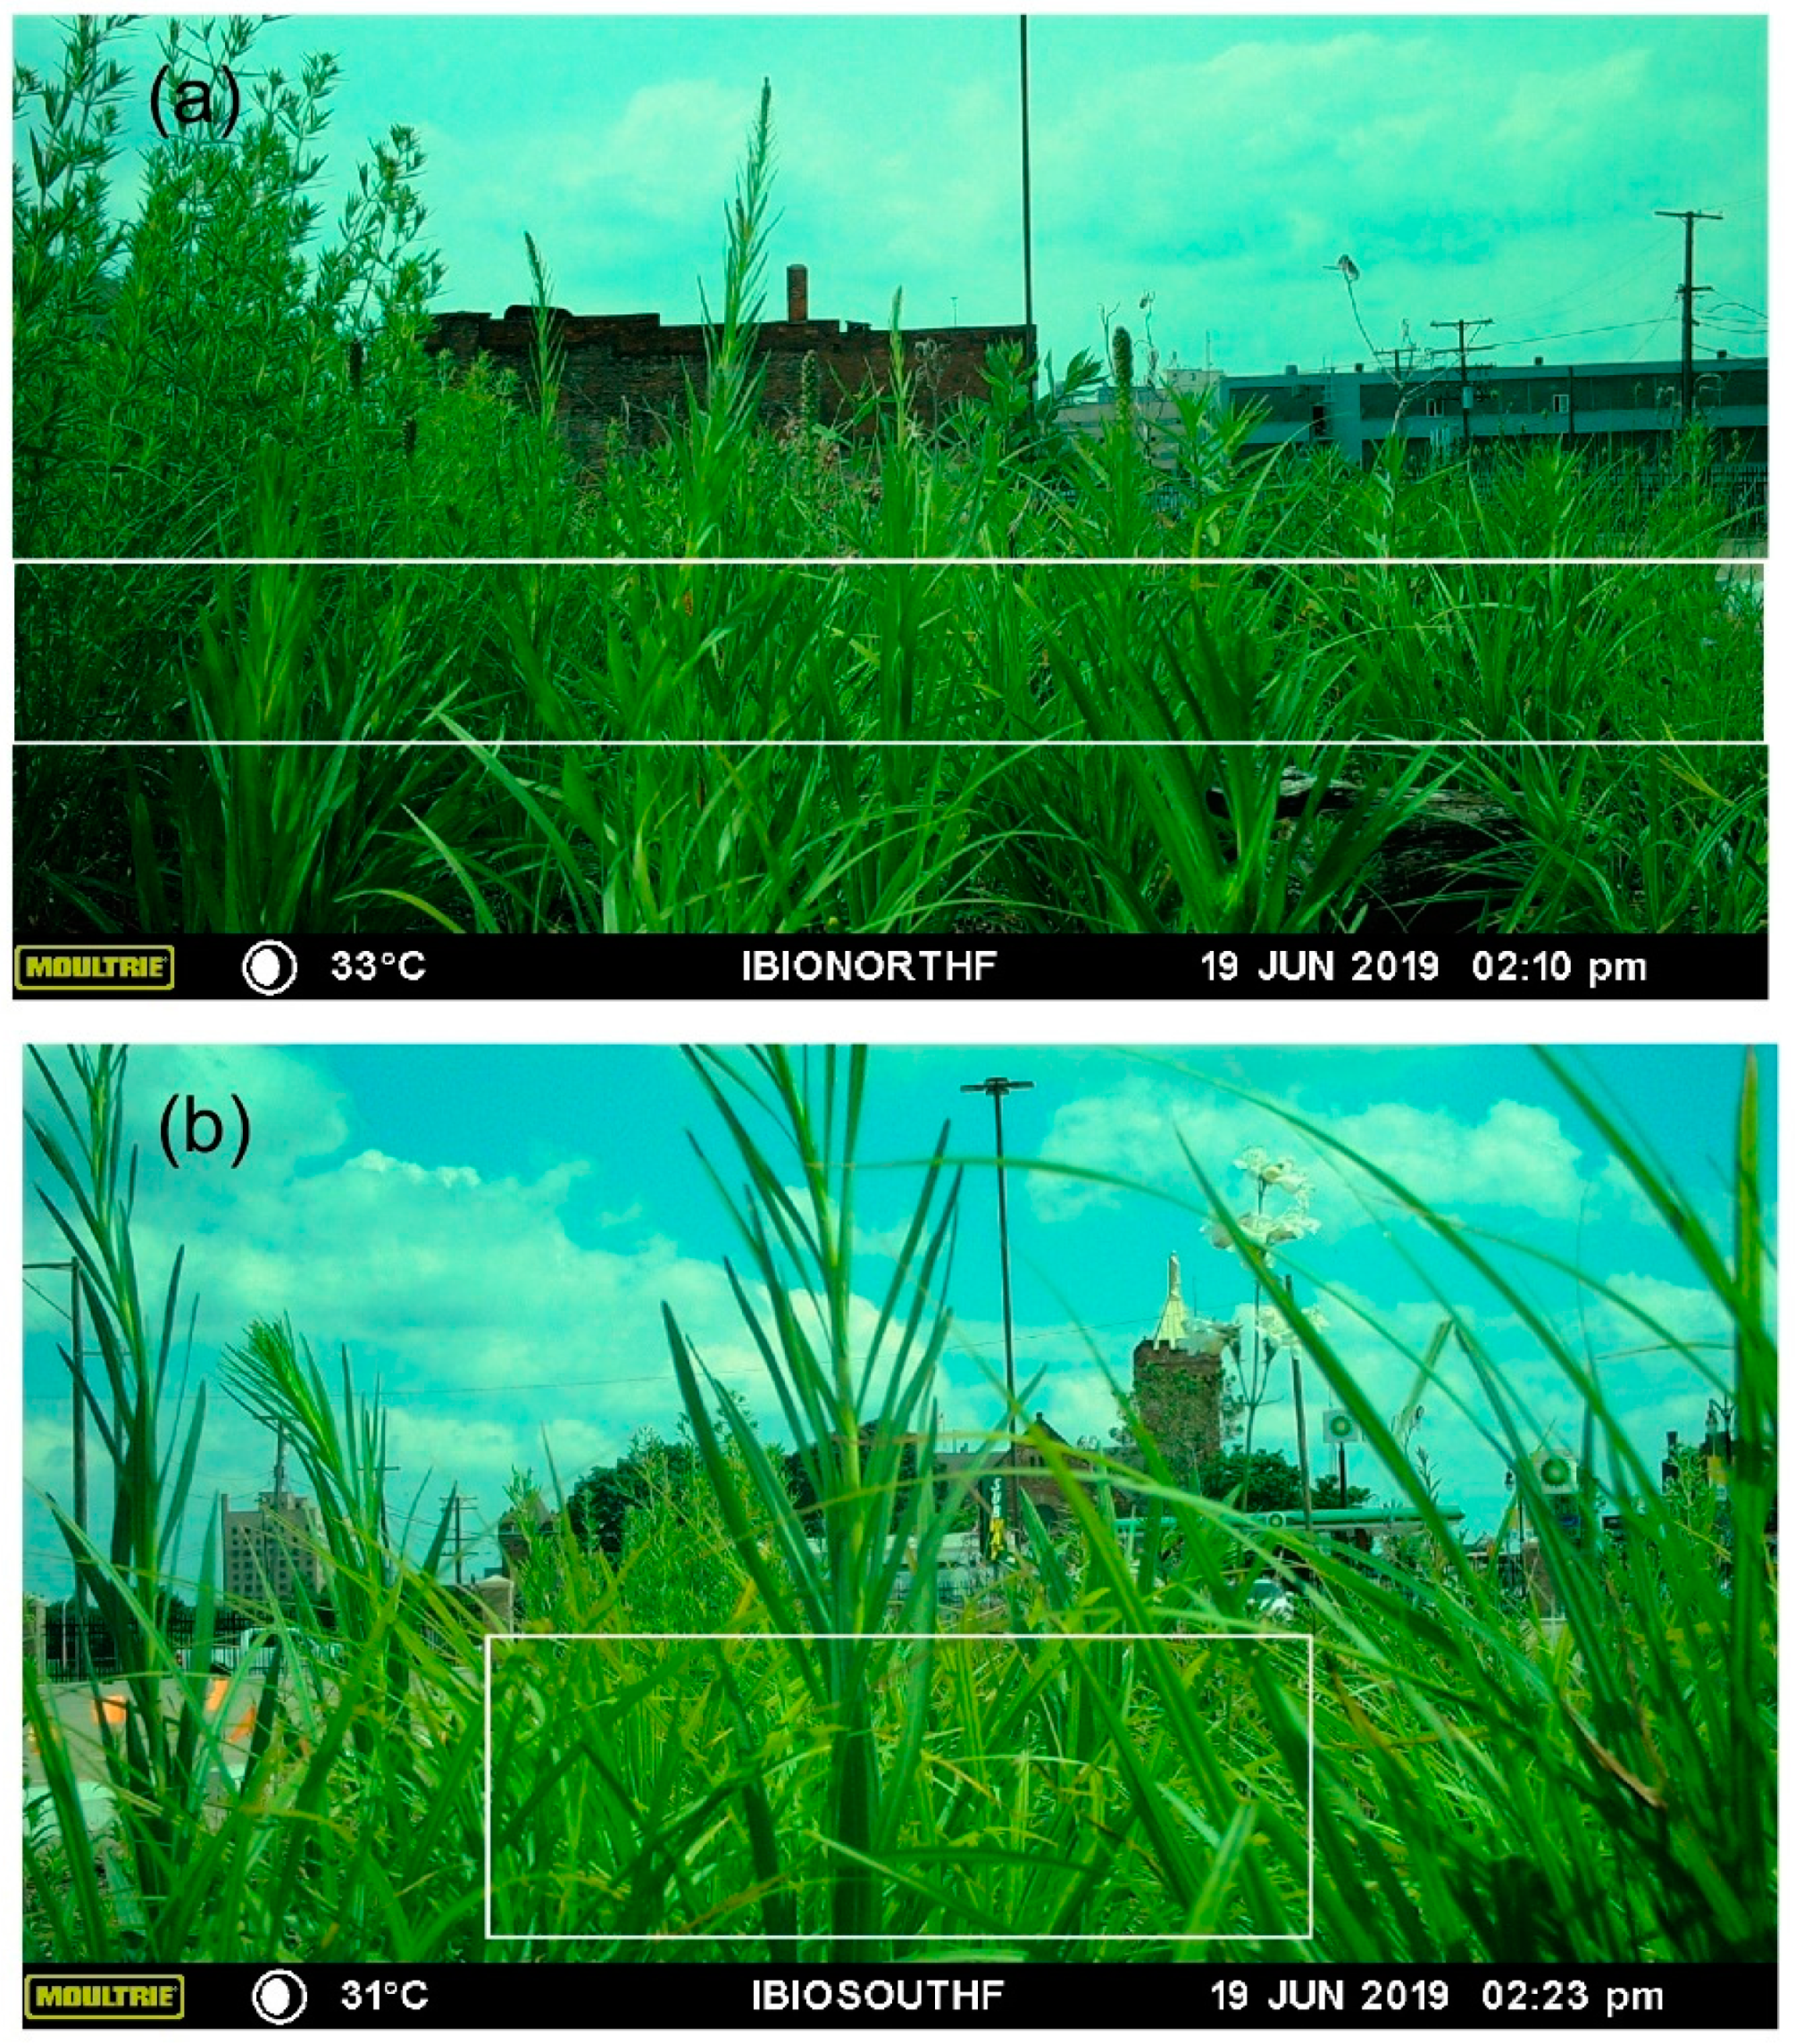
In spring 2018, we installed phenocams (Moultrie M-40i, EBSCO Industries Inc., Birmingham, AL, USA) at the north and south ends of the bioswale by attaching them to lampposts (Figure 3b and Figure 4c). These phenocams captured hourly digital images of the bioswale, hereafter referred to as north-facing (installed on the south-end lamppost) and south-facing (installed on the north-end lamppost). We retrieved these images weekly and subsequently sorted them into folders labeled by hour.
After sorting, 2 p.m. (in Eastern Standard Time) photos were used to estimate bioswale greenness because light conditions were best for image analysis. Images taken at 4 p.m. for the north-facing phenocam on days 13 September 2019 to 23 September 2019 and 4 October 2019 to 10 October 2019 were used in analysis. For each phenocam image, a static region of interest (ROI) was selected that would maximize the amount of plant material being analyzed in the image over time (Figure 5) [53]. As has been done in other studies [26], daily greenness (Ig) for each of those jpeg ROIs were calculated in MATLAB version 2018a (MathWorks, Natick, MA, USA) based on the relative intensities of red-green-blue pixels:
Each year, we normalized those daily greenness values for each phenocam using min-max normalization [26]. Then we averaged those north-facing and south-facing normalized greenness values to represent the bioswale greenness.
2.6. Stomatal Conductance
We measured stomatal conductance on a weekly basis between 9 a.m. and 11 a.m. throughout the growing season (23 April to 23 October), beginning in September of 2018 using an SC-1 leaf porometer (Decagon Devices, Pullman, WA, USA) (Figure 4d). Measurements were not made outside of the growing season (see Section 2.1) or on weeks when conditions were too wet for proper functioning of the porometer. At each visit to the bioswale, the porometer was calibrated in accordance with the user manual. After calibration, three plants from each of three species, i.e., Swamp Milkweed, Hoary Verbena, and Lanceleaf Coreopsis were measured (Figure 3b). We note that in July 2019, Lanceleaf Coreopsis succumbed to a suspected fungal infection in the bioswale, and measurements were halted on this species at that time. For each of the nine plants, we measured one low leaf, one mid-height leaf, and one high leaf to account for variability in stomatal conductance due to leaf positioning in the plant canopy. Ultimately, each plant species had 9 measurements. We averaged these nine measurements resulting in a single average weekly stomatal conductance value per species.
2.7. Water Use Efficiency
WUE is the ratio of water use to carbon uptake in plants [40], as suggested in Figure 1. For this study, we suggest that water use can be represented by stomatal conductance [54] and that carbon uptake can be represented by greenness [53]. Low values of stomatal conductance with high values of greenness would suggest a high WUE, whereas high values of stomatal conductance with high values of greenness might suggest a low WUE.
3. Results
3.1. Air and Near-Surface Temperatures
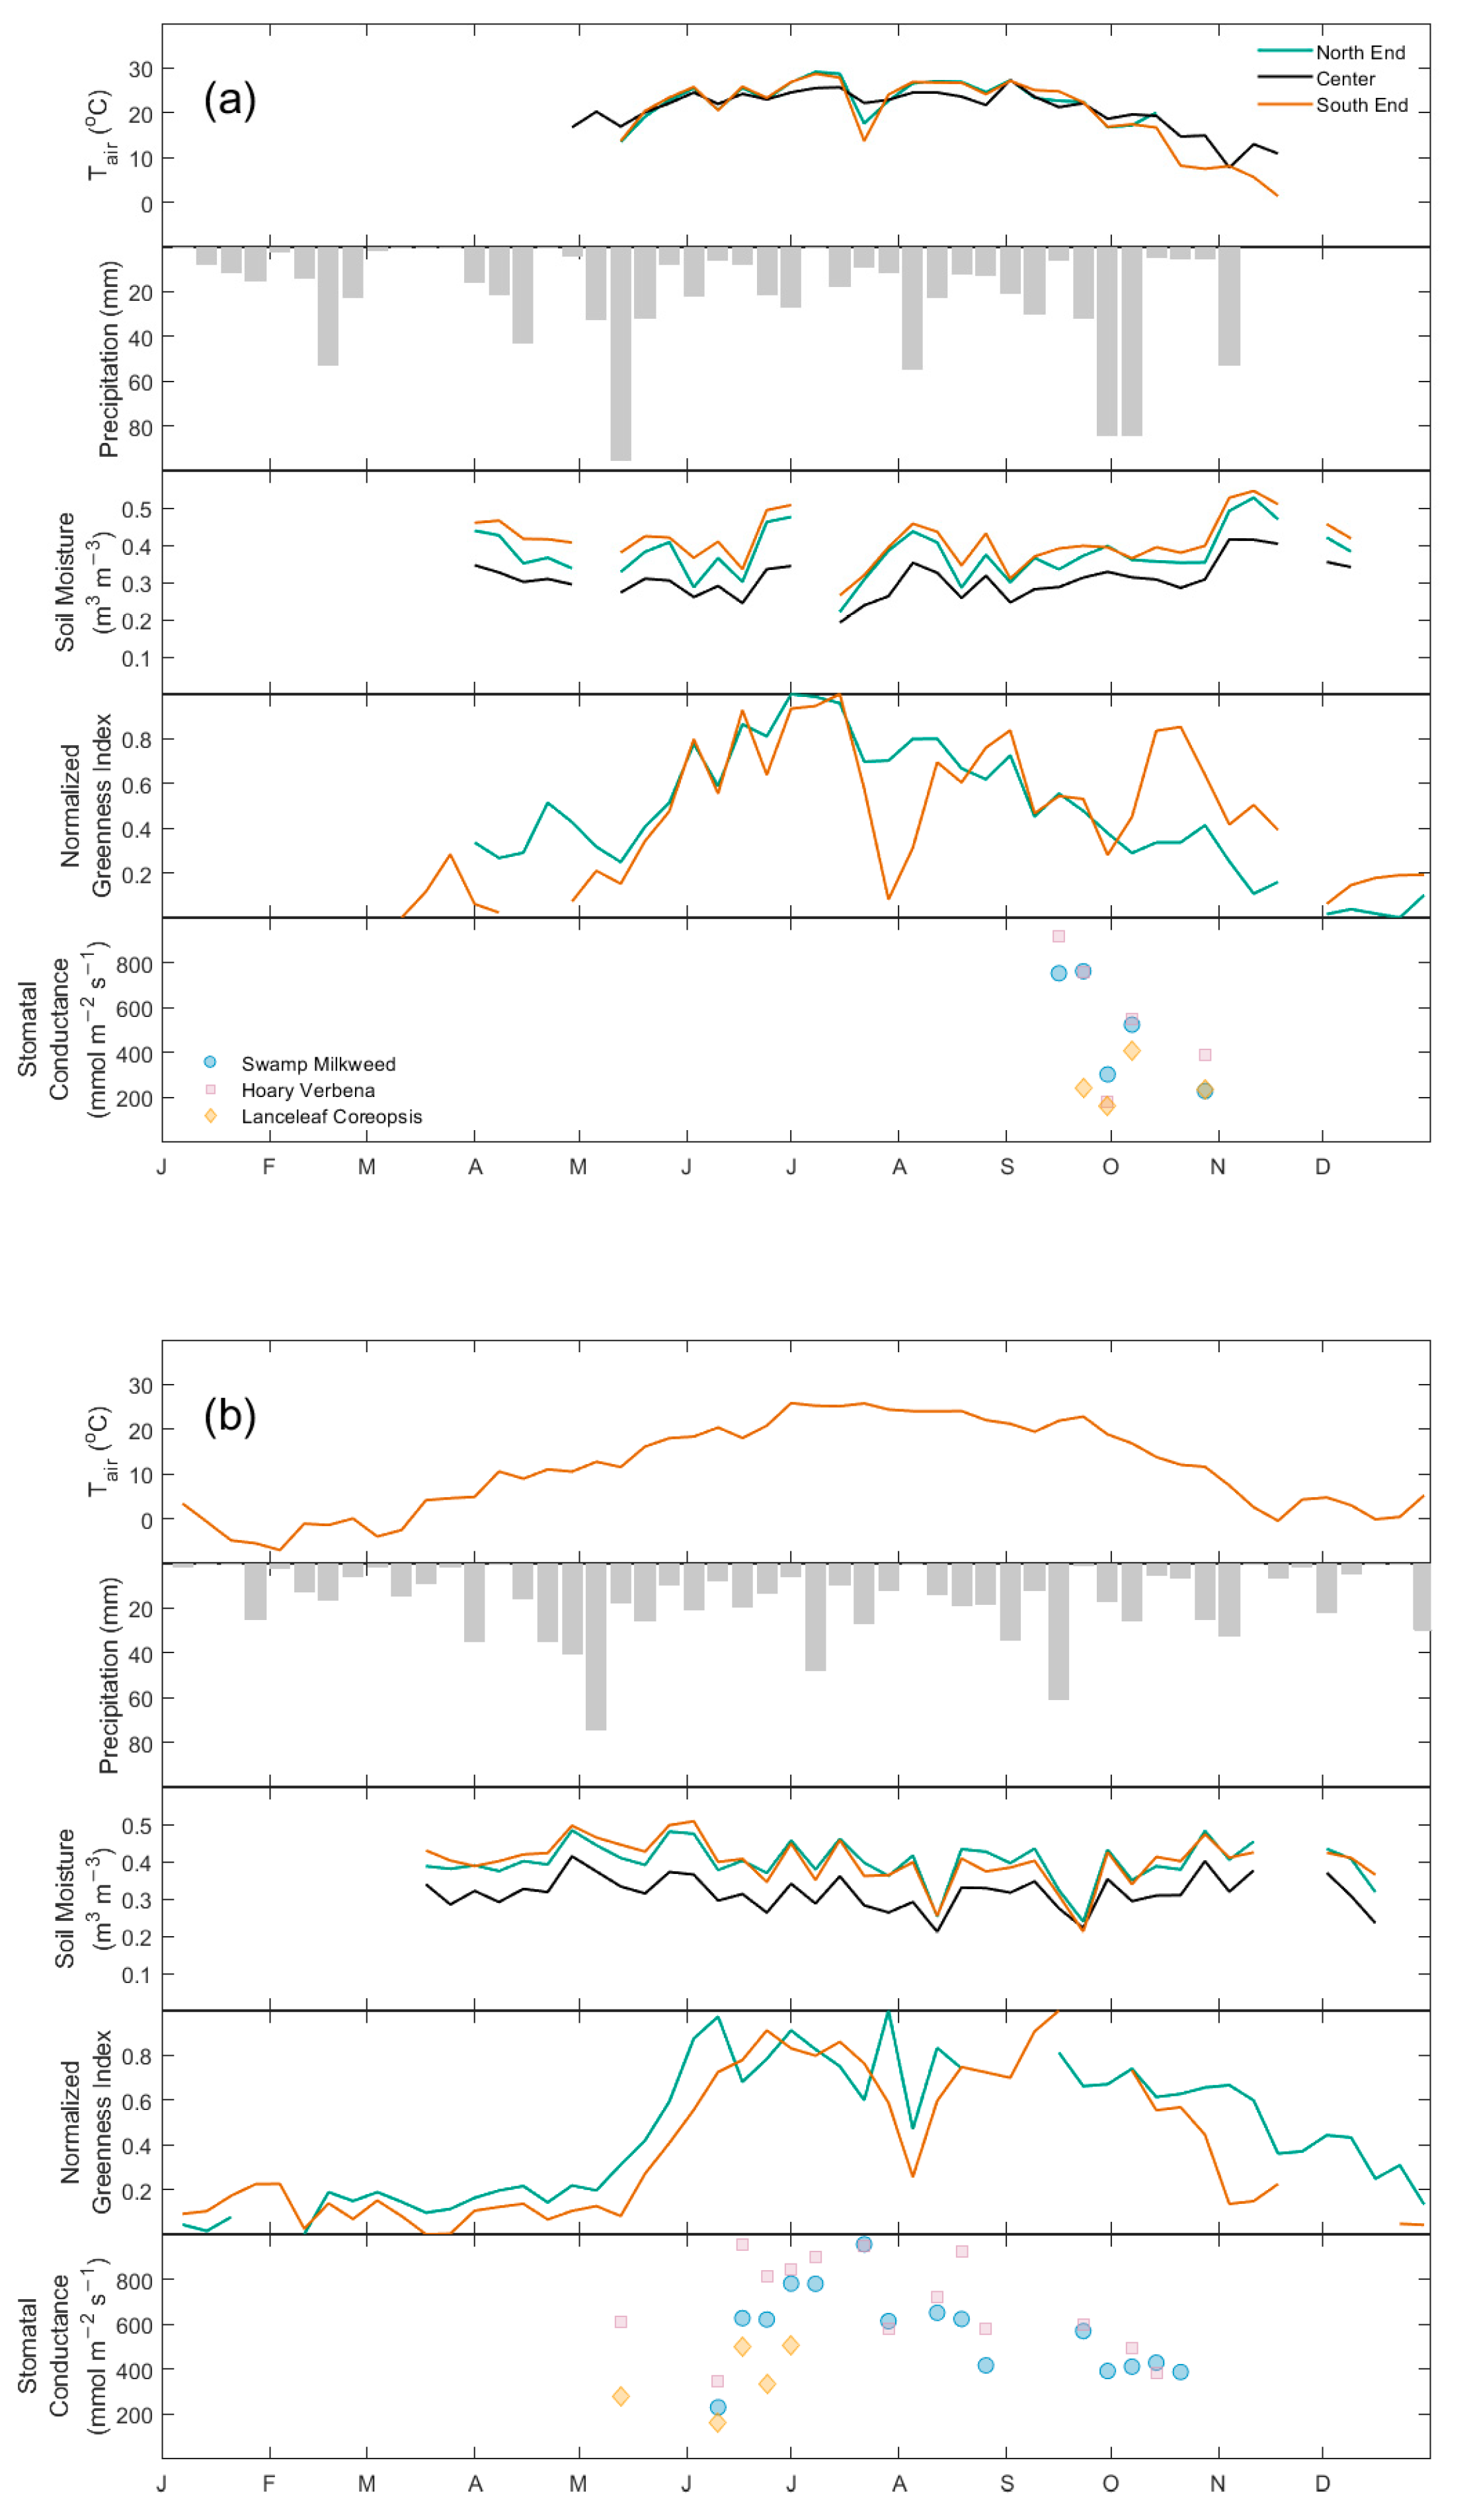
Mean air temperature generally increases from January to July or August, when it reaches its peak (Figure 6). The mean air temperature then tends to decrease from July/August to December. The mean temperature was 10.2 °C in 2018 and 10.0 °C in 2019. Both years have mean temperatures higher than the long-term mean temperature in Detroit of 9.0 °C [55]. In 2018 the coldest month was January with a mean temperature of −4.1 °C, and the hottest month was August with a mean temperature of 24.0 °C. The coldest month in 2019 was January, with a mean temperature of −4.5 °C, and the hottest month was July, with an average temperature of 24.7 °C. The maximum average daily temperature was on 5 July at 24.4 °C and on 20 July at 23.9 °C in 2018 and 2019, respectively. The minimum average daily temperature was on January 5 at −16.7 °C and 30 January at −20.6 °C in 2018 and 2019, respectively.
Near-surface temperatures at the bioswale also generally increase through the spring, reaching a peak in July, and then decrease again through December (Figure 6a). Near-surface temperatures are generally slightly higher than ambient air temperatures. However, near-surface temperatures are lower than ambient temperatures in July. The magnitudes of these differences change throughout the year and within different regions of the bioswale, with the greatest overall differences occurring in the central bioswale in May and October through December, and the smallest difference occurring in the central region from June to September.
3.2. Precipitation
The largest rainfall event in 2018 occurred on 12 May, with a total rainfall of 66.0 mm. The largest rainfall event in 2019 occurred on 30 April, with a total rainfall of 30.2 mm. The study site received 946.4 mm of total precipitation in 2018 and 807.0 mm in 2019. Both years exceeded Detroit’s average annual rainfall of 786.6 mm. The wettest month of 2018 was May, with a total rainfall of 159.0 mm. The wettest month of 2019 was April, with a total rainfall of 118.9 mm.
3.3. Soil Moisture
Soil moisture is variable throughout the year, responding to rainfall inputs. For instance, a major rainfall event (15.5 mm) on 1 August 2018 resulted in a soil moisture increase from 0.33 to 0.40 m3 m−3. The average annual soil moisture for 2018 and 2019 was 0.36 m3 m−3 in both years. In both years, the south end of the bioswale had the greatest average soil moisture (0.41 m3 m−3), while the central region had the lowest average soil moisture (0.31 m3 m−3) (Table 2). Average soil moisture values in the central region of the bioswale for 2018 and 2019 was 0.31 m3 m−3 in both years (Table 2). For 2019, the month with the highest average soil moisture was February (0.44 m3 m−3), while the month with the lowest soil moisture was January (0.30 m3 m−3).
3.4. Greenness
In general, greenness starts out low at the beginning of the year and peaks in summer (Figure 6). The north end of the bioswale had a mean growing season greenness of 0.61 and 0.67 in 2018 and 2019, respectively. The south end of the bioswale had a mean growing season greenness of 0.57 and 0.61 in 2018 and 2019, respectively. Annual mean greenness was 0.44 and 0.43 at the north and south ends of the bioswale, respectively (Table 2). Average greenness for 2019 (0.41) is lower than for 2018 (0.47) because of missing greenness data from the first two months of 2018. In 2018, June had the highest average greenness (0.68), and December had the lowest (0.23). In 2019, September had the highest average greenness (0.71), and January had the lowest (0.17).
At our study site, greenness tends to be explained by air temperature (Figure 7a); i.e., as temperature increases, so does greenness (R2 = 0.65; p < 0.01). This is contrary to soil moisture (Figure 7b), which is negatively correlated with greenness, but with considerable scatter (R2 = 0.08; p = 0.01).
3.5. Stomatal Conductance
Across all species, we see stomatal conductance generally increase from May to a peak in July and then decrease from July to October (Figure 6). Tap-rooted Hoary Verbena had the highest average stomatal conductance over both years (2-year mean = 657 mmol m−2 s−1); values for 2018 and 2019 were 560 and 692 mmol m−2 s−1, respectively (Table 2). The average stomatal conductance of Swamp Milkweed for 2018 and 2019 was 514 and 566 mmol m−2 s−1, respectively (2-year mean = 553 mmol m−2 s−1). Lanceleaf Coreopsis, the species with the least extensive root system, had the lowest average stomatal conductance, with averages for 2018 and 2019 of 262 and 357 mmol m−2 s−1, respectively (2-year mean = 315 mmol m−2 s−1). In 2019, stomatal conductance was highest in July and lowest in October for Hoary Verbena and Swamp Milkweed.
3.6. Water Use Efficiency
To assess WUE, we plotted regressions of greenness (i.e., carbon uptake) versus stomatal conductance (i.e., water use) (Figure 8). Notably, the plant species vary in their WUEs. Specifically, Swamp Milkweed, the species with the most extensive root system, varies the most widely with multiple values in the upper quadrats of the conceptual figure (Figure 1 and Figure 8). Hoary Verbena, with the tap root, also varies widely but falls mainly to the upper right quadrat, suggesting it tends to have high water use and low WUE. In contrast, Lanceleaf Coreopsis, with the least extensive root system, generally falls to the upper left quadrat. This suggests that Lanceleaf Coreopsis has the lowest water use and thus the highest WUE of the three species at the bioswale.
4. Discussion
4.1. Temporal Variability of Bioswale Ecohydrology
Results suggest that the ecohydrology of bioswales varies throughout the year. For instance, the stomatal conductance of all plant species peaks in July (Figure 6a). This suggests that these bioswale plants may be most effective at taking up and diverting stormwater during this time. Interannual variations in bioswale ecohydrology have been observed in multiple ways. For instance, seasonal variations in infiltration due to temperature changes were observed within a retrofitted Pervious Concrete Infiltration Basin (PCIB) on Villanova University’s campus near Philadelphia, Pennsylvania [56].
Other studies suggest that variability in soil moisture throughout the year (Figure 6) is important for vegetation growth and establishment [57]. One study argued that relatively drier summer conditions provided a window of opportunity for bioswale vegetation, enabling seed germination and encouraging plant growth [39]. Findings include the highest stomatal conductance in the growing season, a time period when soil moisture was not highest but likely when atmospheric demand and temperatures were greatest [39]. Our results support this assertion by demonstrating that biomass accumulation does not appear to be a function of soil moisture but does appear to be strongly controlled by temperature (Figure 7).
The temporal variability of ecohydrology in urban GI highlights the importance of continuous and long-term monitoring of these systems in order to understand their functioning [56]. Notably, these seasonal variations will have implications on the design and management of GI for stormwater management. This is especially important as managers consider the sustainability of these GI systems in the context of changes in precipitation patterns as a result of climate change [58]. For instance, Detroit, MI is expected to see heavier rainfall events near the end of the growing season (Figure 6).
4.2. Bioswale Function and Plants
Our results suggest that ecohydrological functions are species-specific. For instance, the stomatal conductance measurements suggest that physiological response and associated water use from the bioswale are species-specific (Figure 6). Other studies have surmised that increases in stomatal conductance represent increased transpiration [44]. Observed differences in stomatal conductance between species were noted as suggesting that not all species will contribute equally to bioswale function [44,47]. These results support that species selection in bioswale design will play an important role in determining the ability of GI to manage stormwater and minimize its contribution to combined sewer systems [59]. Additional considerations to the relationship between transpiration and belowground microbial communities are needed [47].
At our study site, WUE and temporal variations in WUE were also species-specific. Because it had WUE in all quadrats (Figure 1 and Figure 8), Swamp Milkweed, the species with the most extensive root system, may be the most sensitive to changing hydrologic conditions. In contrast, Lanceleaf Coreopsis, with the least extensive root system, generally showed lower stomatal conductance that would lead to lower transpiration. This suggests that Lanceleaf Coreopsis has the lowest water use and highest WUE of the three species under these conditions at this bioswale. While this may be desirable in GI implemented in semiarid cities [23,24,26], high WUE is probably not particularly effective for stormwater management goals of GI implemented in humid cities. With a tap root, Hoary Verbena varied widely (Figure 8) but tended to have high water use and low WUE (Figure 8) and may be well-suited to GI implemented for stormwater management in humid cities such as Detroit, MI.
5. Conclusions
While green infrastructure such as retrofitted bioswales has been implemented in large cities to provide cost-effective ecosystem services such as stormwater management, the maintenance of these isolated vegetated patches of the landscape has largely been ignored. A better understanding of the ecohydrological processes and how the ecohydrology influences the function of green infrastructure and its potential to provide ecosystem services could improve the long-term viability of these efforts. Our study suggests that soil moisture and temperature within retrofitted bioswales are storm-specific and patchy, making it difficult to draw broad conclusions. However, results from our study do suggest that plant characteristics such as WUE impact the ecohydrological processes within bioswales; some plants such as the shallow-rooted Lanceleaf Coreopsis may be better suited for bioswales under water-limited conditions whereas others such as Hoary Verbena with a deeper tap root may be better suited in wet humid conditions where saturated soils are more common. Therefore, to allow for full and sustained success, retrofitted bioswales plants should be carefully selected and possibly adapted over time to meet environmental demands and maximize their ecosystem service potential. This is especially important in shrinking cities where the need for cost-effective strategies that make use of vacant and abandoned space is particularly valuable.
Author Contributions
Conceptualization, S.A.P. and S.K.; methodology, S.A.P. and S.K.; formal analysis, S.A.P., E.S., S.K. and K.H.; investigation, E.S., S.K. and K.H.; resources, S.A.P.; data curation, S.A.P., E.S., S.K. and K.H.; writing—original draft preparation, S.A.P., E.S. and S.K.; writing—review and editing, S.A.P., E.S. and K.H.; supervision, S.A.P. and K.H.; project administration, S.A.P.; funding acquisition, S.A.P. and S.K. All authors have read and agreed to the published version of the manuscript.
Funding
We are grateful to Richard Barber and his Interdisciplinary Research Program at Wayne State University for enabling this research. This research is also supported by NSF CNH award 1518376, NSF SRN award 1444758, and NSF MCA award 2126206.
Data Availability Statement
Weekly field measurement data are available in HydroShare: http://www.hydroshare.org/resource/c2ded31dc83c42c980500e47a380a3c4 (accessed on 23 August 2022).
Acknowledgments
We offer a special thank you to Anastasia Alexandrova, Michelle Serreyn, Tim Dittrich, and Shariat Mobasser for their initial contributions to the study. We would also like to thank the Detroit Biodiversity Network for their assistance in maintaining the Parking Lot 12 bioswale. Finally, we are grateful for the help from multiple field assistants including Alexander Eklund, Natalie Lyon, Adam Pruett, Isidore Harris, Orlando Rios, Oluwafemi Aregbesola, Kennadi Rankin, Connor Socrates, Elana Chan, Anastasia Alexandrova, and Amy Leslie. This manuscript version has also benefited from the input of Cecily Valdez.
Conflicts of Interest
The authors declare no conflict of interest.
References
- Varis, O.; Biswas, A.K.; Tortajada, C.; Lundqvist, J. Megacities and water management. Int. J. Water Resour. Dev. 2006, 22, 377–394. [Google Scholar] [CrossRef]
- Fletcher, T.D.; Andrieu, H.; Hamel, P. Understanding, management and modelling of urban hydrology and its consequences for receiving waters: A state of the art. Adv. Water Resour. 2013, 51, 261–279. [Google Scholar] [CrossRef]
- Faust, K.M.; Abraham, D.M.; DeLaurentis, D. Coupled Human and Water Infrastructure Systems Sector Interdependencies: Framework Evaluating the Impact of Cities Experiencing Urban Decline. J. Water Resour. Plan. Manag. 2017, 143, 04017043. [Google Scholar] [CrossRef]
- Schilling, J.; Logan, J. Greening the Rust Belt A Green Infrastructure Model for Right Sizing America’s Shrinking Cities. J. Am. Plan. Assoc. 2008, 74, 451–466. [Google Scholar] [CrossRef]
- Herrmann, D.L.; Shuster, W.D.; Mayer, A.L.; Garmestani, A.S. Sustainability for Shrinking Cities. Sustainability 2016, 8, 911. [Google Scholar] [CrossRef]
- Faust, K.M.; Abraham, D.M. Impact Assessment of Stormwater Alternatives on Generated Runoff in Cities Experiencing Urban Decline. Icsdec 2016 Integr. Data Sci. Constr. Sustain. 2016, 145, 540–547. [Google Scholar] [CrossRef]
- Ghofrani, Z.; Sposito, V.; Faggian, R. Maximising the Value of Natural Capital in a Changing Climate through the Integration of Blue-Green Infrastructure. J. Sustain. Dev. Energy Water Environ. Syst. Jsdewes 2020, 8, 213–234. [Google Scholar] [CrossRef]
- Phillips, P.J.; Chalmers, A.T.; Gray, J.L.; Kolpin, D.W.; Foreman, W.T.; Wall, G.R. Combined Sewer Overflows: An Environmental Source of Hormones and Wastewater Micropollutants. Environ. Sci. Technol. 2012, 46, 5336–5343. [Google Scholar] [CrossRef]
- Hoover, F.A.; Hopton, M.E. Developing a framework for stormwater management: Leveraging ancillary benefits from urban greenspace. Urban Ecosyst. 2019, 22, 1139–1148. [Google Scholar] [CrossRef]
- Herrmann, D.L.; Shuster, W.D.; Garmestani, A.S. Vacant urban lot soils and their potential to support ecosystem services. Plant Soil 2017, 413, 45–57. [Google Scholar] [CrossRef]
- Taguchi, V.J.; Weiss, P.T.; Gulliver, J.S.; Klein, M.R.; Hozalski, R.M.; Baker, L.A.; Finlay, J.C.; Keeler, B.L.; Nieber, J.L. It Is Not Easy Being Green: Recognizing Unintended Consequences of Green Stormwater Infrastructure. Water 2020, 12, 522. [Google Scholar] [CrossRef]
- Bolund, P.; Hunhammar, S. Ecosystem services in urban areas. Ecol. Econ. 1999, 29, 293–301. [Google Scholar] [CrossRef]
- Coutts, C.; Hahn, M. Green Infrastructure, Ecosystem Services, and Human Health. Int. J. Environ. Res. Public Health 2015, 12, 9768–9798. [Google Scholar] [CrossRef] [PubMed]
- Norton, B.A.; Coutts, A.M.; Livesley, S.J.; Harris, R.J.; Hunter, A.M.; Williams, N.S.G. Planning for cooler cities: A framework to prioritise green infrastructure to mitigate high temperatures in urban landscapes. Landsc. Urban Plan. 2015, 134, 127–138. [Google Scholar] [CrossRef]
- Filazzola, A.; Shrestha, N.; MacIvor, J.S. The contribution of constructed green infrastructure to urban biodiversity: A synthesis and meta-analysis. J. Appl. Ecol. 2019, 56, 2131–2143. [Google Scholar] [CrossRef]
- Meerow, S.; Newell, J.P. Spatial planning for multifunctional green infrastructure: Growing resilience in Detroit. Landsc. Urban Plan. 2017, 159, 62–75. [Google Scholar] [CrossRef]
- Elliott, R.M.; Motzny, A.E.; Majd, S.; Chavez, F.J.V.; Laimer, D.; Orlove, B.S.; Culligan, P.J. Identifying linkages between urban green infrastructure and ecosystem services using an expert opinion methodology. Ambio 2020, 49, 569–583. [Google Scholar] [CrossRef]
- Liu, Y.Z.; Engel, B.A.; Flanagan, D.C.; Gitau, M.W.; McMillan, S.K.; Chaubey, I. A review on effectiveness of best management practices in improving hydrology and water quality: Needs and opportunities. Sci. Total Environ. 2017, 601, 580–593. [Google Scholar] [CrossRef]
- Pour, S.H.; Abd Wahab, A.K.; Shahid, S.; Asaduzzaman, M.; Dewan, A. Low impact development techniques to mitigate the impacts of climate-change-induced urban floods: Current trends, issues and challenges. Sustain. Cities Soc. 2020, 62, 102373. [Google Scholar] [CrossRef]
- Wang, R.R.; Eckelman, M.J.; Zimmerman, J.B. Consequential Environmental and Economic Life Cycle Assessment of Green and Gray Stormwater Infrastructures for Combined Sewer Systems. Environ. Sci. Technol. 2013, 47, 11189–11198. [Google Scholar] [CrossRef]
- Kurc, S.A.; Small, E.E. Soil moisture variations and ecosystem-scale fluxes of water and carbon in semiarid grassland and shrubland. Water Resour. Res. 2007, 43, W06416. [Google Scholar] [CrossRef]
- Hale, R.L.; Turnbull, L.; Earl, S.R.; Childers, D.L.; Grimm, N.B. Stormwater Infrastructure Controls Runoff and Dissolved Material Export from Arid Urban Watersheds. Ecosystems 2015, 18, 62–75. [Google Scholar] [CrossRef]
- Wang, Z.H.; Zhao, X.X.; Yang, J.C.; Song, J.Y. Cooling and energy saving potentials of shade trees and urban lawns in a desert city. Appl. Energy 2016, 161, 437–444. [Google Scholar] [CrossRef]
- Yang, J.C.; Wang, Z.H. Planning for a sustainable desert city: The potential water buffering capacity of urban green infrastructure. Landsc. Urban Plan. 2017, 167, 339–347. [Google Scholar] [CrossRef]
- Fahmy, M.; Ibrahim, Y.; Hanafi, E.; Barakat, M. Would LEED-UHI greenery and high albedo strategies mitigate climate change at neighborhood scale in Cairo, Egypt? Build. Simul. 2018, 11, 1273–1288. [Google Scholar] [CrossRef]
- Luketich, A.M.; Papuga, S.A.; Crimmins, M.A. Ecohydrology of urban trees under passive and active irrigation in a semiarid city. PLoS ONE 2019, 14, e0224804. [Google Scholar] [CrossRef]
- Brisson, J.; Chazarenc, F. Maximizing pollutant removal in constructed wetlands: Should we pay more attention to macrophyte species selection? Sci. Total Environ. 2009, 407, 3923–3930. [Google Scholar] [CrossRef]
- Payne, E.G.I.; Pham, T.; Deletic, A.; Hatt, B.E.; Cook, P.L.M.; Fletcher, T.D. Which species? A decision-support tool to guide plant selection in stormwater biofilters. Adv. Water Resour. 2018, 113, 86–99. [Google Scholar] [CrossRef]
- Funai, J.T.; Kupec, P. Exploring Planting and Filter Media in Stormwater Bioremediating Landscapes: A Review. Water Air Soil Pollut. 2017, 228, 9. [Google Scholar] [CrossRef]
- Rodriguez-Iturbe, I.; D’Odorico, P.; Laio, F.; Ridolfi, L.; Tamea, S. Challenges in humid land ecohydrology: Interactions of water table and unsaturated zone with climate, soil, and vegetation. Water Resour. Res. 2007, 43, W09301. [Google Scholar] [CrossRef]
- Geris, J.; Tetzlaff, D.; McDonnell, J.J.; Soulsby, C. Spatial and temporal patterns of soil water storage and vegetation water use in humid northern catchments. Sci. Total Environ. 2017, 595, 486–493. [Google Scholar] [CrossRef] [PubMed]
- Kurc, S.A.; Small, E.E. Dynamics of evapotranspiration in semiarid grassland and shrubland ecosystems during the summer monsoon season, central New Mexico. Water Resour. Res. 2004, 40, W09305. [Google Scholar] [CrossRef]
- Newman, B.D.; Vivoni, E.R.; Groffman, A.R. Surface water-groundwater interactions in semiarid drainages of the American southwest. Hydrol. Process. 2006, 20, 3371–3394. [Google Scholar] [CrossRef]
- Callow, J.N.; Smettem, K.R.J. The effect of farm dams and constructed banks on hydrologic connectivity and runoff estimation in agricultural landscapes. Environ. Model. Softw. 2009, 24, 959–968. [Google Scholar] [CrossRef]
- Porporato, A.; Feng, X.; Manzoni, S.; Mau, Y.; Parolari, A.J.; Vico, G. Ecohydrological modeling in agroecosystems: Examples and challenges. Water Resour. Res. 2015, 51, 5081–5099. [Google Scholar] [CrossRef]
- Berland, A.; Shiflett, S.A.; Shuster, W.D.; Garmestani, A.S.; Goddard, H.C.; Herrmann, D.L.; Hopton, M.E. The role of trees in urban stormwater management. Landsc. Urban Plan. 2017, 162, 167–177. [Google Scholar] [CrossRef] [PubMed]
- Skorobogatov, A.; He, J.X.; Chu, A.; Valeo, C.; van Duin, B. The impact of media, plants and their interactions on bioretention performance: A review. Sci. Total Environ. 2020, 715, 136918. [Google Scholar] [CrossRef]
- Elliott, R.M.; Gibson, R.A.; Carson, T.B.; Marasco, D.E.; Culligan, P.J.; McGillis, W.R. Green roof seasonal variation: Comparison of the hydrologic behavior of a thick and a thin extensive system in New York City. Environ. Res. Lett. 2016, 11, 1–15. [Google Scholar] [CrossRef]
- Mazer, G.; Booth, D.; Ewing, K. Limitations to vegetation establishment and growth in biofiltration swales. Ecol. Eng. 2001, 17, 429–443. [Google Scholar] [CrossRef]
- Hatfield, J.L.; Dold, C. Water-Use Efficiency: Advances and Challenges in a Changing Climate. Front. Plant Sci. 2019, 10, 00103. [Google Scholar] [CrossRef] [Green Version]
- Barradas, V.L.; Pablo Ruiz-Cordova, J.; Esperon-Rodriguez, M. Microclimatology and ecophysiology of the urban vegetation of a city with tropical climate modified by altitude in Mexico. Bot. Sci. 2016, 94, 775–786. [Google Scholar] [CrossRef]
- Tirpak, R.A.; Hathaway, J.M.; Franklin, J.A. Evaluating the influence of design strategies and meteorological factors on tree transpiration in bioretention suspended pavement practices. Ecohydrology 2018, 11, e2037. [Google Scholar] [CrossRef]
- Voyde, E.; Fassman, E.; Simcock, R.; Wells, J. Quantifying Evapotranspiration Rates for New Zealand Green Roofs. J. Hydrol. Eng. 2010, 15, 395–403. [Google Scholar] [CrossRef]
- Scharenbroch, B.C.; Morgenroth, J.; Maule, B. Tree Species Suitability to Bioswales and Impact on the Urban Water Budget. J. Environ. Qual. 2016, 45, 199–206. [Google Scholar] [CrossRef] [PubMed]
- Tan, P.Y.; Wong, N.H.; Tan, C.L.; Jusuf, S.K.; Schmiele, K.; Chiam, Z.Q. Transpiration and cooling potential of tropical urban trees from different native habitats. Sci. Total Environ. 2020, 705, 135764. [Google Scholar] [CrossRef]
- Tu, M.-c.; Caplan, J.S.; Eisenman, S.S.W.; Wadzuk, B.M. When Green Infrastructure Turns Grey: Plant Water Stress as a Consequence of Overdesign in a Tree Trench System. Water 2020, 12, 573. [Google Scholar] [CrossRef]
- Brodsky, O.L.; Shek, K.L.; Dinwiddie, D.; Bruner, S.G.; Gill, A.S.; Hoch, J.M.; Palmer, M.I.; McGuire, K.L. Microbial Communities in Bioswale Soils and Their Relationships to Soil Properties, Plant Species, and Plant Physiology. Front. Microbiol. 2019, 10, 02368. [Google Scholar] [CrossRef]
- Galli, A.; Peruzzi, C.; Beltrame, L.; Cislaghi, A.; Masseroni, D. Evaluating the infiltration capacity of degraded vs. rehabilitated urban greenspaces: Lessons learnt from a real-world Italian case study. Sci. Total Environ. 2021, 787, 147612. [Google Scholar] [CrossRef]
- Basso, B.; Ritchie, J.T. Evapotranspiration in High-Yielding Maize and under Increased Vapor Pressure Deficit in the US Midwest. Agric. Environ. Lett. 2018, 3, 170039. [Google Scholar] [CrossRef]
- Berglund, L. The Shrinking City as a Growth Machine: Detroit’s Reinvention of Growth through Triage, Foundation Work and Talent Attraction. Int. J. Urban Reg. Res. 2020, 44, 219–247. [Google Scholar] [CrossRef]
- Peel, M.C.; Finlayson, B.L.; McMahon, T.A. Updated world map of the Koppen-Geiger climate classification. Hydrol. Earth Syst. Sci. 2007, 11, 1633–1644. [Google Scholar] [CrossRef]
- Ivey, C.T.; Martinez, P.; Wyatt, R. Variation in pollinator effectiveness in swamp milkweed, Asclepias incarnata (Apocynaceae). Am. J. Bot. 2003, 90, 214–225. [Google Scholar] [CrossRef] [PubMed]
- Kurc, S.A.; Benton, L.M. Digital image-derived greenness links deep soil moisture to carbon uptake in a creosotebush-dominated shrubland. J. Arid Environ. 2010, 74, 585–594. [Google Scholar] [CrossRef]
- Whitehead, D. Regulation of stomatal conductance and transpiration in forest canopies. Tree Physiol. 1998, 18, 633–644. [Google Scholar] [CrossRef] [PubMed]
- Howard, J.L.; Shuster, W.D. Experimental Order 1 soil survey of vacant urban land, Detroit, Michigan, USA. CATENA 2015, 126, 220–230. [Google Scholar] [CrossRef]
- Emerson, C.H.; Traver, R.G. Multiyear and seasonal variation of infiltration from storm-water best management practices. J. Irrig. Drain. Eng. 2008, 134, 598–605. [Google Scholar] [CrossRef]
- Alizadehtazi, B.; Gurian, P.L.; Montalto, F.A. Observed variability in soil moisture in engineered urban green infrastructure systems and linkages to ecosystem services. J. Hydrol. 2020, 590, 125381. [Google Scholar] [CrossRef]
- Kapetas, L.; Fenner, R. Integrating blue-green and grey infrastructure through an adaptation pathways approach to surface water flooding. Philos. Trans. R. Soc. A-Math. Phys. Eng. Sci. 2020, 378, 20190204. [Google Scholar] [CrossRef]
- Thienelt, T.S.; Anderson, D.E. Estimates of energy partitioning, evapotranspiration, and net ecosystem exchange of CO2 for an urban lawn and a tallgrass prairie in the Denver metropolitan area under contrasting conditions. Urban Ecosyst. 2021, 24, 1201–1220. [Google Scholar] [CrossRef]
Figure 1.
A conceptual relationship between biomass gain (i.e., greenness) and water loss (i.e., stomatal conductance) displaying suitability of WUE for urban stormwater management.
Figure 1.
A conceptual relationship between biomass gain (i.e., greenness) and water loss (i.e., stomatal conductance) displaying suitability of WUE for urban stormwater management.

Figure 2.
Geographic locations of the GI projects in Detroit, MI. Geographical locations of the GI Projects were downloaded from the City of Detroit Open Data Portal (https://data.detroitmi.gov/ (accessed on 23 August 2022)).
Figure 2.
Geographic locations of the GI projects in Detroit, MI. Geographical locations of the GI Projects were downloaded from the City of Detroit Open Data Portal (https://data.detroitmi.gov/ (accessed on 23 August 2022)).

Figure 3.
Description of the bioswale site with (a) an aerial photograph of Wayne State University’s Parking Lot 12 (with the bioswale outlined in a red rectangle) and (b) field survey plots of soil moisture, air temperature, surface water stage and temperature, and stomatal conductance. The aerial photograph was acquired from Google Earth (https://earth.google.com/ (accessed on 24 August 2022)).

Figure 4.
Site photographs of the field survey and instruments illustrating (a) iButtons in solar-light housing, (b) weekly soil moisture measurements, (c) a phenocam mounted on south lamppost, (d) weekly stomatal conductance measurements, and (e) a pressure transducer at one of the inputs to the bioswale after a rainstorm.

Figure 5.
Sample images acquired at 14:00 on 19 June 2019 (EST) from (a) the south-facing and (b) the north-facing phenocams. Regions of interest (ROIs) are outlined in white rectangles.
Figure 5.
Sample images acquired at 14:00 on 19 June 2019 (EST) from (a) the south-facing and (b) the north-facing phenocams. Regions of interest (ROIs) are outlined in white rectangles.

Figure 6.
Weekly air temperature, precipitation, soil moisture, normalized greenness index, and stomatal conductance measurements in (a) 2018 and (b) 2019.
Figure 6.
Weekly air temperature, precipitation, soil moisture, normalized greenness index, and stomatal conductance measurements in (a) 2018 and (b) 2019.

Figure 7.
Relationships of the normalized greenness index with (a) air temperature and (b) soil moisture. Black lines indicate linear regression lines.
Figure 7.
Relationships of the normalized greenness index with (a) air temperature and (b) soil moisture. Black lines indicate linear regression lines.

Figure 8.
Relationships of the normalized greenness index with stomatal conductance from three species.
Figure 8.
Relationships of the normalized greenness index with stomatal conductance from three species.


Table 1.
Previous ecohydrological evaluation of green infrastructure.
| Reference | City | Climate/ Annual Rainfall * | Relevant Measurements |
|---|---|---|---|
| Barradas et al. [41] | Puebla, Mexico | Temperate, humid; 827 mm | Stomatal conductance; leaf water potential |
| Tirpak et al. [42] | Knoxville, Tennessee | Temperate; 1271 mm | Sap flow |
| Voyde et al. [43] | Auckland, New Zealand | Temperate; 1284 mm | Evapotranspiration |
| Scharenbroch et al. [44] | Chicago, Illinois | Temperate; 918 mm | Stomatal conductance |
| Tan et al. [45] | Singapore | Tropical; 2378 mm | Sap flow, leaf stomatal conductance, total canopy area |
| Luketich et al. [26] | Tucson, Arizona | Semiarid; 301 mm | Sap velocity, canopy greenness, leaf area index |
| Tu et al. [46] | Philadelphia, Pennsylvania | Temperate; 1113 mm | Leaf water potential, stomatal Conductance |
| Brodsky et al. [47] | New York, New York | Temperate; 1144 mm | Stomatal conductance |
| Galli et al. [48] | Milan, Italy | Temperate; 1162 mm | Fractional vegetation cover |
Note: * Climate data retrieved from: https://en.climate-data.org/ (accessed on 16 September 2022).
Table 2.
Mean and standard deviation (SD) of ecohydrological measurements.
| Measurement | Location/Species | Mean | SD |
|---|---|---|---|
| Soil Moisture (m3 m−3) | North End | 0.39 | 0.06 |
| Center | 0.31 | 0.05 | |
| South End | 0.41 | 0.06 | |
| Normalized Greenness Index | North End | 0.44 | 0.20 |
| South End | 0.43 | 0.22 | |
| Stomatal Conductance (mmol m−2 s−1) | Swamp Milkweed | 553 | 200 |
| Hoary Verbena | 657 | 232 | |
| Lanceleaf Coreopsis | 315 | 132 |
Publisher’s Note: MDPI stays neutral with regard to jurisdictional claims in published maps and institutional affiliations. |
© 2022 by the authors. Licensee MDPI, Basel, Switzerland. This article is an open access article distributed under the terms and conditions of the Creative Commons Attribution (CC BY) license (https://creativecommons.org/licenses/by/4.0/).
Share and Cite
MDPI and ACS Style
Papuga, S.A.; Seifert, E.; Kopeck, S.; Hwang, K. Ecohydrology of Green Stormwater Infrastructure in Shrinking Cities: A Two-Year Case Study of a Retrofitted Bioswale in Detroit, MI. Water 2022, 14, 3064. https://doi.org/10.3390/w14193064
AMA Style
Papuga SA, Seifert E, Kopeck S, Hwang K. Ecohydrology of Green Stormwater Infrastructure in Shrinking Cities: A Two-Year Case Study of a Retrofitted Bioswale in Detroit, MI. Water. 2022; 14(19):3064. https://doi.org/10.3390/w14193064
Chicago/Turabian StylePapuga, Shirley Anne, Emily Seifert, Steven Kopeck, and Kyotaek Hwang. 2022. "Ecohydrology of Green Stormwater Infrastructure in Shrinking Cities: A Two-Year Case Study of a Retrofitted Bioswale in Detroit, MI" Water 14, no. 19: 3064. https://doi.org/10.3390/w14193064
Note that from the first issue of 2016, this journal uses article numbers instead of page numbers. See further details here.