
Preparation of Powdered Activated Carbon Composite Material and Its Adsorption Performance and Mechanisms for Removing RhB
1
Key Laboratory for Improving Oil and Gas Recover, Ministry of Education, Northeast Petroleum University, Daqing 163318, China
2
Key Laboratory of Disaster Prevention, Mitigation and Protection Engineering, Northeast Petroleum University, Daqing 163318, China
3
State Key Laboratory of Environmental Aquatic Chemistry, Research Center for Eco-Environmental Sciences, Chinese Academy of Sciences, Beijing 100085, China
*
Author to whom correspondence should be addressed.
Water 2022, 14(19), 3048; https://doi.org/10.3390/w14193048
Submission received: 27 July 2022
/
Revised: 19 September 2022
/
Accepted: 23 September 2022
/
Published: 27 September 2022
(This article belongs to the Special Issue Advanced Technologies and Materials for Polluted Water Remediation)
Abstract
:For solving the problem of low efficiency about dyes and slow precipitation rate for powdered activated carbon (PAC), this study successfully prepares a kind of powdered activated carbon-based composites (PACMC) to remove Rhodamine B (RhB) in wastewater as an adsorbent. PACMC derived from potassium humate and polyaluminium chloride (PACl)-modified PAC were fabricated via a chemical precipitation method. We confirmed the micro-morphology and chemical composition of PACMC by scanning electron microscopy energy-dispersive X-ray spectrometer (SEM-EDS) and fourier infrared spectroscopy (FT-IR), certifying that PACMC was synthesized by chemical reaction of raw materials. PACMC has layered porous structure and functional groups, which is beneficial to the transport and diffusion of RhB molecules. The specific surface area (10.098 m2·g−1) and average particle size (142.9 µm) of PACMC and the specific surface area (710.1 m2·g−1) and average particle size (11.9 µm) of PAC were measured. By comparison, it can be seen that PACMC has larger average particle size conducive to solid–liquid separation. The static adsorption experiments were carried out to investigate the adsorption properties of RhB by PACMC. The results showed that the adsorption capacity of PACMC for RhB was 2–3 times as high as that of PAC. The pH value of the solution had a significant effect on the adsorption of RhB by PACMC and the maximum adsorption was observed at pH = 4.5 (qe = 28.56 mg·g−1, C0 = 40 mg·L−1). The adsorption of RhB by PACMC can be well described by the pseudo-second-order kinetics. The kinetic results revealed that the adsorption process involved several steps, where the chemical adsorption and intra-particle diffusion both played the important roles. The isothermal adsorption data were in accordance with the Dubinin–Radushkevich model, which indicated that the adsorption was dominated by the chemisorption mechanism. Therefore, the adsorption mechanisms included chemical binding/chelation effect and electrostatic adsorption effect.
1. Introduction
The textile industry is one of the most flourishing industries across the globe. According to a Global Industry Analysts (GIA) report, the worth of textile industry at present is around $480 billion and is shortly expected to reach $700 billion. The textile industry extensively uses resources like high power, water, and raw material, which contribute to pollution of air, water, and soil [1]. Colored wastewater could be the dominant pollutant in industrial areas [2]. Over 10,000 dyes with a total yearly production over 7 × 10⁵ MT worldwide are commercially available and 5–10% of dyestuffs are lost in the industrial effluents [3,4]. These dyes and pigments contain hazardous metals such as mercury, chromium, nickel, copper, and cobalt, which usually escape the treatment systems because of their incapability to degrade recalcitrant dyestuff. RhB is a typical alkaline xanthene dye which is widely used in textile, cosmetics, food, paper making, and leather. It is estimated that 20% of the total RhB used remains in the effluent during the production process [5]. The improper handling of these wastewaters can compromise the quality of the aqueous systems that are used as receptors for its discharge, causing water pollution and environmental risks for the entire ecosystems that are exposed [6]. RhB are mutagenic and carcinogenic for the human body and can be absorbed by the skin, consequently leading to health complications like respiratory or renal failure and permanent blindness [7,8]. Then, the removal of RhB is paramount to reduce the potential of health problems to the human being, to protect the environment and to satisfy the corresponding legislations related to the presence of these pollutants. Although we have various traditional and current technologies to cope up with the existing textile pollution, the expected effluent quality could still not be achieved due to certain limitations. Considering these aspects, different methods for the removal/reduction of RhB in aqueous systems have been studied.
Dye removal techniques include ultrafiltration, photocatalytic degradation, electrocatalytic degradation, oxidation, flocculation, and adsorption [9,10,11,12,13]. Ag-Bi/C films could adsorb RhB and photo catalyze the oxidization of RhB by H2O2 [14]. However, the photocatalytic products need to be further studied. Adsorption is an effective technique for dye removal due to the low operational cost and high removal efficiency, especially if effective adsorbents are utilized [15,16,17]. Nanoscale zero-valent iron has been employed intensively to remediate textile wastewater contaminants [10,18]. Nanoscale zero-valent iron coated with lignin-derived carbon as a novel functional material can efficiently remove heavy metal ions and organic pollutants in wastewater by synergistic effects between the catalytic Fe0 center and the lignin-derived carbon [19]. L-lysine-modified montmorillonite enhances the adsorption capacities of Pb(II) and Etidronic acid-functionalized layered double hydroxide enhance heavy metal removal [20,21]. However, biochar has been recommended as a promising adsorbent material for organic contaminants’ removal from wastewater. Activated carbon is the most widely used, simplest, and least expensive method for removing micropollutants in particular hydrophobic compounds, and in water treatment plants. For some carbons, adsorption capacity substantially increased when carbon particle diameter was decreased from a few tens of micrometers to a few micrometers [22]. It has been reported that the adsorption capacity of activated carbon for macromolecules (for example, natural organic matter (NOM)) increases as the median particle diameter decreases from 10 µm (PAC) to 0.7 µm (SPAC), whereas the adsorption capacity for small molecules (for example, phenol) does not change with decreasing particle size [23]. It is expected that surface modifications will help increase the adsorption capacity of activated carbon for small molecules. Combined modified clay/biochar composites revealed noteworthy advantages due to their high adsorption capacity, low cost, and good suitability for removing anionic dyes and phenolic compounds [24]. Post-treatment of the beech biochar with citric acid (CA) and oxidation of the surface by heating enhances biochar adsorption capacities [25]. Activated carbon prepared with polyurethane as a raw material can effectively improve the recovery rate of adsorbent by combining with iron oxide nanoparticles [26]. However, it is important to keep in mind that a promising sorbent successfully applicable at industrial scale should be economically attractive and raw materials should be extensively available in large quantities in nature or as a by-product (bio-residues). The release of powdered activated carbon (PAC) may negatively impact downstream processes. The use of PAC in water treatment therefore needs consideration of how the fine adsorbent material is most effectively removed from the water, in addition to the removal of the micropollutant target.
A balance between the contaminant removal and the clarification performance therefore needs to be reached for efficient treatment. Systematic investigations to study the influence of the physicochemical properties (e.g., functional groups) of activated carbon on the adsorption behavior of RhB have not been done in this field. Therefore, it is the aim of this work to prepare PAC-based composite materials for very efficient adsorption of RhB from aqueous solution with a much better adsorption and separation performance. In addition, the preparation, chemical, textural, and particle size characterization of the powdered activated carbon-based composites (PACMC) is presented in this work. The findings in this work have presented the intermediate evidence for revealing the relation between the adsorption efficiency and functional groups based on the powdered activated carbon-based composites (PACMC), and are of significance for understanding the process and mechanism of adsorption materials.
2. Experimental
2.1. Materials and Reagents
Industrial humate (HS) was supplied by Beijing Bowei Shennong Technology Co., LTD. (Beijing, China). Polyaluminum chloride (PACl) was purchased from Nanning Chemical Co., LTD. (Nanning, China). Powder-activated carbon was acquired from Xilong Science Chemical Co., LTD. (China). RhB (C28H31ClN2O3) was purchased from Shanghai Zhanyun Chemical Co., LTD. (Shanghai, China). All chemicals were of analytical grade and used without further processing.
2.2. Preparation of PACMC Composite Material
Typically, 4.42 g of HS, PACl, and PAC (mass ratio 1:1:1) were firstly dissolved in the water solution (97.3% in water, 500 mL) and stirred for 12 h at room temperature (R.T.). Then, the solution was stood for 12 h. After that, the mixture dried in vacuo at 50 °C for 48 h, and it was ground into a fine powder. All solutions were prepared using deionized water.
2.3. Material Characterization
During the preparation of PACMC, the interaction among PAC, PACl, and HS could be analyzed by SEM-EDS (GEMI NISEM 500) and FT-IR (NicoletiS50, USA). After adsorption, the interaction between PACMC and RhB could be analyzed by SEM-EDS (GEMI NI-SEM 500) and FT-IR (NicoletiS50, USA). SEM-EDS (FP-6500) was performed to observe the morphological features and element distribution of the samples. The content of humate in solution samples were measured via EEM, COD, and TOC. The particle size distribution and the specific surface areas were measured via a lazer particle size meter (Mastersizer2000, Malvern, UK). PACMC zero charge (pHpzc) was determined by a mass titration method [27]. Subsequently, the RhB was determined by UV–visible spectrometer [5,6].
2.4. Batch Adsorption Experiments
2.4.1. Adsorption Isotherm Experiment
Batch removal experiments were performed in a constant temperature oscillation incubator with a set temperature of 20 °C and a vibration speed of 180 r·min−1. Three replicates for each experimental combination were performed to investigate initial solution pH value (4.5–9), contact time (0–24 h), and initial concentration (20, 30, and 40 mg·L−1) effect on RhB removal. The RhB solutions with different concentrations were obtained by dissolving the corresponding dosage of RhB mother liquor (1000 mg·L−1) with deionized water. 0.05 g of PACMC (or PAC+PACl, or PAC) was dispersed into 50 mL solutions. The pH value of the RhB solution was adjusted with 0.1 mol·L−1 NaOH or 0.1 mol·L−1 HCl and determined by a pH meter (PB-10, Sartorius Scientific Instruments Co., Ltd., Beijing, China). After the end of the adsorption experiment, the solution was filtered by 0.45 μm filter membrane. The RhB was determined by a UV–visible spectrometer at 540 nm. The adsorption capacity (, mg·g−1) and RhB removal rate (η, %) were calculated using Formulas (1) and (2). The adsorption quantity qe was calculated by Formula (3) and fitted by Freundlich, Langmuir, Temkin, and Dubinin–Radushkevich isotherm models. The equations of Freundlich, Langmuir, Temkin, and Dubinin–Radushkevich adsorption isotherm are (4)–(7), respectively:
where C0 (mg·L−1) and Ct (mg·L−1) are the initial and final concentrations of the contaminant solution, respectively; V (L) is the volume of the contaminant solution; W (g) is the mass of adsorbent; and t (min) is the adsorption time; qe (mg·g−1) is the equilibrium adsorption quantity; Ce (mg·L−1) is contaminant concentration at equilibrium; KF ((mg·g−1) (L·mg−1) n−1) is Freundlich constant; n is an empirical parameter related to adsorption strength; qmax (mg·g−1) is the maximum adsorption capacity; KL (L·mg−1) is Langmuir constant; KT (mg·g−1) and B (J·mol−1) are Temkin constants; β (mol2 ·kJ2) is a constant related to adsorption energy; R (8.314 J·(mol·K)−1) is the ideal gas constant; T (K) is the thermodynamic temperature [28]. After the reaction, the PACMC and PAC particles were filtrated, washed with deionized water several times, freeze-dried overnight, and stored in glass vials for further characterization.
2.4.2. Adsorption Kinetics Experiment
Three replicates for each experimental combination were performed to investigate initial solution pH value (6.88), contact time (0–24 h), and initial concentration (20 mg·L−1) effect on RhB removal. 0.05 g of PACMC was dispersed into 50 mL solutions. The adsorption experiment and RhB concentration test were conducted in the same way as 2.4.1. Pseudo-first-order dynamics model, pseudo-second-order dynamics model, and particle intima diffusion model were fitted and calculated by Formulas (8)–(10), respectively:
where, k1 (min−1) is the adsorption rate constant of pseudo-first-order kinetic model; k2 (g·(mg·min)−1) is the adsorption rate constant of pseudo-second-order kinetic model; kdi (mg·(g·min0.5)−1) is the rate constant of internal diffusion model; c (mg·g−1) is a constant [28].
2.4.3. Thermodynamic Analysis of Adsorption Results
The adsorption experiment and RhB concentration test were conducted in the same way as Section 2.4.1. Thermodynamic functions such as enthalpy (ΔHΘ) and entropy (ΔSΘ) can be obtained from Equation (11) [29]:
where ΔSΘ (J·(mol·K)−1) is the entropy change in the adsorption process; ΔHΘ (kJ·mol−1) is adsorption enthalpy change; Kd (mL·g−1) is the equilibrium constant; Gibbs free energy (ΔGΘ, kJ·mol−1) can be obtained from Kd, and the formula is as follows:
3. Results and Discussion
3.1. Adsorbent Characterization
The FT-IR spectra for PACl, PAC, HS, and PACMC were recorded and are shown in Figure 1. In the case of PACl, the bands appearing at 3430 cm−1, 1616 cm−1, and 1383 cm−1 are associated with OH vibrations. The bands at 1105 cm−1 and 989 cm−1 are assigned to the bending vibrations of Al-OH2 and the band at 618 cm−1 is assigned to the symmetric stretching mode of Al–O bond of the central AlO4− [30]. In the case of PAC, 1570 cm−1 were related to the aliphatic C=O (-COOH, -COOR) [31,32,33]. In the case of HS, the most interesting bands, in which oxygen-containing functional groups carboxylic and phenolic may be observed, are 1570, 1090, 1372, and 3120 cm−1 [34]. In the case of PACMC, the peaks located at 1065 and 2990 cm−1 meant the stretching vibration of C-O and RNH and RNH2, respectively [31,32,33]. After PACMC synthesis, FTIR study was performed to identify the functional group in PACMC. As seen, new peaks appeared in the FT-IR spectrum. It can be observed that the major changes of PACMC IR spectra occur at the region 3700–1000 cm−1, in which the adsorption bands of oxo-groups or oxo-bridges appear. Specifically, the band at 3430 and 3120 cm−1 in PACl and HS spectra gradually degenerates into three distinct bands at 3669, 2990, and 2898 cm−1. In this region, bands related with the vibrations of C-C and C-O bonds appear. The band at 1105 cm−1 in the PACl spectra gradually degenerates into two distinct bands at 1065 and 1255 cm−1 after the PAC and HS addition. The alteration of bands indicates that PACl, PAC, and HS molecules are all affected by the combination of three compounds. Moreover, at the region 1000–600 cm−1, the two weak bands appearing at the spectra of PACl gradually disappear. At the region 1700–1500 cm−1, the three weak bands appearing at the spectra of PACl, PAC, and HS gradually disappear. These bands are associated with vibrations of oxo-groups or oxo-bridges and the disappearance could be an indication of interaction among PACl, PAC, and HS molecules.
Summarizing, it can be suggested that the introduction of PACl and HS results in noticeable alterations of PACMC’s IR spectra. These alterations could be indicative of the interactions among PACl, PAC, and HS molecules, such as covalent bonding and electrostatic interactions, which result in the formation of new, composite species. It is possible that in these interactions the -COO- groups of HS and the -O- or -OH- groups of PACl or PAC are involved. According to the theory of coagulation, PAC and HS are the main reaction subjects in the synthesis process, and PACl acts as a binder through coagulation. PAC plays the role of supporting and providing channels. HS binds to the surface of PAC through the bridging effect of PACl. At the same time, PACl also forms a stronger combination with PAC through HS bridging, which enhances the solid–liquid separation potential and recycling efficiency of PACMC.
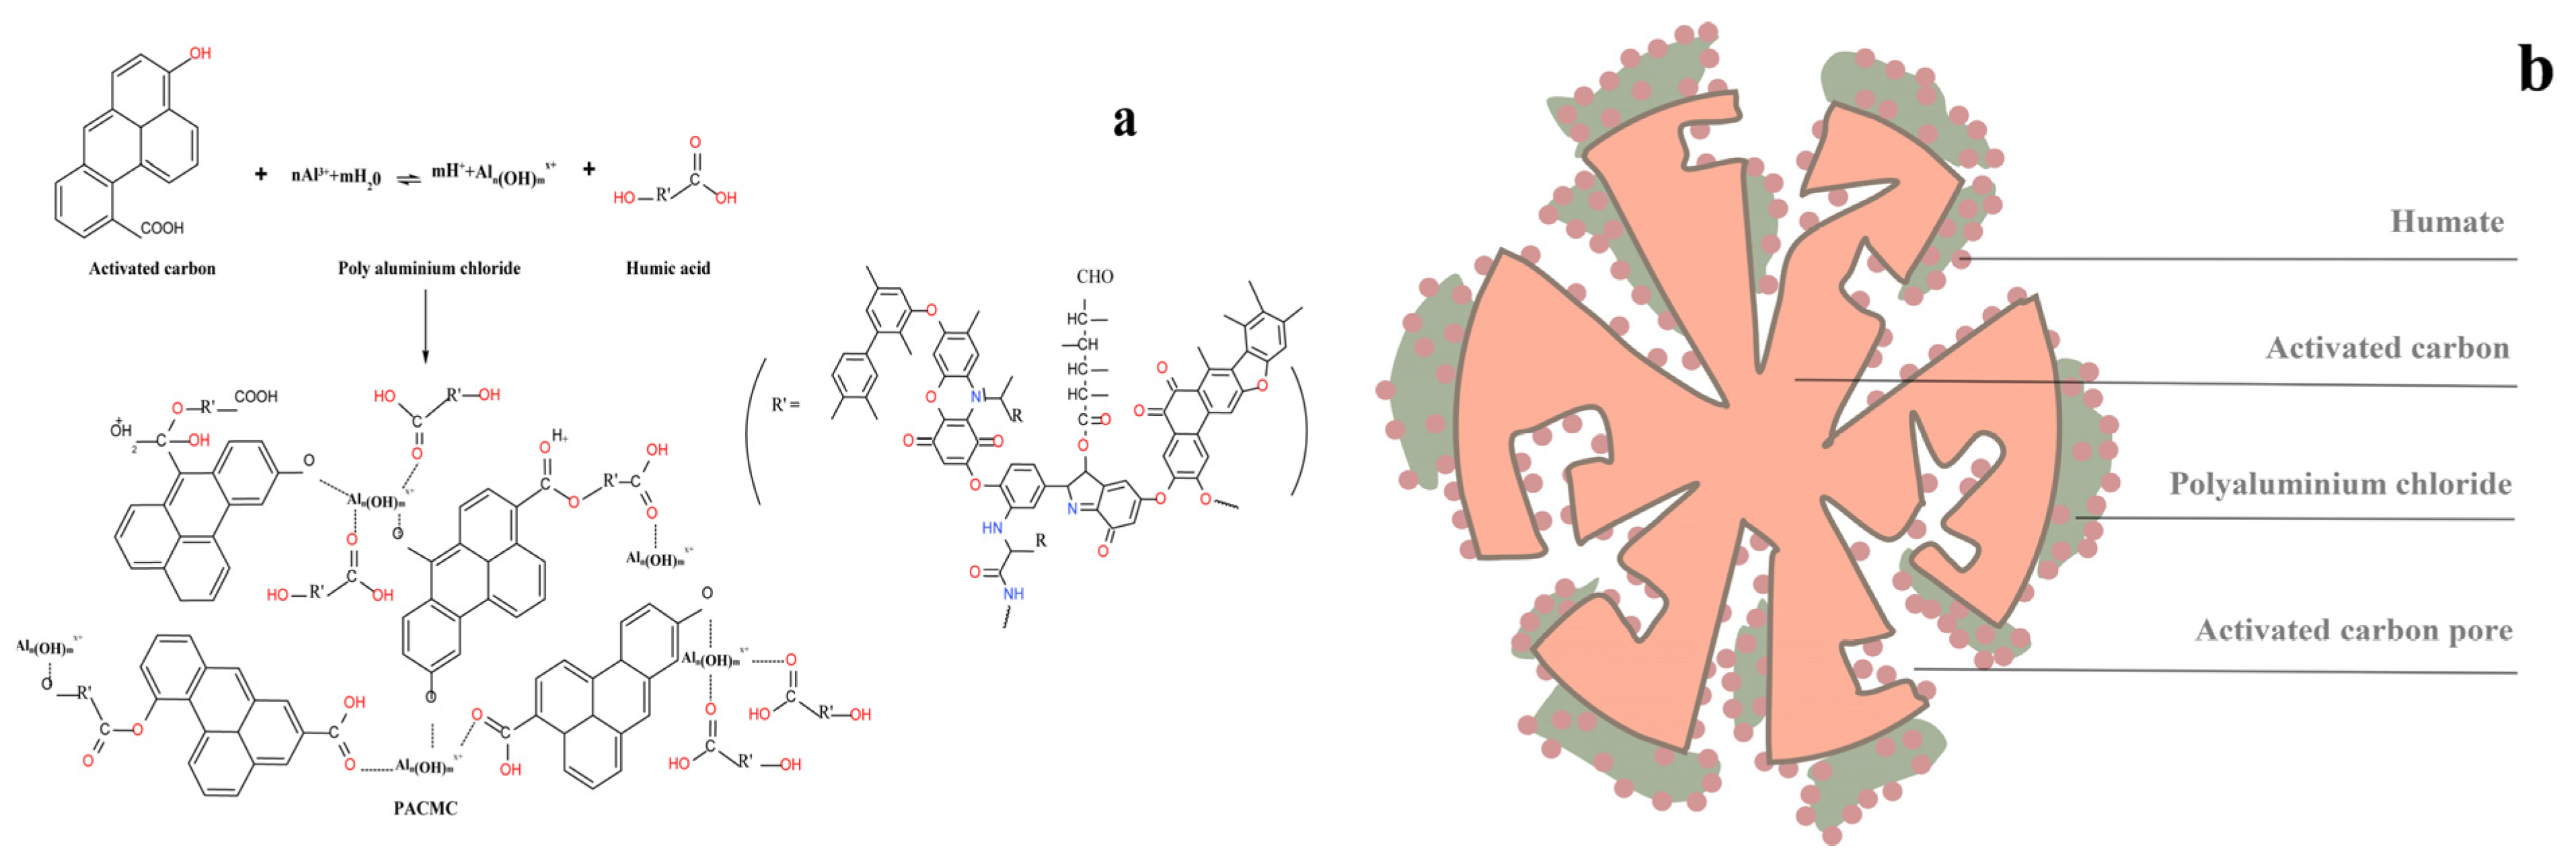
SEM images of PACMC at different magnifications are given in Figure 2a,b. The availability of pores and internal surface is clearly displayed in the SEM picture of PACMC. It was possible to observe that PACMC was constituted of different size particles. PACMC has a layered structure, irregular shape, and the surface is fractured and rough. Furthermore, the surface of these particles has a lot of tiny pores, cracks, and attachs fine particles, which forms a complex pore network system. The micrographs reveal that PAC presents a layered surface, which is also an indication that PAC provides supporting and channels for PACMC (Figure 2c). EDS images of PACMC are given in Figure 2d. Peaks of silicon, aluminum, and chlorine appear in PACMC, while the content of carbon decreases and the content of oxygen increases, indicating that PACMC has -OH and -COOH groups. PAC is mainly composed of carbon and oxygen (Figure 2e). By comparing Figure 2d and Figure 3b, it can be seen that silicon, aluminum, and chlorine do not appear on all surfaces, which indicates that PAC and PACl are unevenly distributed in the preparation process of PACMC. The preparation route and a schematic microstructure illustration of PACMC are speculated as shown in Figure 4.
Good stability is an important prerequisite for practical application of an adsorbent. pH is the most likely factor affecting the stability of PACMC, so the experiment tested the reactant dissolving effect of PACMC at different pH values (pH = 2, 7, 9). As shown in Figure 5, there was no obvious displacement of EEWP in the three-dimensional fluorescence spectra of PACMC supernatant at different pH values, indicating no dissolution of HS. COD and TOC tests were carried out on the supernatant, and the results also showed that TOC and COD of all samples were zero, indicating that the three components in PACMC have been firmly combined together, and that PACMC has good stability.
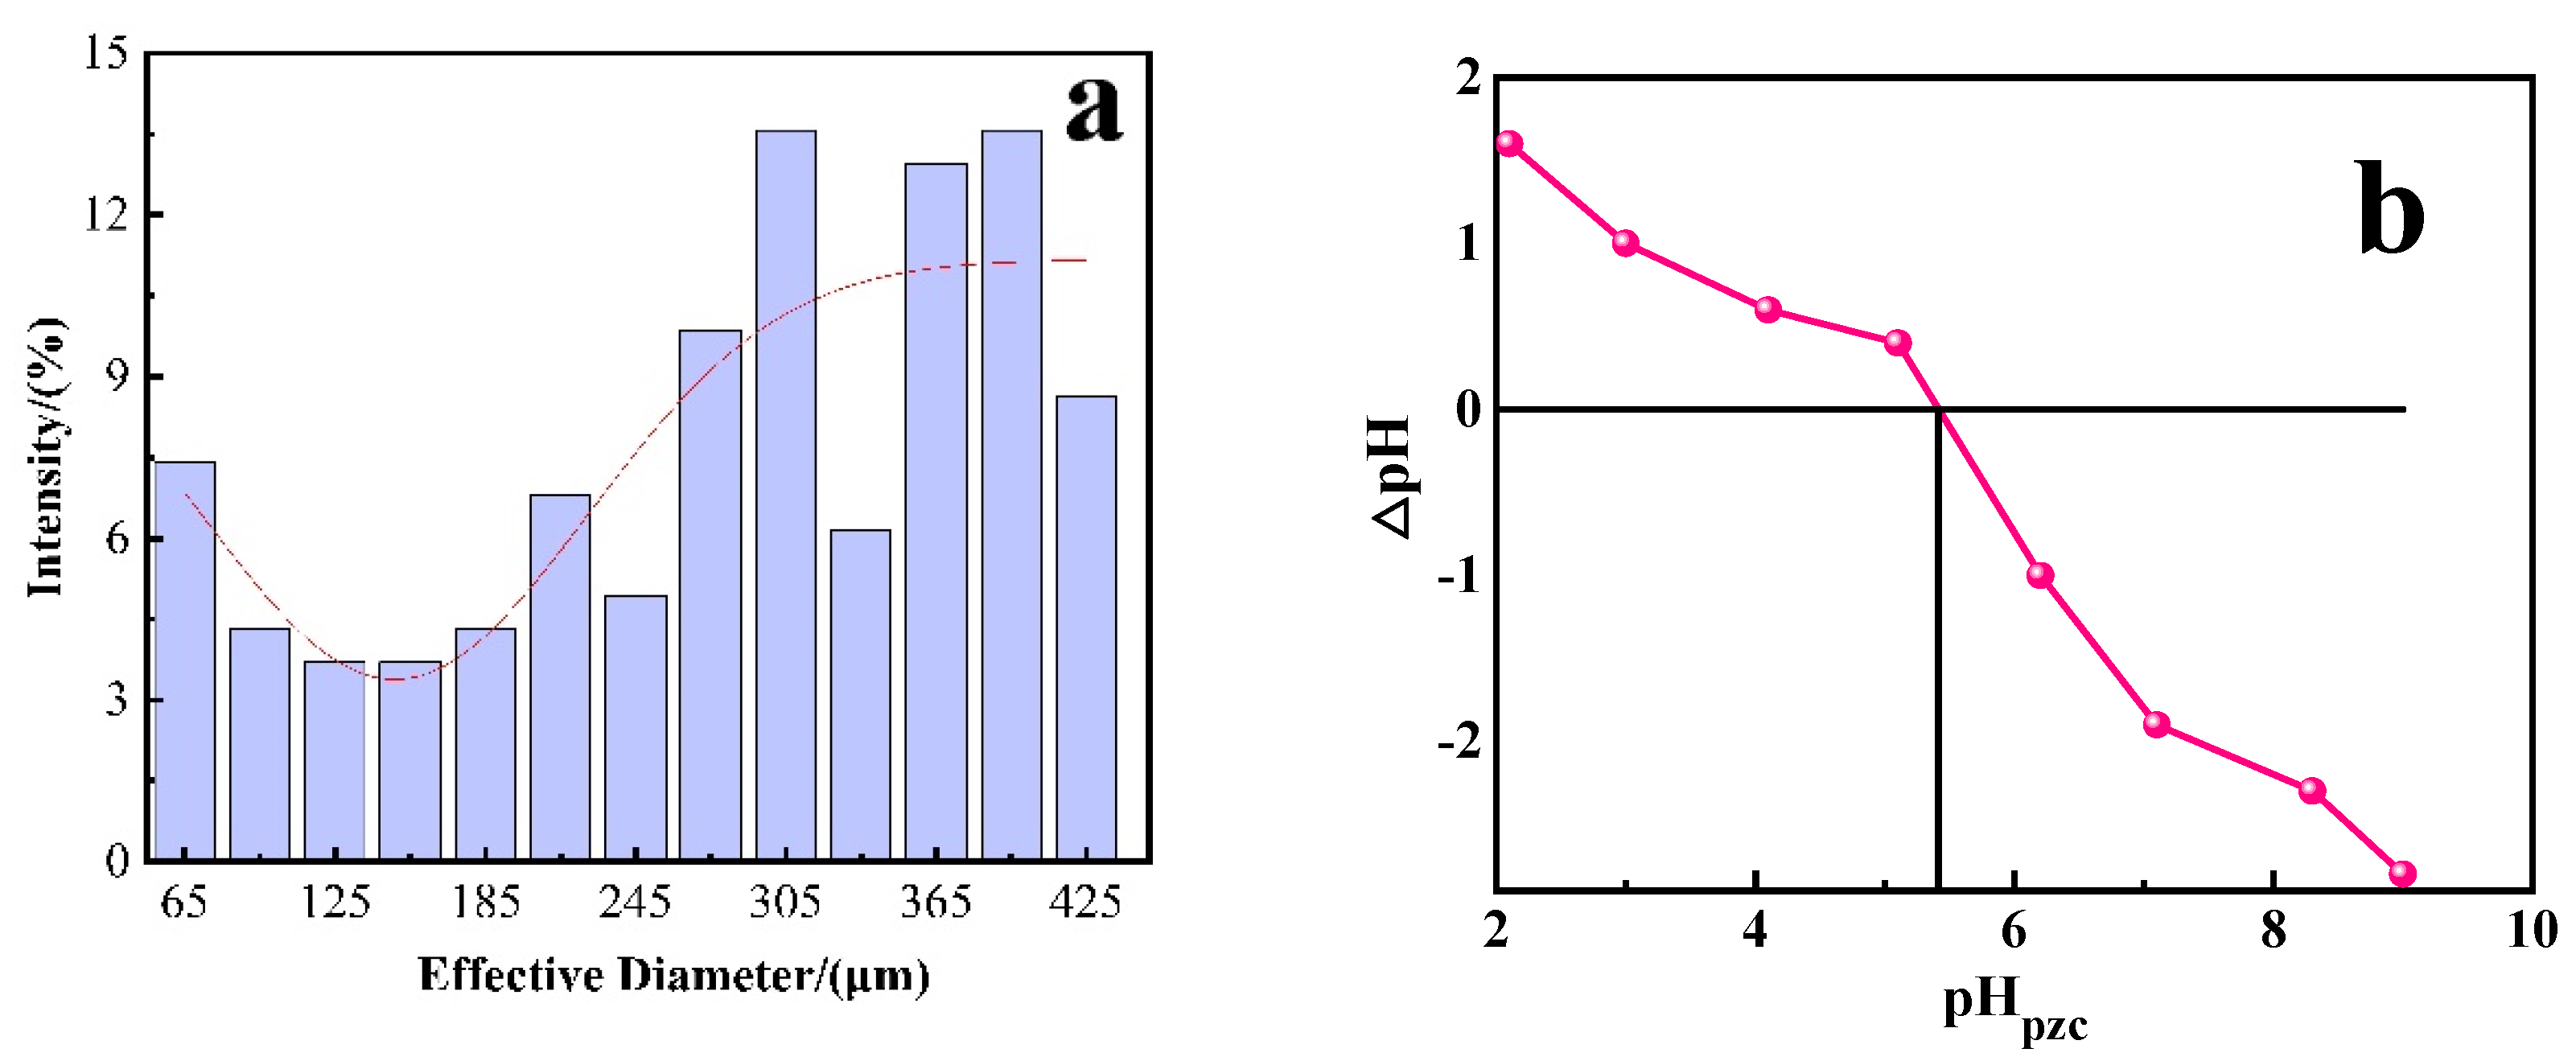
The specific surface area (10.098 m2·g−1) and average particle size (142.9 µm) of PACMC and the specific surface area (710.1 m2·g−1) and average particle size (11.9 µm) of PAC were measured. By comparison, it can be seen that PACMC has a larger average particle size, which is conducive to solid–liquid separation. PACMC will have a better adsorption effect on hydrophilic small molecular because it has a more active functional group. As shown in Figure 6a, the particle size distribution of PACMC shows that the particle size of the material ranges from tens of microns to hundreds of microns, compared with PAC, which can achieve better solid–liquid separation and recycling effect. Studies have shown that PACl flocculation effect is unstable [35], indicating that the introduction of HS promotes the bonding of PAC particles, and PACl reacts with PAC and HS during the reaction process, resulting in more compact particles than ordinary flocs. In addition to the influence of surface functional groups, the charge characteristic of particles is also an important factor to determine the adsorption effect of materials. The zero charge point (intersection of pH and ΔpH) of PACMC under different pH conditions was measured experimentally, as shown in Figure 6b. With the increase of pH, the charge on PACMC surface changed from positive to negative (transition point pHpzc at pH = 5.4). In the adsorption experiment, the charge on PACMC surface is positively at pH below this and negatively at higher pH. Therefore, under different pH conditions, the interaction between PACMC and dye molecules should consider the changes of surface functional groups, electrical properties, and charge density at the same time, and the adsorption effect is the comprehensive embodiment of chemical and physical interaction.
3.2. Adsorption Isothermal Model and Adsorption Kinetics Model
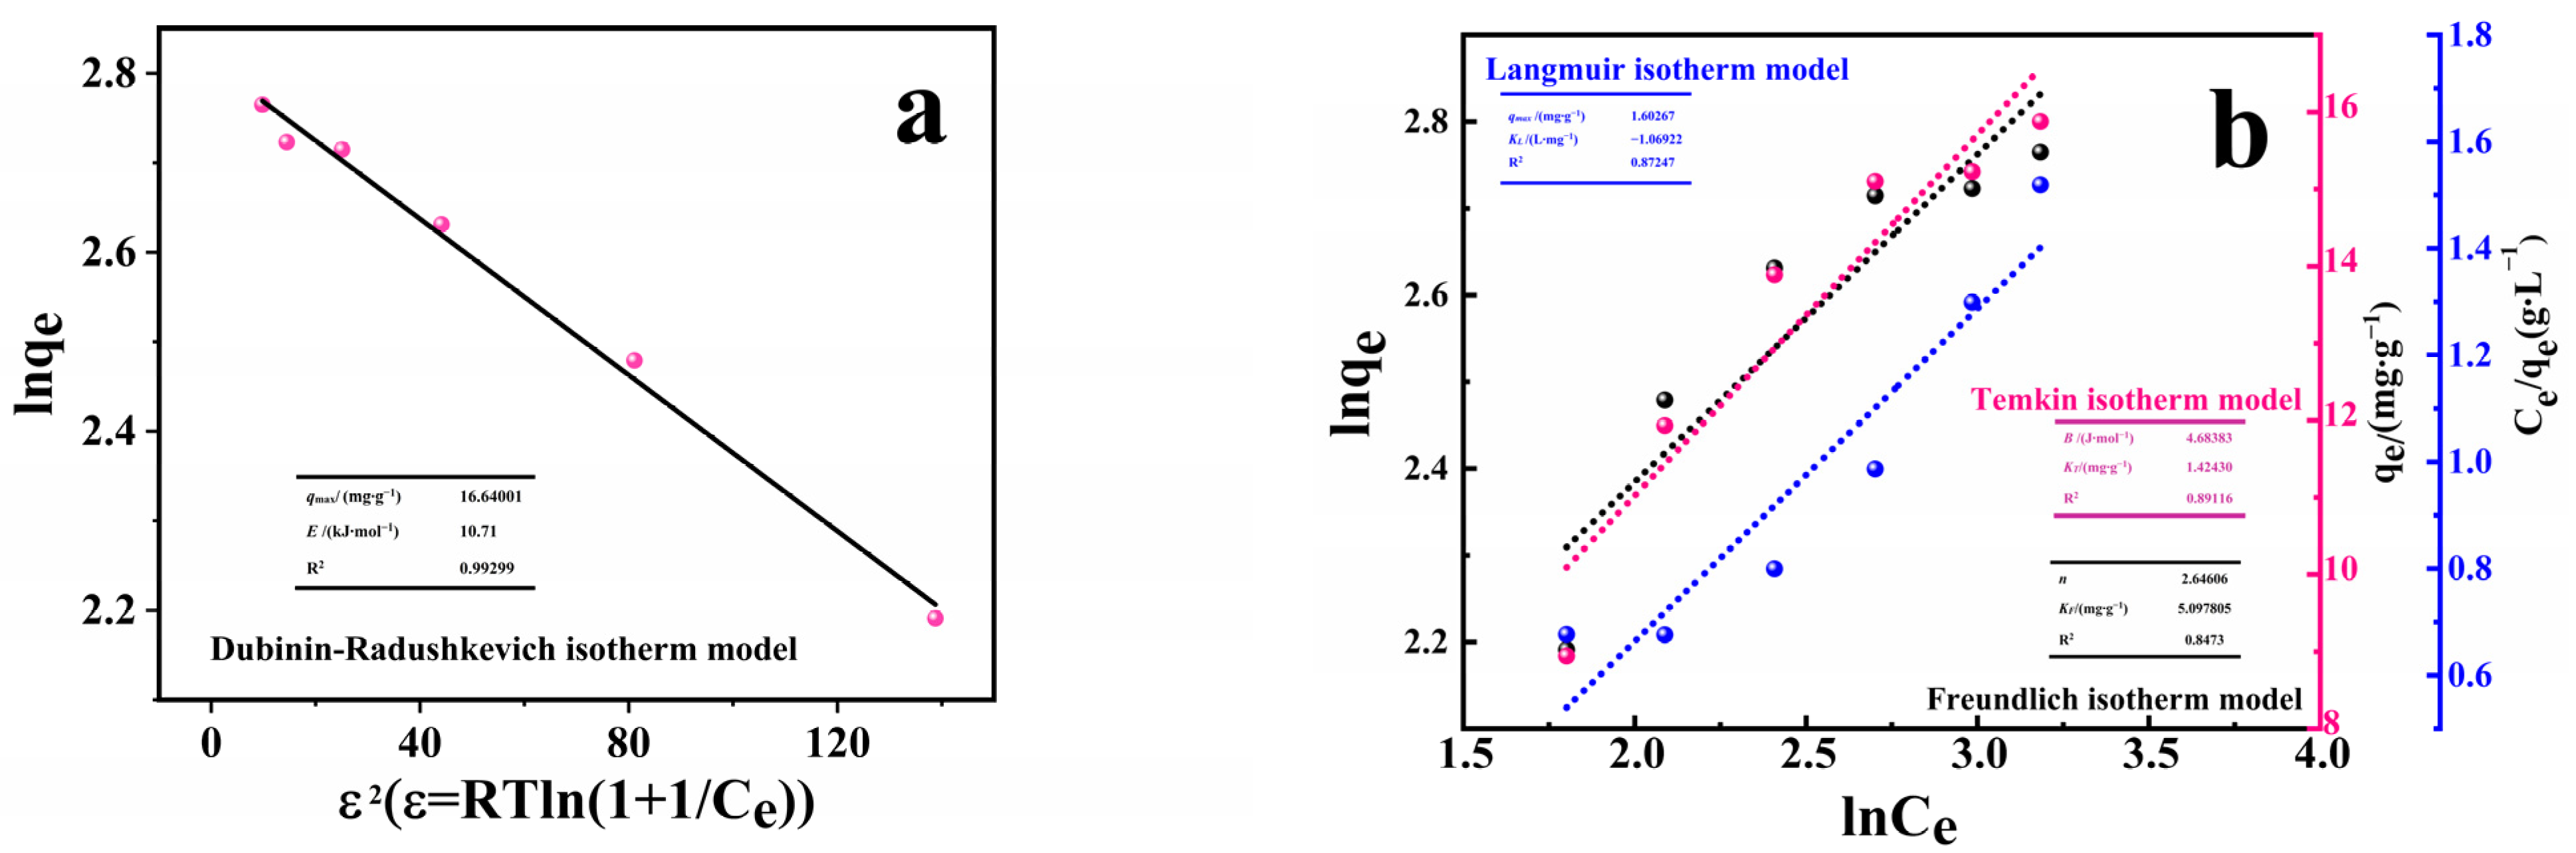
The adsorption data were analyzed and four different models were considered: Langmuir, Freundlich, Temkin, and Dubinin–Radushkevich isotherms, described by Equations (4)–(7). The validity of these models was verified by finding the equilibrium constants as well as the value of the square of the correlation coefficient (R2). A summary of the models’ results considered is presented in Figure 7a,b. The examination of the adsorption data obtained when Langmuir, Freundlich, and Temkin isotherm was applied shows relatively low values for R2 in the range of 0.84 to 0.89. Dubinin–Radushkevich isotherm was also examined to fit the data. The R2 value is high (R2 = 0.9930). A plot of lnqe vs. ε2 shows a linear relationship that allows the calculation of the constants qmax and E as described by Equation (7) and summarized in table and shown in Figure 7a. The good fitting of the adsorption data to Dubinin–Radushkevich isotherm suggests that the adsorption of RhB by PACMC may be physical adsorption or existing ion exchange. The β value can be used to predict the mean free energy (E (kJ)) as follows:
The average free energy of adsorption is 10.71 kJ, indicating that the adsorption of RhB on PACMC is the result of ion exchange [36].
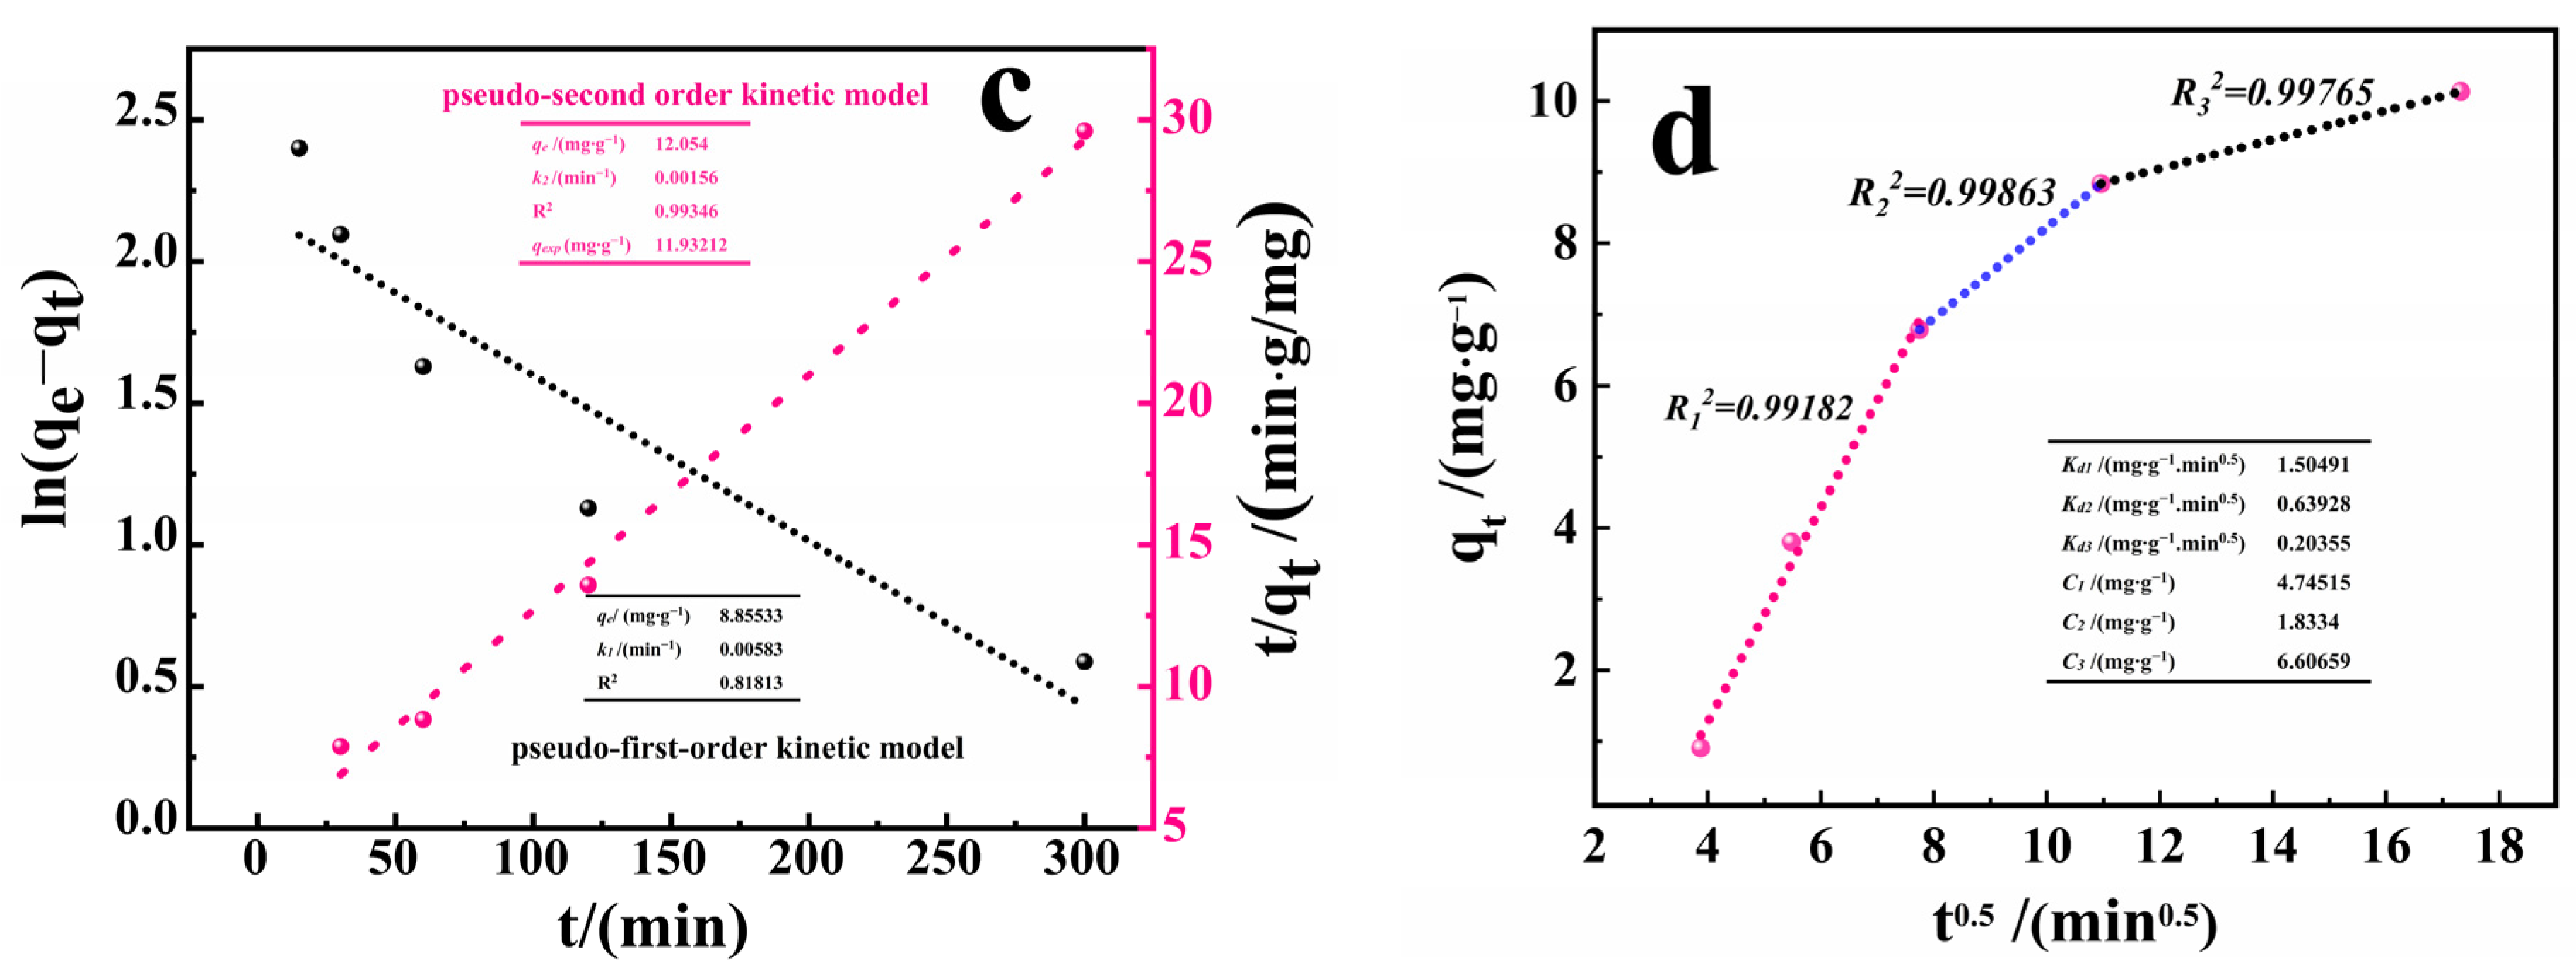
To get more details about the kinetics of adsorption, the models of pseudo-first-order kinetic model (PFO), pseudo-second-order kinetic model (PSO) [37], and particle intra diffusion model (IPD) [38] were adjusted to the experimental data. The results are reported in Figure 6c, along with the k1, k2, R2, and qe values. PSO model demonstrated a satisfactory fit over the experimental data, as can be seen from the high R2 values and low k2 and ∆qe ones. PSO model assumes that the adsorption rate is second order with respect to the available surface sites [39]. As can be seen from Figure 7c, the qe values for RhB (at C0 = 20 mg·L−1) are 12.05 mg·g−1, which are close to the experimental qe values of 11.9 mg·g−1 for RhB, indicating that the adsorption of RhB by PACMC is more consistent with the pseudo-second-order kinetic model. This indicates that RhB and PACMC may form valence bonds by exchanging or sharing electron pairs, which is a kind of chemisorption [40].
Furthermore, Figure 7d shows that the IPD plot is multi-linear and does not pass through the origin, which means that intraparticle diffusion is not the only rate-limiting step. Indeed, the first linear portion (steep-sloped) represents the external mass transfer. The second depicts the intraparticle diffusion, and the plateau portion indicates the equilibrium [41]. Thus, the intraparticle diffusion rate constant (Kdi) and the thickness of the boundary layer (Ci) were valued from the slope and the intercept of the linear portion (Figure 7d). The larger the intercept, the higher the boundary layer effect [42]. In the process of PACMC absorbing RhB, the C1 value is not zero, and the Kdi value decreases continuously, indicating that PACMC’s adsorption process is not only limited by the internal diffusion of particles, but also that there are other comprehensive factors that affect the whole adsorption process.
3.3. Thermodynamic Study
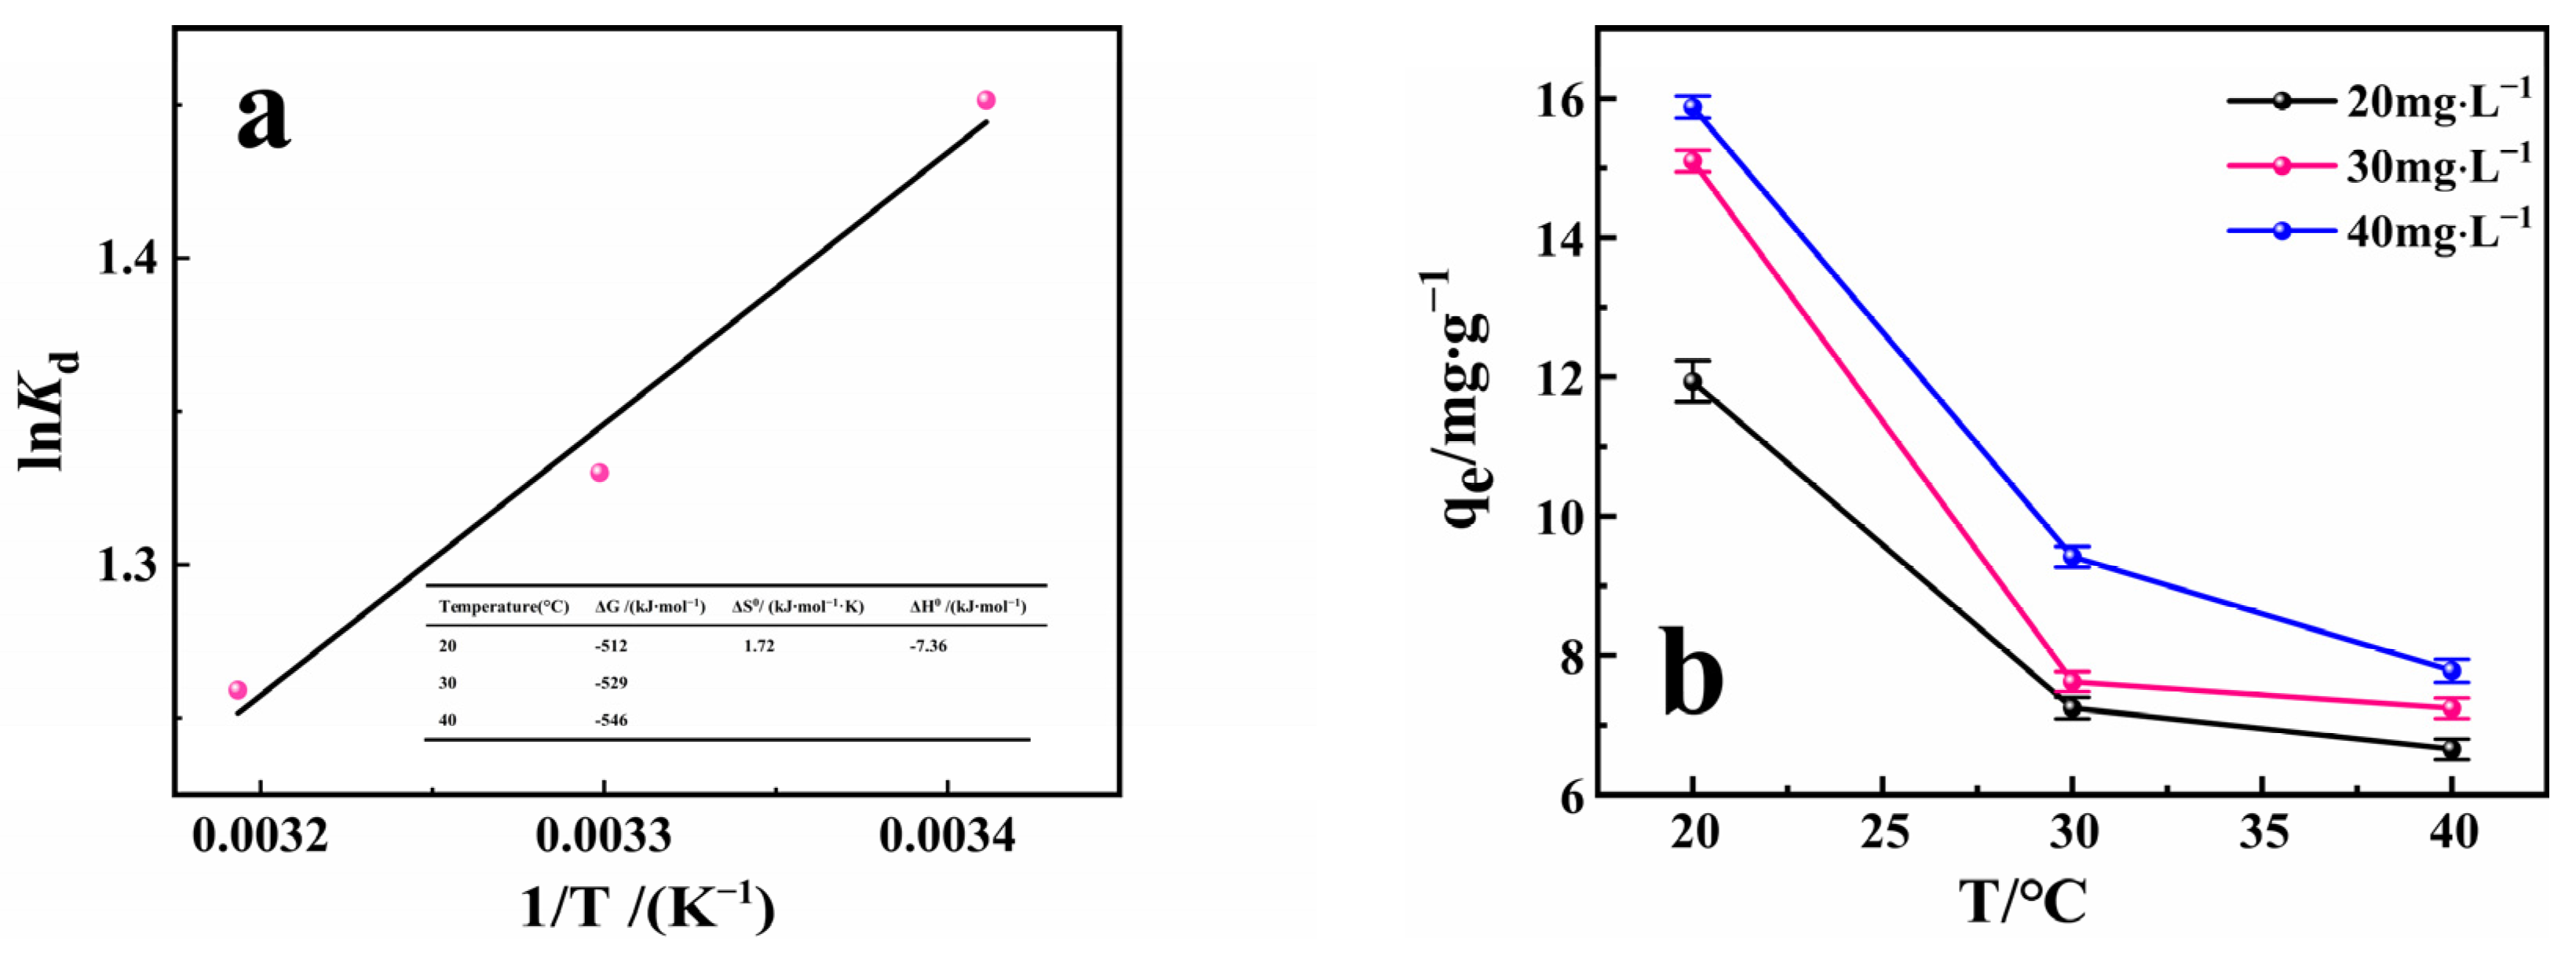
The direction and reaction degree of a physical and chemical process can be determined by thermodynamic study. Therefore, thermodynamic parameters of RhB adsorption by PACMC were calculated based on experimental data to explore the characteristics of the adsorption process. Figure 8a depicts the variation of lnKd with 1/T. The enthalpy of adsorption was determined from the slope of the straight line and to be equal to −7.36 kJ·mol−1. These thermodynamic functions at different temperatures are calculated and shown in Figure 8a. The positive value of entropy (ΔS) and the negative value of Gibbs free energy indicate that the adsorption process is spontaneous. The negative enthalpy indicates that RhB adsorption on PACMC is an exothermic process. This conclusion was also confirmed by Figure 8b. The uptake, particularly at a relatively high initial concentration (40 mg·L−1), indicated a decline upon increasing the temperature. The change in entropy (ΔS) and Gibbs free energy were found to be 1.72 kJ·(mol·K)−1 and −546 kJ·mol−1, respectively. The entropy (ΔS) values indicates that the confusion degree of the solid–liquid contact surface is increasing during the adsorption process. Both values show that the adsorption process is spontaneous [43].
3.4. Adsorption Performance
3.4.1. Comparison of RhB Adsorption Performance
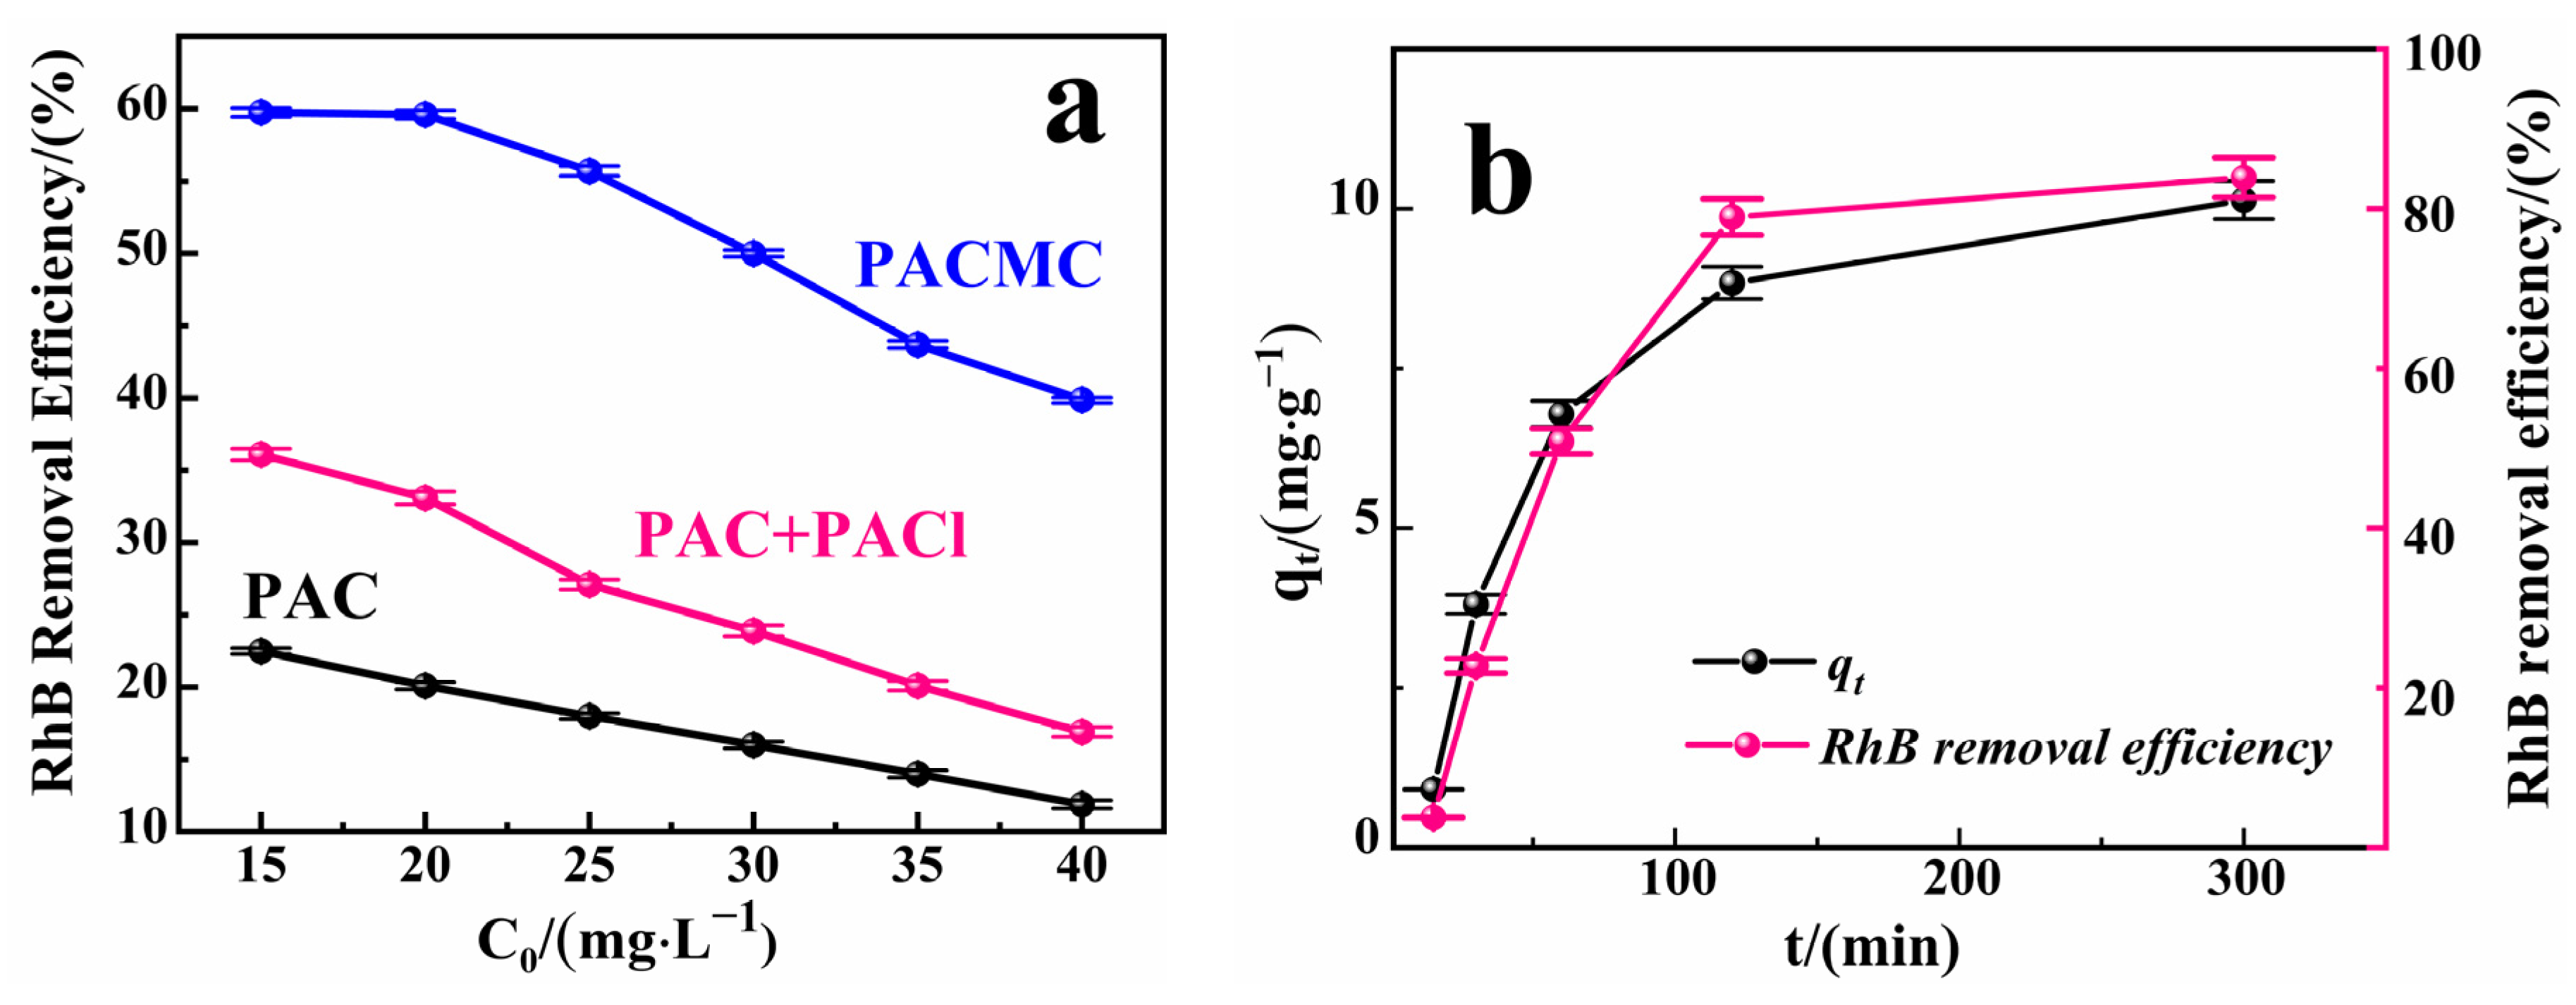
As shown in Figure 9a, when the initial concentration of RhB solution is 35 mg·L−1, under the same adsorption conditions, PACMC shows the maximum of RhB adsorption with 15.26 mg·g−1, which is 218% higher than PAC + PACl and 281% higher than PAC, respectively. The adsorption removal rates of RhB by PACMC, PAC + PACl and PAC all decrease with the increase of initial concentration of RhB solution, which is consistent with the law of adsorption. Constant adsorption capacity and dynamic adsorption equilibrium process determine the final adsorption ratio [44]. The introduction of PAC makes the pore structure of PACMC richer and helps to improve the adsorption capacity of PACMC. The adsorption capacity of PACMC for RhB is positively correlated with the effective adsorption sites on its surface, but the higher the initial concentration of RhB, the less effective adsorption sites of PACMC, so the removal rate of RhB is related to the initial concentration of RhB solution [45]. As the initial concentration of RhB increases, the adsorption capacity increases until the adsorption process reaches saturation, because the increase of RhB concentration strengthens the interaction frequency between PACMC and RhB. It is worth noting that with the increase of the initial concentration of RhB, its adsorption removal rate shows a nonlinear change, indicating that the removal of RhB not only includes the adsorption of the outer active site of the material, but also includes the internal diffusion process, and RhB has a stronger force with the small pore size in the material [46].
3.4.2. Influence of Adsorption Time
In the adsorption process of removing RhB, contact time plays a pivotal role. From the economic point of view, this parameter was valuable for selecting the appropriate retention time of the adsorbent for the industrial process. From Figure 9b, it was observed that increasing the contact time of RhB with PACMC increases the removal efficiency quickly. Compared with photocatalytic degradation of RhB, PACMC can achieve the purpose of rapid adsorption and removal of RhB, and the adsorption capacity of RhB can reach 11.1 mg·g−1 after 120 min. However, the slower removal takes place for up to 120 min. Beyond that, there is no such remarkable change. This was because of the establishment of saturation of the reactive surface sites on the adsorbent, which was adequately occupied by RhB molecules.
3.4.3. Influence of pH
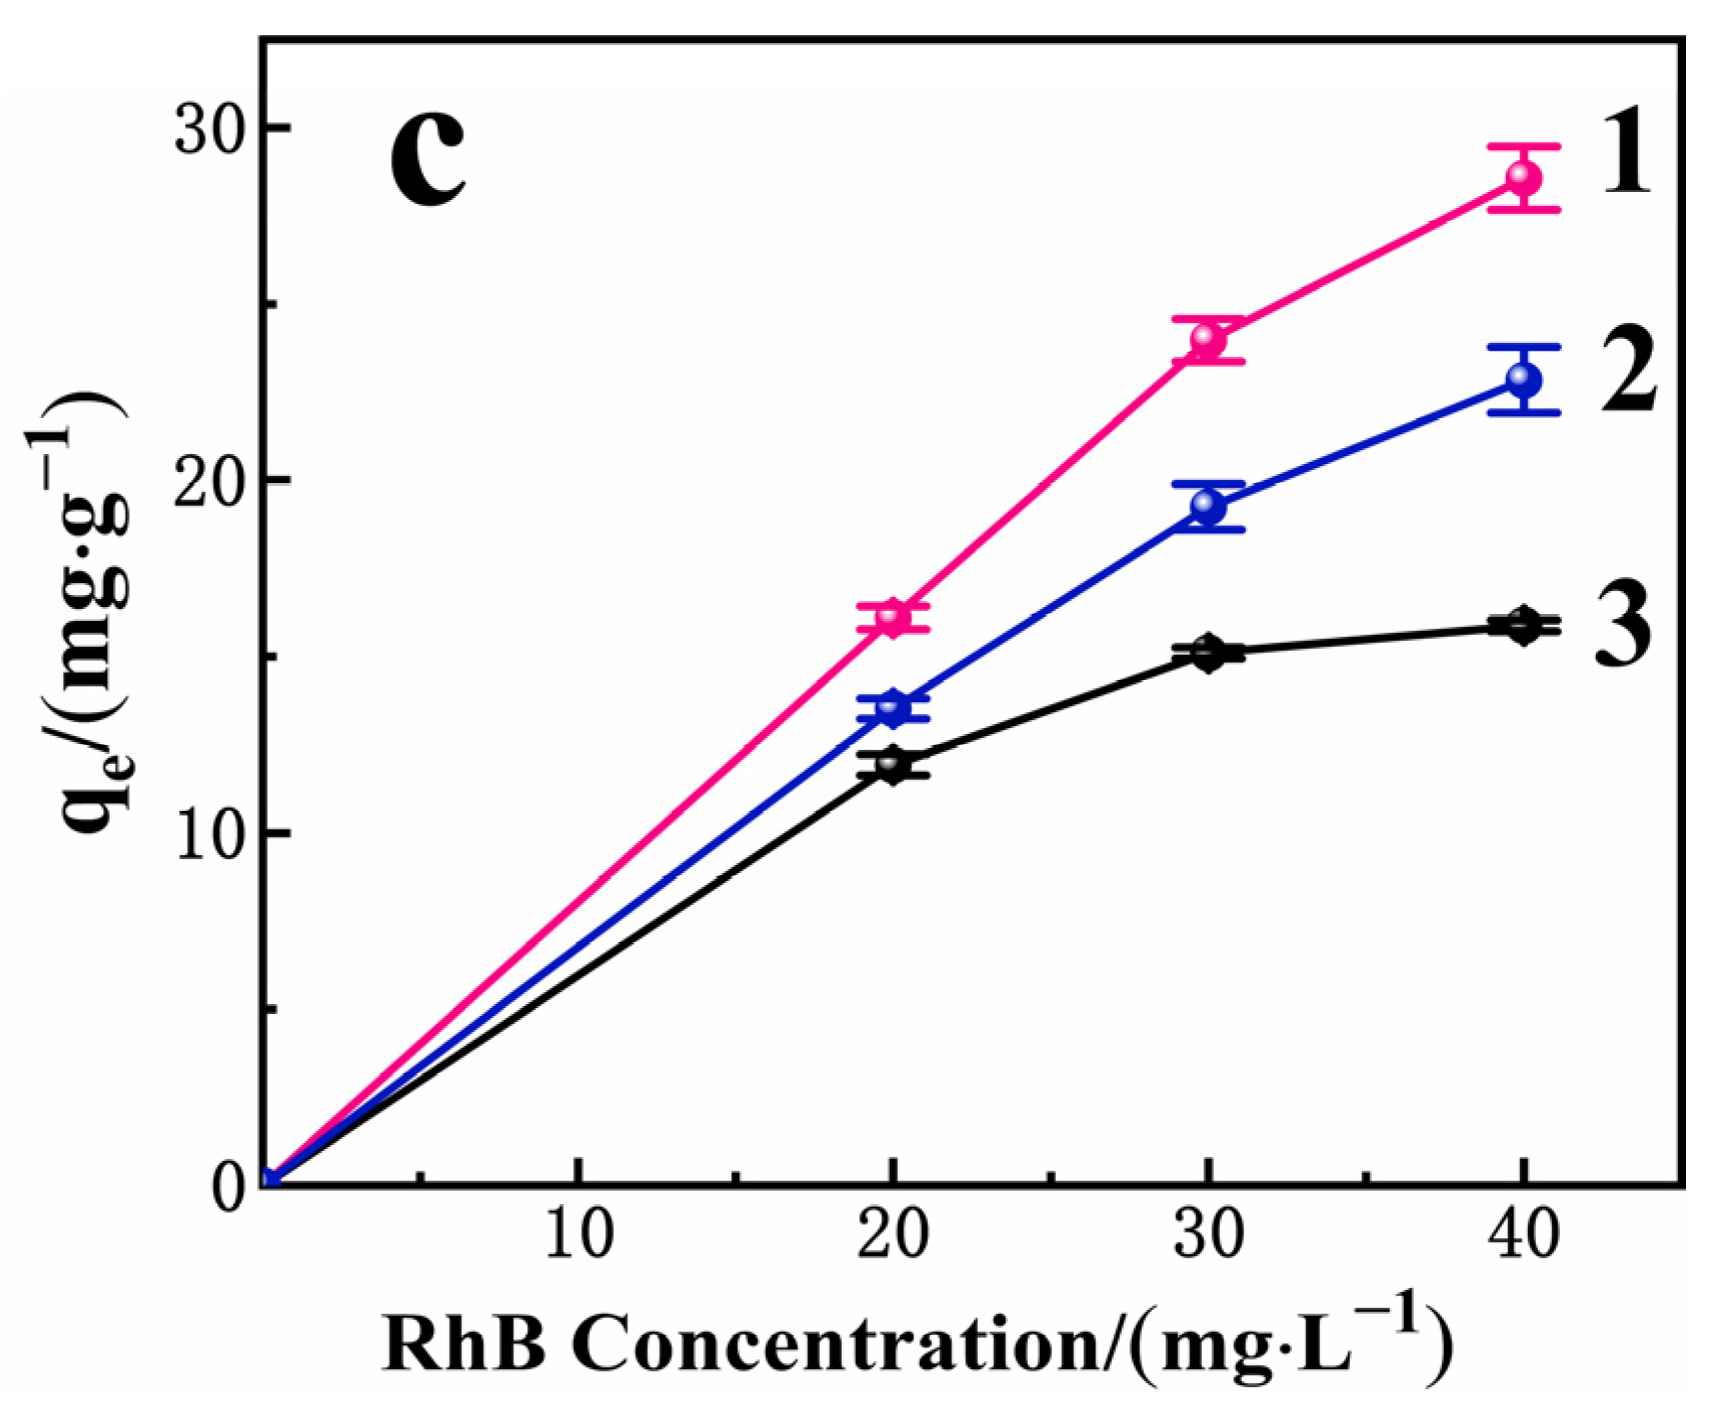
The presence of electrical charges on surfaces is probably one of the most important variables that encompass the adsorption phenomena [47]. Figure 9c presents the adsorption capacities results of RhB at equilibrium conditions as function of the initial solution pH. From the results, it can be observed that PACMC has high Qm values (qe = 28.56 mg·g−1, C0 = 40 mg·L−1) in the pH = 4.5. RhB adsorption tends to decrease slightly at pH = 9, and decreases sharply at pH = 7. This observation can be attributed to the high hydroxide ions (OH−) concentration. At pH > pHPZC, PACMC surface is negatively charged and RhB is in a zwitterionic structure (RhB±). The positive charges of RhB± molecules are strongly shielded by OH- and the greater the OH− concentration, the greater the shielding effect. However, charge attraction between negatively charged PACMC and RhB+ still works. As a result, the formed complex RhB±(OH-)n tends to be repelled by the PACMC surface, decreasing the Qm values. From these analyses, the initial solution pH of the subsequent adsorption experiments was fixed at 6.88, which is the pH value that provided great adsorption capacities of PACMC, besides being within the standards and effluent release conditions established by the Environmental Protection Agency.
3.5. Adsorption Mechanism
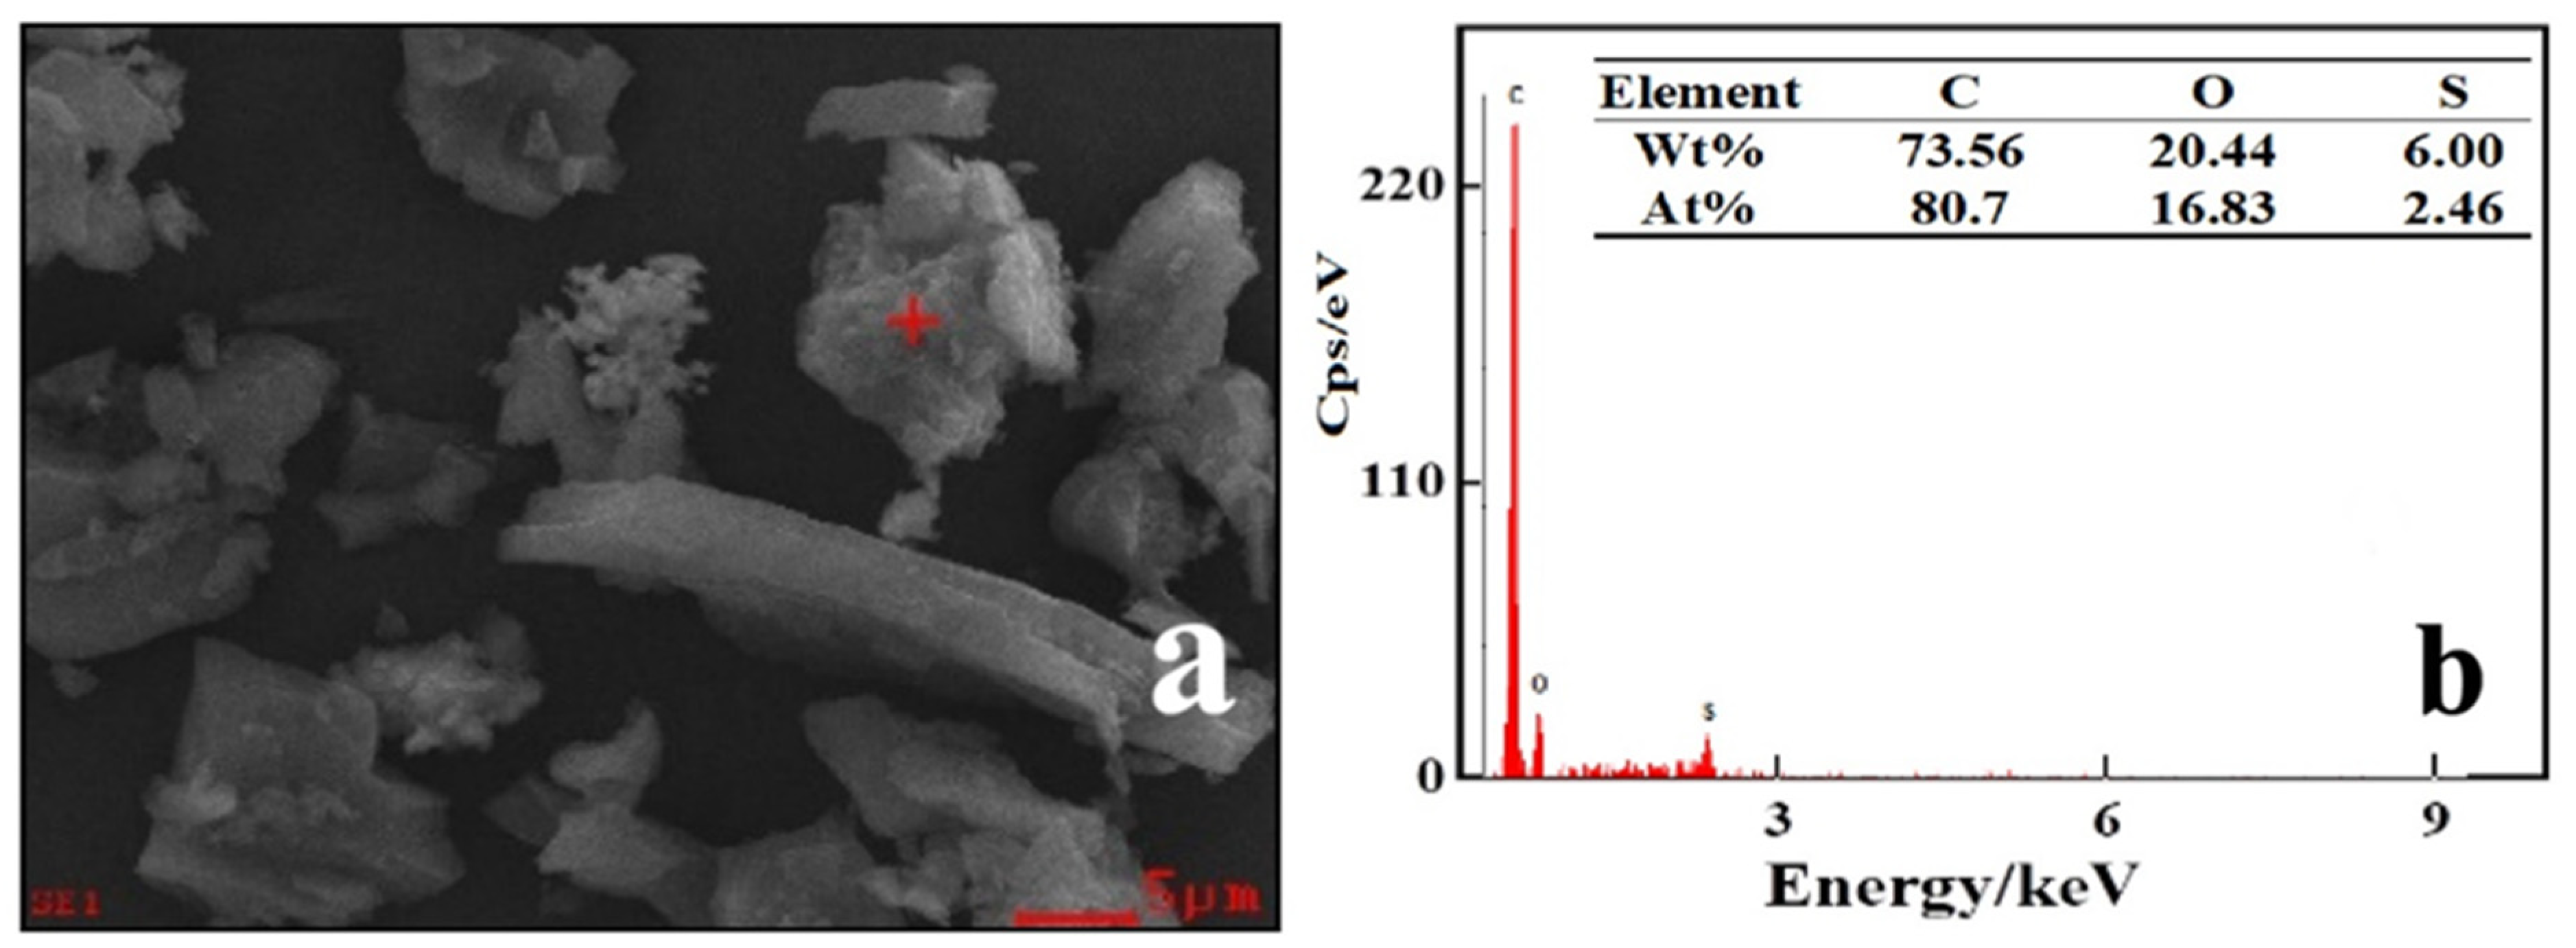
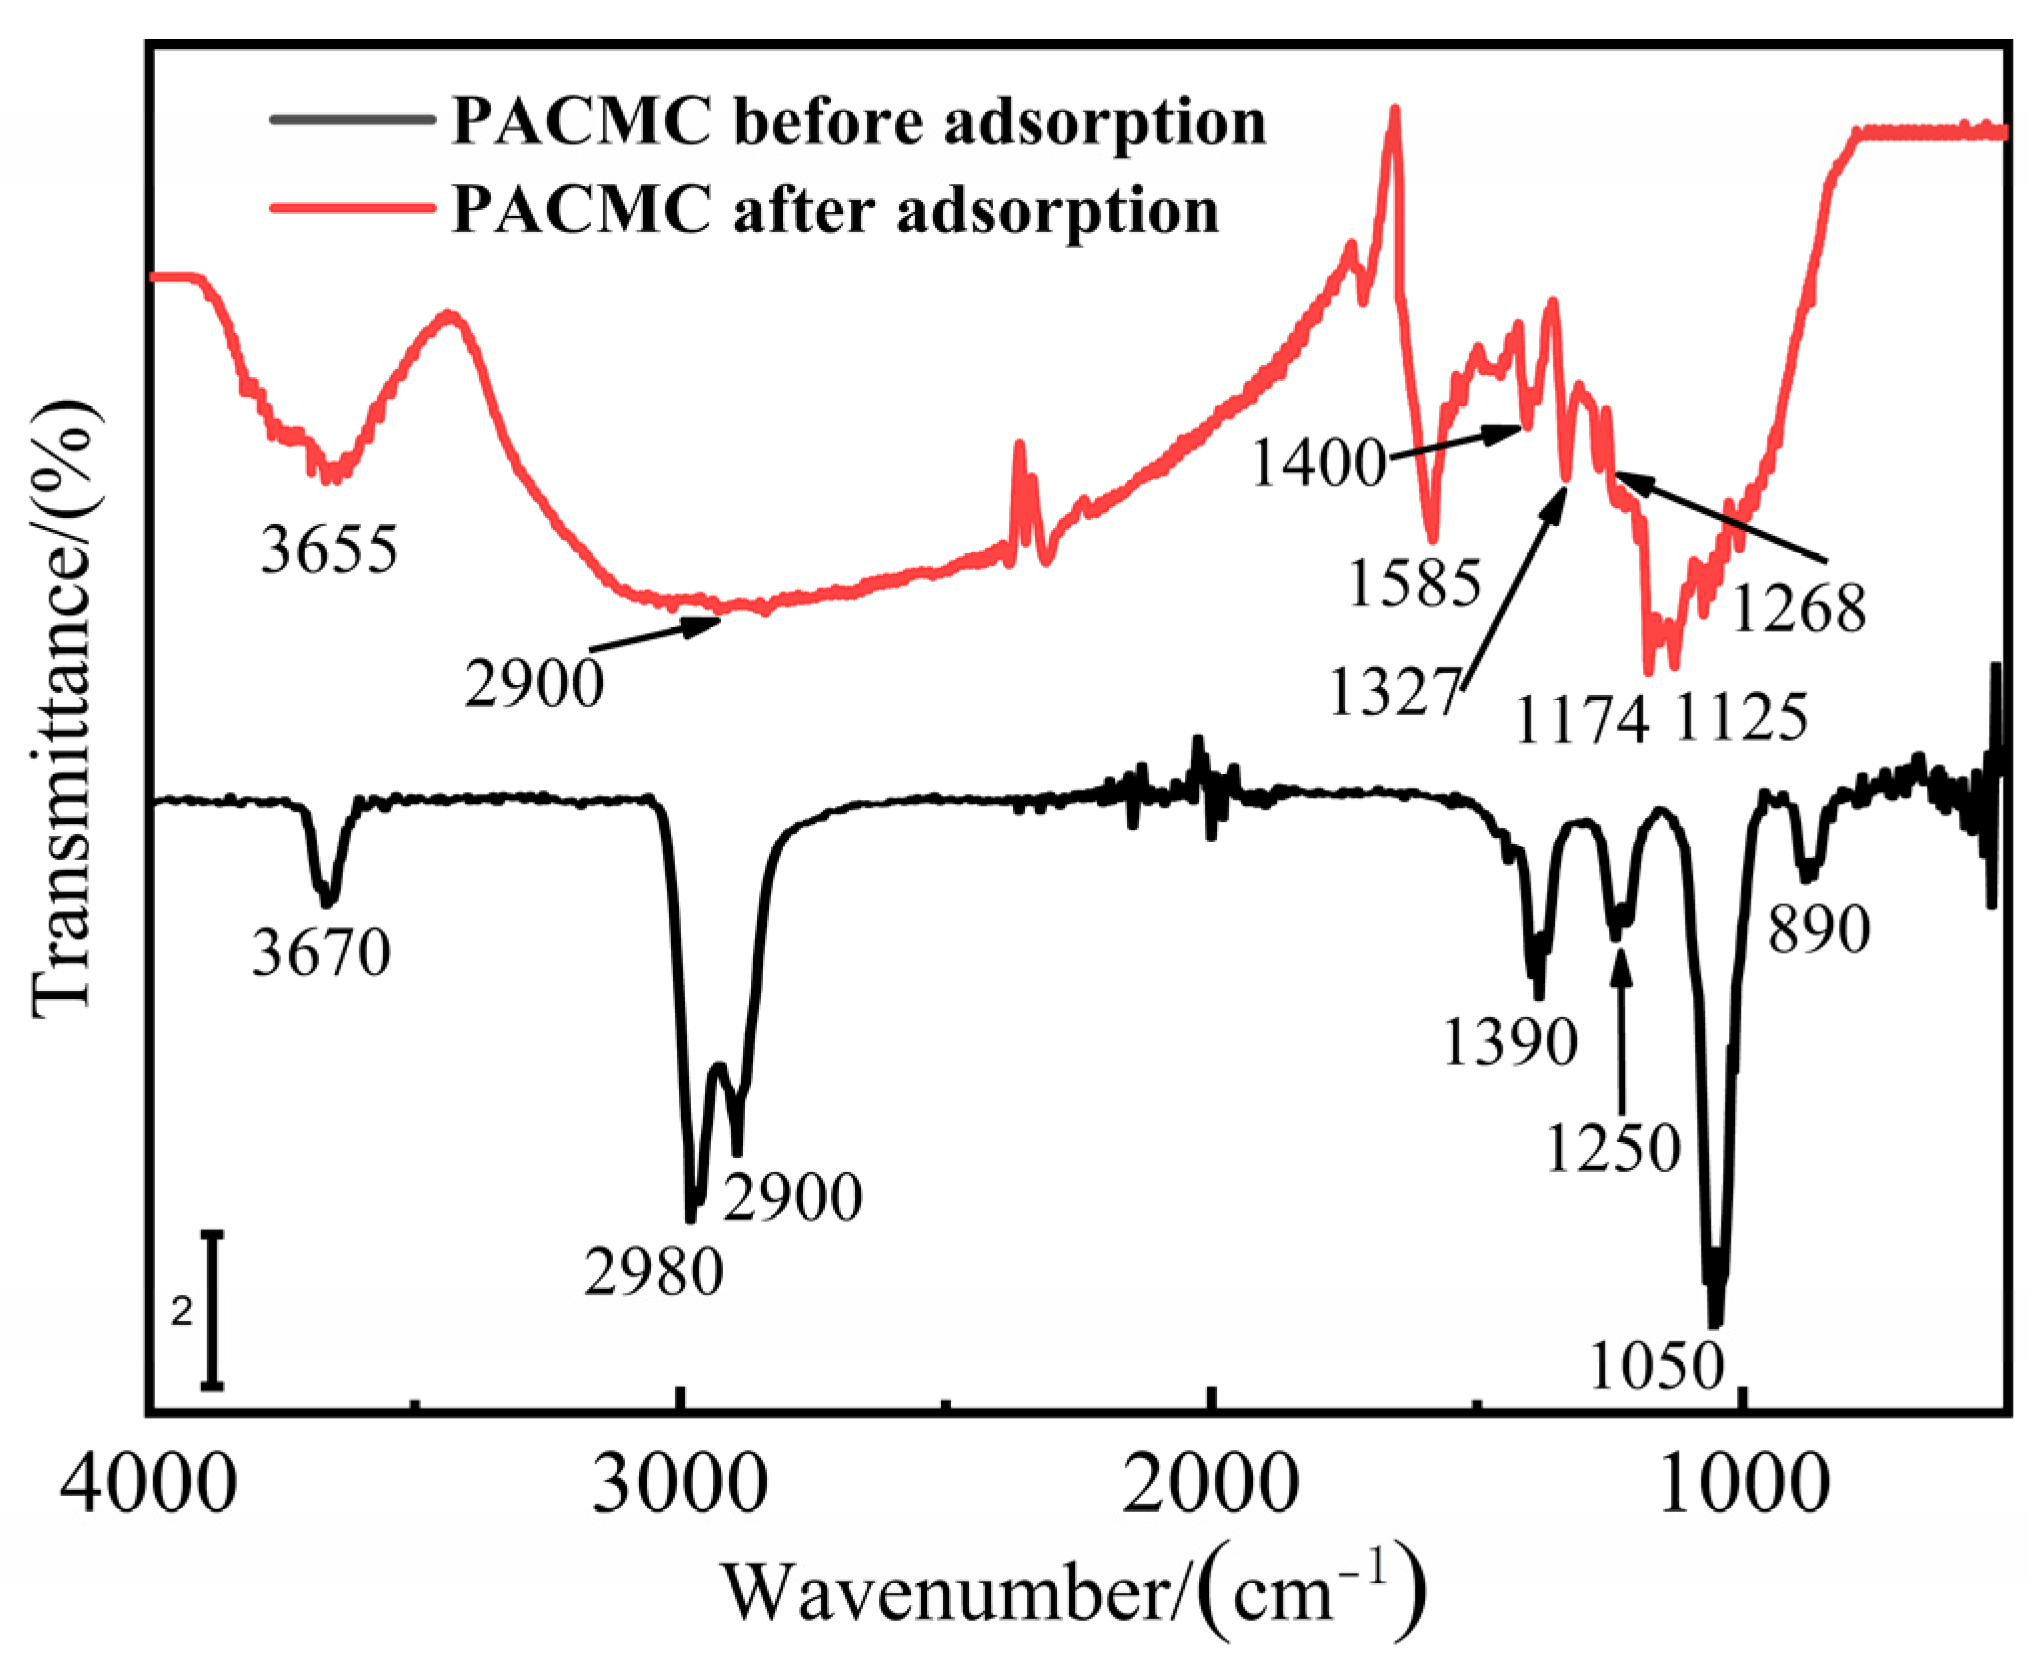
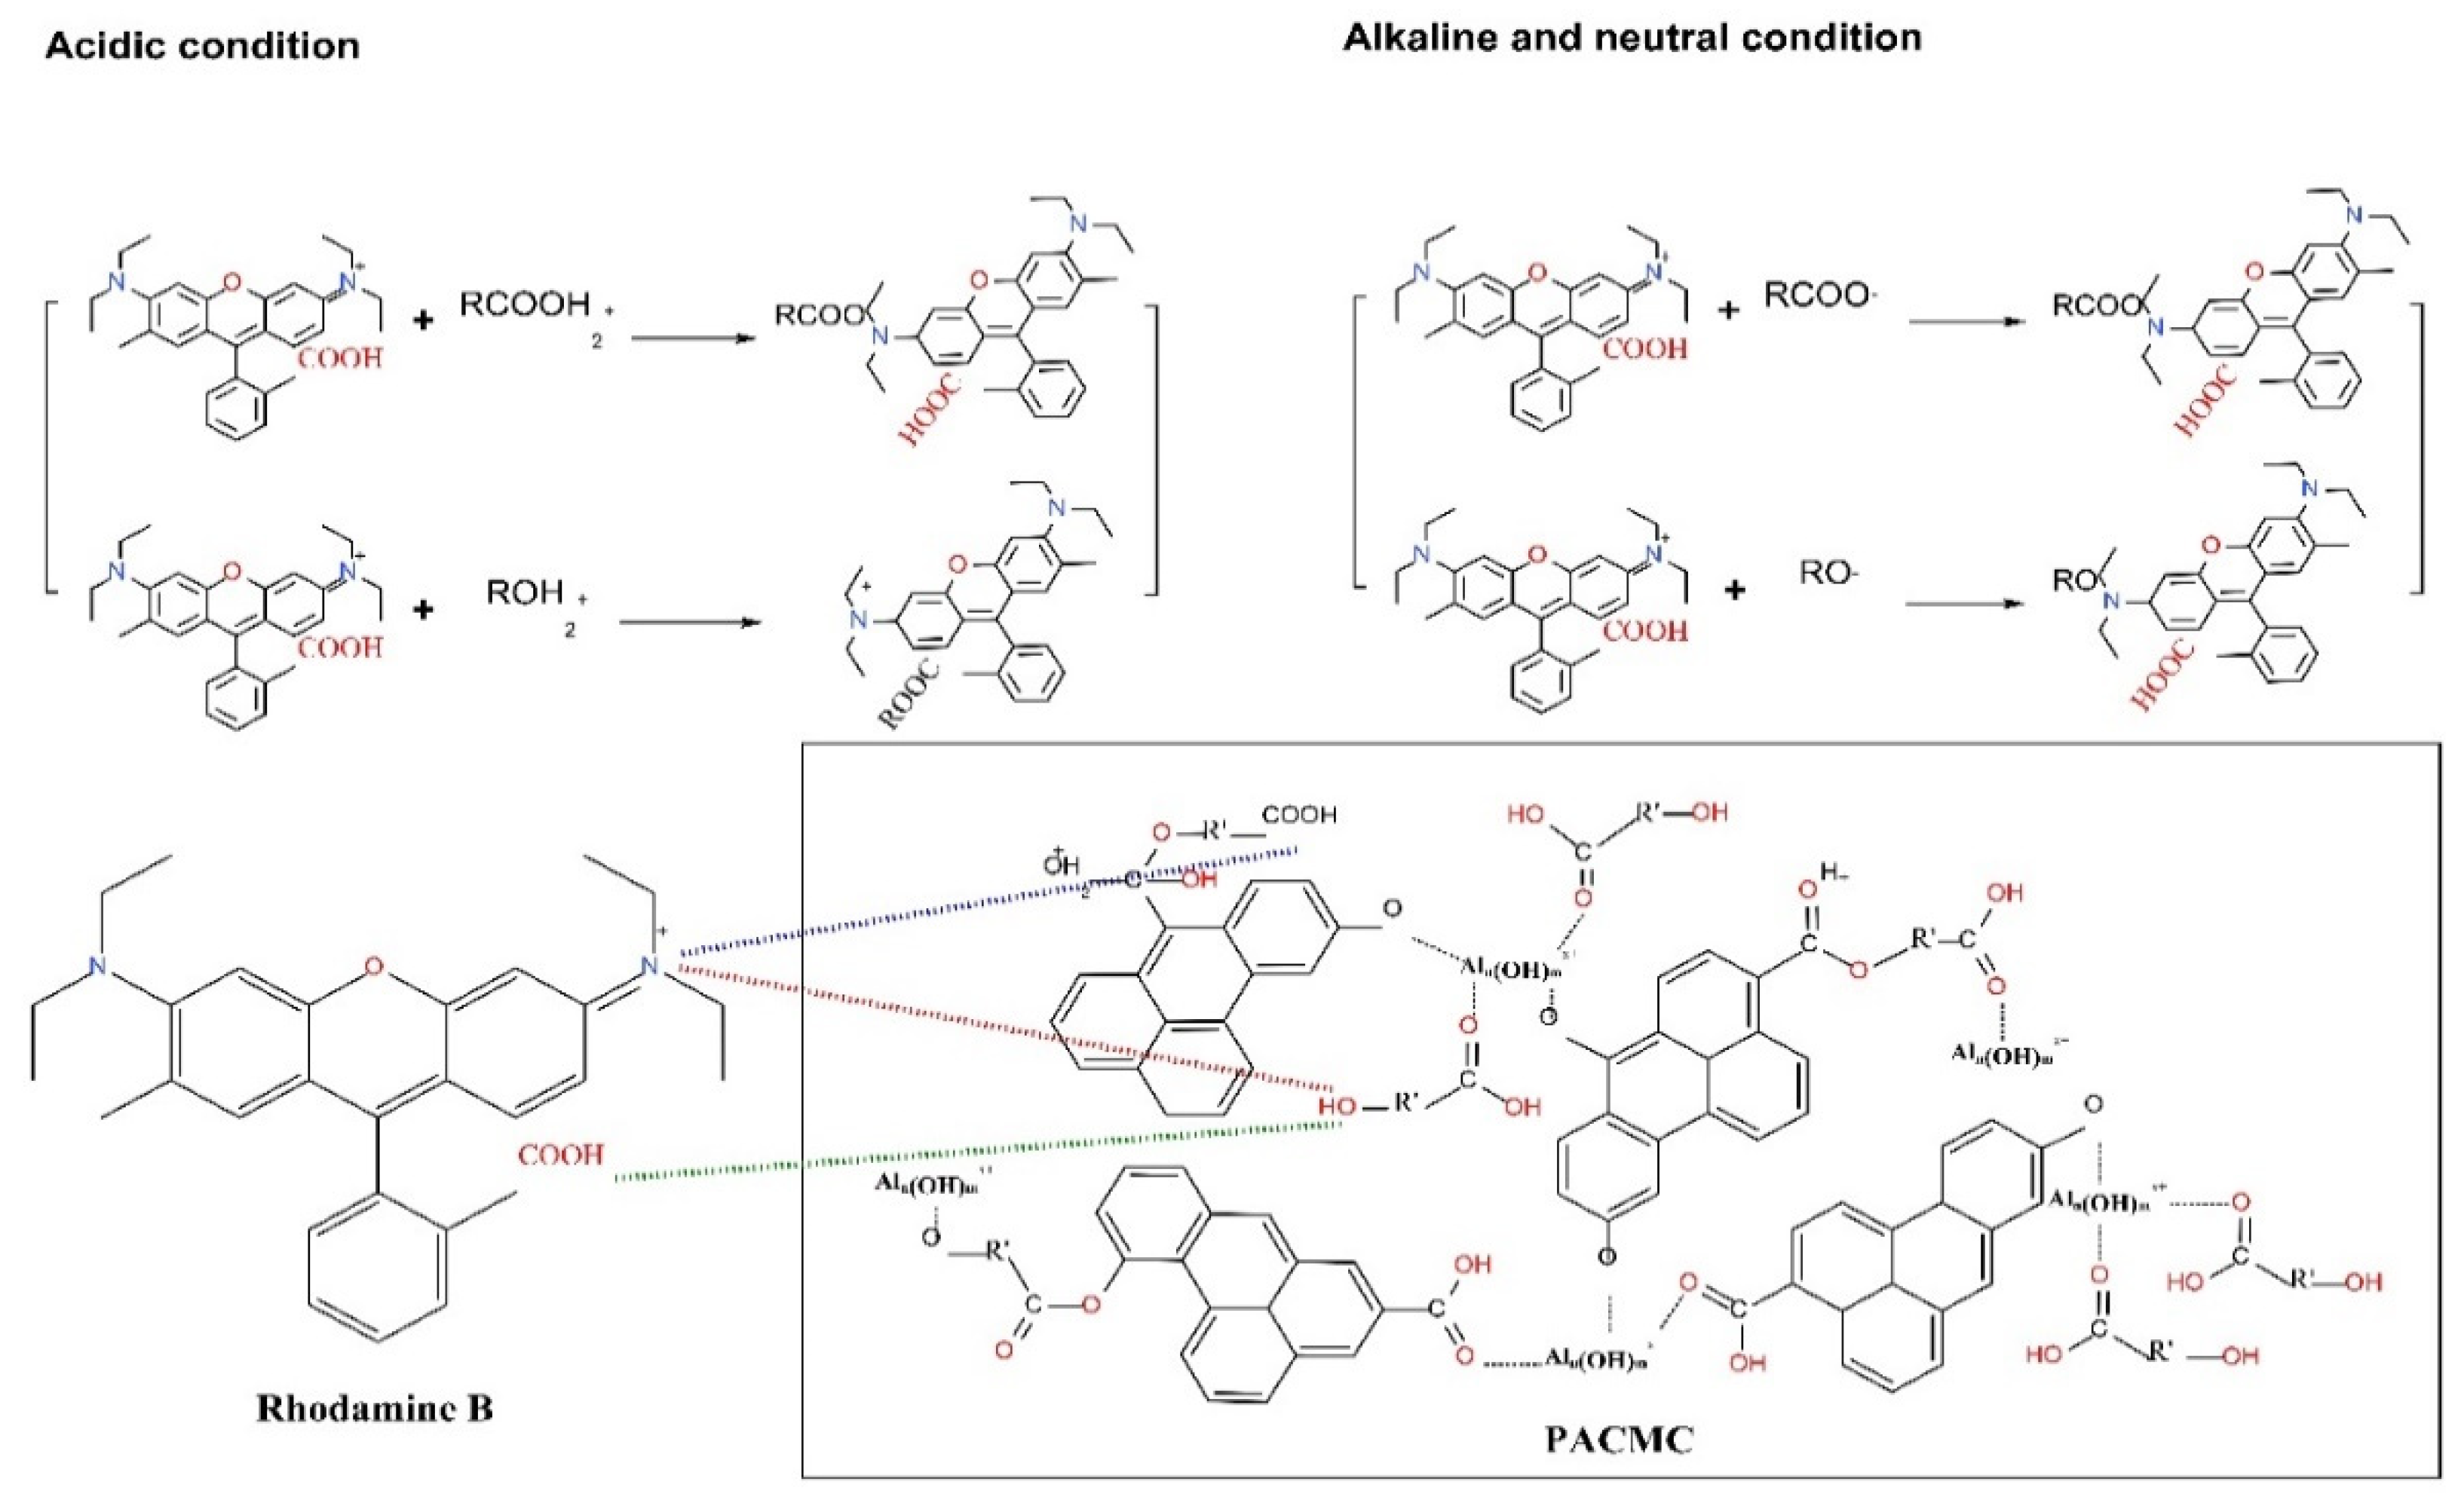
The SEM and EDS of PACMC after adsorption are shown in Figure 3a,b respectively. The layer structure that appears in Figure 2a gets blurred in Figure 3a because of adsorption. The particles are more dispersed and their morphology becomes more diverse, with floc-like substances appearing. The content of carbon increases and the content of oxygen decreases, indicating that they have adsorbed RhB (Figure 3b). The sulfur element appeared in element analysis may come from RhB impurity. The FT-IR of PACMC after adsorption is shown in Figure 10. As seen, new peaks appeared in the FT-IR spectrum. It can be observed that the major changes of PACMC IR spectra occur at the region 1600–800 cm−1, in which the adsorption bands of oxo-groups or bridges appear. Specifically, the band at 1390 cm−1 in PACMC spectra gradually degenerates into two distinct bands at 1400 and 1327 cm−1. In this region, bands related with the vibrations of O-H bonds appear. The band at 1050 cm−1 in PACMC spectra gradually degenerates into two distinct bands at 1174 and 1125 cm−1. Moreover, the band at 890 cm−1 in PACMC spectra disappears. The alteration of bands indicates that the carboxylic hydroxyl group disappeared and the hydroxyl group decreased after the adsorption of RhB by PACMC, indicating that carboxylic and hydroxyl groups are involved in the reaction during the adsorption process. FT-IR results before and after adsorption showed that the composition and structure of the adsorbent did not change, and the surfactant functional groups were basically consumed. At the same time, the particle dispersion increased after adsorption, indicating that part of the active functional groups that play the role of bridging were also consumed. On account of all the experimental results above, the functional groups (-OH and -COOH) that introduce on the surface of PACMC will chemically bond with RhB. The adsorption mechanism of RhB by PACMC is as follows: under acidic conditions, due to hydrophobicity, RhB+ is more likely to contact with PACMC, resulting in chemical bond bonding, and there is electrostatic attraction between positively charged PACMC and RhB. Under alkaline conditions, there is charge attraction between negative charged PACMC and RhB+. However, the formed complex RhB±(OH-)n tends to be repelled by the PACMC surface, decreasing the Qm values. The mechanism is speculated as shown in Figure 11.
4. Conclusions
In summary, we have developed a novel strategy to fabricate powdered activated carbon-based composites (PACMC) via a chemical precipitation method using powdered activated carbon (PAC), potassium humate (HS), and polyaluminium chloride (PACl). The results obtained in this work exhibit clear evidence that PACMC has a good capacity to adsorb RhB efficiently and spontaneously. The morphology studies of the PACMC revealed a highly porous structure suitable for adsorption. The calculated enthalpy of the reaction was −7.36 kJ·mol−1, with a decline of adsorption from 15.8 to 8.9 mg·g−1 when the temperature was increased from 20 to 40 °C, respectively. This confirms the exothermic nature of the reaction. Dubinin–Radushkevich isotherm exhibited the best data fit and representation of the experimental results with the square of the correlation coefficient (R2) value being 0.99299. Studies on reaction kinetics showed that the reaction is of a pseudo-second-order, indicating that it is a chemical adsorption process. Compared with PAC or PAC+PACl, PACMC had better adsorption effect on RhB. RhB removal by PACMC was found to be maximum at an optimum pH value of about 4.5 at 20 °C. When the initial concentration of RhB was 40 mg·L−1, the adsorption capacity can reach 28.56 mg·g−1. The adsorption mechanism of RhB by PACMC is that the functional groups (-OH and -COOH) introduced on the surface of PACMC are chemically bonded with RhB: under acidic conditions, due to hydrophobicity, RhB+ is more likely to have contact with PACMC, which leads to chemical bond bonding. At the same time, there is charge attraction between positive PACMC and RhB-. Under alkaline conditions, there is charge attraction between negatively charged PACMC and RhB+. However, the formed complex RhB±(OH-)n tends to be repelled by the PACMC surface, decreasing the Qm values.
According to the results in this work, it can be clearly seen that the current adsorption process appears to be feasible, as it proceeds fairly quickly with very promising adsorption capacity. PACMC are low cost and available adsorbents. The cost of PACMC is half that of PAC, and adsorption capacity is more than twice that of PAC. The environmental implications of applying such an adsorption process are insignificant because there is no need to regenerate the adsorbent—its raw materials are abundant and cheap.
Author Contributions
Conceptualization, Y.S.; methodology, Y.S.; validation, G.A and F.Z.; formal analysis, K.W.; investigation, Z.D.; resources, F.Z.; data curation, B.Z.; writing—original draft preparation, Y.S.; writing—review and editing, Y.S.; supervision, G.A. and F.Z.; project administration, Y.S. and F.Z.; funding acquisition, Y.S. All authors have read and agreed to the published version of the manuscript.
Funding
This research received no external funding.
Conflicts of Interest
The authors declare no conflict of interest.
References
- MoT. Census of Textile Power Processing Industry in India, Volume VII; Textile Committee, Ministry of Textiles, Government of India: Mumbai, India, 2001. [Google Scholar]
- Dükkancı, M.; Vinatoru, M.; Mason, T.J. The sonochemical decolourisation of textile azo dye Orange II: Effects of Fenton type reagents and UV light. Ultrason. Sonochem. 2014, 21, 846–853. [Google Scholar] [CrossRef] [PubMed]
- Sen, T.K.; Afroze, S.; Ang, H.M. Equilibrium, kinetics and mechanism of removal of methylene blue from aqueous solution by adsorption onto pine cone biomass of Pinus radiate. Water Air Soil Pollut. 2011, 218, 499–515. [Google Scholar] [CrossRef]
- Rafatullah, M.; Sulaiman, O.; Hashim, R.L. Adsorption of methylene blue on low-cost adsorbents: A review. J. Hazard. Mater. 2009, 177, 70–80. [Google Scholar] [CrossRef] [PubMed]
- Guo, Z.; Zhang, J.; Liu, H. Ultra-high Rhodamine B adsorption capacities from an aqueous solution by activated carbon derived from Phragmites australis doped with organic acid by phosphoric acid activation. RSC Adv. 2016, 6, 40818–40827. [Google Scholar] [CrossRef]
- Danish, M.; Khanday, W.A.; Hashim, R. Application of optimized large surface area date stone (Phoenix dactylifera) activated carbon for rhodamin B removal from aqueous solution: Box-Behnken design approach. Ecotoxicol. Environ. Saf. 2017, 139, 280–290. [Google Scholar] [CrossRef] [PubMed]
- Shakiba, S.; Maryam, M.; Mohammad-Hossein, S. Recent advances in the treatment of dye-containing wastewater from textile industries: Overview and perspectives. Process Saf. Environ. Prot. 2020, 143, 138–163. [Google Scholar]
- Khan, T.A.; Sharma, S.; Ali, I. Adsorption of Rhodamine B dye from aqueous solution onto acid activated mango (Magnifera indica) leaf powder: Equilibrium, kinetic and thermodynamic studies. J. Toxicol. Environ. Health Sci. 2011, 3, 286–297. [Google Scholar]
- Shi, B.; Li, G.; Wang, D. Removal of direct dyes by coagulation: The performance of preformed polymeric aluminum species. J. Hazard. Mater. 2007, 143, 567–574. [Google Scholar] [CrossRef]
- Yogalakshmi, K.N.; Das, A.; Rani, G. Nanobioremediation: A new age technology for the treatment of dyes in textile effluents. In Bioremediation of Industrial Waste for Environmental Safety; Springer: Singapore, 2020; pp. 313–347. [Google Scholar]
- Fatombi, J.K.; Osseni, S.A.; Idohou, E.A.; Agani, I.; Neumeyer, D.; Verelst, M.; Mauricot, R.; Aminou, T. Characterization and application of alkali-soluble poly saccharide of Carica papaya seeds for removal of indigo carmine and Congo red dyes from single and binary solutions. J. Environ. Chem. Eng. 2019, 7, 103343. [Google Scholar] [CrossRef]
- Cao, Q.W.; Zheng, Y.F.; Song, X.C. Enhanced visible-light-driven photocatalytic degradation of RhB by AgIO3/WO3 composites. J. Taiwan Inst. Chem. E 2017, 70, 359–365. [Google Scholar] [CrossRef]
- Li, X.; Sun, S.; Zhang, X.; Liu, G.; Zheng, C.R.; Zheng, J.; Zhang, D.; Yao, H. Combined electro-catazone/electro-peroxone process for rapid and effective Rhodamine B degradation. Sep. Purif. Technol. 2017, 178, 189–192. [Google Scholar] [CrossRef]
- Zhang, J.; Yang, Z.; Wang, L. Carbon covered Ag and Bi nanoparticles uniformly dispersed in porous carbon matrix: Synergistic effect for removal of RhB. Mater. Lett. 2020, 275, 128099. [Google Scholar] [CrossRef]
- Shahnaz, T.; Narayanasamy, S. Surface modification of nanocellulose using polypyrrole for the adsorptive removal of Congo red dye and chromium in binary mixture. Int. J. Biol. Macromol. 2020, 151, 322–332. [Google Scholar] [CrossRef] [PubMed]
- Ghibate, R.; Sabry, F.; Senhaji, O.; Taouil, R.; Touzani, M. State of the art of technologies for Zn2þ ions removal from industrial effluents with adsorption: Examination of process parameters (Part I). Int. J. Innov. Res. Sci. Technol. 2015, 2, 39–48. [Google Scholar]
- Ali, F.; Ali, N.; Bibi, I.; Said, A.; Nawaz, S.; Ali, Z.; Salman, S.M.; Iqbal, H.M.N.; Bilal, M. Adsorption isotherm, kinetics and thermodynamic of acid blue and basic blue dyes onto activated charcoal. Case Stud. Chem. Environ. Eng. 2020, 2, 100040. [Google Scholar] [CrossRef]
- Shubair, T.; Eljamal, O.; Khalil, A.; Matsunaga, N. Nitrate Removal in Porous Media Using Nanoscale Zero Valent Iron: Column Experiment. In Proceedings of the 3rd International Exchange and Innovation Conference on Engineering & Sciences Kyushu University, Fukuoka, Japan, 19–20 October 2017. [Google Scholar]
- Xiao, W.D.; Xiao, L.P.; Lv, Y.H.; Yin, W.Z.; Julio, S.; Zhai, S.R.; An, Q.D.; Sun, R.C. Lignin-derived carbon coated nanoscale zero-valent iron as a novel bifunctional material for efficient removal of Cr(VI) and organic pollutants. Sep. Purif. Technol. 2022, 299, 121689. [Google Scholar] [CrossRef]
- Zhu, S.; Mingzhu, X.; Yuting, C.; Muhammad, A.K.; Wu, L.; Fengyun, W.; Tahir, M. Along Wang Adsorption and Desorption of Pb(II) on L-Lysine Modified Montmorillonite and the simulation of Interlayer Structure. Appl. Clay Sci. 2019, 169, 40–47. [Google Scholar] [CrossRef]
- Sidi, Z.; Yexiang, C.; Muhammad, A.K.; Haihua, X.; Fengyun, W.; Mingzhu, X. In-Depth Study of Heavy Metal Removal by an Etidronic Acid-Functionalized Layered Double Hydroxide. ACS Appl. Mater. Interfaces 2022, 14, 7450–7463. [Google Scholar] [CrossRef]
- Yoshihiko, M.; Soichi, N.; Asuka, S. Adsorption capacities of activated carbons for geosmin and 2-methylisoborneol vary with activated carbon particle size: Effects of adsorbent and adsorbate characteristics. Water Res. 2015, 85, 95–102. [Google Scholar]
- Ando, N.; Matsui, Y.; Kurotobi, R. Comparison of natural organic matter adsorption capacities of super-powdered activated carbon and powdered activated carbon. Water Res. 2010, 44, 4127–4136. [Google Scholar] [CrossRef]
- Hicham, Z.; Lydia, F.; Hayet, D.; Aymen, A.; Abdoulaye, K. A comprehensive review of biochar in removal of organic pollutants from wastewater: Characterization, toxicity, activation/functionalization and influencing treatment factors. J. Water Process Eng. 2022, 47, 102801. [Google Scholar]
- Hicham, Z.; Lydia, F.; Angélique, M.; Rian, V.; Abdoulaye, K. Potential of Flax Shives and Beech Wood-Derived Biochar in Methylene Blue and Carbamazepine Removal from Aqueous Solutions. Materials 2022, 15, 2824. [Google Scholar]
- Maryam, H.; Mohammad, H. Application of three dimensional porous aerogels as adsorbent for removal of heavy metal ions from water/wastewater: A review study. Adv. Colloid Interface Sci. 2020, 284, 102247. [Google Scholar]
- Ẑalac, S.; Kallay, N. Application of mass titration to the point of zero charge determination. J. Colloid Interface Sci. 1992, 149, 233–240. [Google Scholar] [CrossRef]
- Parwathi, P.; Swapnil, D.; Manan, S.; Rashi, S. Determination of fluoride removal using silica nano adsorbent modified by rice husk from water. Groundw. Sustain. Dev. 2020, 11, 100423. [Google Scholar]
- Tzoupanos, N.D.; Zouboulis, A.I.; Tsoleridis, C.A. A systematic study for the characterisation of a novel coagulant (polyaluminium silicate chloride). Colloids Surf. A Physicochem. Eng. Asp. 2009, 342, 30–39. [Google Scholar] [CrossRef]
- Iqbal, M.; Saeed, A.; Zafar, S.I. FTIR spectrophotometry, kinetics and adsorption isotherms modeling, ion exchange, and EDX analysis for understanding the mechanism of Cd2+ and Pb2+ removal by mango peel waste. J. Hazard. Mater. 2009, 164, 161–171. [Google Scholar] [CrossRef]
- Jiang, R.; Tian, J.; Zheng, H.; Qi, J.; Sun, S.; Li, X. A novel magnetic adsorbent based on waste litchi peels for removing Pb(II) from aqueous solution. J. Environ. Manag. 2015, 155, 24–30. [Google Scholar] [CrossRef]
- Ma, W.; Ya, F.; Han, M.; Wang, R. Characteristics of equilibrium, kinetics studies for adsorption of fluoride on magnetic-chitosan particle. J. Hazard. Mater. 2007, 143, 296–302. [Google Scholar] [CrossRef]
- Halina, M.; Jadwiga, W. Adsorption of metal ions on humic acids extracted from brown coals. Fuel Process. Technol. 2003, 84, 23–36. [Google Scholar]
- Nakazawa, Y.; Matsui, Y.; Hanamura, Y. Minimizing residual black particles in sand filtrate when applying superfine powdered activated carbon: Coagulants and coagulation conditions. Water Res. 2018, 147, 311–320. [Google Scholar] [CrossRef] [PubMed]
- Qada, E.N.E.; Allen, S.J.; Walker, G.M. Adsorption of Basic Dyes onto Activated Carbon Using Microcolumns. Ind. Eng. Chem. Res. 2006, 45, 6044–6049. [Google Scholar] [CrossRef]
- Tan, I.A.W.; Ahmad, A.L.; Hameed, B.H. Adsorption isotherms, kinetics, thermodynamics and desorption studies of 2, 4, 6-trichlorophenol on oil palm empty fruit bunch-based activated carbon. J. Hazard. Mater. 2009, 164, 473–482. [Google Scholar] [CrossRef] [PubMed]
- Zhu, S.D.; Khan, M.A.; Wang, F.Y. Rapid removal of toxic metal Cu2+ and Pb2+ by amino trimethylene phosphonic acid intercalated layered double hydroxide: A combined experimental and DFT study. Chem. Eng. J. 2020, 392, 123711. [Google Scholar] [CrossRef]
- Çelekli, A.; Ìlgün, G.; Bozkurt, H. Sorption equilibrium, kinetic, thermodynamic, and desorption studies of Reactive Red 120 on Chara contraria. Chem. Eng. J. 2012, 191, 228–235. [Google Scholar] [CrossRef]
- Tan, K.L.; Hameed, B.H. Insight into the adsorption kinetics models for the removal of contaminants from aqueous solutions. J. Taiwan Inst. Chem. Eng. 2017, 74, 25–48. [Google Scholar] [CrossRef]
- Randhawa, N.S.; Das, N.N.; Jana, R.K. Adsorptive remediation of Cu (II) and Cd (II) contaminated water using manganese nodule leaching residue. Desalination Water Treat. 2014, 52, 4197–4211. [Google Scholar] [CrossRef]
- Wu, F.C.; Tseng, R.L.; Juang, R.-S. Initial behavior of intraparticle diffusion model used in the description of adsorption kinetics. Chem. Eng. J. 2009, 153, 1–8. [Google Scholar] [CrossRef]
- Zhan, Y.; Lin, J.; Zhu, Z. Removal of nitrate from aqueous solution using cetylpyridinium bromide (CPB) modified zeolite as adsorbent. J. Hazard. Mater. 2011, 186, 1972–1978. [Google Scholar] [CrossRef]
- Çolak, F.; Atar, N.; Olgun, A. Biosorption of acidic dyes from aqueous solution by Paenibacillusmacerans: Kinetic, thermodynamic and equilibrium studies. Chem. Eng. J. 2009, 150, 122–130. [Google Scholar] [CrossRef]
- Shahryari, Z.; Goharrizi, A.S.; Azadi, M. Experimental study of methylene blue adsorption from aqueous solutions onto carbon nano tubes. Int. J. Water Resour. Environ. Eng. 2010, 2, 16–28. [Google Scholar]
- Wang, B.; Zhang, H.; Phuong, H.T. Gas permeability and adsorbability of the glass-bonded porous silicon carbide ceramics with controlled pore size. Ceram. Int. 2015, 41, 2279–2285. [Google Scholar] [CrossRef]
- Lucas, S.; Vitor, A.D.; Patrícia, V. Optimization of Sibipiruna activated carbon preparation by simplex-centroid mixture design for simultaneous adsorption of rhodamineB and metformin. J. Hazard. Mater. 2021, 411, 125–166. [Google Scholar]
- Zimmermann, A.C.; Mecabô, A.; Fagundes, T. Adsorption of Cr(VI) using Fe-crosslinked chitosan complex (Ch-Fe). J. Hazard. Mater. 2010, 179, 192–196. [Google Scholar] [CrossRef] [PubMed]
Figure 1.
Infra-red spectra of PACMC and ingredient.

Figure 2.
SEM and EDS maps of PACMC and PAC. (a) PACMC-SEM; (b) PACMC-SEM; (c) PAC-SEM; (d) PACMC-EDS; (e) PAC-EDS.
Figure 2.
SEM and EDS maps of PACMC and PAC. (a) PACMC-SEM; (b) PACMC-SEM; (c) PAC-SEM; (d) PACMC-EDS; (e) PAC-EDS.

Figure 3.
SEM and EDS maps of PACMC after RhB adsorption. (a) PACMC-SEM; (b) PACMC-EDS.

Figure 4.
(a) Preparation route of PACMC. (b) A schematic microstructure illustration for PACMC.

Figure 5.
EEMs maps of PACMC’s supernatant at different pH conditions (a) pH = 9. (b) pH = 7. (c) pH = 2.
Figure 5.
EEMs maps of PACMC’s supernatant at different pH conditions (a) pH = 9. (b) pH = 7. (c) pH = 2.

Figure 6.
(a) Particle size distribution of PACMC. (b) Zero potential of PACMC at different pH (Adsorbent mass: 2 g·L−1, Temperature: 20 °C).
Figure 6.
(a) Particle size distribution of PACMC. (b) Zero potential of PACMC at different pH (Adsorbent mass: 2 g·L−1, Temperature: 20 °C).

Figure 7.
(a,b) Fitting of adsorption isotherms of PACMC. (c) Kinetics of RhB uptake on PACMC. (d) Particle diffusion model for RhB adsorption by RhB (C0 = 20 mg·L−1, Adsorbent mass: 1 g·L−1, Temperature: 20 °C, pH = 6.88, Reaction time: 6 h).
Figure 7.
(a,b) Fitting of adsorption isotherms of PACMC. (c) Kinetics of RhB uptake on PACMC. (d) Particle diffusion model for RhB adsorption by RhB (C0 = 20 mg·L−1, Adsorbent mass: 1 g·L−1, Temperature: 20 °C, pH = 6.88, Reaction time: 6 h).


Figure 8.
(a) Fitting of adsorption isotherms of PACMC. (b) Influence of Temperature for the adsorption of RhB on PACMC (C0 = 20 mg·L−1, Adsorbent mass: 1 g·L−1 pH = 6.88, Reaction time: 24 h).
Figure 8.
(a) Fitting of adsorption isotherms of PACMC. (b) Influence of Temperature for the adsorption of RhB on PACMC (C0 = 20 mg·L−1, Adsorbent mass: 1 g·L−1 pH = 6.88, Reaction time: 24 h).

Figure 9.
(a) Influence of initial RhB concentration for removal efficiency of RhB on PAC, PAC+PACl, and PACMC (Adsorbent mass: 1 g·L−1, Temperature: 20 °C, pH = 6.88, Reaction time: 24 h); (b) Influence of reaction time for the adsorption capacity (qt) and removal efficiency of RhB on PACMC (C0 = 20 mg·L−1, Adsorbent mass: 1 g·L−1, Temperature: 20 °C, pH = 6.88); (c) Influence of solution pH for the adsorption of RhB on PACMC 1—pH = 4.5; 2—pH = 9; 3—pH = 7 (C0 = 20, 30, 40 mg·L−1, Adsorbent mass: 1 g·L−1, Temperature: 20 °C, Reaction time: 24 h).


Figure 10.
FTIR images of PACMC after adsorption.

Figure 11.
Possible mechanism of RhB adsorption by PACMC.

Publisher’s Note: MDPI stays neutral with regard to jurisdictional claims in published maps and institutional affiliations. |
© 2022 by the authors. Licensee MDPI, Basel, Switzerland. This article is an open access article distributed under the terms and conditions of the Creative Commons Attribution (CC BY) license (https://creativecommons.org/licenses/by/4.0/).
Share and Cite
MDPI and ACS Style
Song, Y.; Wang, K.; Zhao, F.; Du, Z.; Zhong, B.; An, G. Preparation of Powdered Activated Carbon Composite Material and Its Adsorption Performance and Mechanisms for Removing RhB. Water 2022, 14, 3048. https://doi.org/10.3390/w14193048
AMA Style
Song Y, Wang K, Zhao F, Du Z, Zhong B, An G. Preparation of Powdered Activated Carbon Composite Material and Its Adsorption Performance and Mechanisms for Removing RhB. Water. 2022; 14(19):3048. https://doi.org/10.3390/w14193048
Chicago/Turabian StyleSong, Yarui, Kaisheng Wang, Fajun Zhao, Zhaoxi Du, Biao Zhong, and Guangyu An. 2022. "Preparation of Powdered Activated Carbon Composite Material and Its Adsorption Performance and Mechanisms for Removing RhB" Water 14, no. 19: 3048. https://doi.org/10.3390/w14193048
Note that from the first issue of 2016, this journal uses article numbers instead of page numbers. See further details here.