Dynamic Formation Processes and Characteristics of “28 June 2012” Debris Flow in Aizi Valley, Ningnan County, Sichuan Province, China


1
Hubei Key Laboratory of Disaster Prevention and Mitigation, China Three Gorges University, Yichang 443002, Hubei, China
2
School of Civil Engineering, Henan Polytechnic University, Jiaozuo 454000, Henan, China
3
Gongqing Institute of Science and Technology, Gongqingcheng 332020, Jiangxi, China
4
Hubei Provincial Engineering Research Center of Slope Habitat Construction Technique Using Cement-Based Materials, China Three Gorges University, Yichang 443002, Hubei, China
5
Key Laboratory of Lower Yellow River Channel and Estuary Regulation, Ministry of Water Resources, Yellow River Institute of Hydraulic Research, Yellow River Conservancy Commission (YRCC), Zhengzhou 450003, Henan, China
6
Faculty of Public Safety and Emergency Management, Kunming University of Science and Technology, Kunming 650093, Yunnan, China
7
Key Laboratory of Geological Disaster Risk Prevention and Control and Emergency Disaster Reduction of Ministry of Emergency Management of the People’s Republic of China, Kunming 650093, Yunnan, China
8
Key Laboratory of Early Rapid Identification, Prevention and Control of Geological Disaster in Traffic Corridor of High Intensity Earthquake Mountainous Area of Yunnan Province, Kunming 650093, Yunnan, China
*
Authors to whom correspondence should be addressed.
Water 2022, 14(19), 3045; https://doi.org/10.3390/w14193045
Submission received: 14 July 2022
/
Revised: 20 September 2022
/
Accepted: 23 September 2022
/
Published: 27 September 2022
(This article belongs to the Section Soil and Water)
Abstract
:On 28 June 2012, a large debris flow occurred in Aizi gully, Ningnan County, Sichuan Province, China. It was the most significant debris flow disaster at a construction site in 2012 in China, which left 40 people dead or missing. Field investigations and model calculations were conducted following the event in order to determine dynamic parameters and execute engineering mitigation measures. Analyzing the collected data, it is found that earthquake and drought play a dominant role in debris flow initiation, and from 1 January 1986 to 31 December 2010, 43 earthquakes with a magnitude greater than 3.0 occurred around the study area. Through calculation it was found that the inducive radius of 16 earthquakes was larger than the distance between the epicenter and the study area, and it proves that the study area is frequently affected by seismic activities. Furthermore, on the basis of calculation of rainfall anomaly index H from January 2011 to June 2012, it can be seen that the rainfall of 2011 is extremely low. The percentage of the rainfall anomaly index is almost less than −34%, which indicates that the drought in the basin is serious. Under the influences of repeated seismic activities and continuous droughts, the structure of soil was destroyed and its strength and permeability changed significantly, providing favorable conditions for debris flow initiation. On 28 June 2012, heavy rainfall with the intensity of 23.3 mm/h occurred, and the total amount of precipitation reached 66.1 mm before 6am of 28 June 2012. Debris flow was induced due to the triggering effect of the torrential rain. Studying the causes of the large-scale debris flows in construction sites can significantly facilitate the prevention and mitigation of future debris flow disasters, as well as reduce the potential of hazards caused by debris flows in major engineering areas.
1. Introduction
Rainfall-induced landslides and the subsequent debris flows pose a great threat to the safety of people and their properties in mountainous areas and are one of the most common types of geological disasters worldwide [1]; debris flows are not only responsible for repeated blockages of national highways and rivers but also result in loss of life and property. They also cause damage to the environment every year in mountainous regions [2,3]. Therefore, understanding influential factors and a formation mechanism is essential to plan debris flow mitigation [4]. Many researchers have attempted to understand the physical mechanisms of rainfall-induced landslides, and proposed some early warning models [5,6], and the rainfall intensity–duration model (I-D) is the main rainfall-induced landslide early warning model currently in use, and it directly applies real-time rainfall data to forecasting landslide initiations. A rainfall threshold is one of the commonly used indicators for early warning systems. However, due to the lack of long series rainfall data in remote mountainous areas, the accuracy of the determined critical rainfall value cannot meet the needs of early warning systems. Many researchers have attempted to reveal the relationship between rainfall and the occurrence of mass movements [7].
Previous studies showed that earthquakes played a significant role in the process of debris flow initiation [8,9], and a lot of studies find that most landslides are located near a fault, particularly large-scale rock landsides [10,11]. For example, the Xiaojiang debris flow activity zone is located within the Xiaojiang seismic belt in China, and seismic activity in Alaska was the main reason for the outbreak of a large-scale catastrophic debris flow in 1964 [12]. The Chi-Chi earthquake in Taiwan in 1999 led to a significant increase in the frequency and scale of debris flows. In addition, 76% of the landslides occurred within 5km of the fault after the Wenchuan earthquake [13,14,15,16,17].
Due to global climate change, extreme weather events become more frequent, especially extreme droughts and heavy rainfalls, and recent studies found that drought also plays an important role in the processes of debris flow formation. In northern Italy and the watershed of Lake Lago Di Braies, the sediment deposition data of the past 4500 years showed that debris flows were closely related to the seasonal extreme weather conditions [18]. Recent data from China (2010–2012) indicate a close correlation between debris flows and antecedent droughts. In 2010, over 2900 people died in western China due to debris flows, and 12 of the 16 debris flow sites were in the areas that experienced droughts from 2009–2010. Among them, the Gansu Zhouqu region experienced a severe drought in winter and a light drought in spring 2010, and following the debris flow on 7 August 2010, that killed more than 2000 people. On 10 June 2011, rare debris flows in Hunan Linxiang Hefan Ravine, which experienced a mildly dry winter and severely dry spring, caused 12 people to die and seven people to be missing [19]. A drought can reduce vegetation cover, weaken soil strength and increase loose solid materials which are prone to debris flows due to the distribution of varied debris and disturbed soil. Seismic activities and droughts can produce large amounts of loose solid materials in drought-affected areas, and due to the influence of subsequent precipitation, such materials can easily be mobilized into debris flows [19].
Engineering activities such as the construction of large hydropower projects, highways, industrial plants, etc. have a significant impact on the stability of slopes in mountainous areas, which provide favorable conditions for debris flow formation [13]. Therefore, studying the combined effects of seismic activities, extreme droughts, heavy rainfalls and human engineering activities on debris flow formation has an important scientific significance. According to the data from 2009 to 2012 in Sichuan Province, 41 debris flow events occurred and over 281 people died or were missing, which represents 0.5% of the total number of geological disasters and 57% of the total number of casualties. Revealing the formation mechanism and movement processes of a debris flow under the influence of earthquakes and droughts can not only provide a basis for the prevention and control of the debris flows in the study area, but can also provide an important basis for predicting and utilizing mitigation measures for this kind of debris flow. Therefore, the aim of the present study was to analyze the formation mechanism of the debris flow that occurred on 28 June 2012, as an opportunity for better understanding debris flow development under the comprehensive effect of natural and human activities, in order to further promote prevention and mitigation in many regions, especially in major project areas in western China.
2. Study Area
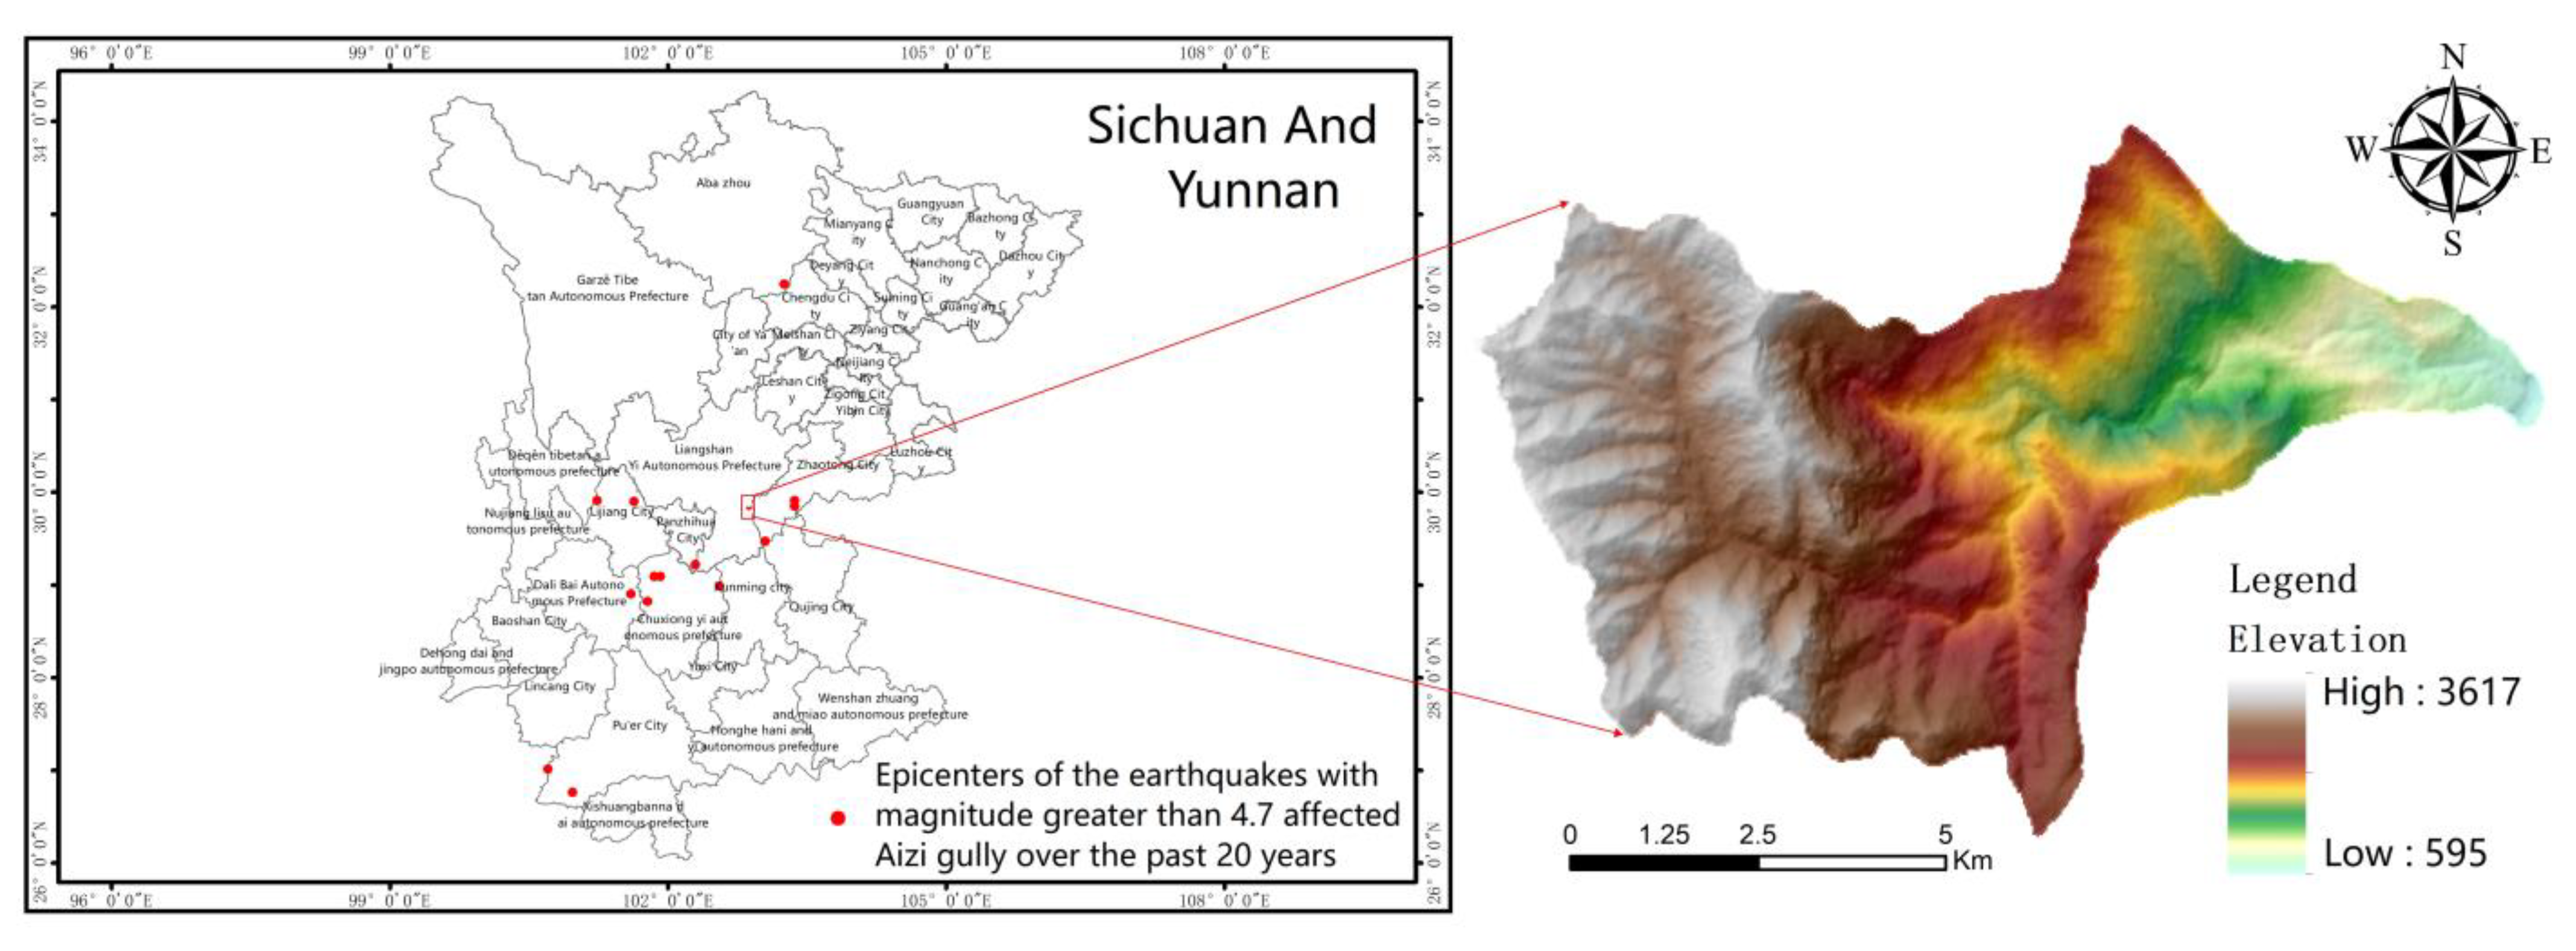
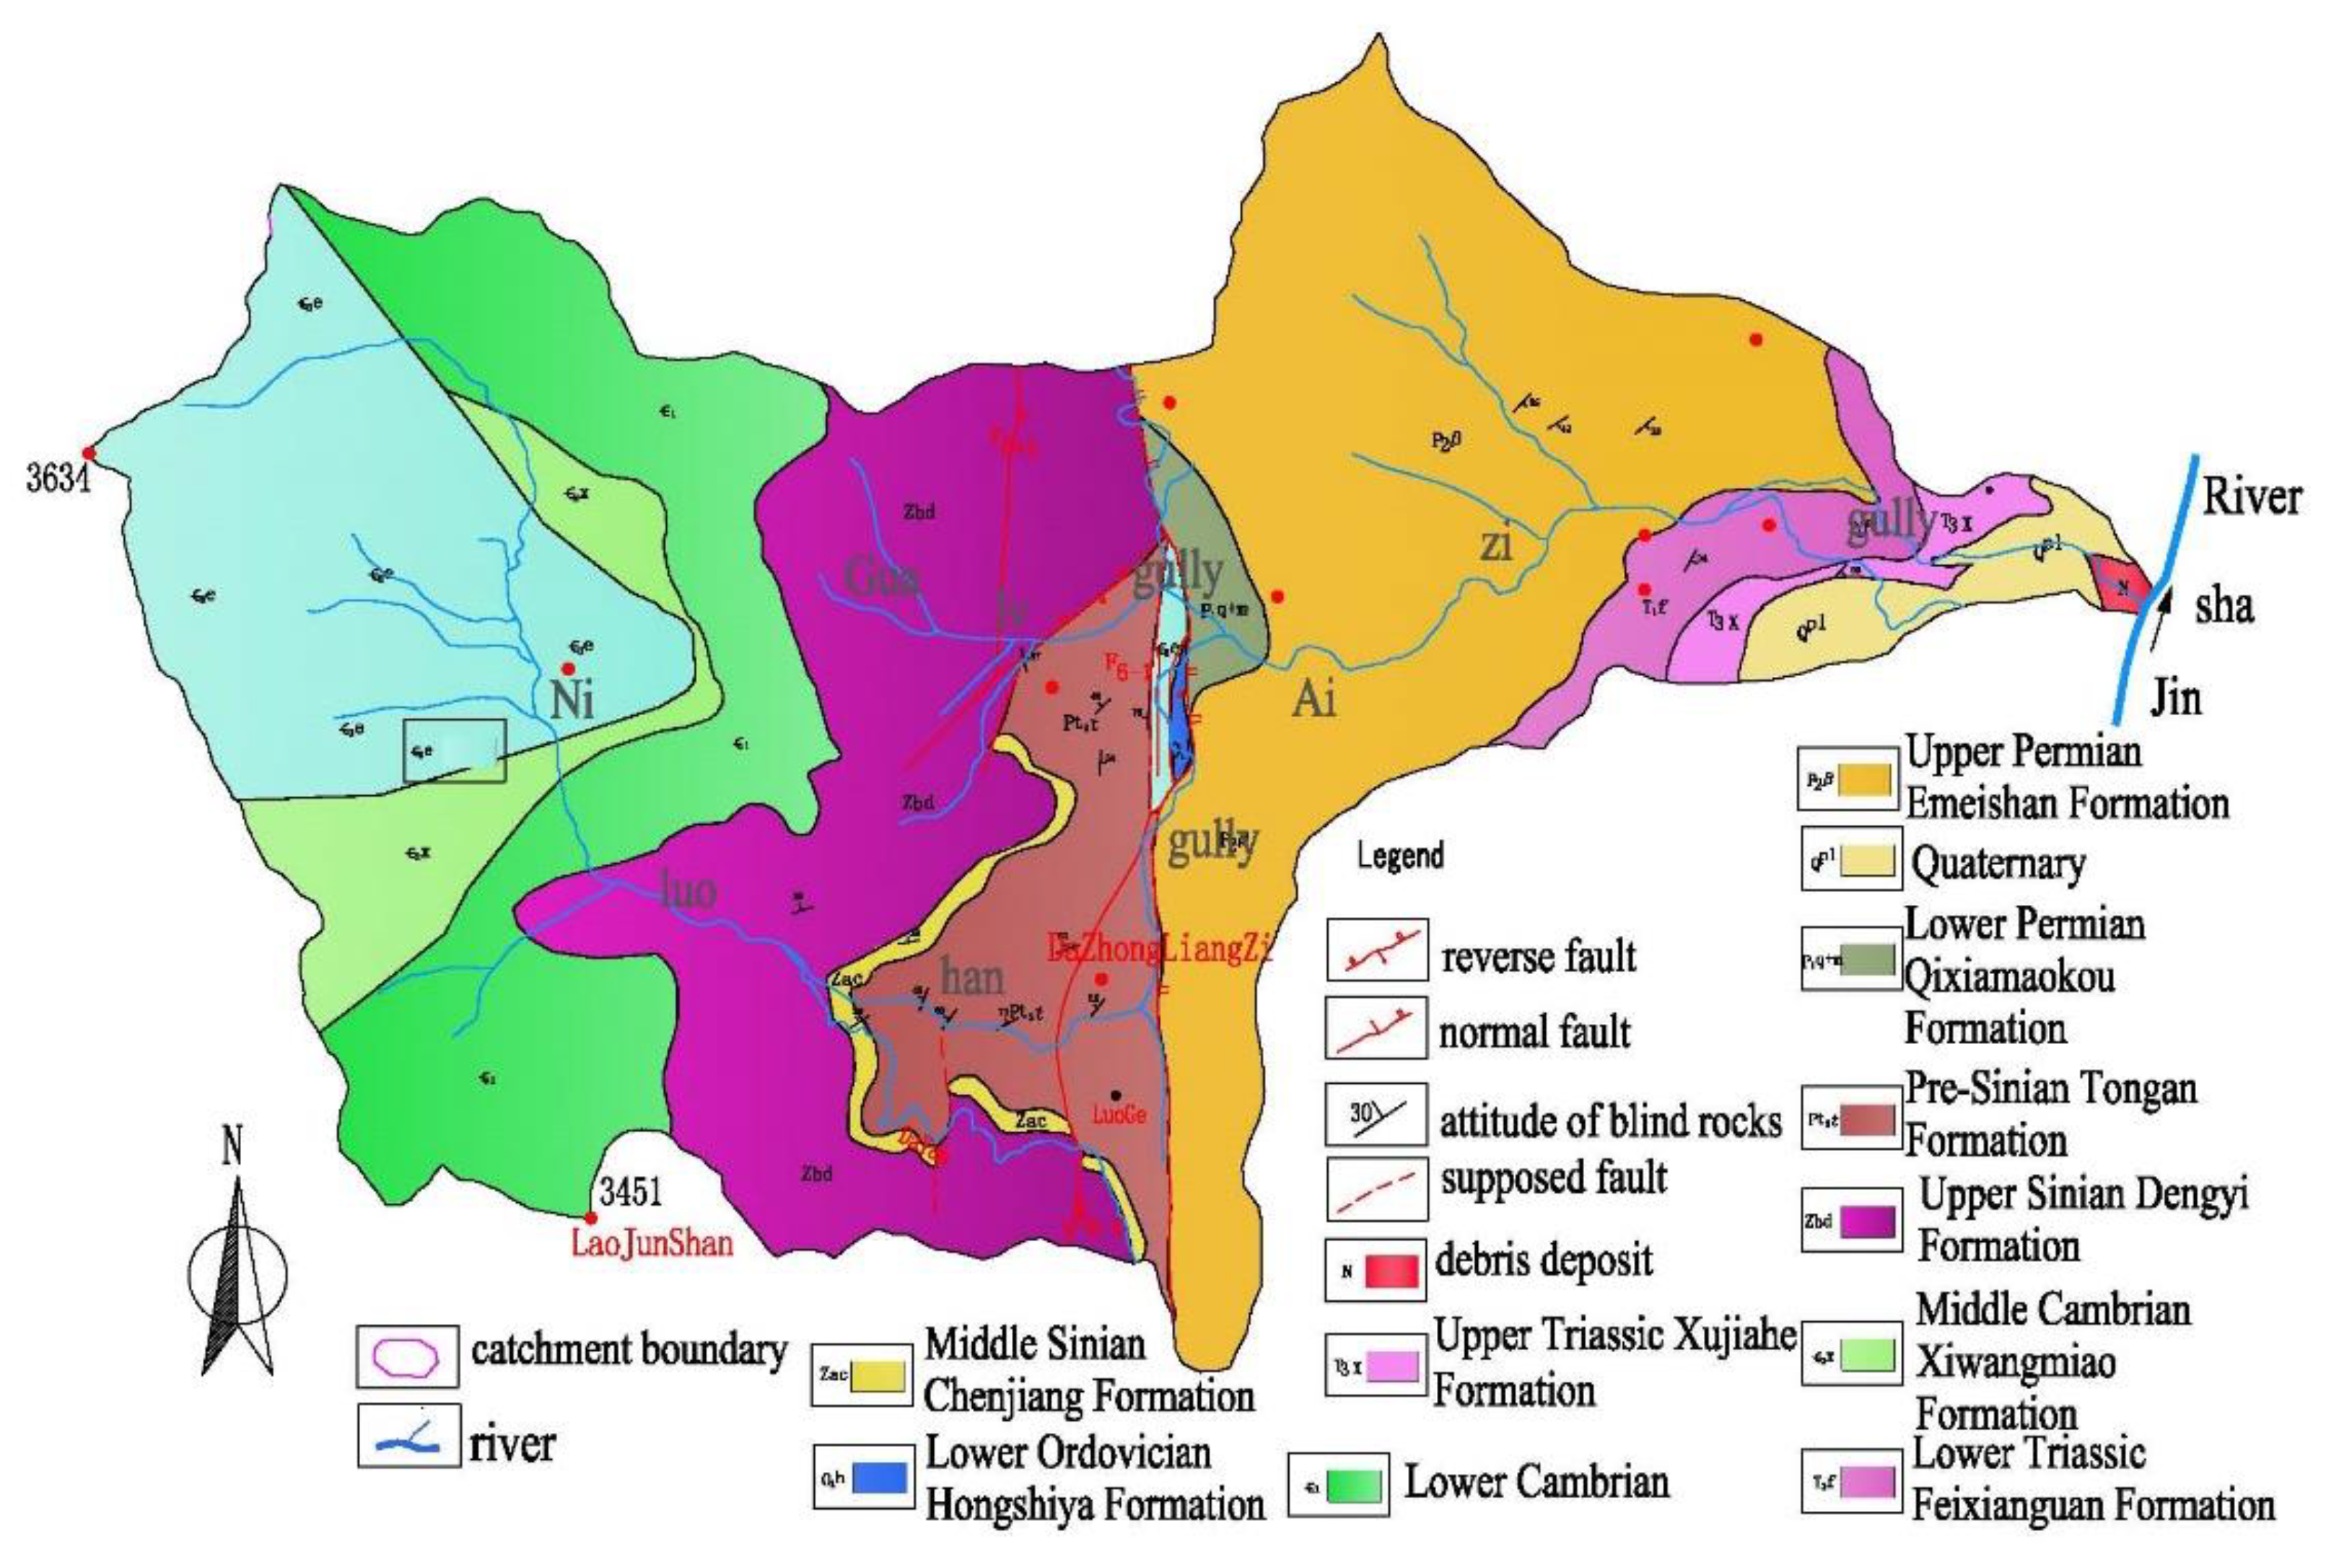
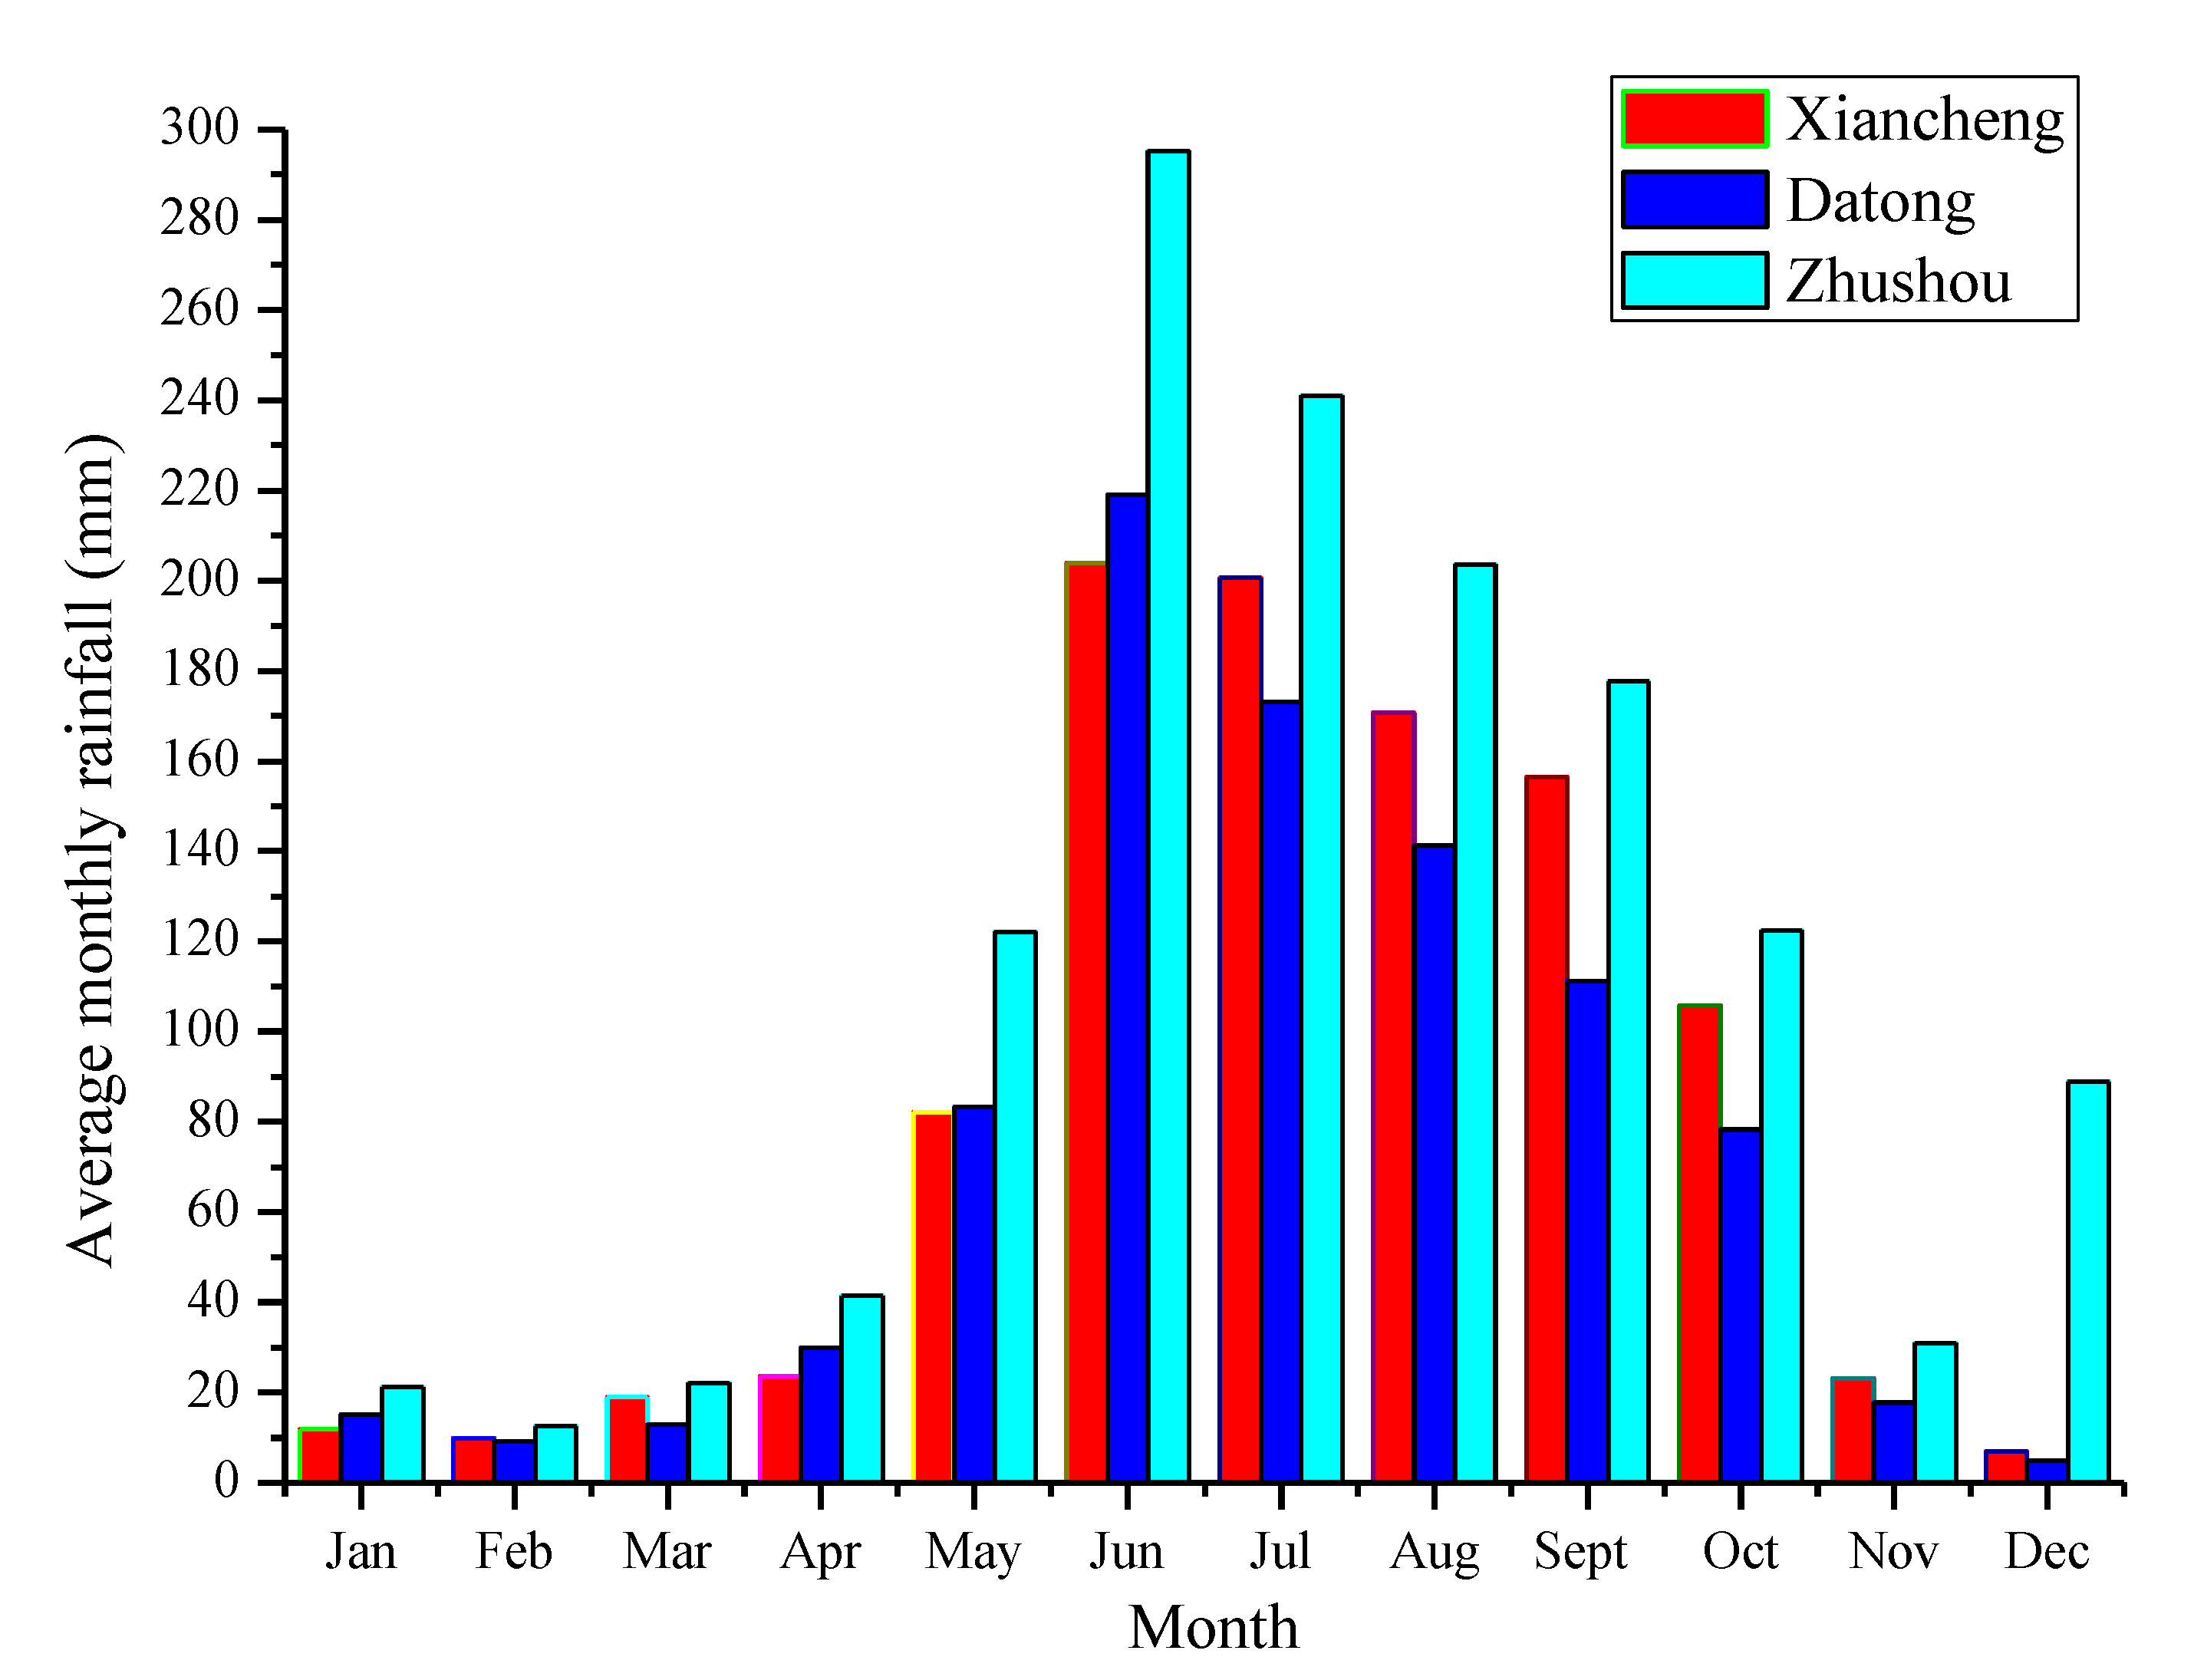
Aizi gully is located on the left bank of Jinsha River and the south slope of Daliangshan Mountain; Figure 1 and Figure 2 show the Aizi gully water system map and watershed zoning map. It can be noted that faults are well developed in this area, with two east–west fractures across the central valley. The main superficial soil includes red soil, mountainous yellow soil, brown soil, meadow soil, etc., among which the red soil is the main soil type. The bedrock mainly includes Ordovician dolostone, limestone, sandstone, Cambrian dolomite, sandstone, Sinian system dolomite and Permian basalt, all of which appear staggered in the area, shown in Figure 3. Due to the fault activity, Permian basalt and limestone on both sides of the fault are fragile, providing abundant loose solid materials for debris flow formation [20]. The study area is situated in the subtropical monsoon climate zone, which has distinct dry and wet seasons. The weather is moderately warm and dry in this area, with a mean annual temperature of 19.0 °C and a mean annual precipitation of 960.5 mm. Rainfall is mainly concentrated in five months from June to October, accounting for more than 90% of annual precipitation (Figure 4). Aizi gully watershed is composed of three confluence areas: Aizi gully (19.10 km2), Gualv gully (10.48 km2) and Niluohan gully (35.97 km2) (Figure 2). In Aizi gully watershed, the west side is higher than the east, and the length of the gully is 21.96 km. On both sides of the main gully, the tributary has a narrow and deep cut, and the average gradient of the main gully is 155‰. Aizi gully watershed has the maximum altitude of 3646 m and the minimum one of 604m, giving the maximum relief of 3042 m.
Seismic activities have frequently occurred in fault zones. In the period from 1993 to 2012, the Aizi Valley has been affected by 16 earthquakes with magnitude greater than 4.7 on the Richter Scale, indicating destructive earthquakes. During the period of 2008 to 2012, there were five earthquakes that affected Aizi gully and provided sufficient loose solid materials for the outbreak of the “28 June 2012” debris flow [21,22,23,24].
Figure 2 shows that Aizi gully debris flow consists of three zones, namely, the source zone, the transportation zone and the depositional zone. The source zone is the area from which the materials are displaced, or the movement is initiated. Additionally, the materials finally stop and are deposited in the depositional zone.
3. Methods
The distribution of loose solid materials in Aizi Valley was mapped through field investigations and remote sensing interpretations. Combining field measurements with radar explorations, the area and thickness of ancient debris flow deposits and landslide deposits were obtained. Remote sensing interpretation was used to measure the area of colluvial deposits, and function [25] was used to calculate its volume. During the processes of data collection, some difficulties were encountered. For example, in the absence of historical rainfall and earthquake data, the assistance of the local government was required, and some of the data were taken from annals. Moreover, during the site visit, the local villagers rarely spoke Mandarin, leading to communication difficulties.
Earthquake and extreme drought play a crucial role in the mobilization of debris flows [20,26]. The effective peak acceleration (EPA) is used to evaluate the influence of seismic events. First, according to the Chinese earthquake catalog (State Seismological Bureau of Earthquake Disaster Prevention Division, 1995, 1999) and the National Earthquake Data Center (CEDC) database, our team developed a comprehensive earthquake catalog for mainland China. Based on this, the relationship between the sensible earthquake radius R and earthquake magnitude M is used to calculate sensible earthquake radii of all the major earthquakes by considering the magnitude and . Historical earthquake data affecting the Aizi Valley area were analyzed using the formula ( is the magnitude of the earthquake, R is the inductive radius and D is the distance between debris flow location and earthquake epicenter). If , the seismic events are assumed to have effects on the debris flow sites, otherwise no effect is assumed. Secondly, droughts were classified based on the monthly rainfall anomaly index (H), and the specific indicators are shown in Table 1. According to Van Rooy [27], the rainfall anomaly index () was the ratio of positive precipitation anomaly to negative precipitation anomaly. The calculation formula was as follows: , where: is the measured precipitation (mm), is the average precipitation (mm); is the average value of 10 extreme precipitation values. For the positive anomaly, the plus sign was taken, which was the average value of the 10 maximum precipitation values. For the negative anomaly, the negative sign was taken, which was the average value of the 10 minimum precipitation values. There were 7 grades from wet to dry (Table 1).
4. Dynamic Characteristics of Disastrous Debris Flow in Aizi Gully
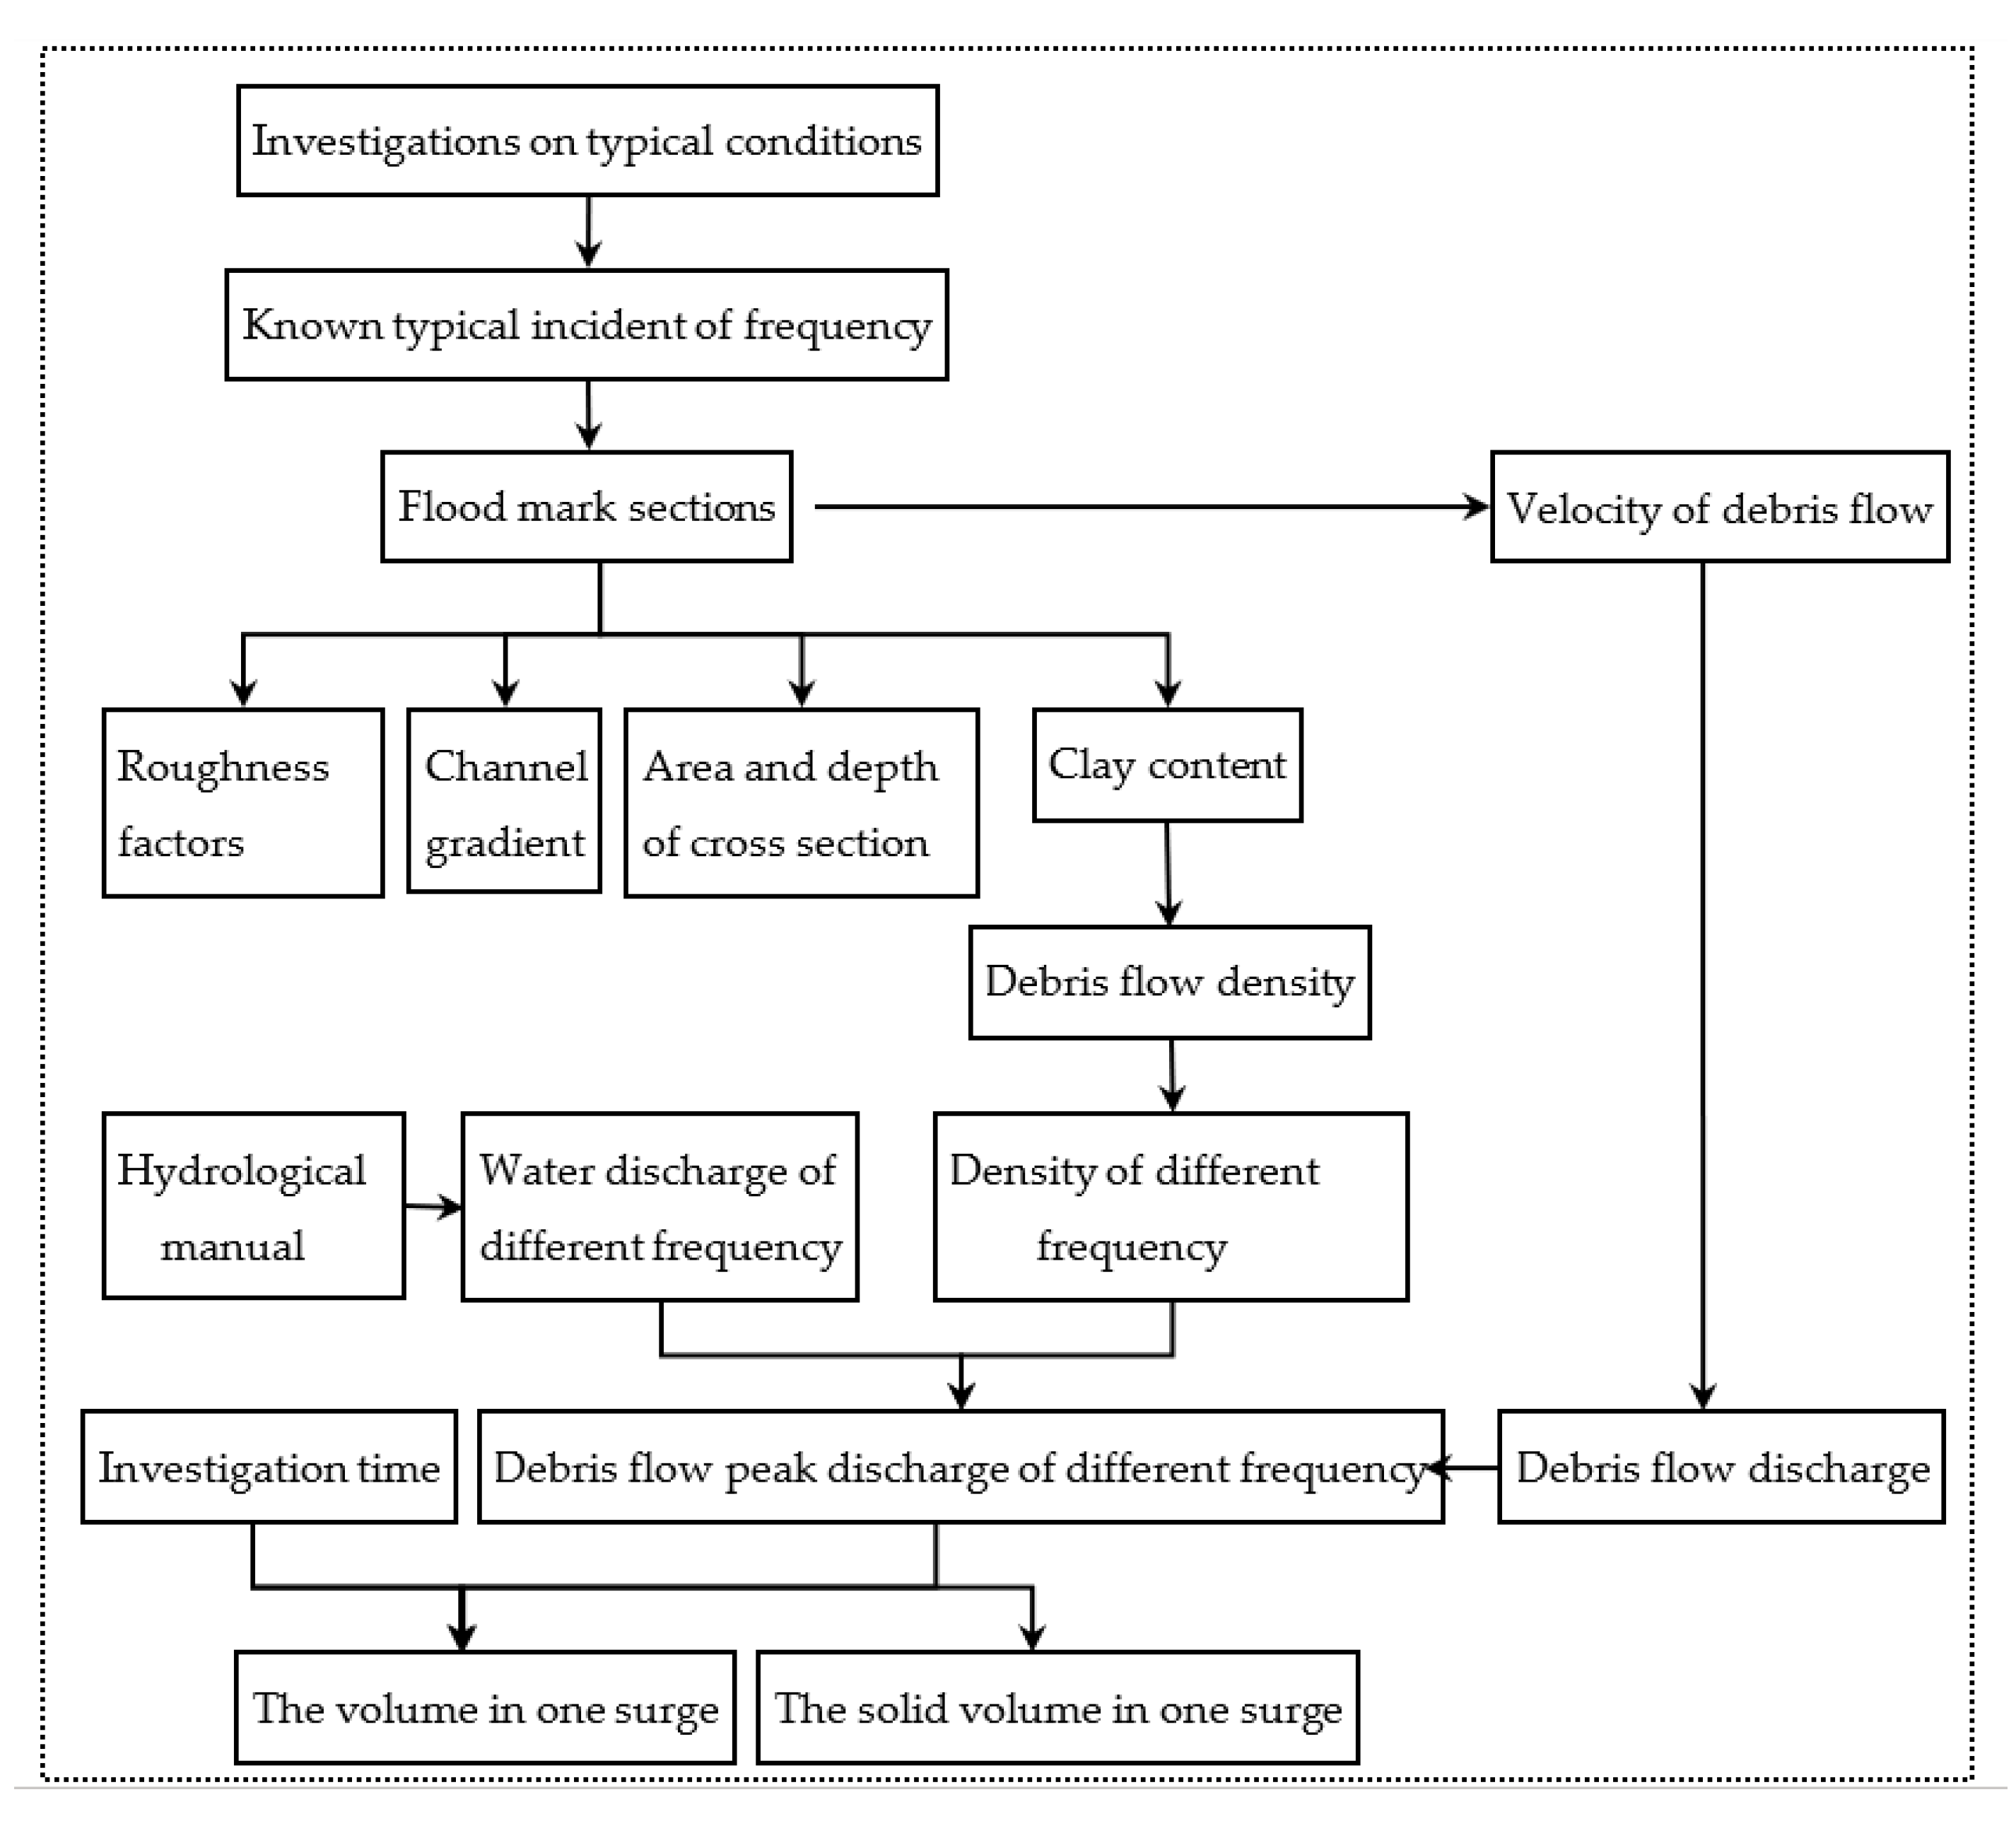
Field investigations, remote sensing interpretation and model calculations were used to identify the dynamic characteristics of the debris flow in Aizi gully (Figure 5). From 24 July to 4 September 2012, field work was conducted by visiting local residents to ascertain that “28 June 2012” debris flow was the largest debris flow in the past century in this area. According to the flood mark and field conditions, the roughness coefficients of five cross-sections were determined (Figure 6 and Table 2). Grain sizes were determined by using field weighing and laboratory particle size analysis techniques, from which the debris flow bulk density was obtained. Based on clay content, the bulk density of the debris flow could be determined [28]. According to the “Debris Flow Survey Guides”, the velocity and discharge for each cross-section were calculated [29,30]. The corresponding computational formula [31] and results are shown in Table 3, Table 4 and Table 5. From the calculation results, it can be seen that the “28 June 2012” debris flow in Aizi gully was a once-in-a-century viscous debris flow. Based on the field measurements, the bulk density of 1.77 g/cm3 was obtained. From model calculation, we know that the bulk density ranges from 1.75 to 1.8 g/cm3. Eventually, 1.8 g/cm3 was used for comprehensive consideration. Results showed that the velocity at the outlet of Aizi gully was 7.54 m/s. Based on the method of completing the square, discharge, total volume of one time debris flow and total volume of solid materials were 971.36 m3/s, 57.4 × 10⁴ m3 and 27.0 × 10⁴ m3, respectively. The related formula [29,31,32] and calculation results are shown in Table 3, Table 4 and Table 5.
5. Results and Discussion
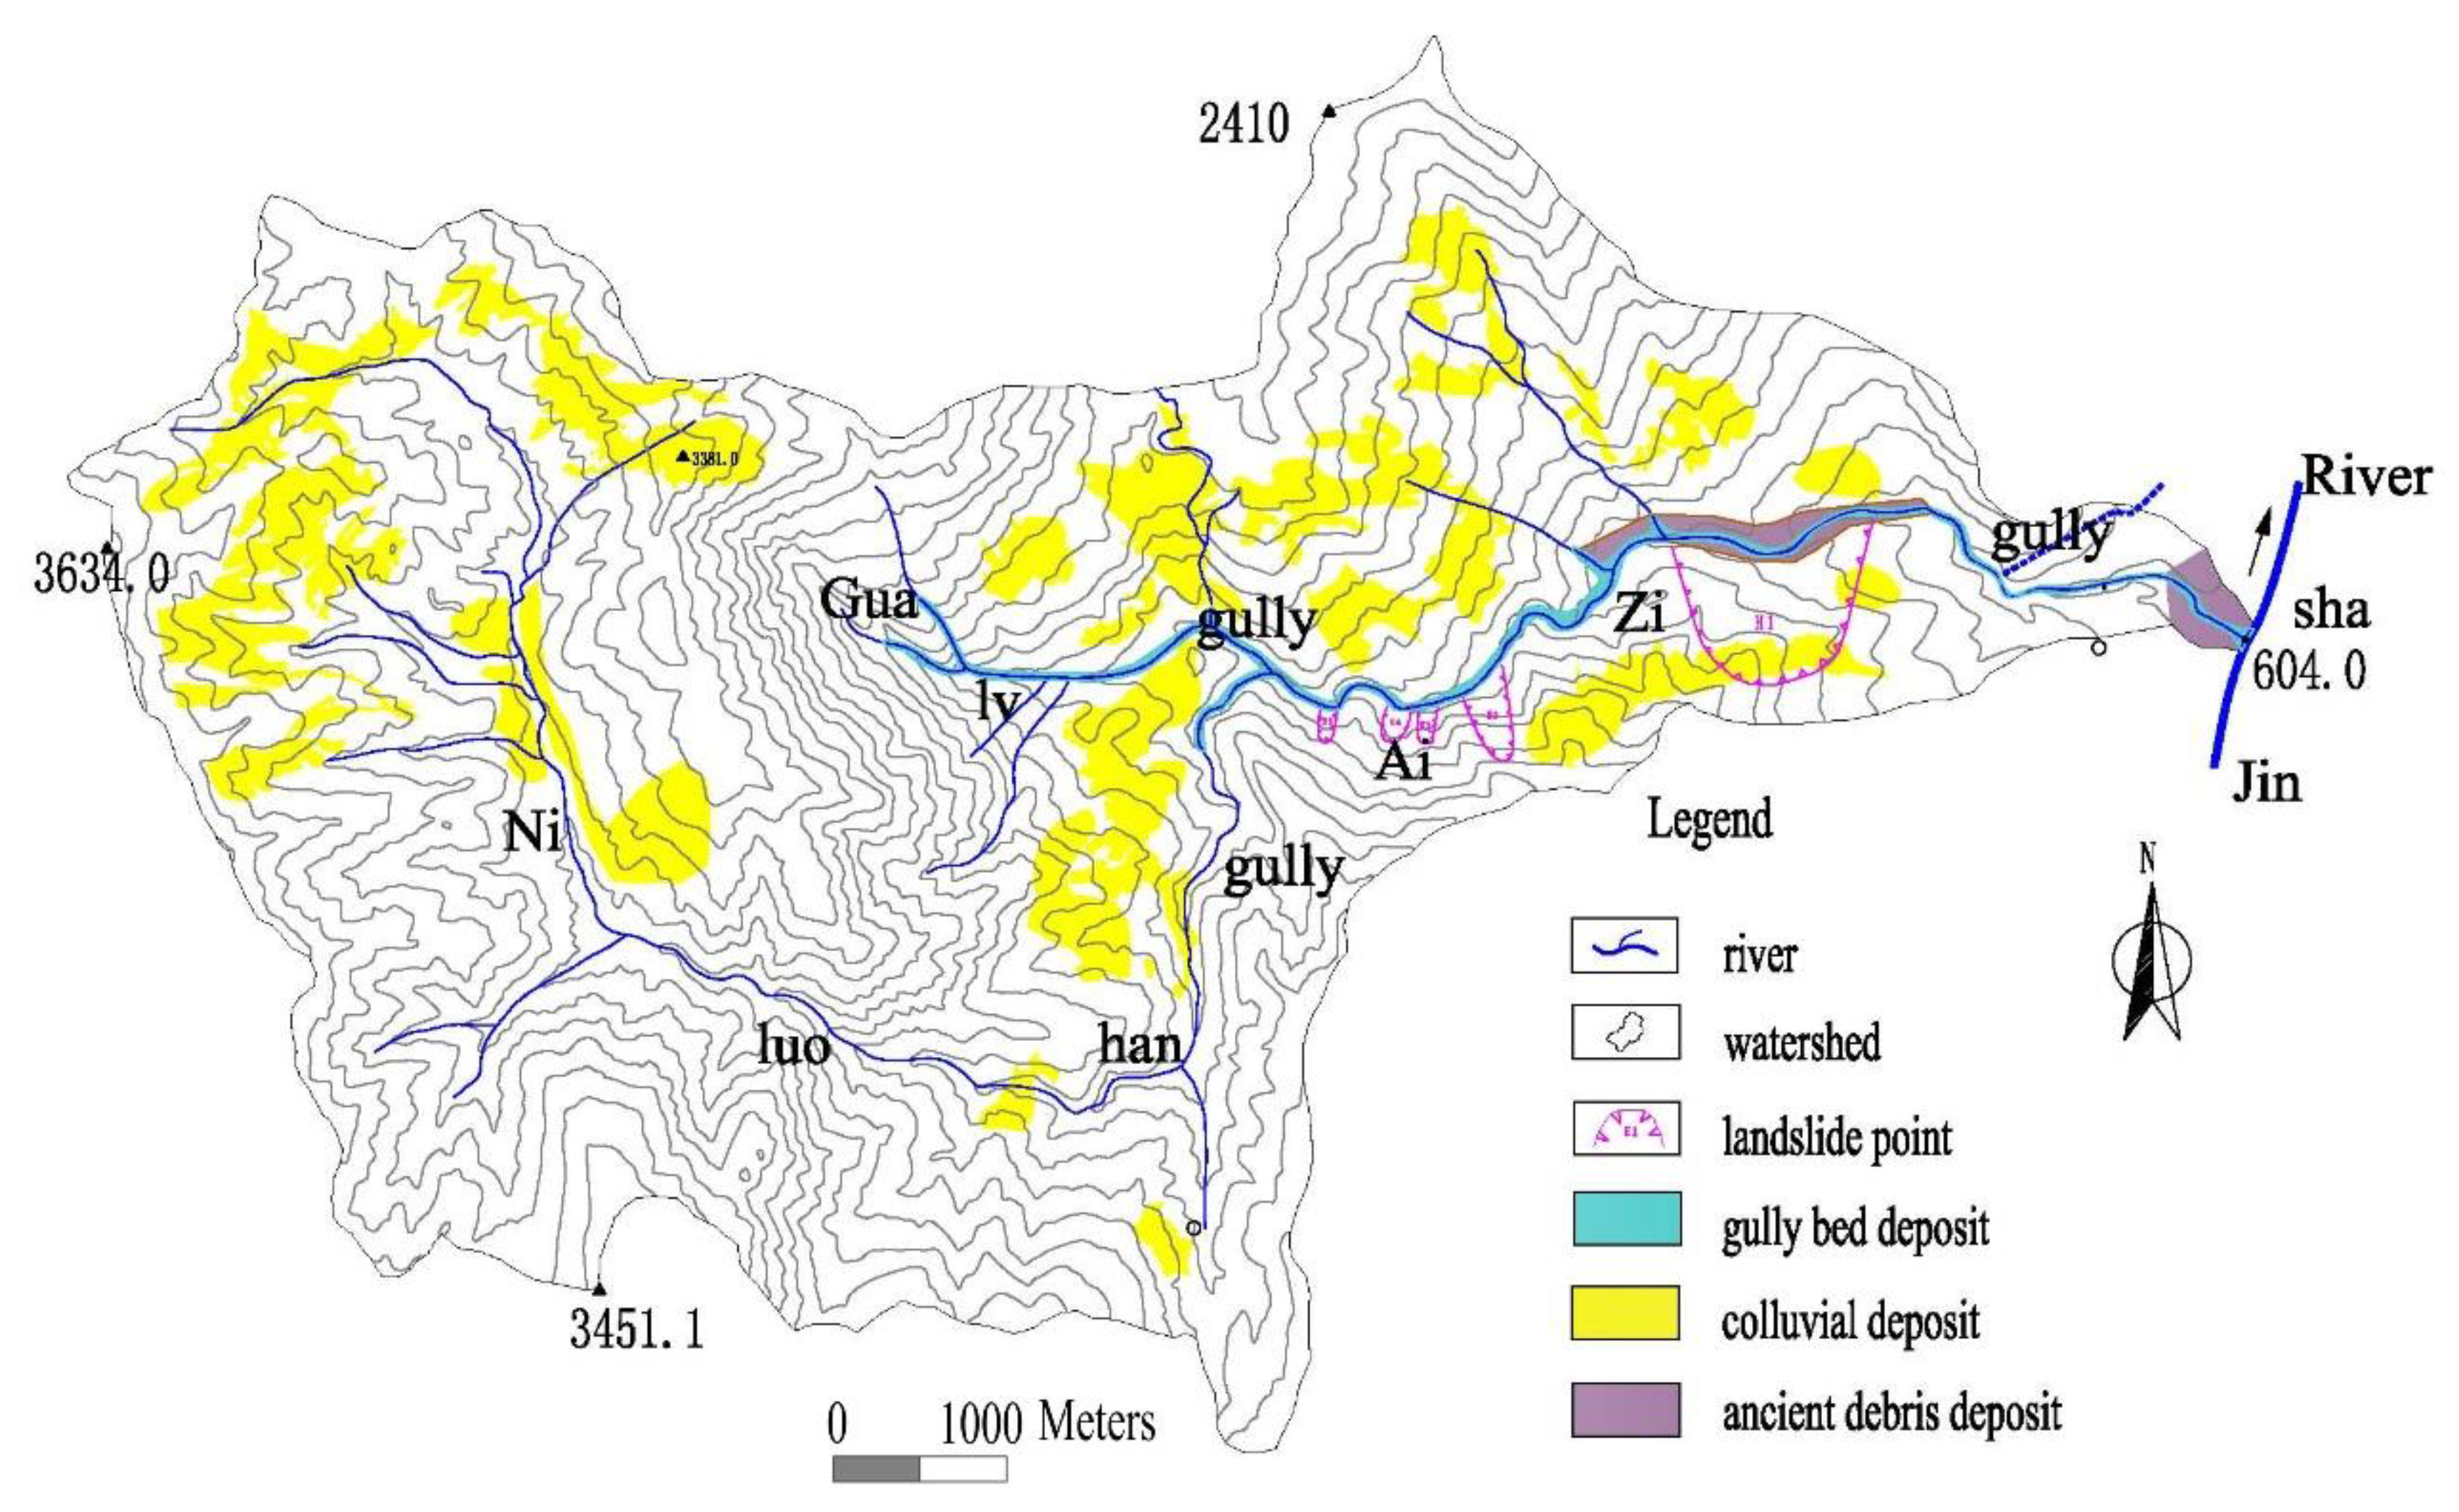
With the help of field investigations and remote sensing interpretations, the location, area and volume of the solid materials were identified within the watershed, as shown in Figure 7. It can be noted that the loose solid materials were mainly distributed in the upstream of Niluohan gully, the majority of Gualv gully and midstream of Aizi gully. By means of field measurements and model calculations, the total volume of loose solid materials was calculated to be 4812.54 × 104 m3, which included 2388.1 × 104 m3 residual sediments, 1158.34 × 104 m3 colluvial deposits, 855.1 × 10⁴ m3 landslide deposits and 411 × 104 m3 ancient debris flow deposits (Figure 8). The abundance of loose solid materials contributes to large-scale debris flows.
The maximum relative height difference in Aizi gully was 3042 m, which met the minimum critical height difference of 300 m for debris flow initiation [29], and the mean gradient of the gully bed was 155%. Furthermore, the tributaries in the initiation areas had a bigger gradient than that of the main valley. In the case of Gualv gully, the area of watershed was 10.48 km2, and the gradient of gully bed was 380.3‰, which was much higher than the critical gradient of 26% for debris flow initiation. In addition, abundant loose materials in this area contributed to the debris flow outbreak. The total loose solid materials in Aizi gully were 4812.54 × 104 m3 (Table 6), which means that the average loose solid materials in the whole watershed were 0.7 m, considerably higher than the critical thickness of 0.2 m for viscous debris flow formation [33,34].
5.1. Earthquake and Extreme Drought
5.1.1. Promotion Effect of Earthquake on Debris Flow
Aizi gully is located in the Arming River in the Zemuhe seismic zone, and seismic activities repeatedly occur. Using the abovementioned equation to identify the influence of seismic activities on debris flow initiation, the calculation results are displayed in Table 7. It can be seen that the study area is frequently affected by seismic activities, which destroyed soil structure, significantly decreased soil strength and remarkably changed permeability characteristics of soil, thus providing favorable conditions for debris flow initiation.
5.1.2. Promotion Effect of Drought on Debris Flow
Previous studies showed that debris flows were influenced by extreme droughts [18]. The correlation coefficient between total denudation rate and drought index reached 0.81 in 40 watersheds in China. This indicated that debris flow was closely related to drought. Ningnan County suffered from drought for three consecutive years in 2009, 2010 and 2011. In 2012, Ningnan County suffered the worst drought in a century. From the table of rainfall anomalies (Table 8), it can be seen that rainfall in 2012 was much less than in 2011. Almost all precipitation anomaly percentages were less than −34%, indicating that drought was serious in this area. Abundant antecedent rainfall followed by intense rainfall on 28 June 2012 played the inducing role in debris flow formation.
A previous study revealed that that “28 June 2012” debris flow event in Aizi gully occurred within five years after the earthquake and successive years of drought [17]. The coupling rates between seismic activity, drought and debris flow reached more than 70% (Table 9), indicating that seismic activity and drought played a decisive role in the process of debris flow outbreak. The soil structure deteriorated and slope stability was reduced due to the earthquake and drought, which increased the possibility of debris flows.
5.2. Triggering Effect of Intense Rainfall
5.2.1. Antecedent Rainfall
Rainfall is the leading cause of rainfall-induced debris flows [35] and antecedent rainfall plays a significant role in the process of debris flow formation [23,36]. Due to the abundant antecedent rainfall, the soil in the region will be much closer to saturation and the triggering critical rainfall will be less. In May 2012, continuous rainfall caused the soil to reach close to or even reach saturation in Aizi gully watershed, and rainfall was extremely abundant one week prior to the debris flow outbreak. Analysis of the rainfall data from three meteorological stations (Table 10) showed that the maximum daily rainfall in Dazhai meteorological station five days before outbreak of debris flow reached 24.9 mm, while Baihetan and Xintian meteorological stations recorded the total rainfall of 17.6 mm and 39.9 mm, respectively. Xintian meteorological station, which is the nearest meteorological station, recorded cumulative rainfall reaching 78.3 mm on 28 June.
5.2.2. Triggering Rainfall
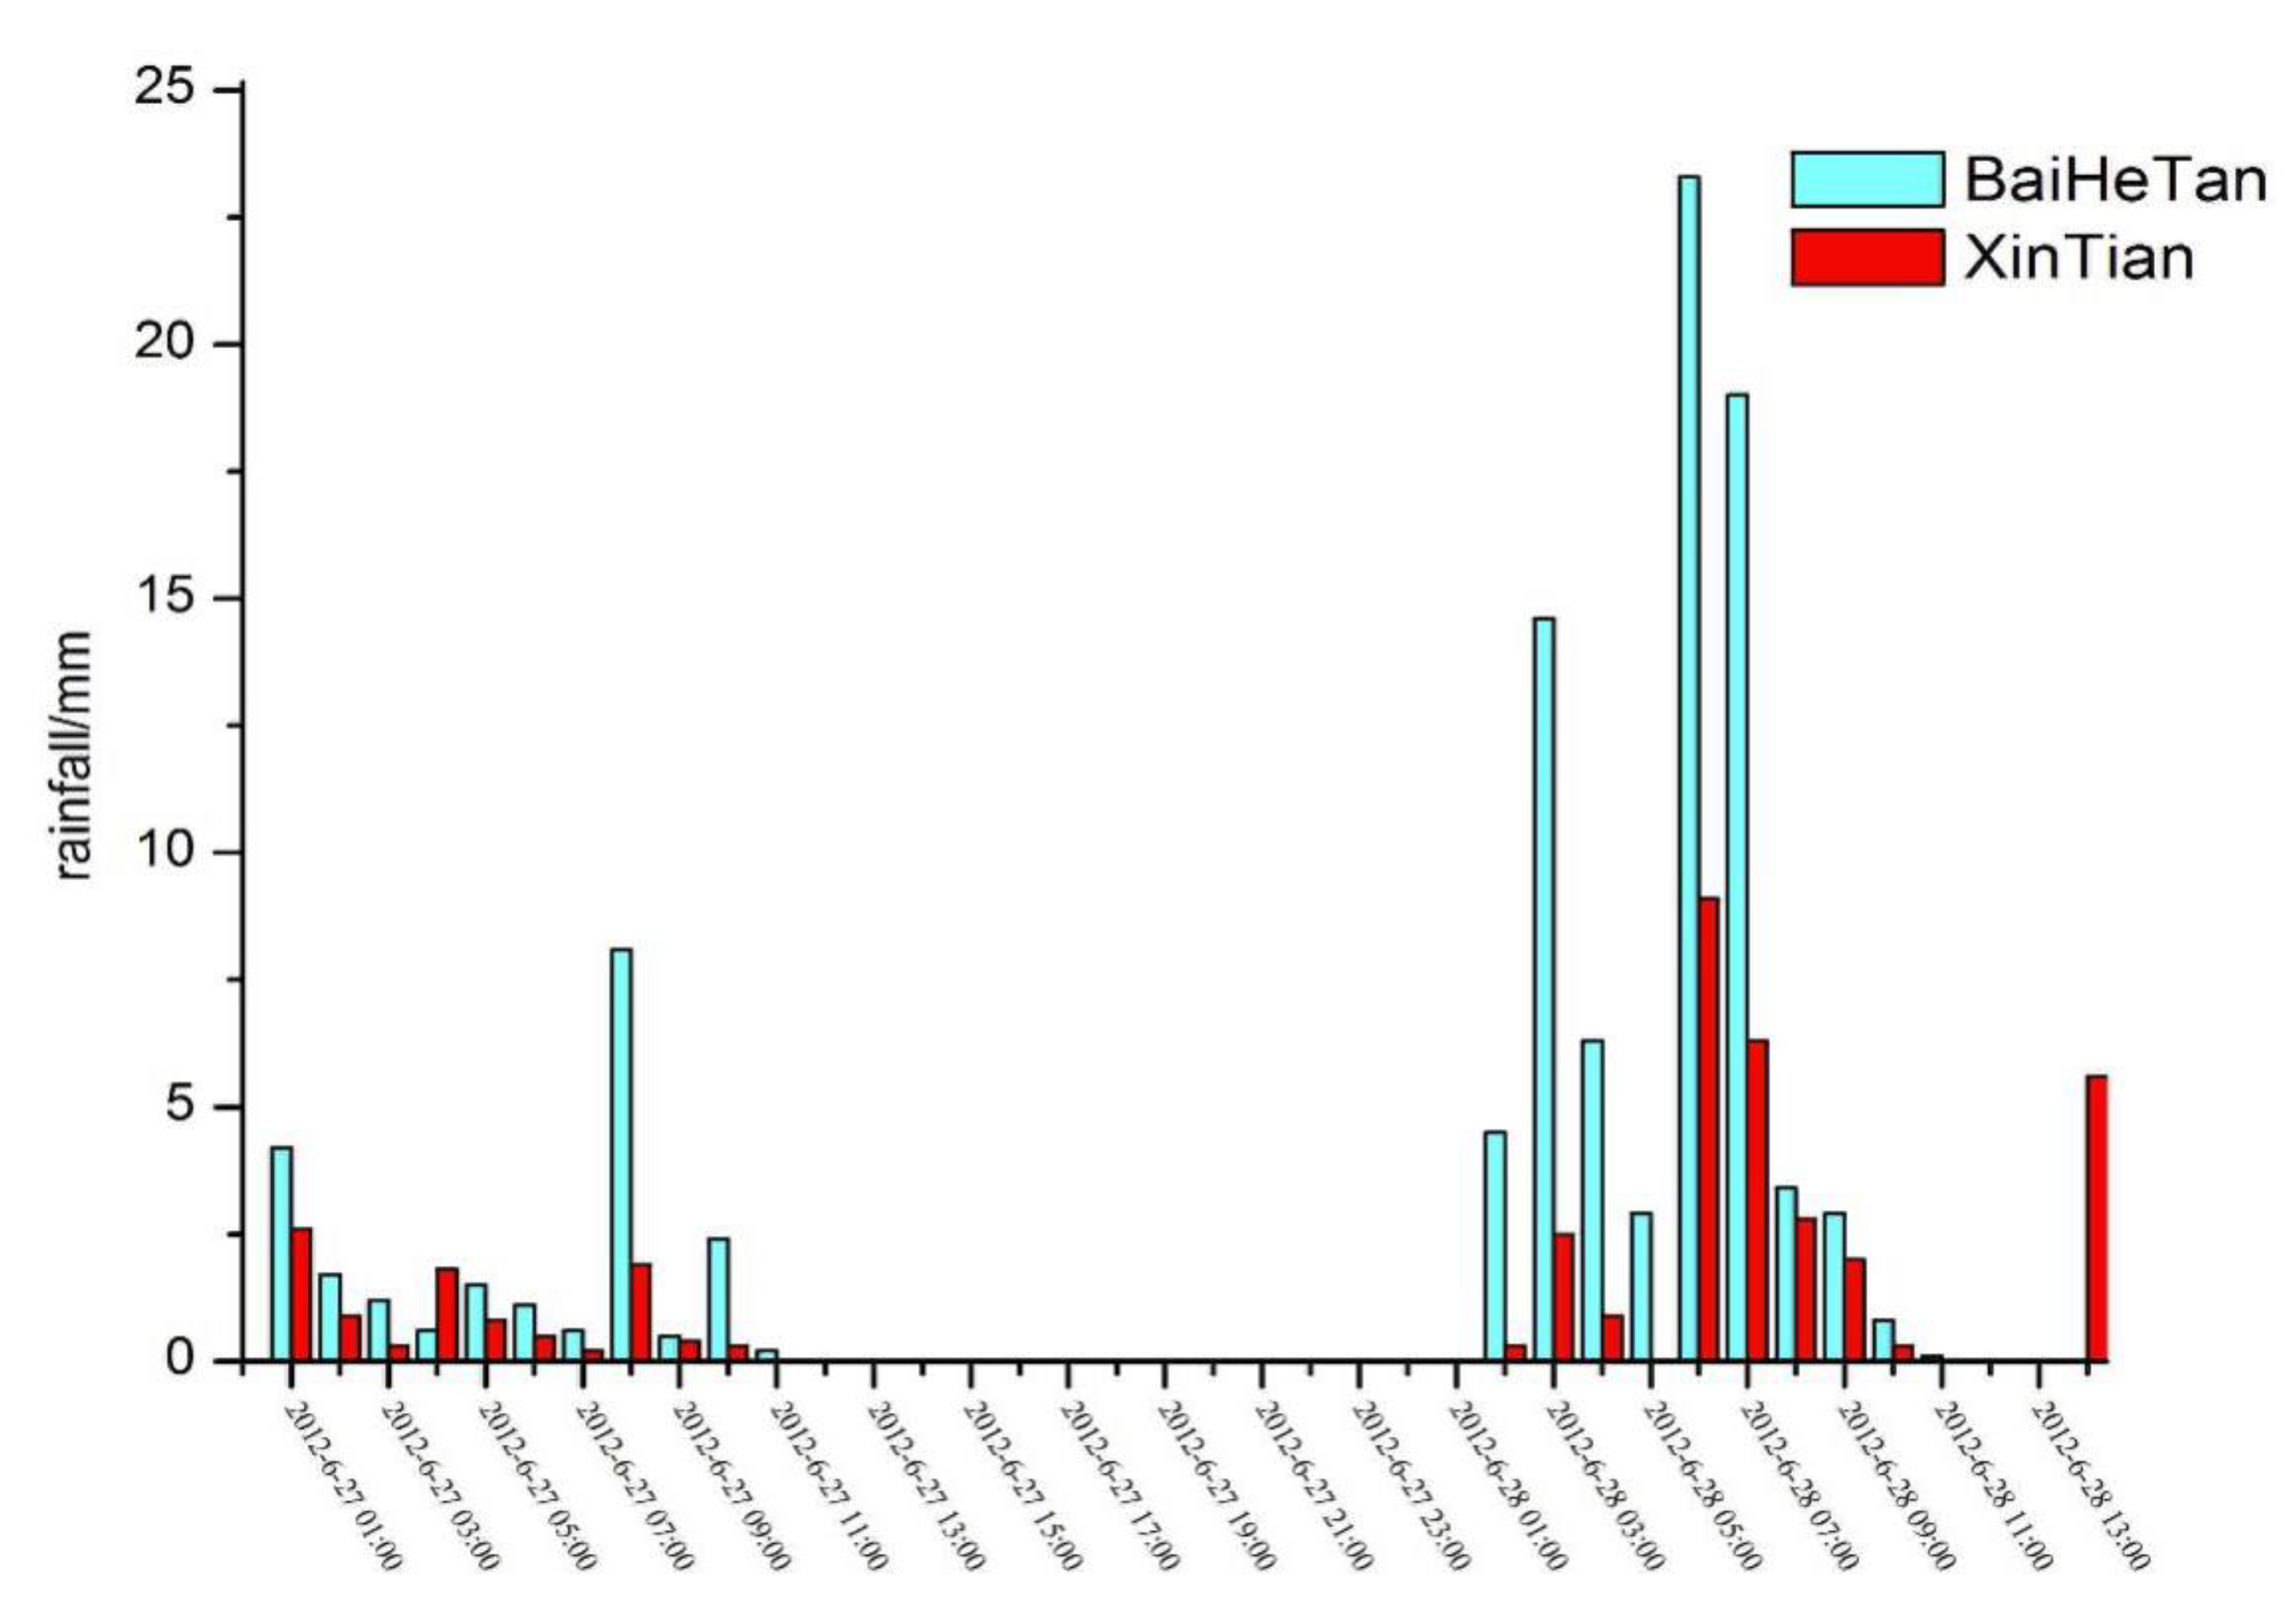
Hourly rainfall data from 27 June to 28 June 2012 were collected in Baihetan meteorological station and Xintian meteorological station, and the results are shown in Figure 9. It can be seen that the heaviest rainfall occurred between 03:00 a.m. and 07:00 a.m. on 28 June 2012. The cumulative rainfall in these five hours reached 66.1 mm. The mean rainfall intensity was 13.22 mm/h, while the maximum rainfall intensity was 23.3 mm/h, which is much higher than the critical rainfall intensity of 5 mm/h [33,34]. As a result of the long-term drought, the soil in this watershed was desiccated, causing continuous rainfall to seep into the soil for five days. During the process of infiltration, the soil shrunk and the clay particles swelled and blocked the porosity of the soil, which increased pore water pressure and decreased shear strength. Later, as a result of short-term intense rainfall, debris flow was initiated.
5.3. The Formation Processes of Debris Flow in Aizi Gully
The “28 June 2012” large-scale debris flow formed under the effect of long-term seismic activities and extreme drought, combined with abundant antecedent rainfall and the triggering effect of intense rainfall on 28 June. Combined with field investigations and accounts of the eyewitnesses, the formation process of “28 June 2012” debris flow was analyzed. The forming processes are as follows:
(i) The long-term effect of earthquakes and extreme droughts weakens soil structure, resulting in the strength of the soil becoming lower and permeability of the soil becoming much higher. Under the effect of abundant antecedent rainfall, the water content of soil increased, resulting in higher pore water pressure, further decreased shear strength and sharply reduced slope stability.
(ii) As a result of the uneven distribution of rainfalls in the study area, point rainstorms are mainly concentrated in the Gualv gully watershed. In addition, loose solid materials are abundant and the slope gradient is high in Gualv gully. Under the triggering effect of intense rainfall, slope debris flow initiated in Gualv gully. Field investigations revealed that the area of slope debris flow in the Gualv gully watershed was approximately 450 m2, with a mean initiated soil thickness of 0.08 m. Therefore, the volume of the soil participating in the slope debris flow was 36 m3.
(iii) With the long duration of rainfall, surface runoff gradually increased and the solid materials in the tributaries formed debris flows under the scouring effect of surface runoff. Through field investigations, we found that two tributaries in Gualv gully formed debris flows under the scouring effect of runoff. The total length and width of these two tributaries are 1.0 km and 3.0 m, respectively, and the thickness of the soil scoured by surface runoff was 0.25 m. Therefore, the volume of soil participating in tributary debris flows was 750 m3.
(iv) Slope and tributary debris flows confluenced together into the main gully and moved downwards. They confluenced together in the No 1 cross-section, with the velocity and discharge at this cross-section being 3.02 m/s and 38.67 m3/s, respectively.
(v) The debris flow moved further downwards along the main gully. Due to the scouring effect of the debris flow, more solid materials from the gully bed were mobilized in debris flow movement, which resulted in increased velocity and discharge at cross-section 2, reaching 4.95 m/s and 255.2 m3/s, respectively.
(vi) Abundant loose solid materials were deposited on the left bank of the middle and lower reaches of Aizi gully. Under the effect of heavy rainfall, solid materials rushed into the main gully and participated in debris flow movement. Cross-section 3 shows further increase in the debris flow velocity and discharge, reaching 6.35 m/s and 835.6 m3/s, respectively.
(vii) As the Aizi gully bed gradient was higher in the middle and lower reaches, this contributed to increasing debris flow velocity and discharge, and amplifying the souring and carrying capacity continuously. The debris flow constantly scoured gully bed and banks, causing debris flow velocity and discharge to increase again, resulting in large-scale debris flow. At the outlet of Aizi gully, the corresponding velocity and discharge reached 7.54 m/s and 971.36 m3/s, respectively.
5.4. Discussion
5.4.1. Large-Scale Debris Flow Formed Due to the Combined Effects of Extreme Drought and Seismic Activity beyond People’s Imagination
In this area, the average life expectancy is 65 years. Generally speaking, people’s understanding of the scale of debris flow disasters is limited to 100 years, i.e., restricted to three generations’ life experiences. When a debris flow scale is beyond people’s knowledge, they do not have enough experiences to react properly. Therefore, low-frequency and large-scale debris flows have caused catastrophic disasters.
5.4.2. Improper Site Selection and Large-Scale Engineering Construction
Aizi gully has a population of 577 residents. As a result of the population increase during recent decades, the building area has expanded, which has increased the likelihood and scale of debris flow disasters. In addition, the under construction hydropower station provided good business opportunities to local people due to convenient transportation and water resources, but also caused many casualties and exacerbated the disasters.
5.4.3. Insufficient Understanding of Responsible Personnel about Debris Flow Disasters
Along with the development in the western China, many hydropower companies proactively participated in the development by building more power stations. According to Guidelines for Engineering Construction, it is necessary to carry out geological disaster evaluation. Although hydropower investment enterprises have performed corresponding evaluations, these were primarily for land expropriation, without considering potential geohazards. Therefore, when the hydropower professional department designed the temporary structures, they failed to give a full consideration of debris flow, especially the low-frequency and large-scale debris flow hazards [19]. For example, the size of the drainage tunnel in Aizi gully was designed by a hydropower company based on the maximum flood discharge, without taking debris flow into account. Thus, the debris flow caused blockage to the drainage tunnel.
5.4.4. Lack of Monitoring and Early Warning Systems
In the mountainous areas of western China, disaster prevention and mitigation more or less rely on local residents, and proper monitoring and warning systems only exist at key engineering sites. Robust and accurate displacement prediction is a key component of an early warning system, and a hybrid approach integrating k-fold cross-validation (CV), metaheuristic SVR and the nonparametric Friedman test is proposed to enhance reproducibility by presenting the statistical significance [22,37,38,39,40]. In Aizi gully, the construction period of the hydropower project was approximately ten years, and the construction area was considered as a temporary site. Therefore, there were no corresponding monitoring instruments installed. In addition, the communication system between upstream and downstream is poor in Aizi gully. Therefore, it is difficult to implement disaster prevention and mitigation through interaction between upstream and downstream.
5.4.5. Resident Are Not Sensitive to Disaster Warning Information
As the border area between Sichuan Province and Yunnan Province had experienced three consecutive years of drought, on 20 May 2012 we predicted that debris flow might cause serious disasters in this region. On 5 June 2012, Sichuan Provincial Government endorsed our report, and people living in this region performed disaster prevention drills. Before intense rainfall on 28 June 2012, the messenger transferred information to hydropower station staff that the regional rainfall could cause a debris flow disaster, but they did not pay attention to this information, and did not evacuate from the study area. Therefore, when debris flow occurred on 28 June 2012 they had no preparation and failed to escape.
6. Conclusions and Advice for Disaster Prevention
Using field investigations, remote sensing interpretation, laboratory experiments, model calculation and interviews with local residents, the study evaluated the influential factors, formation processes and dynamic characteristics of the “28 June 2012” large-scale debris flow in Aizi gully watershed. With the purpose of reducing debris flow disasters in Aizi gully watershed, corresponding prevention and control measures were recommended. The conclusions and advice for disaster prevention are as follows:
1. Due to long-term seismic activity and extreme drought, intense rainfall induced slope and tributary debris flows. Then, slope and tributary debris flows confluenced and blocked the main gully. The rainstorm destroyed the blockage and formed dilute debris flow, which was able to scour more solid materials from the gully bed because of its high scouring capacity. In addition, the banks collapsed and large rocks continuously participated in it, which led to an increase in scale, velocity and discharge of the debris flow, which culminated in the “28 June 2012” large-scale debris flow in Aizi gully watershed.
2. In the Jinsha River areas, the critical rainfall requirement is expected to be reduced due to the coupled effect of earthquakes and droughts. Moreover, large hydropower projects in China are concentrated in the semi-arid valleys of the Jinsha River catchment. The absence of engineering or nonengineering measures against debris flows in this basin contributes to the severity of debris flow disasters.
3. Considering the special characteristics of Aizi Valley, it is recommended to apply combined obstruction and drainage measures to prevent debris flow hazards. Moreover, it is essential to establish a disaster warning system and increase residents’ awareness of debris flow disasters. The measures could include: (a) in the debris flow transportation area, build grille dams, which not only can intercept boulders and increase gully bed roughness, but can also reduce debris flow scouring capacity. (b) Build a drainage canal in the debris flow depositional area, as the cross-section and gradient of the existing drainage tunnel in Aizi gully are not suitable for draining debris flow, so a spare tunnel should be constructed in the depositional area. (c) Set up monitoring and early warning systems. Due to the frequent seismic activities and uneven rainfall distribution, Aizi Valley is prone to geohazards, especially during rainy seasons. Therefore, building early monitoring and warning systems may effectively forecast debris flow hazards. (d) A lack of basic knowledge of debris flow hazards among local residents was a major factor behind the “28 June 2012” debris flow disaster in Aizi gully. Thus, the government should strengthen the propaganda on disaster prevention and mitigation, and improve public awareness of debris flow disasters. This would significantly reduce losses caused by debris flow hazards.
However, the influence of earthquake and drought on the strength and permeability of gravel soil cannot be quantified, which leads to the inability to accurately predict the time when gravel soil starts to form debris flow, and finally may lead to low prediction accuracy, causing a certain impact on disaster prevention and mitigation.
Author Contributions
Conceptualization, X.Z., L.X. and N.H.; methodology, D.L.; software, L.X.; validation, Z.Y.; formal analysis, N.H.; investigation, N.H.; resources, N.H.; data curation, D.L.; writing—original draft preparation, N.H.; writing—review and editing, N.H. and X.Z.; visualization, Z.Y.; supervision, L.X.; project administration, L.X.; funding acquisition, N.H. All authors have read and agreed to the published version of the manuscript.
Funding
This work are financially supported by Hubei Key Laboratory of Disaster Prevention and Mitigation (China Three Gorges University) (2021KJZ04); The Special Funds of the National Natural Science Foundation of China (42041006, 42041004); Yellow River Institute of Hydraulic Research, YRCC, Key Laboratory of Lower Yellow River Channel and Estuary Regulation, MWR, Zhengzhou 450003, China; Excellent Youth Foundation of Henan Scientific Committee (222300420013); Special Basic Research Fund for Central Public Research Institutes (HKY-JBYW-2020-15).
Institutional Review Board Statement
Not applicable.
Informed Consent Statement
Not applicable.
Acknowledgments
The authors would like to acknowledge the financial support from Hubei Key Laboratory of Disaster Prevention and Mitigation (China Three Gorges University) (2021KJZ04); The Special Funds of the National Natural Science Foundation of China (42041006, 42041004); Yellow River Institute of Hydraulic Research, YRCC, Key Laboratory of Lower Yellow River Channel and Estuary Regulation, MWR, Zhengzhou 450003, China; Excellent Youth Foundation of He’nan Scientific Committee (222300420013); Special Basic Research Fund for Central Public Research Institutes (HKY-JBYW-2020-15).
Conflicts of Interest
The authors declare no conflict of interest.
References
- Iverson, R.M. Landslide triggering by rain infiltration. Water Resour. Res. 2000, 36, 1897–1910. [Google Scholar] [CrossRef]
- Chen, H.X.; Zhang, L.M.; Chang, D.S.; Zhang, S. Mechanisms and runout characteristics of the rainfall-triggered debris flow in Xiaojiagou in Sichuan Province, China. Nat. Hazards 2012, 62, 1037–1057. [Google Scholar] [CrossRef]
- Falae, P.O.; Kanungo, D.P.; Chauhan, P.K.S.; Dash, R.K. Electrical resistivity tomography (ERT) based subsurface characterization of Pakhi Landslide, Garhwal Himalayas, India. Environ. Earth Sci. 2019, 78, 430. [Google Scholar] [CrossRef]
- Luino, F.; Turconi, L.; Paliaga, G.; Faccini, F.; Marincioni, F. Torrential floods in the upper Soana Valley (NW Italian Alps): Geomorphological processes and risk-reduction strategies. Int. J. Disaster Risk Reduct. 2018, 27, 343–354. [Google Scholar] [CrossRef]
- Yang, Z.J.; Wang, L.Y.; Qiao, J.P.; Uchimura, T.; Wang, L. Application and verification of a multivariate real-time early warning method for rainfall-induced landslides: Implication for evolution of landslide-generated debris flows. Landslides 2020, 17, 2409–2419. [Google Scholar] [CrossRef]
- Uhlemann, S.; Smith, A.; Chambers, J.; Dixon, N.; Dijkstra, T.; Haslam, E.; Meldrum, P.; Merritt, A.; Gunn, D.; Mackay, J. Assessment of ground-based monitoring techniques applied to landslide investigations. Geomorphology 2016, 253, 438–451. [Google Scholar] [CrossRef]
- Crosta, G.B.; Dal Negro, P.; Frattini, P. Soil slips and debris flows on terraced slopes. Nat. Hazards Earth Syst. Sci. 2003, 3, 31–42. [Google Scholar] [CrossRef]
- Yang, Z.; Lan, H.; Gao, X.; Li, L.; Meng, Y.; Wu, Y. Urgent landslide susceptibility assessment in the 2013 Lushan earthquake-impacted area, Sichuan Province, China. Nat. Hazards 2015, 75, 2467–2487. [Google Scholar] [CrossRef]
- Fan, X.; Scaringi, G.; Xu, Q.; Zhan, W.; Dai, L.; Li, Y.; Pei, X.; Yang, Q.; Huang, R. Coseismic landslides triggered by the 8th August 2017 Ms 7.0 Jiuzhaigou earthquake (Sichuan, China): Factors controlling their spatial distribution and implications for the seismogenic blind fault identification. Landslides 2018, 15, 967–983. [Google Scholar] [CrossRef]
- Yin, J.; Chen, J.; Xu, X.W.; Wang, X.; Zheng, Y. The characteristics of the landslides triggered by the Wenchuan Ms, 8.0 earthquake from Anxian to Beichuan. J. Asian Earth Sci. 2010, 37, 452–459. [Google Scholar] [CrossRef]
- Dai, F.C.; Xu, C.; Yao, X.; Xu, L.; Tu, X.B.; Gong, Q.M. Spatial distribution of landslides triggered by the 2008 Ms 8.0 Wenchuan earthquake, China. J. Asian Earth Sci. 2011, 40, 883–895. [Google Scholar] [CrossRef]
- Ryan, H.F.; Legg, M.R.; Conrad, J.E.; Sliter, R.W. Recent faulting in the gulf of Santa Catalina: San Diego to Dana Point. Earth Sci. Urban Ocean S. Calif. Cont. Borderl. 2009, 454, 291–315. [Google Scholar]
- Liu, C.-N.; Dong, J.-J.; Peng, Y.-F.; Huang, H.-F. Effects of strong ground motion on the susceptibility of gully type debris flows. Eng. Geol. 2009, 104, 241–253. [Google Scholar] [CrossRef]
- Tang, C.; Van, A.T.; Chang, M.; Chen, G.; Zhao, X.; Huang, X. Catastrophic debris flows on 13 August 2010 in the Qingping area, southwestern China: The combined effects of a strong earthquake and subsequent rainstorms. Geomorphology 2012, 139, 559–576. [Google Scholar] [CrossRef]
- Tang, C.; Zhu, J.; Chang, M.; Ding, J.; Qi, X. An empirical–statistical model for predicting debris-flow runout zones in the Wenchuan earthquake area. Quat. Int. 2012, 250, 63–73. [Google Scholar] [CrossRef]
- Tang, C.; Zhu, J.; Li, W.; Liang, J. Rainfall-triggered debris flows following the Wenchuan earthquake. Bull. Eng. Geol. Environ. 2009, 68, 187–194. [Google Scholar] [CrossRef]
- Chen, N.S.; Tanoli, J.I.; Hu, G.S.; Wang, F.N.; Yang, C.L.; Ding, H.T.; He, N.; Wang, T. Outlining a stepwise, multi-parameter debris flow monitoring and warning system: An example of application in Aizi Valley, China. J. Mt. Sci. 2016, 13, 1527–1543. [Google Scholar] [CrossRef]
- Irmler, R.; Daut, G.; Mäusbacher, R. A debris flow calendar derived from sediments of lake Lago di Braies (N. Italy). Geomorphology 2006, 77, 69–78. [Google Scholar] [CrossRef]
- Chen, N.; Lu, Y.; Zhou, H.; Deng, M.; Han, D. Combined Impacts of Antecedent Earthquakes and Droughts on Disastrous Debris Flows. J. Mt. Sci. 2014, 11, 1507–1520. [Google Scholar] [CrossRef]
- Ni, H.Y.; Tang, Y.Q.; Xu, R.G.; Wang, D.W.; Chen, X.Y.; Song, Z. Mechanism and characteristics of Wenjia gully debris flow in epicenter area of Wenchuan earthquake. J. Eng. Geol. 2011, 19, 262–270. (In Chinese) [Google Scholar]
- Zhuang, J.Q.; Cui, P.; Peng, J.B.; Hu, K.H.; Iqbal, J. Initiation process of debris flows on different slopes due to surface flow and trigger-specific strategies for mitigating post-earthquake in old Beichuan County, China. Environ. Earth Sci. 2013, 68, 1391–1403. [Google Scholar] [CrossRef]
- Kazama, M.; Uzuoka, R.; Mori, T. Earthquake Induced debris flow and landslide in the iwate-miyagi Nairiku earthquake in 2008, Japan. In Proceedings of the 5th International Conference on Geotechnical Earthquake Engineering, Santiago de Chile, Chile, 9–14 January 2011; Volume 1, pp. 10–13. [Google Scholar]
- Ni, H.; Wang, D. Present Status, Problem and Advice on the Research of Prediction and Forecasting of Debris Flow Based on Rainfall Condition. J. Catastrophol. 2010, 25, 124–128. [Google Scholar]
- Liu, M.; Zhang, Y.; Tian, S.; Chen, N.; Mahfuzr, R.; Javed, I. Effects of loose deposits on debris flow processes in the Aizi Valley, southwest China. J. Mt. Sci. 2020, 17, 156–172. [Google Scholar] [CrossRef]
- Guzzetti, F.; Peruccacci, S.; Rossi, M.; Stark, C.P. The rainfall intensity–duration control of shallow landslides and debris flows: An update. Landslides 2008, 5, 3–17. [Google Scholar] [CrossRef]
- Chen, N.; Tian, S.; Zhang, Y.; Wang, Z. Soil mass domination in debris -flow disasters and strategy for hazard mitigation. Earth Sci. Front. 2021, 28, 337–348. [Google Scholar] [CrossRef]
- Van Ray, M.P. A rainfall anomaly index independent of time and space. Notos 1965, 14, 43–48. [Google Scholar]
- Chen, N.S.; Cui, P.; Liu, Z.G.; Wei, F.Q. Calculation of the debris flow concentration based on clay content. Sci. China Ser. E Technol. Sci. 2003, 46, 163–174. [Google Scholar] [CrossRef]
- Institute of Mountain Hazards and Environment of Chinese Academy of Sciences. Debris Flow in China; Commercial Press: Beijing, China, 2000. [Google Scholar]
- Chen, N.S.; Yue, Z.Q.; Cui, P.; Li, Z.L. A rational method for estimating maximum discharge of a landslide-induced debris flow: A case study from southwestern China. Geomorphology 2007, 84, 44–58. [Google Scholar] [CrossRef]
- The Ministry of Construction of the People’s Republic of China. Geotechnical Engineering Specification GB50021-2001; China Building Industry Press: Beijing, China, 2002. [Google Scholar]
- Gartner, J.E.; Cannon, S.H.; Santi, P.M.; Dewolfe, V.G. Empirical models to predict the volumes of debris flows generated by recently burned basins in the western US. Geomorphology 2008, 96, 339–354. [Google Scholar] [CrossRef]
- Chen, N.; Yang, C.; Zhou, W.; Hu, G.; Li, H.; Hand, D. The critical rainfall characteristics for torrents and debris flows in the Wenchuan earthquake stricken area. J. Mt. Sci. 2009, 6, 362–372. [Google Scholar] [CrossRef]
- Chen, N.S.; Li, H.; Xie, W.Y. Emergency judge method and index of debris flow sites triggered by 5·12 Wenchuan Earthquake. J. Mt. Sci. 2009, 27, 108–114. (In Chinese) [Google Scholar]
- Wu, H.; Xiong, D.H.; Xiao, L.; Zhang, S.; Yuan, Y.; Su, Z.-a.; Zhang, B.-j.; Yang, D. Effects of vegetation coverage and seasonal change on soil microbial biomass and community structure in the dry-hot valley region. J. Mt. Sci. 2018, 15, 1546–1558. [Google Scholar] [CrossRef]
- Guo, X.; Cui, P.; Ma, L.; Kong, Y. Triggering Rainfall Characteristics for Debris Flows along Dujiangyan-Wenchuan Highway of Sichuan. Mt. Res. 2014, 32, 739–746. [Google Scholar] [CrossRef]
- Ma, J.W.; Xia, D.; Guo, H.X.; Wang, Y.K.; Niu, X.X.; Liu, Z.Y.; Jiang, S. Metaheuristic-based support vector regression for landslide displacement prediction: A comparative study. Landslides 2022, 19, 2489–2511. [Google Scholar] [CrossRef]
- Zhang, F. The formation mechanism’s research of loess landslides in the mountain area of the Southern Ningxia. Chin. J. Geol. Hazard Control 2011, 3, 11–15. [Google Scholar]
- Giannecchini, R.; Galanti, Y.; D’Amato Avanzi, G.; Barsanti, M. Probabilistic rainfall thresholds for triggering debris flows in a human-modified landscape. Geomorphology 2016, 257, 94–107. [Google Scholar] [CrossRef]
- Senneset, K. Prediction of earthquake induced landslides. In Proceedings of the 7th International Symposium on Landslides, Trondheim, Norway, 17–21 June 1996; Volume 1, pp. 115–132. [Google Scholar]
Figure 1.
Location of Aizi gully watershed.

Figure 2.
Aizi gully water system and debris flow zoning map.

Figure 3.
Geological map of Aizi gully watershed.

Figure 4.
Rainfall distribution in Aizi gully watershed.

Figure 5.
Investigation methods of debris flow dynamic characteristics.

Figure 6.
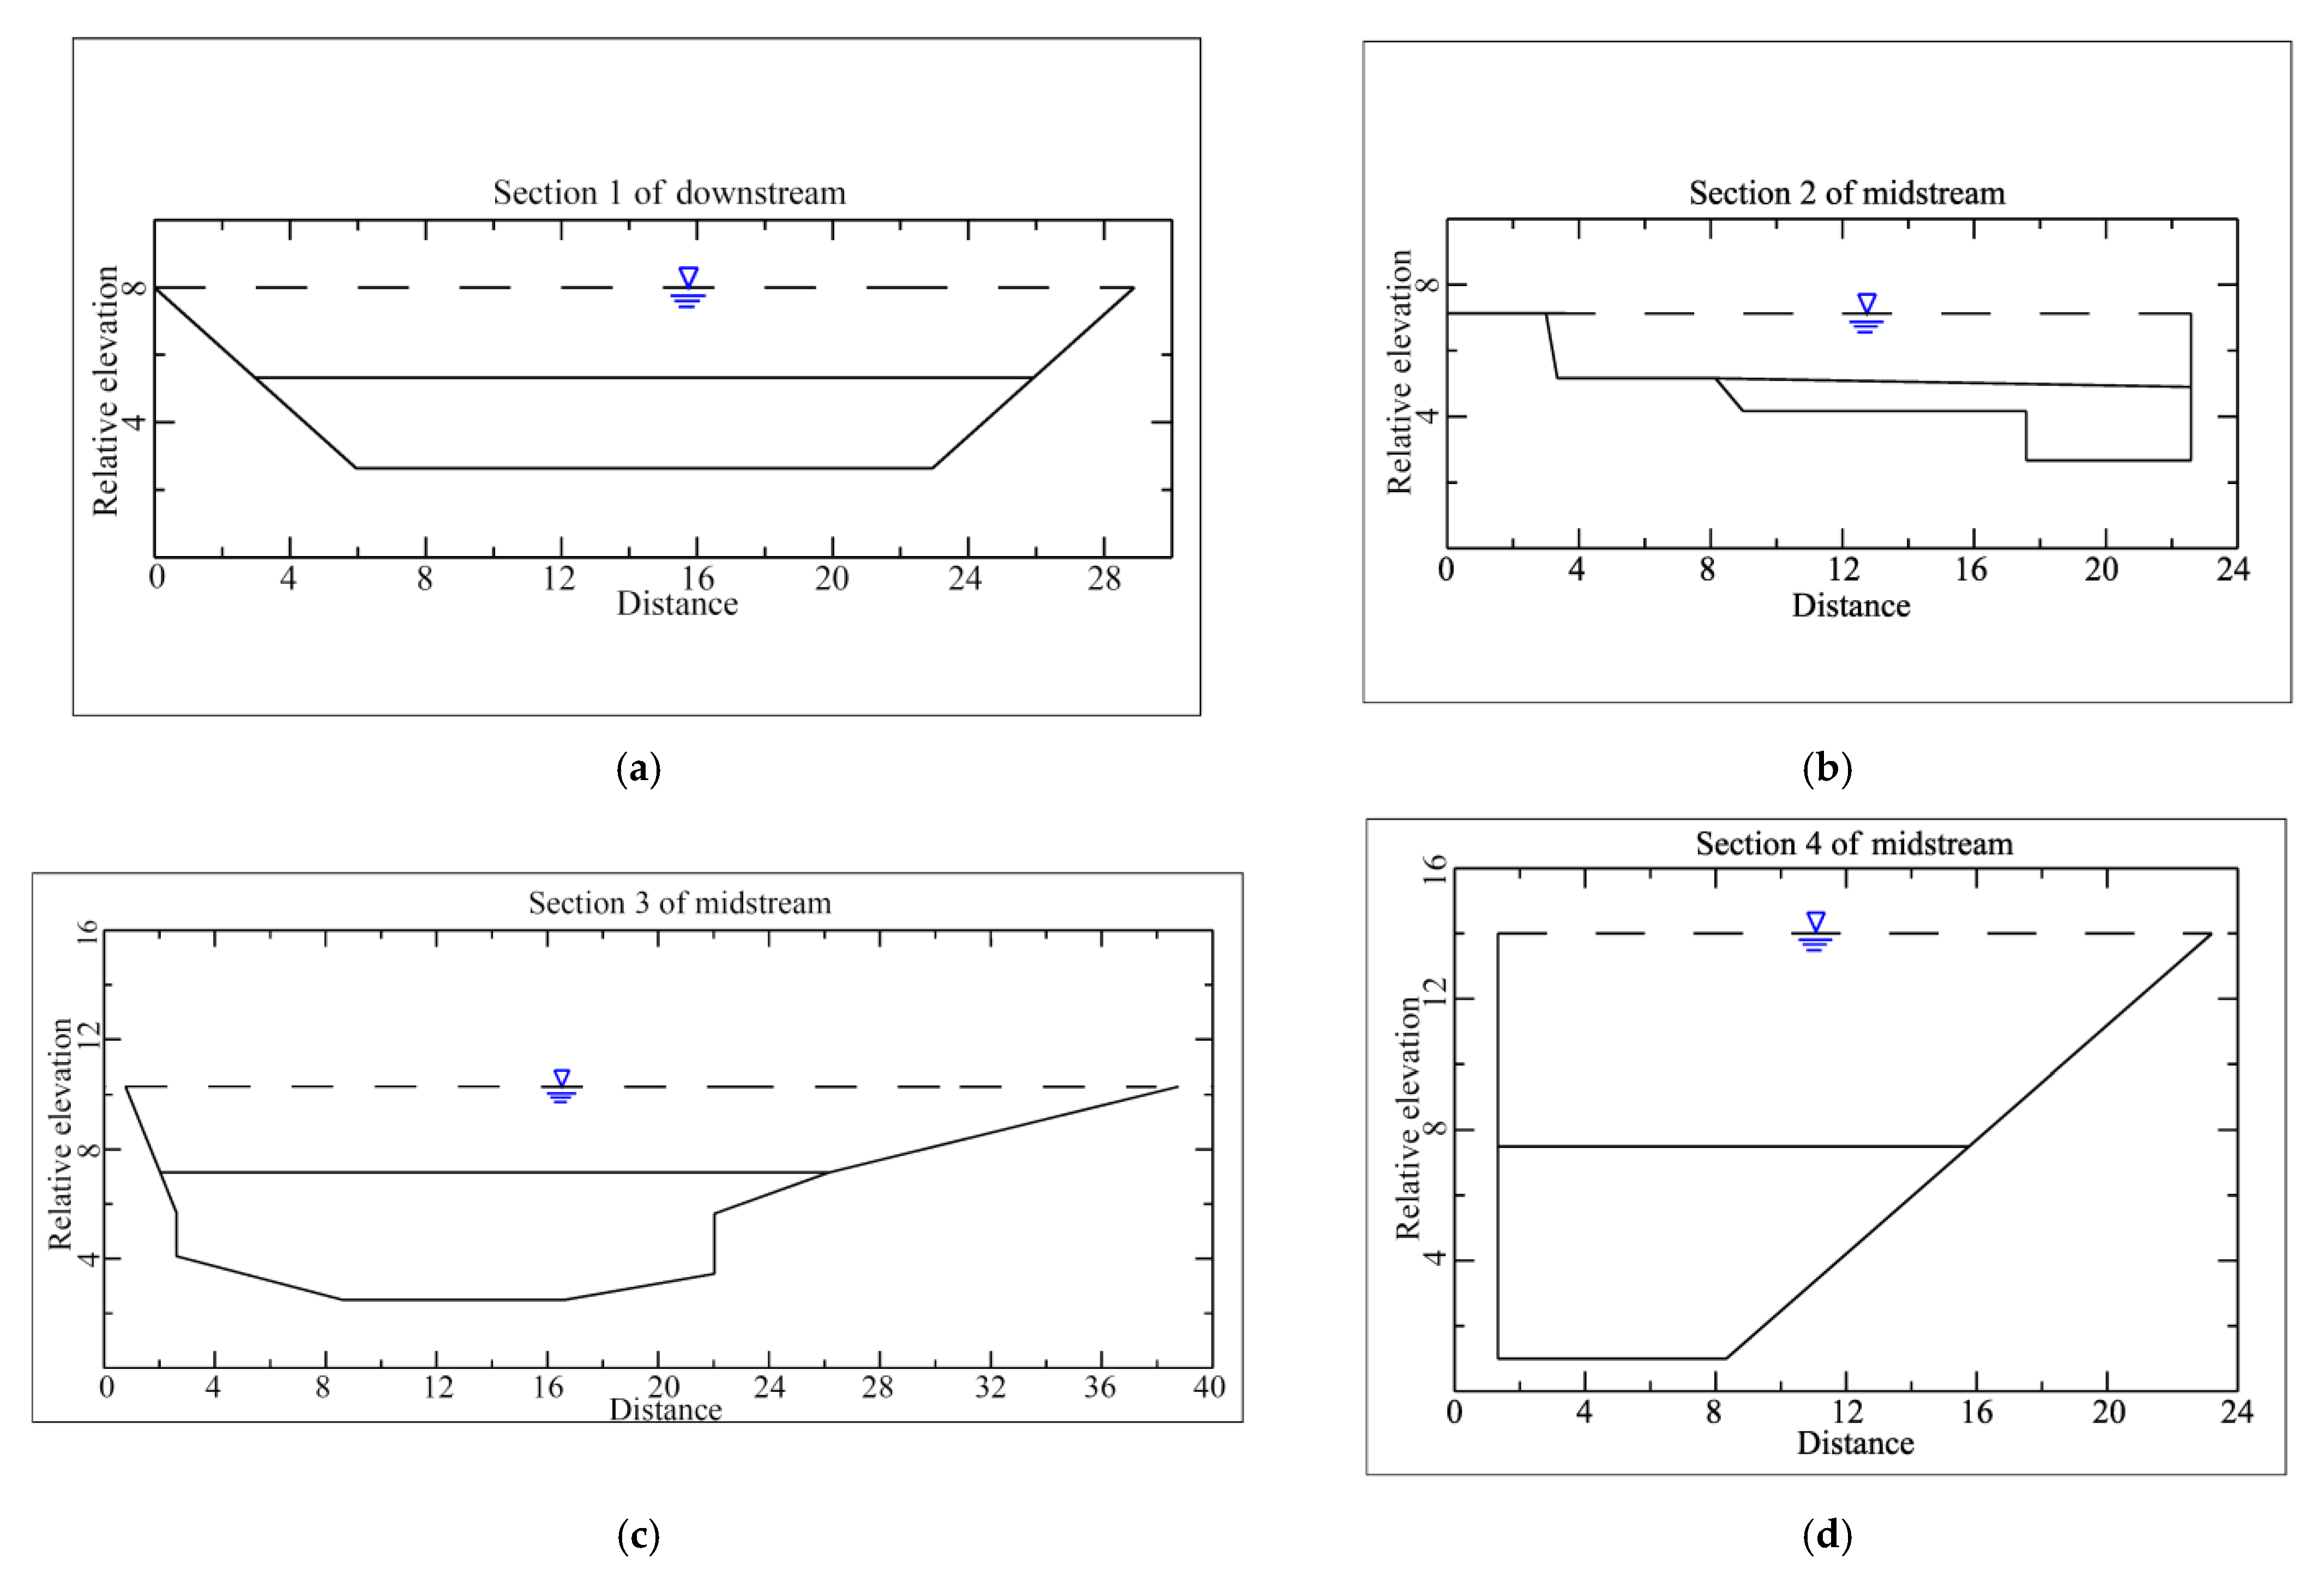
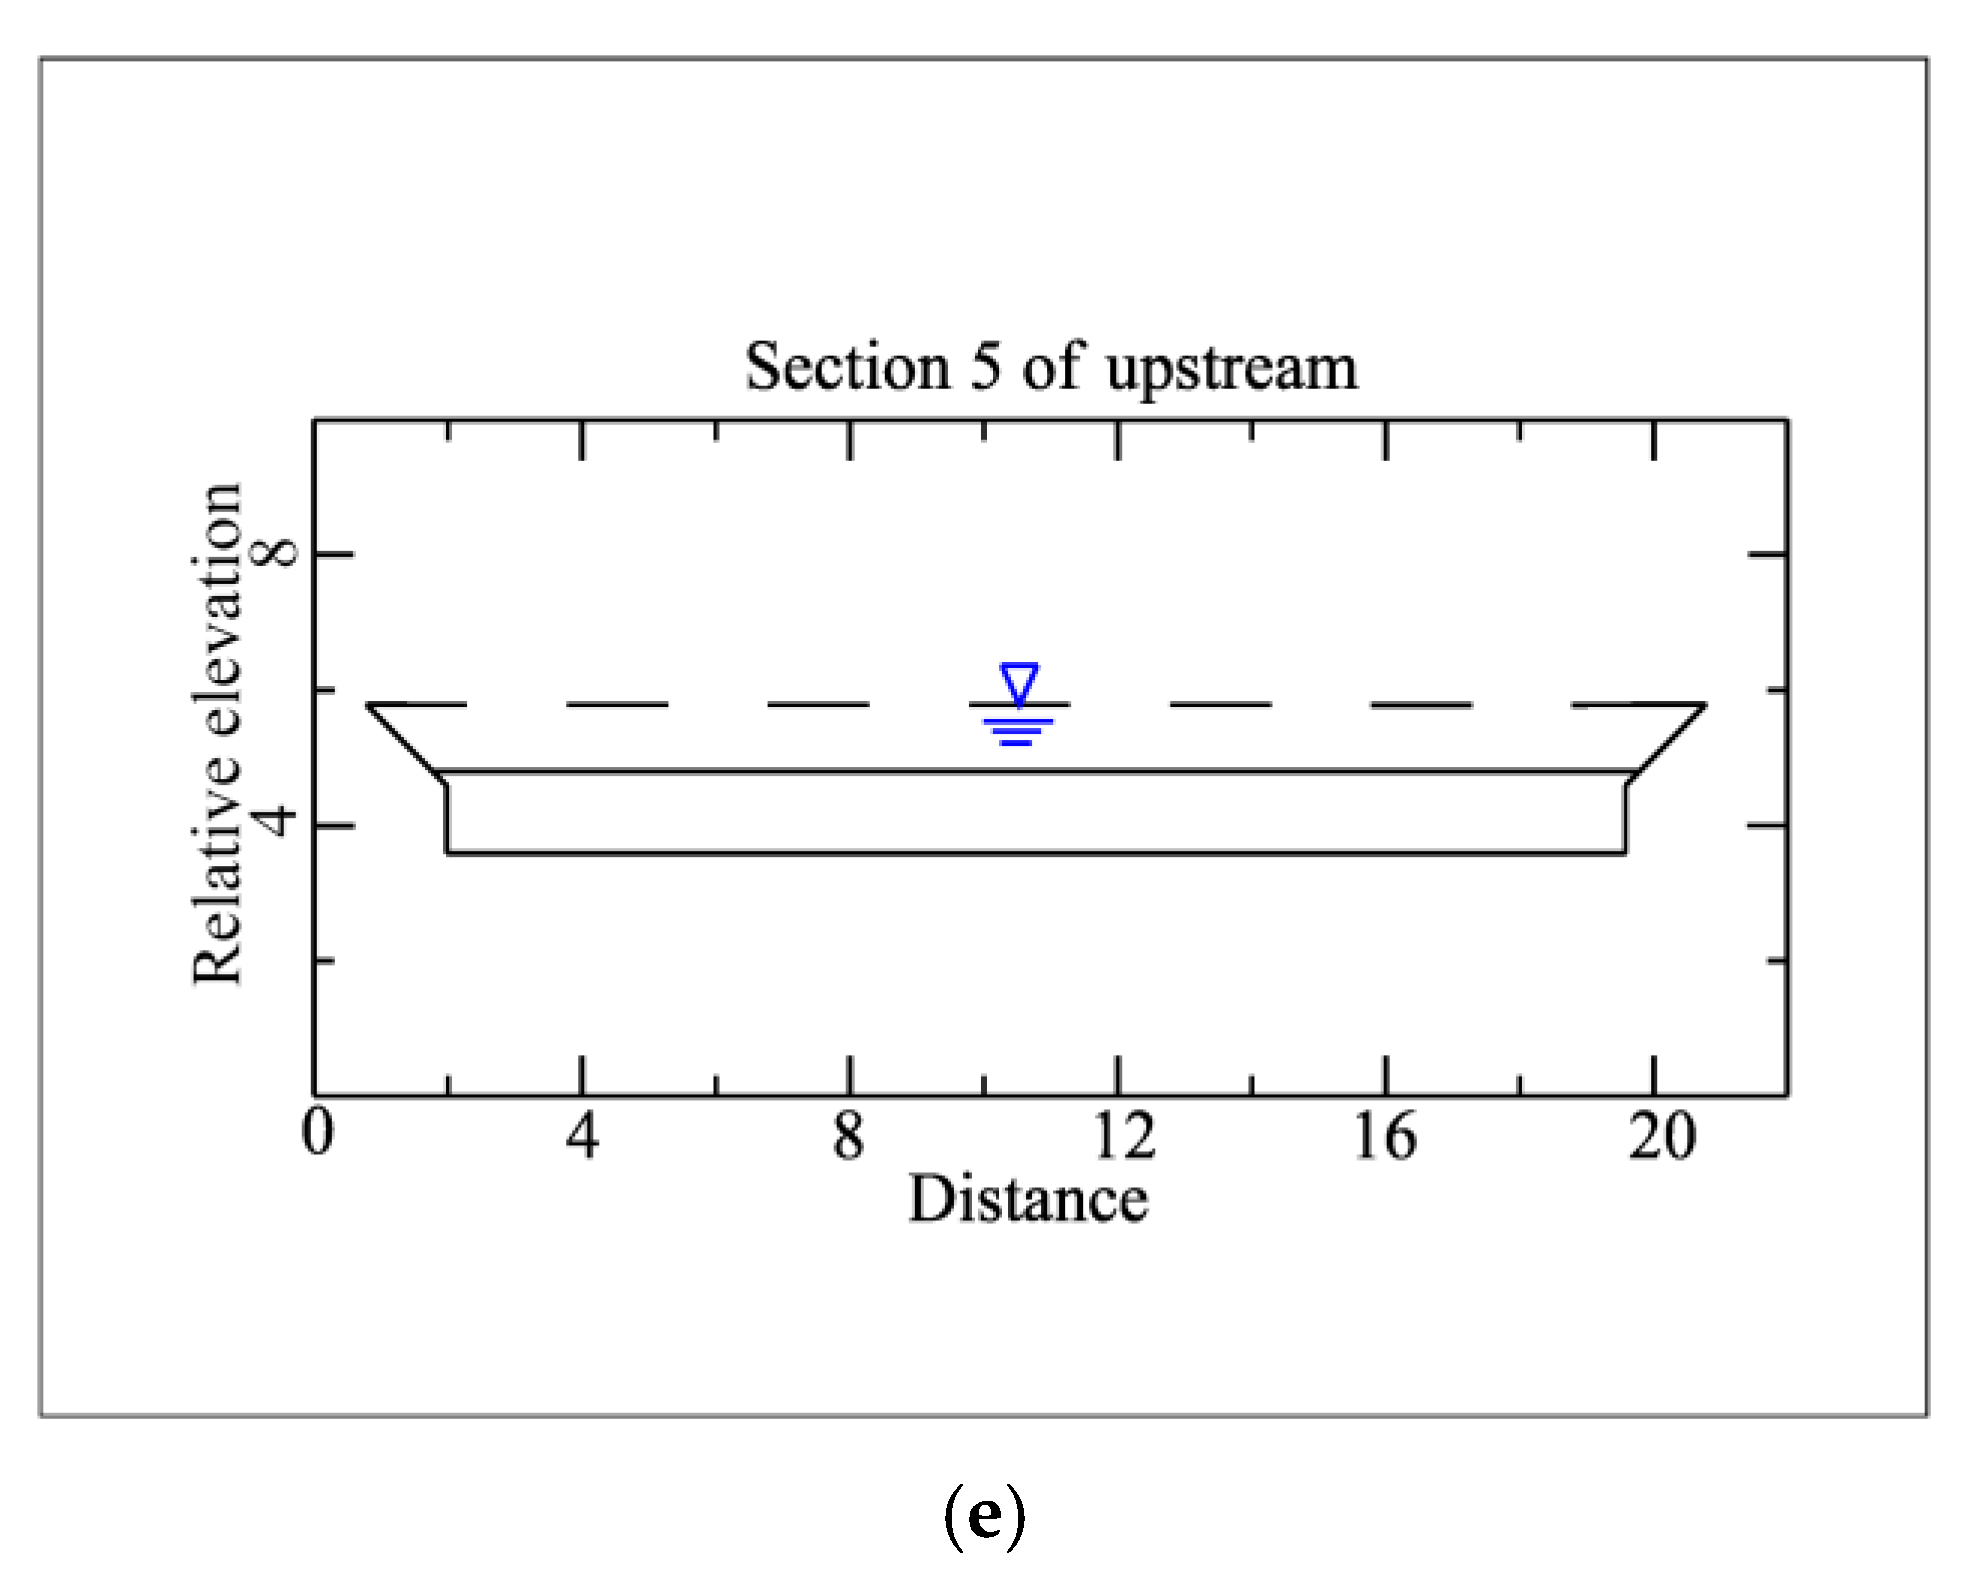
Profiles five different cross-sections (the locations of the cross-section are displayed Figure 2); (a) No 1 cross-section profile; (b) No 2 cross-section profile; (c) No 3 cross-section profile; (d) No 4 cross-section profile; (e) No 5 cross-section profile.
Figure 6.
Profiles five different cross-sections (the locations of the cross-section are displayed Figure 2); (a) No 1 cross-section profile; (b) No 2 cross-section profile; (c) No 3 cross-section profile; (d) No 4 cross-section profile; (e) No 5 cross-section profile.


Figure 7.
Profile of loose solid materials distribution in Aizi gully.

Figure 8.
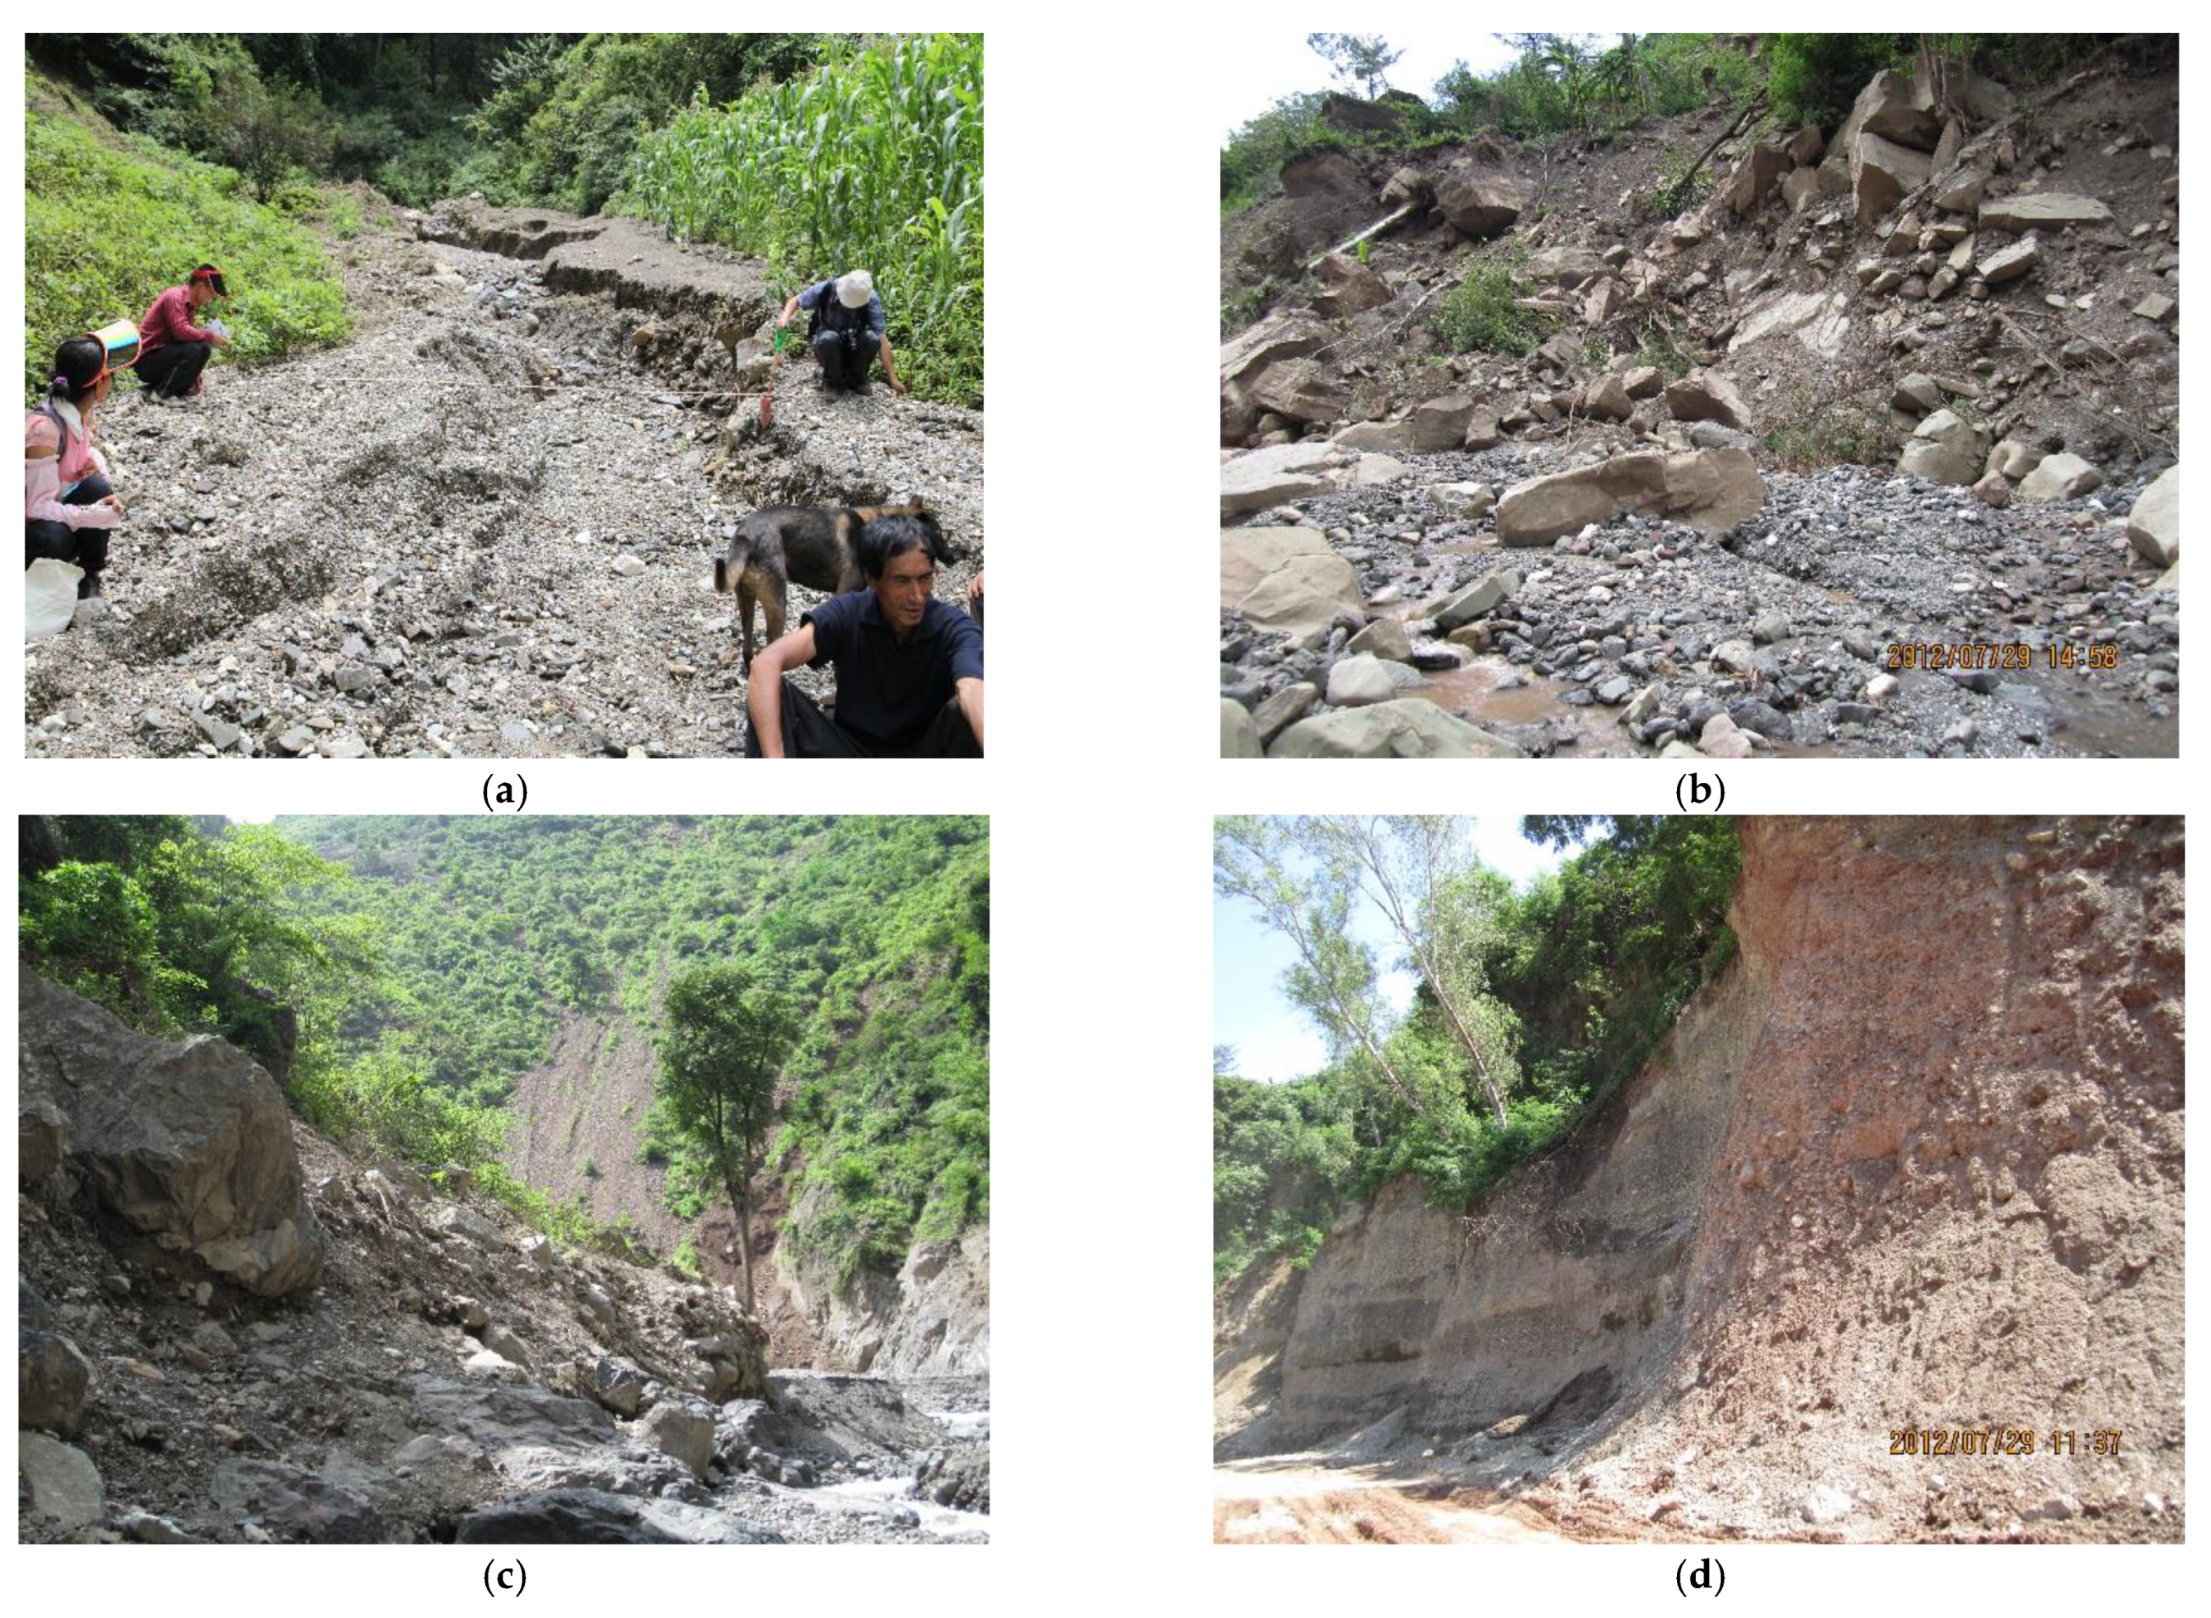
Photos of debris flow source materials; (a) colluvium; (b) collapse deposits; (c) landslide deposits; (d) ancient debris flow deposits.
Figure 8.
Photos of debris flow source materials; (a) colluvium; (b) collapse deposits; (c) landslide deposits; (d) ancient debris flow deposits.

Figure 9.
Rainfall intensity curve in Baihetan meteorological station and Xintian meteorological station from 27 June to 28 June 2012. (The meaning of the number on the horizontal axis is the time period, for example, 2012-6-27 01:00 represents the time period from 00:00 a.m. to 01:00 a.m. on 27 June 2012, the vertical axis is the amount of rainfall data from two different meteorological stations).


Table 1.
Partition table of drought and flood grades based on rainfall anomaly method.
| Rainfall Anomaly /% | Drought and Flood Grades | Code |
|---|---|---|
| H > 88 | Extreme flood | 1 |
| 37 < H ≤ 88 | Serious flood | 2 |
| 27 < H ≤ 37 | Mild flood | 3 |
| −31 ≤ H ≤ 27 | Normal | 4 |
| −34 ≤ H < −31 | Mild drought | 5 |
| −48 ≤ H < −34 | Serious drought | 6 |
| H < −48 | Extreme drought | 7 |
Table 2.
Characteristics of debris flow in Aizi gully.
| Cross-Section Number | 1 | 2 | 3 | 4 | 5 |
|---|---|---|---|---|---|
| Location | 102°53′54.8″ E 27°10′57.0″ N | 102°53′23.0″ E 27°10′57.2″ N | 102°52′3.2″ E 27°11′3.2″ N | 102°51′44.1″ E 27°45′45.4″ N | 102°49′38.9″ E 27°10′30.6″ N |
| Gully bed elevation | 690 m | 770 m | 1108 m | 1264 m | 1857 m |
| Gully bed gradient (°) | 5 | 6 | 7 | 12 | 8 |
| Mean mud depth (m) | 5.4 | 4.95 | 7.64 | 12.4 | 2.2 |
| Area of cross-section (m2) | 122.8 | 125.5 | 180.3 | 168.8 | 40.2 |
| Cross-section features | The flood mark is clear on both sides of this cross-section, undisturbed samples under the big rocks are found here | The flood mark is clear in this cross-section | The topography is open without sedimentation and jam | The flood mark is higher than other cross-sections due to blockage of big rocks, moreover, scour is serious on both sides of this cross-section | Several tributaries developed above this cross-section, the flood mark on the tree in the gully bed is clear |
| Dynamic characteristics | Velocity = 7.54 m/s, (method of completing the square) (p = 1%) discharge = 971.36 m3/s, (field investigation method) discharge = 925.91 m3/s | Velocity = 7.06 m/s, (method of completing the square) (p = 1%) discharge = 963.13 m3/s, (field investigation method) discharge = 886.03 m3/s | Velocity = 4.76 m/s, (method of completing the square) (p = 1%) discharge = 940.91 m3/s, (field investigation method) discharge = 858.22 m3/s | Velocity = 4.95 m/s, (method of completing the square) (p = 1%) discharge = 891.92 m3/s, (field investigation method) discharge = 835.56 m3/s | Velocity: 6.35 m/s, (method of completing the square) (p = 1%) discharge = 545.28 m3/s, (field investigation method) discharge = 255.27 m3/s |
Table 3.
Calculation methods of debris flow dynamic characteristics [32].
Table 3.
Calculation methods of debris flow dynamic characteristics [32].
| Calculation Methods | Computational Formula |
|---|---|
| Calculate bulk density based on clay content | |
| Velocity of viscous debris flow | |
| Velocity of dilute debris flow | Vc = (Mc/a)·R2/3·Ic1/2 |
| Calculate velocity by super-elevation-in-bend method | |
| Water discharge | |
| Method of completing the square | |
| Morphological investigation method | |
| Total volume of one time debris flow | |
| Total volume of solid materials |
Table 4.
Calculation results of velocity and discharge of each cross-section.
| Cross-Section | (Viscous Debris Flow), MC (Dilute Debris Flow) | Velocity (m/s) | Water Discharge (m3/s) | Blockage Coefficient | (Correction Coefficient) | Calculation Results of Method of Completing the Square (m3/s) | Calculation Results of Morphological Investigation Method (m3/s) |
|---|---|---|---|---|---|---|---|
| No 1 | 8.3 | 7.54 | 321.22 | 1.6 | 1.89 | 971.36 | 925.91 |
| No 2 | 7.5 | 7.06 | 339.73 | 1.5 | 1.89 | 963.13 | 886.03 |
| No 3 | 3.5 | 4.76 | 331.89 | 1.5 | 1.89 | 940.91 | 858.22 |
| No 4 | 2 | 4.95 | 314.61 | 1.5 | 1.89 | 891.92 | 835.56 |
| No 5 | 10 | 6.35 | 251.28 | 1.4 | 1.55 | 545.28 | 255.27 |
Table 5.
Debris flow discharge under different frequency.
| Frequency p (%) | Bulk Density/g/cm3 | Water Discharge Qb/m3/s | Debris Flow Discharge m3/s | Duration T (s) | Total Volume of One Time Debris Flow Wc (104 m3) | Total Volume of Solid Materials Ws (104 m3) |
|---|---|---|---|---|---|---|
| 1 | 1.8 | 321.22 | 971.36 | 2400 | 57.4 | 27 |
| 2 | 1.77 | 299.28 | 875.31 | 2400 | 51.7 | 23.4 |
| 5 | 1.71 | 240.8 | 661.59 | 2400 | 39.1 | 16.4 |
| 10 | 1.62 | 193.71 | 487.86 | 2400 | 28.8 | 10.5 |
Table 6.
Statistics of loose solid materials (×104 m3).
| Confluence Area | Residual Deposits | Colluvial Deposits | Landslide Deposits | Ancient Debris Flow Deposits | Total |
|---|---|---|---|---|---|
| Niluohan gully | 407.09 | 445.24 | 90.10 | ||
| Gualv gully | 940.18 | 158.50 | |||
| Aizi gully | 1041.54 | 554.60 | 765.00 | 411.00 | |
| Total (104 m3) | 2388.81 | 1158.34 | 855.1 | 411.00 | 4813.25 |
Table 7.
Earthquakes with magnitude of more than 4.7 that affected Aizi gully over the past 20 years (where is the magnitude of the earthquake, R is the inductive radius and D is distance between debris flow location and earthquake epicenter. EPA is the abbreviation for earthquake peak acceleration, and gal is the abbreviation for gallon which is the unit of EPA).
| Date | Ms | Depth/km | R/km | D/km | EPA/Gal (cm/s2) |
|---|---|---|---|---|---|
| 24 October 1995 | 6.5 | 15 | 308.67 | 174.12 | 4.9 |
| 23 February 1996 | 6.9 | 10 | 402.81 | 149.43 | 11.0 |
| 19 November 1998 | 6.1 | 33 | 236.54 | 62.10 | 16.2 |
| 15 January 2000 | 6.4 | 32 | 288.80 | 57.99 | 25.5 |
| 10 April 2002 | 4.9 | 28 | 93.24 | 39.64 | 7.3 |
| 21 July 2003 | 6.3 | 10 | 270.21 | 76.47 | 15.1 |
| 16 October 2003 | 5.9 | 32 | 207.06 | 18.05 | 55.8 |
| 15 November 2003 | 5.4 | 24 | 148.46 | 46.03 | 10.7 |
| 26 November 2003 | 5 | 13 | 116.68 | 16.07 | 25.7 |
| 10 August 2004 | 5.5 | 6 | 158.67 | 55.66 | 9.1 |
| 5 August 2005 | 5.4 | 31 | 148.46 | 87.17 | 3.8 |
| 12 May2008 | 8 | 14 | 837.53 | 392.96 | 8.7 |
| 30 August 2008 | 6.3 | 19 | 270.21 | 139.34 | 5.6 |
| 31 August 2008 | 5.8 | 13 | 193.73 | 64.27 | 10.6 |
| 9 July 2009 | 6.3 | 6 | 270.21 | 28.68 | 53.2 |
| 29 August 2010 | 4.9 | 10 | 93.24 | 65.76 | 3.2 |
Table 8.
Rainfall anomaly in Aizi gully from January 2011 to June 2012.
| Data | Rainfall/mm | Anomaly/% |
|---|---|---|
| January 2011 | 26 | 136 |
| February 2011 | 2 | −82 |
| March 2011 | - | - |
| April 2011 | 16 | −37 |
| May 2011 | - | - |
| June 2011 | 164 | −25 |
| July 2011 | 71 | −65 |
| September 2011 | 79 | −48 |
| August 2011 | 206 | 21 |
| October 2011 | 67 | −29 |
| November 2011 | 12 | −56 |
| December 2011 | 7 | −74 |
| January 2012 | 6 | −50 |
| February 2012 | 0 | −100 |
| March 2012 | 0 | −100 |
| April 2012 | 2 | −92 |
| May 2012 | 75 | −16 |
| June 2012 | 241 | 11 |
Table 9.
Relationship between earthquake, drought and debris flows.
| Correlation Level | Correlation between Debris Flow and Earthquake | Correlation between Debris Flow and Drought | Degree of Correlation |
|---|---|---|---|
| 1 | More than 70% of the total debris flow disasters in this region occurred within 5 years after earthquake | More than 70% of the total debris flow disasters in this region occurred in summer after spring drought | Very close relationship |
| 2 | 50–70% of the total disastrous debris flow in this region occurred within 5 years after earthquake | 50–70% of the total disastrous debris flow in this region occurred in summer after spring drought | Close relationship |
| 3 | 30–50% of the total disastrous debris flow in this region occurred within 5 years after earthquake | 30–50% of the total disastrous debris flow in this region occurred in summer after spring drought | General relationship |
| 4 | Less than 30% of the total disastrous debris flow in this region occurred within 5 years after earthquake | Less than 30% of the total disastrous debris flow in this region occurred in summer after spring drought | Relationship is not obvious |
Table 10.
Antecedent rainfall statistics before debris flow outbreak on 28 June 2012 (unit: mm).
| Prophase Rainfall Time | 23 June | 24 June | 25 June | 26 June | 27 June | Cumulative Rainfall in Five Days before Outbreak of Debris Flow | 28 June |
|---|---|---|---|---|---|---|---|
| Daily rainfall in Baihetan meteorological station | 0.1 | 4.8 | 0.1 | 1.5 | 11.1 | 17.6 | 29.8 |
| Daily rainfall in Xintian meteorological station | 9.3 | 0.1 | 5.6 | 24.9 | 39.9 | 78.3 | |
| Daily rainfall in Dazhai meteorological station | No data recorded because the instrument was damaged | ||||||
Publisher’s Note: MDPI stays neutral with regard to jurisdictional claims in published maps and institutional affiliations. |
© 2022 by the authors. Licensee MDPI, Basel, Switzerland. This article is an open access article distributed under the terms and conditions of the Creative Commons Attribution (CC BY) license (https://creativecommons.org/licenses/by/4.0/).
Share and Cite
MDPI and ACS Style
He, N.; Liu, D.; Zhang, X.; Xu, L.; Yang, Z. Dynamic Formation Processes and Characteristics of “28 June 2012” Debris Flow in Aizi Valley, Ningnan County, Sichuan Province, China. Water 2022, 14, 3045. https://doi.org/10.3390/w14193045
AMA Style
He N, Liu D, Zhang X, Xu L, Yang Z. Dynamic Formation Processes and Characteristics of “28 June 2012” Debris Flow in Aizi Valley, Ningnan County, Sichuan Province, China. Water. 2022; 14(19):3045. https://doi.org/10.3390/w14193045
Chicago/Turabian StyleHe, Na, Daxiang Liu, Xianggang Zhang, Linjuan Xu, and Zhiquan Yang. 2022. "Dynamic Formation Processes and Characteristics of “28 June 2012” Debris Flow in Aizi Valley, Ningnan County, Sichuan Province, China" Water 14, no. 19: 3045. https://doi.org/10.3390/w14193045
Note that from the first issue of 2016, this journal uses article numbers instead of page numbers. See further details here.