
Variability of Carbon Export in the Lower Mississippi River during an Extreme Cold and Warm Year

1
School of Renewable Natural Resources, Louisiana State University, Baton Rouge, LA 70803, USA
2
Coastal Studies Institute, Louisiana State University, Baton Rouge, LA 70803, USA
*
Author to whom correspondence should be addressed.
Water 2022, 14(19), 3044; https://doi.org/10.3390/w14193044
Submission received: 5 August 2022
/
Revised: 21 September 2022
/
Accepted: 24 September 2022
/
Published: 27 September 2022
(This article belongs to the Special Issue Recent Progress in CO2 Emission from the World’s Rivers)
Abstract
:The Mississippi River (MR) discharges on average 474 km3 of water annually into the Northern Gulf of Mexico (NGOM) with a large quantity of carbon, playing a vital role in the ecosystem’s food chain and water quality. In this study, we analyzed exports of dissolved inorganic (DIC) and organic carbon (DOC) from January 2021 to December 2021, during which the contiguous United States experienced one of the coldest winters as well as the hottest summer on record. Bi-weekly in situ river measurements and water sampling were conducted in the lower MR at Baton Rouge in Louisiana, USA, approximately 368 km from the river’s mouth. We found that the MR transported 12.61 Tg C of DIC and 4.54 Tg C of DOC into the NGOM during the study period. Much of the DOC mass export occurred during the winter (~38%), while much of the DIC mass export took place in the spring months (~35%). The seasonality of DOC and DIC exports was affected by their concentrations, water temperature, and discharge. DIC concentrations were significantly higher in the fall (32.0 mg L−1) than those during the winter (20.4 mg L−1), while DOC concentrations were highest during the winter months (11.3 mg L−1) and varied seasonally, however, not significantly. Partial pressure of dissolved carbon dioxide (pCO2) in the MR averaged 1703 ± 646 µatm peaking in the summer at 2594 µatm and reaching a low in the winter at 836 µatm. Outgassing of CO2 (FCO2) peaked in the spring averaging 3.43 g C m2 d−1 and was lowest in the winter at 1.62 g C m2 y−1. Our findings validate our initial hypotheses that seasonal variability and weather extremes strongly affect terrestrial-aquatic carbon transfer, and that climate change will likely intensify carbon export from the Mississippi River Basin.
1. Introduction
Riverine carbon transport is a significant component of the global carbon cycle currently not well constrained. Despite covering a relatively low portion of the global area, rivers are a critical conduit connecting two of the world’s largest carbon reservoirs [1,2,3]. Globally rivers transport inland waters carrying terrestrially derived carbon and essential nutrients to coastal environments [4,5,6]. Riverine carbon is transported through outgassing to the atmosphere as carbon dioxide gas (FCO2) or laterally exported to the ocean. Lateral export of river carbon includes particulate organic carbon (POC, 0.17–0.24 Pg C/y), dissolved organic carbon (DOC, 0.20–0.36 Pg C/y), dissolved inorganic carbon (DIC, 0.38-0.41 Pg C/y), and particulate inorganic carbon (PIC, 0.05–0.17 Pg C/y) [2,7,8,9,10]. Global fluxes of riverine dissolved carbon are typically greater than that of particulate carbon, indicating the importance of an accurate estimation of their total flux [4,6,8]. As a significant component of the global carbon budget, recent studies have aimed to estimate global dissolved carbon export from rivers [2,4]. However, our knowledge of the seasonality of the riverine carbon transport is still limited for predicting future riverine carbon dynamics.
Dissolved inorganic carbon (DIC) is of critical importance to fluvial and coastal ecosystem health originating from soil respiration, groundwater, and carbonate weathering [7,11,12]. DIC is utilized by phytoplankton and submerged aquatic vegetation through photosynthesis and regulates aquatic CO2 concentration. DIC remains the largest terrestrial carbon pool delivered to coastal ecosystems by fluvial transport [4,8,11]. Consumption and oxidation of DOC is a significant energy source within aquatic food webs, with implications for the health of coastal and estuary environments [13,14,15]. DOC sources primarily from the decomposition of terrestrial vegetation, runoff of detrital, and autochthonous DOC from in-stream microorganisms [16,17,18]. Past estimations of dissolved carbon have typically utilized long-term data sets to model carbon transport [2,19]. Many of the data sets used in these studies only account for a particular carbon form, with very few studies collecting direct measurements of dissolved carbon and fewer collecting multiple carbon forms [2,4,19]. Past models tend to have a wide discrepancy in total export as they often fail to account for seasonal variations which have significant impacts on river hydrology and environmental factors [2,4,6]. The restraints from these global models have emphasized the need for high resolutions studies on dissolved carbon transport with a direct collection of river carbon.
In addition to lateral carbon transport, rivers are known to act as a carbon source to the atmosphere through the outgassing of CO2. Large rivers are often supersaturated with CO2 with respect to the atmosphere as respiration from aquatic organisms and oxidation of DOC typically overcome in-stream primary production [5,20,21]. As a greenhouse gas, CO2 outgassing from rivers presents a critical component of atmospheric CO2 with considerable uncertainty [2,5]. Globally inland waters are estimated to outgas between 0.23–1.80 Pg of CO2 to the atmosphere annually, potentially equivalent to the total carbon exported laterally [4,6,20,22,23]. The variability in estimation has largely been due to low-resolution data and estimations of riverine partial pressure of CO2 (pCO2) based on DIC concentration, total alkalinity, and river pH [24]. Evasion of CO2 is known to vary both spatially and temporally due to changes in environment, hydrology, and land-use conditions [20,25,26]. These variations are particularly prevalent in today’s large rivers in subtropical climate regions [27]. Subtropic rivers have a relatively high pCO2 due to warmer climate, high precipitation, and increasing biogeochemical activity [21,27,28]. Subtropical regions have been subject to environment and hydrologic shifts as climate change has increased global precipitation and atmospheric temperatures [29,30]. Currently, climate change is often observed as changing mean conditions, less often considering the drastic change in weather highs and lows. As these changes continue in severity, seasonal variability is predicted to decline, with summers becoming hotter and longer and winters shorter and milder with more extreme heat waves and cold snaps [31]. Therefore, studies are needed to quantify seasonal variation in riverine carbon transport during the extreme years.
In recent years, intensifying effects of climate change have resulted in increased precipitation, temperatures, and discharge across the Mississippi River Basin [32]. Rising temperatures throughout the year have resulted in longer summers and shorter winter seasons with extreme weather events increasing in intensity [31,33,34]. Current models are projecting these trends to continue, with water temperature in the Mississippi River expected to increase between 1–8 °C over the next 80 years [35]. Additionally, river discharge has continued to follow a similar trend increasing steadily over the past century due mainly to land-use change [18,33,36]. River discharge is predicted to increase 11–60% in the coming century resulting in more regular flooding events [37,38]. These changes are predicted to increase riverine dissolved carbon exported to the Gulf of Mexico [18,39]. Recent modeling work by Tian et al. [33] has suggested DOC export has increased by nearly 40% in the last 100 years as much of the basin has undergone severe land use change and urbanization. Similarly, a study by Ren et al. [18] found DIC is predicted to increase by up to 65% in the coming century due largely to climate changes, including increased atmospheric temperature and precipitation. Previous studies simplified seasonal export from the Mississippi River into a wet and dry season where the bulk of carbon is exported during the wet season and the least in the dry season [39,40]. With seasonal climate continuing to evolve, a more comprehensive evaluation of the temporal variability of carbon export from the Mississippi River is critical to accurately model future carbon fluxes and evaluate changes in the export and of carbon from this extensive river network.
With the above introduction in mind, we conducted this study measuring riverine DIC, DOC, and pCO2 from January to December of 2021, a year with extreme weather variability across the Mississippi River Basin. Our primary goal was to determine if there was a significant relationship between seasonality and carbon export in the lower Mississippi River near its mouth to the Gulf of Mexico. Additionally, we aimed to provide an updated estimation of the total export from the Mississippi River during a year with unprecedented weather extremes. Our objectives were to: (1) determine if a substantial seasonal variation in carbon export was present during an extreme cold winter and hot summer; (2) confirm the increasing trend in the export of dissolved carbon from the Mississippi River; and (3) provide direct measurements to assist in future modeling of carbon flux estimations. With these objectives in mind, we aimed to test the hypothesis that riverine carbon export will be highest in the warm and wet spring and lowest in the dry and cold winter seasons.
2. Materials and Methods
This study was conducted in the Lower Mississippi River at Baton Rouge in southern United States (30°26′23.5′′ N 91°11′30.4′′ W). The Mississippi River drains 3.2 million km2 of land, roughly 41% of the contiguous United States, and discharges each year, on average over the past four decades, a total of 673 km3 of freshwater into the Gulf of Mexico through its mainstem channel (474 km3) and its distributary the Atchafalaya River (199 km3) [41,42]. The study site was on the mainstem and was chosen as it rests roughly 370 km from the river’s outlet into the Gulf of Mexico, eliminating the potential effect of tidal change and the resulting salinity. Over the last century, the Mississippi River Basin has undergone rapid urbanization and land-use change, severely impacting terrestrial loading and transport of carbon [18,36]. Large wetland and forest areas have been converted into urban and agricultural regions across the Mississippi Basin. These landscape changes have increased runoff and nutrient addition from wastewater effluent and agricultural fertilizers to the Mississippi River [32,43]. The lower portion of the Mississippi River has been heavily engineered to run through a series of levees, effectively cutting the river off from its floodplain. This modification has increased the speed of carbon transport, resulting in less organic carbon being stored along the rivers banks [44,45]. The faster rate of transportation has also decreased the time for organic carbon to be oxidized to CO2 on this route, increasing overall organic carbon export [45].
Climate conditions in this region are humid and subtropical, with hot and humid summers and mild winters rarely reaching sub-freezing temperatures. Our study location is in a 16 km straight shot of the river, where the water is well mixed. According to a river channel study of the Mississippi River by Wang and Xu [46], the average width of the Mississippi River at Baton Rouge was about 1200 m and the average depth at the location was 10 m. Our sampling location was on a local barge approximately 80 m into the river, where conditions were turbulent and under constant flow.
We conducted monthly and bi-weekly in situ measurements at the sample site between January and December of 2021 (Figure 1). Our sample schedule ensured we collected all samples and measurements between 9:00 and 9:30 AM Central Standard Time (CST). During each sampling trip, we took in situ measurements of partial pressure of carbon dioxide (pCO2) (C-SenseTM sensor Turner Designs, San Jose, CA, USA) and measured dissolved oxygen (DO), water temperature, conductivity using a YSI 556 multi-probe meter (YSI Inc., Yellow, Springs, OH, USA). NO2 + NO3 concentrations were taken from USGS gauge station # 07374000 (https://waterdata.usgs.gov/nwis/uv?site_no=07374000, accessed on 31 July 2022), choosing an hourly reading closest to our sample time. We collected water samples approximately 80 m from the riverbank in well-flowing river water. Samples were taken approximately 30–50 cm below the surface using a grab sampler.
Each trip, the grab sampler was rinsed three times with river water, in addition to rinsing the acid rinsed HDPE sample bottle three times with river water. Once thoroughly rinsed, we collected a composite sample consisting of three individual water samples into the HDPE sample bottle. We then filtered river samples into a precleaned 40 mL glass vial using a 0.2 µm filter with a capped pierceable lid and immediately placed the sample on ice. Following the sample, trip samples were placed in a fridge until delivered to LSU Wetland Biogeochemistry Analytical Services (WBAS) laboratory in Baton Rouge LA, United States for DIC and DOC analysis. Water samples were analyzed using a Total Organic Carbon Analyzer (TOC-L CHS/CSN Shimadzu, Kyoto, Japan) using the 680 °C combustion catalytic oxidation method with nondispersive infrared sensor (NDIR) detection. The instrument was calibrated using TC and IC standards, TOC was then calculated from the TC (Total Carbon) and IC (Inorganic Carbon) concentrations.
We calculated the mass flux of DIC and DOC using supplemental discharge data from USGS# 07374000. We multiplied discharge data by average monthly DIC and DOC concentrations to determine annual total DIC and DOC mass loadings (Lannual) in tera grams per day (Tg/d). Average monthly DIC/DOC concentration values were assumed to represent the month due to the frequency of samples:
whereby Ldaily is the daily load of sampled DIC and DIC from each sample date (Tg C d−1). Qdaily is the total daily discharge (km3 d−1) of each sample date in each month. Q is the average total discharge of a given sample month (km3 mo−1) CO2 outgassing (FCO2 in mmol CO2 m2 h−1) estimates between the river and air were calculated using the following equation from Cai and Wang [47]:
KT is the gas transfer velocity (m/d), we elected to use 3.9 as was consistent with a recent study conducted at the same location by Reiman and Xu [39]. The value is slightly higher than 3.0 found by Raymond et al. [5] for 10th order streams. However, as gas transfer velocity is highly variable and not well constrained, we elected to remain consistent with previous finding confirmed by Dubois et al. [48]. We calculated KH using the following equation developed by Weiss [49]:
T is the water temperature in kelvin and constants , , , , B2, and are given to be = −58.0931, = 90.5069, = 22.2940, = 0.027766, B2 = −0.025888, = 0.0050578. S is the salinity, which was assumed to be 0 as the Mississippi River is considered freshwater. pCO2 water is the value measured using the C-Sense sensor (Turner Designs, San Jose, CA, USA). Due to damaged equipment during the summer month, we used a regression model (r2 = 0.792) shown below to account for three pCO2 readings during June and July. Where is river discharge (m3 s−1) at the time of sampling (09:00 CST) and DO is recorded dissolved oxygen at time of sampling (mg L−1).
pCO2 air was assumed to be 410 µatm for all calculations; however, due to the local oil refinery and infrastructure, atmospheric CO2 at Baton Rouge can often be higher than average conditions. While temporal changes in atmospheric CO2 are known, a constant value was assumed for all calculations of FCO2.
Discharge data were averaged into monthly means for flow-weighted mass export calculations. A Pearson’s correlation matrix was used to look for significant (p < 0.05) correlations across the overall data, specifically between carbon measurements and ambient water parameters. Linear regressions were used for modeling the relationships between carbon measurements and river discharge and temperature across the entire study. With seasons as factors, a one-way analysis of variance (ANOVA) was chosen to determine if seasonal variation occurred across any of our carbon data or highly correlated variables. All ANOVAs were followed by a post hoc Tukey test to determine the significant differences across factors of the ANOVA. While some data management and organization were done using Microsoft Excel, all statistical analysis was done in R version 4.2 and ran in R studio (Boston, MA, USA).
3. Results
3.1. River Discharge and Ambient Conditions
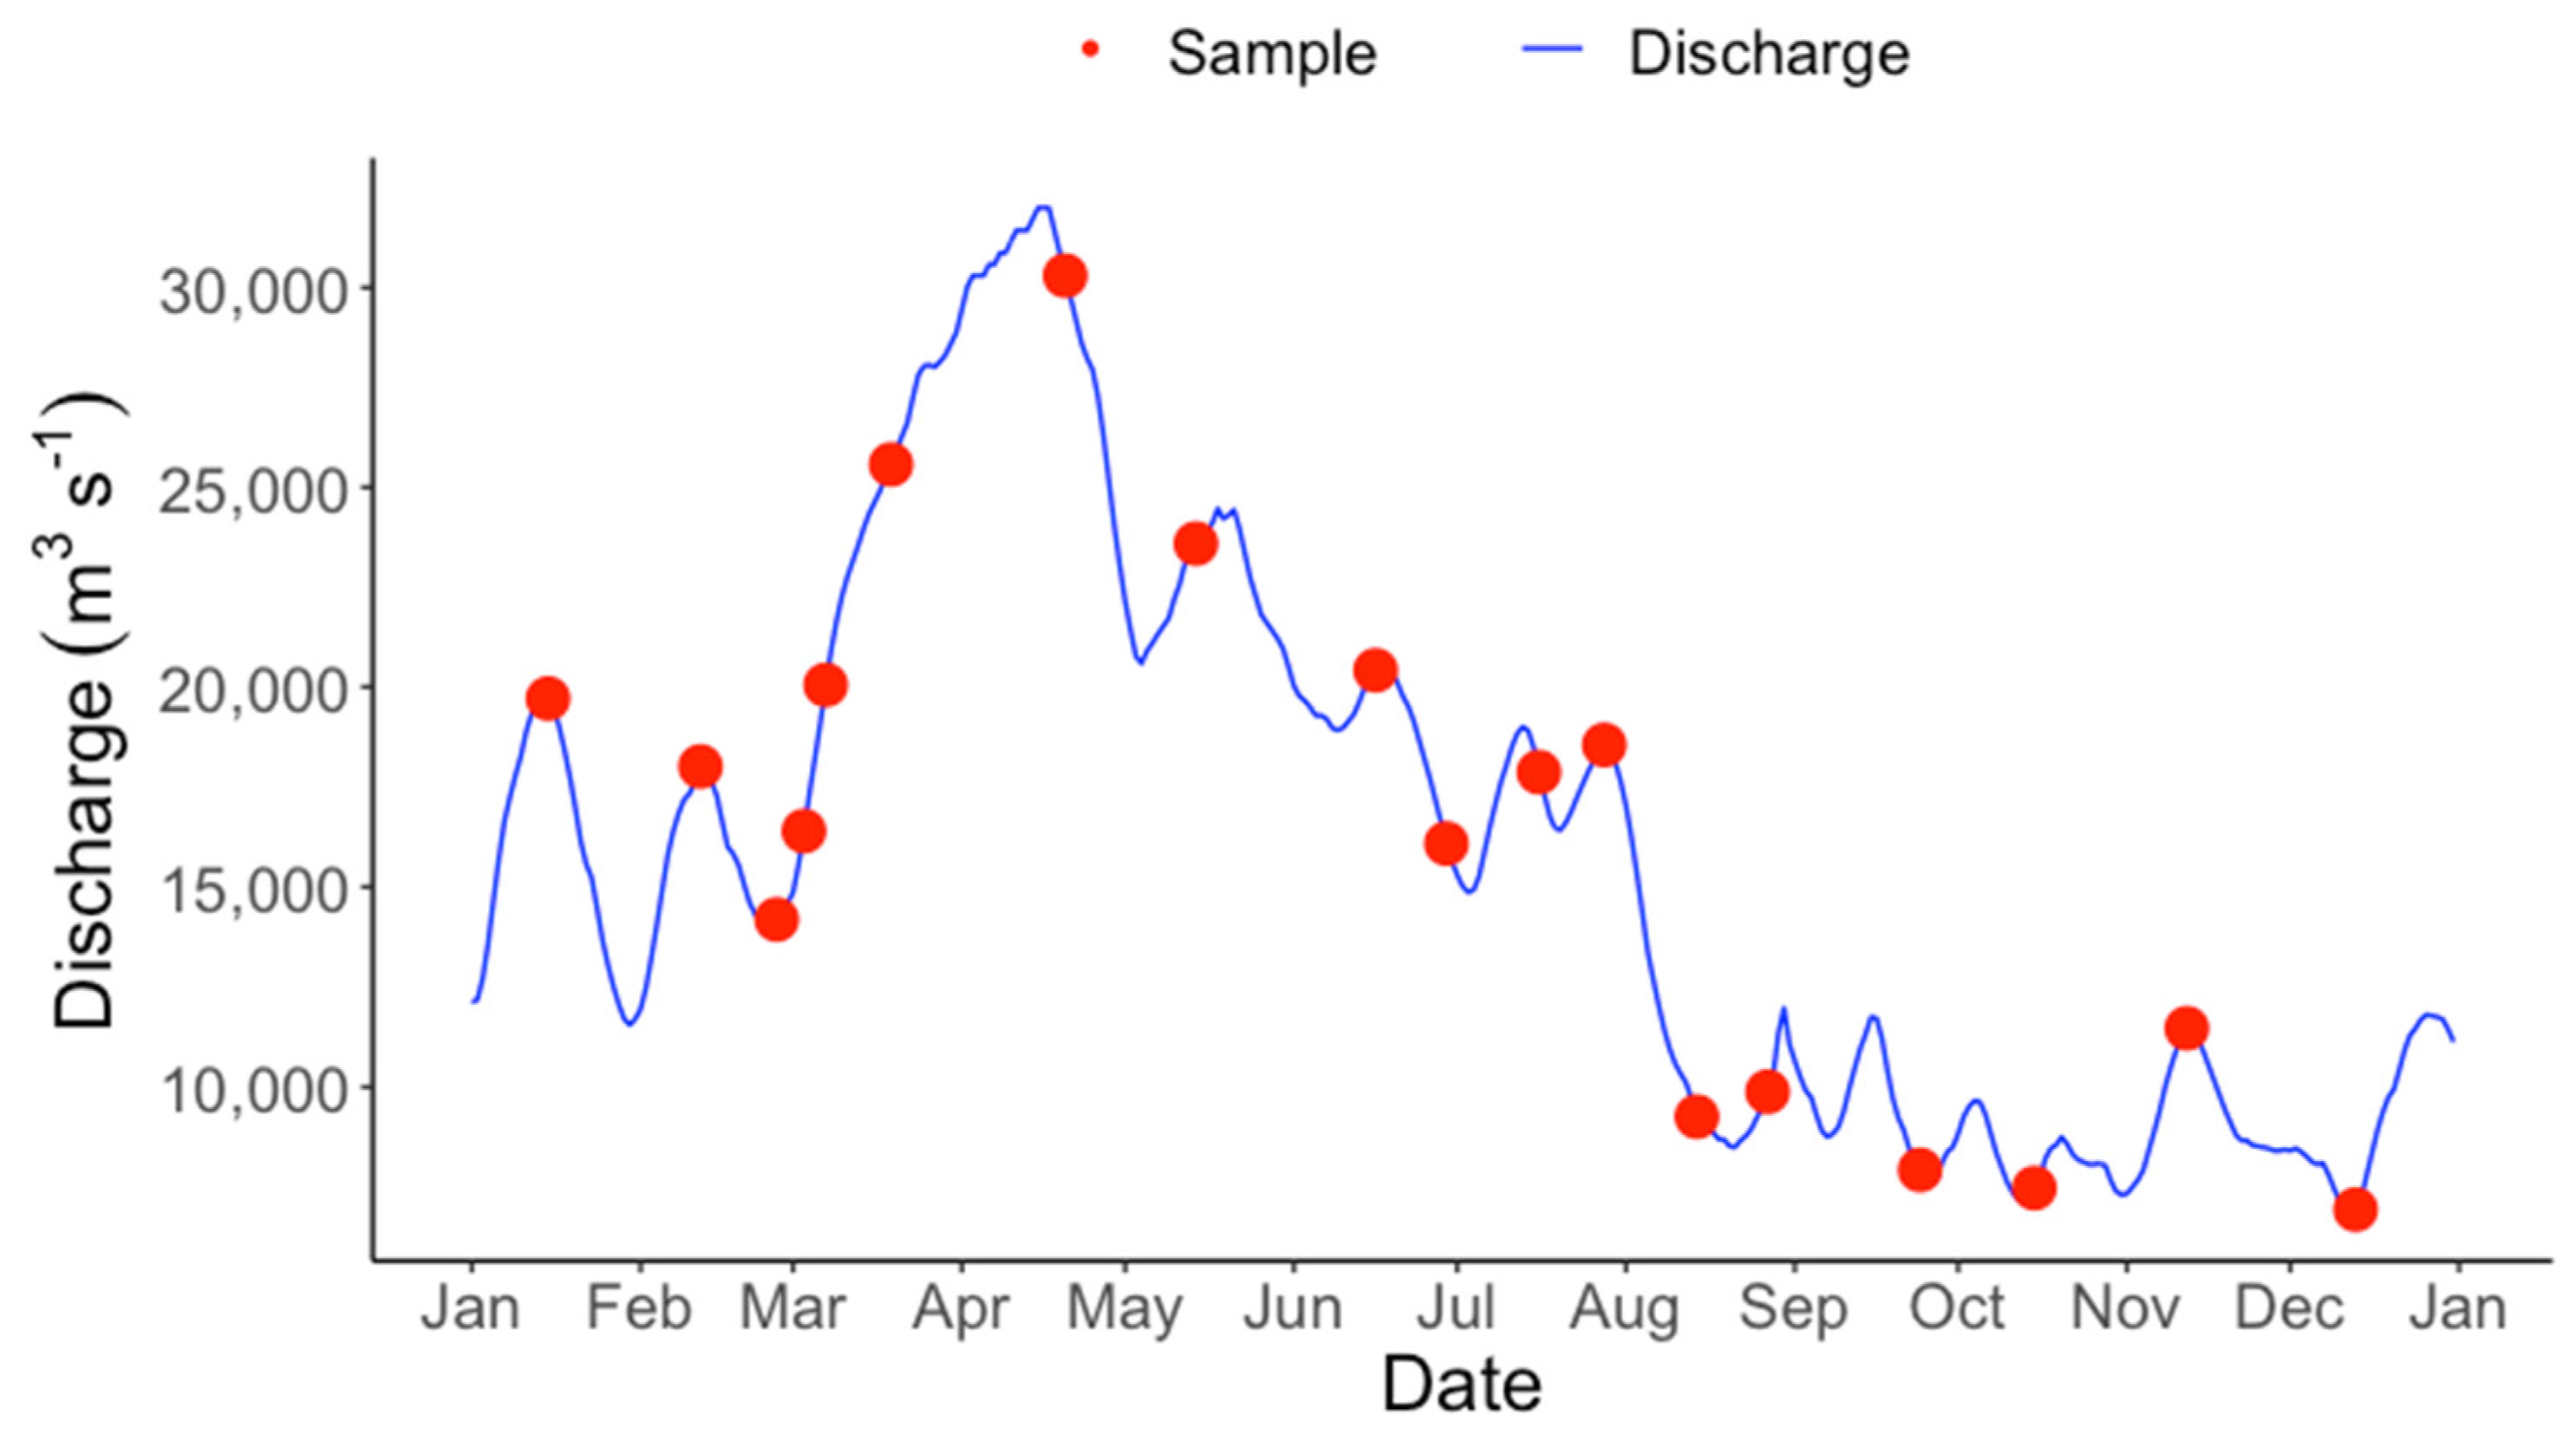
During the study period from January 2021 through December 2021, discharge of the Mississippi River at Baton Rouge (USGS# 07374000) averaged 15,852 m3 s−1 (Std. Dev, ± 6897 m3 s−1). Discharge ranged from a maximum of 31,998 m3 s−1 in April to a low of 6909 m3 s−1 in December (Figure 1). Spring flow was highest during the study year accounting for 37.3% of total annual discharge. Comparatively, summer, fall, and winter, 19.9%, 14.2%, and 28.6% of annual discharge. Discharge during 2021 was on average 6% lower than the previous 16 years at the same site (16,859 ± 8247 m3 s−1).
Annual mean water temperature in the Mississippi River at Baton Rouge in 2021 (18.76, ±8.48 °C) was nearly identical to the previous 12-year average from 2008–2020 (18.31, ±8.68 °C). While mean temperature was consistent with previous years, a seasonal breakdown revealed increased temperature variability (Table 1). The 12-year mean water temperatures during spring (21.0 °C) and summer (28.7 °C) were both 1 °C higher in this study. Long term averages for fall (15.4 °C) and winter (8.1 °C) deviated more drastically with winter temperatures 16% lower (6.82, ±3.18 °C) and fall 28% higher (19.7, ±7.09 °C) than previous years. Fall water temperature remained above 10 °C for the entire season for the first time in the past decade, stressing the rising temperatures and unique weather of this study. River temperature ranged from a three-decade low of 2.3 °C in mid-February to a high of 30.5 °C in late July. Water temperatures were considerably lower in February following a disturbance in arctic oscillation resulting in a drastic temperature drop across the Mississippi River Basin which brought water temperatures to a near record low. With seasonal water temperatures on average greater during our study period it is of note that the previous 12 years have shown an already increasing trend in water temperature.
Other ambient parameters also showed seasonal differences. Dissolved oxygen concentration was highest in the winter season averaging (11.4 ± 1.3 mg L−1) and lowest in the summer at (6.2 ± 0.4 mg L−1) (Table 1). cDOM (61.47, ±12.04 AFU) and NH4 (88.64, ±19.32 AFU) showed a slight increase in the summer months following a spike in discharge in mid-July. Chlorophyll-a (230.62, ±45.02 AFU) and phycocyanin (127.32, ±29.08 AFU) where highest in the winter season correlating positively with low temperatures and high turbidity (92.85, ±36.55 NTU). NO3+NO2 concentrations were significantly correlated to river discharge across our study period (r2 = 0.29, p < 0.05). Concentrations of NO3+NO2 were highest during the spring season (1.15 ± 0.18 mg L−1) and lowest during the late summer (0.82 ± 0.41 mg L−1).
3.2. Seasonal Trend of DIC and DOC Concentrations
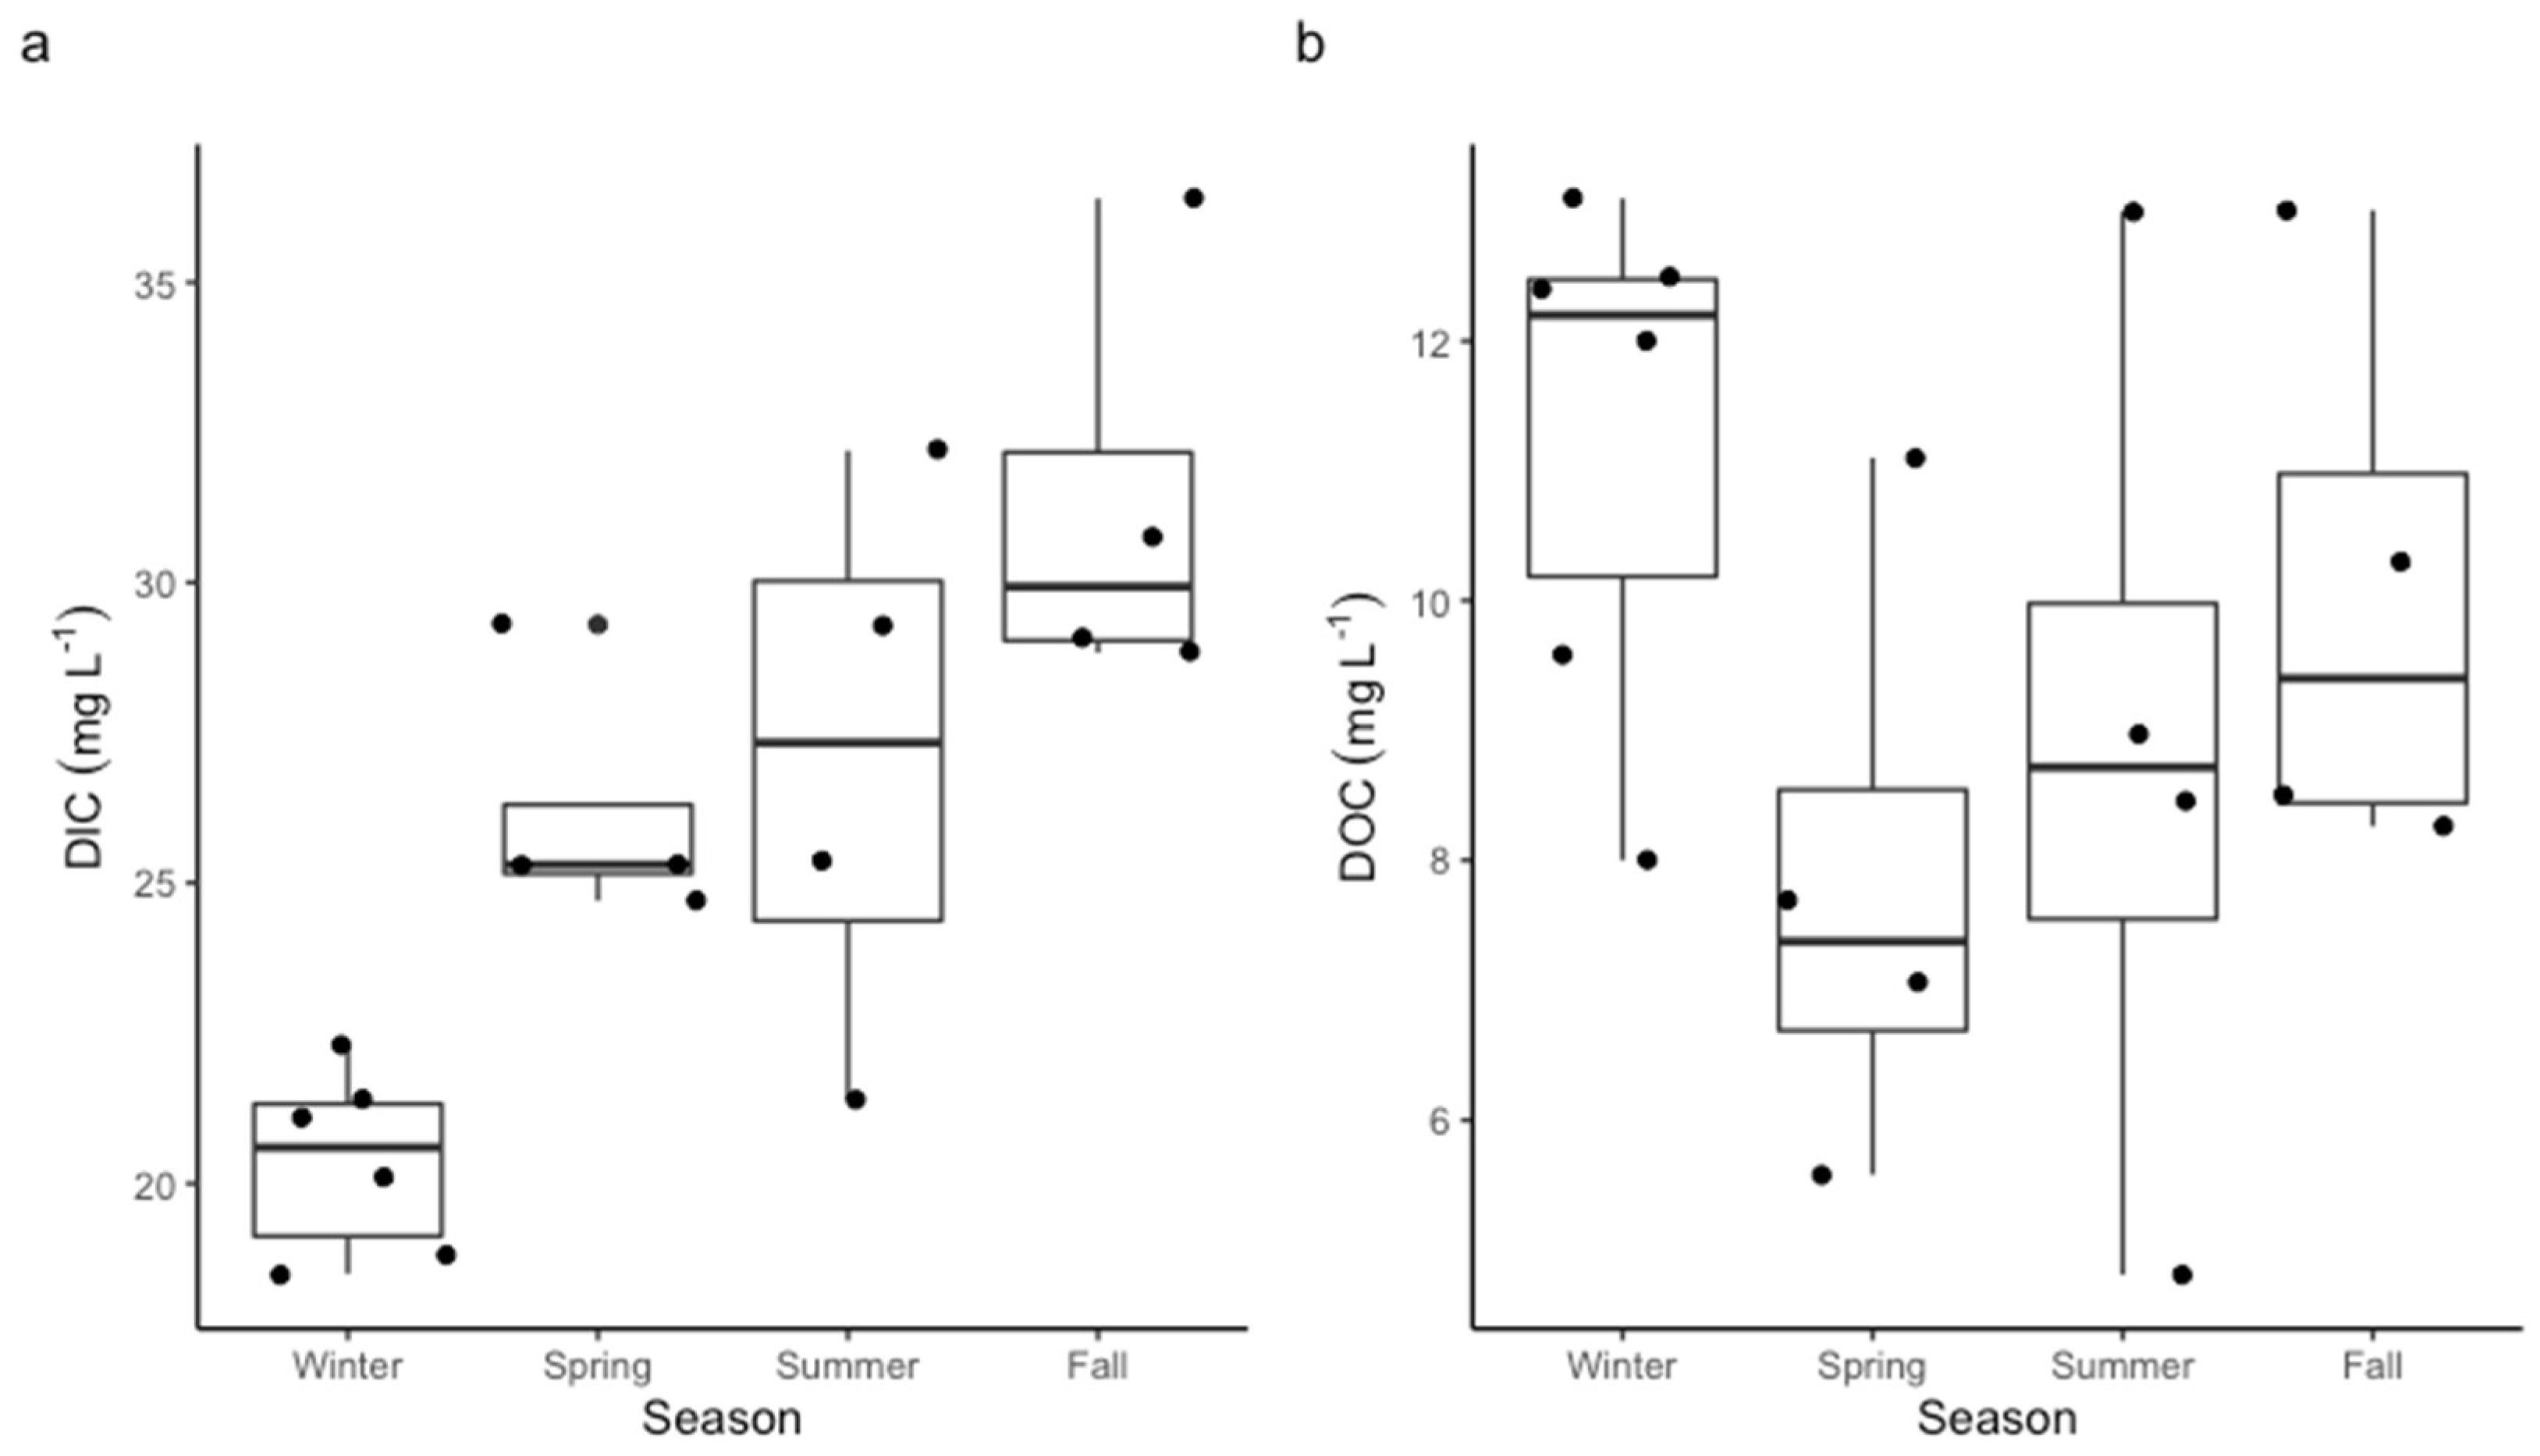
Mean concentrations of dissolved organic and inorganic carbon had a strong seasonal distribution within the Mississippi River. DIC concentrations increased throughout the year from a minimum average in the winter at (20.4 ± 1.5 mg L−1) (standard deviation) rising steadily through the spring and summer to a mean fall concentration of (32.0 ± 3.9 mg L−1) (Table 2). DOC concentrations inversely were highest in the winter months, correlating significantly with the low winter temperatures (p < 0.05). Discharge was significantly and inversely correlated with DIC concentrations (p < 0.05). Based on a one-way ANOVA and post hoc Tukey test, DOC concentration had no significant seasonal concentration variation. While not significant, DOC did decrease in the spring and summer with rising discharge and temperatures. Meanwhile, DIC displayed a significant difference in mean concentration between winter and the remaining three seasons (Figure 2).
The DIC: DOC ratio within the Mississippi River increased steadily throughout the year from a low in March (1.4) directly following the cold winter event to a high (6.1) in late August following a month-long heatwave with temperatures averaging >29 °C. The ratio of DIC: DOC remained below 2.0 for one of the winter samplings dates (19 March), which was on the latter end of the season when temperatures and discharge of the river had begun to rise. The ratio remained above 2.0 for the remainder of the year aside from one sample point in July following a two-week period where river discharge rose 30%.

Table 2.
DIC, DOC, NO3 and NO2 and river discharge across all sample dates.
| Sample Date | DIC mg L−1 | DOC mg L−1 | NO3 + NO2 mg L−1 | Q m3 s−1 |
|---|---|---|---|---|
| 15 January 2021 | 18.8 | 9.58 | 0.98 | 19,708.53 |
| 12 February 2021 | 20.1 | 12.4 | 1.06 | 18,009.51 |
| 26 February 2021 | 22.3 | 12.5 | 1.09 | 14,186.74 |
| 03 March 2021 | 21.1 | 12 | 1.04 | 16,395.45 |
| 07 March 2021 | 18.5 | 13.1 | 0.92 | 20,048.33 |
| 19 March 2021 | 21.4 | 8 | 1.11 | 25,570.11 |
| 20 April 2021 | 25.3 | 5.58 | 1.15 | 30,299.03 |
| 14 May 2021 | 24.7 | 7.06 | 1.16 | 23,587.93 |
| 16 June 2021 | 25.3 | 7.69 | 1.37 | 20,416.45 |
| 29 June 2021 | 29.3 | 11.1 | 0.93 | 16,083.97 |
| 16 July 2021 | 21.4 | 13 | 1.37 | 17,867.93 |
| 28 July 2021 | 25.36 | 8.97 | 1.09 | 18,547.53 |
| 14 August 2021 | 32.2 | 8.46 | 0.7 | 9259.61 |
| 27 August 2021 | 29.3 | 4.81 | 0.37 | 9882.58 |
| 24 September 2021 | 29.1 | 8.5 | 0.56 | 7928.72 |
| 15 October 2021 | 30.76 | 10.3 | 0.6 | 7475.65 |
| 12 November 2021 | 28.83 | 13.01 | 1.12 | 11,468.32 |
| 13 December 2021 | 36.4 | 8.26 | 1.24 | 6937.63 |
3.3. Seasonal Variation in Partial Pressure and Outgassing of CO2
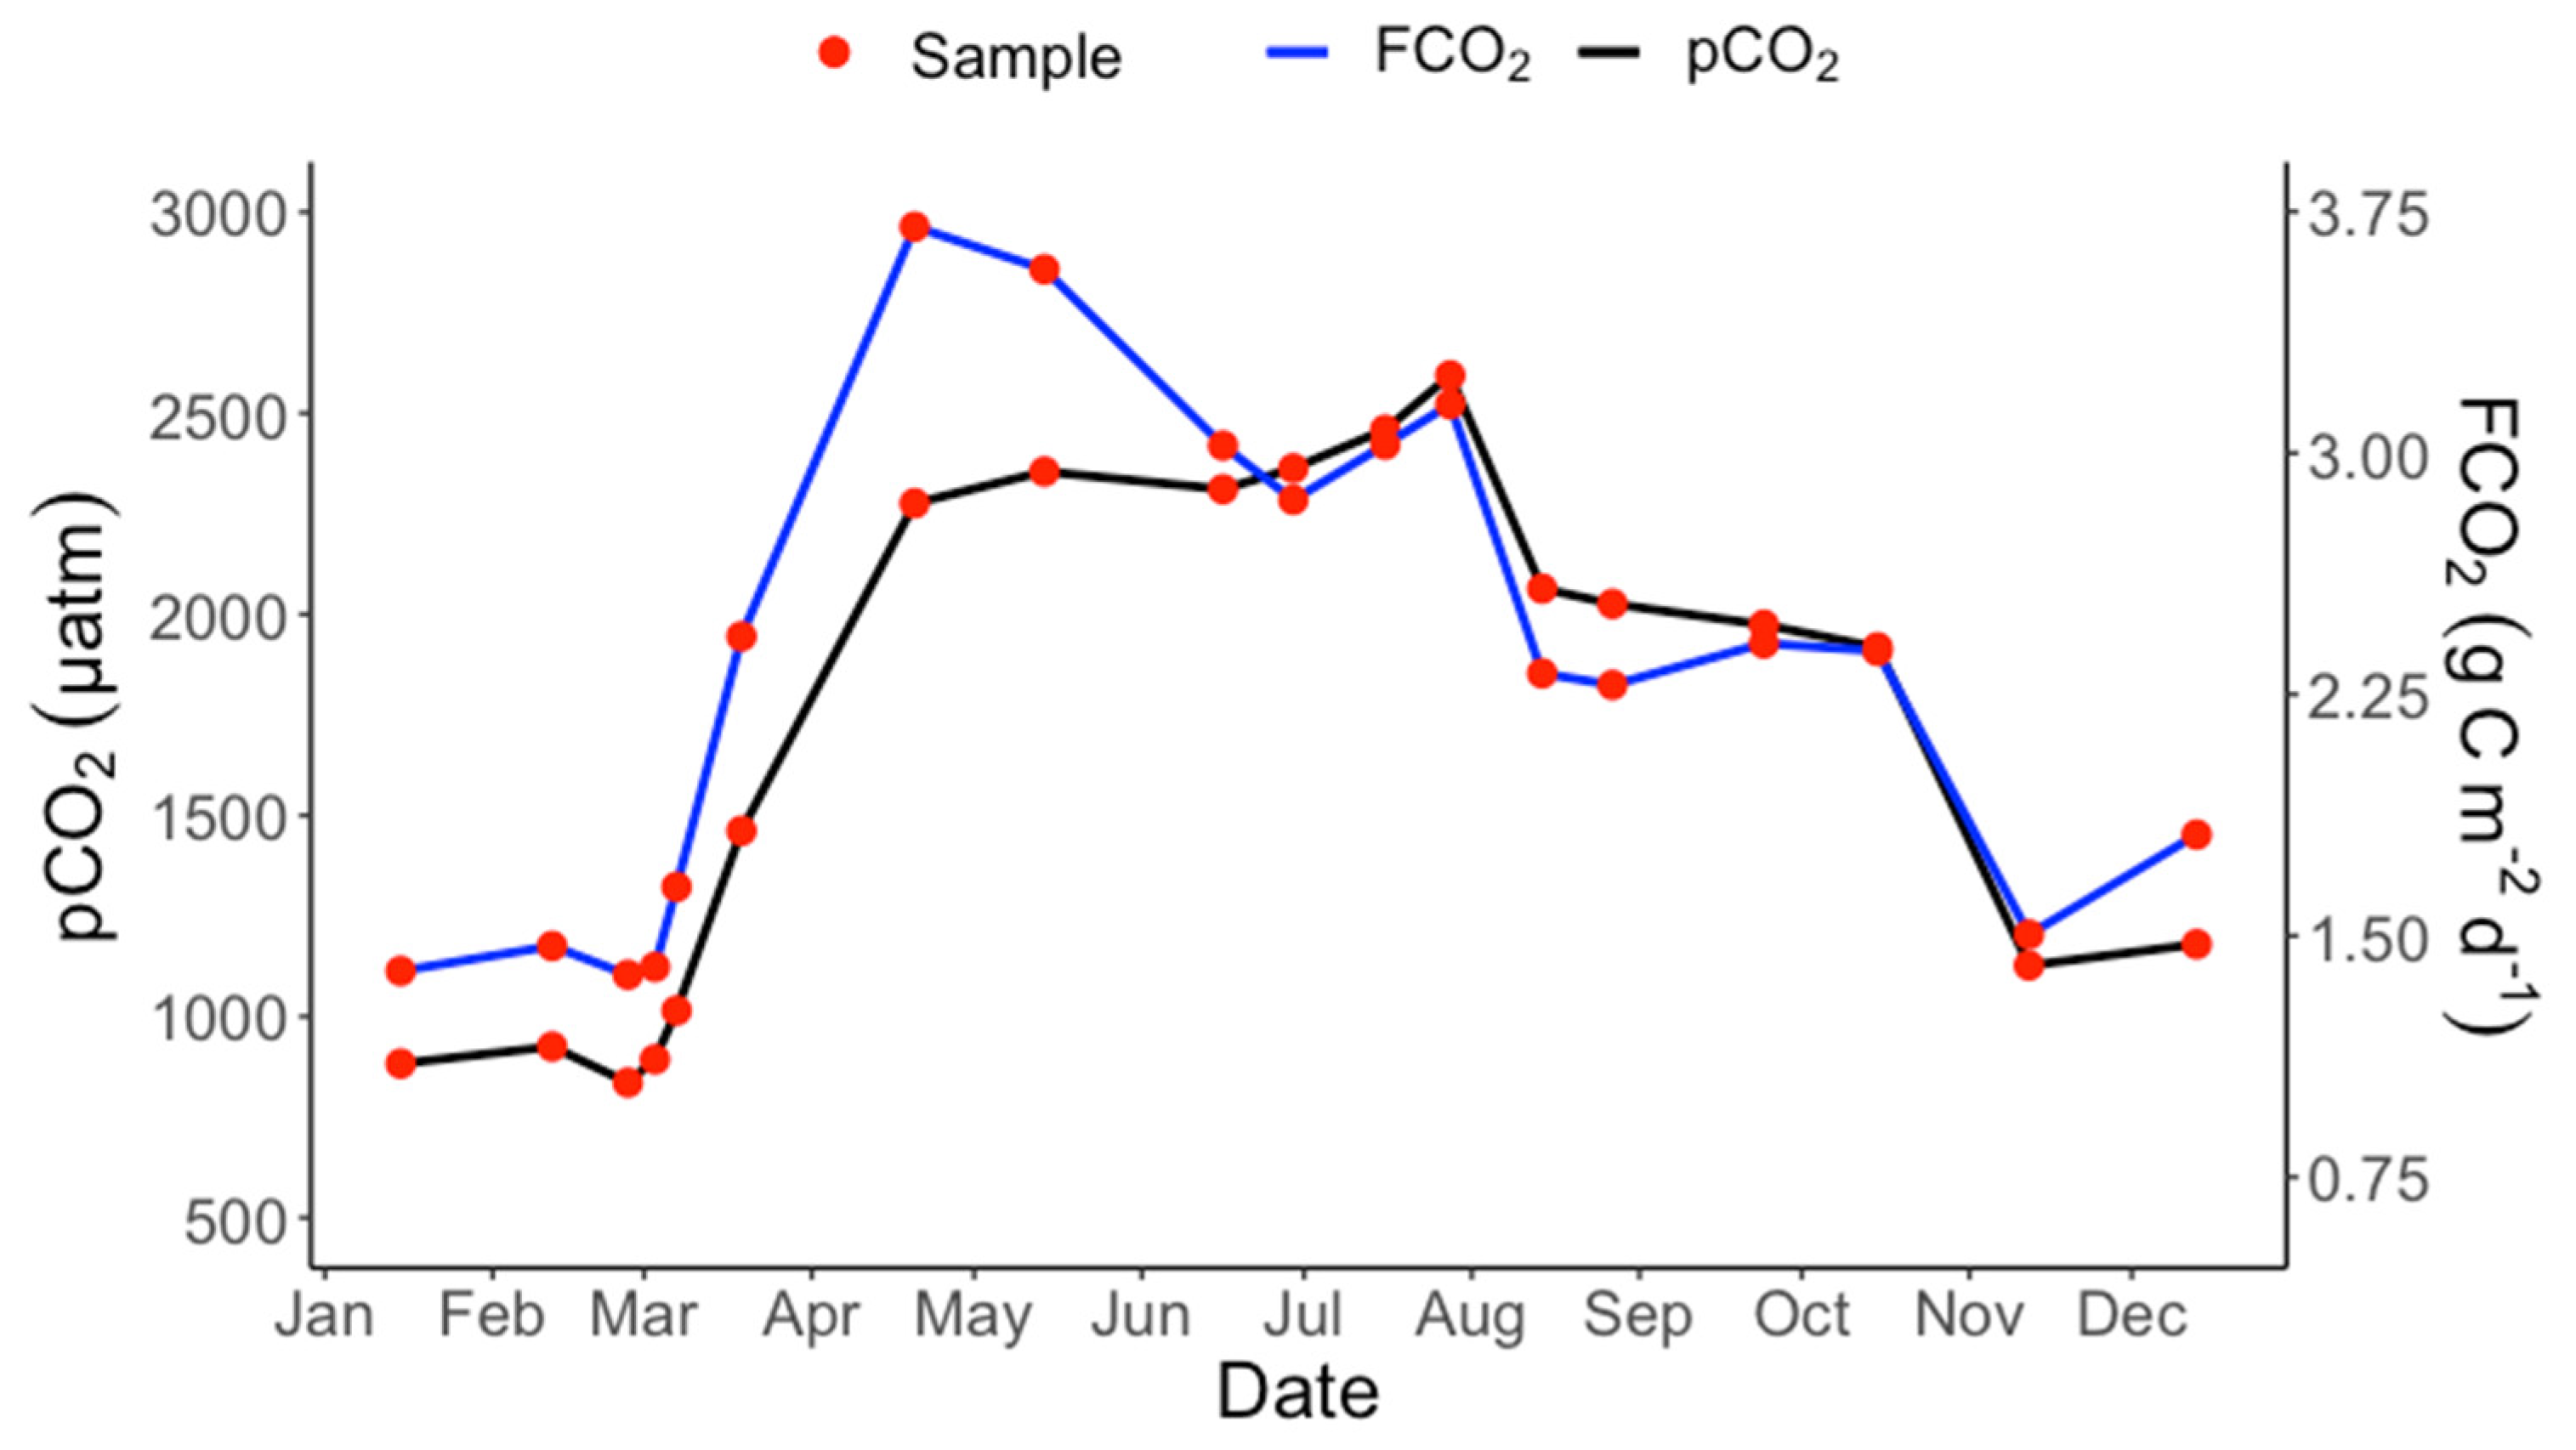
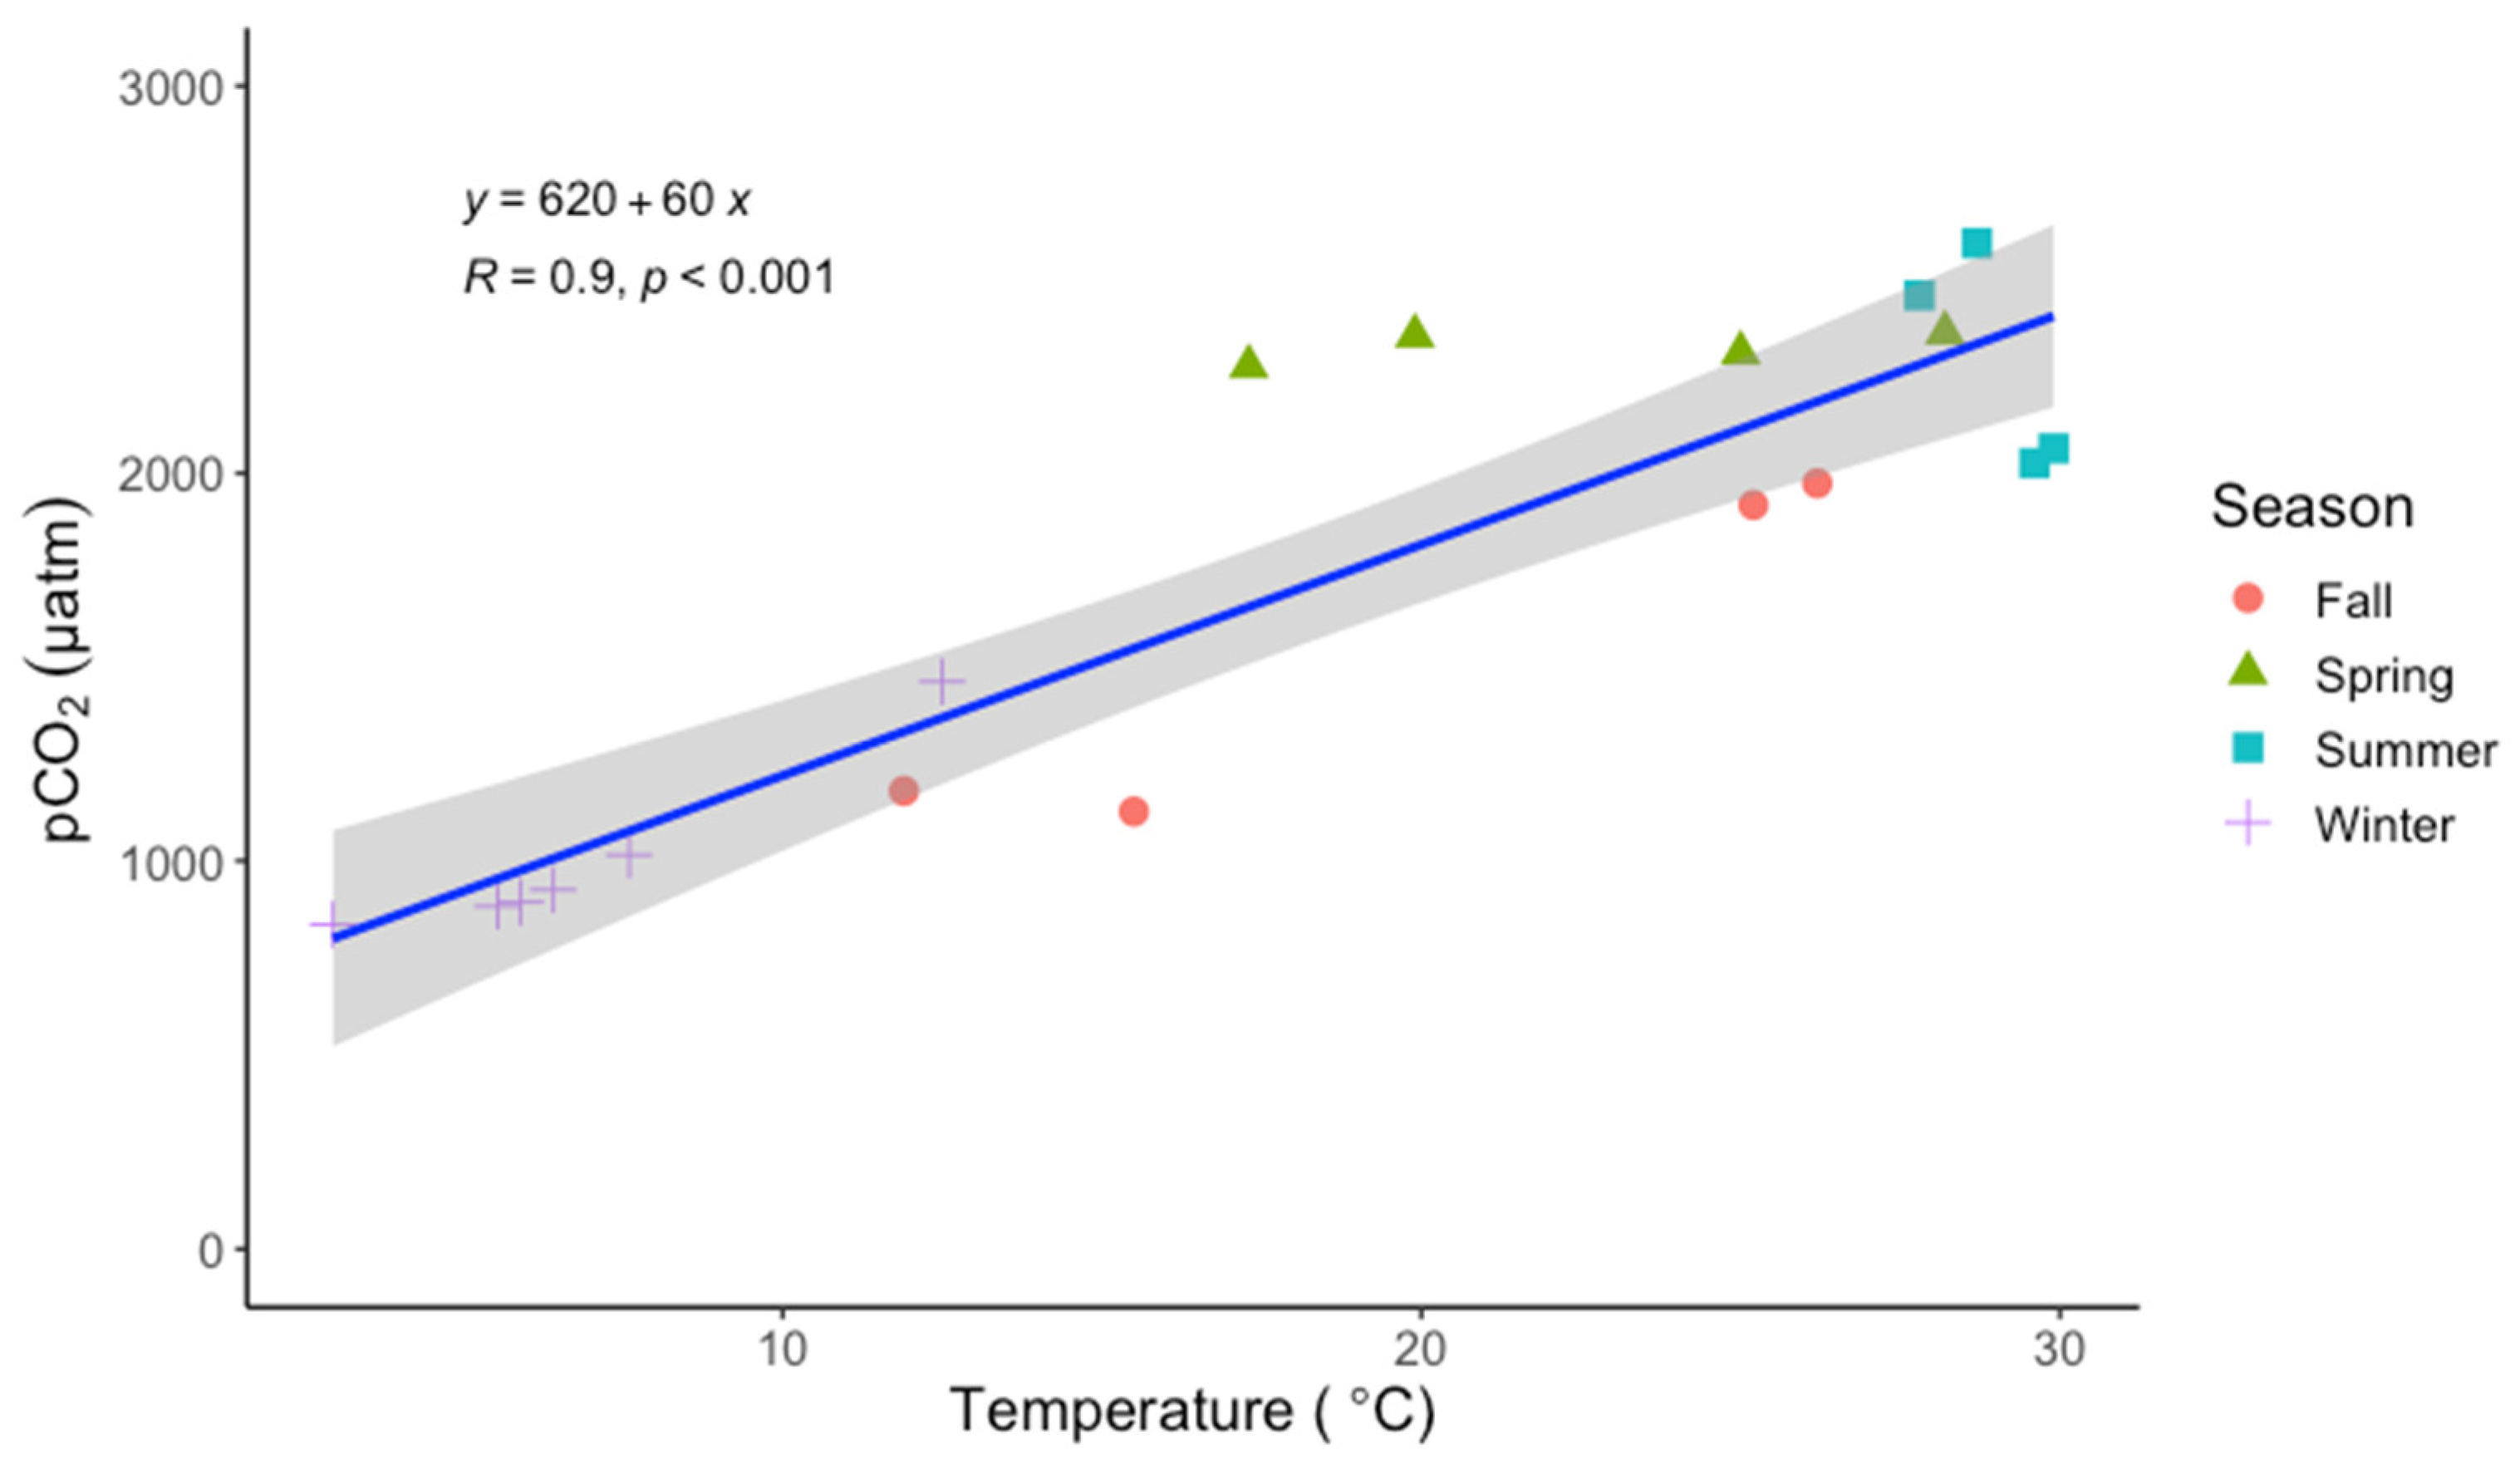
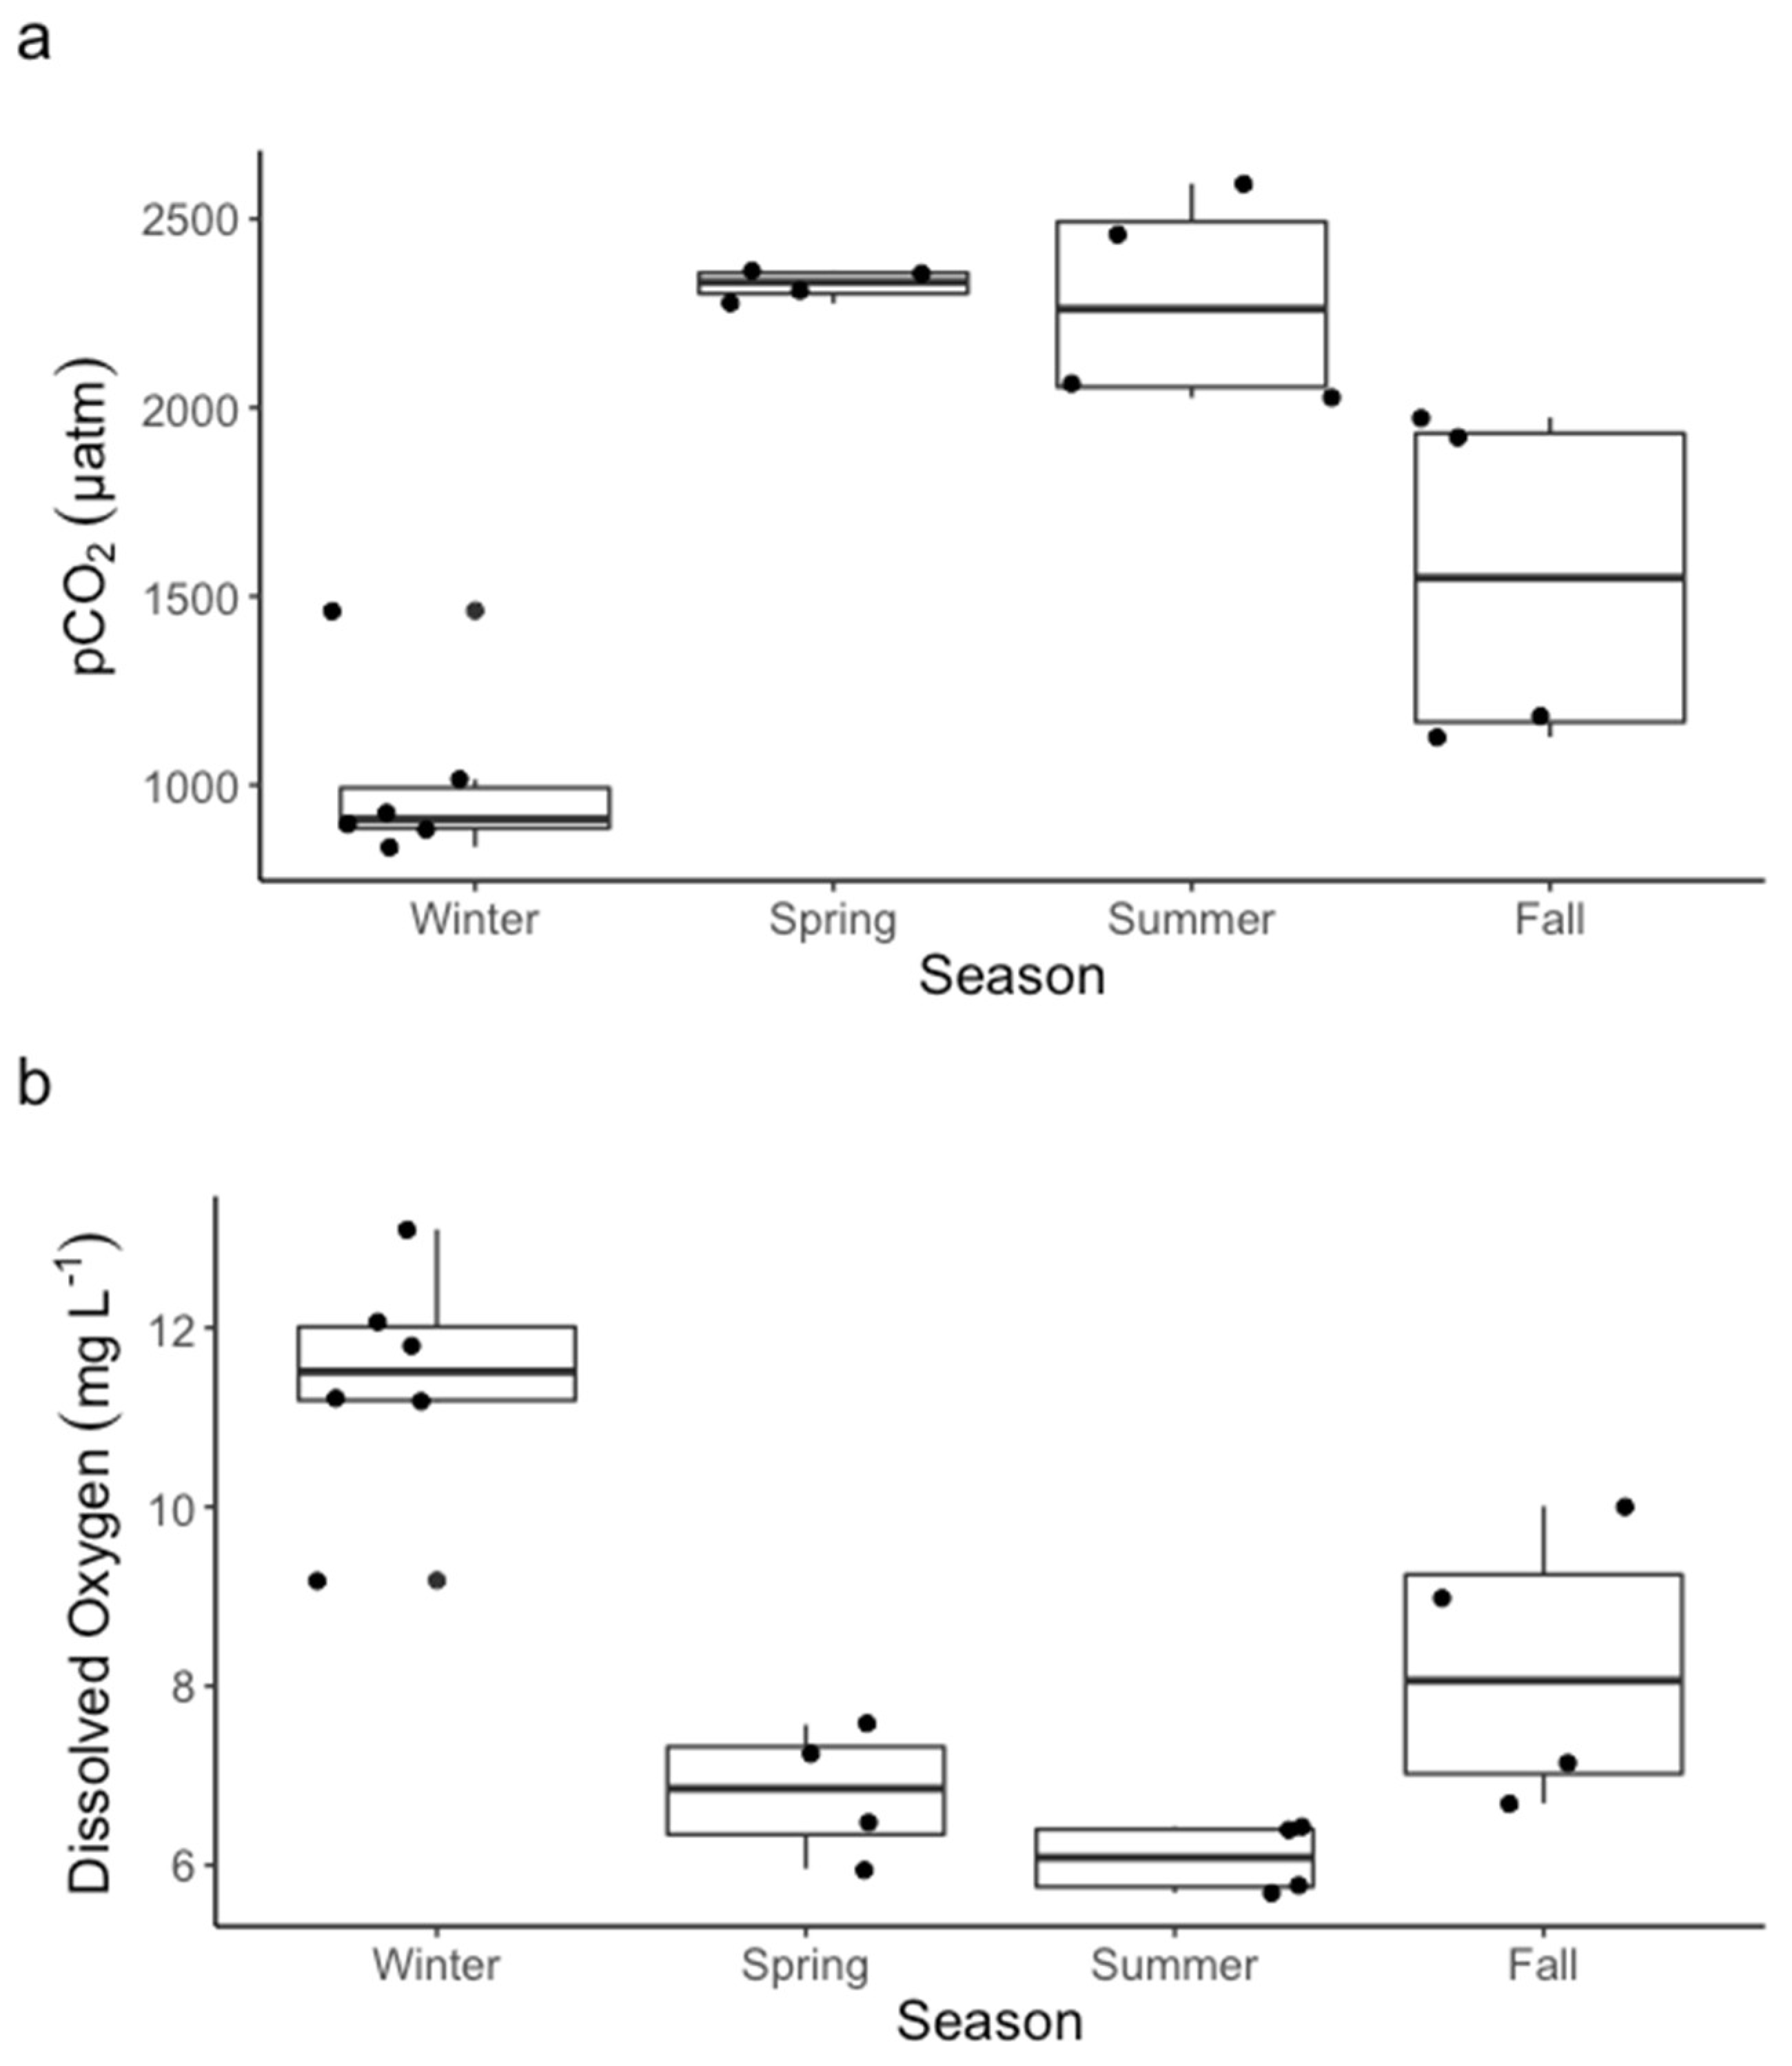
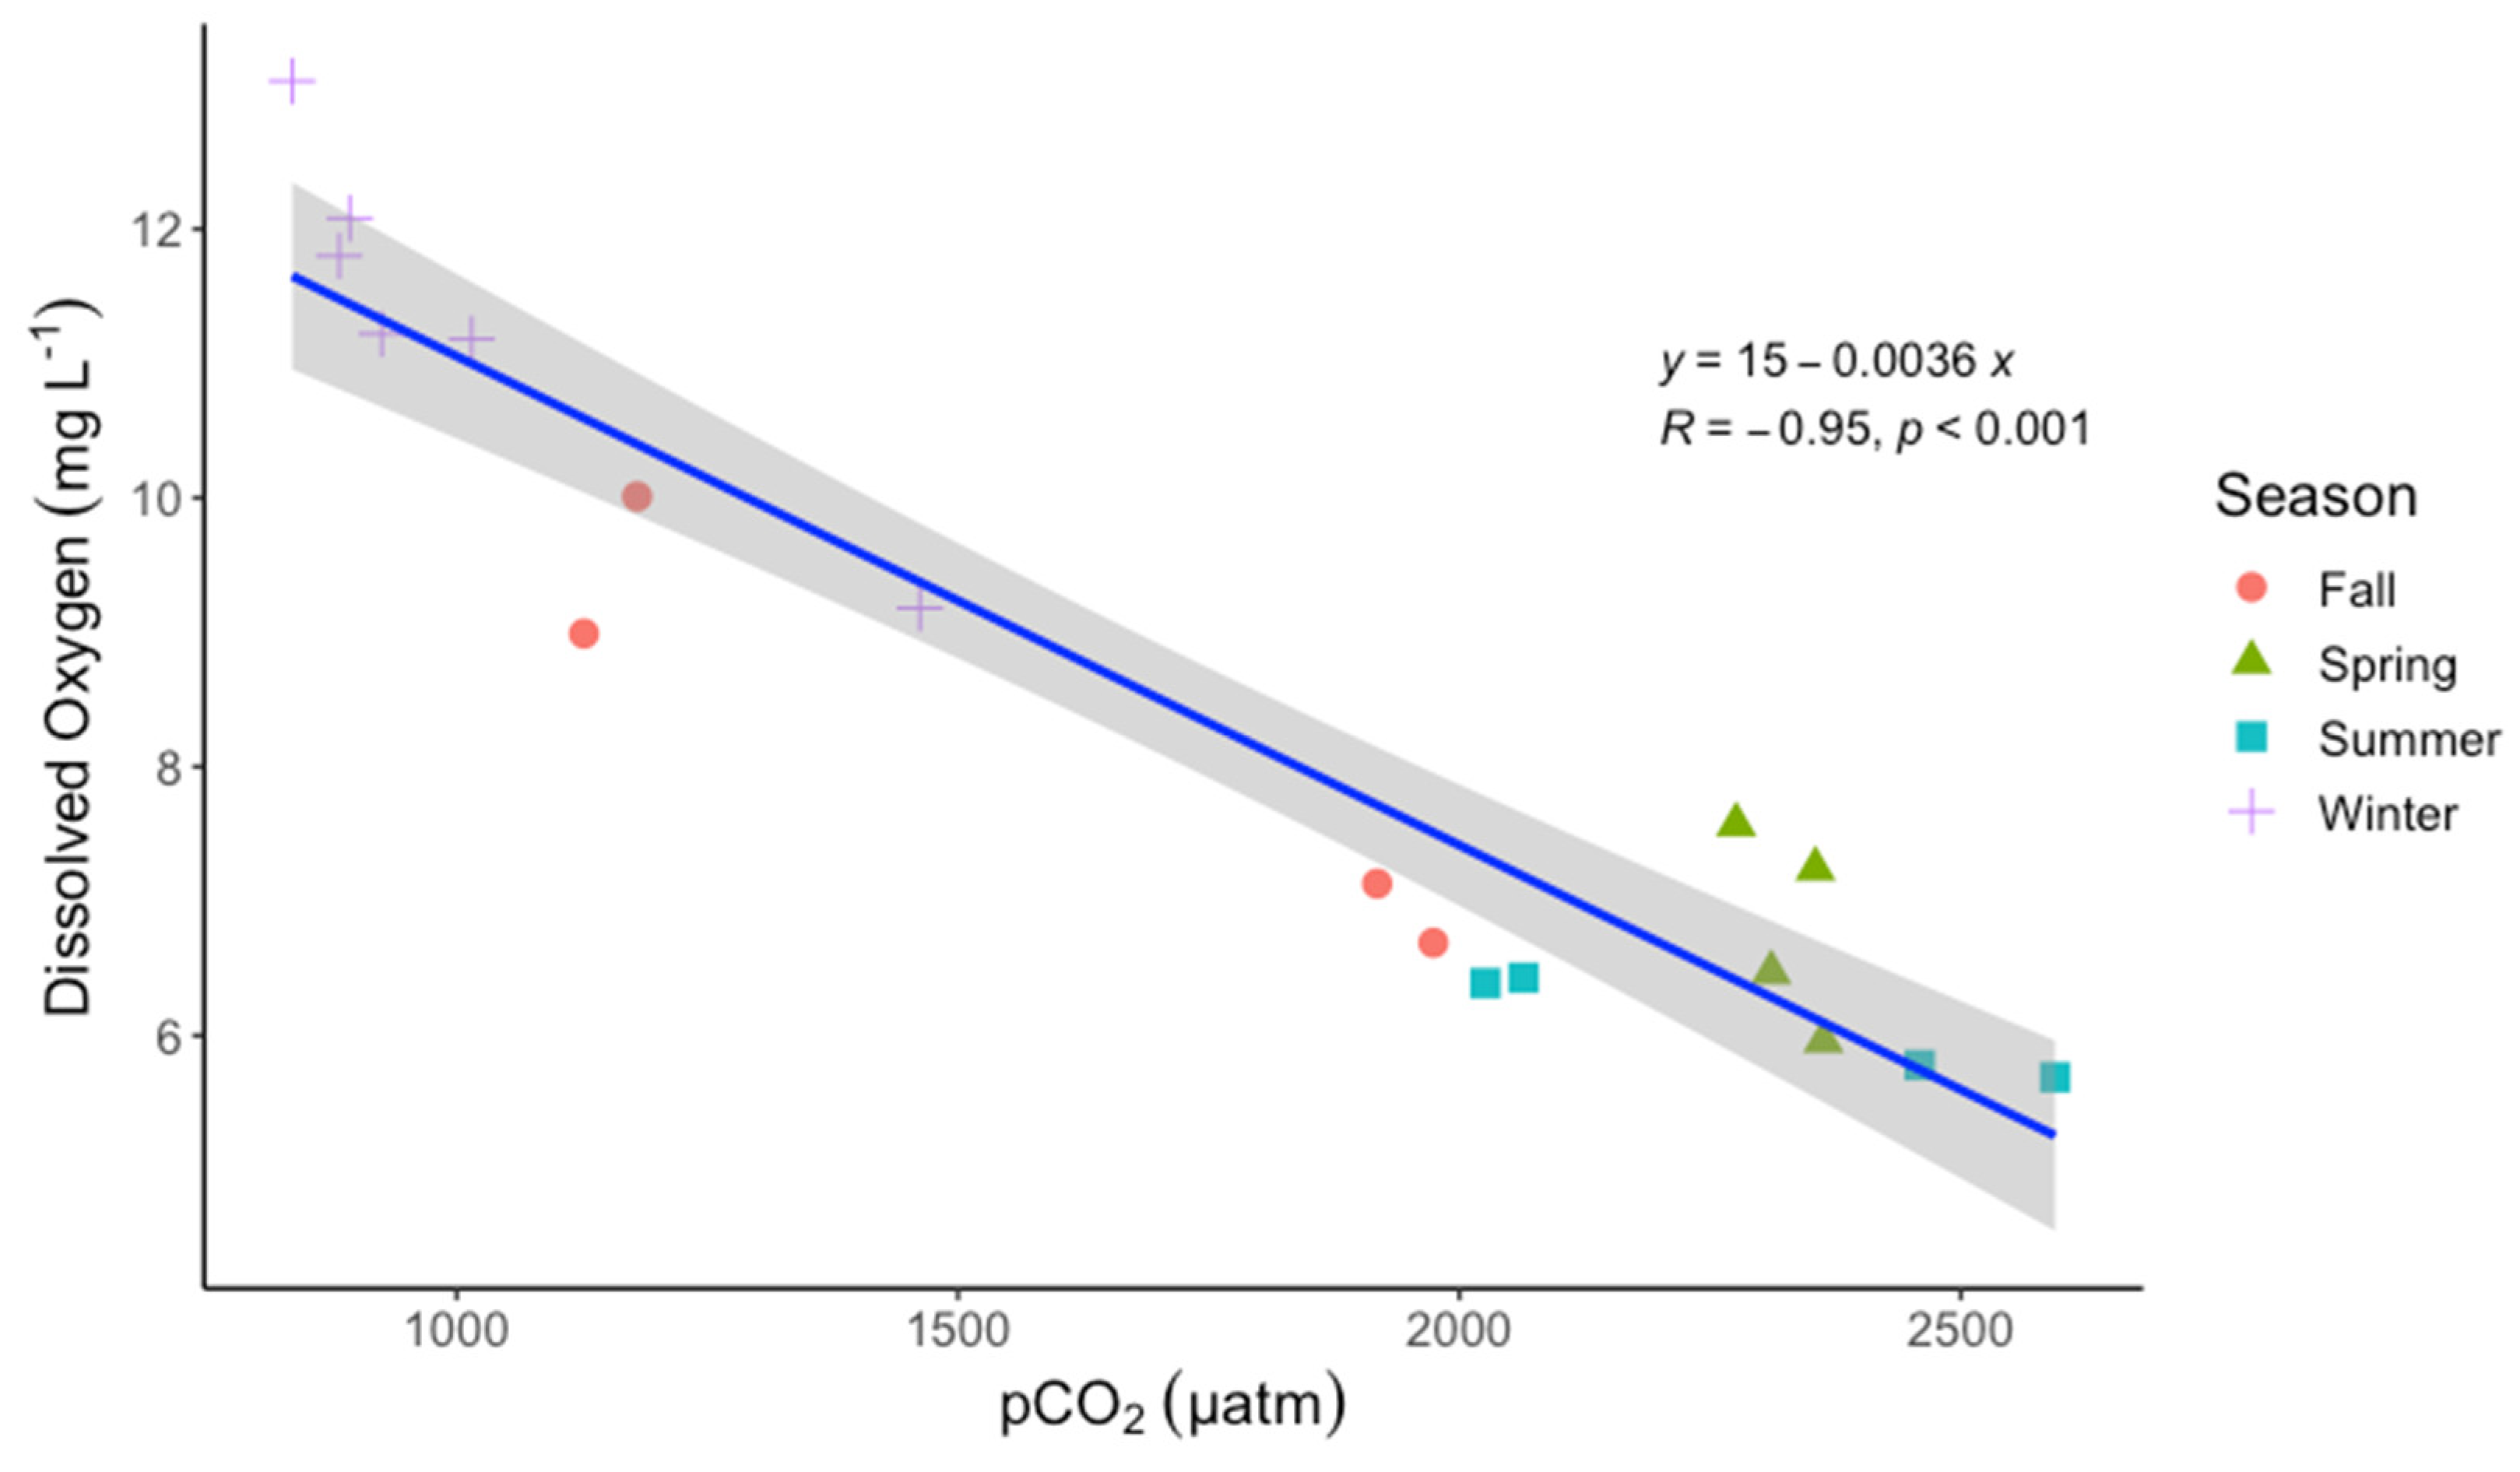
The partial pressure of CO2 in the Mississippi River was supersaturated with respect to the atmosphere (greater than 410 µatm) across all 18 sample dates, averaging (1703 ± 646 µatm, Figure 3). pCO2 varied widely across seasons rising from low winter (1002 ± 233 µatm) concentrations to a high in the spring (2326 ± 40 µatm) summer (2223 ± 283 µatm) then steadily declining into the late fall (1408 ± 442 µatm). pCO2 reached a low of 836 µatm directly following a drop in water temperature to near record low of 2.3 °C. pCO2 was near twice the winter concentration in all other seasons. pCO2 had a significant and positive correlation with water temperature and inverse relationship with DO (p < 0.05, Figure 4 and Figure 5). Dissolved oxygen correlated negatively and significantly with pCO2 (p < 0.05, Figure 6) and positively with Chlorophyll-a (p < 0.01, Table 2). River turbidity, Chlorophyll-a and cyanobacteria presence were all highest in the winter season at 92.85 NTU, 230.62 AFU and 127.32 AFU. These parameters saw a drastic decline in the spring season at nearly half their winter values.
Outgassing rates followed a similar trend to pCO2, averaging 2.32 ± 0.77 g m−2 d−1 and ranging from a winter low of 1.62 g m−2 d−1 to a spring high of 3.43 g m−2 d−1 (Figure 3). Rates remained much higher in the warmer spring and summer months, nearly double the winter, and fall. The highest rate of CO2 outgassing occurred in April 3.70 g m−2 d−1 in concurrence with the peak discharge of 31,998 m3 s−1 witnessed in our study.
In total, the Lower Mississippi outgassed 865 g C m−2 (Table 3) totaling 267.18 Gg C for the study year. The bulk of this occurred in the spring and summer, i.e., 169.92 Gg C (or 63.6%). Outgassing was calculated based on direct pCO2 measurements and water temperature which both followed a similar seasonal trend. The least amount of outgassed CO2 occurred in the winter season (43.28 Gg C) and this corresponded with low river temperature and pCO2.
3.4. Mass Export of DIC and DOC
During our study period, a total of 12.61 Tg of DIC was exported to the Northern Gulf of Mexico from the lower Mississippi River (Table 4). During this period the greatest export occurred in the spring at 37.9%. The lowest export was in the fall where only 18.1% (Table 3) of the annual load was exported. This ratio was nearly identical to that of the river discharge that accounted for 37.3% of annual flow in the spring compared with 14.2% in the fall. However, this was inverse when looking at concentration of DIC which increased throughout the year and was highest in the fall (32.0, ±3.9 mg L−1) (Figure 5).
Figure 5.
Boxplot of seasonal variation in riverine (a) pCO2; (b) Dissolved oxygen concentration. Dots showing sample points.
Figure 5.
Boxplot of seasonal variation in riverine (a) pCO2; (b) Dissolved oxygen concentration. Dots showing sample points.

Table 3.
Total mass export of dissolved inorganic carbon (DIC) dissolved organic carbon (DOC), CO2 outgassing (FCO2), and river discharge (Q). with seasonal percentage of the annual total.
Table 3.
Total mass export of dissolved inorganic carbon (DIC) dissolved organic carbon (DOC), CO2 outgassing (FCO2), and river discharge (Q). with seasonal percentage of the annual total.
| Season | DIC Tg | DOC Tg | FCO2 g C m−2 d−1 | Q km3 |
|---|---|---|---|---|
| Winter | 2.88 (22.8%) | 1.56 (34.5%) | 1.62 (16.2%) | 143.1 (28.6%) |
| Spring | 4.78 (37.9%) | 1.31 (28.9%) | 3.43 (35.9%) | 186.4 (37.3%) |
| Summer | 2.68 (21.2%) | 0.91 (20.1%) | 2.72 (27.7%) | 99.5 (19.9%) |
| Fall | 2.28 (18.1%) | 0.75 (16.5%) | 2.03 (20.3%) | 71.0 (14.2%) |
| Total | 12.61 | 4.54 | 864.6 | 500 |
During the same period the Mississippi River exported 4.54 Tg of DOC, about one 3rd the DIC load. DOC load (1.56 Tg) was greatest in the winter, accounting for 34.5% of the annual total (Table 3). DOC correlated significantly with both cyanobacteria and chlorophyl-a which were both significantly higher in the winter (p < 0.05) and nearly half in the drier and warmer fall months.
Table 4.
Comparison of previous studies of dissolved carbon and outgassing from the Mississippi River.
Table 4.
Comparison of previous studies of dissolved carbon and outgassing from the Mississippi River.
| Study Period | Q | DOC | DIC | pCO2 | FCO2 | |||
|---|---|---|---|---|---|---|---|---|
| Km3 yr−1 | Tg C yr−1 | µmol L−1 | Tg C yr−1 | µmol L−1 | µatm | g C m−2 yr−1 | Reference | |
| 2021 | 500 | 4.54 | 806 ± 218 | 12.61 | 2129 ± 419 | 1703 ± 646 | 864.6 | This Study |
| 2015–2018 | 548 | 3.95 | 607 ± 158 | 12.25 | 1782 ± 585 | 1500 ± 743 | 654 | [39] |
| 2009–2010 | 550 | 1.6 | 296 ± 54 | - | - | - | - | [50] |
| 2006–2008 | 457 | 1.88 | 307 ± 28 | 13.6 | 2421 ± 480 | - | - | [40] |
| 2000–2001 | 374 | 1.51 | 375 ± 42 | - | - | 1362 ± 267 | 1077 ± 407 | [48] |
| 1971–2000 | - | 2.6 ± 0.4 | - | 18.8 ± 3.4 | - | - | - | [33] * |
Note: * Findings based on simulated models.
4. Discussion
Our study took place during a year with significant seasonal variability. 2021 was one of the hottest years on record across the Mississippi River Basin and was above average in annual precipitation. Severe weather extremes throughout the year contributed to conditions being above the long-term average. One such example was intense variability in winter conditions as a severe weather event brought on by a destabilization of the polar vortex event provided much of the basin one of the coldest winters on record. Across the basin the bulk of the annual precipitation occurred in the spring and summer with conditions becoming much drier and hotter leading into the fall season. The abnormal precipitation and temperature contributed and were emphasized by the seasonal variation in riverine carbon transport.
Table 5.
Pearson correlation coefficients for measured parameters. Phycocyanin (Phyco), chloro-phyll-a (Chl-a), colored dissolved organic matter (cDOM), ammonium (NH4), turbidity (N), water temperature (T), specific conductivity (SC), dissolved oxygen (DO), pH, partial pressure of carbon dioxide (pCO2), dissolved inorganic carbon (DIC), dissolved organic carbon (DOC) and discharge Q. Only significant relationships displayed (p < 0.05).
| Phyco | Chl a | cDOM | NH4 | N | T | SC | DO | pH | pCO2 | DIC | DOC | Q | |
|---|---|---|---|---|---|---|---|---|---|---|---|---|---|
| Phyco | 1.00 | ||||||||||||
| Chl a | 0.94 | 1.00 | |||||||||||
| cDOM | 0.69 | 0.63 | 1.00 | ||||||||||
| NH4 | 0.67 | 0.62 | 0.99 | 1.00 | |||||||||
| N | 0.79 | 0.70 | 0.58 | 0.63 | 1.00 | ||||||||
| T | - | −0.59 | - | - | - | 1.00 | |||||||
| SC | −0.57 | −0.51 | - | - | −0.54 | - | 1.00 | ||||||
| DO | - | 0.57 | - | - | - | −0.97 | - | 1.00 | |||||
| pH | - | - | - | - | - | - | - | - | 1.00 | ||||
| pCO2 | - | - | - | - | - | 0.90 | - | −0.95 | −0.15 | 1.00 | |||
| DIC | −0.78 | −0.77 | −0.48 | −0.48 | −0.71 | 0.54 | 0.86 | −0.48 | −0.09 | - | 1.00 | ||
| DOC | 0.49 | 0.55 | - | - | - | - | - | - | 0.05 | −0.49 | - | 1.00 | |
| Q | - | - | - | - | - | - | -0.91 | - | 0.20 | - | −0.66 | - | 1.00 |
Findings from this study indicate significant seasonal variability in dissolved carbon export from the Mississippi River to the Northern Gulf of Mexico. As shown in previous studies by Reiman and Xu [39] & Joshi [41], DIC export varied significantly with temperature and discharge [51]. Extreme and abnormal temperature, precipitation, and discharge variability across the study period magnified this effect. One such event during the winter was followed by river temperatures far below the 14-year seasonal average at near-record lows with river temperature below 5 °C for over a week. Following this event, the highest DOC concentration (13.1 mg/L) and lowest pCO2 (836 μatm) from our study were recorded. Recent studies on carbon transport by Raymond and Bauer [15] and Bianchi et al. [17] suggested instream processing of organic carbon increases from headwaters to the coast [39]. The abnormally high winter DOC was considered to be attributed to a decrease in stream processing of DOC to DIC as low temperature hindered biogeochemical processes. As a net heterotrophic system [52] decreased winter processing of DOC is consistent with previous findings by Reiman and Xu [53] of diel variability of pCO2 during the summer months compared to spring. While winter discharge was around one quarter of the annual, over 1/3rd of total DOC was exported this season (Table 3).
Figure 6.
Inverse relationship of river dissolved oxygen content and pCO2.

DIC was the primary form of carbon in the Mississippi River, accounting for approximately 75% of total dissolved carbon exported in our study. While DIC was negatively correlated to river discharge (r2 = −0.66 p < 0.05), it remained the dominant form of carbon through all seasons. DIC concentration increased throughout the year with increasing water temperature and decreasing discharge. DIC concentration was correlated most significantly with discharge and water temperature (Table 5), as found in previous works by Tian et al. [33] & Reiman and Xu [39]. DIC and pCO2 were not correlated significantly, as in the fall season, pCO2 decreased while DIC increased. A study by Abril et al. [24] found the use of DIC or total alkalinity to calculate pCO2 empirically resulted in an overestimation of overall pCO2 from rivers. These findings suggest that in the Mississippi, DO and discharge may be a better fit for determining pCO2 as nearly all study parameters significantly impact DIC.
Nearly 40% of total carbon exports occurred during the spring season. This was consistent with the annual river flush, where river discharge was highest and high concentrations of soil DOC and nutrients from agriculture fertilizers are released through runoff from high precipitation and headwater snow melt [54]. While no correlation was seen between nitrates and either carbon species, the positive correlation with discharge and NO2 + NO3 may be evidence of increased fertilizer leaching during the spring flush and increased biological activity within the river. Rivers are known to be more heterotrophically active in the spring and summer months as water temperatures rise [55,56]. During these warmer months, organic carbon can be mineralized into DIC at a more rapid rate, leading to the drop in DOC as seen in the spring and summer. While DOC and DIC did not have a clear significant inverse relationship, our study did find high pCO2 in the spring and summer to be consistent with rising DIC and lower DOC. As seen in previous studies by both Joshi et al. [41] and Shen et al. [50] of the Mississippi River this was likely due to the rising temperatures throughout the year in the region and likely increased DOC mineralization.
This study is the first that investigated carbon export during one of the coldest winters and hottest falls in the Mississippi River. Severe winter conditions during our study resulted in an intense drop in temperature lasting for three weeks between 13 February and 7 March 2021. The winter weather event coincided with some of the lowest pCO2 measurements recorded in the Lower Mississippi River and our study’s highest recorded concentration of DOC. The increase in riverine DOC may be attributed to several factors. (1). As a net heterotrophic system, the low temperatures can result in less instream processing of DOC to DIC, decreasing the DIC: DOC ratio and river pCO2 concentration [40,57] (2). The increased flow from the spring flush is known to flush a large amount of soil organic carbon into the river [18,40]. The increased flow also acts as a diluting effect on DIC, which could partly explain the sudden shift in the DIC: DOC ratio [33,58]. While previous studies such as Reiman and Xu [39] have reported similar seasonal trends, the sudden and pronounced change in weather resulted in ambient winter conditions significantly below the long-term average. While we did not observe a net sink of CO2, the low pCO2 resulted in less overall CO2 outgassed during the winter. A recent study by Reiman and Xu [53] showed a diel variation in pCO2 at the exact location, suggesting values may have been even lower in the middle of the day. Additionally, the rising discharge from the early spring flush corresponding with peak DOC concentrations resulted in the most significant seasonal and annual reported export of DOC to the Northern Gulf of Mexico to date (Table 3 and Table 4). When ignoring the extreme winter weather and using only monthly measurements DOC concentrations and pCO2 were 20% lower and 10% higher respectively. These findings help to confirm the significant role of weather events on long terms carbon export sums.
In addition to one of the coldest records, our study also witnessed one of the warmest falls. Water temperatures during the fall season of 2021 remained above 10 °C for the entirety of the fall season, a shift from the past decade where temperatures typically drop around late November. The concentration of DIC was higher during our study (25.57 ± 5.03 mg L−1) than in the most recent update of carbon export in the Mississippi River from 2019 [39] (21.40 ± 7.02 mg L−1, Table 4). DIC in our study followed the season trend found in previous findings by Cai et al. and Raymond et al. of increasing throughout the year with rising temperature and decreasing discharge [36,40]. Due to a warmer and drier fall than last year, DIC concentration in the fall averaged above 30 mg L−1 throughout the season. As previously found, DIC concentration in the Mississippi is primarily attributed to carbonate dissolution of soil CO2 in the Upper Mississippi [48]. High river discharge can reduce contact time with minerals and dilute the overall concentration of DIC [58,59]. Under the changing seasonal conditions in our study, DIC concentrations were subject to more extreme variability, resulting in a much higher DIC: DOC ratio in the fall season. While conditions during our study were considered irregular, climate change is expected to shift seasonal conditions to extremes. Based on their analysis of extreme temperature indicators in the Mississippi River Basin during 1948–2017, Tavakol et al. [34] postulated that the region has a growing risk of extreme temperatures with more frequent and longer hot events. Summer and fall are expected to become hotter and drier, with spring precipitation and flooding events increasingly regular [60]. While our study has shown a clear seasonal trend and increased overall export of carbon from the Mississippi River, it is only representative of a single year of data collection in the river. To further support these findings, more work is needed in rivers throughout different climate regions and over longer study periods. While winters are expected to become milder, the findings from our study on dissolved carbon transport have implications for predicting future seasonal and annual variation. As these conditions continue to change, our findings point to the importance of considering these events in carbon export models to assess the role of large rivers more accurately in the carbon budget.
5. Conclusions
This study demonstrates a significant seasonal effect on riverine carbon export in a large river basin. This effect is likely to become more variable as climate change continues to impact basin weather resulting in longer and hotter summers followed by shorter and more mild winters. Our study found that the bulk of carbon export occurs in the spring season in concurrence with the highest discharge of the river and rising temperatures. The unique weather patterns from our study confirmed a strong effect of extreme weather on carbon transport in the short term, with rippling effects throughout the year. The lower Mississippi River exported 4.54 Tg of DOC and 12.61 Tg of DIC. CO2 outgassing (864.6 g C m−2 yr−1) was greater during our study than all previous findings, supporting the effect of rising water temperature and discharge on outgassing. High riverine pCO2 during the spring (3.43 g C m2) led to outgassing rates more than double that of winter (1.62 g C m2). DIC showed no significant increase compared to previous findings. However, seasonality strongly affected DIC as concentration increased with warming temperatures and drier conditions throughout the year ultimately 50% higher in the fall (32.0 mg L-1) than the winter 20.37 mg L−1. The impact of shifting seasonal conditions is seen in changing DIC: DOC export ratios throughout the year. While our finding saw an increase in DOC export due to low temperatures, moving forward, DIC will increase in concentration with rising temperatures owing to increased in-situ processing of DOC and carbonate weathering rates throughout the basin. Outgassing rates of CO2 are most significant in the high flow warmer conditions and will likely increase in the future as these conditions intensify. While our study reaffirmed the river as a carbon source to the atmosphere, the low pCO2 observed during the winter may suggest a negative feedback loop if extreme winter weathers events persist, resulting in lower winter outgassing or a temporal carbon sink. Our findings imply that seasonality is critical in assessing total carbon load from large rivers such as the Mississippi River. As seasonal variation in the Mississippi River Basin continues to intensify under the changing climate, dissolved carbon transport to the Gulf of Mexico will become more seasonally dependent. As the weather becomes more unpredictable under the changing climate, more work on short-term events will be needed to confirm their effect on total seasonal transport. These findings will help future models better account for river carbon budgets under changing seasonal conditions and further validate these findings.
Author Contributions
L.P.: Field measurements, Data collection & analysis, Writing—review and editing. Y.J.X.: Conceptualization, Methodology, Supervision, Funding acquisition, Writing—review and editing. All authors have read and agreed to the published version of the manuscript.
Funding
This study was supported by a U.S. National Science Foundation grant (Award#: 1937826) and a U.S. Geological Survey 104b Award (Award#: G16AP00056). The study also benefited from a U.S. Department of Agriculture Hatch Fund project (Project#: LAB94459).
Institutional Review Board Statement
Not applicable.
Informed Consent Statement
Not applicable.
Data Availability Statement
Not applicable.
Acknowledgments
The authors are grateful to the associate editor and two anonymous reviewers for their valuable feedback and suggestions, which were important and helpful to improve the quality of this article.
Conflicts of Interest
The authors declare no conflict of interest.
References
- Meybeck, M. Carbon, nitrogen, and phosphorus transport by world rivers. Am. J. Sci. 1982, 282, 401–450. [Google Scholar] [CrossRef]
- Li, M.; Peng, C.; Wang, M.; Xue, W.; Zhang, K.; Wang, K.; Shi, G.; Zhu, Q. The carbon flux of global rivers: A re-evaluation of amount and spatial patterns. Ecol. Indic. 2017, 80, 40–51. [Google Scholar] [CrossRef]
- Battin, T.J.; Luyssaert, S.; Kaplan, L.A.; Aufdenkampe, A.K.; Richter, A.; Tranvik, L.J. The boundless carbon cycle. Nat. Geosci. 2009, 2, 598–600. [Google Scholar] [CrossRef]
- Cole, J.J.; Prairie, Y.T.; Caraco, N.F.; McDowell, W.H.; Tranvik, L.J.; Striegl, R.G.; Duarte, C.M.; Kortelainen, P.; Downing, J.A.; Middelburg, J.J.; et al. Plumbing the global carbon cycle: Integrating inland waters into the terrestrial carbon budget. Ecosystems 2007, 10, 172–185. [Google Scholar] [CrossRef]
- Raymond, P.A.; Hartmann, J.; Lauerwald, R.; Sobek, S.; McDonald, C.; Hoover, M.; Butman, D.; Striegl, R.; Mayorga, E.; Humborg, C.; et al. Global carbon dioxide emissions from inland waters. Nature 2013, 503, 355–359. [Google Scholar] [CrossRef]
- Meybeck, M.; Vörösmarty, C. Global transfer of carbon by rivers. Glob. Chang. Newsl. 1999, 37, 18–19. [Google Scholar]
- Meybeck, M. Concentrations of river waters in major elements and contributions in solution awx oceans. Rev. Geol. Dyn. Geogr. Phys. 1979, 21, 215–246. [Google Scholar]
- Ludwig, W.; Amiotte Suchet, P.; Probst, J.L. River discharges of carbon to the world’s oceans: Determining local inputs of alkalinity and of dissolved and particulate organic carbon. Sci. Terre Des. Planètes Comptes Rendus L’académie Des. Sci. 1996, 323, 1007–1014. [Google Scholar]
- Huang, T.H.; Fu, Y.H.; Pan, P.Y.; Chen, C.T.A. Fluvial carbon fluxes in tropical rivers. Curr. Opin. Environ. Sustain. 2012, 4, 162–169. [Google Scholar] [CrossRef]
- Hedges, J.; Keil, R.G.; Benner, R. What happens to terrestrial organic matter in the ocean? Org. Geochem. 1997, 27, 195–212. [Google Scholar] [CrossRef]
- Jiang, L.-Q.; Carter, B.R.; Feely, R.A.; Lauvset, S.K.; Olsen, A. Surface ocean pH and buffer capacity: Past, present and future. Sci. Rep. 2019, 9, 18624. [Google Scholar] [CrossRef] [PubMed]
- Drake, T.W.; Raymond, P.A.; Spencer, R.G. Terrestrial carbon inputs to inland waters: A current synthesis of estimates and uncertainty. Limnol. Oceanogr. Lett. 2018, 3, 132–142. [Google Scholar] [CrossRef]
- Hope, D.; Billett, M.F.; Cresser, M.S. A review of the export of carbon in river water: Fluxes and processes. Environ. Pollut. 1994, 84, 301–324. [Google Scholar] [CrossRef]
- Bianchi, T.S. The role of terrestrially derived organic carbon in the coastal ocean: A changing paradigm and the priming effect. Proc. Natl. Acad. Sci. USA 2011, 108, 19473–19481. [Google Scholar] [CrossRef] [PubMed]
- Raymond, P.A.; Bauer, J.E. Use of 14C and 13C natural abundances for evaluating riverine, estuarine, and coastal DOC and POC sources and cycling: A review and synthesis. Org. Geochem. 2001, 32, 469–485. [Google Scholar] [CrossRef]
- Chaplot, V.; Mutema, M. Sources and main controls of dissolved organic and inorganic carbon in river basins: A worldwide meta-analysis. J. Hydrol. 2021, 603, 126941. [Google Scholar] [CrossRef]
- Bianchi, T.S.; Filley, T.; Dria, K.; Hatcher, P.G. Temporal variability in sources of dissolved organic carbon in the lower Mississippi river. Geochim. Cosmochim. Acta 2004, 68, 959–967. [Google Scholar] [CrossRef]
- Lohrenz, S.E.; Hopkinson, C.S.; Yang, J.; Tao, B.; Pan, S.; He, R.; Ren, W.; Tian, H.; Cai, W.-J.; Huang, W.-J. Century-long increasing trend and variability of dissolved organic carbon export from the Mississippi River basin driven by natural and anthropogenic forcing. Glob. Biogeochem. Cycles 2016, 30, 1288–1299. [Google Scholar] [CrossRef]
- Meybeck, M. Riverine transport of atmospheric carbon: Sources, global typology and budget. Water Air Soil Pollut. 1993, 70, 443–463. [Google Scholar] [CrossRef]
- Lauerwald, R.; Laruelle, G.G.; Hartmann, J.; Ciais, P.; Regnier, P.A. Spatial patterns in CO2 evasion from the global river network. Glob. Biogeochem. Cycles 2015, 29, 534–554. [Google Scholar] [CrossRef]
- Richey, J.E.; Melack, J.M.; Aufdenkampe, A.K.; Ballester, V.M.; Hess, L.L. Outgassing from Amazonian rivers and wetlands as a large tropical source of atmospheric CO2. Nature 2002, 416, 617–620. [Google Scholar] [CrossRef] [PubMed]
- Regnier, P.; Friedlingstein, P.; Ciais, P.; MacKenzie, F.T.; Gruber, N.; Janssens, I.; Laruelle, G.; Lauerwald, R.; Luyssaert, S.; Andersson, A.J.; et al. Anthropogenic perturbation of the carbon fluxes from land to ocean. Nat. Geosci. 2013, 6, 597–607. [Google Scholar] [CrossRef]
- Richey, J.E. Pathways of Atmospheric CO~2 through Fluvial Systems. Scope-Sci. Comm. Probl. Environ. Int. Counc. Sci. Unions 2004, 62, 329–340. [Google Scholar]
- Abril, G.; Bouillon, S.; Darchambeau, F.; Teodoru, C.R.; Marwick, T.R.; Tamooh, F.; Ochieng Omengo, F.; Geeraert, N.; Borges, A.V. Large overestimation of pCO 2 calculated from pH and alkalinity in acidic, organic-rich freshwaters. Biogeosciences 2015, 12, 67–78. [Google Scholar]
- Duvert, C.; Butman, D.E.; Marx, A.; Ribolzi, O.; Hutley, L.B. CO2 evasion along streams driven by groundwater inputs and geomorphic controls. Nat. Geosci. 2018, 11, 813–818. [Google Scholar] [CrossRef]
- Ran, L.; Lu, X.X.; Richey, J.E.; Sun, H.; Han, J.; Yu, R.; Liao, S.; Yi, Q. Long-term spatial and temporal variation of CO2 partial pressure in the Yellow River, China. Biogeosciences 2015, 12, 921–932. [Google Scholar] [CrossRef]
- Zeng, F.W.; Masiello, C.A. Sources of CO2 evasion from two subtropical rivers in North America. Biogeochemistry 2010, 100, 211–225. [Google Scholar] [CrossRef]
- Butman, D.; Raymond, P.A. Significant efflux of carbon dioxide from streams and rivers in the United States. Nat. Geosci. 2011, 4, 839–842. [Google Scholar] [CrossRef]
- Eccles, R.; Zhang, H.; Hamilton, D. A review of the effects of climate change on riverine flooding in subtropical and tropical regions. J. Water Clim. Chang. 2019, 10, 687–707. [Google Scholar] [CrossRef]
- Cherchi, A.; Ambrizzi, T.; Behera, S.; Freitas, A.C.V.; Morioka, Y.; Zhou, T. The Response of Subtropical Highs to Climate Change. Curr. Clim. Chang. Rep. 2018, 4, 371–382. [Google Scholar] [CrossRef]
- Osland, M.J.; Stevens, P.W.; Lamont, M.M.; Brusca, R.C.; Hart, K.M.; Waddle, J.H.; Langtimm, C.A.; Williams, C.M.; Seminoff, J.A. Tropicalization of temperate ecosystems in North America: The northward range expansion of tropical organisms in response to warming winter temperatures. Glob. Chang. Biol. 2021, 27, 3009–3034. [Google Scholar] [CrossRef] [PubMed]
- Foley, J.A.; Kucharik, C.J.; Twine, T.E.; Coe, M.T.; Donner, S.D. Land use, land cover, and climate change across the Mississippi Basin: Impacts on selected land and water resources. Ecosyst. Land Use Chang. 2006, 15, 249–261. [Google Scholar] [CrossRef]
- Tian, H.; Ren, W.; Yang, J.; Tao, B.; Cai, W.J.; Lohrenz, S.E.; Hopkinson, C.S.; Liu, M.; Yang, Q.; Lu, C.; et al. Climate extremes dominating seasonal and interannual variations in carbon export from the Mississippi River Basin. Glob. Biogeochem. Cycles 2015, 29, 1333–1347. [Google Scholar] [CrossRef]
- Tavakol, A.; Rahmani, V.; Harrington, J. Evaluation of hot temperature extremes and heat waves in the Mississippi River Basin. Atmospheric Res. 2020, 239, 104907. [Google Scholar] [CrossRef]
- Tang, C.; Dennis, R.; Cooter, E. Water Temperature Changes in the Mississippi River Basin; Internal. Presentation, RTP, NC; Environmental Protection Agency: Washington, DC, USA, 2015. [Google Scholar]
- Raymond, P.A.; Oh, N.-H.; Turner, R.E.; Broussard, W. Anthropogenically enhanced fluxes of water and carbon from the Mississippi River. Nature 2008, 451, 449–452. [Google Scholar] [CrossRef] [Green Version]
- Munoz, S.E.; Giosan, L.; Therrell, M.D.; Remo, J.W.F.; Shen, Z.; Sullivan, R.M.; Wiman, C.; O’Donnell, M.; Donnelly, J.P. Climatic control of Mississippi River flood hazard amplified by river engineering. Nature 2018, 556, 95–98. [Google Scholar] [CrossRef]
- Tao, B.; Tian, H.; Ren, W.; Yang, J.; Yang, Q.; He, R.; Cai, W.; Lohrenz, S. Increasing Mississippi river discharge throughout the 21st century influenced by changes in climate, land use, and atmospheric CO2. Geophys. Res. Lett. 2014, 41, 4978–4986. [Google Scholar] [CrossRef]
- Reiman, J.; Xu, Y.J. Dissolved carbon export and CO2 outgassing from the lower Mississippi River—Implications of future river carbon fluxes. J. Hydrol. 2019, 578, 124093. [Google Scholar] [CrossRef]
- Cai, Y.; Guo, L.; Wang, X.; Aiken, G. Abundance, stable isotopic composition, and export fluxes of DOC, POC, and DIC from the Lower Mississippi River during 2006–2008. J. Geophys. Res. Biogeosci. 2015, 120, 2273–2288. [Google Scholar] [CrossRef]
- Joshi, S.; Xu, Y.J. Assessment of Suspended Sand Availability under Different Flow Conditions of the Lowermost Mississippi River at Tarbert Landing during 1973–2013. Water 2015, 7, 7022–7044. [Google Scholar] [CrossRef]
- Rosen, T.; Xu, Y.J. Estimation of sedimentation rates in the distributary basin of the Mississippi River, the Atchafalaya River Basin, USA. Hydrol. Res. 2015, 46, 244–257. [Google Scholar] [CrossRef]
- Vaughn, D.R.; Kellerman, A.M.; Wickland, K.P.; Striegl, R.G.; Podgorski, D.C.; Hawkings, J.R.; Nienhuis, J.H.; Dornblaser, M.M.; Spencer, R.G. Anthropogenic landcover impacts fluvial dissolved organic matter composition in the Upper Mississippi River Basin. Biogeochemistry 2021, 1–25. [Google Scholar] [CrossRef]
- Wohl, E.; Hall, R.O., Jr.; Lininger, K.B.; Sutfin, N.A.; Walters, D.M. Carbon dynamics of river corridors and the effects of human alterations. Ecol. Monogr. 2017, 87, 379–409. [Google Scholar] [CrossRef]
- Repasch, M. Unexpected Consequences of River Engineering on the Carbon Cycle. AGU Adv. 2021, 2, e2021AV000402. [Google Scholar] [CrossRef]
- Wang, B.; Xu, Y.J. Dynamics of 30 large channel bars in the Lower Mississippi River in response to river engineering from 1985 to 2015. Geomorphology 2018, 300, 31–44. [Google Scholar] [CrossRef]
- Cai, W.-J.; Wang, Y. The chemistry, fluxes, and sources of carbon dioxide in the estuarine waters of the Satilla and Altamaha Rivers, Georgia. Limnol. Oceanogr. 1998, 43, 657–668. [Google Scholar] [CrossRef]
- Dubois, K.D.; Lee, D.N.; Veizer, J. Isotopic constraints on alkalinity, dissolved organic carbon, and atmospheric carbon dioxide fluxes in the Mississippi River. J. Geophys. Res. Biogeosci. 2010, 115, G02018. [Google Scholar] [CrossRef]
- Weiss, R. Carbon dioxide in water and seawater: The solubility of a non-ideal gas. Mar. Chem. 1974, 2, 203–215. [Google Scholar] [CrossRef]
- Shen, Y.; Fichot, C.; Benner, R. Floodplain influence on dissolved organic matter composition and export from the Mississippi-Atchafalaya River system to the Gulf of Mexico. Limnol. Oceanogr. 2012, 57, 1149–1160. [Google Scholar] [CrossRef]
- Soria-Reinoso, I.; Alcocer, J.; Sánchez-Carrillo, S.; García-Oliva, F.; Cuevas-Lara, D.; Cortés-Guzmán, D.; Oseguera, L.A. The Seasonal Dynamics of Organic and Inorganic Carbon along the Tropical Usumacinta River Basin (Mexico). Water 2022, 14, 2703. [Google Scholar] [CrossRef]
- Dagg, M.J.; Bianchi, T.S.; Breed, G.A.; Cai, W.-J.; Duan, S.; Liu, H.; McKee, B.A.; Powell, R.T.; Stewart, C.M. Biogeochemical characteristics of the lower Mississippi River, USA, during June 2003. Estuaries 2005, 28, 664–674. [Google Scholar] [CrossRef]
- Reiman, J.H.; Xu, Y.J. Diel Variability of pCO2 and CO2 Outgassing from the Lower Mississippi River: Implications for Riverine CO2 Outgassing Estimation. Water 2018, 11, 43. [Google Scholar] [CrossRef]
- Turner, R.E.; Rabalais, N.N.; Alexander, R.B.; McIsaac, G.; Howarth, R.W. Characterization of nutrient, organic carbon, and sediment loads and concentrations from the Mississippi River into the northern Gulf of Mexico. Estuaries Coasts 2007, 30, 773–790. [Google Scholar] [CrossRef]
- Goulder, R. Seasonal variation in heterotrophic activity and population density of planktonic bacteria in a clean river. J. Ecol. 1980, 68, 349–363. [Google Scholar] [CrossRef]
- Servais, P.; Garnier, J. Contribution of heterotrophic bacterial production to the carbon budget of the river Seine (France). Microb. Ecol. 1993, 25, 19–33. [Google Scholar] [CrossRef] [PubMed]
- Voss, B.M.; Wickland, K.P.; Aiken, G.R.; Striegl, R.G. Biological and land use controls on the isotopic composition of aquatic carbon in the Upper Mississippi River Basin. Glob. Biogeochem. Cycles 2017, 31, 1271–1288. [Google Scholar] [CrossRef]
- Cai, Y.; You, C.-F.; Wu, S.-F.; Cai, W.-J.; Guo, L. Seasonal variations in strontium and carbon isotope systematics in the Lower Mississippi River: Implications for chemical weathering. Chem. Geol. 2020, 553, 119810. [Google Scholar] [CrossRef]
- Calabrese, S.; Parolari, A.J.; Porporato, A. Hydrologic Transport of Dissolved Inorganic Carbon and Its Control on Chemical Weathering. J. Geophys. Res. Earth Surf. 2017, 122, 2016–2032. [Google Scholar] [CrossRef]
- Ford, T.W.; Chen, L.; Schoof, J.T. Variability and Transitions in Precipitation Extremes in the Midwest United States. J. Hydrometeorol. 2021, 22, 533–545. [Google Scholar] [CrossRef]
Figure 1.
Discharge of the Mississippi River at Study site (USGS # 07374000) over study period January–December 2021. Red dots represent sample dates.
Figure 1.
Discharge of the Mississippi River at Study site (USGS # 07374000) over study period January–December 2021. Red dots represent sample dates.

Figure 2.
Boxplot of seasonal variability of (a) DIC; (b)DOC. Dots are sample points from each field trip.
Figure 2.
Boxplot of seasonal variability of (a) DIC; (b)DOC. Dots are sample points from each field trip.

Figure 3.
Seasonal trend of pCO2 and CO2 outgassing from the Mississippi River at Baton Rouge, Louisiana.
Figure 3.
Seasonal trend of pCO2 and CO2 outgassing from the Mississippi River at Baton Rouge, Louisiana.

Figure 4.
Positive correlation between pCO2 and water temperature in the Mississippi River across the study period.
Figure 4.
Positive correlation between pCO2 and water temperature in the Mississippi River across the study period.

Table 1.
Average concentration of water measurements across seasons with (±standard deviation). Turbidity measured in NTU (Nephelometric Turbidity Units) cDOM, NH4, Chl-a, and Phycocyanin measured in AFU (Arbitrary Fluorescence Units).
Table 1.
Average concentration of water measurements across seasons with (±standard deviation). Turbidity measured in NTU (Nephelometric Turbidity Units) cDOM, NH4, Chl-a, and Phycocyanin measured in AFU (Arbitrary Fluorescence Units).
| Season | Temp °C | DO mg L−1 | pH | Turbidity NTU | cDOM AFU | NH4 AFU | Chl-a AFU | Phyco AFU |
|---|---|---|---|---|---|---|---|---|
| Winter | 6.82 ± 3.18 | 11.43 ± 1.31 | 8.06 ± 0.7 | 92.85 ± 36.55 | 59.31 ± 5.13 | 83.75 ± 7.24 | 230.62 ± 45.02 | 127.32 ± 29.08 |
| Spring | 22.6 ± 4.92 | 6.81 ± 0.73 | 7.89 ± 0.22 | 41.6 ± 17.54 | 59.56 ± 2.62 | 83.55 ± 3.59 | 148.85 ± 17.05 | 77.35 ± 27.45 |
| Summer | 29.0 ± 0.95 | 6.07 ± 0.39 | 7.79 ± 0.09 | 85.32 ± 77.91 | 61.47 ± 12.04 | 88.64 ± 19.32 | 175.95 ± 55.08 | 97.05 ± 61.37 |
| Fall | 19.7 ± 7.09 | 8.21 ± 1.56 | 7.84 ± 0.06 | 30.37 ± 20.04 | 54.97 ± 4.67 | 76.41 ± 6.49 | 130.73 ± 24.05 | 54.38 ± 19.24 |
Publisher’s Note: MDPI stays neutral with regard to jurisdictional claims in published maps and institutional affiliations. |
© 2022 by the authors. Licensee MDPI, Basel, Switzerland. This article is an open access article distributed under the terms and conditions of the Creative Commons Attribution (CC BY) license (https://creativecommons.org/licenses/by/4.0/).
Share and Cite
MDPI and ACS Style
Potter, L.; Xu, Y.J. Variability of Carbon Export in the Lower Mississippi River during an Extreme Cold and Warm Year. Water 2022, 14, 3044. https://doi.org/10.3390/w14193044
AMA Style
Potter L, Xu YJ. Variability of Carbon Export in the Lower Mississippi River during an Extreme Cold and Warm Year. Water. 2022; 14(19):3044. https://doi.org/10.3390/w14193044
Chicago/Turabian StylePotter, Lee, and Y. Jun Xu. 2022. "Variability of Carbon Export in the Lower Mississippi River during an Extreme Cold and Warm Year" Water 14, no. 19: 3044. https://doi.org/10.3390/w14193044
Note that from the first issue of 2016, this journal uses article numbers instead of page numbers. See further details here.