Article

Testing Groundwater Quality in Jouamaa Hakama Region (North of Morocco) Using Water Quality Indices (WQIs) and Fuzzy Logic Method: An Exploratory Study

by
El Mustapha Azzirgue
1,*,
El Khalil Cherif
2,*,
Taha Ait Tchakoucht
3,
Hamza El Azhari
1 and
Farida Salmoun
1
1
Laboratory of Physical Chemistry of Materials, Natural Substances and Environment, Chemistry Department, Sciences and Technology Faculty, Abdelmalek Essaâdi University, Tangier 90090, Morocco
2
Institute for Systems and Robotics, Instituto Superior Técnico, University of Lisbon, 1649-004 Lisbon, Portugal
3
School of Digital Engineering and Artificial Intelligence, Euromed Research Center, Euromed University of Fes, Meknes Road (Bensouda Roundabout), Fes 30000, Morocco
*
Authors to whom correspondence should be addressed.
Water 2022, 14(19), 3028; https://doi.org/10.3390/w14193028
Submission received: 22 August 2022 / Revised: 12 September 2022 / Accepted: 20 September 2022 / Published: 26 September 2022
(This article belongs to the Section Water Quality and Contamination)

Abstract

:
Groundwater is one of the important determinants of human health in many regions of Morocco. Indeed, it is one of the government’s top concerns. However, slow and wrong decisions are hindering the advancement of the quality of groundwater in Morocco. The traditional monitoring methods are costly, time-consuming, and human-resource-intensive, especially in such a developing country. An exploratory study was conducted in the Jouamaa Hakama region in Morocco to test and compare groundwater quality using in situ measurements, water quality indices (WQIs), and a fuzzy logic (FL) method. The methodology followed in this study involves using and comparing four WQIs and FL based on in situ measurements at nine different wells along the Ouljat Echatt River downstream of the Chrafate wastewater treatment station. Twelve physical–chemical and bacteriological parameters: potential of hydrogen (pH), temperature (T°), turbidity (TURB), chemical oxygen demand (COD), biochemical oxygen demand in five days (BOD5), suspended matter (SM), phosphate (PO43−), nitrite ( N O 2 ), nitrate ( N O 3 ), ammonium ( N H 4 + ), dissolved oxygen (DO), electrical conductivity (EC), and fecal coliforms (FC) were measured in 2016 and 2017. The results show that all wells are of poor quality according to FL and WQIs; the Weighted Geometric WQI and Oregon WQI indicate that the groundwater is below the acceptable standard for human consumption, while the Weighted Arithmetic WQI and Logarithmic WQI indicate that the majority of wells are of good quality. These tested indices represent an excellent tool to support decision making and can be highly helpful in monitoring groundwater quality in vulnerable areas such as the Jouamaa Hakama region in the north of Morocco.

1. Introduction

Among the several sources of water used, groundwater is the most valuable natural source. It is utilized for irrigation, industry, and domestic water supplies. Due to population growth, urbanization, and industrialization, the demand for drinking water has steadily increased [1]. However, promoting sustainable development and the advancement of both socioeconomic and environmental goals is crucially connected to the quality of groundwater [2]. In most nations across the world, determining the quality of water is critical and plays a significant role in its sustainable development. Numerous potential sources of contamination make groundwater pollution a challenging issue [3], such as anthropogenic activity, agricultural and industrial practices [4], or contamination from dirty rivers [2], and some waters are now unsafe to consume. Drinking-water contamination is a source of illness and is frequently linked to the spread of ailments such as cholera, dysentery, poliomyelitis, and diarrhea [5]. According to the World Health Organization (WHO), polluted waters are responsible for around 80% of illnesses in humans. Therefore, groundwater and surface water monitoring and management have become a necessary process that should be integrated into political perspectives for sustainable development [6]. The groundwater in Morocco has always been a priority as part of a strategic decision to develop the water sector [7]. It is a significant component of the nation’s hydraulic legacy [8]. A substantial reduction in precipitation at the start of this century has been observed, which is concerning for the decades to come [2]. Like many other nations in the Mediterranean region, the groundwater in Morocco is contaminated.
The management and protection of water supplies depend greatly on the evaluation of water quality [9]. For the country to thrive sustainably, groundwater quality monitoring is essential. The definition of groundwater quality includes the thermal, physical, chemical, and bacteriological characteristics of the water body [10]. Indeed, a decision index determines sustainable consumption and water resources quality [11]. Due to the wide usage of groundwater (irrigation and human consumption), the monitored parameters vary and are usually linked to consumer safety, which is the purpose of this study, as well as understanding the nature of pollutant sources [12].
Groundwater quality indicators for human consumption include pH, water T°, TURB, COD, BOD5, SM, PO43−, N O 2 , N O 3 , N H 4 + , DO, EC, and FC [13,14]. These parameters are traditionally identified by field sampling, in situ measurements, and laboratory analysis and compared with their standard values [15,16]. This approach is costly, time-consuming, and human-resource-intensive. In addition, many WQIs have been developed using these in situ parameters for numerical outcome scores [17,18,19].
WQIs have the benefit of providing information regarding the status of water resources to the general public, water managers, and decision-makers [20,21]. This makes it possible to evaluate the success or failure of any management plan for enhancing the quality of the water [22]. To make groundwater quality information easily understandable to the general public, decision-makers, and non-specialists, the WQI converts a collection of chosen water quality criteria into a single dimensionless number [23].
WQIs were first introduced by Horton in 1965 [24]. The aim of a WQI is to combine all of the parameters into a unique number that can be used to categorize water based on in situ parameters. Numerous works and studies on WQIs and water quality measures have used WQIs for water quality [25]. The steps required to generate WQIs were described by Horton [24] as follows: (1) collect measurements for individual water quality indicators, (2) convert the measurements into “sub-index” values to represent them on a common scale, and (3) combine the various subindex values into a single overall value [26]. The five forms of WQI aggregation functions are (a) the arithmetic aggregation function, (b) the multiplicative aggregation function, (b) the geometric mean, (c) the harmonic mean, and (d) the minimum operator. Various scholars have attempted to build a water quality index based on these functions [26].
Later, Brown et al. [27] created a new WQI that was based on the judgment of a panel of 142 water quality experts, who determined the weighting of each variable and established five categories for water quality: red (very bad), orange (bad), yellow (average), green (good), and blue (excellent). The original index that Brown et al. suggested was in an arithmetic form. Later, Brown et al. (1973) [28] believed that a geometric aggregate was preferable to an arithmetic aggregate because it is more sensitive when a single variable exceeds the norm.
In the same period, 1971, Prati et al. [29] proposed a different index based on water quality criteria, while Deininger and Landwehr [30] proposed their own WQI that is conceptually related to Brown et al. [27]. Three specific-purpose water quality indices were presented by Nemerow [31], and when combined, they yielded a general water quality index. In their strategy, they combined the maximum value and the average value of each variable. A variable’s impact is lessened by the approach when it significantly exceeds the permitted limits [32]. In Alabama (USA), Dinius (1972) [33] presented another WQI based on the Horton index [32]. This WQI establishes a decreasing scale from 100 to 0, with 100 representing the ideal water quality. Dinius [34], in 1987, developed another WQI using the subindex method introduced by Dalkey with some changes [35].
In 1989, House and Newsome [36] demonstrated how a WQI might be used to assess “good” and “bad” water by consolidating data on a variety of biological and physical–chemical characteristics into a single, straightforward index. Afterwards, new indices appeared, such as the global pollution index (Sargaonkar and Deshpande) [37]; the River WQI; and the Scatter Score Index, which is used to assess water quality around mine sites in the United States and detect changes in water quality over time and space [32,38]. Meanwhile, in Canada, the Canadian Council of Ministers of the Environment (CCME) has introduced a WQI, which is a non-linear index [32].
Another WQI was created by Said et al. [39] using logarithmic aggregation, with which they intended to preserve the precision of the index while reducing the number of variables that needed to be added and changing the aggregation method.
Introduced by Icaga in 2007 [40], the most recent technique for computing a WQI is based on FL and was motivated by Silvert’s [41] work in 2000 on environmental assessment. FL is a form of multivalued logic that expresses the partial truth between being false and true. It takes any real number between 0 and 1, unlike Boolean logic [40], where the truth values of variables can only be the integer values 0 or 1. Zadeh (1965) [42] introduced fuzzy logic as yet another practical and affordable technique for determining the quality of water. It has the potential to be an excellent tool since it simulates complex systems under ambiguous and imprecise situations using qualitative and quantitative models.
In general, WQIs have been used to measure water quality in a variety of water bodies around the world [18,43,44,45,46] using different concepts [47,48,49]. The selection of quality indicators, the application of weights, the construction of subindices, and the determination of the aggregate quality value are the foundations of the methodology used to calculate WQIs [50]. Similar to this, numerous works and studies on WQIs and water quality measures have been conducted in Morocco [51,52,53,54,55].
WQIs can be seen as water quality models that depict a complicated reality simply by selecting variables and defining procedures for weighting and aggregating variables [32]. Different ways of aggregating variables have been used. These are mainly: the weighted arithmetic mean (WAWQI), the weighted geometric mean (WGWQI), the weighted and unweighted harmonic quadratic mean (WUHQMWQI), in particular, the Oregon Water Quality Index (OWQI), and, more recently, aggregation using logarithmic (Logarithmic WQI) and fuzzy logic (FL)-based functions. The role of WQIs is to simplify a set of parameters, while the role of FL is to analyze these parameters [56].
The objective of this exploratory study was to use the most well-known WQIs and FL to assess and compare groundwater quality in the Jouamaa region in the north of Morocco. It also aimed at confirming the superiority of the FL method in accurately determining water quality from the used parameters. Moreover, it is intended to support decision-makers and managers to periodically assess and monitor water quality for appropriate management strategies to minimize the level of water contamination.

2. Materials and Methods
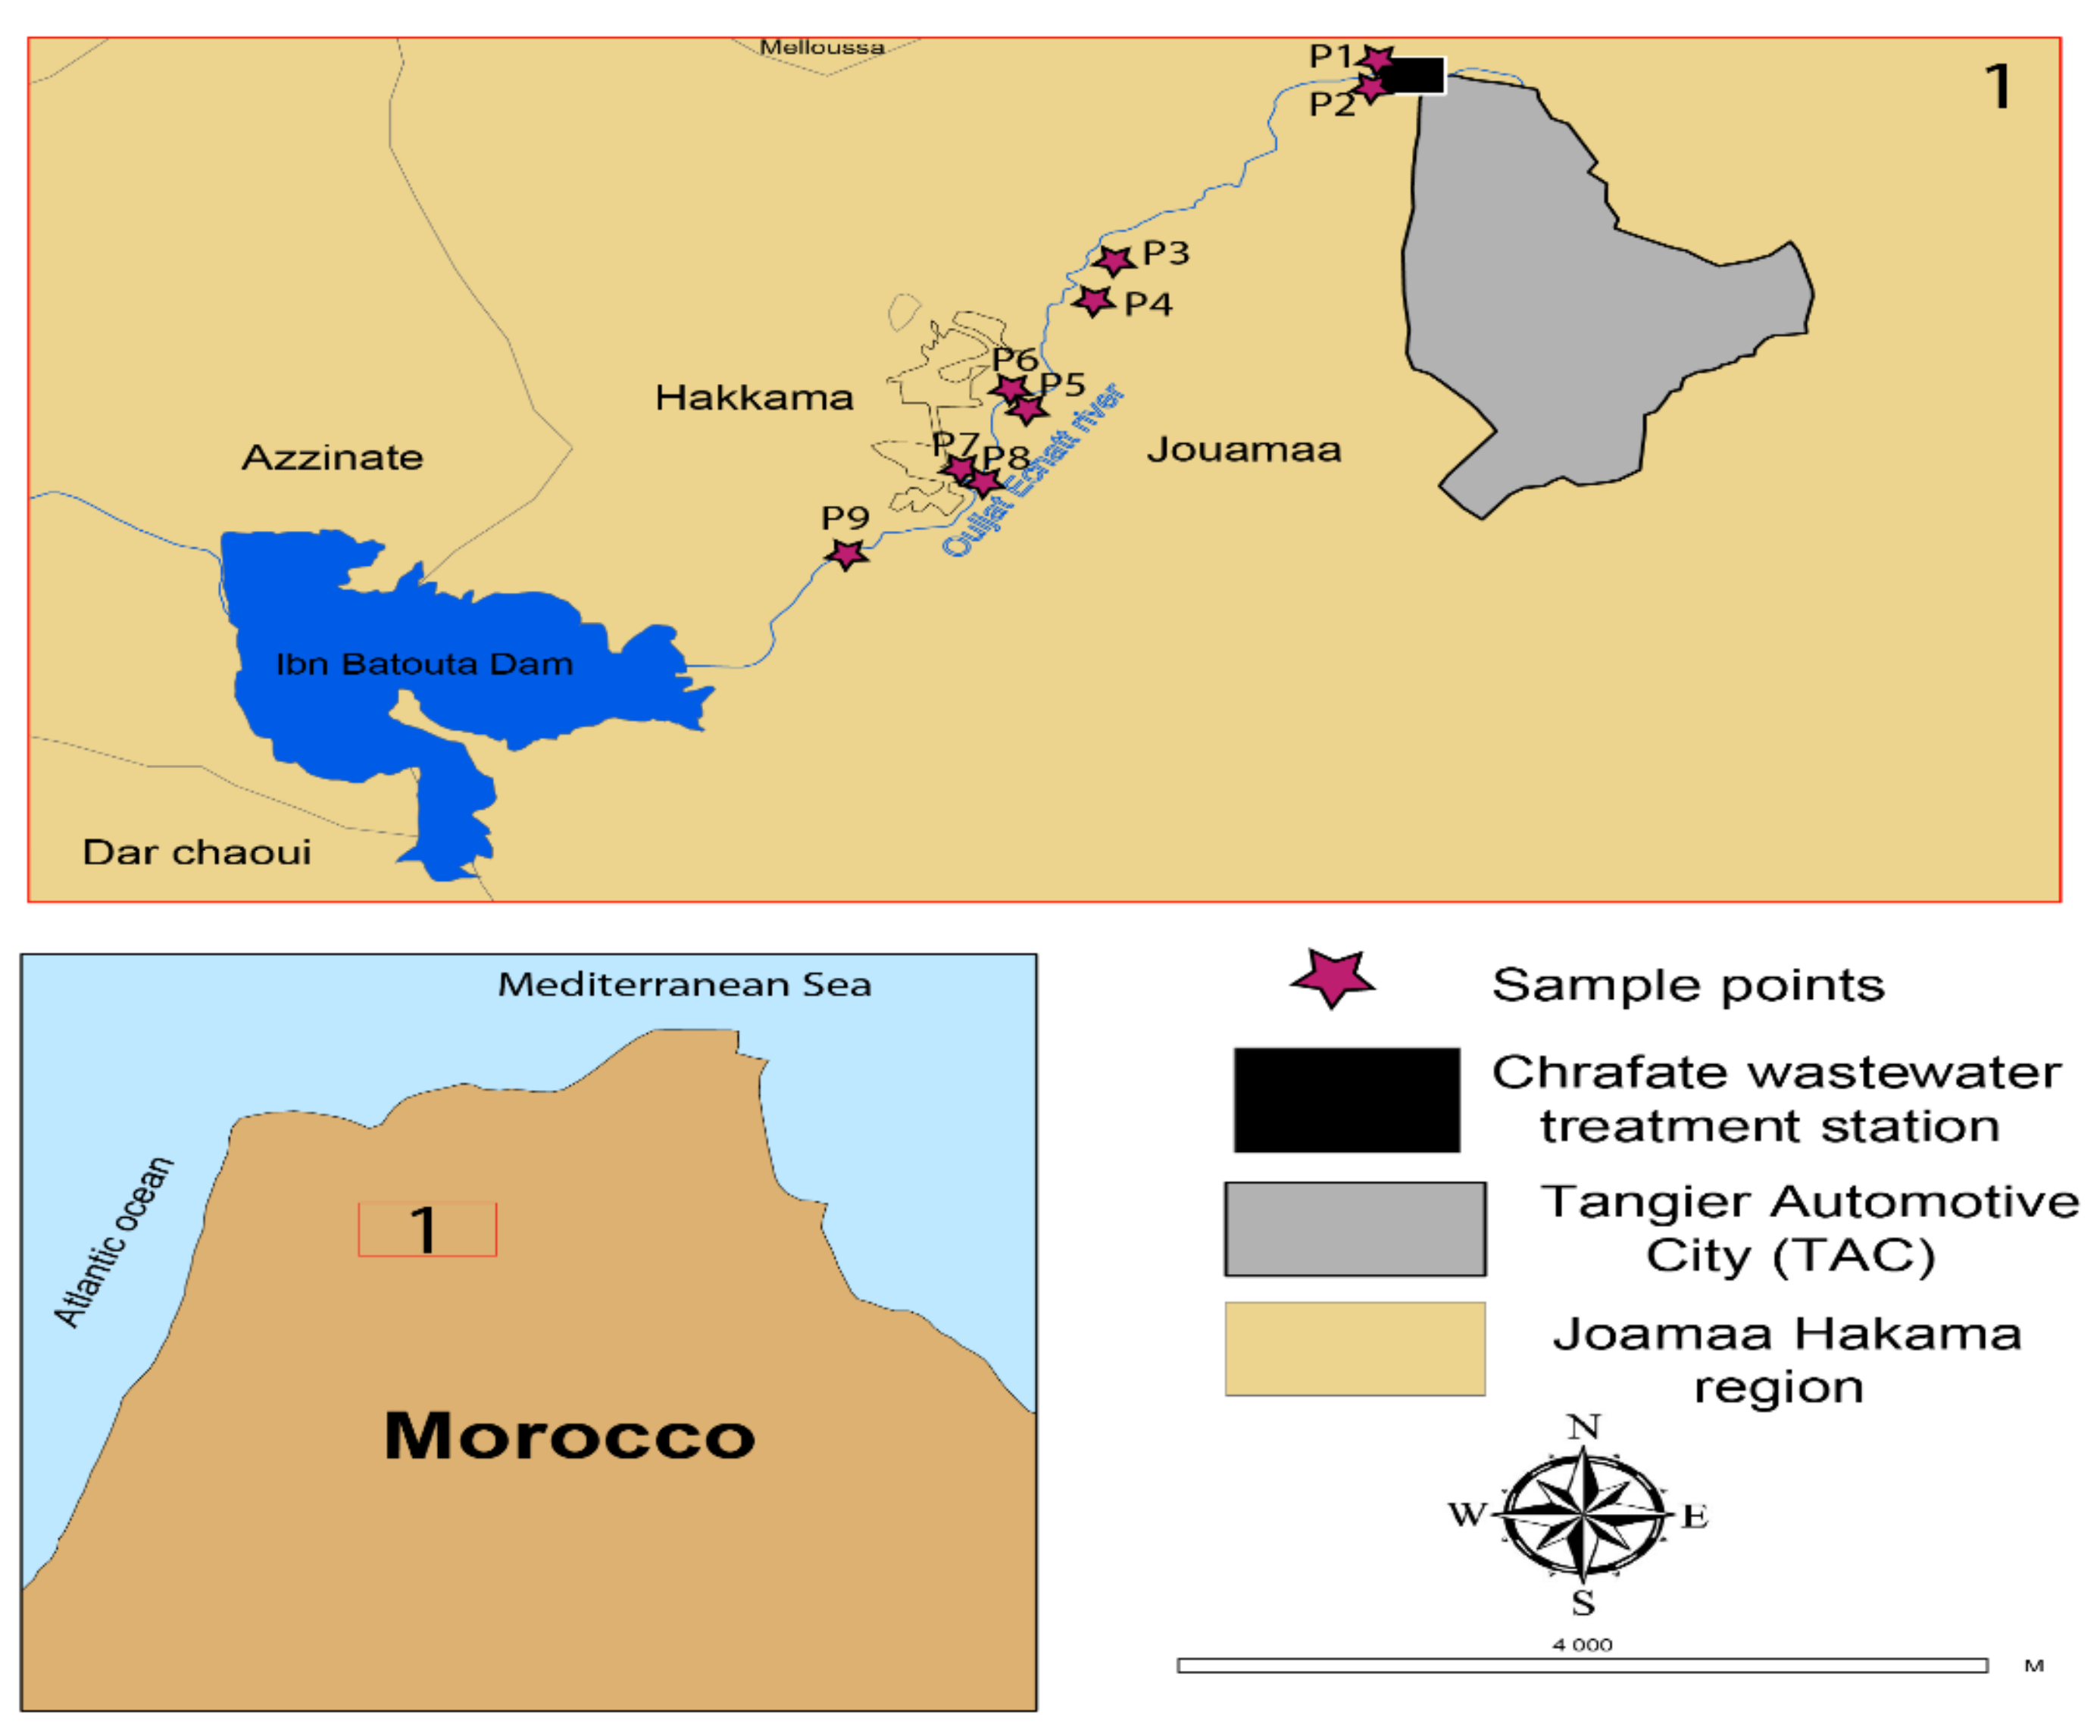
2.1. The Study Area

The Jouamaa Hakama region is located in the north of Morocco, 17 km away from the city of Tangier. The study area is characterized by the Tangier Automotive City (TAC) industrial zone, the Chrafate wastewater treatment station, the Ouljat Echatt river, 9 wells, and the Ibn Batouta dam (Figure 1). The Ouljat Echatt river receives the treated TAC discharges from the Chrafate wastewater treatment station [57,58], and all 9 wells are distributed along this river (Figure 1 and Figure 2) [59]. The wells are between 5 and 10 m deep and used for the population’s daily needs (Figure 2). The water from these wells is drawn by a pump into well n° 3 (P3) (see Figure 1), while for the other wells, the water is drawn manually by buckets.

2.2. Water Quality Analysis

Eighteen samples were extracted from the nine wells along the Ouljat Echatt river for physical, chemical, and bacteriological analyses. Table 1 shows the selected parameters and the reasons for their choice in this study. Before sampling, each bottle was rinsed with distilled water, and sterilized bottles were used for bacteriological and other analyses. Each sample was tested in situ for pH, T°, DO, EC, and TURB. A volume of 1.5 L was taken using flasks at the well for other physical–chemical and bacteriological parameters (Table 1). The samples were identified using sampling sheets (date, geographical coordinates, time of sampling, number, etc.). The sample bottles were transported to the laboratory in a cooler at low T° (4 °C). For bacteriological analyses, the samples were analyzed within a period of less than 24 h after collection. The physical–chemical parameters were analyzed in the “Laboratory of Physical Chemistry of Materials, Natural Substances and Environment, Chemistry Department, Sciences, and Technology Faculty, Abdelmalek Essaâdi University, Tangier, Morocco”, while the bacteriological analysis was conducted in the laboratory “National Office for the Sanitary Safety of Food Products ONSSA” Tangier, Morocco. Table 2 summarizes all of the parameters measured, the analytical methods and Moroccan standards used during the analysis, and the interpretation of the results.

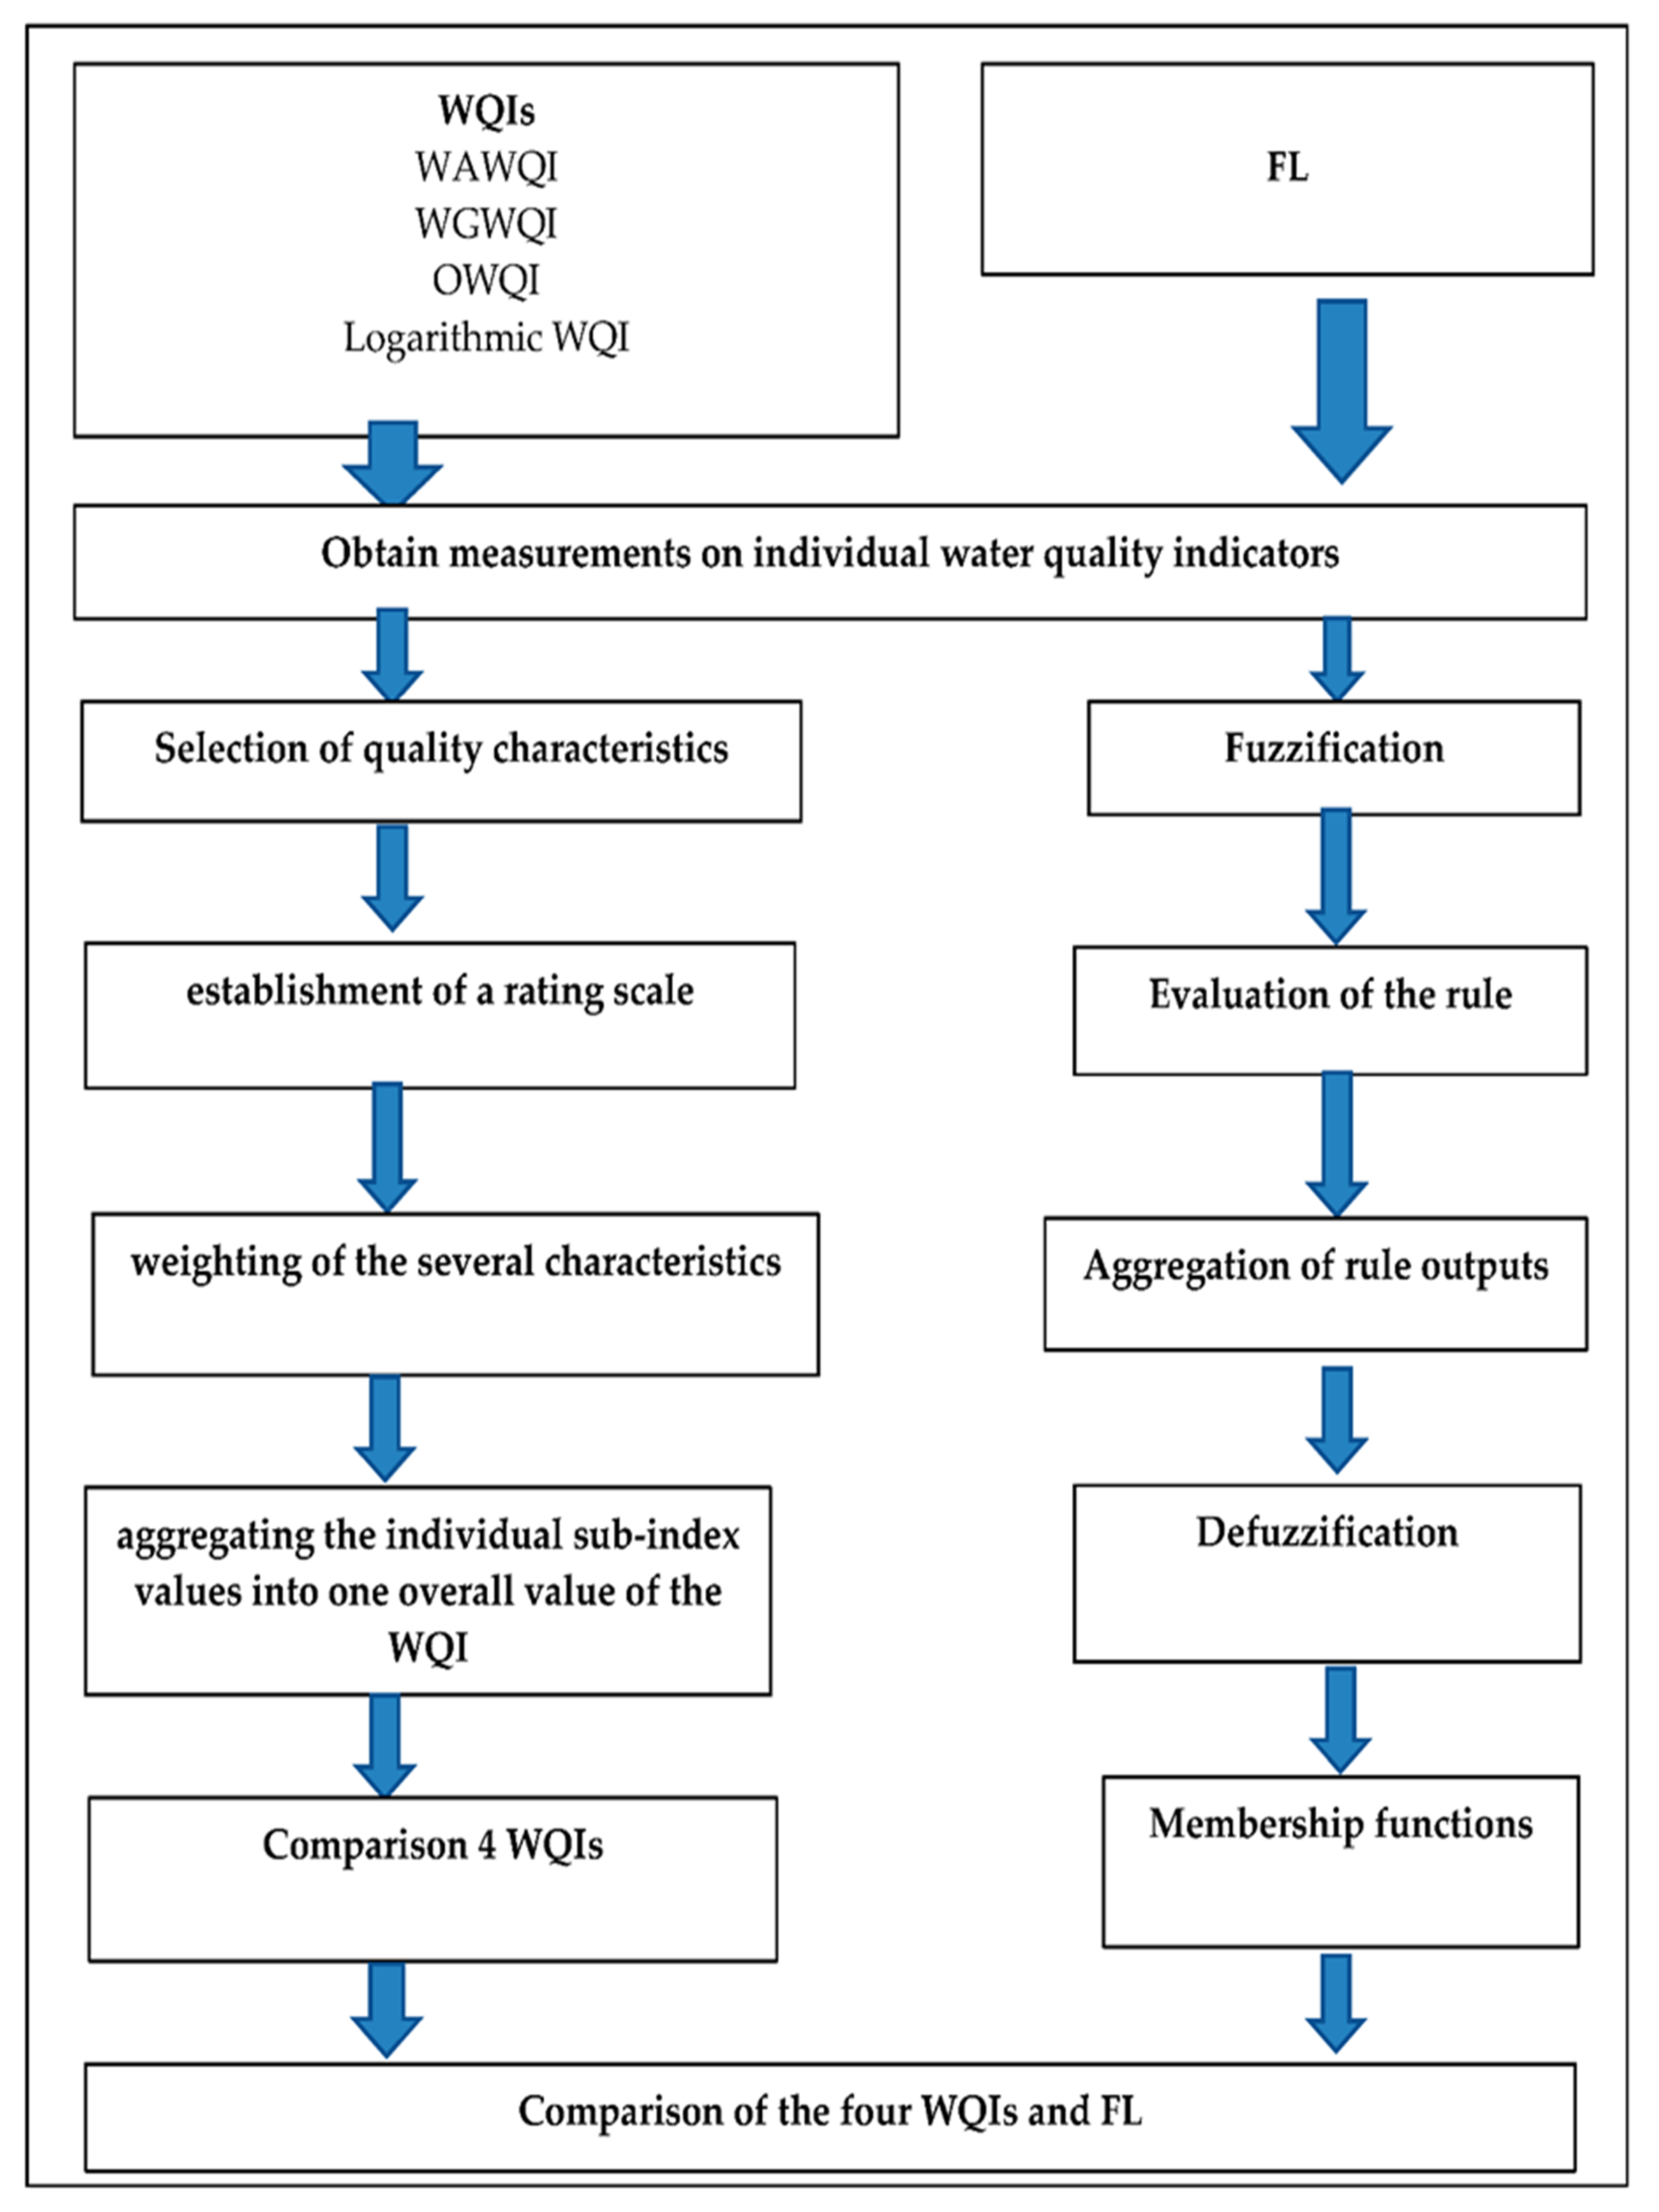
2.3. The WQI Approach

The process of creating a WQI consists of condensing a number of different indicators into a single, concise value that identifies the water quality of a specific source and is understandable by a broad audience, including non-experts such as the general public or decision-makers [51].
There are water quality indices based on indicators and aggregation methods currently used around the world, such as the US National Sanitation Foundation’s Water Quality Index (NSFWQI); the Canadian Council of Ministers of the Environment Water Quality Index (CCMEWQI); the British Columbia Water Quality Index (BCWQI); and the OWQI.

2.3.1. Chosen WQIs and Data Collection

Five WQIs based on five different equations were used in this study for the following reasons:
  • Each of the chosen equations belongs to an aggregation category of the WQI.
  • The 5 equations can be compared to assess the quality of groundwater belonging to the study area.
  • The chosen equations will help us to model and project a relevant method for the future monitoring and surveillance of ecosystems downstream of discharges of treated wastewater from industrial areas.
  • Modeling from WQIs will provide decision-makers with a reliable and easy tool for controlling and monitoring water resources downstream of industrial areas.
  • For the sampling and selection of samples, we targeted 9 wells on either side of the river downstream from the Chrafate wastewater treatment station to the dam. The choice of wells is for the purpose of monitoring whether there is groundwater degradation and whether there is longitudinal and transverse propagation of pollution.
The results of the samples were compared to Moroccan standards [66] according to Table 2, and the WQIs were calculated based on Moroccan standards for drinking water.
For the chosen equations, Table 3 below summarizes the equations used to compute each WQI.
1.
Weighted Arithmetic Average: The First NSFWQI in 1971 [67]
Brown et al.’s (1965) initial index proposal included an arithmetic form. Choosing the appropriate variables to include in the WQI was one of the difficulties with the Horton approach [67]. With the support of the National Sanitation Foundation, Brown et al. created a different version of the WQI; thus, the name of this index is NSFWQI (Equations (1)–(5)). Brown’s method, which is based on Dalkey’s method (the Delphi technique developed by the Rand Corporation) [35], was carried out by carefully choosing the variables, creating a standard scale, and allocating weights to the variables (Table 4). A group of 142 specialists were asked to rate the total water quality using the chosen variables on a scale from 1 (highest) to 5 (lowest).
The relative weight (Wi) of each parameter was calculated by Equation (1):
W i = w i i = 1 n w i
where wi represents the weight of the parameter (i), and (n) is the total number of parameters.
The quality rating was calculated by Equation (2):
Q i = C i S i 100
where Qi is the quality rating, Ci is the concentration, and Si is the standard.
For the pH, the rating scale was determined by Equation (3):
Q i = C p H 8.5 6.5 8.5
The subindex (SI) for each parameter was calculated by Equation (4):
SI = WiQi
where Wi is the relative weight, and Qi is the scale rating of the parameter.
DO, FC, pH, BOD, N O 3 , PO43, T°, TURB, and SM are the variables included in the calculations. Each variable received a rating that was calculated using the arithmetic mean, and ratings were then changed into temporary weights. The final weight was then calculated by dividing each temporary weight by the total number of temporary weights [68,69,70,71,72]. Brown et al. [28] thought about using a color spectrum to show the range of water quality in each area, with dark red signifying very poor water quality (WQI = 0–10), a narrow strip of yellow showing average quality (50 WQI), and dark blue signifying excellent water quality (WQI = 90–100) (Table 5).
W Q I = i = 1 n W i   Q i i = 1 n W i  
where Wi is the unit weight of the nth water quality parameter; Qi is the quality rating of the ith water quality parameter.
2.
Weighted Geometric Average: In 1973, the NSFWQI was updated for the second time. Brown et al. proposed another formula for calculating the WQI after discovering that the multiplicative formula was better suited to the judgments of experts. Researchers used the same scale of classification of water quality [23,74,75] and employed the geometric mean form of weighting in the WQI (Equation 6 and Table 6). Later, other researchers [76,77,78] also used a weighted geometric mean for aggregation [32].
WQI = ∏qiwi
where qi is the quality class for the nth variable; Wi is the relative weight for the nth variable (∑Wi = 1). Brown et al. kept the same scale for the classification of water quality [32].
3.
Weighted and Unweighted Harmonic Square Average: Canadian Council of Ministers of the Environment (CCEM) 2001, Dojido et al. 1994 [48]
In order to calculate the WQI, Dojido et al. (1994) [48] introduced the harmonic mean. Individual indicator weights are not used in this average. Researchers discovered that it reduces eclipsing while accounting for the influence of other indicators and is more responsive to the more degraded indicators than the arithmetic form [79]. The British Columbia Water Quality Index and the CCEM Water Quality Index are further indicators based on harmonic means. A harmonic-mean-based methodology has been used in several WQIs [21,80,81]. Another often used WQI that is available to the general public is the OWQI, which was created by the Oregon Department of Environmental Quality (ODEQ) in the late 1970s and revised multiple times since then [81]. Due to the vast amounts of information and resources required for the calculation and presentation of the findings, the original OWQI was, however, abandoned in 1983. The OWQI was updated in 1994 by improving the original subindices (adding T° and a total phosphorus subindex) and thereby improving the aggregation process in response to advances in computer technology, improved displaying tools, and data visualization, which allowed a better understanding of water quality. The NSFWQI, which used the Delphi approach for variable selection, served as a basis for the original OWQI [74].
The OWQI takes into account measurements of the eight factors that affect water quality, including T°, DO, BOD, pH, N O 3 , P O 4 3 , and FC (Equation (7)). The categories of impairment used to classify the water quality factors include oxygen depletion, eutrophication (the potential for excessive biological development), dissolved chemicals, and health risks [82].
O W Q I = n i = 1 n 1 S I i 2
O W Q I = S Q R T   ( 8 1 S I T ^ 2 + 1 S I D O ^ 2 + 1 S I B O D ^ 2 + 1 S I p H ^ 2 + 1 S I T S ^ 2 + 1 S I N ^ 2 + 1 S I P ^ 2 + 1 S I F C ^ 2   )
4.
Logarithmic Aggregation: New Water Quality Index Proposed by Said et al. 2004 [39]
A new WQI (Equation (8) and Table 7) was created by Said et al. [39] utilizing logarithmic aggregation in an effort to alter the aggregation method while retaining the precision of the index and cutting down on the number of variables that must be added. After testing their index with a random database, they demonstrated that it produced findings that were comparable to those of the NSFWQI and WEP-WQI [32]. Said et al.’s proposal in 2004 [39] was to divide the WQI calculation into two parts. Variables related to water quality were ranked in the first one based on their importance. To give DO the highest weight, followed by fecal coliform and total phosphorus, and to maintain the index in a straightforward equation, numerous versions were tried in the second stage. Finally, the logarithm was employed to produce small numbers that the general public, stakeholders, and management decision-makers could use with ease. The following factors were chosen for the new WQI based on their amount of influence on water quality: DO, P O 4 3 , FC, TURB, and specific conductivity.
New W Q I = log   ( D O 1.5 3.5 T P     T U R B 0.15   15 F C 10000 + 0.14   S C 0.5 )  
where DO is the dissolved oxygen (% oxygen saturation); TURB is the turbidity (Nephelometric turbidity units (NTU)); TP is the total phosphates (mg/L); FC is the fecal coliform bacteria (counts/100 mL); and SC is the specific conductivity (MS/cm at 25 °C);
The index was designed to range from 0 to 3. The maximum or ideal value of this index is 3.
In very good water, the value of this index will be 3. From 3 to 2, the water is acceptable, and less than 2 is marginal and needs remediation; if one or two variables have deteriorated, the value of this index will be less than 2.
If most of the variables have deteriorated, the index is less than 1, which means that the water quality is poor [32].
5.
Fuzzy Logic: Icaga 2007 (Equation (9)) [40]
Icaga 2007 [40] developed the FL approach after being influenced by Silvert’s [41] work on the evaluation of the environment. According to Zadeh [42], FL is a type of multivalued logic that expresses a partial truth that can either be true or false. Contrary to Boolean logic [83], where variables’ truth values can only be the integer values 0 or 1, it accepts any real number between 0 and 1 [32]. Some people view the idea of “acceptability” as being ambiguous [41]. In order to translate quantitative data into something more palatable, fuzzy membership functions must first be defined to represent the level of acceptability (Figure 3).
Fuzzy   W Q I =   μ Ã x . x d x     μ Ã x d x
According to Icaga, six steps are needed to develop an FL index for a conventional classification containing four classes, as follows [40]:
  • Determination of the quality classes for the measured variables;
  • Arrangement of the variables according to their classes into the four groups;
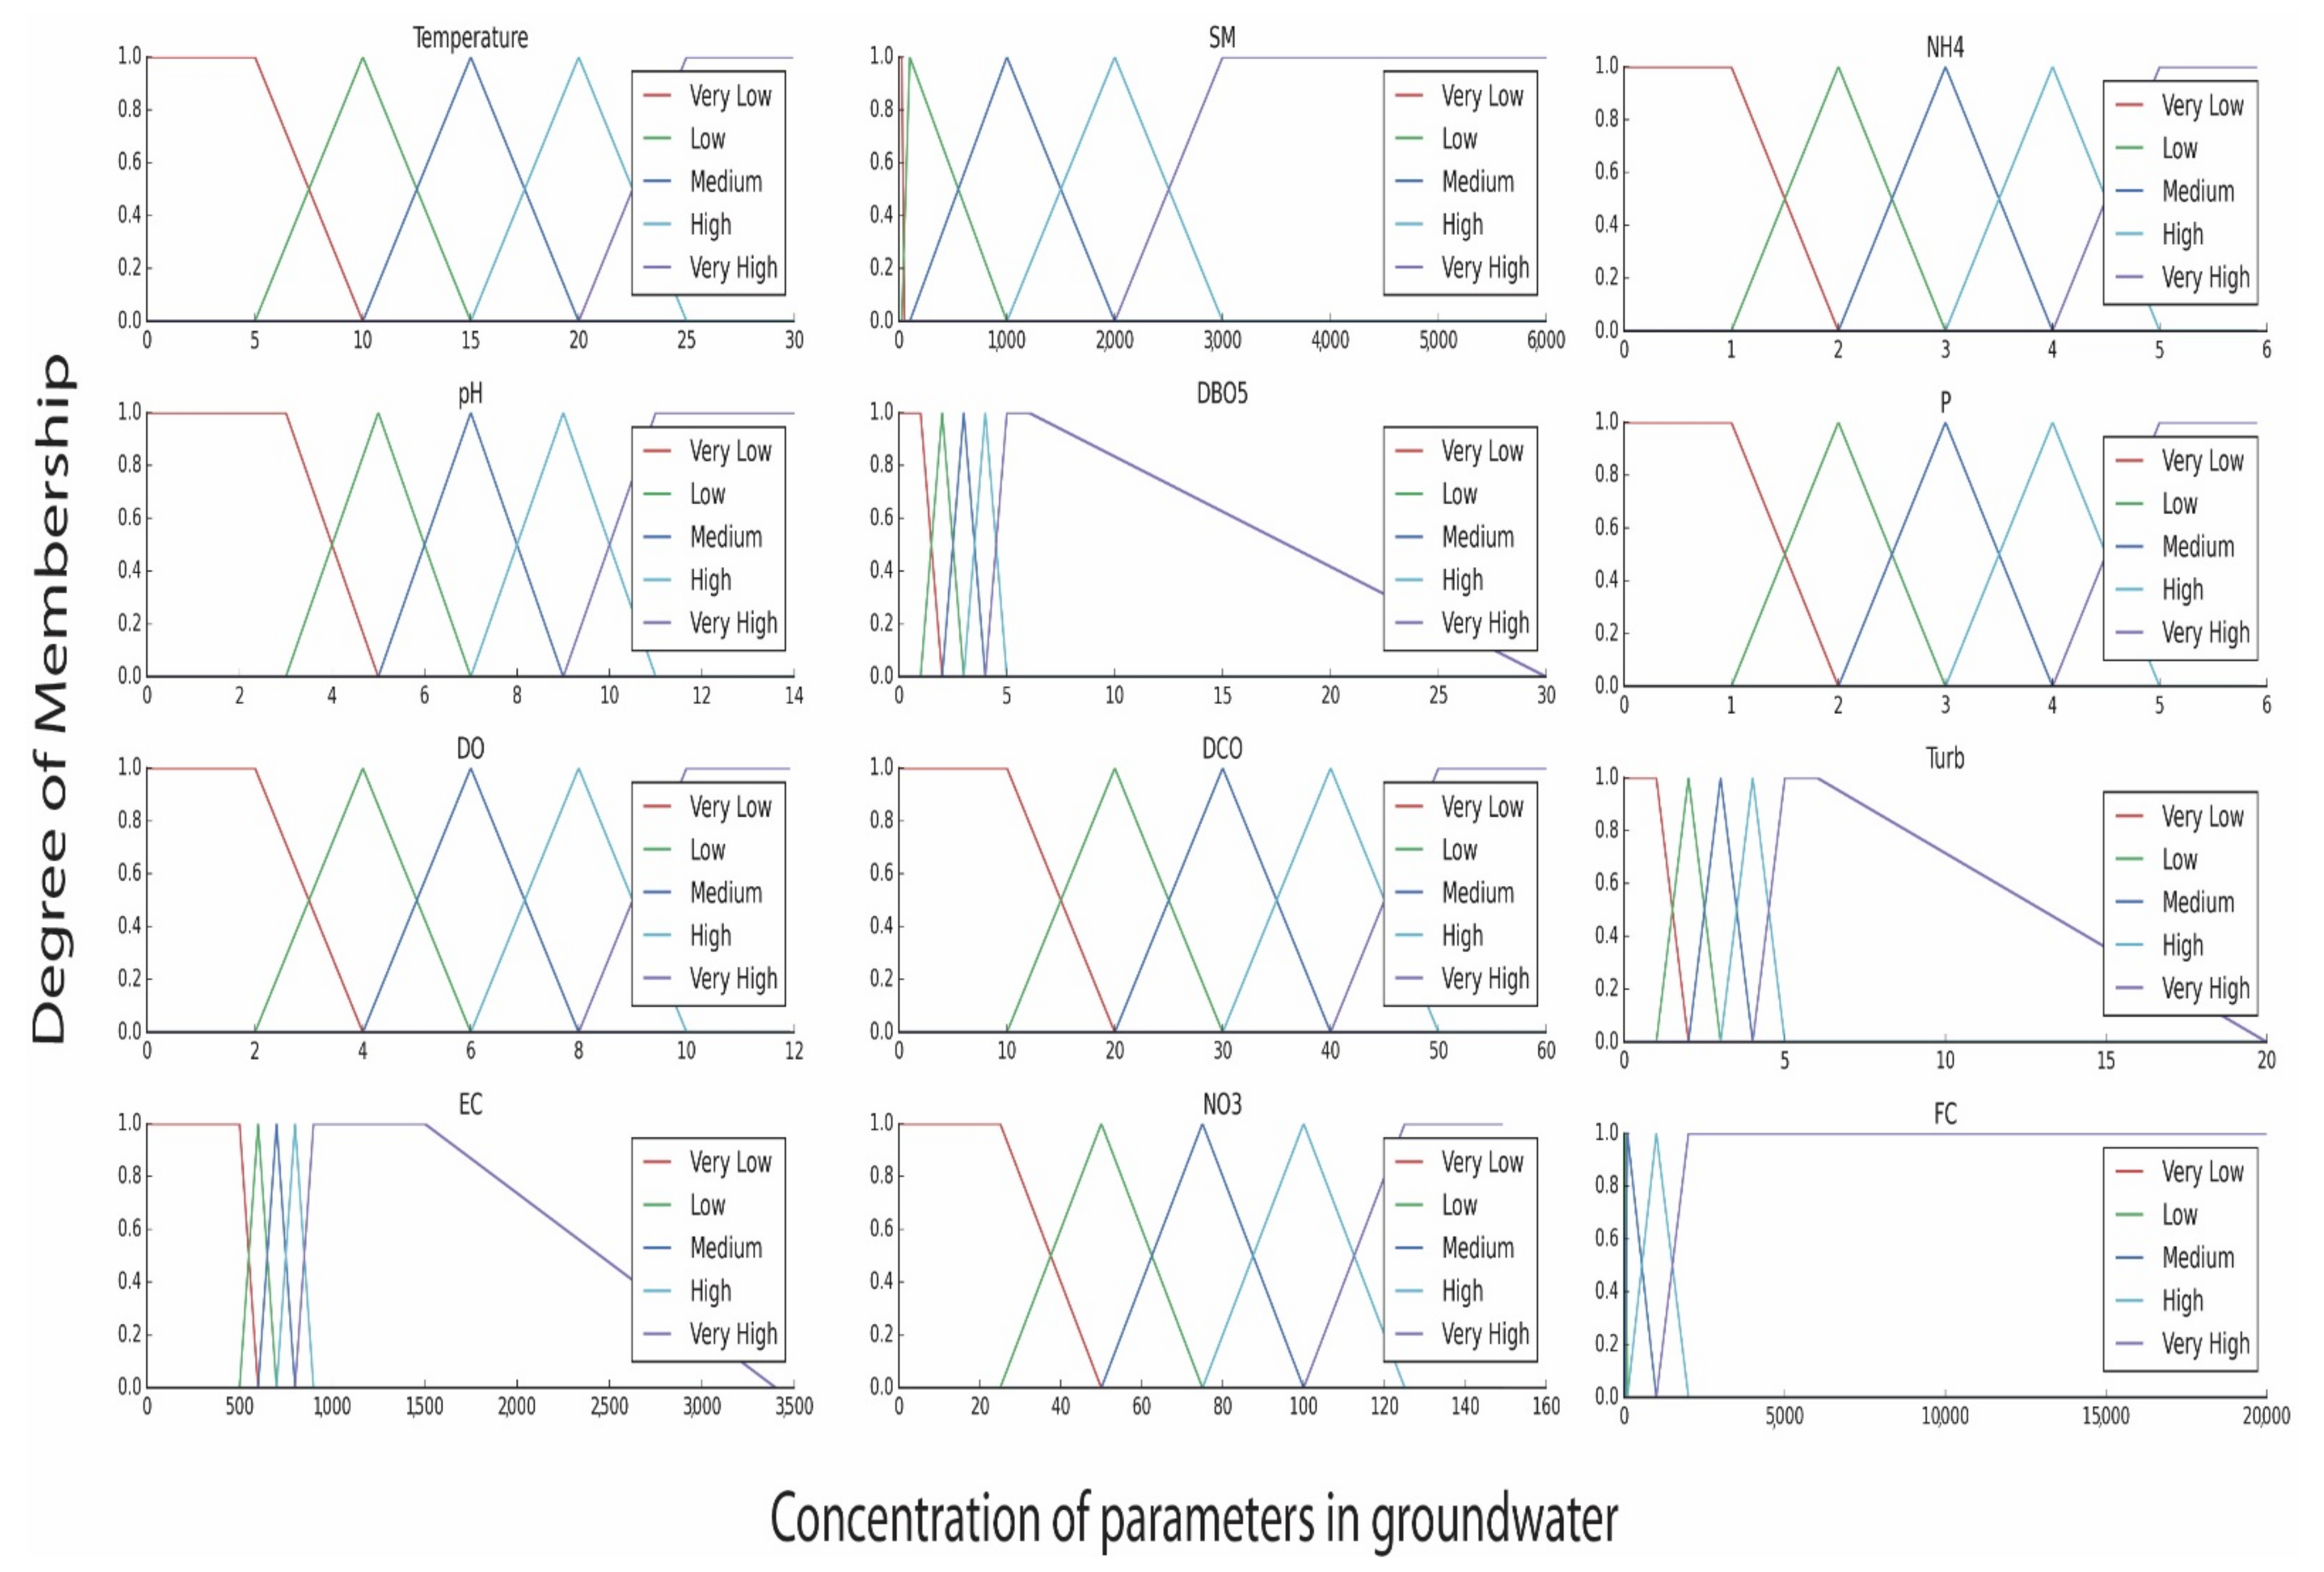
  • Application of membership functions;
  • Rule bases;
  • Use of the fuzzy algorithm: In the fuzzy algorithm, the Mamdani [84] approach is used. Fuzzy inferences of the groups are determined using grades of membership functions of the variables;
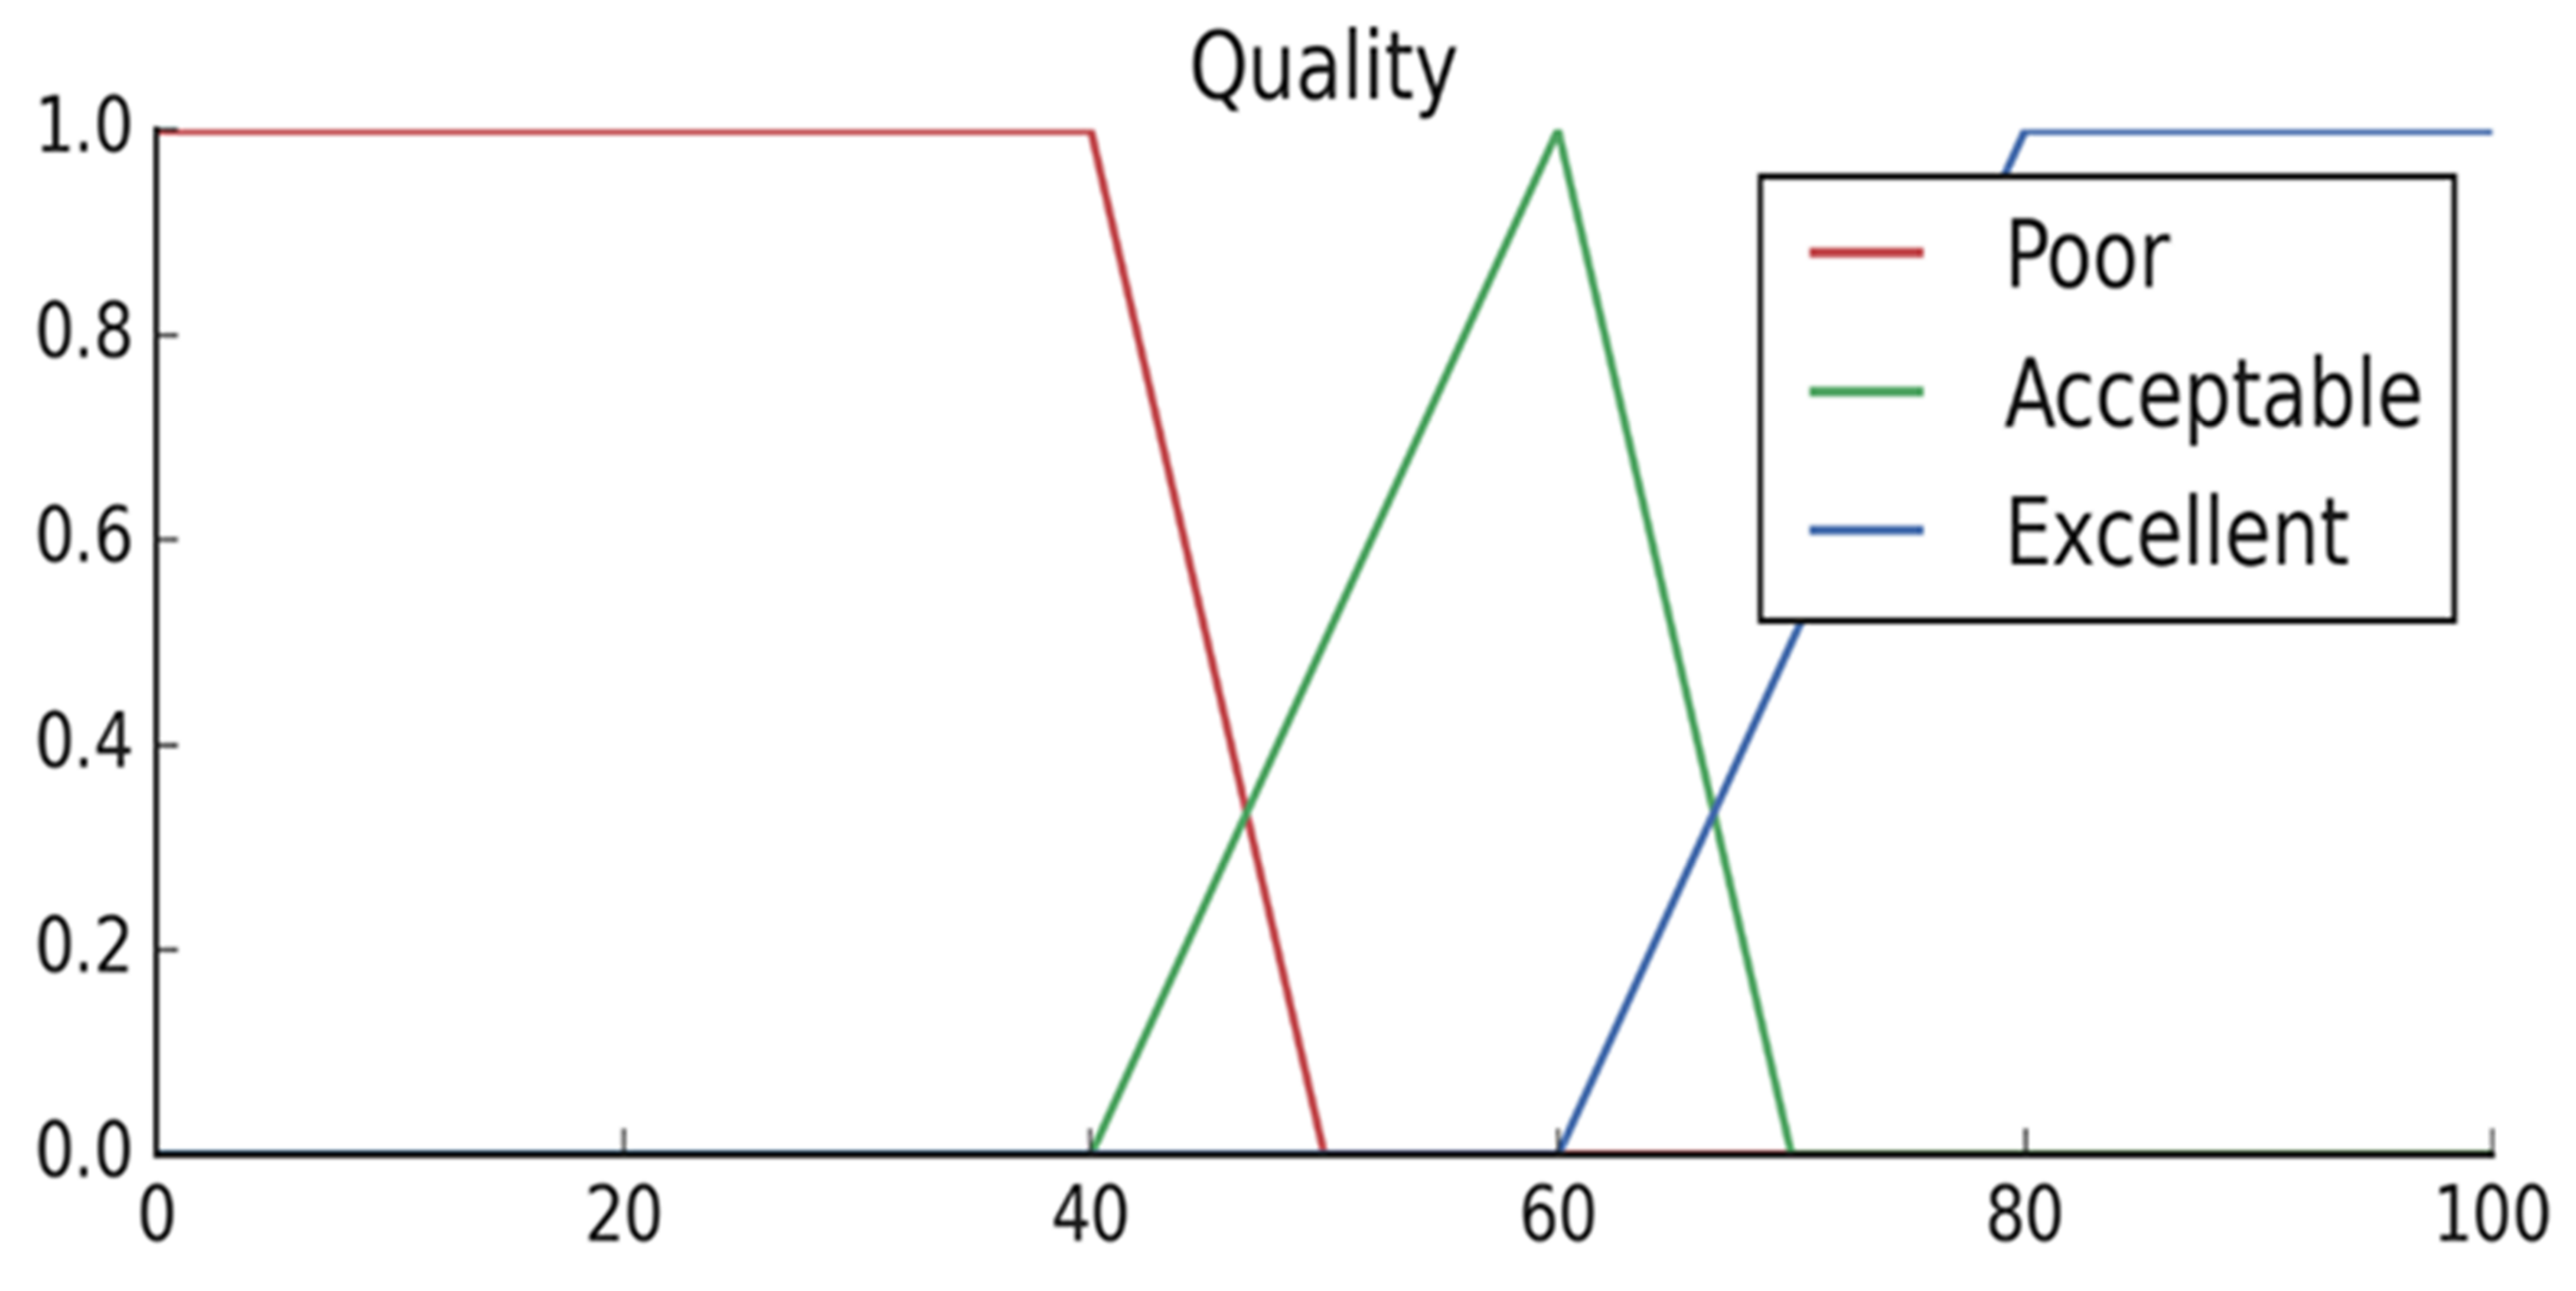
  • Defuzzification of the inferences using centroid methods, which calculate the center of gravity of the output function.
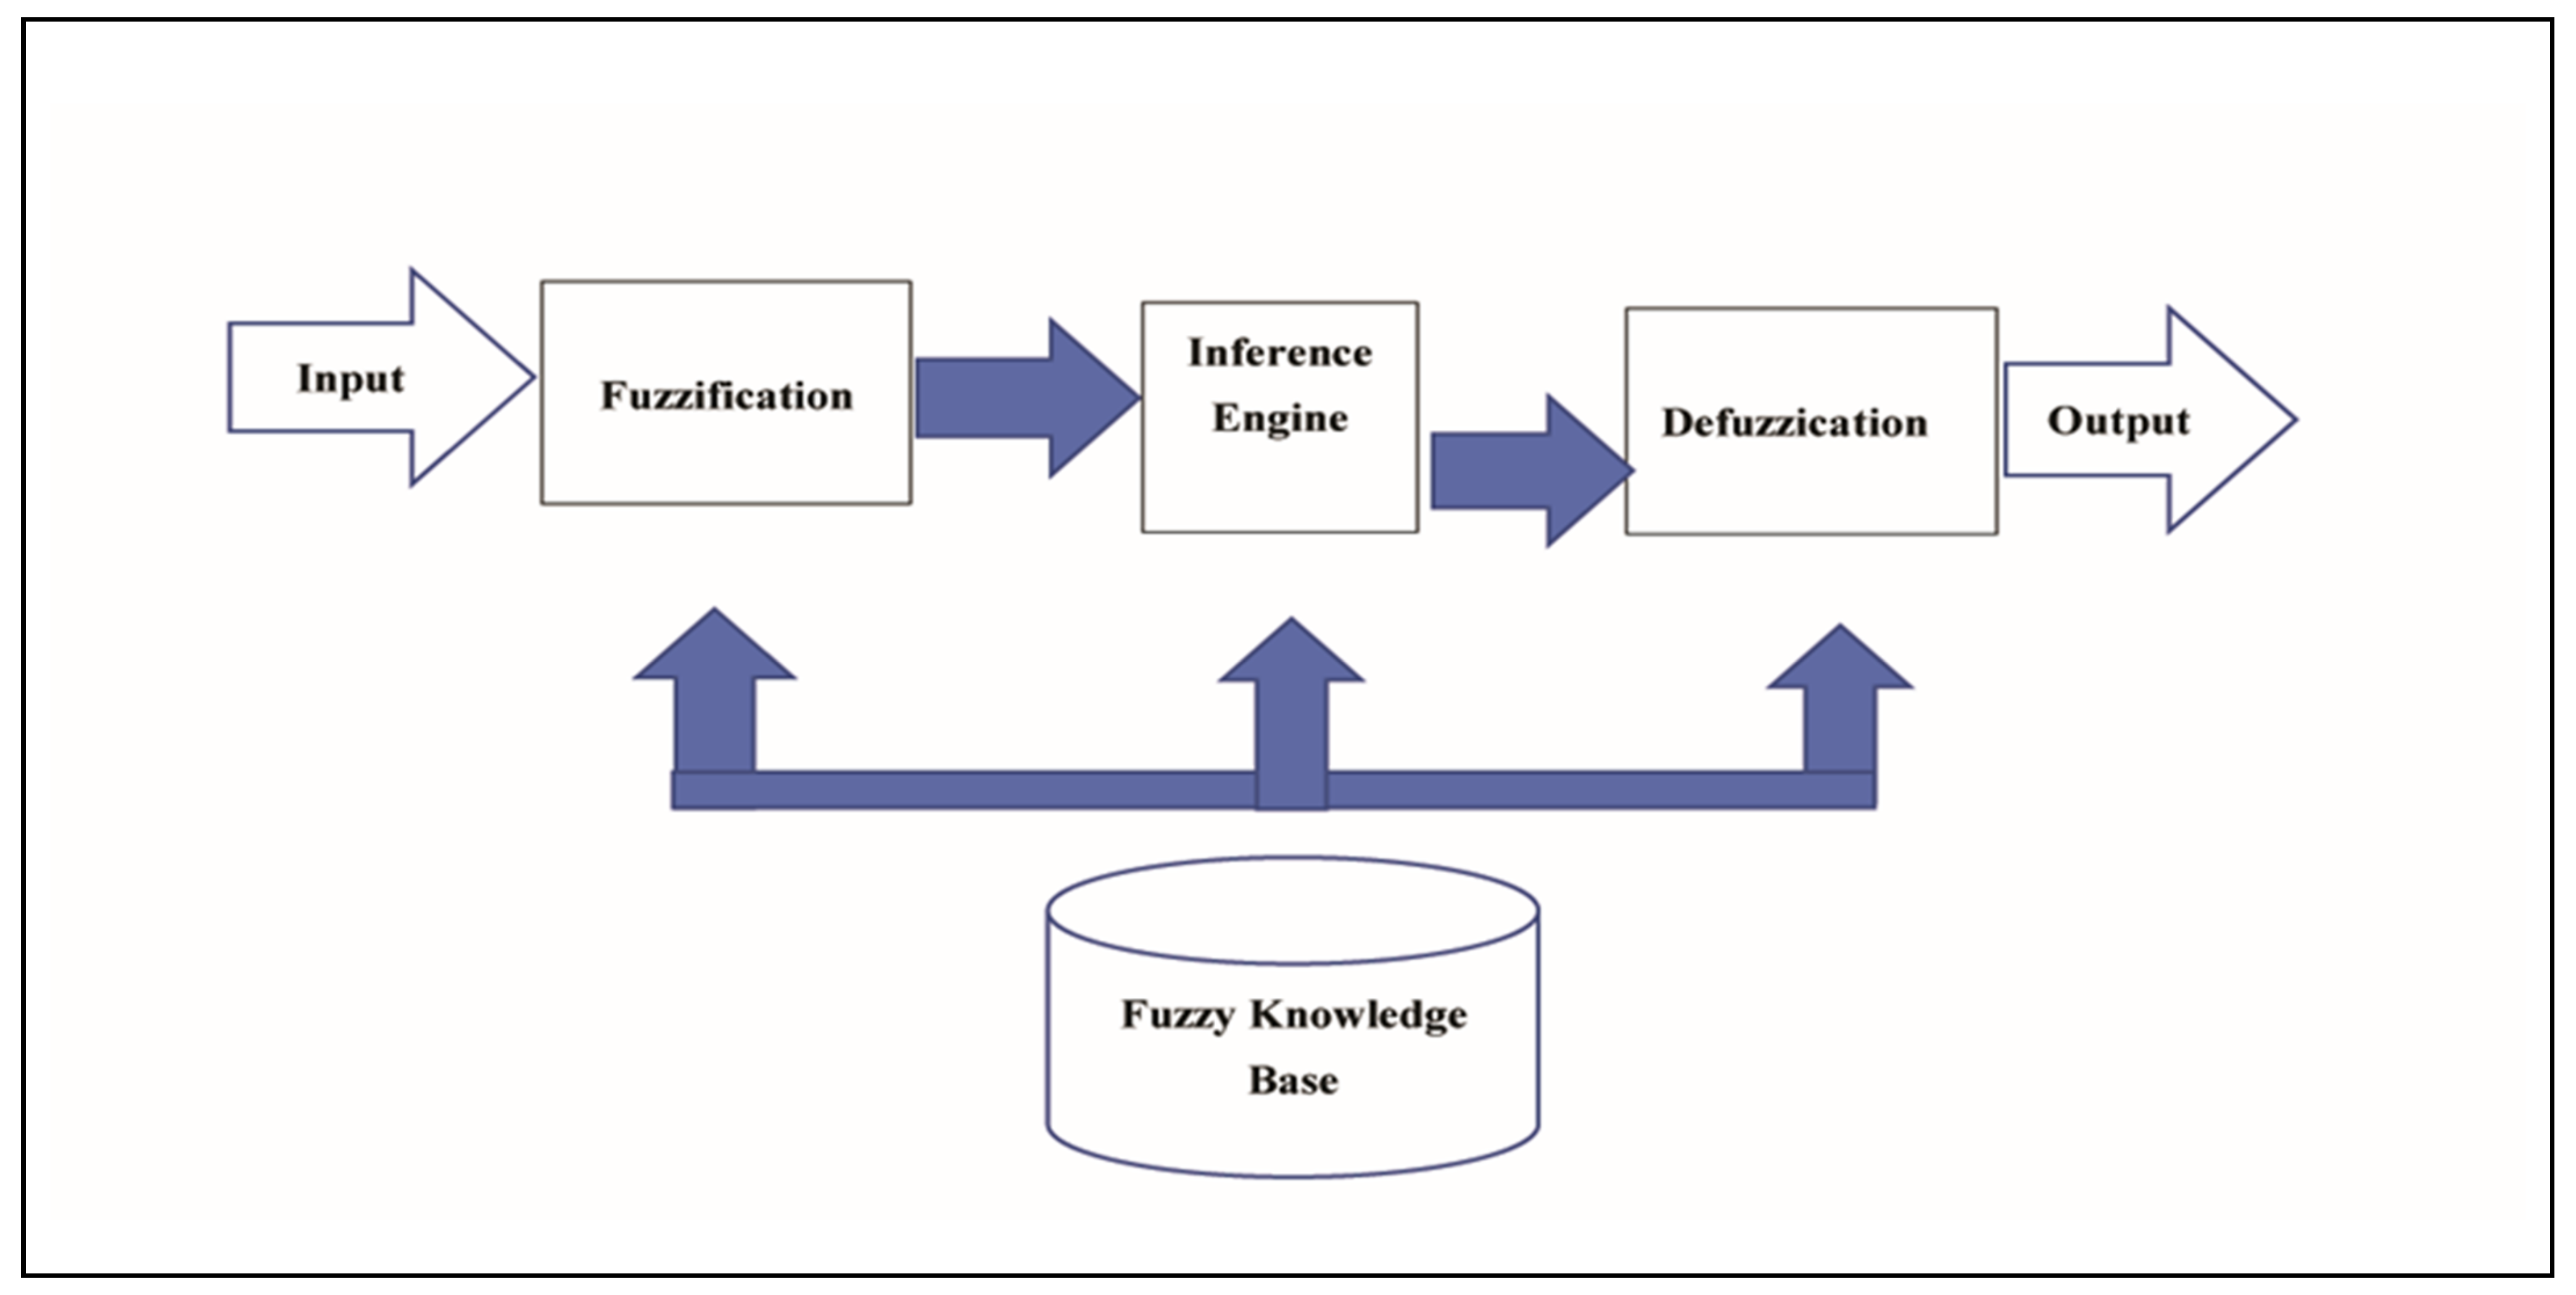
In order to develop systems more in line with the spirit of human thinking, Zadeh [42] introduced FL, which has since grown to be one of the most popular methods in the field of artificial intelligence. It is considered suitable for creating environmental indices. It has been demonstrated that this technique can handle complicated systems in ambiguous and imprecise situations [85].
It is an effective way to communicate evaluation results in a way that the general public, decision-makers, and non-experts in general may understand [41,85,86]. To characterize water quality, fuzzy-logic-based water quality indices are being developed [19,87,88,89,90]. The intricacy of the environmental circumstances has an impact on the outcome; this issue is connected to the “principle of incompatibility” [91].

2.3.2. FL Formalism

Based on fuzzy set theory, Zadeh developed FL in 1965 [42,92], which enables the consideration of any ambiguity or uncertainty. The idea of membership functions is a fundamental one in FL [51].

2.3.3. Fuzzification

To activate rules that are defined in terms of linguistic variables, net input values are mapped to those variables using membership functions. Additionally, the fuzzifier uses membership functions to assess the degree to which input values belong to each fuzzy set.

2.3.4. Evaluation of the Rule

Combining the fuzzy inputs yields a calculation of the rule’s strength. Multiple connective antecedents are combined using the fuzzy intersection operation. The strength value of the rule’s antecedent has a correlation with the rule’s consequent, and the most frequent way to entail a rule is to cut the consequent membership function at the level of the antecedent truth. Clipping is the name of this technique [51].

2.3.5. Aggregation of Rule Outputs

Using the fuzzy union of each individual rule contribution, the outputs of all rules are then combined into a single fuzzy distribution [51].

2.3.6. Defuzzification

The aggregated output fuzzy set is mapped to a precise number using several methods, including (1) the “centroid”, which is the most popular defuzzification method and involves calculating the center of gravity of the aggregate fuzzy set, (2) the “maximum”, (3) the “mean of the maxima”, (4) the “height”, and (5) the “modified height” [51].

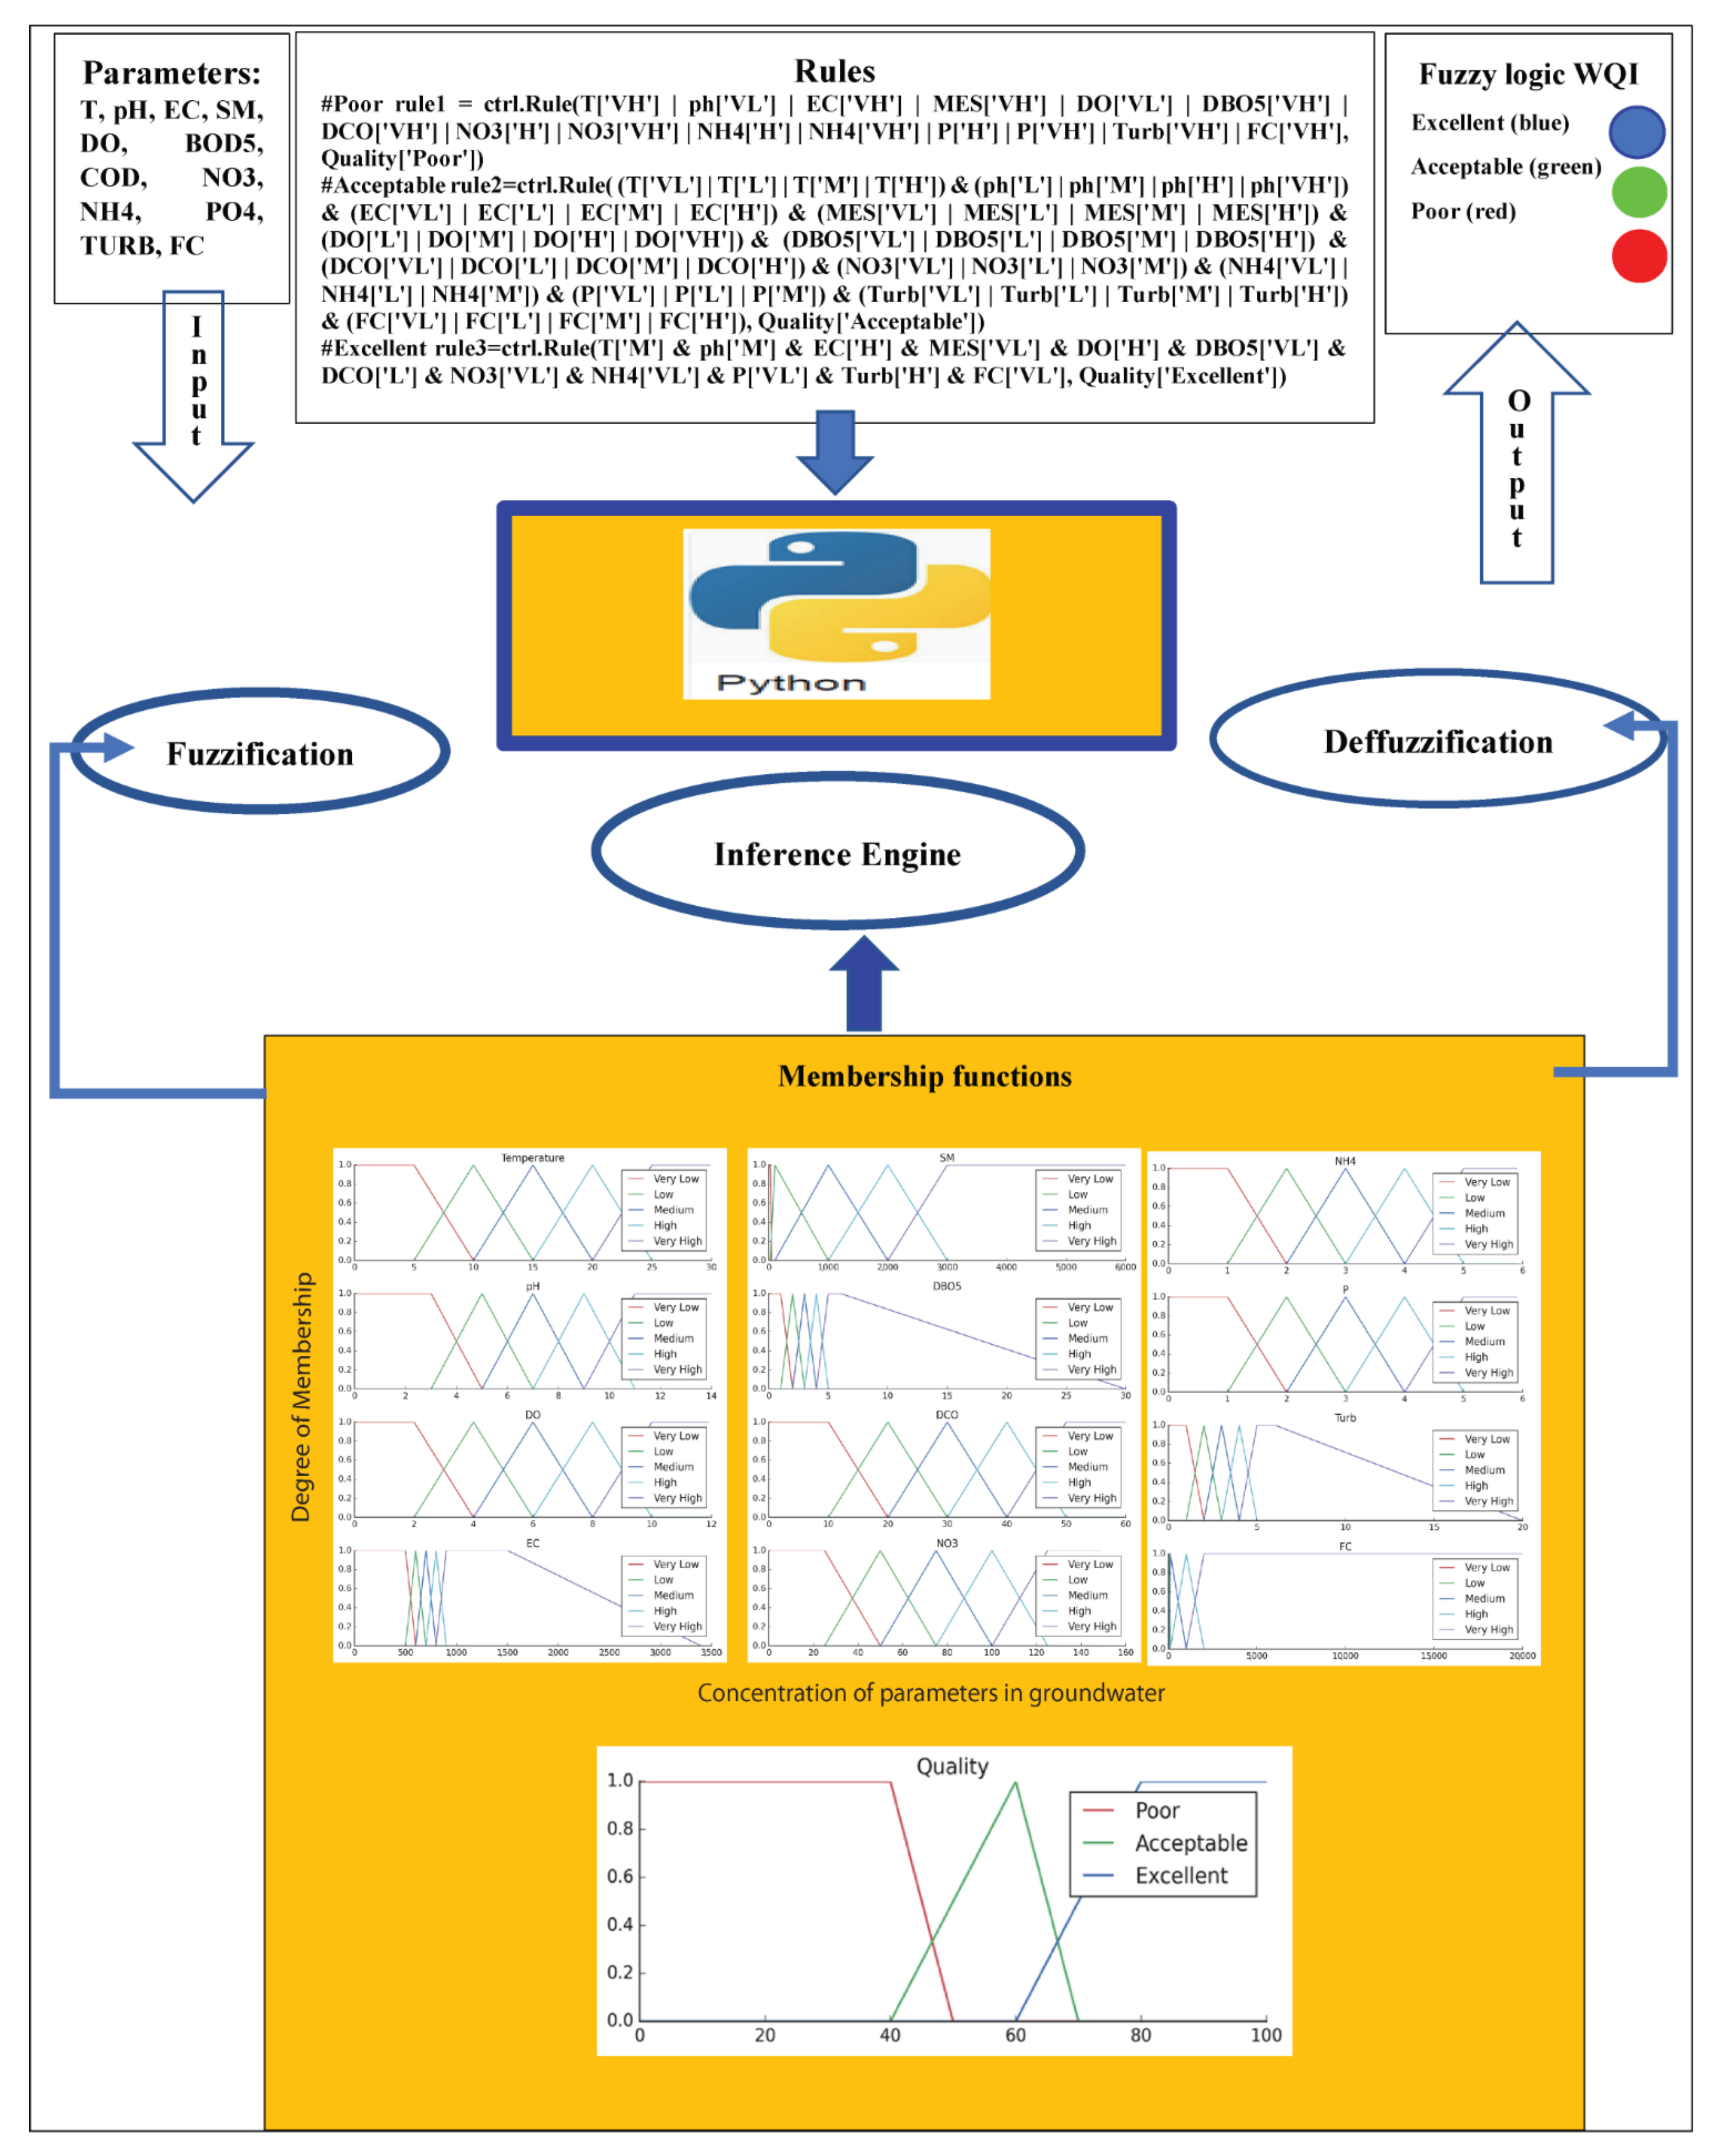
2.3.7. Membership Functions

A membership function, which can take trapezoidal, triangular, Gaussian, etc., forms, is used to represent a fuzzy subset of an input. Each point in a fuzzy set is assigned a membership score between 0 and 1 by the membership function. To define membership functions, several approaches can be utilized, including expert knowledge [93], genetic algorithms [94], fuzzy clustering, and neural networks [95].

2.3.8. Fuzzy Set Operations

The relationships among the fuzzy subsets are defined by using fuzzy set operators, which can be used in developing different systems based on fuzzy logic, of which three basic operators are: 1. Intersection (AND), 2. Union (OR), and 3. Negation (NOT).

2.4. Using Python Programming Language

The Python programming language is a sophisticated, object-oriented scripting programming language with dynamic semantics and an efficient and intuitive coding style [96,97,98]. It is a viable and attractive analytical tool for environmental research [99]. In this work, the SciKit-fuzzy [100] library was used to model the FL WQI (Figure 4). Physical–chemical and bacterial parameters were the predictor variables, while the WQI and FL models were the dependent variables. The generation of rules is a crucial step. It was achieved based on expertise and knowledge of the area under study.

2.5. Rules for Fuzzy Logic

The procedure performed within FL is described in Table 8 and Figure 4. We suggest that the levels of the thirteen parameters are sufficient to assess the quality of groundwater by means of an aggregate index called Fuzzy Water Quality (FGWQ). We chose “very low”, “low”, “medium”, “high”, and “very high” fuzzy sets for the inputs and “excellent”, “acceptable”, and “poor’’ fuzzy sets for the output. Trapezoidal membership functions were defined for the fuzzy sets in the extremities, while triangular ones were used for the in-between fuzzy sets (Figure 4 and Figure 5).
The robustness of the system depends on the number and quality of the rules [19]. In this study, we built the rules below:
#Poor
If T is “very high” or pH is “very low” or EC is “very high” or SM is “very high” or DO is “very low” or BOD5 is “very high” or COD is “very high” or NO3 is “high” or NO3 is “very high” or NH4 is “ high” or NH4 is “very high” or PO4 is “ high” or PO4 is “very high» or TURB is “very high” or FC is “very high” then Quality is “Poor”.
#Acceptable
If (T is “very high” or T is “low” or T is “medium” or T is “ high”) and (pH is “low” or pH is “medium” or pH is “ high” or pH is “very high”) and (EC is “very low” or EC is “ low” or EC is “medium” or EC is “ high”) and (SM is “very low” or SM is “low” or MES is “medium” or SM is “ high”) and (DO is “low” or DO is “medium” or DO is “high” or DO is “very high”) and (BOD5is “very low” or DBO5is “low” or BOD5 is “medium” or BOD5 is “ high”) and (COD is “very low” or COD is “low” or COD is “medium” or COD is “high”) and (NO3 is “very low” or NO3 is “low” or NO3 is “medium” and NH4 is “very low” or NH4 is “low” or NH4 is “medium”) and (PO4 is “very low” or PO4 is “low” or PO4 is “medium” and TURB is “very low” or TURB is “low” or TURB is “medium” or TURB is “ high”) and (FC is “very low” or FC is “low” or FC is “medium” or FC is “high”) then Quality is “Acceptable”.
#Excellent
If T is “medium” and pH is “medium” and EC is “high” and SM is “very low” and DO is “ high” and BOD5 is “very low” and COD is “low” and NO3 is “very low” and NH4 is “very low” and PO4 is “very low” and TURB is “ high” and FC is “very low” then Quality is “Excellent”.

3. Results and Discussion

3.1. Physical–Chemical and Bacteriological Parameter Assessment

Table 9 shows the results of the physical–chemical, mineral, and bacteriological parameters of nine samples. The groundwater T° was 18.8–20.9 °C in 2016 and 19.9-20.7 °C in 2017, with average T° values of 20.36 and 20.34, respectively. The majority of the samples in the study showed nearly neutral properties, lower than the maximum value recommended by Moroccan standards, with a pH range between 7.17 and 8.05.
The value of EC varied between 820 and 3250 µS/cm in 2016 and 2017, with a remarkable maximum value at sites P2, P3, P4, and P6, exceeding the criteria of the Moroccan standard set at 1300 µs/cm (Table 9). Except for sites P1, P2, and P4, all site points had DO concentrations between 1.05 mg/L and 7.56mg/L, complying with Moroccan standards (Table 9). The concentrations of BOD5 show that the values varied from 2 to 29 mg/L and were relatively high compared to the value of 3 mg/L set by the Moroccan standard (Table 9). Given that the COD concentrations increased from 2016 to 2017, with a range of 1.05–42.90 mg/L, it is also reported that there were levels higher than those recommended by Moroccan norms. TURB is a measure of the lack of clarity of the water. The TURB values of the samples were between 1.25 and 20 NTU, and the admissible limit of TURB is 5 NTU according to Moroccan standards (Table 9).
High concentrations of N O 3 and N H 4 + were observed and ranged from 0.13–26.6 mg/L ( N O 3 ) to 0.33–0.57 mg/L ( N H 4 + ) in 2016 and 2017, respectively, with a pH that was somewhat neutral (Table 9). N H 4 + is formed through the fixation of nitrogen from the atmosphere by soil microbes, while nitrifying bacteria convert nitrogen to N O 3 under aerobic conditions [101]. The reason for the presence of water pollution in these wells during the rainy season is the transport of soluble substances to the water table, so most of the sources of nitrogen pollution come from the soil, septic tanks, and animal manure.
Normal concentrations of P O 4 3 recorded at the nine site points ranged from 0.07 mg/L to 3.48 mg/L, which is less than the 5 mg/L recommended by Moroccan regulations (Table 9). Hence, this confirms the absence of eutrophication [100]. FC showed high values in 2016 and 2017, with an average of 585–585.22 MPN/100 mL, which is more than the 20 MPN/100 mL recommended by Moroccan regulations (Table 9). This indicates recent fecal contamination [102] in the wells, which are used in this region for drinking water. It also means that there is a greater risk that pathogens are present [100]. Based on this result, the source of this fecal pollution could be directly related to TAC and other agriculture activities [58]. It is crucial to note the contact between TAC discharge, the Charafate wastewater treatment plant discharge, the Ouljat Echatt river, and the nine wells [58]. Indeed, organic and mineral pollution negatively impacted the groundwater’s chemical and physical properties [58].
Indeed, mineral pollution negatively impacts the groundwater’s chemical and physical properties. N O 3 is one of the most common mineral pollution sources in groundwater across the world [103]. Jalali et al. (2011) [104] conducted research on groundwater N O 3 contamination in western Iran and discovered N O 3 leaching from agricultural soils, which can raise N O 3 concentrations in groundwater. Chen et al. (2016) [105] discovered a greater concentration of N O 3 in northwest China groundwater and discovered that an increased fertilizer rate, intensive irrigation, and higher permeability might be the primary reasons for elevated N O 3 in northwest China groundwater. Furthermore, Burow et al. (2010) [106] discovered that the global rise in nitrogen fertilizer usage over the last few decades had resulted in higher N O 3 concentrations in groundwater.
Groundwater pollution can have an influence on human health, environmental quality, and socioeconomic development. Many studies, for example, have found that excessive levels of organic pollutants pose a health risk to human populations [107]. This is especially important for newborns and children, who are more vulnerable to the impacts of these pollutants than adults [108,109]. For example, “blue baby syndrome,” also known as newborn methemoglobinemia, is caused by high N O 3 concentrations in the drinking water used to create baby formula. Groundwater pollution can also have an impact on human health through its impacts on the food production chain.

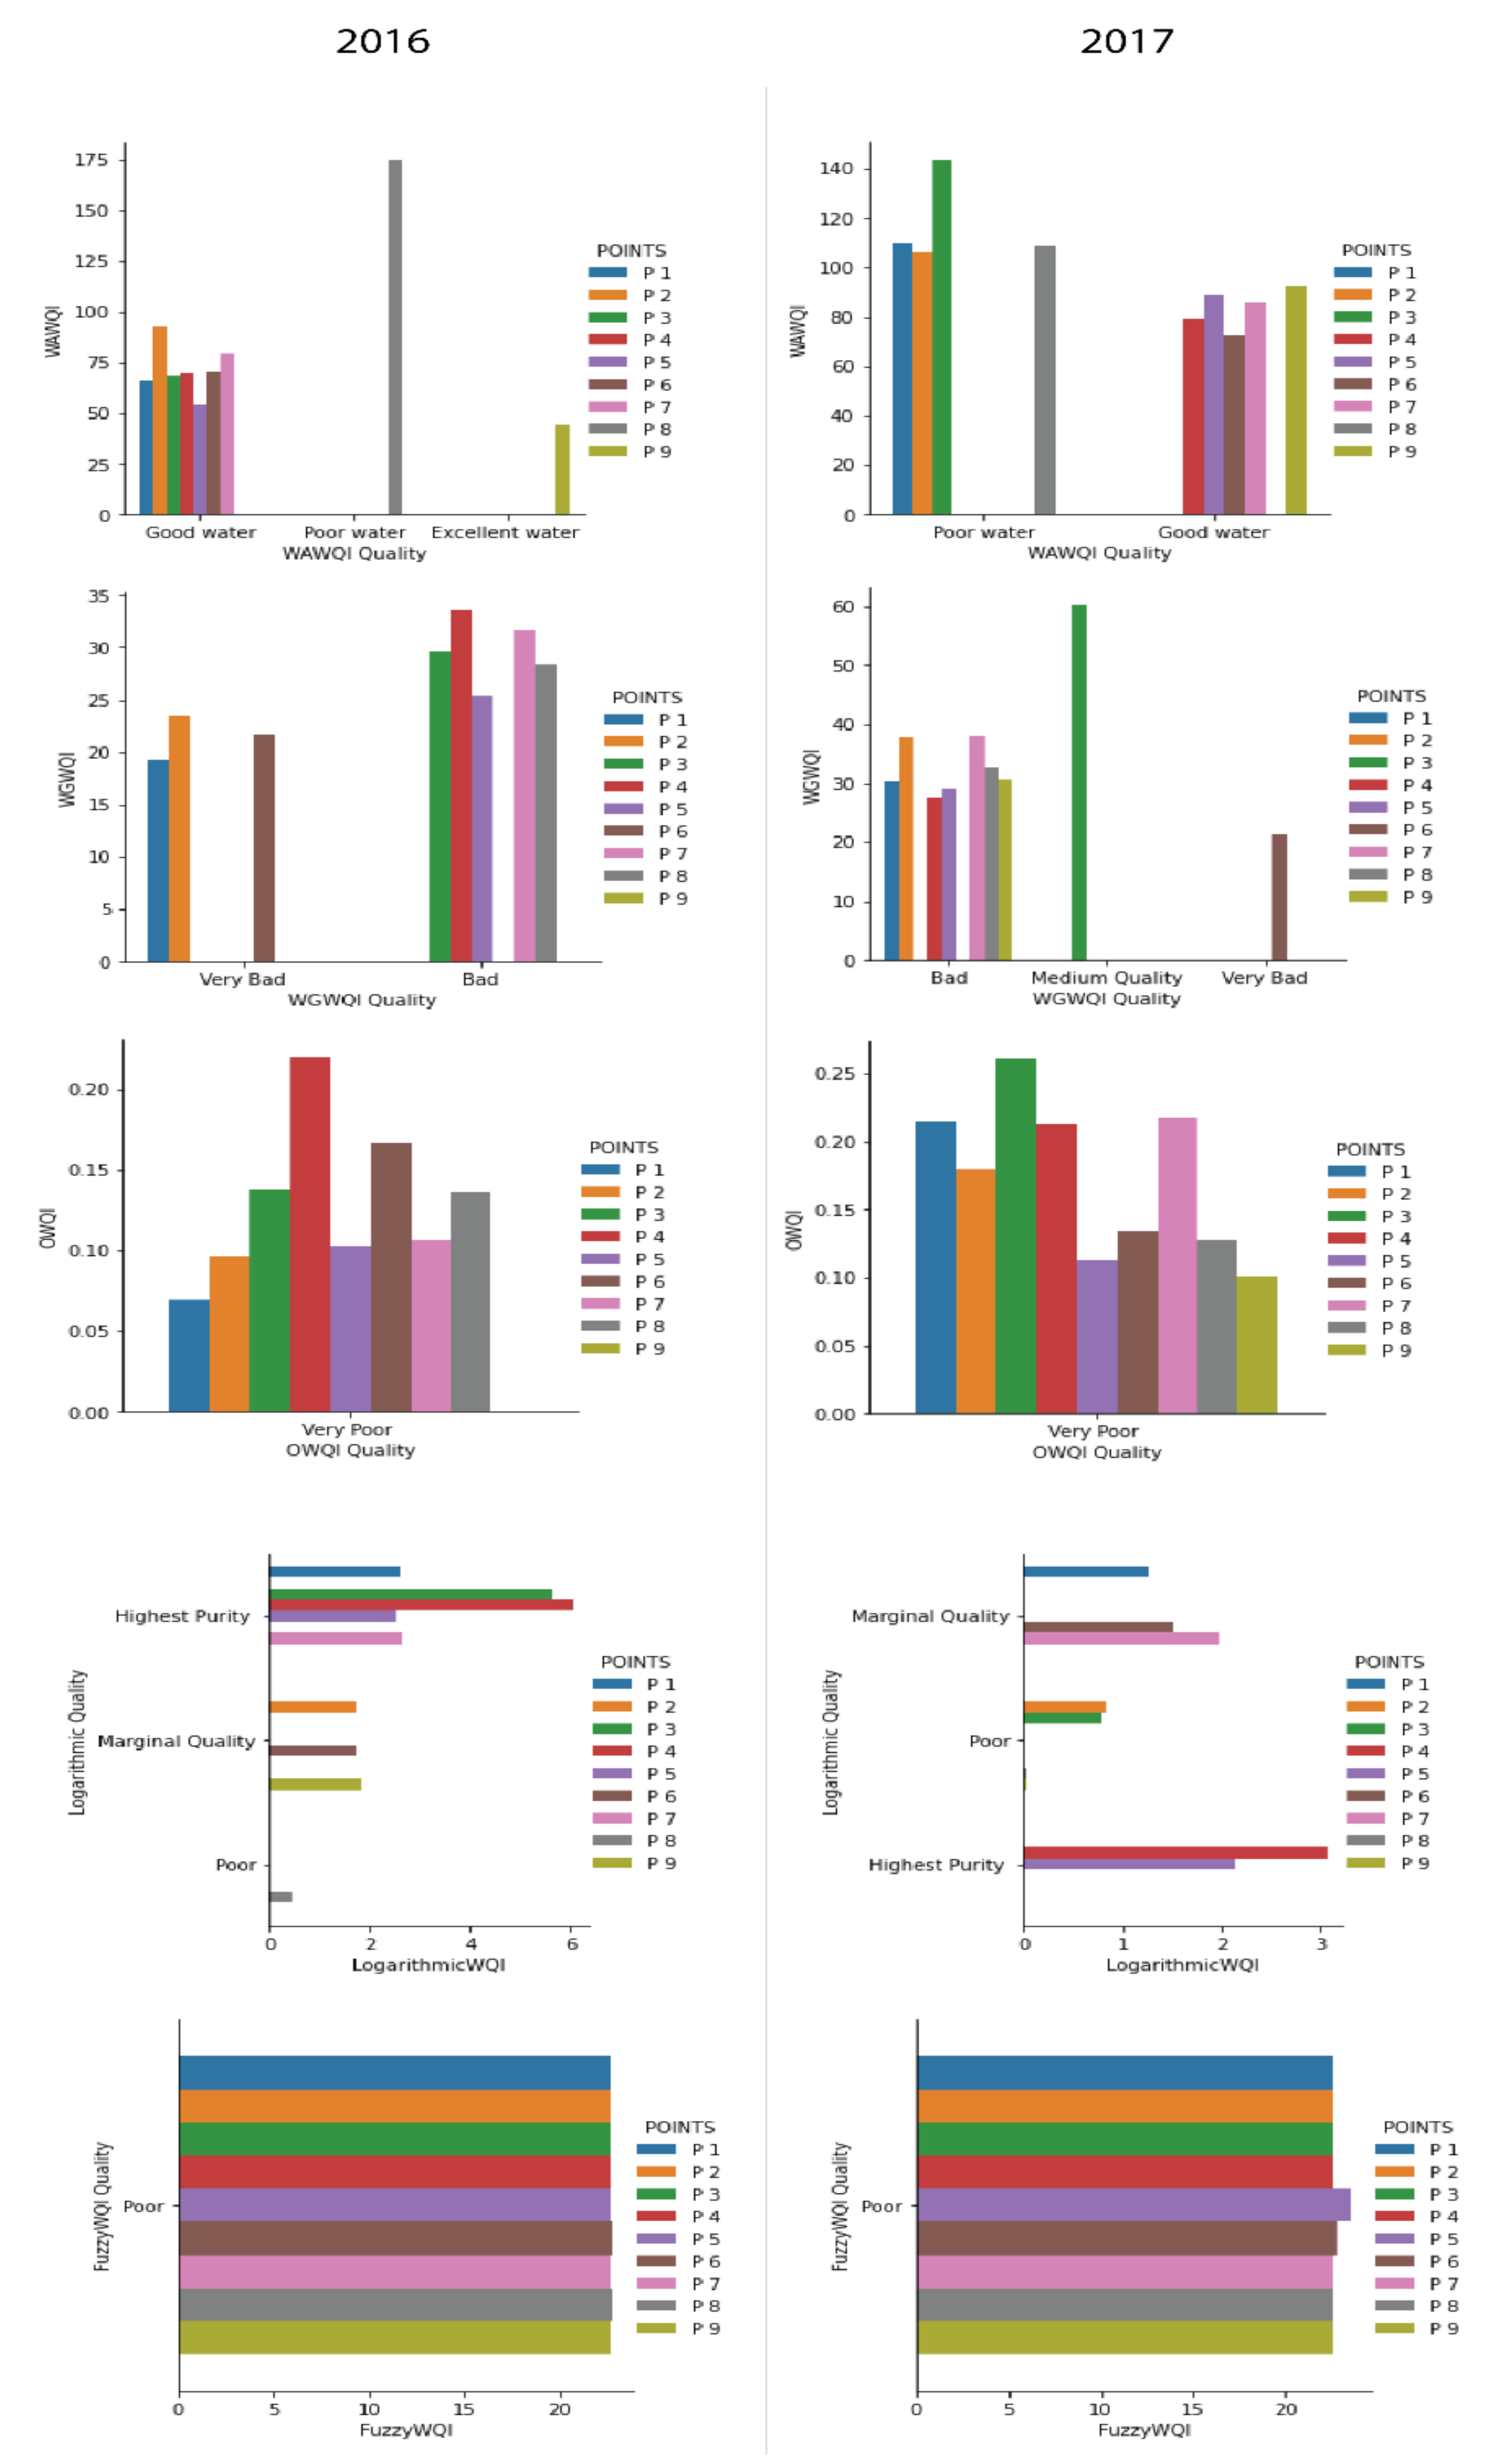
3.2. Evaluation of the Groundwater Quality Using Different WQIs

Based on prior work on WQIs, this study proposes a methodology for evaluating the performance of the groundwater quality utilizing data from all well-water samples at the Jouamaa Hakama site. To that end, this study compared four water quality indices and FL. Table 9 displays the values of the water quality metrics used in this investigation for all wells in 2016 and 2017.
According to the FL WQI, WGWQI and OWQI findings, all or the majority of the wells are of poor quality, indicating that the groundwater is below the permitted limit for human consumption based on Moroccan regulations. However, the WAWQI indicates that the majority of the wells are of good quality, and the Logarithmic WQI indicates that the quality is of the greatest purity in eight cases, intermediate quality in six cases, and poor quality in the remaining five cases (Table 10 and Figure 6, Figure 7 and Figure 8).
According to Table 10, the WAWQI in 2016 ranged between 43 and 174, indicating good quality in the majority of wells. In 2017, the same index ranged from 72 to 143, indicating acceptable quality in just 55% of the wells and low quality in the remaining wells (indicates degradation in P1, P2, P3, and P9). The Logarithmic WQI shows similar results to the WAWQI, with the highest purity in the majority of the wells, except for P8 in 2016 and P2, P3, P8, and P9 in 2017.
Considering the WGWQI, we discovered that water quality ranges from bad to extremely poor in the majority of the cases, with the exception of P3 in 2017. The OWQI classified all samples as very poor quality between 2016 and 2017, with a maximum value of 0.26 in P3. Finally, FL WQI rates all samples as low quality, with a score of 22.59 in the majority of cases.
There is a significant disparity between the findings obtained by the various WQIs and FL. This can be explained by either the differences in the aggregation technique of the input parameters and the problems arising from them or the fact that many parameters were left out of certain WQIs.
In the case of the WAWQI, which is based on the additive method, the true overall quality is not reflected since lower values of one or some subindices are overridden by higher values of other subindices, or vice versa [110]. For example, the water quality in well P9 in 2016 was “Excellent” according to the WAWQI, while the FC concentration in the same location was estimated to be 864 (MPN/100 mL), indicating fecal contamination by far exceeding the Moroccan standard of 20 (MPN/100 mL), hence making the water unsuitable for drinking.
In the case of the Logarithmic WQI, the index considers only five parameters: DO, turbidity, TP, EC, and FC. The quality results from the latter index can be misleading, especially in the case of the ideal values of these five parameters, where the index will classify the point as being of the highest purity, but the other parameters (not included in the equation) by far exceed the standard limits.
However, the WGWQI, which is based on the geometric mean, and the OWQI, which is based on the harmonic mean, can be considered accurate in the context of this study, since they coincide with the results of the parameter assessment and account for the contribution of parameter values indicating low quality. This is explained by the fact that, from their aggregation functions, they are more sensitive to the more degraded input parameters, which alleviates the eclipsing effect [111].
The FL WQI gives equal consideration to both its measured value and the groundwater quality standard in its evaluation, while the former only considers the water quality standard. The FL WQI operates in a way such that all parameters’ quality requirements should be met to achieve the quality objective. The FL WQI is more effective in this context because it collects expert knowledge using the Mamdani inference system, which has proven to simulate an expert’s knowledge in a way that compares to human thinking [85,112]. Furthermore, the effectiveness of the FL WQI has been validated in previous work, such as [113,114], and the results are confirmed through the parameter assessment in Section 3.1 and are close to the results obtained in [58], in which researchers assessed water quality in the same study area by leveraging GIS and analyzing physical–chemical indicators with respect to Moroccan standards. The latter study concluded that water in almost all samples had been contaminated due to urban and agricultural activities.

4. Conclusions

The results of the physical–chemical, mineral, and bacteriological analyses in Jouamaa Hakama groundwater showed high concentrations of TURB, COD, BOD5, SM, P O 4 3 -, N O 2 , N O 3 ,   N H 4 + , DO, EC, and FC in nine wells. These exceed the Moroccan standards, except for pH, T°,   a n d   N O 3 , which were found to be normal in all wells. This showcases the vulnerability of the water quality of the wells where the Ouljat Echatt river runs with treated TAC discharges from the Chrafate wastewater treatment station. Additionally, these results confirm the pollution of the groundwater in the Hakama region and the need for more attention and monitoring of water resources in the north of Morocco.
This exploratory study of using WQIs and FL for testing the groundwater quality determination performance in order to support decision-makers in the north of Morocco showed the poor quality of groundwater wells. The findings indicate that the groundwater is below the human consumption norm based on Moroccan standards. In detail, the comparison between the WQIs showed that the arithmetic WQI indicates that the majority of the wells are of good quality, and the Logarithmic WQI indicates that the quality is of the greatest purity in seven cases, intermediate quality in six cases, and poor quality in the remaining five cases. The Weighted Geometric WQI and Oregon WQI indicate that the groundwater is below the acceptable standard for human consumption. FL indicates poor quality at all sampling points.
The comparison of the data produced from the different WQI computations and FL reveals that there is a significant difference between the results obtained by the WAWQI and Logarithmic WQI with the FL model. On the other hand, similar water quality was indicated by the FL WQI, WGWQI, and OWQI. While the WAWQI and log WQI indicate high water quality in the majority of the samples examined, these WQIs are deemed unreliable in this study since they do not reflect the reality of the area. Generally, FL showed more accurate results and may be used to confirm other WQI outcomes. This study implies that FL might be a potential alternative to WQIs and standard groundwater quality models, particularly in unpredictable situations.
Additionally, the study presents the first step in the implementation of new models based on WQIs and FL that can assist decision-makers on wells’ closure. The relationship between these methods provides an estimated determination of potential pollution in groundwater. Indeed, the future development of the method based on this exploratory study can provide low-cost and spatial information for Jouamaa Hakama groundwater monitoring.
Hence, this study demonstrates the potential of WQIs and FL—using water quality indicators—as a useful tool for organic and mineral groundwater quality and, in particular, the use of these data for developing prediction models, which could be a cost- and time-effective technique compared to classical methods used in the north of Morocco.
This is a preliminary result for monitoring groundwater quality using WQIs. To improve this tool and the Jouamaa Hakama region’s groundwater quality, some objectives following this study are as follows:
-
Didactical field sampling: two times per month to obtain more data.
-
Inclusion of more bacteriological parameters in WQIs, such as total coliforms and pathogens, hydrochemical analysis, and heavy-metal parameters, to enhance water quality assessment, because most nitrate, N O 2 , and FC pollutants come from sewage water and industrial areas.
-
Control of the effectiveness of Charafate wastewater treatment plants, such as physical and chemical (jar test) analyses and bacteriological analysis, to confirm the source of pollution in this area.
-
Control of TAC wastewater quality and its compliance with Moroccan environmental regulations.
-
More studies on the techniques and methods of applying suitable treatment for liquid effluents from agriculture, industrial, and urban areas.
-
Establishment of the deep monitoring of the domestic water sanitation network in urban riparian areas to maintain its balance.
-
The adoption of machine-learning techniques for the prediction of important pollution indicators in our study area.
-
The development of a real-time model for groundwater monitoring based on the prediction of pollution indicators for supporting decision-makers in the north of Morocco.

Author Contributions

Conceptualization, E.K.C. and E.M.A.; methodology, E.K.C., E.M.A. and T.A.T.; software, E.K.C. and T.A.T.; validation E.K.C., E.M.A. and T.A.T.; formal analysis, E.K.C., T.A.T. and F.S.; writing—original draft preparation, E.K.C., E.M.A. and T.A.T.; writing—review and editing, E.K.C., E.M.A., T.A.T. and H.E.A.; visualization, E.K.C. and E.M.A.; supervision, E.K.C. and F.S.; funding acquisition, E.K.C. All authors have read and agreed to the published version of the manuscript.

Funding

This research received no external funding.

Acknowledgments

The authors would like to thank all those who collaborated in this work on the field sampling, laboratory analysis, and writing manuscript teams. El Khalil Cherif was supported by FCT with the LARSyS—FCT Project UIDB/50009/2020 and by the FCT project VOAMAIS (PTDC/EEI-AUT/31172/2017, 02/SAICT/2017/31172).

Conflicts of Interest

The authors declare no conflict of interest.

References

  1. Ramakrishnaiah, C.R.; Sadashivaiah, C.; Ranganna, G. Assessment of Water Quality Index for the Groundwater in Tumkur Taluk, Karnataka State, India. E J. Chem. 2009, 6, 523–530. [Google Scholar] [CrossRef]
  2. Benseddik, B.; El Mrabet, E.; El Mansouri, B.; Chao, J.; Kili, M. Delineation of Artificial Recharge Zones in Mnasra Aquifer (NW, Morocco). Model. Earth Syst. Environ. 2017, 3, 10. [Google Scholar] [CrossRef]
  3. Jayaprakash, M.; Giridharan, L.; Venugopal, T.; Krishna Kumar, S.P.; Periakali, P. Characterization and Evaluation of the Factors Affecting the Geochemistry of Groundwater in Neyveli, Tamil Nadu, India. Environ. Geol. 2008, 54, 855–867. [Google Scholar] [CrossRef]
  4. Alexakis, D.E. Meta-Evaluation of Water Quality Indices. Application into Groundwater Resources. Water 2020, 12, 1890. [Google Scholar] [CrossRef]
  5. Aghlmand, R.; Rasi Nezami, S.; Abbasi, A. Evaluation of Chemical Parameters of Urban Drinking Water Quality along with Health Risk Assessment: A Case Study of Ardabil Province, Iran. Int. J. Environ. Res. Public Health 2021, 18, 5179. [Google Scholar] [CrossRef] [PubMed]
  6. Bougarne, L.; Bouchamma, E.; Abbou, M.B.; Bouka, H. Assessment of the Water Quality of the Reservoir Bab Louta (Taza, Morocco). Mater. Environ. Sci. 2017, 8, 2296–2301. [Google Scholar]
  7. Baite, W.; Boukdir, A.; Zitouni, A.; Dahbi, S.D.; Mesmoudi, H.; Elissami, A.; Sabri, E.; Ikhmerdi, H. Diagnosis of the Ghiss Nekor Aquifer in Order to Elaborate the Aquifer Contract. In Proceedings of the E3S Web of Conferences; EDP Sciences: Les Ulis, France, 2018; Volume 37, p. 1006. [Google Scholar]
  8. Nouayti, A.; Khattach, D.; Hilali, M.; Nouayti, N.; Arabi, M. Assessment of Groundwater Quality Using Statistical Techniques in High Basin of Guir (Eastern High Atlas, Morocco). Mater. Today Proc. 2019, 13, 1084–1091. [Google Scholar] [CrossRef]
  9. Alexakis, D.; Tsihrintzis, V.A.; Tsakiris, G.; Gikas, G.D. Suitability of Water Quality Indices for Application in Lakes in the Mediterranean. Water Resour. Manag. 2016, 30, 1621–1633. [Google Scholar] [CrossRef]
  10. Ritchie, J.C.; Schiebe, F.R. Water Quality. In Remote Sensing in Hydrology and Water Management; Schultz, G.A., Engman, E.T., Eds.; Springer: Berlin/Heidelberg, Germany, 2000; pp. 287–303. ISBN 978-3-642-59583-7. [Google Scholar]
  11. Şener, Ş.; Varol, S.; Şener, E. Evaluation of Sustainable Groundwater Utilization Using Index Methods (WQI and IWQI), Multivariate Analysis, and GIS: The Case of Akşehir District (Konya/Turkey). Environ. Sci. Pollut. Res. 2021, 28, 47991–48010. [Google Scholar] [CrossRef]
  12. Adimalla, N.; Qian, H. Groundwater Quality Evaluation Using Water Quality Index (WQI) for Drinking Purposes and Human Health Risk (HHR) Assessment in an Agricultural Region of Nanganur, South India. Ecotoxicol. Environ. Saf. 2019, 176, 153–161. [Google Scholar] [CrossRef]
  13. Wills, M.; Irvine, K.N. Application of the National Sanitation Foundation Water Quality Index in Cazenovia Creek, NY, Pilot Watershed Management Project. Middle States Geogr. 1996, 1996, 95–104. [Google Scholar]
  14. Mădălina, P.; Breabăn, I. Water Quality Index—An Instrument for Water resources Management. In Proceedings of the Aerul si Apa Componente ale Mediului, Cluj Napoca, Rumunia, 20–21 March 2014. [Google Scholar] [CrossRef]
  15. Chaudhary, J.K. A Comparative Study of Fuzzy Logic and WQI for Groundwater Quality Assessment. Proc. Comput. Sci. 2020, 171, 1194–1203. [Google Scholar]
  16. Abba, S.I.; Abdulkadir, R.A.; Sammen, S.S.; Pham, Q.B.; Lawan, A.A.; Esmaili, P.; Malik, A.; Al-Ansari, N. Integrating Feature Extraction Approaches with Hybrid Emotional Neural Networks for Water Quality Index Modeling. Appl. Soft Comput. 2022, 114, 108036. [Google Scholar] [CrossRef]
  17. Bassi, N.; Kumar, M.D. Water Quality Index as a Tool for Wetland Restoration. Water Policy 2017, 19, 390–403. [Google Scholar] [CrossRef]
  18. Gitau, M.W.; Chen, J.; Ma, Z. Water Quality Indices as Tools for Decision Making and Management. Water Resour. Manag. 2016, 30, 2591–2610. [Google Scholar] [CrossRef]
  19. Ocampo-Duque, W.; Osorio, C.; Piamba, C.; Schuhmacher, M.; Domingo, J.L. Water Quality Analysis in Rivers with Non-Parametric Probability Distributions and Fuzzy Inference Systems: Application to the Cauca River, Colombia. Environ. Int. 2013, 52, 17–28. [Google Scholar] [CrossRef]
  20. Nasiri, F.; Maqsood, I.; Huang, G.; Fuller, N. Water Quality Index: A Fuzzy River-Pollution Decision Support Expert System. J. Water Resour. Plan. Manag. 2007, 133, 95–105. [Google Scholar] [CrossRef]
  21. Dos Santos Simoes, F.; Moreira, A.B.; Bisinoti, M.C.; Gimenez, S.M.N.; Yabe, M.J.S. Water Quality Index as a Simple Indicator of Aquaculture Effects on Aquatic Bodies. Ecol. Indic. 2008, 8, 476–484. [Google Scholar] [CrossRef]
  22. Rickwood, C.J.; Carr, G.M. Development and Sensitivity Analysis of a Global Drinking Water Quality Index. Environ. Monit. Assess. 2009, 156, 73–90. [Google Scholar] [CrossRef]
  23. Sutadian, A.D.; Muttil, N.; Yilmaz, A.G.; Perera, B.J.C. Development of River Water Quality Indices—A Review. Environ. Monit Assess 2016, 188, 58. [Google Scholar] [CrossRef]
  24. Horton, R.K. An Index Number System for Rating Water Quality. J. Water Pollut. Control. Fed. 1965, 37, 300–306. [Google Scholar]
  25. Alves, M.T.R.; Teresa, F.B.; Nabout, J.C. A Global Scientific Literature of Research on Water Quality Indices: Trends, Biases and Future Directions. Acta Limnol. Bras. 2014, 26, 245–253. [Google Scholar] [CrossRef]
  26. Shah, K.A.; Joshi, G.S. Evaluation of Water Quality Index for River Sabarmati, Gujarat, India. Appl. Water Sci. 2017, 7, 1349–1358. [Google Scholar] [CrossRef] [Green Version]
  27. Brown, R.M.; McClelland, N.I.; Deininger, R.A.; Tozer, R.G. A Water Quality Index—Do We Dare. Water Sew. Work. 1970, 117, 339–343. [Google Scholar]
  28. Brown, R.M.; McClelland, N.I.; Deininger, R.A.; Landwehr, J.M. Validating the WQI. In Proceedings of the National Meeting of American Society of Civil Engineers on Water Resources Engineering, Washington, DC, USA, 29 January–2 February 1973; Volume 29. [Google Scholar]
  29. Prati, L.; Pavanello, R.; Pesarin, F. Assessment of Surface Water Quality by a Single Index of Pollution. Water Res. 1971, 5, 741–751. [Google Scholar] [CrossRef]
  30. Deininger, R.A.; Landwehr, J.M. A Water Quality Index for Public Water Supplies. Ph.D. Thesis, Department of Environment and Industrial Health, University of Michigan, Ann Arbor, MI, USA, 1971. [Google Scholar]
  31. Nemerow, N.L.; Sumitomo, H. Benefits of Water Quality Enhancement (Part A: Pollution Index for Benefits Analysis); Water Pollution Control Research Series N. 16110 DAJ 12/70; Environmental Protection Agency, Water Quality Office: New York, NY, USA, 1970. [Google Scholar]
  32. Kachroud, M.; Trolard, F.; Kefi, M.; Jebari, S.; Bourrié, G. Water Quality Indices: Challenges and Application Limits in the Literature. Water 2019, 11, 361. [Google Scholar] [CrossRef]
  33. Dinius, S.H. Social Accounting System for Evaluating Water Resources. Water Resour. Res. 1972, 8, 1159–1177. [Google Scholar] [CrossRef]
  34. Dinius, S.H. Design of an Index of Water Quality 1. JAWRA J. Am. Water Resour. Assoc. 1987, 23, 833–843. [Google Scholar] [CrossRef]
  35. Dalkey, N. Delphi the RAND Corporation; RAND Corporation: Santa Monica, CA, USA, 1967. [Google Scholar]
  36. House, M.A.; Newsome, D.H. Water Quality Indices for the Management of Surface Water Quality. In Urban Discharges and Receiving Water Quality Impacts; Elsevier: Amsterdam, The Netherlands, 1989; pp. 159–173. [Google Scholar]
  37. Sargaonkar, A.; Deshpande, V. Development of an Overall Index of Pollution for Surface Water Based on a General Classification Scheme in Indian Context. Environ. Monit. Assess. 2003, 89, 43–67. [Google Scholar] [CrossRef]
  38. Kim, A.G.; Cardone, C.R. Scatterscore: A Reconnaissance Method to Evaluate Changes in Water Quality. Environ. Monit. Assess. 2005, 111, 277–295. [Google Scholar] [CrossRef]
  39. Said, A.; Stevens, D.K.; Sehlke, G. An Innovative Index for Evaluating Water Quality in Streams. Environ. Manag. 2004, 34, 406–414. [Google Scholar] [CrossRef] [PubMed]
  40. Icaga, Y. Fuzzy Evaluation of Water Quality Classification. Ecol. Indic. 2007, 7, 710–718. [Google Scholar] [CrossRef]
  41. Silvert, W. Fuzzy Indices of Environmental Conditions. Ecol. Model. 2000, 130, 111–119. [Google Scholar] [CrossRef]
  42. Zadeh, L.A. Fuzzy Sets. Inf. Control 1965, 8, 338–353. [Google Scholar] [CrossRef] [Green Version]
  43. Stambuk-Giljanovic, N. Water Quality Evaluation by Index in Dalmatia. Water Res. 1999, 33, 3423–3440. [Google Scholar] [CrossRef]
  44. Pesce, S.F.; Wunderlin, D.A. Use of Water Quality Indices to Verify the Impact of Córdoba City (Argentina) on Suquía River. Water Res. 2000, 34, 2915–2926. [Google Scholar] [CrossRef]
  45. Yidana, S.M.; Yidana, A. Assessing Water Quality Using Water Quality Index and Multivariate Analysis. Environ. Earth Sci. 2010, 59, 1461–1473. [Google Scholar] [CrossRef]
  46. Swamee, P.K.; Tyagi, A. Describing Water Quality with Aggregate Index. J. Environ. Eng. 2000, 126, 451–455. [Google Scholar] [CrossRef]
  47. Smith, D.G. A Better Water Quality Indexing System for Rivers and Streams. Water Res. 1990, 24, 1237–1244. [Google Scholar] [CrossRef]
  48. Dojlido, J.; Raniszewski, J.; Woyciechowska, J. Water Quality Index-Application for Rivers in Vistula River Basin in Poland. Water Sci. Technol. 1994, 30, 57. [Google Scholar] [CrossRef]
  49. Singh, G.; Kamal, R.K. Application of Water Quality Index for Assessment of Surface Water Quality Status in Goa. Curr. World Environ. 2014, 9, 994. [Google Scholar] [CrossRef]
  50. Ochungo, E.A.; Ouma, G.O.; Obiero, J.P.O.; Odero, N.A. Water Quality Index for Assessment of Potability of Groundwater Resource in Langata Sub County, Nairobi-Kenya. Am. J. Water Resour. 2019, 7, 62–75. [Google Scholar] [CrossRef]
  51. Mourhir, A.; Rachidi, T.; Karim, M. River Water Quality Index for Morocco Using a Fuzzy Inference System. Environ. Syst. Res. 2014, 3, 21. [Google Scholar] [CrossRef]
  52. Soumaila, K.I.; Mustapha, N.; Mohamed, C. Assessment of Surface Water Quality Using Indices and Geographic Information System in the Sebou River Basin, Morocco. ESJ 2021, 17, 249. [Google Scholar] [CrossRef]
  53. Barakat, A.; Hilali, A.; Baghdadi, M.E.; Touhami, F. Assessment of Shallow Groundwater Quality and Its Suitability for Drinking Purpose near the Béni-Mellal Wastewater Treatment Lagoon (Morocco). Hum. Ecol. Risk Assess. Int. J. 2020, 26, 1476–1495. [Google Scholar] [CrossRef]
  54. Kacem, H.A.; Fal, S.; Karim, M.; Alaoui, H.M.; Rhinane, H.; Maanan, M. Application of Fuzzy Analytical Hierarchy Process for Assessment of Desertification Sensitive Areas in North West of Morocco. Geocarto Int. 2021, 36, 563–580. [Google Scholar] [CrossRef]
  55. Sarti, O.; Otal, E.; Morillo, J.; Ouassini, A. Integrated Assessment of Groundwater Quality beneath the Rural Area of R’mel, Northwest of Morocco. Groundw. Sustain. Dev. 2021, 14, 100620. [Google Scholar] [CrossRef]
  56. Kord, M.; Arshadi, B. Applying the Water Quality Index with Fuzzy Logic as a Way to Analyze Multiple Long-Term Groundwater Quality Data: A Case Study of Dehgolān Plain. Arab. J. Geosci. 2022, 15, 253. [Google Scholar] [CrossRef]
  57. Azzirgue, E.M.; Salmoun, F.; Cherif, E.K.; Ait Tchakoucht, T.; Mejjad, N. Using Machine Learning Approaches to Predict Water Quality of Ibn Battuta Dam (Tangier, Morocco). In Proceedings of the 2nd International Conference on Big Data, Modelling and Machine Learning; SCITEPRESS—Science and Technology Publications: Kenitra, Morocco, 2021; pp. 350–354. [Google Scholar]
  58. Azzirgue, E.M.; Farida, S.; El Khalil, C.; Mejjad, N. Determination of the Jouamaa Groundwater Quality Using Physico-Chemical Water Analysis and Geographic Information System. In Proceedings of the E3S Web of Conferences; EDP Sciences: Les Ulis, France, 2021; Volume 314, p. 07006. [Google Scholar]
  59. Azzirgue, E.M.; Salmoun, F. Assessment of the Physico-Chemical Quality of Water of Oued Ouljat Echatt and Dam Ibn Batouta-Tangier. IJASRE 2019, 5, 314–324. [Google Scholar] [CrossRef]
  60. Ahmed, A.T.; Emad, M.; Bkary, M.A. Impacts of Temperature Alteration on the Drinking Water Quality Stored in Plastic Bottles. Appl. Water Sci. 2021, 11, 167. [Google Scholar] [CrossRef]
  61. Soil, L.; District, W.C.; Clark, K. Cow Creek Water Quality Monitoring Report 2006–2008. 2008. Available online: https://scholar.google.com/scholar?hl=fr&as_sdt=0%2C5&q=Soil%2C+L.%3B+District%2C+W.C.%3B+Clark%2C+K.+Cow+Creek+Water+Quality+Monitoring+Report+2006%E2%80%932008%3B+&btnG= (accessed on 12 September 2022).
  62. Mahmud, Z.H.; Islam, M.S.; Imran, K.M.; Hakim, S.A.I.; Worth, M.; Ahmed, A.; Hossan, S.; Haider, M.; Islam, M.R.; Hossain, F. Occurrence of Escherichia coli and Faecal coliforms in Drinking Water at Source and Household Point-of-Use in Rohingya Camps, Bangladesh. Gut Pathog. 2019, 11, 52. [Google Scholar] [CrossRef]
  63. Wangsan, K.; Upaphong, P.; Assavanopakun, P.; Sapbamrer, R.; Sirikul, W.; Kitro, A.; Sirimaharaj, N.; Kuanprasert, S.; Saenpo, M.; Saetiao, S. Self-Reported Computer Vision Syndrome among Thai University Students in Virtual Classrooms during the COVID-19 Pandemic: Prevalence and Associated Factors. Int. J. Environ. Res. Public Health 2022, 19, 3996. [Google Scholar] [CrossRef]
  64. Rittmann, B.E.; McCarty, P.L. Environmental Biotechnology: Principles and Applications; McGraw-Hill Education: New York, NY, USA, 2001; ISBN 1-260-44059-1. [Google Scholar]
  65. Council, N.R.; Committee, S.D.W. Solid Particles in Suspension. In Drinking Water and Health: Volume 1; National Academies Press: Washington, DC, USA, 1977. [Google Scholar]
  66. NM03.7.001. 2006: Norme Marocaine Relative à La Qualité Des Eaux d’alimentation Humaine; Bulletin Officiel N° 5404; 16 March 2006. Available online: https://pdfcoffee.com/nm-037001-norme-maroccaine-eau-alimentation-4-pdf-free.html (accessed on 12 September 2022).
  67. Lumb, A.; Sharma, T.C.; Bibeault, J.-F. A Review of Genesis and Evolution of Water Quality Index (WQI) and Some Future Directions. Water Qual. Expo. Health 2011, 3, 11–24. [Google Scholar] [CrossRef]
  68. Tyagi, S.; Sharma, B.; Singh, P.; Dobhal, R. Water Quality Assessment in Terms of Water Quality Index. Am. J. Water Resour. 2013, 1, 34–38. [Google Scholar] [CrossRef]
  69. Effendi, H.; Romanto; Wardiatno, Y. Water Quality Status of Ciambulawung River, Banten Province, Based on Pollution Index and NSF-WQI. Proc. Environ. Sci. 2015, 24, 228–237. [Google Scholar] [CrossRef]
  70. Zeinalzadeh, K.; Rezaei, E. Determining Spatial and Temporal Changes of Surface Water Quality Using Principal Component Analysis. J. Hydrol. Reg. Stud. 2017, 13, 1–10. [Google Scholar] [CrossRef]
  71. Matta, G.; Nayak, A.; Kumar, A.; Kumar, P. Water Quality Assessment Using NSFWQI, OIP and Multivariate Techniques of Ganga River System, Uttarakhand, India. Appl. Water Sci. 2020, 10, 206. [Google Scholar] [CrossRef]
  72. Abbasnia, A.; Alimohammadi, M.; Mahvi, A.H.; Nabizadeh, R.; Yousefi, M.; Mohammadi, A.A.; Pasalari, H.; Mirzabeigi, M. Assessment of Groundwater Quality and Evaluation of Scaling and Corrosiveness Potential of Drinking Water Samples in Villages of Chabahr City, Sistan and Baluchistan Province in Iran. Data Brief 2018, 16, 182–192. [Google Scholar] [CrossRef]
  73. Nabizadeh, R.; Valadi Amin, M.; Alimohammadi, M.; Naddafi, K.; Mahvi, A.H.; Yousefzadeh, S. Development of Innovative Computer Software to Facilitate the Setup and Computation of Water Quality Index. J. Environ. Health Sci. Eng. 2013, 11, 1. [Google Scholar] [CrossRef]
  74. McClelland, N.I. Water Quality Index Application in the Kansas River Basin; US Environmental Protection Agency-Region VII: Lenexa, KS, USA, 1974; Volume 74. [Google Scholar]
  75. Banda, T.D.; Kumarasamy, M. Aggregation Techniques Applied in Water Quality Indices (WQIs). Pollut. Res 2020, 39, 400–441. [Google Scholar]
  76. Bhargava, D.S. Use of Water Quality Index for River Classification and Zoning of Ganga River. Environ. Pollut. Ser. B Chem. Phys. 1983, 6, 51–67. [Google Scholar] [CrossRef]
  77. Walski, T.M.; Parker, F.L. Consumers Water Quality Index. J. Environ. Eng. Div. 1974, 100, 593–611. [Google Scholar] [CrossRef]
  78. Landwehr, J.M.; Deininger, R.A. A Comparison of Several Water Quality Indexes. J. Water Pollut. Control Fed. 1976, 48, 954–958. [Google Scholar]
  79. Walsh, P.; Wheeler, W. Water Quality Index Aggregation and Cost Benefit Analysis; United States Enviromental Protection Agency: Washington, DC, USA, 2012. [Google Scholar]
  80. Dunnette, D.A. A Geographically Variable Water Quality Index Used in Oregon. J. Water Pollut. Control Fed. 1979, 51, 53–61. [Google Scholar]
  81. Cude, C.G. Oregon Water Quality Index a Tool for Evaluating Water Quality Management Effectiveness 1. JAWRA J. Am. Water Resour. Assoc. 2001, 37, 125–137. [Google Scholar] [CrossRef]
  82. Abbasi, T.; Abbasi, S.A. Why Water-Quality Indices. In Water Quality Indices; Elsevier: Amsterdam, The Netherlands, 2012; pp. 3–7. ISBN 978-0-444-54304-2. [Google Scholar]
  83. Fleming, S.W.; Wong, C.; Graham, G. The Unbearable Fuzziness of Being Sustainable: An Integrated, Fuzzy Logic-Based Aquifer Health Index. Hydrol. Sci. J. 2014, 59, 1154–1166. [Google Scholar] [CrossRef]
  84. Mamdani, E.H. Applications of Fuzzy Algorithms for Control of Simple Dynamic Plant. Proc. IEE 1974, 121, 1585–1588. [Google Scholar] [CrossRef]
  85. Gharibi, H.; Mahvi, A.H.; Nabizadeh, R.; Arabalibeik, H.; Yunesian, M.; Sowlat, M.H. A Novel Approach in Water Quality Assessment Based on Fuzzy Logic. J. Environ. Manag. 2012, 112, 87–95. [Google Scholar] [CrossRef]
  86. Can Fuzzy Logic Bring Complex Environmental Problems into Focus? Environ. Sci. Technol. 2005, 39, 42A–47A. [CrossRef]
  87. Sasikumar, K.; Mujumdar, P.P. Fuzzy Optimization Model for Water Quality Management. J. Water Resour. Plan. Manag. 1998, 124. [Google Scholar] [CrossRef]
  88. Lu, R.-S.; Lo, S.-L.; Hu, J.-Y. Analysis of Reservoir Water Quality Using Fuzzy Synthetic Evaluation. Stoch. Environ. Res. Risk Assess. 1999, 13, 327–336. [Google Scholar] [CrossRef]
  89. Chang, N.-B.; Chen, H.-W.; Ning, S.-K. Identification of River Water Quality Using the Fuzzy Synthetic Evaluation Approach. J. Environ. Manag. 2001, 63, 293–305. [Google Scholar] [CrossRef]
  90. Liou, S.-M.; Lo, S.-L.; Hu, C.-Y. Application of Two-Stage Fuzzy Set Theory to River Quality Evaluation in Taiwan. Water Res. 2003, 37, 1406–1416. [Google Scholar] [CrossRef]
  91. Zadeh, L.A. Outline of a New Approach to the Analysis of Complex Systems and Decision Processes. IEEE Trans. Syst. Man Cybern. 1973, SMC-3, 28–44. [Google Scholar] [CrossRef]
  92. Zadeh, L.A. Fuzzy Sets. In Fuzzy Sets, Fuzzy Logic, and Fuzzy Systems: Selected Papers by Lotfi A. Zadeh; World Scientific: Singapore, 1996; pp. 394–432. [Google Scholar]
  93. Turksen, I.B. Measurement of Membership Functions and Their Acquisition. Fuzzy Sets Syst. 1991, 40, 5–38. [Google Scholar] [CrossRef]
  94. Karr, C.L.; Gentry, E.J. Fuzzy Control of PH Using Genetic Algorithms. IEEE Trans. Fuzzy Syst. 1993, 1, 46. [Google Scholar] [CrossRef]
  95. Jang, J.-S.; Sun, C.-T. Neuro-Fuzzy Modeling and Control. Proc. IEEE 1995, 83, 378–406. [Google Scholar] [CrossRef]
  96. Shende, R.; Gupta, G.; Macherla, S. Determination of an Inflection Point for a Dosimetric Analysis of Unflattened Beam Using the First Principle of Derivatives by Python Code Programming. Rep. Pract. Oncol. Radiother. 2019, 24, 432–442. [Google Scholar] [CrossRef]
  97. Perez, F.; Granger, B.E.; Hunter, J.D. Python: An Ecosystem for Scientific Computing. Comput. Sci. Eng. 2010, 13, 13–21. [Google Scholar] [CrossRef]
  98. Lindstrom, G. Programming with Python. IT Prof. Mag. 2005, 7, 10. [Google Scholar] [CrossRef]
  99. Karssenberg, D.; de Jong, K.; van der Kwast, J. Modelling Landscape Dynamics with Python. Int. J. Geogr. Inf. Sci. 2007, 21, 483–495. [Google Scholar] [CrossRef]
  100. Scikit-Fuzzy. Available online: https://pythonhosted.org/scikit-fuzzy/overview.html (accessed on 12 September 2022).
  101. Tindall, J.A.; Petrusak, R.L.; McMahon, P.B. Nitrate transport and transformation process in unsaturated porous media. J. Hydrol. 1995, 169, 51–94. [Google Scholar] [CrossRef]
  102. Vilain, M. La Production Végétale; JB Baillère: Paris, France, 1987; ISBN 2-85206-425-1. [Google Scholar]
  103. Adimalla, N.; Li, P. Occurrence, Health Risks, and Geochemical Mechanisms of Fluoride and Nitrate in Groundwater of the Rock-Dominant Semi-Arid Region, Telangana State, India. Hum. Ecol. Risk Assess. Int. J. 2019, 25, 81–103. [Google Scholar] [CrossRef]
  104. Jalali, M. Nitrate Pollution of Groundwater in Toyserkan, Western Iran. Environ. Earth Sci. 2011, 62, 907–913. [Google Scholar] [CrossRef]
  105. Chen, J.; Wu, H.; Qian, H. Groundwater Nitrate Contamination and Associated Health Risk for the Rural Communities in an Agricultural Area of Ningxia, Northwest China. Expo. Health 2016, 8, 349–359. [Google Scholar] [CrossRef]
  106. Burow, K.R.; Nolan, B.T.; Rupert, M.G.; Dubrovsky, N.M. Nitrate in Groundwater of the United States, 1991−2003. Environ. Sci. Technol. 2010, 44, 4988–4997. [Google Scholar] [CrossRef]
  107. Wu, J.; Zhang, Y.; Zhou, H. Groundwater Chemistry and Groundwater Quality Index Incorporating Health Risk Weighting in Dingbian County, Ordos Basin of Northwest China. Geochemistry 2020, 80, 125607. [Google Scholar] [CrossRef]
  108. He, X.; Li, P.; Ji, Y.; Wang, Y.; Su, Z.; Elumalai, V. Groundwater Arsenic and Fluoride and Associated Arsenicosis and Fluorosis in China: Occurrence, Distribution and Management. Expo. Health 2020, 12, 355–368. [Google Scholar] [CrossRef]
  109. Wu, J.; Sun, Z. Evaluation of Shallow Groundwater Contamination and Associated Human Health Risk in an Alluvial Plain Impacted by Agricultural and Industrial Activities, Mid-West China. Expo. Health 2016, 8, 311–329. [Google Scholar] [CrossRef]
  110. Liou, S.M.; Lo, S.L.; Wang, S.H. A generalized water quality index for Taiwan. Environ. Monit. Assess. 2004, 96, 35–52. [Google Scholar] [CrossRef]
  111. Nguyễn, T.T.N.; Đồng, K.L.; Nguyễn, C.H. Development of Water Quality Index for Coastal Zone and Application in the Hạ Long Bay. VNU J. Sci. Earth Environ. Sci. 2013, 29, 43–52. [Google Scholar]
  112. Ross, T.J. Fuzzy Logic with Engineering Applications; John Wiley & Sons: Hoboken, NJ, USA, 2005; ISBN 0-470-86076-6. [Google Scholar]
  113. Marimon, W.; Jimenez, N.T.; Jimenez, C.; Chavarro, J.; Dominguez, E. Comparative Analysis of Water Quality Indices and Their Relationship with Anthropogenic Activities. Case Study: Bogotá River. Research Square 2021. Available online: https://assets.researchsquare.com/files/rs-471745/v1_covered.pdf?c=1631867851 (accessed on 12 September 2022). [CrossRef]
  114. Nayak, J.G.; Patil, L.G.; Patki, V.K. Development of water quality index for Godavari River (India) based on fuzzy inference system. Groundw. Sustain. Dev. 2020, 10, 100350. [Google Scholar] [CrossRef]
Figure 1. The study area of the Jouamaa Hakama region, northern Morocco (at the lower-right corner), with the locations of nine zone and surveying well-water sampling points, the TAC industrial zone, the Chrafate wastewater treatment station, the Ouljat Echatt river, and the Ibn Batouta dam [52].
Water 14 03028 g001
Figure 2. Figure showing some Jouamaa Hakama wells, which are used for the population’s daily needs.
Water 14 03028 g002
Figure 3. Fuzzy Inference System.
Water 14 03028 g003
Figure 4. Different components of the fuzzy logic WQI.
Water 14 03028 g004
Figure 5. Flowchart illustrating the methodology and steps of WQIs and FL.
Water 14 03028 g005
Figure 6. Membership functions of different input parameters (T°, pH, DO, EC, SM, DBO5, DCO, NO3-, NH4+, PO43-, TURB, and FC).
Water 14 03028 g006
Figure 7. Membership of the FLWQI.
Water 14 03028 g007
Figure 8. Results of FLWQI in Bar Plots.
Water 14 03028 g008
Table 1. The analyzed parameters during this study and the reasons for the parameters’ selection with references.
Type of ParameterParameterReason for ChoiceReference
Physical–chemicalBOD5, COD, DO, pH, and T°
EC
TURB

N O 2 , N O 3 ,
N H 4 + ,
P O 4 3 , and
SM
An increase in T° leads to a pH decrease.
All parameters have an impact on DO and can lead to algal growth.
Pure water is not a good conductor of electric current.
-
Associated with cancer, birth defects, and other health effects (methemoglobinemia).
-
N H 4 + is not toxic to the human body but can easily be converted to N O 2 / N O 3 .
-
Excessive amounts are the main cause of water eutrophication.
Can concentrate and transmit water pollutants and impede their removal by water treatment.
[60,61,62,63,64,65].
BacteriologicFCPotential transmission of enteric pathogens such as Salmonella, Shigella, Vibrio cholerae, and E. coli.
Potential transmission of enteric pathogens such as Salmonella, Shigella, Vibrio cholerae, and E. coli.
Table 2. The parameters measured, the analytical methods and Moroccan standards used during the analysis, and the interpretation of the results.
ParametersAnalytical MethodsUnitsMoroccan Standards [66]References
pHpH meter in situ---6.5-8.5NM 03.7.009
Thermometer°C30
ECConductimeterµS/cm1300NM 03.7.011
BOD5BOD5 mmg/L3NF T90-103
CODCOD metermg/L30NF T90-101
DOOximetermg/L7 (90%)
SMGravimetricmg/L50 NF T90-105-2
TURBTurbidimetryNFU5NF T90-033
N O 2 Spectrophotometrymg/L0.5NF T 90-040
N O 3 Spectrophotometrymg/L0.5
N H 4 + Spectrophotometrymg/L0.5
P O 4 3 Spectrophotometrymg/L0.2–0.5
FCWater quality—Research and enumeration of Escherichia Coli and coliform bacteria;
Part 1: Membrane filtration method
MPN/100 ml≤20NM 03.7.003
Table 3. Chosen WQIs.
Aggregation Methods Equations
WAWQIWQI = i = 1 n W i   x   Q i i = 1 n W i
WGWQIWQI = ∏qiwi
OWQI O W Q I = n i = 1 n 1 S I i 2
Logarithmic aggregationNewWQI = log ( D O 1.5 3.5 T P     T U R B 0.15   15 F C 10000 + 0.14     S C 0.5 )
Fuzzy logicFuzzy WQI=   μ Ã x . x d x     μ Ã x d x
Table 4. Weights assigned to parameters [32].
ParameterspHTCODBOD5DOECSMTURB N O 2 N O 3 N H 4 + P O 4 3 FC
Weight (wi) *4233542245345
* Each criterion is assigned a weight (Wi) ranging from 1 (lowest influence on water quality) to 5 (greatest impact) based on the potential impact on health and the environment.
Table 5. Classification of water quality [72,73].
WQI ValueClass
Excellent water <50
Good water 50–100
Poor water 100–200
Very poor water 200–300
Unsuitable for drinking >300
Table 6. Descriptor Words and WQI Value Ranges [4].
RatingRange
Excellent 91–100
Good 71–90
Medium 51–70
Bad 26–50
Very bad 0–25
Table 7. WQI characterization of water quality [32].
Index Value RangesClassification
Highest purity3
Marginal purity<2
Poor quality<1
Table 8. Linguistic terms and fuzzy sets for the fuzzy index.
ParametersUnits Very lowLowMediumHighVery high
a = bcdabcabcabcabc
°C051051015101520152025202530
pH---035357579791191114
ECµS/cm05006005006007006007008007008009008009001500
SMmg/L0255050100100010010002000100020003000200030006000
DOmg/L024246468681081012
BOD5mg/L012123234345456
CODmg/L01020102030203040304050405060
N O 3 mg/L02550255075507510075100125100125150
N H 4 + mg/L012123234345456
P O 4 3 mg/L012123234345456
TURBNTU012123234345456
FCMPN/100 mL010201020100201001000100100020001000200020,000
Table 9. Values of water quality parameters in 2016 and 2017 for all 9 wells.
ParametersRangeYear: 2016MeanStandard DeviationRangeYear: 2017MeanStandard DeviationMoroccan Standards [66]
T (°C)18.8–20.920.360.6819.9–20.720.340.2730
pH7.17–8.057.600.296.82–7.827.210.356.5–8.5
EC (µS/cm)980–31001544.44804820–32501568874.291300
SM (mg/L)2–13021.1141.493–137.784.0250
DO (mg/L)2.08–7.565.521.831.59–6.404.201.467 (90%)
BOD5 (mg/L)2–297.558.627–2012.444.673
COD (mg/L)1.05–3210.949.7517.90–42.9026.138.2230
N O 3 (mg/L)0.13–26.65.058.560.13–12.423.264.2050
N H 4 + (mg/L)0.38–0.570.470.060.33–0.550.450.080.5
P O 4 3 (mg/L)0.07–0.990.370.280.41–3.481.291.150.4
TURB (NTU)1.16–17.74.985.351.25–205.165.825
FC (MPN/100 mL)83–1191585.22435.6483–1190585435.6420
Table 10. Comparison between results of four WQIs and FL for nine wells in 2016 and 2017.
YearPOINTSWAWQIWAWQI QualityWGWQIWGWQI QualityOWQIOWQI QualityLogarithmic WQILogarithmic QualityFuzzy WQIFuzzy WQI
Quality
2016P 166.41Good water19.24Very bad0.069Very poor 2.62Highest purity 22.59Poor
2016P 292.95Good water23.55Very bad0.096Very poor 1.73Marginal quality22.59Poor
2016P 368.36Good water29.65Bad0.138Very poor 5.66Highest purity 22.59Poor
2016P 469.75Good water33.65Bad0.220Very poor 6.07Highest purity 22,59Poor
2016P 554.22Good water25.30Bad0.103Very poor 2.52Highest purity 22.59Poor
2016P 670.38Good water21.69Very bad0.166Very poor 1.71Marginal quality22.69Poor
2016P 779.16Good water31.67Bad0.106Very poor 2.65Highest purity 22.59Poor
2016P 8174.57Poor water28.35Bad0.136Very poor 0.45Poor22.68Poor
2016P 943.89Excellent water 0.00Very bad0.000Very poor 1.84Marginal quality22.59Poor
2017P 1109.90Poor water30.26Bad0.215Very poor 1.25Marginal quality22.59Poor
2017P 2106.44Poor water37.67Bad0.179Very poor 0.83Poor22.59Poor
2017P 3143.47Poor water60.14Medium quality0.261Very poor 0.78Poor22.59Poor
2017P 479.39Good water27.62Bad0.213Very poor 3.07Highest purity 22.59Poor
2017P 588.60Good water29.21Bad0.113Very poor 2.13Highest purity 23.47Poor
2017P 672.33Good water21.17Very bad0.134Very poor 1.52Marginal quality22.79Poor
2017P 786.00Good water38.05Bad0.217Very poor 1.98Marginal quality22.59Poor
2017P 8108.78Poor water32.69Bad0.127Very poor 0.03Poor22.59Poor
2017P 992.18Good water30.62Bad0.101Very poor 0.04Poor22.59Poor
Publisher’s Note: MDPI stays neutral with regard to jurisdictional claims in published maps and institutional affiliations.

