
ENSO Signals Recorded by Ash Tree Rings in Iberian Riparian Forests


Instituto Pirenaico de Ecología (IPE-CSIC), Avda. Montañana 1005, E-50192 Zaragoza, Spain
Water 2022, 14(19), 3027; https://doi.org/10.3390/w14193027
Submission received: 1 September 2022
/
Revised: 20 September 2022
/
Accepted: 23 September 2022
/
Published: 26 September 2022
(This article belongs to the Special Issue Implications of Climate Change on the Sustainable Management of the Water–Forest Nexus)
Abstract
:Climate–atmospheric patterns affect ecological processes. The El Niño Southern Oscillation (ENSO) represents the strongest global source of climate variability at annual scales, but its impacts on Mediterranean forests are still understudied. Here, ENSO signals recorded by river flow and radial growth series of Mediterranean riparian forests are uncovered in the middle Ebro basin, northeastern Spain. A chronology or mean series of tree ring widths (period 1970–2018, 27 trees) was built for narrow-leaved ash (Fraxinus angustifolia). Growth indices increased as the river flow did during the prior winter and from May to September. Ash growth indices and river flow of the hydrological year were positively related (r = 0.54, p < 0.001), suggesting that a higher soil moisture enhances growth. This correlation remained significant after taking out the influence of precipitation. Ash growth indices (r = −0.46, p = 0.001) and river flow during the hydrological year (r = −0.30, p = 0.03) were negatively associated with the January Southern Oscillation Index (SOI). These relationships suggest that high SOI values corresponding to La Niña events lead to reduced river flow, thus decreasing ash radial growth. Further approaches could be used to better understand how the ENSO impacts drought-prone riparian forests subjected to increasing aridity.
1. Introduction
Mediterranean riparian forests are highly threatened and vulnerable ecosystems menaced by climate warming (increased aridity), anthropogenic reduction of their area and alteration of hydrological regimes (dam and dike building), and invasive pathogens [1,2,3,4]. Atmospheric and hydrological droughts increase water loss and reduce soil moisture levels due to declines in water table depth leading to growth reductions in riparian Mediterranean forests [5,6]. Such growth declines should be stronger in non-phreatophytic species with shallow roots, dependent on capillary water rise and not adapted to low oxygen, such as the narrow-leaved ash (Fraxinus angustifolia Vahl; hereafter ash), which are coupled to changes in streamflow and water table depth, albeit less than phreatophyte species such as poplars [5,7,8].
Climate and atmospheric dynamics may influence remote areas through large-scale teleconnections, driving local ecological processes [9]. Climate indices often outperform local climatic conditions in explaining ecological processes, as illustrated by the links between the North Atlantic Oscillation (NAO), winter–spring climate and forest growth in the Iberian Peninsula [10,11,12,13,14]. However, teleconnections and large-scale troposphere-stratosphere couplings may affect climate and ecological processes, but their effects remain unknown. This is the case of the El Niño Southern Oscillation (ENSO), which affects global climate at inter-annual to multi-decadal scales [15,16], but whose effects on ecosystems of some regions dominated by NAO impacts such as the Iberian Peninsula are still understudied.
In the Iberian Peninsula, the ENSO has been shown to influence winter–spring rainfall, lake levels, river discharge and river nitrate concentrations, among other variables [17,18,19,20,21]. During El Niño events, the winter stratospheric circulation is weakened due to an enhanced planetary wave generation in the tropics and subsequent vertical propagation into higher atmospheric layers causing teleconnections between the tropical Pacific and the North Atlantic. Usually, either the Southern Oscillation Index (SOI), which is calculated as the series of standardized differences in monthly standardized sea level pressure between Tahiti and Darwin (Australia), or the sea surface temperatures (SST) across the Equatorial Pacific (hereafter SST3.4) are used to assess atmospheric components of the ENSO [22]. The SST3.4 represents SST anomalies relative to the 1950–1979 period in the area bounded by coordinates 120–170° W and 5° S–5° N, where local changes in SST determine rainfall patterns in the Equatorial Pacific [15,23]. Because of time lags between teleconnections such as the ENSO and impacts on Iberian climate [17] correlations are computed considering a 0- to 12-month time lag between the SOI or SST3.4 and climate data. For instance, the October SOI (SST3.4) of the prior year was positively (negatively) related to spring precipitation in northeastern Spain [18]. A 6-month lag was also observed between the ENSO and Iberian climate using drought indices [20]. For example, high July SOI values lead to dry conditions in January of the following year. Overall, year-long droughts starting in winter and spring affected the northeast Iberian Peninsula during periods with high (low) SOI (SST3.4) values [20,21,24,25]. These are negative phases of the ENSO (La Niña events), characterized by strong trade winds and low SST3.4 [26].
ENSO teleconnections to southern Europe and other extratropical areas strengthened during the late 20th century [17,27]. This reinforcement may be due to a higher frequency of extreme ENSO phases recorded during the past decades [23] and could be related to climate warming [28]. Stronger ENSO–climate associations in this seasonally dry region increased the interest in uncovering their ecological impacts on drought-prone ecosystems such as forests. For instance, La Niña events decreased summer cloudiness and reduced growth of European beech (Fagus sylvatica L.) forests in northern Spain due to increased evapotranspiration rates [29]. However, we still lack information on how the ENSO impacts the growth of Iberian riparian forests given their dependence on both river flow and growing-season precipitation [6,30,31].
Here I assess how radial growth of ash stands located in the middle Ebro basin (northeastern Spain) responded to climate, river flow and ENSO during the late 20th century. I hypothesize that spring–summer drought and reduced river flow decrease the growth index of ash and that this impact is mediated by prior-year ENSO influences.
2. Materials and Methods
2.1. Study Site and Tree Species
The study site (“Soto de la Duquesa”; 1.733° W, 42.202° N, 270 m a.s.l.) is a little-disturbed, mature riparian forest situated near Alfaro town, in the Middle Ebro basin, northeastern Spain. The Ebro basin occupies a total area of 85,820 km2, and it represents the largest hydrographic basin in Spain and the third-largest one in the Mediterranean basin. The Ebro river length is 928 km. The study site is situated in the Middle Ebro basin, where the river has a low longitudinal slope and forms meandering channels [32]. The average annual discharge of the Ebro river registered in the Tortosa gauging station, located 47.8 km from the river mouth in the Mediterranean Sea, was 13,186 Hm³ (period 1960–2018). The climate in the study area is semi-arid Mediterranean continental with a mean annual temperature of 13.8 °C and an annual precipitation of 475 mm. Summer drought lasts from July to September, whereas river flow peaks from December to April. The study forest is dominated by poplars located near the river bank (Populus alba L., Populus nigra L.) and ash with scattered elm trees (Ulmus minor Mill.) located in transitional, upslope areas where ash accounts for 60% of the total basal area.
2.2. Climate, Streamflow and Water Table Depth Data
To obtain homogenized long-term series of monthly climatic data (mean maximum and minimum temperatures, total precipitation) the 0.25°-gridded E-OBS dataset ver. 15.0 was used [33]. The climate series were downloaded considering the period 1970–2018 using the Climate Explorer webpage (https://climexp.knmi.nl; accessed on 11 April 2022). Monthly data of climate indices (NAO, SOI, SST3.4) were also obtained from the Climate Explorer webpage.
Monthly river flow data were obtained for the same period from the Spanish National Flow and Discharge Database (Centro de Estudios y Experimentación de Obras Públicas, https://ceh.cedex.es; accessed on 11 April 2022). They corresponded to a gauging station located at Castejón bridge (1.695° W, 42.180° N, 260 m a.s.l.), situated 4 km downstream from the study site. The average annual discharge of the Ebro river registered in this gauging station was 7177 Hm3 (period 1950–2018). The drained area of the gauged station is 25,194 km2.
There are very few continuous series of water table depth in the study area. However, I could obtain monthly data on water table depth from a piezometer located near the Ebro river (1.585° W, 42.132° N, 258 m; period 2006–2017), located about 14 km downstream from the study site (data are available at the webpage https://www.chebro.es/web/guest/red-piezometrica-oficial; accessed on 31 July 2022). Water table depth showed maximum values from October to April (mean 2.03 m) and minimum values from May to September (mean 1.08 m).
2.3. Field Sampling and Tree-Ring Data Processing
In total, 24 mature and dominant ash trees were sampled in autumn 2017 and 2018. Two increment cores per tree were taken at 1.3 m using Pressler increment borers. Cores were air dried, glued onto wooden supports and sanded. Tree rings were visually cross-dated under a binocular, and tree-ring widths were measured to the nearest 0.01 mm using a LINTAB-TSAP measuring device (Rinntech, Heidelberg, Germany).
The COFECHA program was used to check the visual cross-dating of tree-ring width series [34]. Once checked, a site mean series of ring-width indices was built using ARSTAN software ver. 4.4 [35]. First, cubic smoothing splines with a 50% frequency cut-off at 30 years were fitted to each ring-width series to obtain indices by dividing observed by fitted ring widths [36]. Then, auto-regressive models were fitted to individual series of ring-width indices to remove most of their first-order autocorrelation. The resulting pre-whitened or residual series were averaged using bi-weight robust means to compute a site mean series of ring-width indices or chronology [36].
2.4. Statistical Analyses
Monthly river flow data were log-transformed to achieve normality, which was evaluated using Shapiro–Wilk tests. Trends in SOI and river flow series were assessed using the Kendall tau statistic (τ). Pearson correlations were used to assess the following relationships: (i) SOI or SST3.4 vs. river flow or ring-width indices and (ii) monthly climate variables, river flow and water table depth data vs. ring-width indices. In the first two cases, analyses were performed from the previous October of the year before the tree-ring was formed to September of the year of tree-ring formation and also considered mean temperature or summer precipitation or river flow for the hydrological year (from October through September). In the last case, I calculated the average water table depth during the hydrological year to summarize changes in underground water availability.
To remove the influence of precipitation on the relationship between river flow and ring-width indices, partial correlations were calculated. Significance levels of Pearson correlations were corrected by taking into account the serial dependence of involved predictors such as SOI, SST3.4 and climate variables [37]. Lastly, I calculated spatial correlations between the ash ring-width indexed series and SSTs obtained from the NOAA 0.25° daily Optimum Interpolation data (period 1980–2018) using the Climate Explorer webpage. Statistical analyses were done using the Stata software rel. 17 [38].
3. Results
3.1. Growth Data and Correlations with Climate, River Flow and Water Table Depth
The best replicated period was 1970–2018. The mean ± SD ring width was 3.17 ± 1.52 mm and the mean first-order autocorrelation was 0.60 ± 0.26. The mean correlation of individual indexed series with the mean site series was 0.61 ± 0.18, indicating a high growth coherence among coexisting trees and common year-to-year growth variability.
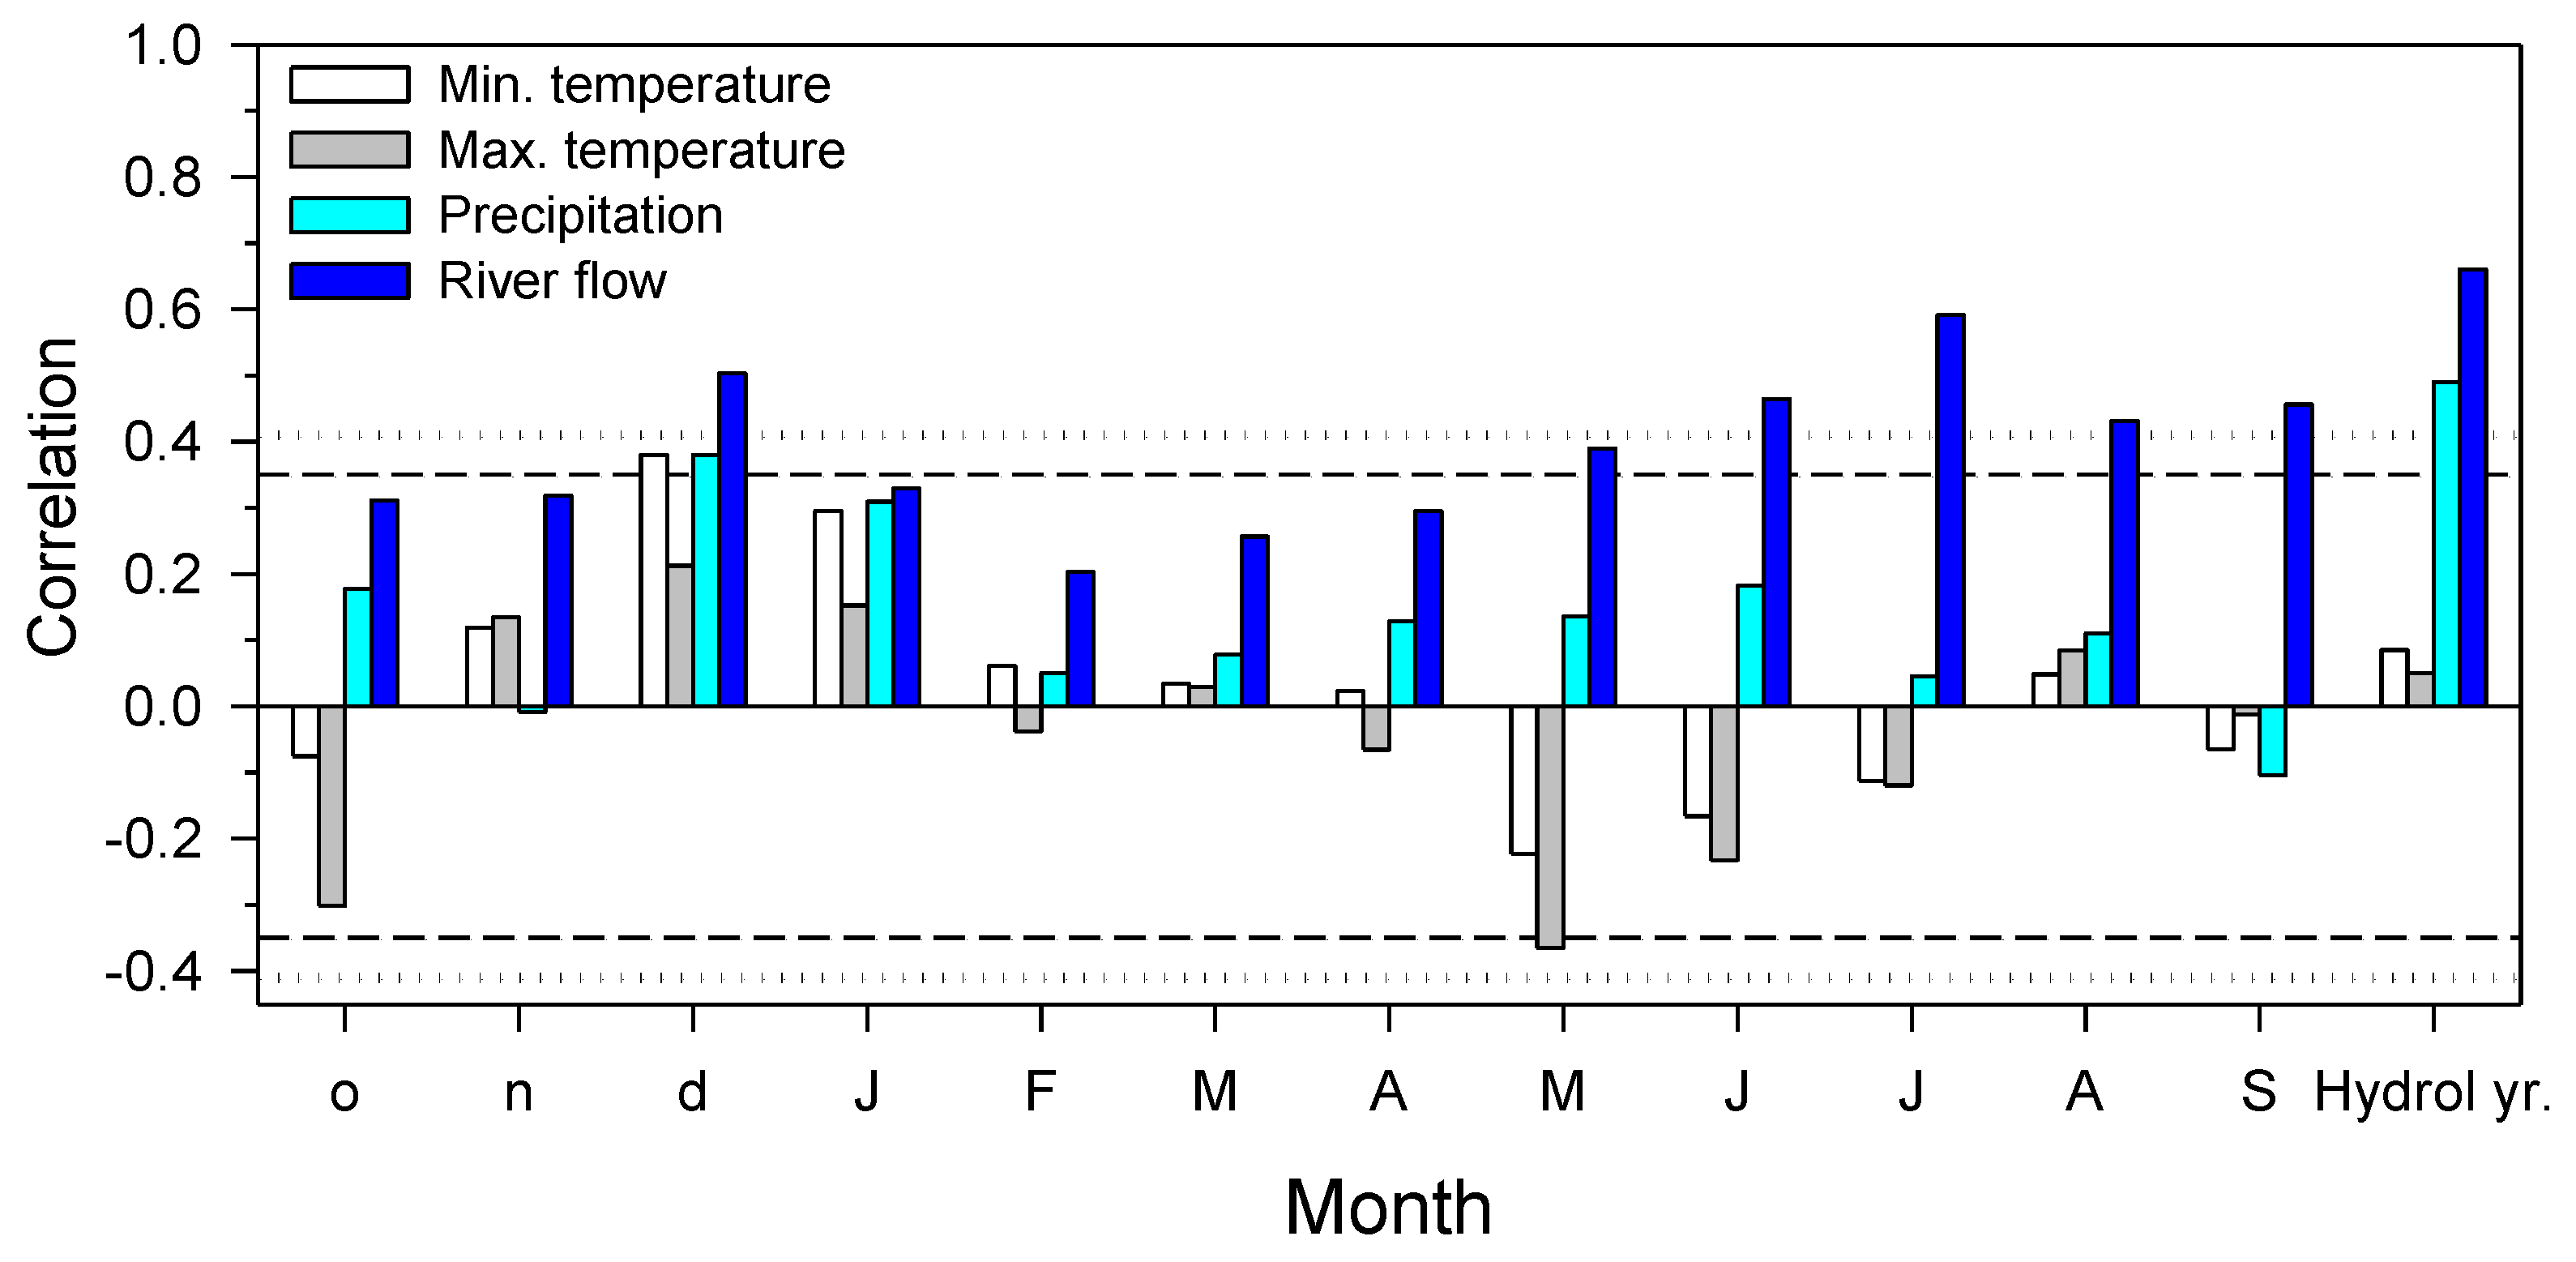
Ash growth indices increased as prior December precipitation and river flow and May to September river flow did and also in response to low maximum May temperatures (Figure 1). Ash growth increased as the total precipitation or river flow of the hydrological year did (r = 0.54, p < 0.001). Importantly, the correlations observed between ash growth and monthly river flow remained significant (p < 0.05) after taking out the influence of precipitation according to partial correlations. Lastly, ash growth indices were negatively related to the mean water table depth during the hydrological year (r = −0.65, p = 0.045, period 2006–2017). Monthly river flow and water table depths were negatively related but considering a 4-month lag (r = −0.62, p < 0.001, n = 114 measurements). For instance, the severe 2012 drought led to a minimum river flow value in September 2012 which corresponded with the lowest value of water table depth measured in February 2013 (0.52 m), i.e., during a month with usually high water table depths (mean 1.90 m).
3.2. River Flow and Correlations of Growth and Climate Indices
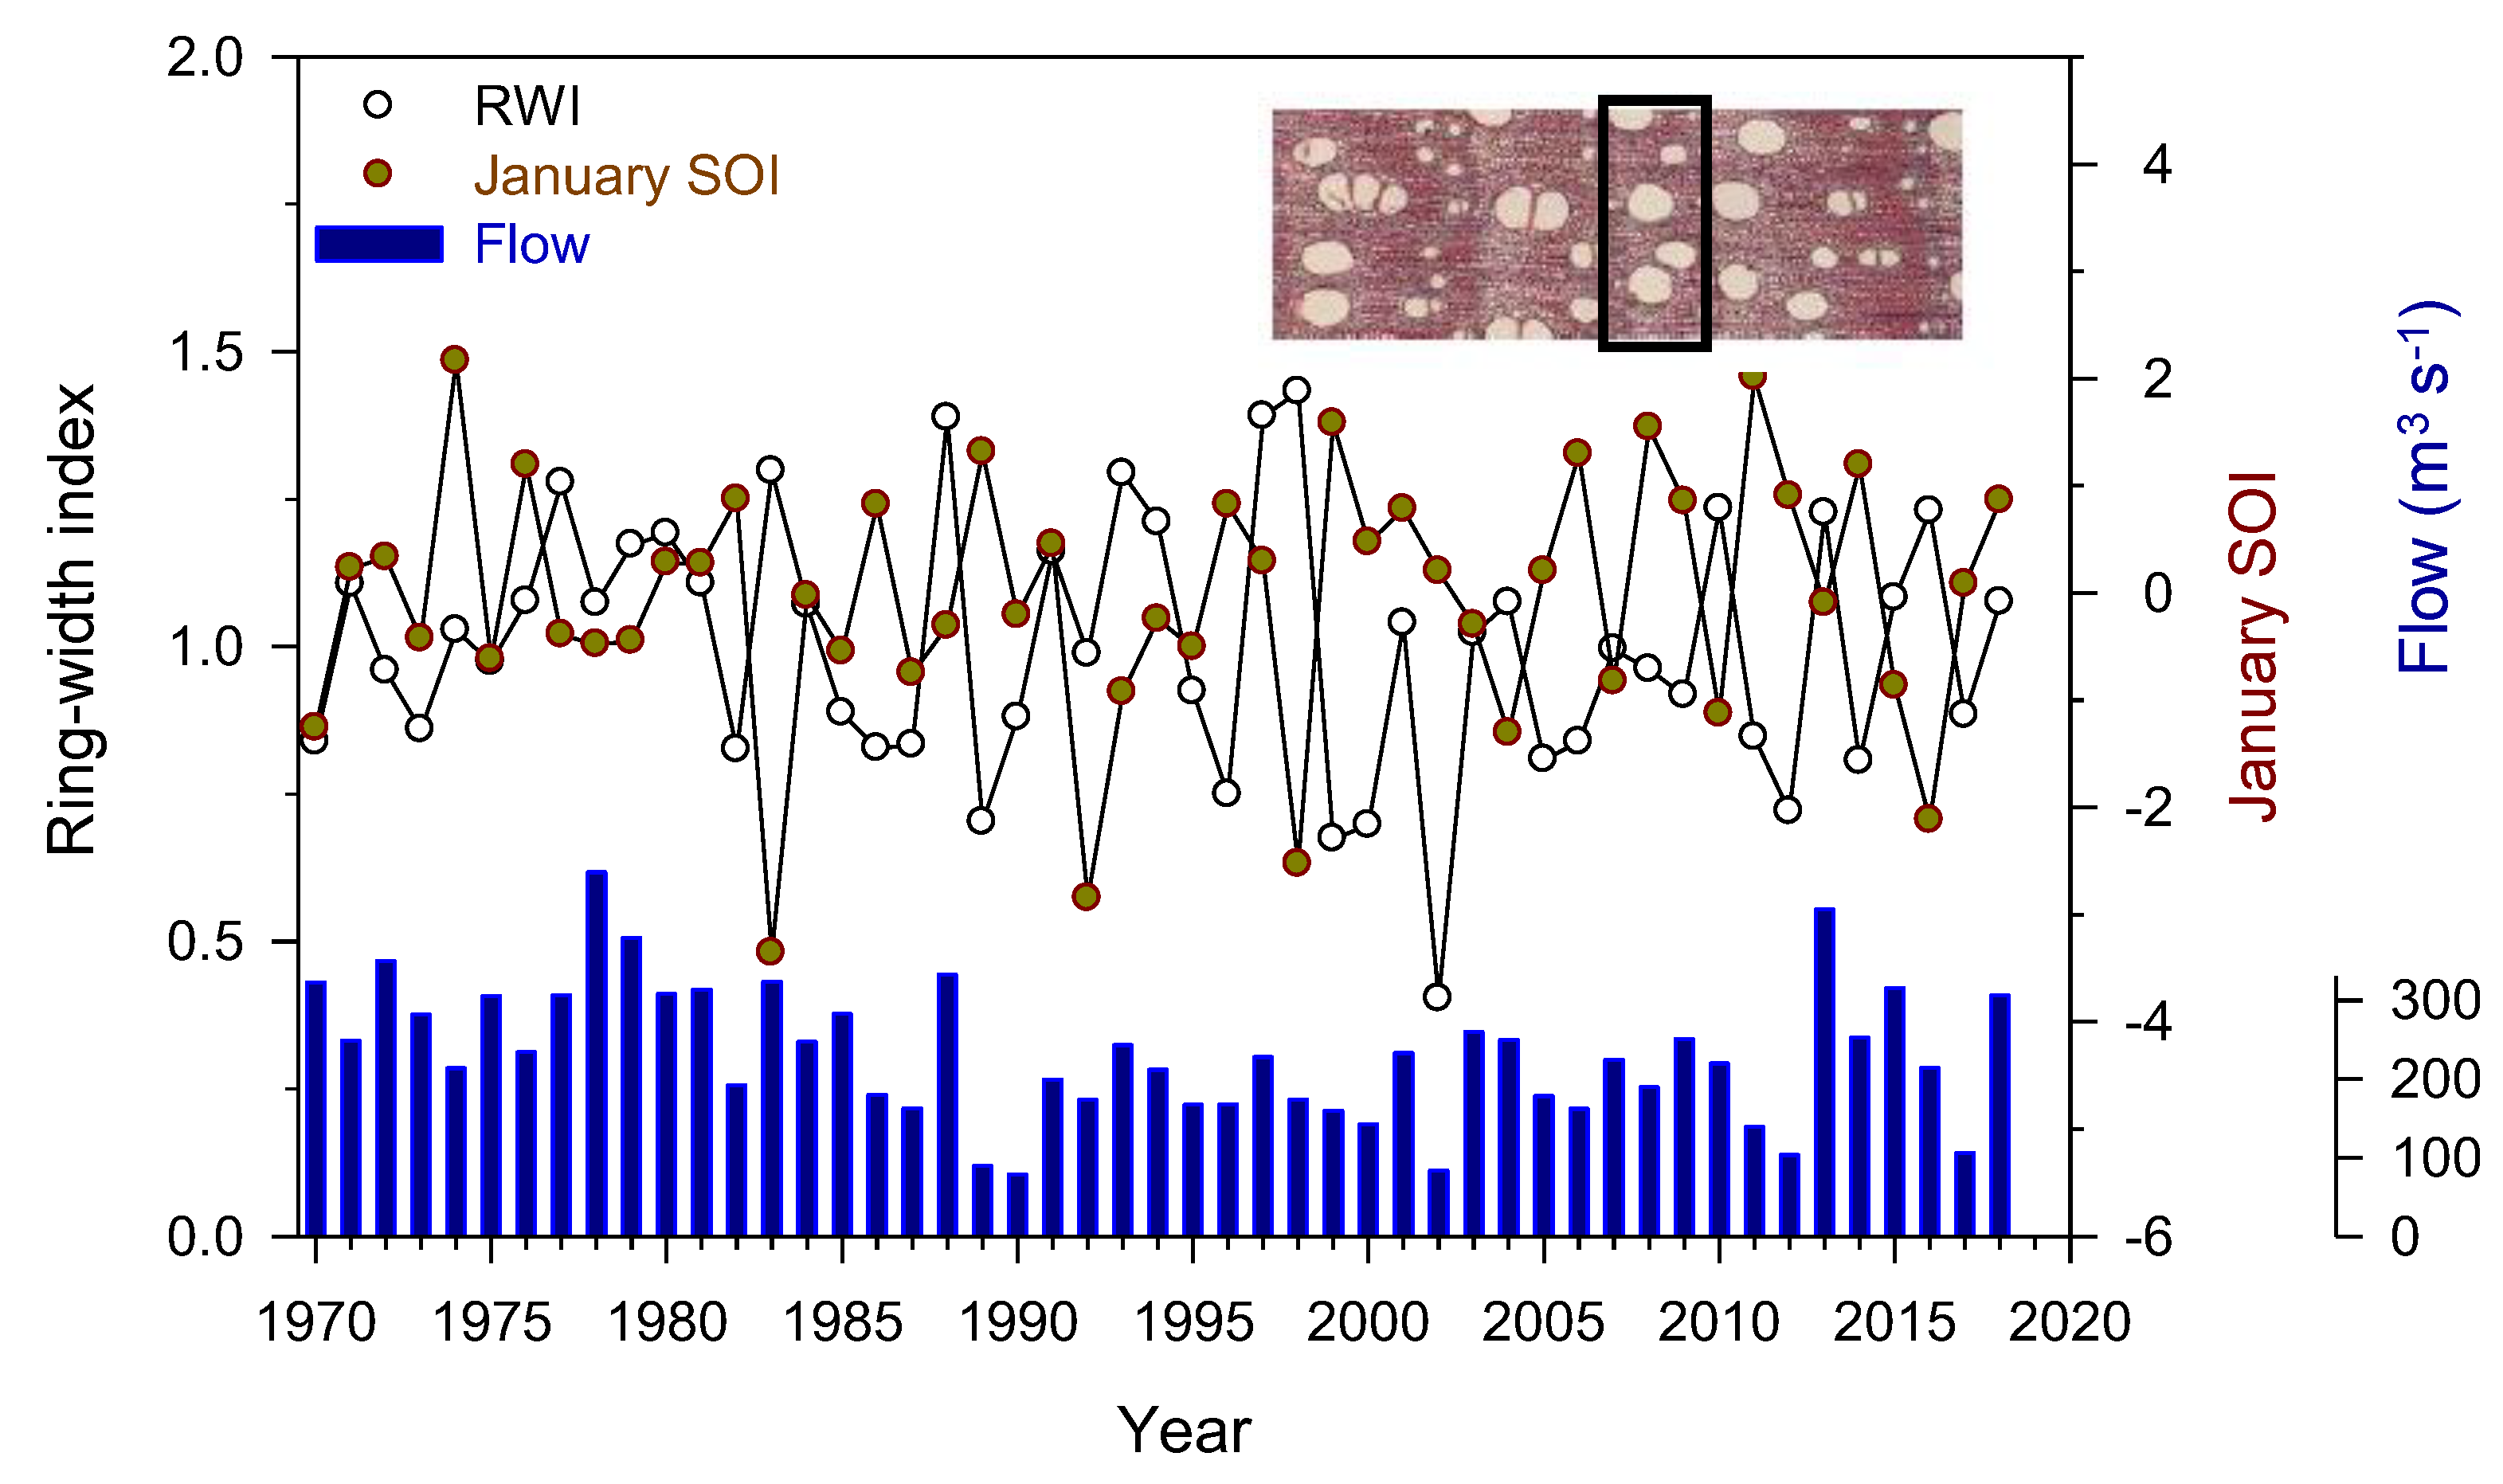
Neither the SOI (τ = 0.08, p = 0.42) nor the flow (τ = 0.17, p = 0.19) series presented any significant trend. The January SOI was negatively related to the ash growth series (r = −0.46, p = 0.001) and also to the river flow of the hydrological year (r = −0.30, p = 0.03; Figure 2). Consequently, the January SST3.4 was positively related to ash growth indices (r = 0.42, p < 0.01). Interestingly, the correlation between January SOI and river flow of the hydrological year increased in absolute terms (r = −0.37, p = 0.01) after excluding some of the strongest El Niño years in the observational record with January SOI values below the −1.5 threshold (1982/83, 1997/98 and 2015/16; cf. [28]). The correlation between SOI and ash ring-width indices remained significant after excluding these El Niño years (r = −0.35, p = 0.02). Comparatively, prior-October NAO showed lower correlations in absolute values with river flow (r = −0.30, p = 0.04) and ash growth (r = −0.32, p = 0.03).
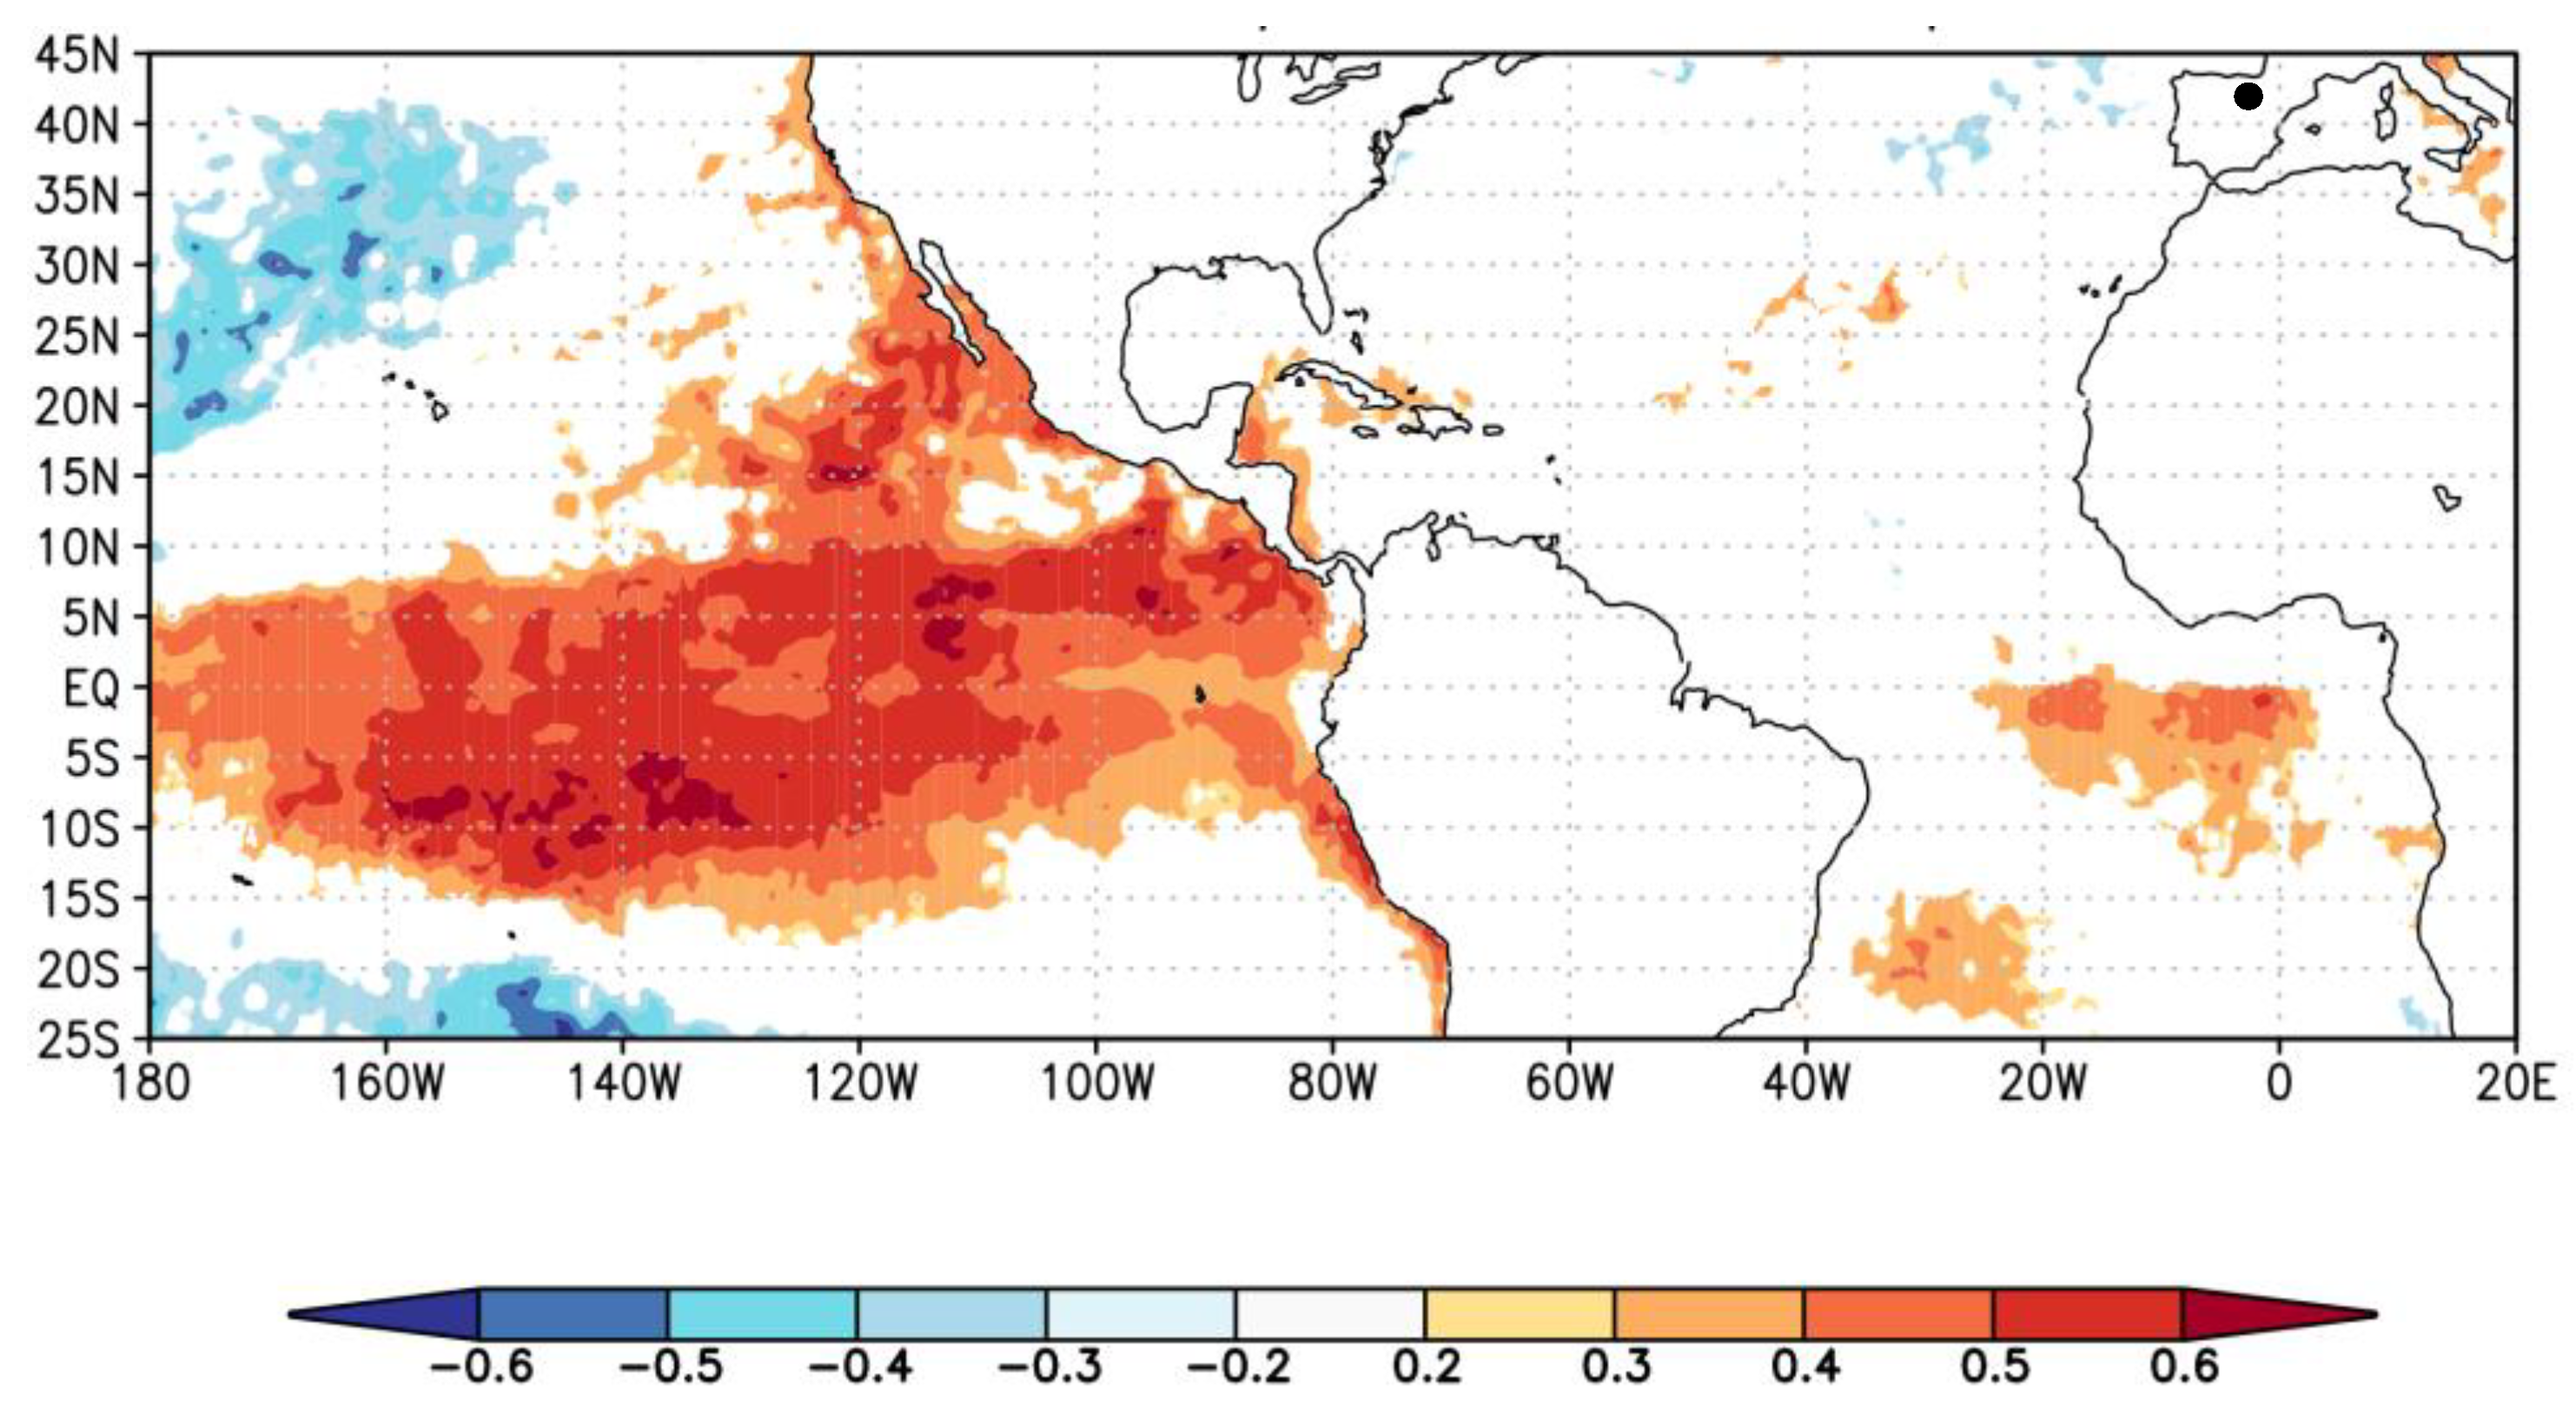
The spatial correlations were in agreement with previous results since a positive correlation between the ash ring-width indexed series and January SSTs over the Equatorial Pacific was found (Figure 3).
4. Discussion
4.1. River Flow and Correlations of Growth and Climate Indices
I found stronger associations between ash growth and river flow than between ash growth and local precipitation. This could be due to the cumulative behavior of river flow leading to decreasing or rising groundwater tables and reduced or increased soil moisture levels during several months in response to dry or wet winter–spring conditions. The Ebro river is characterized by a pluvio-nival hydrological regime with river flow depending on winter–spring precipitation and snowmelt [39].
The presented findings were not local and restricted to the study site since similar correlations were found between the January SOI and ash ring-width series from nearby riparian forests situated in the middle Ebro basin (see [30,31]). For instance, correlations between January SOI and ash site growth series were r = −0.66 (p < 0.0001) and r = −0.45 (p = 0.006) in Tudela (“Soto de la Remonta”, 1.591° W, 42.126° N, 266 m a.s.l.), Novillas (“Soto de Novillas”, 1.377° W, 41.927° N, 231 m a.s.l.) and Zaragoza (“Soto de Partinchas”, 0.934° W, 41.698° N, 207 m a.s.l.) sites, three riparian forests located 11, 37 and 79 km downstream from the Castejón gauging station, respectively.
The relationships between the ENSO, river flow and ash growth were stronger than those observed with the NAO, which is regarded as the prominent climate mode controlling winter–spring precipitation in the Iberian Peninsula [17]. For instance, high winter NAO indices are associated with low precipitation and reduced river flow, mainly in the western Iberian Peninsula [40]. The NAO impacts on winter–spring precipitation, river flow, tree growth and agricultural and forest productivity in the Iberian Peninsula are strong and have been well characterized [10,11,12,13,14,41]. However, ENSO impacts on Iberian climate, river flow and forest growth are not so straightforward, except for La Niña events which lead to winter–spring dry conditions and reduced crop yields [20,41]. Such dry conditions can propagate throughout the year and lead to declines in river flow and riparian forest growth due to the importance of winter rainfall in the study of Mediterranean areas. Recently, it was found that ENSO changes triggered transitory climate shifts toward drier climate conditions and decreased growth and productivity in semi-arid Iberian pine forests [42]. Those findings and the results presented here agree with previous research showing a negative relationship between spring SOI and tree growth in maritime pine (Pinus pinaster Ait.) forests located in Spain [43].
4.2. Caveats and Further Research
The presented analyses suggest that the relationships between the ENSO, river flow and riparian forest growth may not be linear. The 1982/83 and 1997/98 extreme El Niño episodes were exceptionally strong with elevated SSTs across the Equatorial Pacific disrupting global climate patterns [28]. Such disruption could explain the observed high ash growth indices linked to enhanced river flow. Indeed, during those El Niño events, ash growth was 33% higher than on average corresponding to elevated river flow.
Other aspects of ENSO influences on European and Mediterranean rainfall patterns should be also considered. First, the relationships between the ENSO and European hydroclimate are non-stationary and they are modulated by the state of the Atlantic Ocean [44]. Second, there is a tendency towards more “Central Pacific” (CP, with predominantly positive SSTs in the tropical central Pacific) than regular “East Pacific” (EP) El Niño events in the recent decades, which may be linked with global warming and could lead to more frequent negative NAO phases and, paradoxically, colder European winters [45,46]. The tropospheric bridge linking the equatorial Pacific SSTs with the atmospheric circulation over Europe and the North Atlantic is more efficient in the case of CP El Niños. In fact, the presented spatial correlation (Figure 3) is coherent with the increasingly recognized role played by CP El Niño events. However, during the last few decades, EP events have been becoming less frequent but also very intense, which could also explain their importance as drivers of European hydroclimate [46]. The mentioned sources of non-stationarity impact European hydroclimate and Iberian rainfall and river flow patterns and should be considered in future research on the responses of riparian forests.
It is evident that ash growth not only responded to ENSO and river flow. For instance, a very narrow (1.10 ± 0.12 mm mm) ring was produced in 2002, which was significantly (p < 0.05) lower than the mean growth rate (Figure 2). The 2002 very narrow ring was probably related to very low December temperatures observed in the study site which could have negatively impacted earlywood formation (Figure 1). This would explain the stronger relationship between the January SOI and ash growth series from sites where the December 2002 temperature drop was not so abrupt (e.g., “Soto de la Remonta” site near Tudela).
Further research could investigate if the ENSO affects other riparian or floodplain forests and tree species across the Mediterranean Basin and elsewhere considering other drought-prone, seasonally flooded areas and older trees providing longer series of ring-width indices. This would allow better understanding ENSO impacts on forest ecosystems at regional and global scales and considering non-stationary linkages between ENSO and hydroclimate (e.g., [47]). In addition, proxies of tree functioning such as time series of wood anatomy and isotope composition in wood and water (δ13C and δ18O; see [48]) would improve our understanding of how the ENSO affects the functioning of riparian forests.
5. Conclusions
River flow during the hydrological year explained 29% of the year-to-year variability of ash radial growth, which was also negatively related to water table depth. A decline in river flow was linked to dry winter–spring conditions during negative phases of the ENSO (La Niña events) characterized by high SOI values. Such dry winter–spring conditions lead to a reduced river flow, a deeper groundwater table and a decline in ash growth in the study Iberian riparian forest. The analysis contributes to the understanding of ENSO impacts on drought-prone riparian forests and the linkages to basin hydrology on seasonal scales. It should be elucidated if the ENSO tree-ring signals uncovered in the studied riparian forest would also appear in wetter and cooler sites where tree growth is less coupled to precipitation, river flow and underground water fluctuations.
Funding
This research was funded by the BBVA Foundation, SED-IBER project, and Instituto de Estudios Riojanos—Govt. La Rioja (“Estructura, dinámica y funcionamiento de los Sotos de Alfaro como ejemplo de bosques riparios maduros”).
Institutional Review Board Statement
Not applicable.
Informed Consent Statement
Not applicable.
Data Availability Statement
The data presented in this study are available on request from the corresponding author.
Acknowledgments
I am grateful to Michele Colangelo, Patricia M. Rodríguez-González, Ángela Sánchez-Miranda and Raúl Sánchez-Salguero for their help in the field. I also acknowledge Gobierno de La Rioja and Rafael Fernández Aldana for their help in obtaining sampling permissions. This study is dedicated to the memory of Nemesio Camarero López.
Conflicts of Interest
The author declares no conflict of interest.
References
- Rodríguez-González, P.M.; Stella, J.C.; Campelo, F.; Ferreira, M.T.; Albuquerque, A. Subsidy or stress? Tree structure and growth in wetland forests along a hydrological gradient in Southern Europe. For. Ecol. Manag. 2010, 259, 2015–2025. [Google Scholar] [CrossRef]
- Stella, J.C.; Bendix, J. Multiple stressors in riparian ecosystems. In Multiple Stressors in River Ecosystems; Sabater, S., Elosegi, A., Ludwig, R., Eds.; Elsevier: Amsterdam, The Netherlands, 2019; pp. 81–110. [Google Scholar]
- Stella, J.C.; Rodríguez-González, P.M.; Dufour, S.; Bendix, J. Riparian vegetation research in Mediterranean-climate regions, common patterns, ecological processes, and considerations for management. Hydrobiologia 2013, 719, 291–315. [Google Scholar] [CrossRef]
- Valor, T.; Camprodon, J.; Buscarini, S.; Casals, P. Drought-induced dieback of riparian black alder as revealed by tree rings and oxygen isotopes. For. Ecol. Manag. 2020, 478, 118500. [Google Scholar] [CrossRef]
- Stella, J.C.; Riddle, J.; Piegay, H.; Gagnage, M.; Tremelo, M.L. Climate and local geomorphic interactions drive patterns of riparian forest decline along a Mediterranean Basin river. Geomorphology 2013, 202, 101–114. [Google Scholar] [CrossRef]
- Gomes Marques, I.; Campelo, F.; Rivaes, R.; Albuquerque, A.; Ferreira, M.T.; Rodríguez-González, O. Tree rings reveal long-term changes in growth resilience in Southern European riparian forests. Dendrochronologia 2018, 52, 167–176. [Google Scholar] [CrossRef]
- Scott, M.L.; Shafroth, P.B.; Auble, G.T. Responses of riparian cottonwoods to alluvial water table declines. Environ. Manag. 1999, 23, 347–358. [Google Scholar] [CrossRef]
- Dufour, S.; Piégay, H. Geomorphological controls of Fraxinus excelsior growth and regeneration in floodplain forests. Ecology 2008, 89, 205–215. [Google Scholar] [CrossRef]
- Hallett, T.B.; Coulson, T.; Pilkington, J.G.; Clutton-Brock, T.H.; Pemberton, J.M.; Grenfell, B.T. Why large-scale climate indices seem to predict ecological processes better than local weather. Nature 2004, 430, 71–75. [Google Scholar] [CrossRef]
- Macias, M.; Timonen, M.; Kirchhefer, A.; Lindholm, M.; Eronen, M.; Gutiérrez, E. Growth variability of Scots pine (Pinus sylvestris L.) along a west-east gradient across northern Fennoscandia: A dendroclimatic approach. Arctic. Antarct. Alp. Res. 2004, 36, 565–574. [Google Scholar] [CrossRef]
- Camarero, J.J. Direct and indirect effects of the North Atlantic Oscillation on tree growth and forest decline in Northeastern Spain. In Hydrological, Socioeconomic and Ecological Impacts of the North Atlantic Oscillation in the Mediterranean Region; Vicente-Serrano, S.M., Trigo, R.M., Eds.; Springer: Berlin/Heidelberg, Germany, 2011; pp. 129–152. [Google Scholar]
- Camisón, A.; Silla, F.; Camarero, J.J. Influences of the atmospheric patterns on unstable climate-growth associations of western Mediterranean forests. Dendrochronologia 2016, 40, 130–142. [Google Scholar] [CrossRef]
- Pasho, E.; Camarero, J.J.; de Luis, M.; Vicente-Serrano, S.M. Spatial variability in large-scale and regional atmospheric drivers of Pinus halepensis growth in eastern Spain. Agric. For. Meteorol. 2011, 151, 1106–1119. [Google Scholar] [CrossRef]
- Madrigal-González, J.; Ballesteros-Cánovas, J.A.; Herrero, A.; Ruiz-Benito, P.; Stoffel, M.; Lucas-Borja, M.E.; Andivia, E.; Sancho-García, C.; Zavala, M.A. Forest productivity in southwestern Europe is controlled by coupled North Atlantic and Atlantic Multidecadal Oscillations. Nat. Comm. 2017, 8, 2222. [Google Scholar] [CrossRef]
- Stenseth, N.C.; Ottersen, G.; Hurrell, J.W.; Mysterud, A.; Lima, M.; Chan, K.S.; Yoccoz, N.G.; Ådlandsvik, B. Studying climate effects on ecology through the use of climate indices: The North Atlantic Oscillation, El Niño Southern Oscillation and beyond. Proc. R. Soc. Lond. B 2003, 270, 2087–2096. [Google Scholar] [CrossRef]
- McPhaden, M.J.; Zebiak, S.E.; Glantz, M.H. ENSO as an integrated concept in Earth science. Science 2006, 314, 1740–1745. [Google Scholar] [CrossRef]
- Rodó, X.; Baert, E.; Comín, F.A. Variations in seasonal rainfall in Southern Europe during the present century: Relationships with the North Atlantic Oscillation and the El Niño-Southern Oscillation. Clim. Dyn. 1997, 13, 275–284. [Google Scholar] [CrossRef]
- Rodríguez-Puebla, C.; Encinas, A.H.; Nieto, S.; Garmendia, J. Spatial and temporal patterns of annual precipitation variability over the Iberian Peninsula. Int. J. Climatol. 1998, 18, 299–316. [Google Scholar] [CrossRef]
- Pozo-Vázquez, D.; Gámiz-Fortis, S.R.; Tovar-Pescador, J.; Esteban-Parra, M.J.; Castro-Díez, Y. El Niño-Southern Oscillation events and associated European winter precipitation anomalies. Int. J. Climatol. 2005, 25, 17–31. [Google Scholar] [CrossRef]
- Vicente Serrano, S.M. El Niño and La Niña influence on droughts at different timescales in the Iberian Peninsula. Water Res. 2005, 41, 1–18. [Google Scholar] [CrossRef]
- Vegas-Vilarrúbia, T.; Sigró, J.; Giralt, S. Connection between El Niño-Southern Oscillation events and river nitrate concentrations in a Mediterranean river. Sci. Total Environ. 2012, 426, 446–453. [Google Scholar] [CrossRef]
- Ropelewski, C.F.; Jones, P.D. An extension of the Tahiti–Darwin Southern Oscillation index. Mon. Weather Rev. 1987, 115, 2161–2165. [Google Scholar] [CrossRef]
- Trenberth, K.E. The definition of El Niño. Bull. Am. Meteorol. Soc. 1997, 78, 2771–2777. [Google Scholar] [CrossRef]
- Muñoz-Díaz, D.; Rodrigo, F.S. Influence of the El Niño–Southern Oscillation on the probability of dry and wet seasons in Spain. Clim. Res. 2005, 30, 1–12. [Google Scholar] [CrossRef]
- Lorenzo, M.N.; Taboada, J.J.; Iglesias, I.; Gómez-Gesteira, M. Predictability of the spring rainfall in Northwestern Iberian Peninsula from sea surfaces temperature of ENSO areas. Clim. Chang. 2011, 107, 329–341. [Google Scholar] [CrossRef]
- Santoso, A.; Mcphaden, M.J.; Cai, W. The defining characteristics of ENSO extremes and the strong 2015/2016 El Niño. Rev. Geoph. 2017, 55, 1079–1129. [Google Scholar] [CrossRef]
- Brönnimann, S.; Xoplaki, E.; Casty, C.; Pauling, A.; Luterbacher, J. ENSO influence on Europe during the last centuries. Clim. Dyn. 2007, 28, 181–197. [Google Scholar] [CrossRef]
- Cai, W.; Borlace, S.; Lengaigne, M.; van Rensch, P.; Collins, M.; Vecchi, G.; Timmermann, A.; Santoso, A.; McPhaden, M.J.; Wu, L.; et al. Increasing frequency of extreme El Niño events due to greenhouse warming. Nat. Clim. Chang. 2014, 4, 111–116. [Google Scholar] [CrossRef]
- Rozas, V.; Camarero, J.J.; Sangüesa-Barreda, G.; Souto, M.; García-González, I. Summer drought and ENSO-related cloudiness distinctly drive Fagus sylvatica growth near the species rear-edge in northern Spain. Agric. For. Meteorol. 2015, 201, 153–164. [Google Scholar] [CrossRef]
- Camarero, J.J.; Colangelo, M.; Rodríguez-González, P.M.; Sánchez-Miranda, A.; Sánchez-Salguero, R.; Campelo, F.; Rita, A.; Ripullone, F. Wood anatomy and tree growth covary in riparian ash forests along climatic and ecological gradients. Dendrochronologia 2021, 70, 125891. [Google Scholar] [CrossRef]
- Rodríguez-González, P.M.; Colangelo, M.; Sánchez-Miranda, A.; Sánchez-Salguero, R.; Campelo, F.; Rita, A.; Gomes Marques, I.; Albuquerque, A.; Ripullone, F.; Camarero, J.J. Climate, drought and hydrology drive narrow-leaved ash growth dynamics in southern European riparian forests. For. Ecol. Manag. 2021, 490, 119128. [Google Scholar] [CrossRef]
- Ollero, A. Channel adjustments, floodplain changes and riparian ecosystems of the middle Ebro River: Assessment and management. Int. J. Water Res. 2007, 23, 73–90. [Google Scholar] [CrossRef]
- Cornes, R.; van der Schrier, G.; van den Besselaar, E.J.M.; Jones, P.D. An ensemble version of the E-OBS temperature and precipitation datasets. J. Geophys. Res. Atm. 2018, 123, 9391–9409. [Google Scholar] [CrossRef]
- Holmes, R.L. Computer-assisted quality control in tree-ring dating and measurement. Tree-Ring Bull. 1983, 43, 69–78. [Google Scholar]
- Cook, E.R.; Krusic, P.J.; Peters, K.; Holmes, R.L. Program ARSTAN (Version 4.4), Autoregressive Tree–Ring Standardization Program; Tree–Ring Laboratory of Lamont–Doherty Earth Observatory: Palisades, NY, USA, 2017. [Google Scholar]
- Fritts, H.C. Tree Rings and Climate; Academic Press: London, UK, 1976. [Google Scholar]
- Mudelsee, M. Estimating Pearson’s correlation coefficient with bootstrap confidence interval from serially dependent time series. Math. Geol. 2003, 35, 651–665. [Google Scholar] [CrossRef]
- StataCorp. Stata Statistical Software: Release 17; Stata Corp.: College Station, TX, USA, 2021. [Google Scholar]
- Solans, M.A.; LeRoy Poff, N. Classification of natural flow regimes in the Ebro basin (Spain) by using a wide range of hydrologic parameters. River Res. Appl. 2013, 29, 1147–1163. [Google Scholar] [CrossRef]
- Trigo, R.M.; Pozo-Vázquez, D.; Osborn, T.J.; Esteban-Parra, M.-J. North Atlantic Oscillation influence on precipitation, river flow and water resources in the Iberian Peninsula. Int. J. Climatol. 2004, 24, 925–944. [Google Scholar] [CrossRef]
- Gimeno, L.; Ribera, P.; Iglesias, R.; de la Torre, L.; García, R.; Hernández, E. Identification of empirical relationships between indices of ENSO and NAO and agricultural yields in Spain. Clim. Res. 2002, 21, 165–172. [Google Scholar] [CrossRef]
- Carnicer, J.; Domingo-Marimon, C.; Ninyerola, M.; Camarero, J.J.; Bastos, A.; López-Parages, J.; Rodríguez-Fonseca, B.; Lenton, T.M.; Dakos, V.; Ribas, M.; et al. Regime shifts of Mediterranean forest carbon uptake and reduced resilience driven by multidecadal ocean surface temperature. Glob. Chang. Biol. 2019, 25, 2825–2840. [Google Scholar] [CrossRef]
- Bogino, S.; Bravo, F. SOI and NAO impacts on Pinus pinaster Ait. growth in Spanish forests. In TRACE—Tree Rings in Archaeology, Climatology and Ecology; Elferts, D., Brumelis, G., Gärtner, H., Helle, G., Schleser, G., Eds.; GFZ Potsdam: Potsdam, Germany, 2008; pp. 21–26. [Google Scholar]
- Rodríguez-Fonseca, R.; Suárez-Moreno, R.; Ayarzagüena, B.; López-Parages, J.; Gómara, I.; Villamayor, J.; Mohino, E.; Losada, T.; Castaño-Tierno, A. A review of ENSO influence on the North Atlantic. Atmosphere 2016, 7, 87. [Google Scholar] [CrossRef]
- Graf, H.F.; Zanchettin, D. Central Pacific El Niño, the “subtropical bridge,” and Eurasian climate. J. Geophys. Res. 2012, 117, D01102. [Google Scholar] [CrossRef]
- Freund, M.B.; Henley, B.J.; Karoly, D.J.; McGregor, H.V.; Abram, N.J.; Dommenget, D. Higher frequency of Central Pacific El Niño events in recent decades relative to past centuries. Nat. Geosci. 2019, 12, 450–455. [Google Scholar] [CrossRef]
- Schöngart, J.; Junk, W.J.; Piedade, M.T.F.; Ayres, J.M.; Hüttermann, A.; Worbes, M. Teleconnection between tree growth in the Amazonian floodplains and the El Niño–Southern Oscillation effect. Glob. Chang. Biol. 2004, 10, 683–692. [Google Scholar] [CrossRef]
- Singer, M.B.; Stella, J.C.; Dufour, S.; Piégay, H.; Wilson, R.J.; Johnstone, L. Contrasting water uptake and growth responses to drought in co-occurring riparian tree species. Ecohydrology 2013, 6, 402–412. [Google Scholar] [CrossRef]
Figure 1.
Pearson correlations calculated by relating ash ring-width indices (period 1970–2018), monthly climate variables (mean minimum and maximum temperatures, precipitation) and river flow. Dashed and dotted horizontal lines indicate the 0.05 and 0.01 significance levels, respectively. Months of the prior and current years are abbreviated by lowercase and uppercase letters, respectively. The last bars correspond to the hydrological year.

Figure 2.
Variability of ash ring-width indices (RWIs), January SOI and river flow of the hydrological year (blue bars). Note the low RWI recorded in 2002. The inset shows a cross-section of ash wood and the 2002 narrow ring (box).
Figure 2.
Variability of ash ring-width indices (RWIs), January SOI and river flow of the hydrological year (blue bars). Note the low RWI recorded in 2002. The inset shows a cross-section of ash wood and the 2002 narrow ring (box).

Figure 3.
Spatial correlation between the series of ash ring-width indices and January SSTs. The color scale shows Pearson correlations. The point indicates the approximate location of the study site in northeastern Spain.
Figure 3.
Spatial correlation between the series of ash ring-width indices and January SSTs. The color scale shows Pearson correlations. The point indicates the approximate location of the study site in northeastern Spain.

Publisher’s Note: MDPI stays neutral with regard to jurisdictional claims in published maps and institutional affiliations. |
© 2022 by the author. Licensee MDPI, Basel, Switzerland. This article is an open access article distributed under the terms and conditions of the Creative Commons Attribution (CC BY) license (https://creativecommons.org/licenses/by/4.0/).
Share and Cite
MDPI and ACS Style
Camarero, J.J. ENSO Signals Recorded by Ash Tree Rings in Iberian Riparian Forests. Water 2022, 14, 3027. https://doi.org/10.3390/w14193027
AMA Style
Camarero JJ. ENSO Signals Recorded by Ash Tree Rings in Iberian Riparian Forests. Water. 2022; 14(19):3027. https://doi.org/10.3390/w14193027
Chicago/Turabian StyleCamarero, Jesús Julio. 2022. "ENSO Signals Recorded by Ash Tree Rings in Iberian Riparian Forests" Water 14, no. 19: 3027. https://doi.org/10.3390/w14193027
Note that from the first issue of 2016, this journal uses article numbers instead of page numbers. See further details here.