
Evaluation of a Slum Upgrading Program for Improvement of Water Supply in Bandung City, Indonesia


Department of Urban Engineering, Graduate School of Engineering, The University of Tokyo, Bunkyo-Ku, Tokyo 113-8654, Japan
*
Author to whom correspondence should be addressed.
Water 2022, 14(19), 3025; https://doi.org/10.3390/w14193025
Submission received: 23 August 2022
/
Revised: 14 September 2022
/
Accepted: 22 September 2022
/
Published: 26 September 2022
(This article belongs to the Section Urban Water Management)
Abstract
:A slum upgrading program has provided communal boreholes (KOTAKU boreholes) to improve water supply in slums of Indonesia. However, the achievement of the program was only estimated by the number of households served with the boreholes. We evaluated the water supply improvement by comparing actual water consumption, quality, and expenditure and household satisfaction of existing water sources in a slum of Bandung City, Indonesia. A high iron concentration and microbial contamination were observed in some KOTAKU boreholes, but the quality was better than that in the previous sources of the current KOTAKU borehole users. Twenty percent of the users spend more than 4% of their income on water due to bottled water and vended water for drinking and cooking. However, KOTAKU boreholes replaced that water for drinking and/or cooking, resulting in less water expenditure in low-income households. The average consumption was 134 L per capita per day (LPCD), which was higher than the target (60 LPCD) of the program. However, it was found that a highly intermittent water supply was the reason for household dissatisfaction rather than the amount of consumption. The program improved water supply; however, this study revealed the limitations of the water supply, namely, a lack of attention to continuous water supply and water quality.
1. Introduction
The rapid urban population growth along with insufficient support for basic needs, such as housing and health care, leads to the emergence of slums, especially in developing countries [1,2]. People who live in slums face serious public health problems arising from poor environmental conditions, such as overcrowding and contaminated water [3,4]. UN Habitat describes a slum as a place lacking one or more of the following: a durable housing structure, access to clean water, access to improved sanitation, sufficient living space, and security of tenure [5]. The main concern in each slum area might be different, for example, a lack of access to basic infrastructure, e.g., toilets and water supply in Nairobi, Kenya and security of tenure in Thailand [6]. In Asia, cities categorized as lacking basic water services had high percentages of the population living in slums [7].
In 2018, the slum population in East and Southeast Asia was the largest, at 369 million people of the total slum dwellers in the world [8]. Indonesia, the most populous country in the region, had the largest slum population of approximately 44,859,000 in 2018 [8]. The ratio of slum population to the total urban population in Indonesia is 30%, which is the fifth highest, after Myanmar (57%), Cambodia (46%), the Philippines (44%), and Mongolia (37%) [8]. Indonesia’s national slum profiling in 2014 reported that 50% of the urban poor population lived in slums, and around 30% and 37% of the slum dwellers lacked access to safe water and sanitation, respectively [9]. Thus, improvement of access to safe water in slums plays an important role in achieving SDG6 to ensure access to water and sanitation for all.
Since slum dwellers have limited access to a piped water supply network, they need to install a private well and a water storage tank and/or purchase water from shared taps, water vendors, and water shops to fulfill their needs [10,11]. Slum dwellers, even those who have access to piped water, generally rely on multiple water sources due to intermittent water supply and poor water quality [12,13]. Thus, slum households spend a lot of money on water because water vendors and shops charge a high price for water, especially during intermittent water supply [14,15]. The inadequacy also causes slum households to consume less water than the WHO recommendation of 50 L per capita per day (LPCD) [16,17].
Even if slum dwellers have access to sufficient water from water sources, such as private and communal boreholes, protected wells, and springs, this does not necessarily mean that safe water is available [18]. A study in Dhaka, Bangladesh found that access to improved water in the slum area is high (97%), but the water usually had a strange smell, color, and taste [19]. Many studies reported that E. coli and total coliform were found in deep and shallow wells, and even in tap water from a public water supply [20,21,22]. Other water quality problems, such as a high concentration of iron and nitrate due to geological conditions, waste effluent, improper sanitation, and agriculture activity, have been also reported [23,24,25]. In addition, water quality deterioration, especially microbial contamination, has been frequently observed not only in source water, but also in household storage tanks [26]. Intermittent water supply forces households to store water, which increases the risk of microbial contamination, particularly in cases where storage tanks are not frequently cleaned [13,27].
Slum upgrading programs have been conducted in many countries to improve physical, social, economic, organizational, and environmental conditions of slum areas [28]. The most basic form of the programs is the improvement of the physical environment, such as water supply, sanitation, solid waste collection, and access roads [29]. Through the programs, slum dwellers have gained access to water on their premises [30,31]. Improvement of water accessibility enabled slum dwellers to save time and cost expenditures for water in the Philippines and Thailand [32,33]. However, since slum upgrading programs generally focus on providing infrastructure and housing (physical capital) and are evaluated based on the number of people who gained access to those infrastructures, the service quality of water supply has not been well investigated [29,34].
The current slum upgrading program in Indonesia, namely “City Without Slum”, also known as the KOTAKU program, began in 2016 and aimed to eliminate 38,000 hectares of slum area in Indonesia by 2019. As of 2020, the Government of Indonesia claimed that more than 80% of the target areas were upgraded [35]. However, because the achievement of the upgrading is measured by the number of households served with the infrastructure, which are boreholes in terms of water supply, provided by the program, the actual water supply condition is unclear.
Thus, this study investigated the water consumption, quality, expenditure and household satisfaction with the water supply in a slum of Bandung City, Indonesia. In addition, those four parameters, i.e., consumption, quality, expenditure, and satisfaction, were compared among different water source users (KOTAKU borehole, municipal water, communal borehole, private borehole, spring water, and protected dug well) to evaluate the contribution of the KOTAKU program in the improvement of water supply in the slum areas.
2. Materials and Methods
2.1. Study Areas
Bandung, the capital city of West Java Province, is the third-largest city in Indonesia, with a population of 2,444,160 as of 2020 [36]. The total area of Bandung City is 167.31 km2 and consists of 30 subdistricts (Kecamatan), which are further divided into 151 urban villages (Kelurahan). The municipal waterworks, Perusahaan Daerah Air Minum (PDAM) Tirta Wening Bandung, supply water to 72.84% of the Bandung population [37]; however, intermittent water supply has forced the people to utilize multiple water sources, such as private boreholes, protected dug wells, or bottled and refilled water, for their daily needs [38,39]. For drinking water, it was reported as of 2021 that most of the citizens use bottled water (75.07%), followed by boreholes (14.27%), piped water from PDAM (7.97%), protected wells (1.58%), and protected spring water (1.12%) [36].
The city has developed into a metropolitan area and experienced a rapid population increase and urban expansion [38], resulting in a growth in slum settlements despite slum upgrading programs being implemented since 1978 [40]. In 2015, the total slum area in Bandung city was 1457.45 ha, approximately 9% of the total city area, which was the largest in the West Java Province [41]. The KOTAKU program in Bandung City began in 2017 to eliminate slum areas by providing basic infrastructure, such as road, water, sanitation, drainage, waste, and fire safety and involving community participation. To start the program, the Indonesian Government set two targets for water supply improvement: adequate quantity (at least 60 LPCD) and access to “improved” water sources (more than 10 m distance from sanitation facility and no odor, taste, and color). The KOTAKU program upgraded more than 60% of the slum area by 2020 [37]. Out of 151 urban villages in Bandung, 121 had slum areas and were subject to the KOTAKU program, and 98 urban villages were provided a piped water supply from a newly drilled communal borehole (KOTAKU borehole) with a large storage tank (approximately 1000 L) (Figure A1).
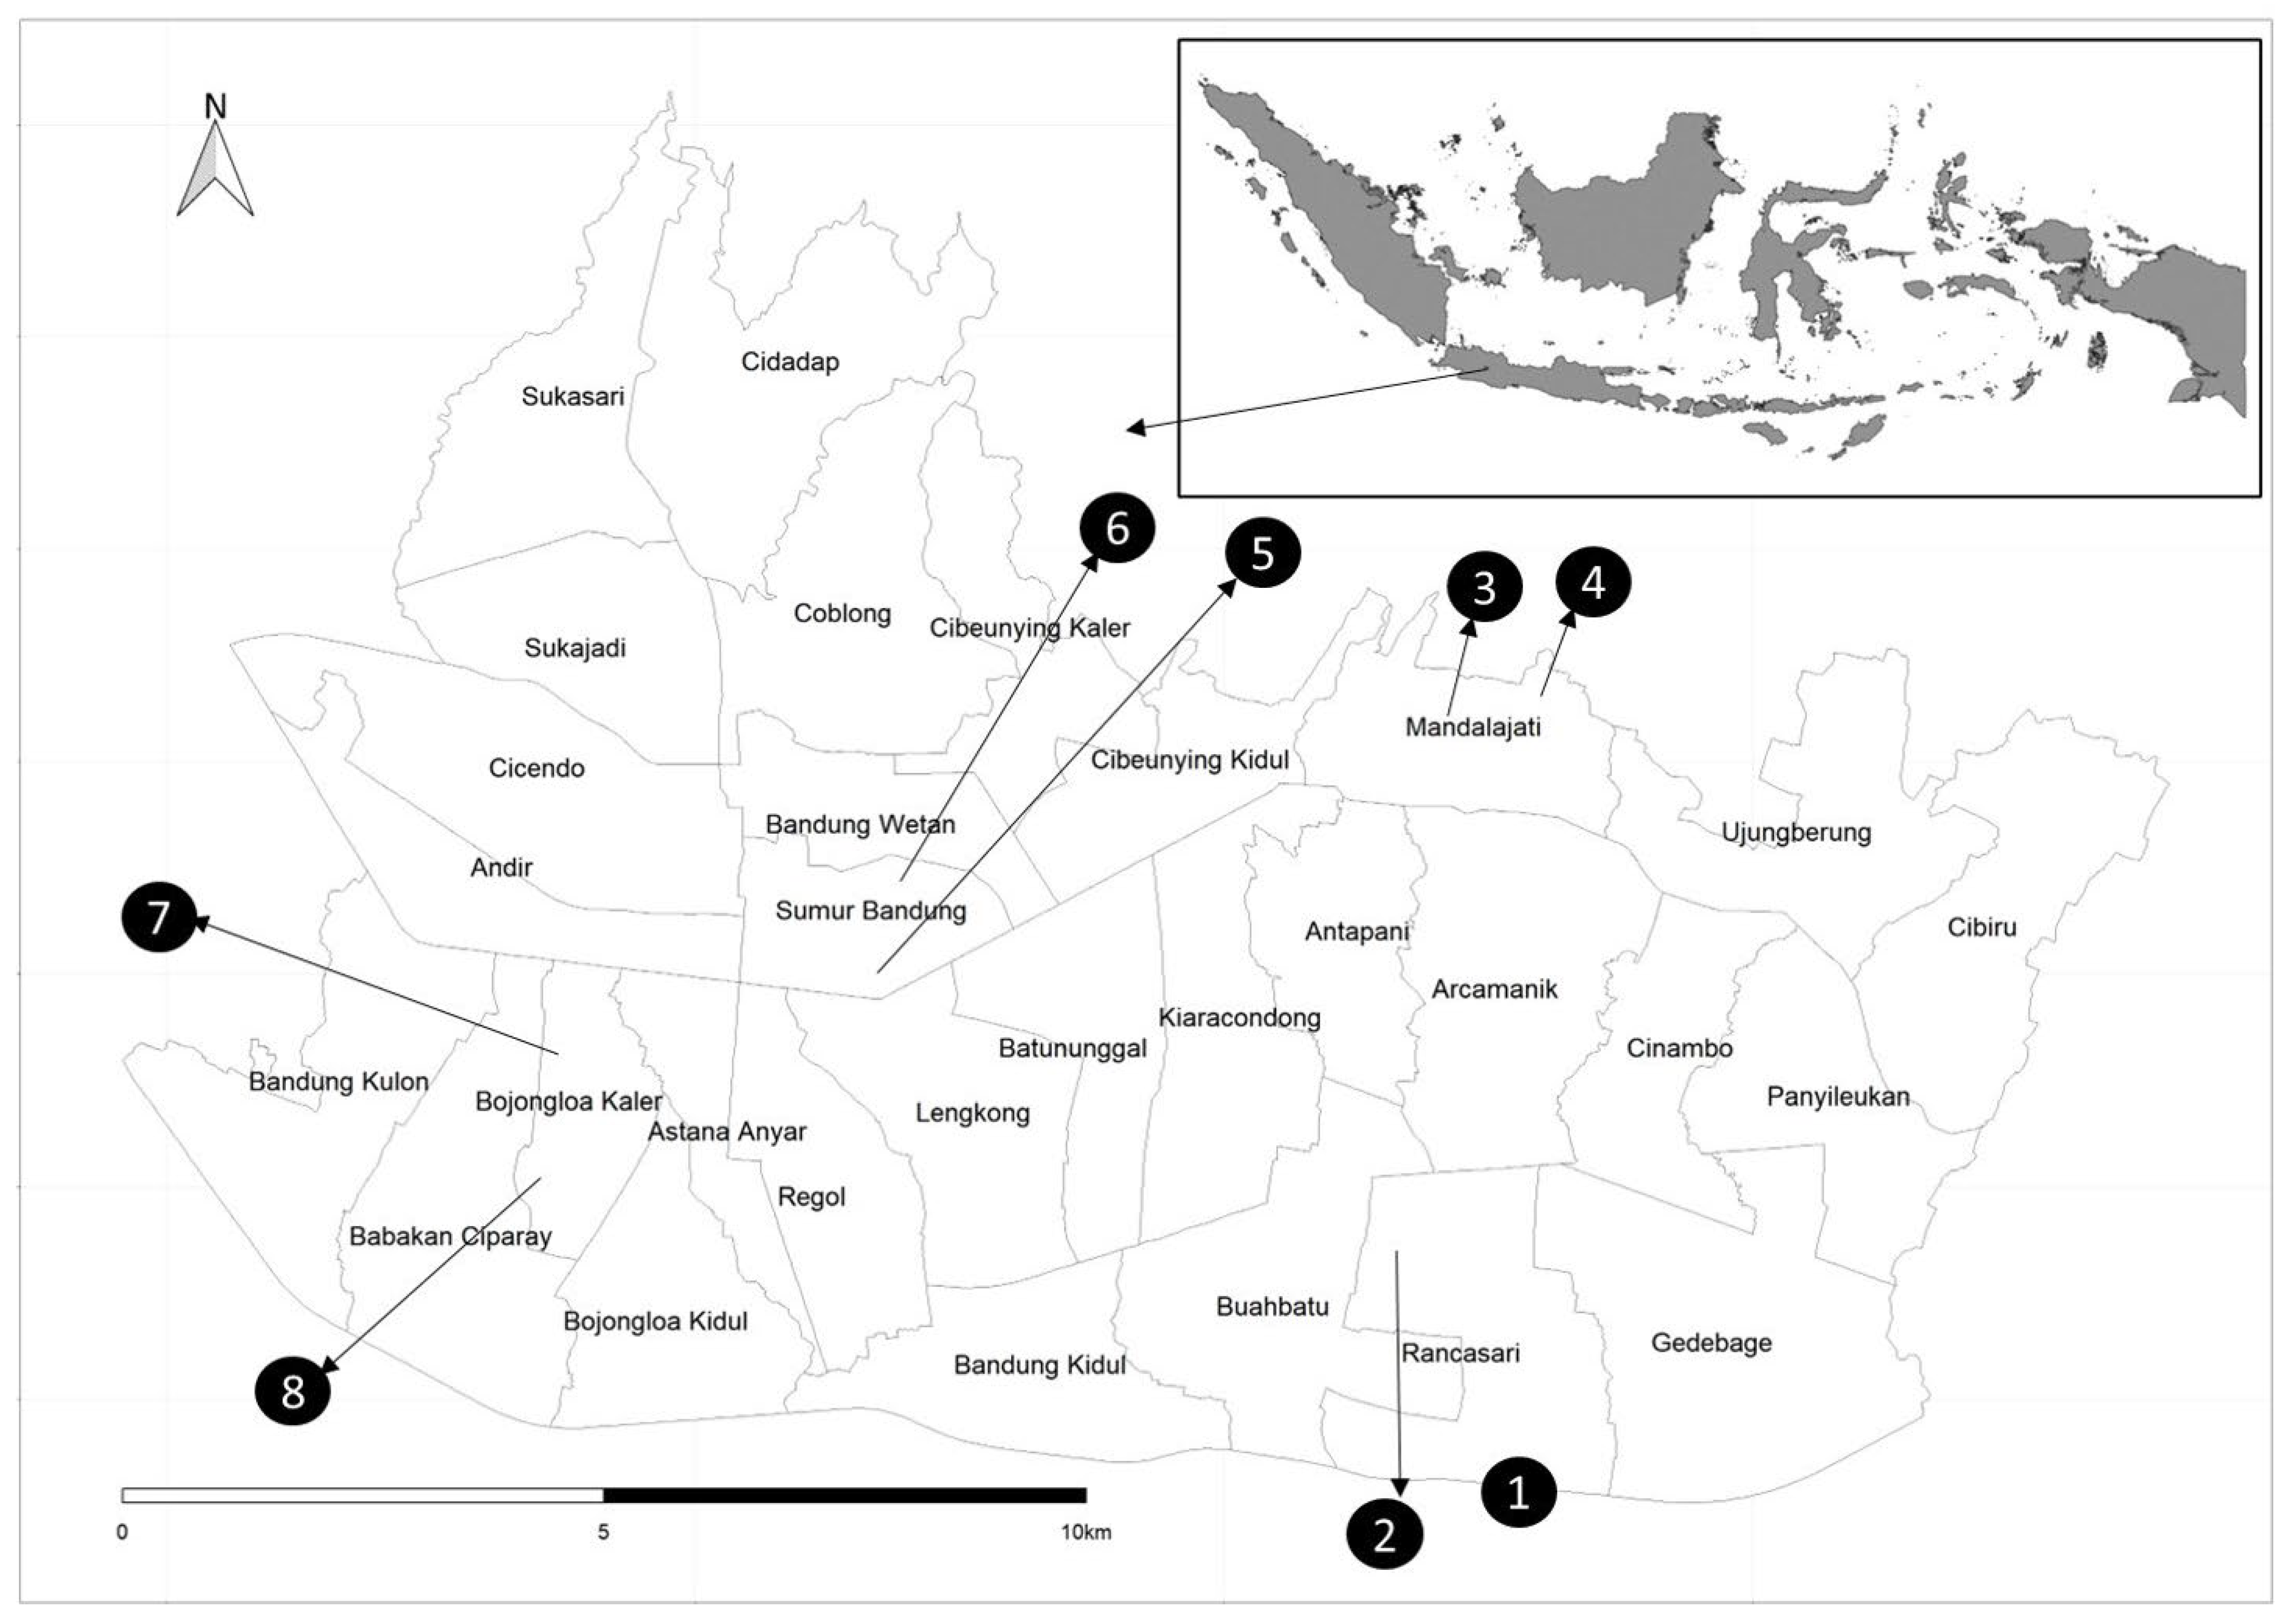
In order to evaluate the water supply by the KOTAKU program, an interview survey and water quality monitoring were conducted in August to October 2021. We randomly selected 120 households, including 71 KOTAKU borehole users (households), from eight urban villages in four subdistricts (Figure 1 and Table 1). The Sumur Bandung and Bojongloa Kaler subdistricts are in the city center, while the Mandalajati and Sumur Bandung subdistricts are in the outskirts of the city. PDAM (treated surface water), KOTAKU boreholes (well depth: 60–130 m), communal boreholes (32–100 m), private boreholes (5–45 m), protected dug wells (5–13 m), and spring water that are categorized as an improved water source in the program are available as water sources in the urban villages selected for this study. All the water sources except the protected dug wells are supplied via pipes. The communal boreholes and spring water were provided by previous slum upgrading programs and managed by the communities or small private companies in the study area. The protected dug wells have been used as communal or private wells.
2.2. Water Sources and Water Consumption
An interview survey was conducted to discover the water sources for three purposes: drinking, cooking, and other daily activities (bathing, washing, etc.). When households used multiple sources for each purpose, the most frequently used source was selected as the source for the respective purpose. In cases where a household used multiple sources at almost the same frequency, this was regarded as multiple sources.
Water consumption was obtained from the average of monthly water bills (two or three months). The per capita water consumption in LPCD was calculated by dividing the total household water consumption by the number of household members. For the households paying a flat-rate water tariff due to water meter outages and for the households using free-of-charge water sources (private boreholes and protected dug wells), the water consumption was estimated based on the capacity and filling frequency of water storage. The water consumption of bottled water and water from vendors was estimated by the monthly average number of those purchases.
2.3. Water Expenditure and Satisfaction with Quantity and Quality
Average monthly water expenditures (two or three months) and household incomes were also obtained from the interview survey. The water expenditure included the expenditure for bottled water and vended water in addition to the water tariff for the other water sources (PDAM, KOTAKU boreholes, communal boreholes, and spring water). The water tariffs for each water source are shown in Table A1 (Appendix A). Private boreholes and protected dug wells are free-of-charge. Satisfaction regarding water quantity and quality were also asked in the interview survey.
The respondents in Section 2.2 and Section 2.3 were one available person in a household as a representative, such as the head of the household or their wife. However, since the representatives in several households were not available, the households for the interview survey in Section 2.3 numbered less than 120. Personal information was handled carefully and anonymously. The interview survey (Section 2.2 and Section 2.3) was approved by the Research Ethics Committee, the University of Tokyo (Approval No. KE21-28) in advance.
2.4. Water Quality Analysis
Table 2 shows the number of samples for the water quality analysis taken from each point. A total of 115 water samples were collected from 109 households out of a total of 120, including 58 households from KOTAKU borehole users. Because 6 out of the 109 households had two sources, water samples were collected from both sources. In addition, 17 samples were directly collected from the KOTAKU boreholes. Household water samples were collected from either taps or storage, from which each household usually took water for their daily use. Because three households in Karang Pamulang mixed water from a communal borehole and a KOTAKU borehole in one storage, that source was regarded as a “mixed borehole”. A total of six parameters, namely, E. coli, total coliform, iron, nitrate, total dissolved solid (TDS), and pH, were analyzed for all water samples. In addition, free and total chlorine concentrations were measured for PDAM samples.
TDS and pH were measured using a compact pH and conductivity meter (LAQUAtwin, HORIBA, Kyoto, Japan). Iron and nitrate concentrations were analyzed using a portable calorimeter (DR 900, HACH LANGE®, Loveland, CO, USA). E. coli and total coliform were measured by the membrane filtration method (Method 10029, USEPA, Washington, DC, USA), wherein 100 mL of water samples was filtered through a 37 mm mixed cellulose ester monitoring unit with a pore size 0.45 µm (Advantec, Tokyo, Japan). Then, the culture medium (m-ColiBlue 24 Broth; Hach, Loveland, CO, USA) was filled in the unit and incubated at 37 °C under aerobic conditions for 24 h [42].
2.5. Statistical Analysis
The comparison of water consumption and water quality parameters between each water source was statistically analyzed using R v.4.0.3. The Kruskal–Wallis test was used for the analysis of the difference among more than two sample groups, while Wilcoxon’s test was used between two sample groups. These test results were considered to be significant at a p-value of less than 0.05.
3. Results
3.1. Water Source for Daily Activities
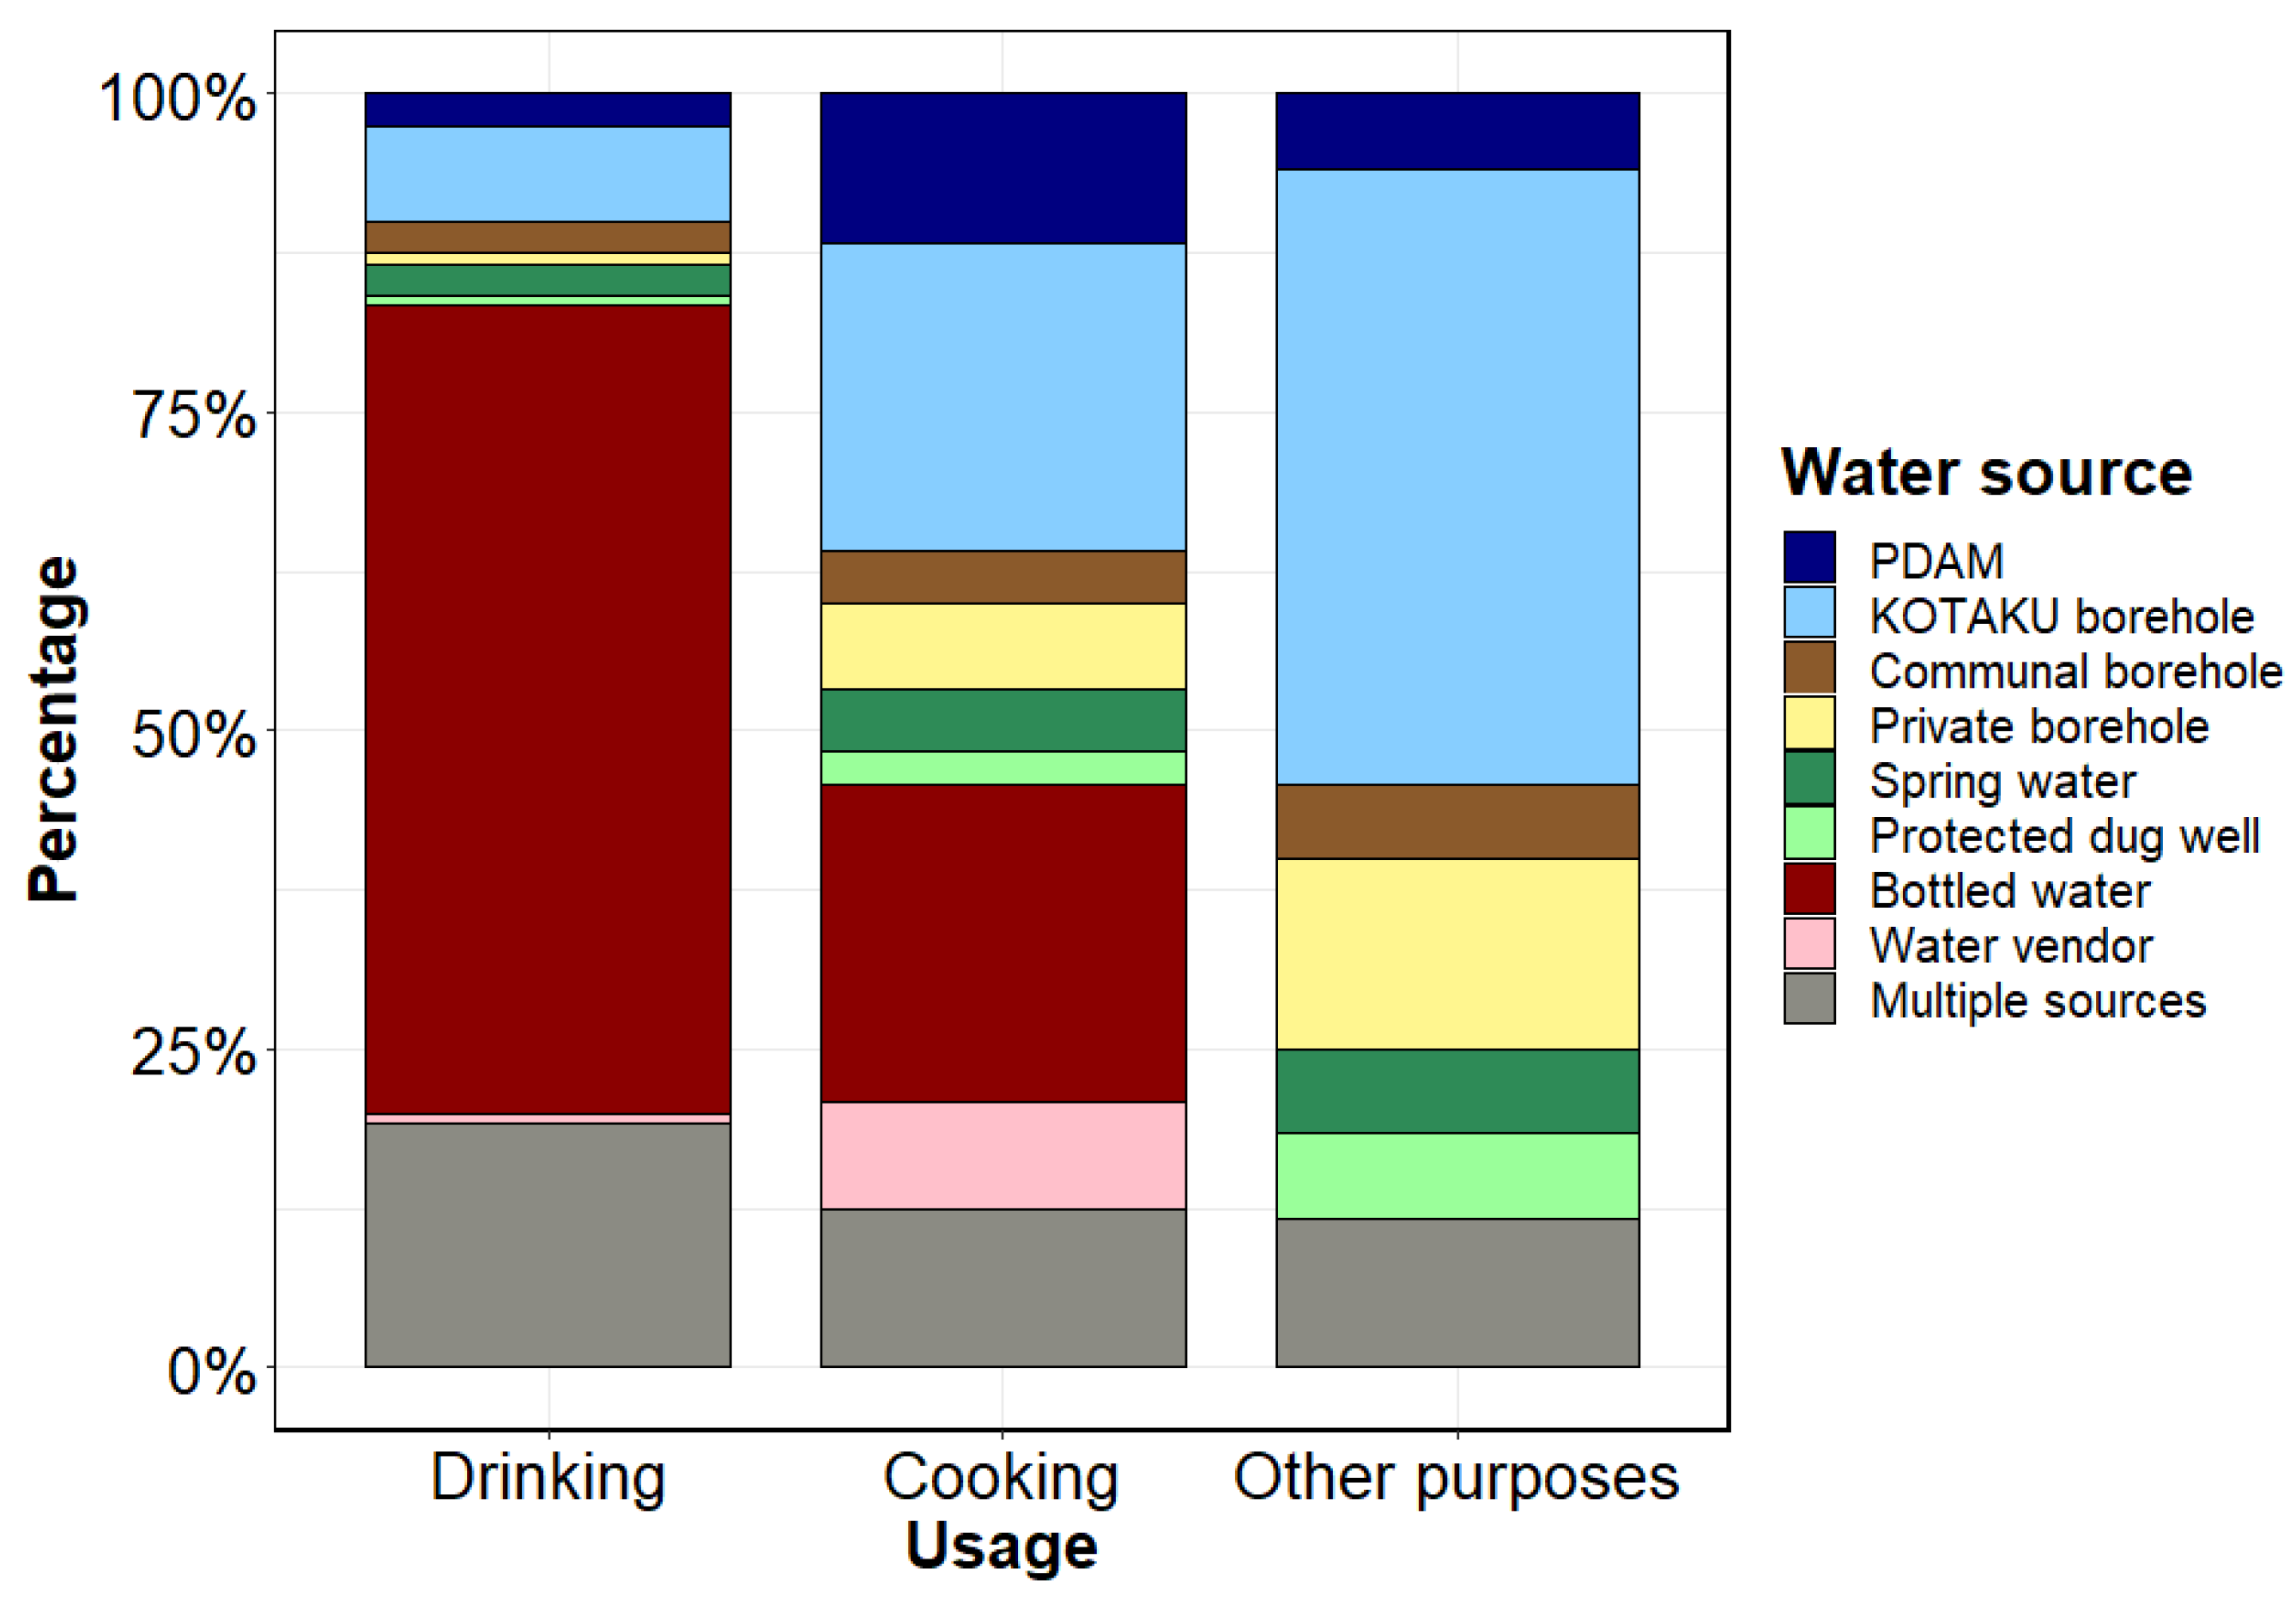
Figure 2 shows the water sources for drinking, cooking, and other purposes. Most of the households (79%) mainly drink bottled water, while the rest drink boiled water taken from other sources. Bottled water was also used in 40 households (33%) for cooking. Only fifteen households (13%), namely, seven KOTAKU borehole users, two PDAM, two communal borehole users, two spring water users, one protected dug well user, and one private borehole user, used a single source for the three purposes (drinking, cooking, and other daily activities), while the others used different sources for each purpose. The KOTAKU boreholes were used for drinking and cooking in 8% of households (n = 9) and 24% of households (n = 29), respectively. The other sources were used less for drinking and cooking: 0.8% and 7% of private borehole users for drinking and cooking, respectively; 0.8% and 2.5% for protected dug wells; 2.5% and 12% for PDAM; 2.5% and 4% for communal boreholes; and 2.5% and 5% for spring water. This implies that the KOTAKU boreholes contribute to providing better quality water than the other sources, probably resulting in the fact that the households can save expenditures on bottled water and vended water.
Figure 3 shows the change of water sources in the current KOTAKU borehole users (n = 67), excluding four new households that moved into the area after water provision from the KOTAKU program. The previous main sources of the KOTAKU borehole users (n = 67) were private boreholes (40%), communal boreholes (19%), protected dug wells (10%), spring water (10%), multiple sources (10%), PDAM (6%), and vended water (3%). The reason for the shift from PDAM to KOTAKU (6%) was due to the intermittent supply by PDAM or to save money considering the cheaper tariff of the KOTAKU borehole. Seven households (10%) used the KOTAKU borehole as single source. Out of 67, 9 households (13%) shifted their drinking water source from bottled water (n = 2), vended water (n = 4), protected dug wells (n = 2), or spring water (n = 1) to KOTAKU boreholes. The number of households that shifted their cooking water source to KOTAKU boreholes was 26 (37%), which consisted of 4 that previously used bottled water, 6 vended water, 1 PDAM, 2 communal borehole, 2 private borehole, 4 protected dug well, 5 spring water, and 2 multiple sources (bottled water and communal borehole). The KOTAKU borehole replaced bottled water and vended water as drinking and or cooking water in 12 (18%) households, of which 6 households shifted for both drinking and cooking water. This implies that the KOTAKU boreholes are considered to be a reliable source by the households. All the 67 users shifted water sources for other purposes to KOTAKU boreholes, but 15 households (22%) were still using both KOTAKU boreholes and other free-of-charge sources, namely, private boreholes and protected dug wells (“Multiple Sources” in Figure 3).
3.2. Water Consumption and Availability
The average household water consumption was 134 LPCD. Figure 4 shows the consumption in the groups based on the household’s main source (most-used water source) with the number of samples and average consumption. There was no significant difference (Kruskal–Wallis, p > 0.05) in water consumption among the main water sources. The highest average consumption was observed in the spring water users (178 LPCD), while the lowest average was in the protected dug well users (105 LPCD). A total of seven (6%) households, namely, two communal borehole users (29% of the communal borehole users), two KOTAKU borehole users (3%), one PDAM user (12%), one spring water user (12%), and one protected dug well user (12%), consumed less than the target consumption (60 LPCD). The reason for the low consumption in the two KOTAKU borehole users was the low water availability or both low water availability and/or saving of water expenditure in the others according to the interview survey (see Section 3.4).
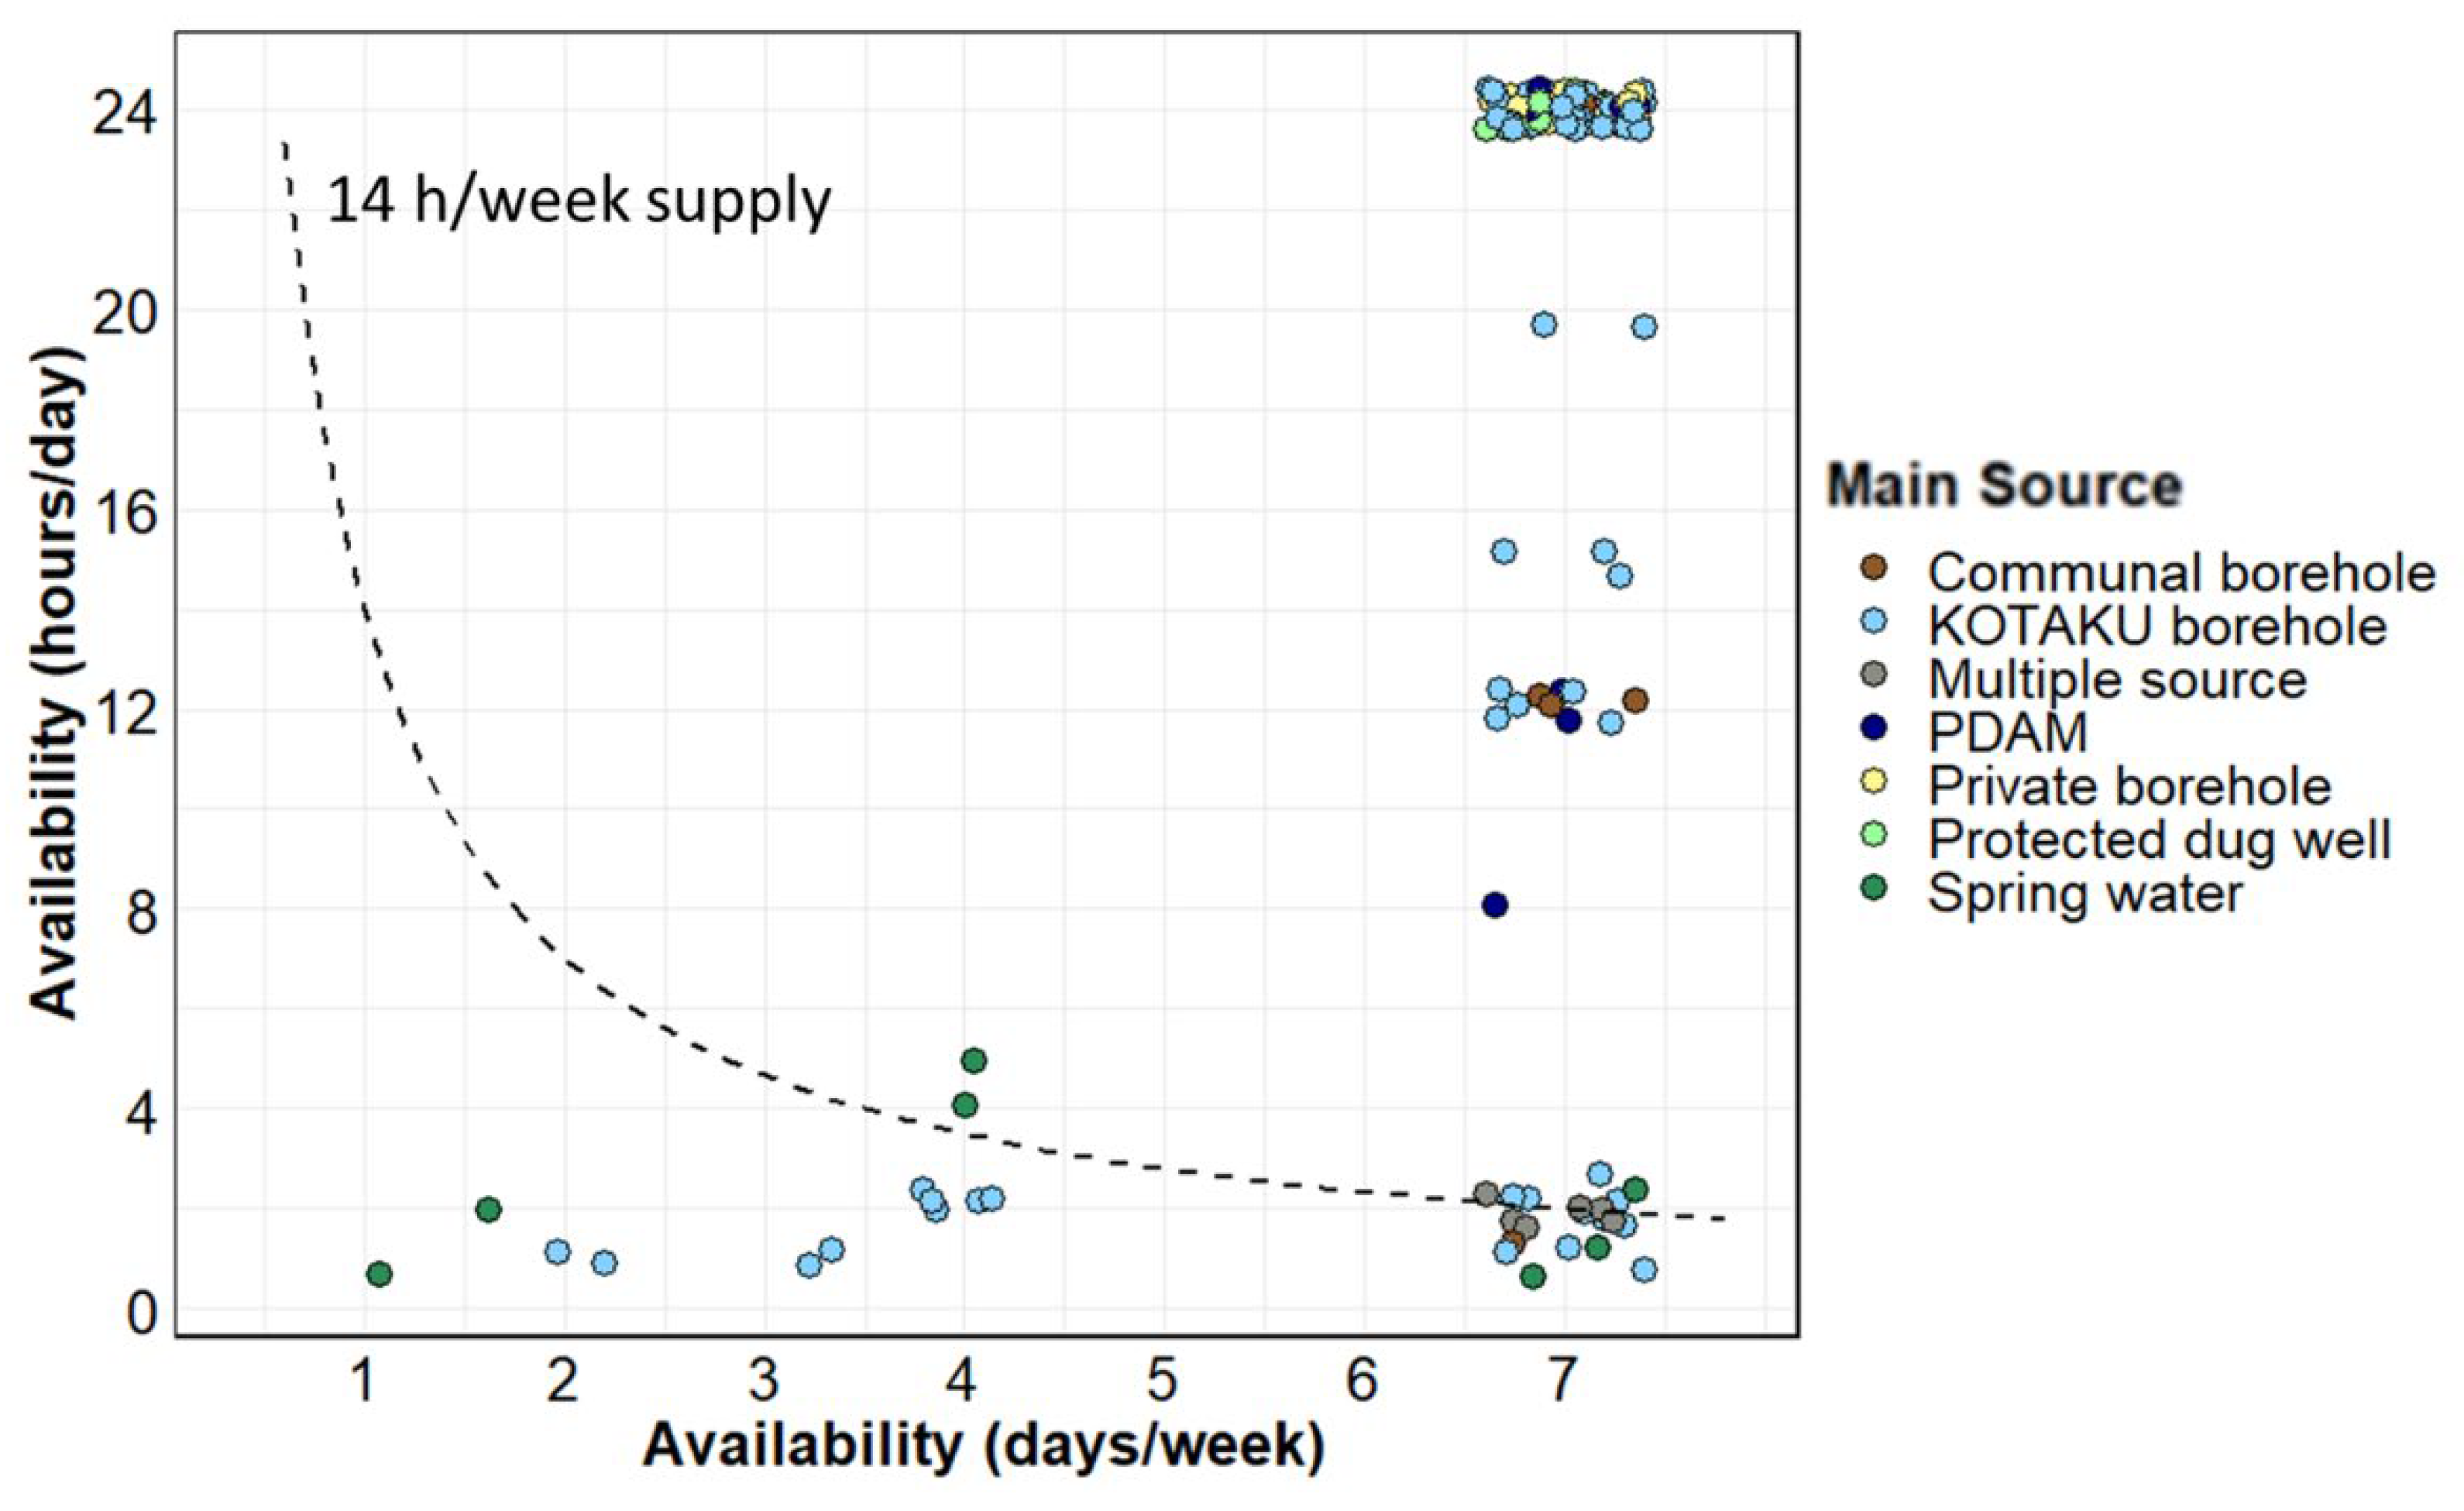
Figure 5 shows the main source and its availability in terms of supply frequency per week and supply hours in each household. Most of the households (106 households out of 120) had access to water every day. However, the inequality of water availability was observed even among users of the same water source. The availability of KOTAKU borehole water was highly varied from 24/7 to only 2 h a week. Almost all private boreholes and protected dug well water were available 24/7, but one protected dug well dried up during the summer season (from June to September). PDAM and communal borehole water were available every day, but the supply hour varied; PDAM was supplied for 8–24 h a day, and communal boreholes were available for 1–24 h a day. As for spring water, only one household was supplied 24/7 (managed by a private company), while the others were not supplied every day. There was a total of 30 households (25%), which consist of 18 KOTAKU borehole users (29% of KOTAKU borehole users), five spring water users (75%), one communal borehole user (14%), and six multiple-source users (67%); however, water was only supplied for 14 h or less per week. Operators of the KOTAKU boreholes said that the intermittent water supply occurred due to a lack of water and/or saving electricity costs. Two KOTAKU borehole users, one communal borehole user, and one spring water user consuming less than 60 LPCD were included in the 30 households.
3.3. Water Quality
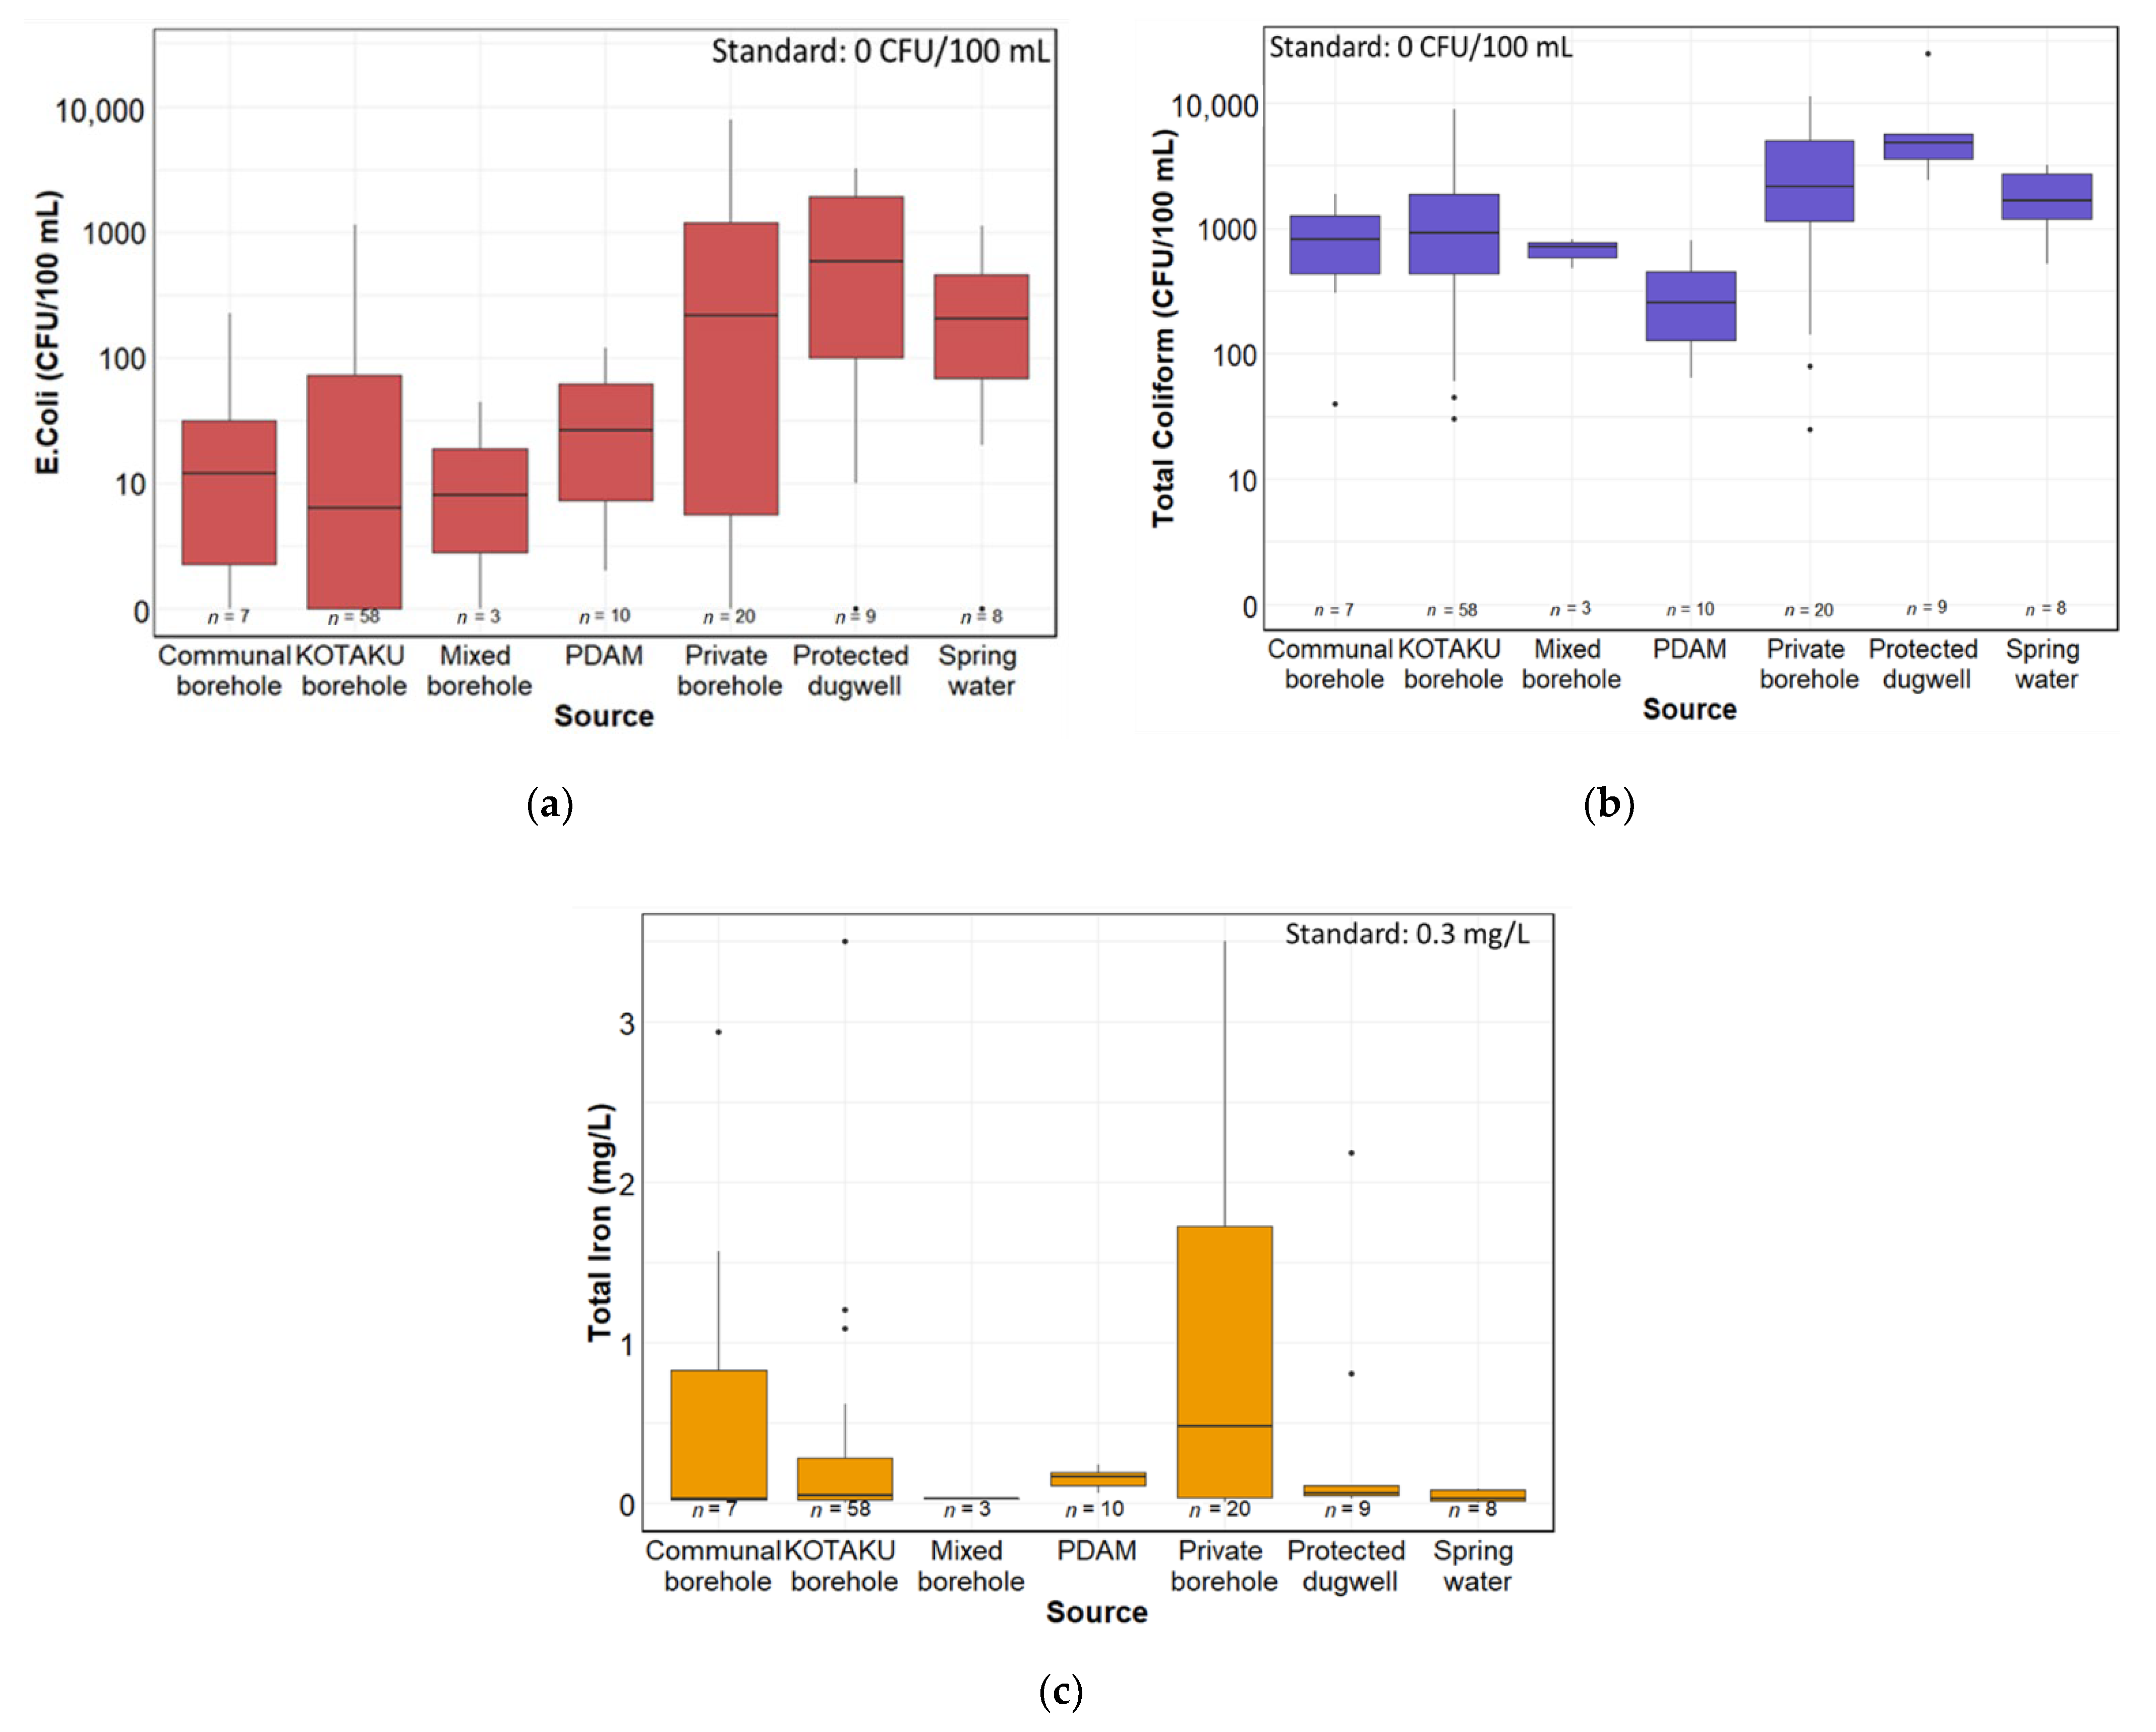
Figure 6a,b show the boxplot of E. coli and total coliform concentrations in the samples obtained from household taps or storage for each water source, respectively. E. coli was detected in 77 out of 115 samples (67%) in the range of 2–7810 CFU/100 mL, while total coliform in all samples was 25–24,700 CFU/100 mL. The highest average concentrations of both E. coli and total coliform were observed in the protected dug well samples, and total coliform concentration in the protected dug wells was significantly higher than other sources. The E. coli concentration in KOTAKU boreholes and communal boreholes was significantly lower than private boreholes, spring water, and protected dug wells (Wilcoxon test, p < 0.05). The total coliform concentration in the KOTAKU boreholes was significantly lower than private boreholes and protected dug wells, but higher than the PDAM’s.
Although the lowest detection rate of E. coli was observed in the KOTAKU borehole samples (30 out of 58, 48%), the concentration of E. coli varied among the samples (0–1140 CFU/mL). E. coli was also found in 6 out of 17 samples (35%) collected directly from the KOTAKU boreholes with a range of 10–68 CFU/100 mL, while total coliform was detected in all the 17 samples with a range of 5–2012 CFU/100 mL. Out of the KOTAKU borehole samples collected from the taps and household storage, 37% (11/30) and 53% (9/17), respectively, had higher concentration of E. coli than its source. Moreover, 20% (6/30) of the samples from the taps and 29% (5/17) from the household storage had a one log or more higher concentration than their source. Similarly, a higher concentration of total coliform than that in the sources was found in 63% (19/30) and 82% (14/17) of the samples from the taps and storage, respectively; among them, 26% (8/30) from the taps and 24% (4/17) from storage had a concentration of one or two logs higher of total coliform than its source. This implied fecal contamination of the KOTAKU borehole water (source itself) in the taps and storage.
Both E. coli and total coliform were detected in all the PDAM samples despite the fact that the PDAM was the only water source with disinfection. Since E. coli and total coliform were also detected in the samples collected at taps, the low concentration of free chlorine (0.01–0.09 mg/L) and total chlorine (0.03–0.2 mg/L) is considered to be the reason for microbial contamination of the PDAM samples. Both E. coli and total coliform in the PDAM samples collected from the household storage (average concentration: 13 and 192 CFU/100 mL, respectively) were significantly higher than those from the taps (80 and 500 CFU/100 mL, respectively) (Wilcoxon test, p < 0.05), indicating microbial contamination in the household storage.
A boxplot of total iron concentration in the water sources is shown in Figure 6c. Out of 115 samples, 29 samples (25%) from KOTAKU boreholes (13 samples), private boreholes (12 samples), communal boreholes (two samples), and protected dug wells (two samples) did not meet Indonesia’s drinking water quality guidelines for iron (0.3 mg/L). All the samples from PDAM and spring water were compliant with the guidelines. The highest average concentration of total iron was 1.1 mg/L in the private borehole samples. The concentration of iron in the KOTAKU borehole samples was significantly lower than the private borehole samples (Wilcoxon test, p < 0.05). All the water samples complied with Indonesia’s drinking water quality guidelines for nitrate (50 mg/L) and pH (6.5–8.5). Only two samples from the private borehole exceeded the guidelines of TDS (500 mg/L) at concentrations of 522 and 527 mg/L.
3.4. Consumer Satisfaction with Water Quantity and Quality
Table 3 shows consumer satisfaction with the quantity and quality of their main sources. Out of 120 households, there are 10 households (8%) not satisfied with water quantity, which consist of 5 KOTAKU borehole users (8% of KOTAKU borehole users), 2 spring water users (25%), 2 multiple water users (KOTAKU borehole and private borehole user or protected dug well user) (22%), and 1 protected dug well user (13%). The reason for the dissatisfaction was low water availability. Despite using other sources, the multiple water source users are not satisfied with quantity from the KOTAKU borehole due to the intermittent supply. On the other hand, households were satisfied when they did not have a problem with the continuity, although they consumed less than 60 LPCD. In this case, the small consumption was due to the fact that one PDAM user needed to save money, and two communal borehole users and one protected dug well user were rarely at home.
Out of 120, 15 (13%) households were not satisfied with water quality. The reason for the dissatisfaction was because of the undesirable appearance of the water, such as turbid and yellowish water. The dissatisfied households used private boreholes (39% of private borehole users), communal boreholes (14%), KOTAKU boreholes (8%), and multiple sources (KOTAKU borehole and private borehole or protected dug well) (22%), in which water samples with significantly high iron concentration were detected (Figure 6c). On the other hand, one communal borehole user was not satisfied with their water quality even though the water had a clean appearance and a low iron concentration (0.3 mg/L). This is because they observed better quality in the other available water (KOTAKU borehole) than their water. All the samples of the unsatisfied private borehole users were found to not meet the iron concentration guidelines. On the contrary, even though the total iron concentration was higher than the guideline value, there were households satisfied with the water quality, including households using KOTAKU boreholes. These KOTAKU borehole users stated that their current water was cleaner than their previous water source (private borehole), while the other users of communal boreholes, protected dug wells, and private boreholes stated having no problem using the water.
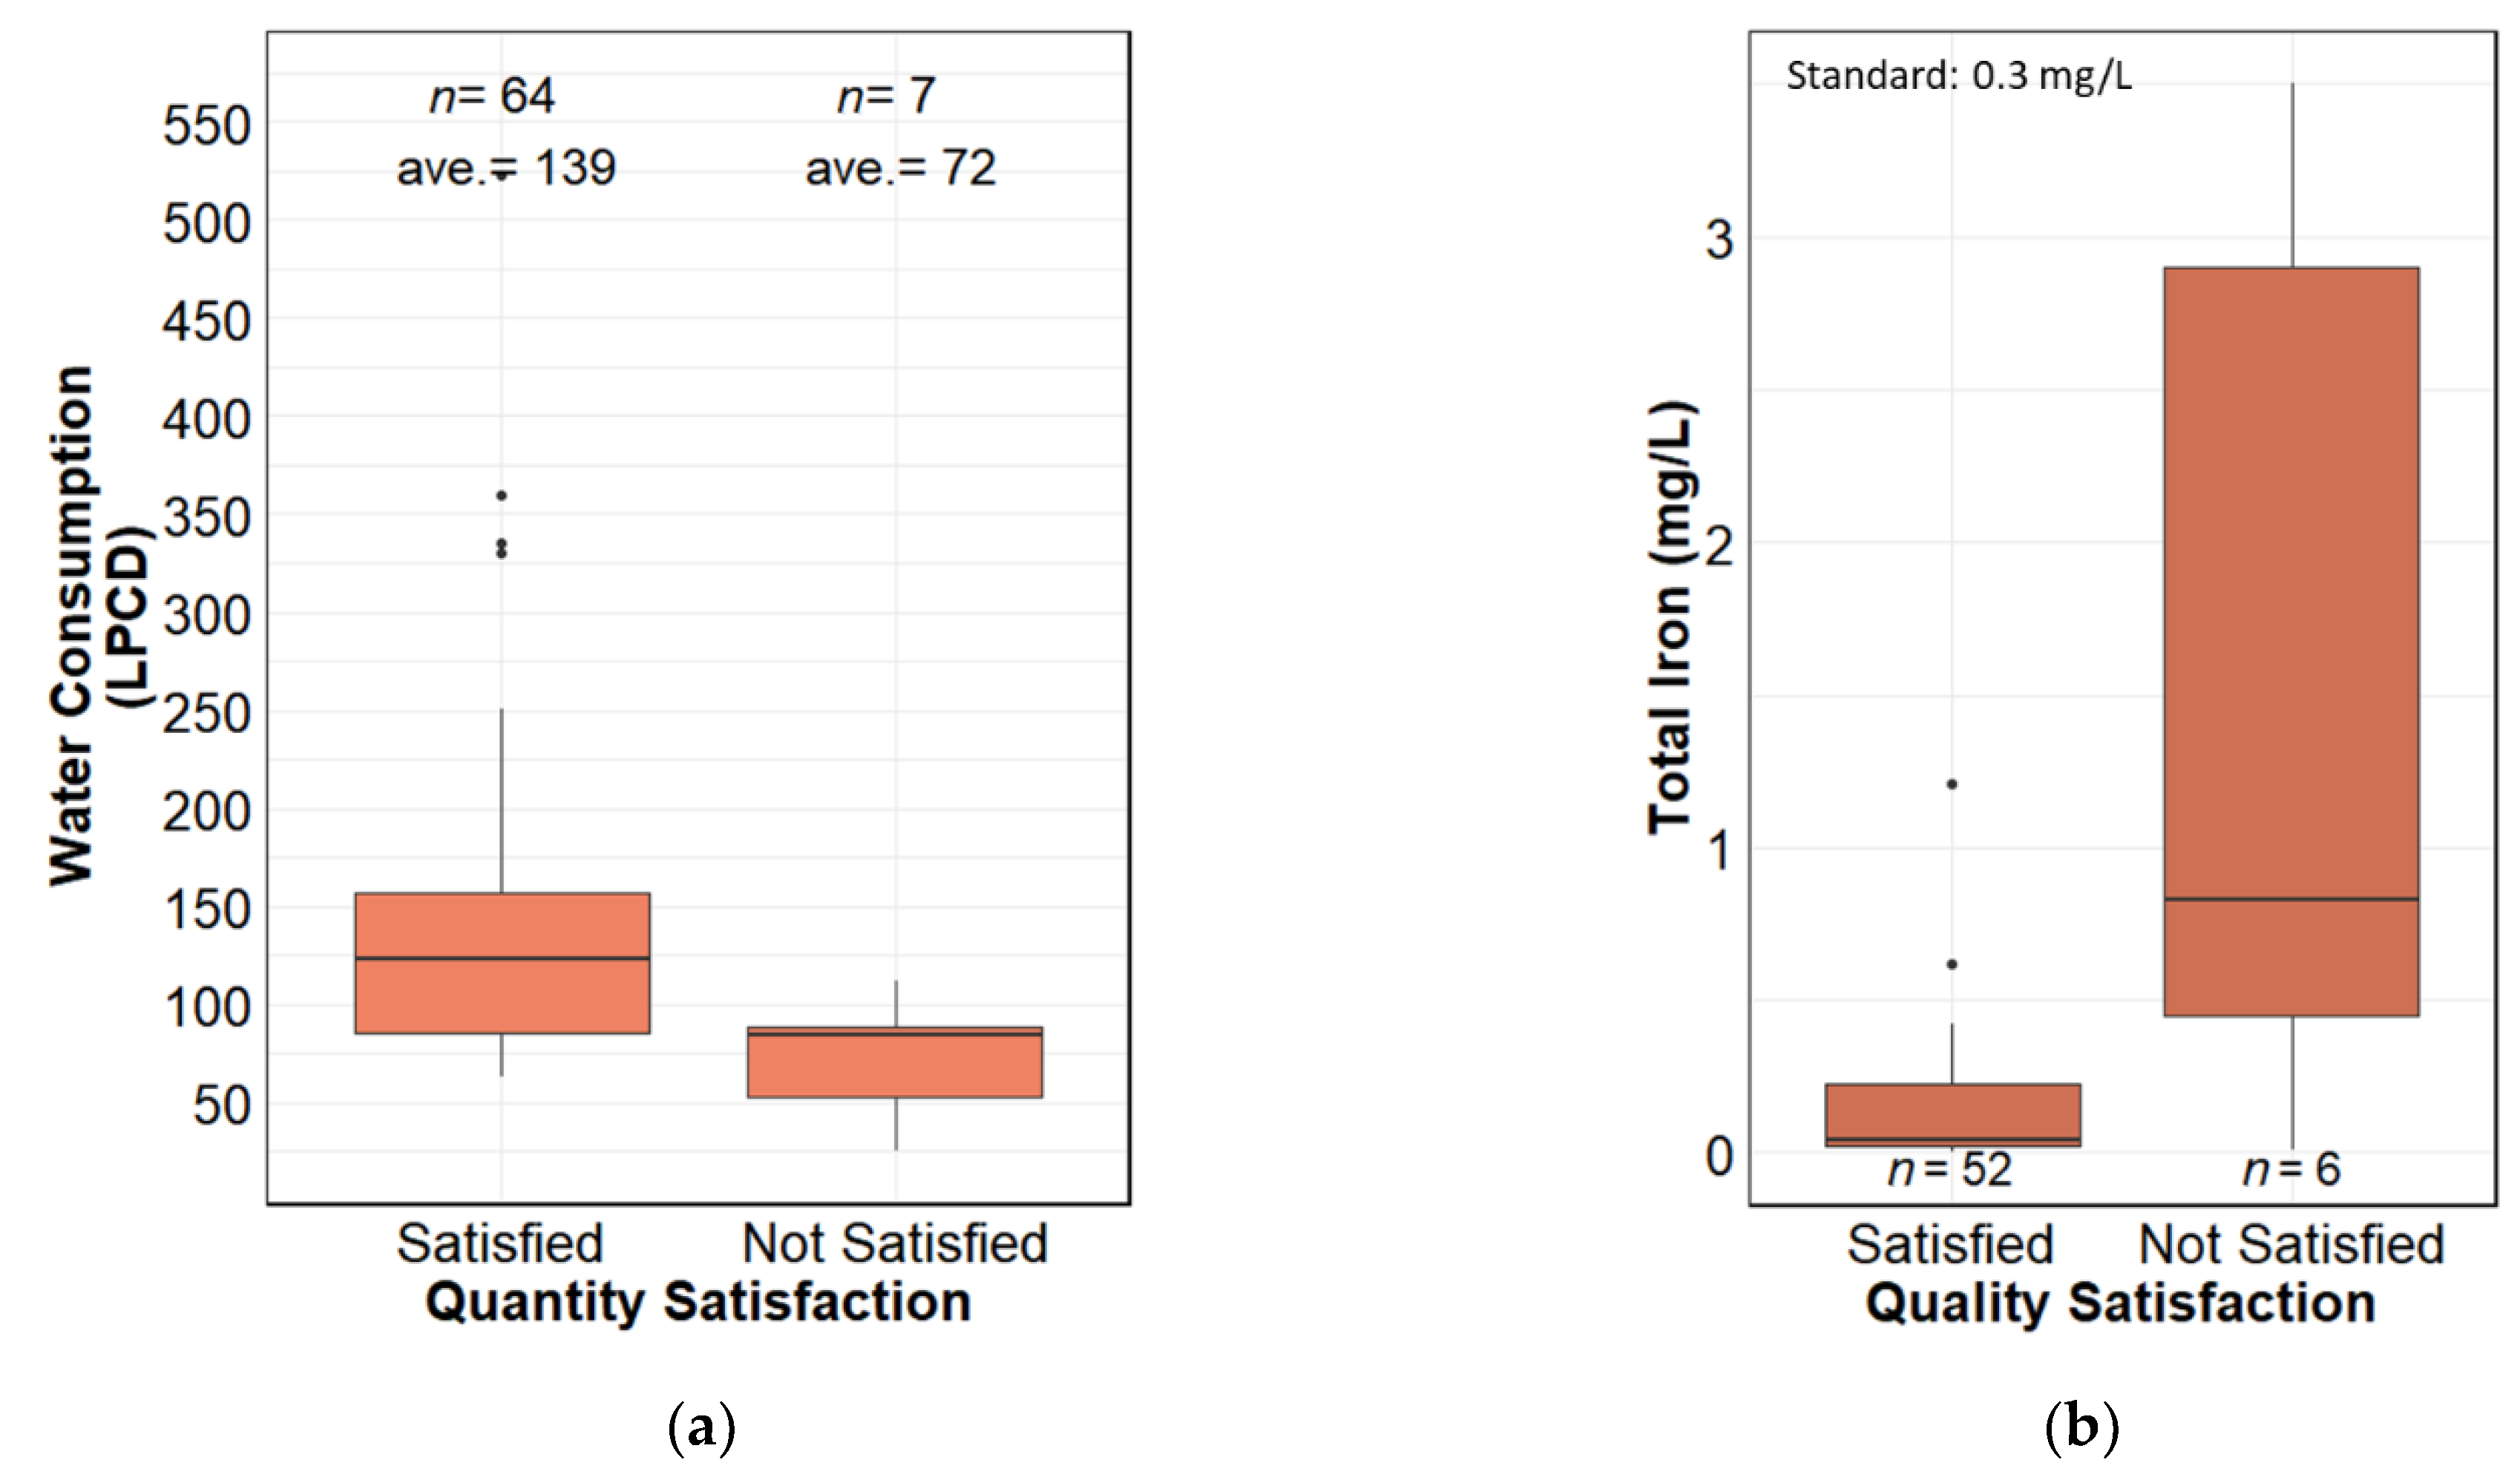
A total of 12 out of 71 KOTAKU borehole users were dissatisfied with the water supply from a KOTAKU borehole because of an inadequate quantity or quality (five households for each) or both of the reasons (two households). The two households that were dissatisfied with both quantity and quality were the users of multiple sources (KOTAKU borehole and private borehole or protected dug well) as their main sources. The seven KOTAKU borehole users with quantity dissatisfaction were supplied water for only 14 h or less in a week (Figure 7a), and their water consumption (average: 72 LPCD) was significantly lower than that of the other KOTAKU users (average: 139 LPCD) (Wilcoxon test, p < 0.05). As for the quality, the dissatisfied households disliked the physical appearance of the water as mentioned above. This can be explained by the fact that the total iron concentration of the six KOTAKU borehole users with dissatisfaction was significantly higher than the other 52 KOTAKU users, as shown in Figure 7b.
3.5. Water Expenditure
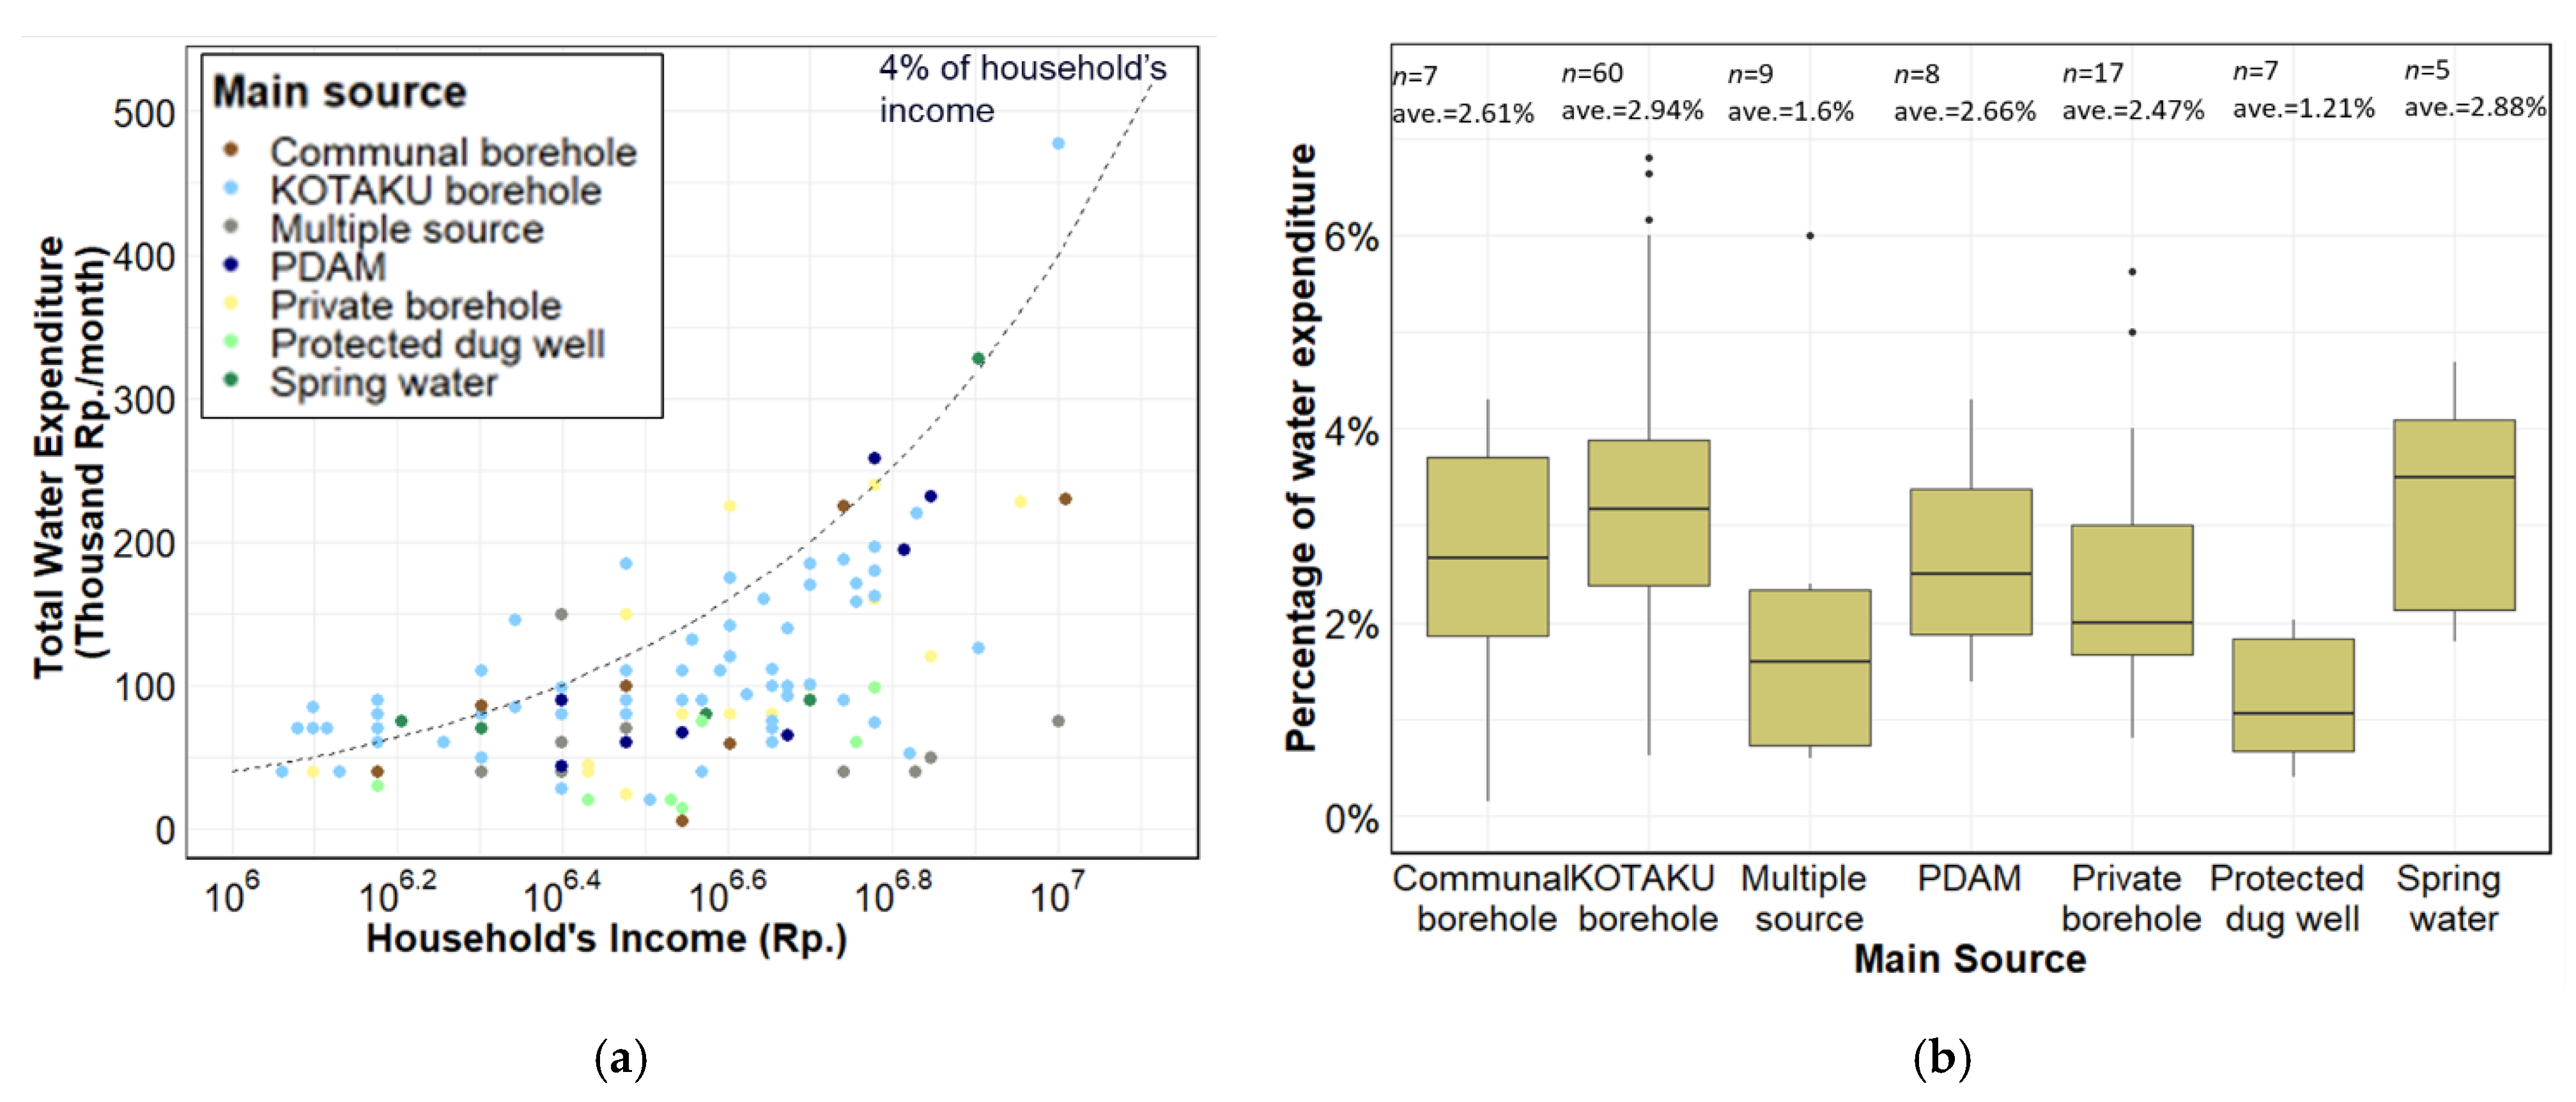
The data of household income and water expenditure were obtained from 113 out of 120 households. The income in half of the households was lower than the minimum wage (IDR 3,742,276) of Bandung City [43]. Figure 8a shows the monthly average household income and total water expenditure, including expenditure for bottled water and vended water. It is reported that less than four percent of the income was affordable water expenditure [44]. There were 20 households (17%) that spent more than 4% of their income on water: 12 KOTAKU borehole users (20% of the total KOTAKU borehole users), 2 private borehole users (12%), 2 communal borehole users (29%), 2 spring water users (20%), 1 PDAM user (13%), and 1 multiple-source user (11%). Among the 20 households, 6 KOTAKU borehole users and 1 spring water user pay a flat tariff (low tariff).
No significant differences were observed in the water expenditure among users of different water sources with charge, namely, KOTAKU borehole, PDAM, communal borehole, and spring water users (Figure 8b). The highest percentage (6.8%) was found in KOTAKU borehole users who were applied the flat tariff (low tariff). This was because bottled water and water from a vendor are the only sources for drinking and cooking water, respectively. It was found that 61 households (54%) spent more money on bottled water than other water, which comprise 29 KOTAKU borehole users (48% of the KOTAKU borehole users), 17 private borehole users (100%), 3 PDAM users (38%), 6 protected dug well users (86%), 3 spring water users (60%), 2 multiple-source users (22%), and 1 communal borehole user (14%). On the other hand, there were six households that did not spend money on bottled water and vended water from vendors because they shifted their drinking and cooking water to KOTAKU boreholes, as shown in Section 3.1. The average household income of the six households was below the minimum wage (IDR 2,525,000). This implied that the KOTAKU boreholes have a monetary contribution for low-income households.
4. Discussion
The KOTAKU boreholes provided water on the premises with an affordable price for most of its users and better quality water than a private borehole, which was the previous water source of almost half of all KOTAKU borehole users. The households in the area preferred bottled water and vended water for drinking and cooking water. This preference was also shown in a previous study because households considered bottled water and vended water as the only safe water [45,46]. However, approximately 18% of households in the study area shifted their drinking and/or cooking water from bottled water and vended water to KOTAKU boreholes because they considered water from the KOTAKU boreholes to be safe and cheap. This indicates that the KOTAKU boreholes provided reliable water for them and resulted in the reduction in their water expenditure. The rate of the shift was still low; however, the KOTAKU boreholes could replace bottled water and vended water as the main source of water for drinking and cooking. On the other hand, out of the households targeted in this study, 17%, including 20% of KOTAKU borehole users, still spend more than 4% of their household income on water due to the charge for bottled water and vended water. The percentages were much lower than those in the households categorized as poor in other cities, for example, Quezon City of Metro Manila, the Philippines (44.8%) [47], and the KOTAKU program needs improvement in water supply to change the behavior of consuming bottled water and vended water to reduce water expenditure costs. In this regard, our study found that the improvement of water supply continuity and water quality was absolutely required.
The average water consumption in the study area was 134 LPCD, which was higher than expected although there is a study showing similar consumption (129 LPCD) in a slum of Sao Paulo and Rio de Janeiro [48]. The KOTAKU program succeeded in providing much more water than the minimum target of 60 LPCD to almost all the households. Although 3% of KOTAKU borehole users consumed less than the target due to intermittent supply, the rate (3%) was less than that in users of the communal boreholes (29%) and spring water (12%) that were provided in the previous slum upgrading program. These results indicate the contribution of the program to water supply improvement in the study area. However, the program needs to consider continuous water supply in the area. Water availability from the KOTAKU boreholes was highly varied, and 29% of the KOTAKU borehole users had access to water for only 14 h or less in a week. Although the percentage is lower than that in the spring water users (75%), such a highly intermittent water supply was the reason for household dissatisfaction with the water quantity rather than the amount of consumption. One of the main reasons for the highly intermittent supply was insufficient water at the source. Since the study area is highly dense, the construction sites of boreholes were limited in areas that had a low abundance of groundwater. Another reason was due to the operation and maintenance costs, such as electricity costs. Since the operation and maintenance of the KOTAKU boreholes were managed with low tariffs by the communities, the communities had difficulty stably supplying water. The slum upgrading programs in Peru and the Philippines succeeded in improving water accessibility of the slum dwellers by expanding the municipal water supply to the dwellers with enough subsidized loans and low interest to set up the connection [31,32]. Although the KOTAKU program is a community-scale approach, such financial support must be a solution to an unstable water supply. In addition, as the households in the study area have access to piped water at a low price and without a water meter in some cases (flat tariff), many households store water as much as possible in case of water shortages and intermittent supply, as shown in previous studies [49,50], leading to further intermittent supply for some KOTAKU borehole users. For equitable water distribution by a nonintermittent and sustainable water supply, water supply provision based on water availability at the source and the number of households connected to a KOTAKU borehole should be considered in addition to the minimum target of water consumption and the total number of KOTAKU boreholes provided in a whole slum area. In addition, installing a water meter can be one of the strategies for efficient water use in the households [51]. Continuous water supply must improve household reliance on water, resulting in reduced water consumption (storing) and household water expenditure.
The results of water quality monitoring indicate that the improved water in this study does not guarantee safe water. E. coli and/or total coliform were detected in all the water samples. However, the KOTAKU boreholes provided better quality water in terms of all the three parameters (E. coli, total coliform, and iron) than private boreholes. This is also supported by the statement from the current KOTAKU borehole users that their current water was better (clearer) than that from the previous source, namely, private borehole water. The E. coli and total coliform concentrations in the protected dug wells, as well as in private boreholes, were significantly higher than those in KOTAKU. This is probably because the protected dug wells and private boreholes are shallow wells and are affected by unsafely managed sanitation facilities, such as latrines and septic tanks [52]. The high density of the population in slum areas makes it difficult to provide tube wells with a safe distance from septic tanks. The reason that E. coli contamination is also found in the deeper boreholes (communal borehole and KOTAKU borehole) is probably because of improper construction of the well, pipeline leakage, and defects at the end point [53,54]. Moreover, our results reveal that the microbial concentration at household storage was much higher than that in its sources (KOTAKU boreholes). The contamination probably occurred due to not cleaning the storage containers and using open containers as a storage at the households [55]. Therefore, the intermittent water supply in the study area accelerated microbial contamination.
The problem of a high iron concentration in groundwater has been reported in Bandung City because of the geological conditions [56]. Our study also found the problem in the KOTAKU boreholes, private boreholes, communal boreholes, and protected dug wells. A high concentration of iron generates odor and yellowish water, which resulted in dissatisfaction with the water quality in our study. Although the iron concentration in the KOTAKU boreholes was significantly lower than that in the private boreholes (previous main water source of the current KOTAKU borehole users), some KOTAKU boreholes had a higher iron concentration than the guidelines. This finding shows the necessity of not only providing KOTAKU boreholes, but also water quality checks before supplying water from KOTAKU boreholes. For the supply of better quality water, especially considering the high iron concentration and microbial contamination, installing simple water treatments, such as oxidation/filtration, rapid sand filtration, and chlorination, is one of the solutions [57] in addition to water quality checks in advance and periodic monitoring.
5. Conclusions
This study evaluated a slum upgrading program, the KOTAKU program, for the improvement of water supply in a slum by investigating actual water consumption, water quality, expenditure for water, and household satisfaction with the water supply. The majority of the KOTAKU borehole users were satisfied with the water supply in terms of both water quantity and quality. This is also indicated by the fact that KOTAKU boreholes replaced the use of the bottled water and vended water for cooking and drinking purposes in some of the households. However, this study revealed the limitations of the water supply in the program.
The borehole water, including the KOTAKU boreholes, had a high iron concentration, exceeding the drinking water guidelines. Microbial contamination was found in all water sources, even in the chlorinated public water supply (PDAM). Although the concentrations of iron, E. coli, and total coliform in the samples of the KOTAKU borehole were significantly lower than those of the previous most common water source, providing safe water is still a big challenge.
The average water consumption in KOTAKU borehole users (130 LPCD) was comparable to that in the other source users (134 LPCD) and much higher than the target (60 LPCD) in the program. However, there were still a few KOTAKU borehole users that gained less water than the target or who spend a lot of money to obtain enough water due to the highly intermittent water supply caused by insufficient water at the source and the operation and maintenance costs. It was found that such a highly intermittent water supply was the reason for household dissatisfaction with the water quantity rather than the amount of consumption and also caused water quality deterioration due to unsafe storage.
The slum upgrading program contributed to increasing access to a better water supply in the study area. However, the evaluation of the upgrading based on the number of households served with the infrastructure can easily miss the important aspects for households, namely, continuous water supply and water quality. Given that other slum upgrading programs also focus on only providing water supply infrastructure, those same issues could be observed. To improve the intermittent water supply in the study area, the supply should be estimated based on the availability of the water source and the number of households connecting to one KOTAKU borehole. In addition, the financial capacity of a community, especially a small community with a very low tariff, to manage the supply must be considered for a sustainable water supply. Installing a water meter can be one solution to improve their financial status. The improvement of the intermittent supply can make it easy to promote effective water use, resulting in a further improvement of the intermittent supply. To ensure safe water, water treatment installations and periodic monitoring of the water quality should be carried out. The improvement of water continuity and quality will lead more households to shift their drinking and cooking water from bottled water and vended water to other sources, such as KOTAKU boreholes, resulting in the households saving water expenditure costs. To achieve not only slum upgrading, but also the SDG 6, these issues should be addressed in future projects.
Author Contributions
Conceptualization, D.U., S.K. and S.T.; methodology, D.U. and S.K.; data analysis, D.U. and S.K.; investigation, D.U.; data curation, D.U. and S.K.; writing—original draft preparation, D.U.; writing—review and editing, S.T. and S.K.; visualization, D.U.; supervision, S.T. and S.K.; project administration, S.K. and S.T.; funding acquisition, S.T. All authors have read and agreed to the published version of the manuscript.
Funding
This research was funded by the Japan International Cooperation Agency (JICA) through a collaborative program with the University of Tokyo and a scholarship provided to Dina Urfanisa for her graduate studies. This study was also funded by Grant-in-Aid for Scientific Research (No. 22H01621) provided by the Japan Society for the Promotion of Sciences (JSPS).
Institutional Review Board Statement
The study protocol was reviewed by the Research Ethics Committee of the University of Tokyo (KE21-28) prior to the implementation.
Informed Consent Statement
The objective and contents of the interview survey were explained to the respondents prior to the interview survey. All subjects gave their informed consent for inclusion before they participated in the study. The study was conducted in accordance with the Declaration of Helsinki, and the protocol was approved by the Research Ethics Committee of the University of Tokyo (KE21-28).
Data Availability Statement
The data presented in this study are openly available in FigShare at https://doi.org/10.6084/m9.figshare.20445915.v7 (accessed on 1 September 2022).
Acknowledgments
The authors would like to express their gratitude to Balai Prasarana Permukiman Wilayah (BPPW) Ministry of Public Works and Housing of West Java Province; KOTAKU Consultant of West Java Province; the chief of KOTAKU Facilitator of Bandung City; the facilitators of KOTAKU city and Community Board of Trustees in the subdistrict level of Rancasari, Mandalajati, Sumur Bandung, and Bojongloa Kaler.
Conflicts of Interest
The authors declare no conflict of interest.
Appendix A
Figure A1.
Samples of water sources available in study area: (a) communal borehole, (b) protected dug well, and (c) KOTAKU borehole.
Figure A1.
Samples of water sources available in study area: (a) communal borehole, (b) protected dug well, and (c) KOTAKU borehole.


Table A1.
Water tariff of different water sources in the study area.
| Water Source | Tariff (IDR) | |
|---|---|---|
| Meter | Flat | |
| PDAM | based on category, for this study: IDR 2000/m3 (0–10 m3), IDR 3600/m3 (11–20 m3), IDR 5700/m3 (21–30 m3), IDR 8800 (>30 m3) | |
| KOTAKU borehole | IDR 4000–IDR 5000/m3 | IDR 20,000–100,000/month |
| Communal borehole | IDR 4000–IDR 5000/m3 | IDR 50,000/month |
| Spring water | IDR 7000/m3 | IDR 30,000–50,000/month |
| Private borehole | Free of charge | |
| Protected dug well | Free of charge | |
IDR 1000 = USD 0.0675 (as of 27 June 2022). The flat tariff of each KOTAKU borehole was decided by each community.
References
- Ooi, G.L.; Phua, K.H. Urbanization and Slum Formation. J. Urban Health 2007, 84, 27–34. [Google Scholar] [CrossRef] [PubMed]
- Mahabir, R.; Crooks, A.; Croitoru, A.; Agouris, P. The study of slums as social and physical constructs: Challenges and emerging research opportunities. Reg. Stud. Reg. Sci. 2016, 3, 399–419. [Google Scholar] [CrossRef]
- Ezeh, A.; Oyebode, O.; Satterthwaite, D.; Chen, Y.F.; Ndugwa, R.; Sartori, J.; Mberu, B.; Melendez-Torres, G.J.; Haregu, T.; Watson, S.I. The history, geography, and sociology of slums and the health problems of people who live in slums. Lancet 2017, 389, 547–558. [Google Scholar] [CrossRef]
- WHO Regional Office for South-East Asia. Addressing Health of the Urban Poor in South-East Asia Region: Challenges and Opportunities; WHO Regional Office for South-East Asia: New Delhi, India, 2011; Available online: https://apps.who.int/iris/bitstream/handle/10665/204753/B4755.pdf?sequence=1&isAllowed=y (accessed on 23 April 2022).
- UN-Habitat. SDG Indicator 11.1.1 Training Module: Adequate Housing and Slum Upgrading; United Nations Human Settlement Programme (UN-Habitat): Nairobi, Kenya, 2018; Available online: https://unhabitat.org/sites/default/files/2020/06/indicator_11.1.1_training_module_adequate_housing_and_slum_upgrading.pdf. (accessed on 23 April 2022).
- Lucci, P.; Bhatkal, T.; Khan, A.; Berliner, T. What Works in Improving the Living Conditions of Slum Dwellers. In A Review of the Evidence Across Four Programs; Overseas Development Institute: London, UK, 2015. [Google Scholar]
- Rahmasary, A.N.; Robert, S.; Chang, I.S.; Jing, W.; Park, J.; Bluemling, B.; Koop, S.; van Leeuwen, K. Overcoming the challenges of water, waste and climate change in Asian cities. Environ. Manag. 2019, 63, 520–535. [Google Scholar] [CrossRef] [PubMed]
- UN-Habitat. World Cities Report 2020: The Value of Sustainable Urbanization. In United Nations Human Settlement Programme; UN-Habitat: Nairobi, Kenya, 2020. [Google Scholar]
- Government of Republic of Indonesia. Environmental and Social Management Framework, National Slum Upgrading Program; Ministry of Public Works and Housing (MPWH): Jakarta, Indonesia, 2016.
- Sarkar, A. Informal water vendors and the urban poor: Evidence from a Nairobi slum. Water Int. 2020, 45, 443–457. [Google Scholar] [CrossRef]
- Majuru, B.; Marc, S.; Paul, R.H. How Do Households Respond to Unreliable Water Supplies? A Systematic Review. Int. J. Environ. Res. Public Health 2016, 13, 1222. [Google Scholar] [CrossRef]
- Biswas, D. Navigating the city’s waterscape: Gendering everyday dynamics of water access from multiple sources. Dev. Pract. 2021, 31, 248–258. [Google Scholar] [CrossRef]
- Adane, M.; Mengistie, B.; Medhin, G.; Kloos, H.; Mulat, W. Piped water supply interruptions and acute diarrhea among under-five children in Addis Ababa slums, Ethiopia: A matched case-control study. PLoS ONE 2017, 12, e0181516. [Google Scholar] [CrossRef]
- Haque, M. Urban Water Governance: Pricing of Water for the Slum Dwellers of Dhaka Metropolis. In Urban Drought; Ray, B., Shaw, R., Eds.; Springer: Singapore, 2019; pp. 385–397. [Google Scholar] [CrossRef]
- Tutu, R.A.; Stoler, J. Urban but off the grid: The struggle for water in two urban slums in greater Accra, Ghana. Afr. Geogr. Rev. 2016, 35, 212–226. [Google Scholar] [CrossRef]
- Subbaraman, R.; Nolan, L.; Sawant, K.; Shitole, S.; Shitole, T.; Nanarkar, M.; Patil-Deskhmuh, A.; Bloom, D.E. Multidi-mensional Measurement of Household Water Poverty in a Mumbai Slum: Looking Beyond Water Quality. PLoS ONE 2015, 10, e0133241. [Google Scholar] [CrossRef]
- Ssemugabo, C.; Wafula, S.T.; Ndejjo, R.; Oporia, F.; Osuret, J.; Musoke, D.; Halage, A.A. Knowledge and practices of households on safe water chain maintenance in a slum community in Kampala City, Uganda. Environ. Health Prev. Med. 2019, 24, 1–9. [Google Scholar] [CrossRef] [PubMed]
- Dagdeviren, H.; Robertson, S.A. Access to water in the slum of the developing world. In Working Paper, No. 57; International Policy Centre for Inclusive Growth (IPC-IG): Brasilia, Brazil, 2009. [Google Scholar]
- Haque, S.S.; Yanez-Pagans, M.; Arias-Granada, Y.; Joseph, G. Water and sanitation in Dhaka slums: Access, quality, and informality in service provision. Water Int. 2020, 45, 791–811. [Google Scholar] [CrossRef]
- Price, H.D.; Adams, E.A.; Nkwanda, P.E.; Mkwandarie, T.W.; Quiliam, R.S. Daily changes in household water access and quality in urban slum undermine global safe water monitoring programmes. Int. J. Hyg. Environ. 2020, 231, 113632. [Google Scholar] [CrossRef]
- Kimani-Murage, E.W.; Ngindu, A.M. Quality of Water the Slum Dwellers Use: The Case of a Kenyan Slum. J. Urban Health 2007, 84, 829–838. [Google Scholar] [CrossRef]
- Handam, N.B.; dos Santos, J.A.B.; Neto, A.H.M.M.; Alencar, M.F.L.; Ignacio, C.F.; Soetro-Martins, A. Drinking water quality in Brazilian urban slums. Rev. Ambient. Água 2020, 15, 1–11. [Google Scholar] [CrossRef]
- Adeniran, A. Assessment of Water Quality in Slum Area Ibadan. Hydrol. Curr. Res. 2018, 9, 1. [Google Scholar] [CrossRef]
- Nyenje, P.M.; Havik, J.C.; Foppen, J.W.; Muwanga, A.; Kulabako, R. Understanding the fate of sanitation-related nutrients in a shallow sandy aquifer below an urban slum area. J. Contam. Hydrol. 2014, 164, 259–274. [Google Scholar] [CrossRef]
- Ketadzo, J.A.; Nkongolo, N.V.; Akrofi, M.M. Empirical analysis of the impact of urbanization on groundwater quality within the slums of Accra, Ghana. Water Policy 2021, 7, 112–131. [Google Scholar] [CrossRef]
- Subbaraman, R.; Shrutika, S.; Tejal, S.; Kiran, S.; Jennifer, O.; David, E.; Anita, P. The social ecology of water in a Mumbai slum:failures in water quality, quantity, and reliability. BMC Public Health 2013, 13, 1–14. [Google Scholar] [CrossRef] [Green Version]
- Meierhofer, R.; Wietlisbach, B.; Matiko, C. Influence of container cleanliness, container disinfection with chlorine, and container handling on recontamination of water collected from a water kiosk in a Kenyan slum. J. Water Health 2019, 17, 308–317. [Google Scholar] [CrossRef]
- UN-Habitat. A practical guide to designing, planning, and executing citywide slum upgrading programmes. In United Nations Human Settlement Programme; UN-Habitat: Nairobi, Kenya, 2014. [Google Scholar]
- Turley, R.; Saith, R.; Bhan, N.; Rehfuess, E.; Carter, B. Slum Upgrading Strategies and Their Affects on Health and Socio-Economic Outcomes: A Systematic Review, 3ie Systematic Review 13; International Initiative for Impact Evaluation (3ie): London, UK, 2013. [Google Scholar]
- Victoria-Williams, J. Urban Community Upgrading: Lessons from the Past—Prospects for the Future; World Bank Publications: Washington, DC, USA, 2006. [Google Scholar]
- Cockburn, J.L.; Romero, J.Q.; Lucci, P.; Lenhardt, A. On the Path to Progress: Improving Living Conditions in Peru’s Slum Settlements; Development Progress: London, UK, 2015. [Google Scholar]
- Aiga, H.; Umenai, T. Impact of improvement of water supply on household economy in a squatter area of Manila. Soc. Sci. Med. 2001, 55, 627–641. [Google Scholar] [CrossRef]
- TDRI. Evaluation of BAAN Mankong Programme; Thailand Development Research Institute: Bangkok, Thailand, 2014. [Google Scholar]
- Olthuis, K.; Benni, J.; Eichwede, K.; Zevenbergen, C. Slum Upgrading: Assessing the importance of location and a plea for a spatial approach. Habitat Int. 2015, 50, 270–288. [Google Scholar] [CrossRef]
- Government of Republic of Indonesia. Strategic Plan of 2020–2024 Term; Ministry of Public Works and Housing (MPWH): Jakarta, Indonesia, 2020.
- The Statistical Agency (BPS) of Bandung City. Bandung Municipality in Figures; The Statistical Agency (BPS) of Bandung City: Bandung, Indonesia, 2021. [Google Scholar]
- Government of Bandung City. Performance of Institutional Government Report (Laporan Kinerja Instansi Pemerintah Kota Bandung) Year 2020; Government of Bandung City: Bandung, Indonesia, 2021.
- Tarigan, A.K.M.; Sagala, S.; Samsura, D.A.; Fiisabiilillah, D.F.; Simarmata, H.A.; Nababan, M. Bandung City, Indonesia. Cities 2016, 50, 100–110. [Google Scholar] [CrossRef]
- Muntalif, B.S.; Nastiti, A.; Sudrajat, A.; Roosmini, D.; Smits, A.J.M.; Meijerink, S.V. Household Water Supply Strategies in Urban Bandung, Indonesia: Findings and Implications for Future Water Access Reporting. J. Eng. Technol. Sci. 2017, 49, 811–832. [Google Scholar] [CrossRef]
- Winarso, H. Slum-upgrading trough physical or socio-economic improvement? lessons from Bandung, Indonesia. J. Hous. Built Environ. 2022, 37, 863–867. [Google Scholar] [CrossRef]
- Profil Perumahan dan Kawasan Permukiman Kota Bandung. Available online: https://perkim.id/pofil-pkp/profil-kabupaten-kota/profil-perumahan-dan-kawasan-permukiman-kota-bandung/ (accessed on 3 May 2022).
- Kuroda, K.; Nakada, N.; Hanamoto, S.; Inaba, M.; Katayama, H.; Do, A.T.; Nga, T.T.V.; Oguma, K.; Hayashi, T.; Takizawa, S. Pepper Mild Mottle Virus as an Indicator and a Tracer of Fecal Pollution in Water Environments: Comparative Evaluation with Wastewater-Tracer Pharmaceuticals in Hanoi, Vietnam. Sci. Total Environ. 2015, 506–507, 287–298. [Google Scholar] [CrossRef]
- West Java Governor Decree of Minimum Wage in Cities of West Java in 2022. Available online: http://disnakertrans.jabarprov.go.id/produk_hukum/id/375 (accessed on 19 July 2022).
- Fujita, Y.; Fujii, A.; Furukawa, S.; Ogawa, T. Estimation of Willingness-to-pay (WTP) for Water and Sanitation Services through Contingent Valuation Method (CVM)–A Case Study in Iquitos City, The Republic of Peru. JBICI Rev. 2005, 10, 59–87. [Google Scholar]
- Nastiti, A.; Muntalif, B.S.; Roosmini, D.; Sudrajat, A.; Meijerink, S.V.; Smits, A.J.M. Coping with poor water supply in periurban Bandung, Indonesia: Towards a framework for understanding risks and aversion behaviors. IIED 2017, 29, 69–88. [Google Scholar] [CrossRef]
- Abubakar, I.R. Strategies for coping with inadequate domestic water supply in Abuja, Nigeria. Water Int. 2018, 43, 570–590. [Google Scholar] [CrossRef]
- Alfonso, S.M.; Kazama, S.; Takizawa, S. Inequalities in access to and consumption of safely managed water due to so-cio-economic factors: Evidence from Quezon City, Philippines. Curr. Res. Environ. Sustain. 2022, 4, 100117. [Google Scholar] [CrossRef]
- Dias, D.M.; Martinez, C.B.; Libậnio, M. Avaliação do impacto da variação da renda no consumo domiciliar de água. Eng. Sanit. Ambient. 2010, 15, 155–166. [Google Scholar] [CrossRef]
- de la Cruz, A.O.; Alvarez-Chavez, C.R.; Ramos-Corella, M.A.; Soto-Hernandez, F. Determinants of domestic water consumption in Hermosillo, Sonora, Mexico. J. Clean. Prod. 2017, 142, 1901–1910. [Google Scholar] [CrossRef]
- Ibrahim, A.S.; Memon, F.A.; Butler, D. Seasonal Variation of Rainy and Dry Season Per Capita Water Consumption in Freetown City Sierra Leone. Water 2021, 13, 499. [Google Scholar] [CrossRef]
- Khaing, S.K.; Kazama, S.; Takizawa, S. Assessment of Billed-Unmetered Water Consumption to Improve Water Utility Management in Yangon City. J. Jpn. Soc. Civ. Eng. Ser. G Environ. Res. 2020, 76, 277–285. [Google Scholar] [CrossRef]
- Lutterodt, G.; van de Vossenberg, J.; Hoiting, Y.; Kamara, A.K.; Oduro-Kwarteng, S.; Foppen, J.W.A. Microbial Groundwater Quality Status of Hand-Dug Wells and Boreholes in the Dodowa Area of Ghana. Int. J. Environ. Res. Public Health 2018, 15, 730. [Google Scholar] [CrossRef]
- Odonkor, S.T.; Mahami, T. Escherichia coli as a tool for disease risk assessment of drinking water sources. Int. J. Microbiol. 2020, 2020, 2534130. [Google Scholar] [CrossRef]
- Islam, T.; Acharjee, M.; Tabassum, N.; Acharjee, M.R. Bacterial propagation in municipal water and deep tube-well water in Kashipur Locality of Narayanganj City, Bangladesh. JWET 2020, 18, 327–337. [Google Scholar] [CrossRef]
- Manga, M.; Ngobi, T.G.; Okeny, L.; Acheng, P.; Namakula, H.; Kyaterekara, E.; Nansubuga, I.; Kibuwami, N. The effect of household storage tanks/ vessels and user practices on the quality of water: A systematic review of literature. Environ. Syst. Res. 2021, 10, 1–26. [Google Scholar] [CrossRef]
- Notodarmojo, S. Ground and Groundwater Pollution (In Indonesia); ITB Press: Bandung, Indonesia, 2005. [Google Scholar]
- Chaturvedi, S.; Dave, P.N. Removal of iron for safe drinking water. Desalination 2012, 303, 1–11. [Google Scholar] [CrossRef]
Figure 1.
Study areas (urban villages) and subdistricts in Bandung City (Study areas are indicated by 1 to 8).
Figure 1.
Study areas (urban villages) and subdistricts in Bandung City (Study areas are indicated by 1 to 8).

Figure 2.
Water source distribution for drinking, cooking, and other purposes selected by households in slum areas, (n = 120).
Figure 2.
Water source distribution for drinking, cooking, and other purposes selected by households in slum areas, (n = 120).

Figure 3.
Change of water sources before and after water provision by the KOTAKU program, (n = 67).

Figure 4.
Household water consumption grouped by main source used (n = 120).

Figure 5.
Supply frequency and hours of different water sources (The dashed line indicates supply hours of 14 h/week).
Figure 5.
Supply frequency and hours of different water sources (The dashed line indicates supply hours of 14 h/week).

Figure 6.
Water quality: (a) E. coli, (b) total coliform, and (c) total iron.

Figure 7.
The comparisons of (a) water consumption and (b) total iron concentration based on KOTAKU borehole user satisfaction with water quantity and quality.
Figure 7.
The comparisons of (a) water consumption and (b) total iron concentration based on KOTAKU borehole user satisfaction with water quantity and quality.

Figure 8.
(a) Monthly total water expenditure and household income with four percent indicator; (b) percentage of monthly water expenditure in monthly income for each main source user. IDR 1000 = 0.0675 USD (as of 27 June 2022).
Figure 8.
(a) Monthly total water expenditure and household income with four percent indicator; (b) percentage of monthly water expenditure in monthly income for each main source user. IDR 1000 = 0.0675 USD (as of 27 June 2022).

Table 1.
Urban villages selected for household survey in Bandung City.
| No. | Subdistrict | Urban Village | No. of KOTAKU Borehole | Total Population (2019/2020) | Total Area (km2) | Slum Population (2016) | Slum Area (km2) (2016) | No. of Households |
|---|---|---|---|---|---|---|---|---|
| 1 | Rancasari | Derwati | 4 | 18,843 | 1.56 | 1042 | 0.018 | 13 |
| 2 | Manjahlega | 8 | 21,426 | 1.66 | 2879 | 0.122 | 15 | |
| 3 | Mandalajati | Karang Pamulang | 13 | 18,144 | 1.88 | 3581 | 0.129 | 15 |
| 4 | Pasir Impun | 19 | 12,647 | 0.84 | 6697 | 0.310 | 19 | |
| 5 | Sumur Bandung | Kebon Pisang | 1 | 11,651 | 0.61 | 2126 | 0.017 | 12 |
| 6 | Merdeka | 0 | 9335 | 1.43 | 954 | 0.034 | 11 | |
| 7 | Bojongloa Kaler | Sukaasih | 3 | 19,065 | 0.87 | 3154 | 0.040 | 12 |
| 8 | Kopo | 27 | 29,524 | 0.93 | 14,302 | 0.177 | 23 | |
| TOTAL | 120 | |||||||
Table 2.
Number of samples for water quality analysis at each point.
| Source | Sampling Point | Total | ||
|---|---|---|---|---|
| Tap | Storage | Borehole | ||
| PDAM | 6 | 4 | - | 10 |
| KOTAKU borehole | 35 | 23 | 17 | 75 |
| Communal borehole | 5 | 2 | - | 7 |
| Private borehole | 12 | 8 | - | 20 |
| Mixed borehole | - | 3 | - | 3 |
| Spring water | 2 | 6 | - | 8 |
| Protected dug well | - | 9 | - | 9 |
| TOTAL | 60 | 55 | 17 | 132 |
Table 3.
Consumer satisfaction with water quantity and quality.
| Number of Households | ||||
|---|---|---|---|---|
| Main Source | Quantity | Quality | ||
| Satisfied | Not Satisfied | Satisfied | Not Satisfied | |
| PDAM | 8 | 0 | 8 | 0 |
| KOTAKU borehole | 57 | 5 | 57 | 5 |
| Communal borehole | 7 | 0 | 6 | 1 |
| Private borehole | 18 | 0 | 11 | 7 |
| Spring water | 6 | 2 | 8 | 0 |
| Protected dug well | 7 | 1 | 8 | 0 |
| Multiple source | 7 | 2 | 7 | 2 |
| TOTAL | 110 | 10 | 105 | 15 |
Publisher’s Note: MDPI stays neutral with regard to jurisdictional claims in published maps and institutional affiliations. |
© 2022 by the authors. Licensee MDPI, Basel, Switzerland. This article is an open access article distributed under the terms and conditions of the Creative Commons Attribution (CC BY) license (https://creativecommons.org/licenses/by/4.0/).
Share and Cite
MDPI and ACS Style
Urfanisa, D.; Kazama, S.; Takizawa, S. Evaluation of a Slum Upgrading Program for Improvement of Water Supply in Bandung City, Indonesia. Water 2022, 14, 3025. https://doi.org/10.3390/w14193025
AMA Style
Urfanisa D, Kazama S, Takizawa S. Evaluation of a Slum Upgrading Program for Improvement of Water Supply in Bandung City, Indonesia. Water. 2022; 14(19):3025. https://doi.org/10.3390/w14193025
Chicago/Turabian StyleUrfanisa, Dina, Shinobu Kazama, and Satoshi Takizawa. 2022. "Evaluation of a Slum Upgrading Program for Improvement of Water Supply in Bandung City, Indonesia" Water 14, no. 19: 3025. https://doi.org/10.3390/w14193025
Note that from the first issue of 2016, this journal uses article numbers instead of page numbers. See further details here.