
Drought Severity and Frequency Analysis Aided by Spectral and Meteorological Indices in the Kurdistan Region of Iraq

 ,
,  ,
,  , ,
, ,  , , and
Abstract
:1. Introduction
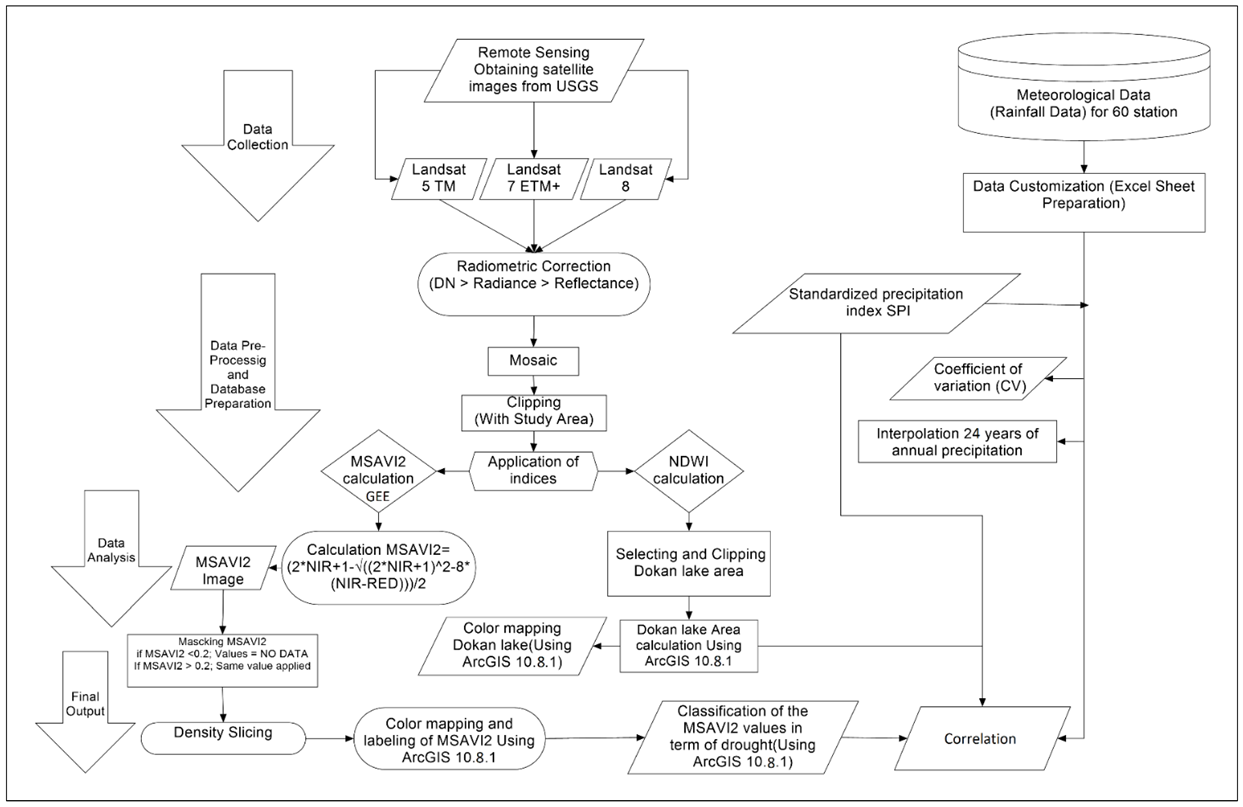
2. Materials and Methods
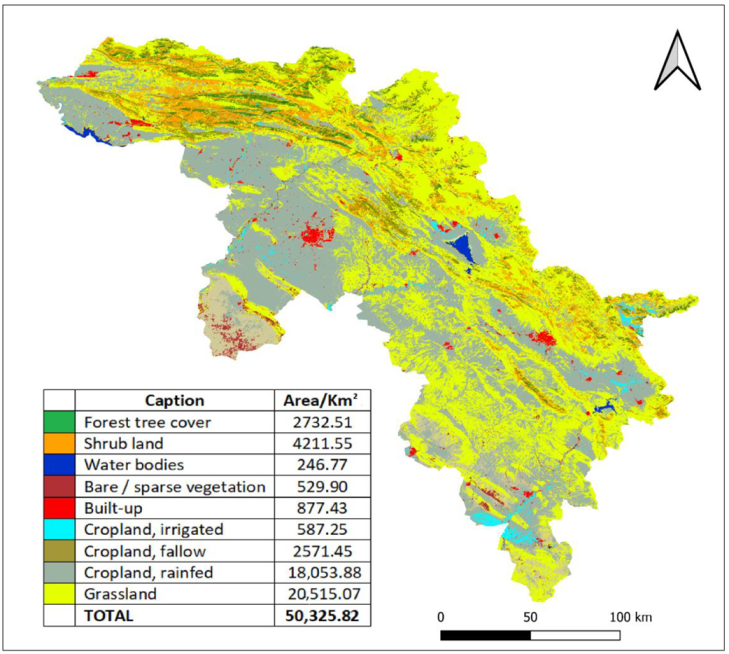
2.1. Study Area
2.2. Datasets
2.2.1. Satellite Images Data
2.2.2. Meteorological Data
2.3. Spectral Drought Indices
2.3.1. The Modified Soil-Adjusted Vegetation Index (MSAVI2)
2.3.2. The Normalized Difference Water Index (NDWI)
2.4. Meteorological Drought Indices
2.4.1. Standardized Precipitation Index (SPI)
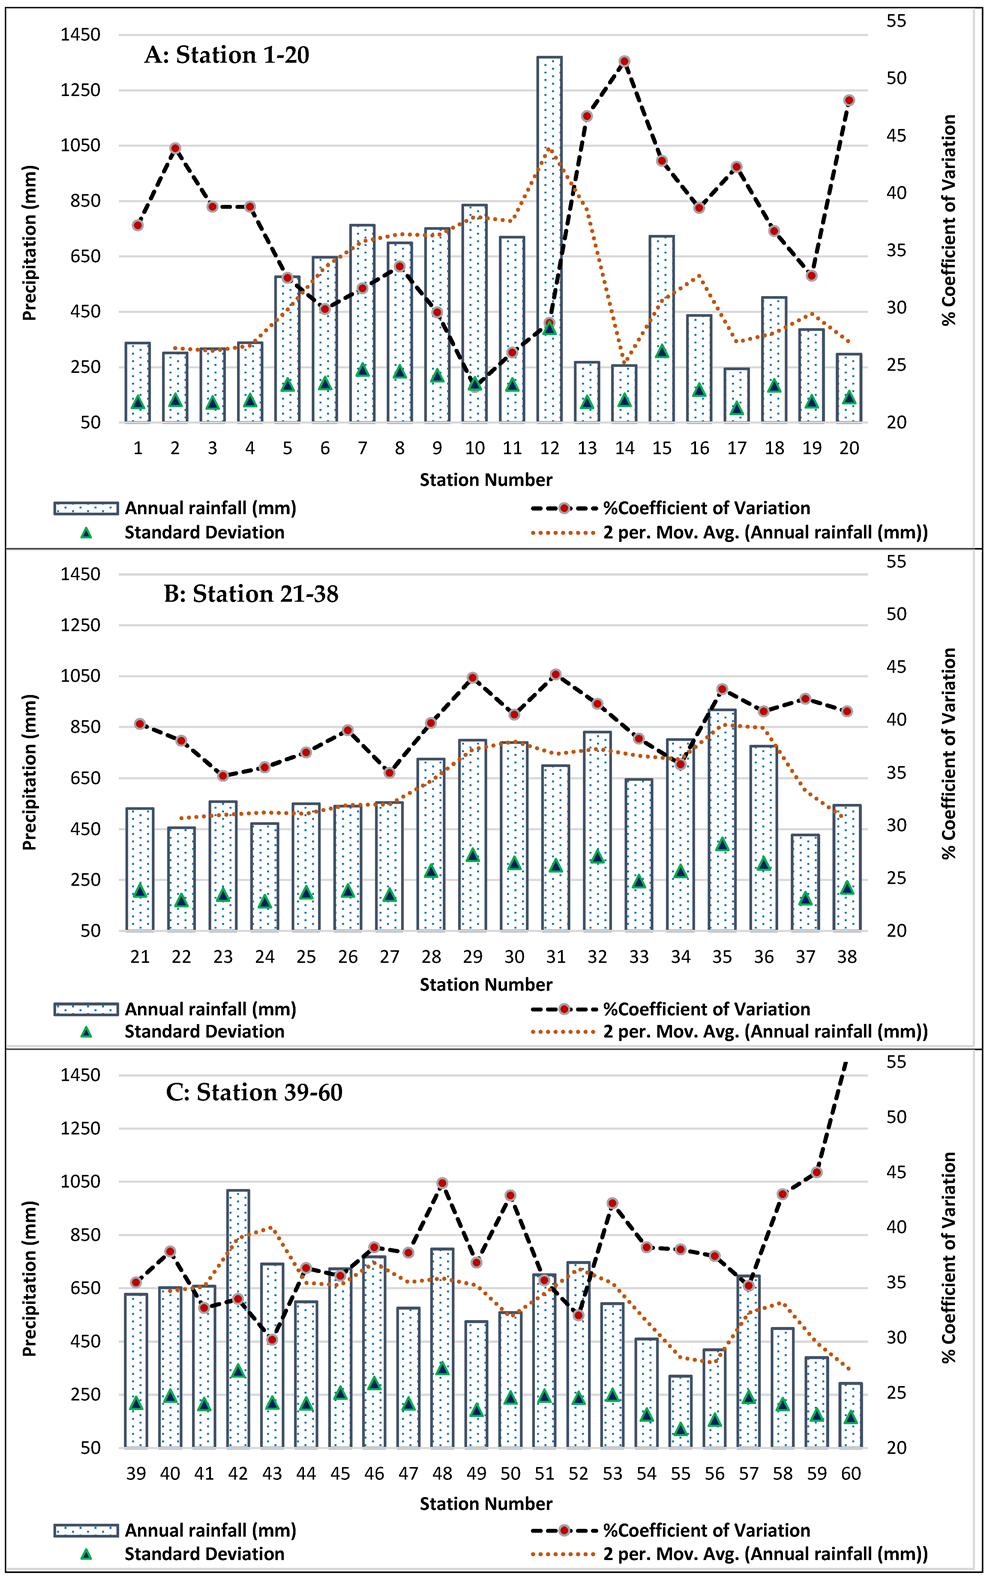
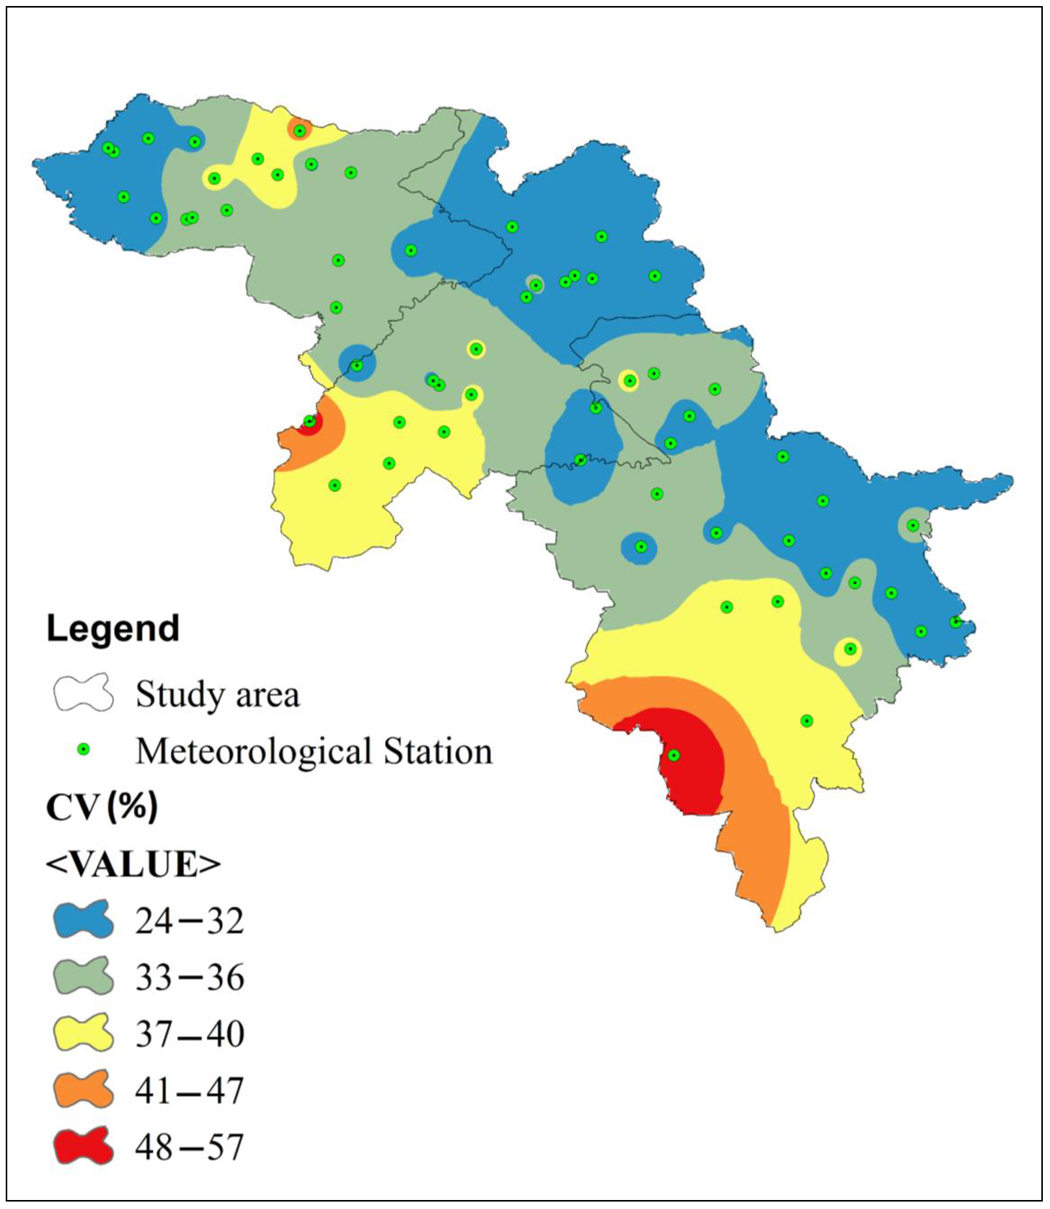
2.4.2. Spatial Distribution of Rainfall across the Study Area
2.5. The Statistical Analyses
The Correlation Coefficient (r)
3. Results
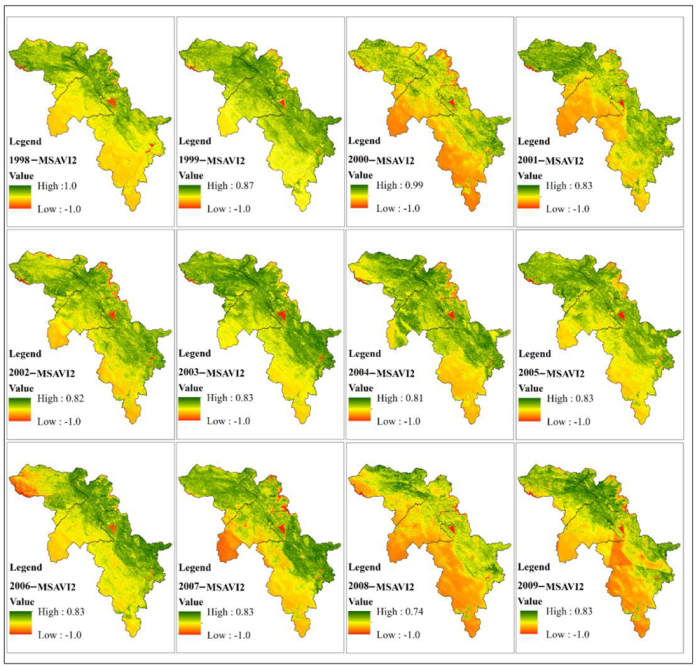
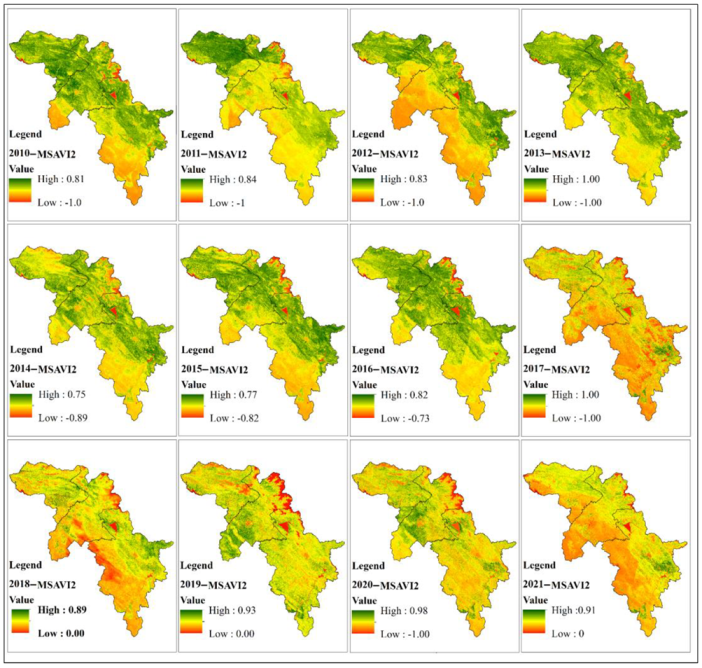
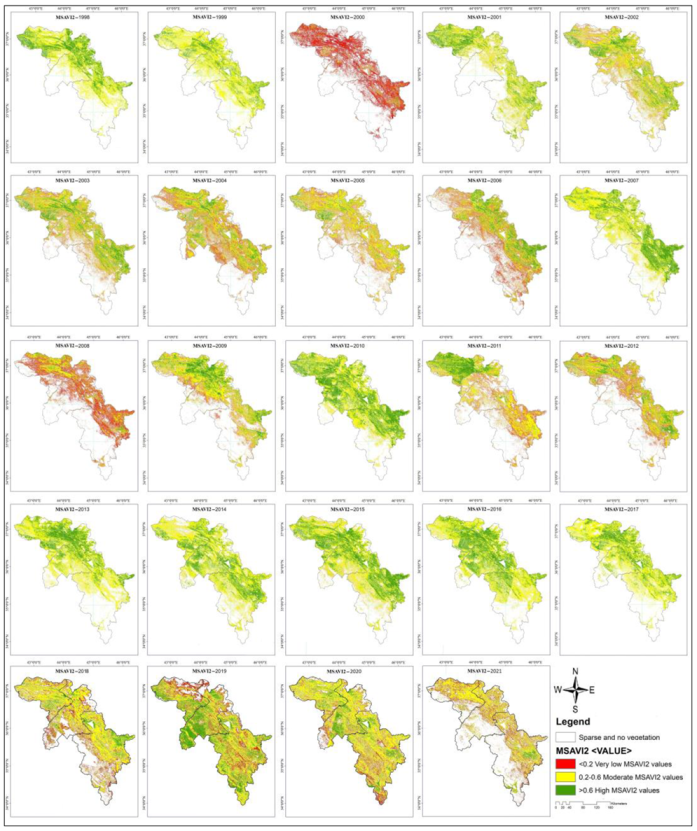
3.1. Modified Soil-Adjusted Vegetation Index (MSAVI2)
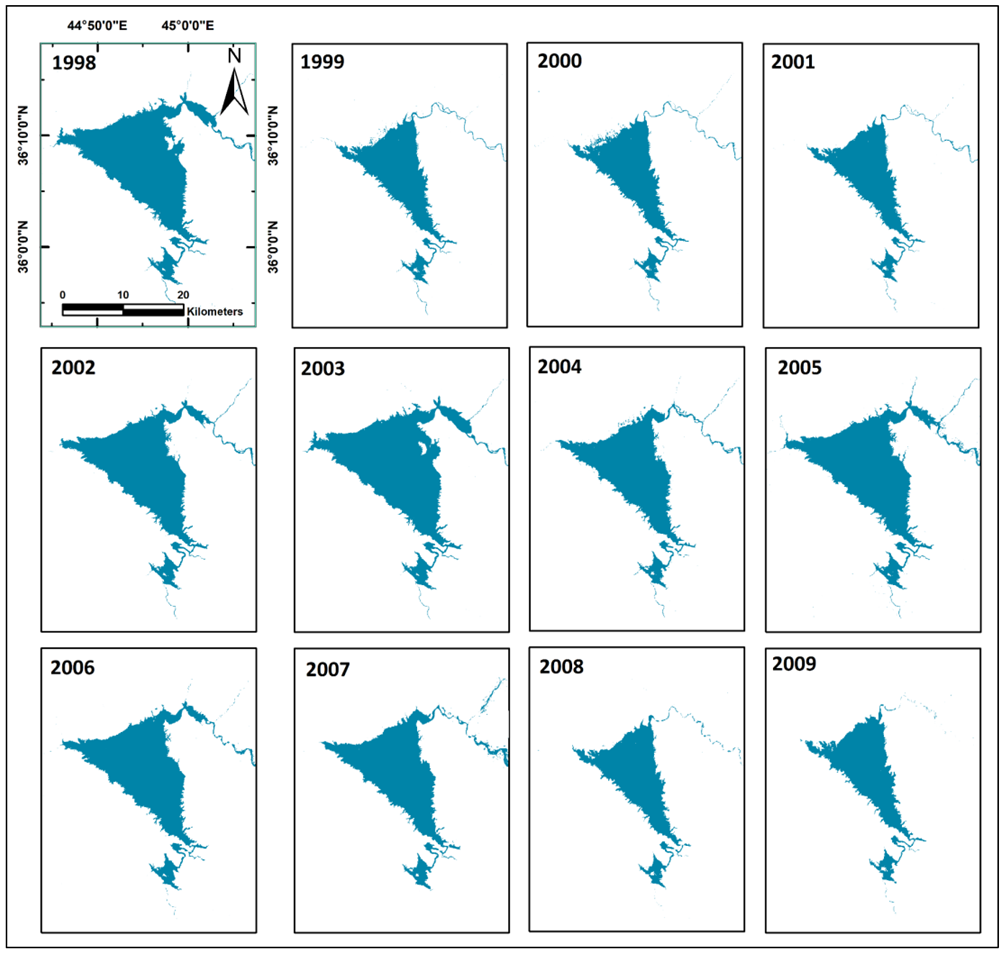
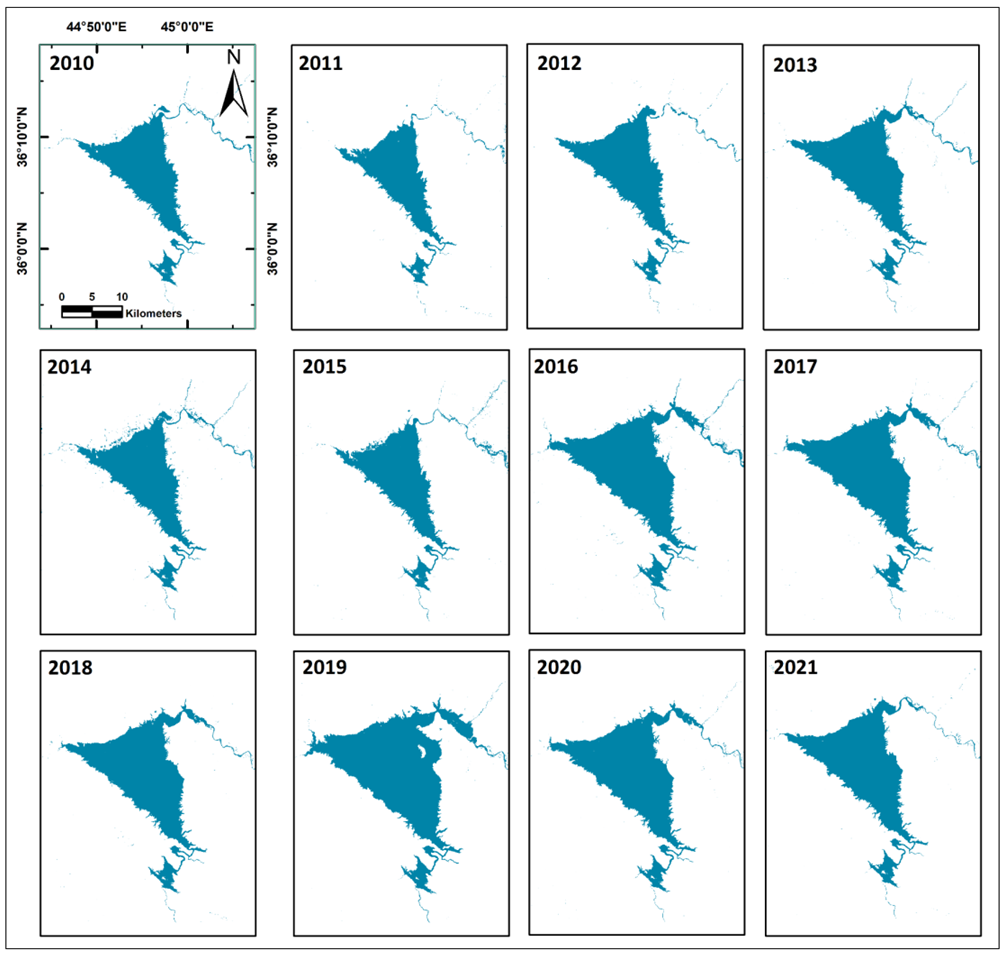
3.2. NDWI (Waterbody Area of LD)
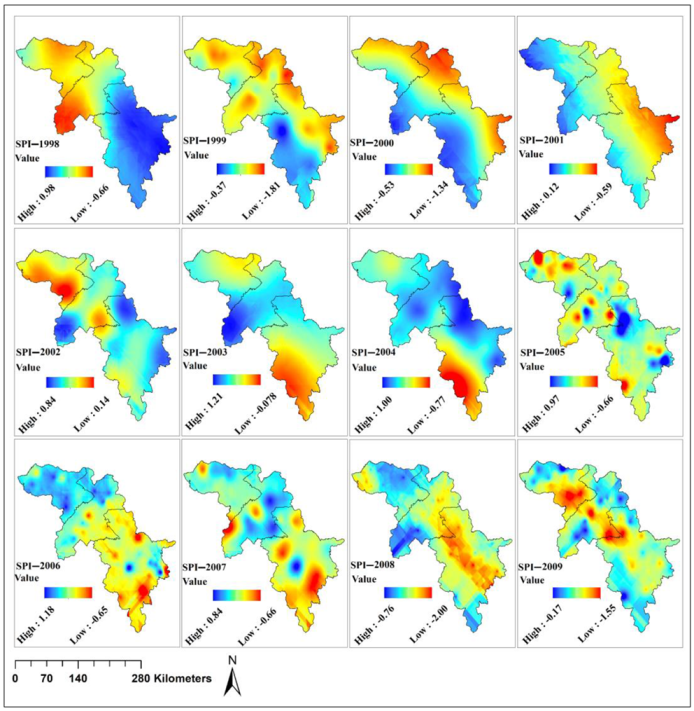
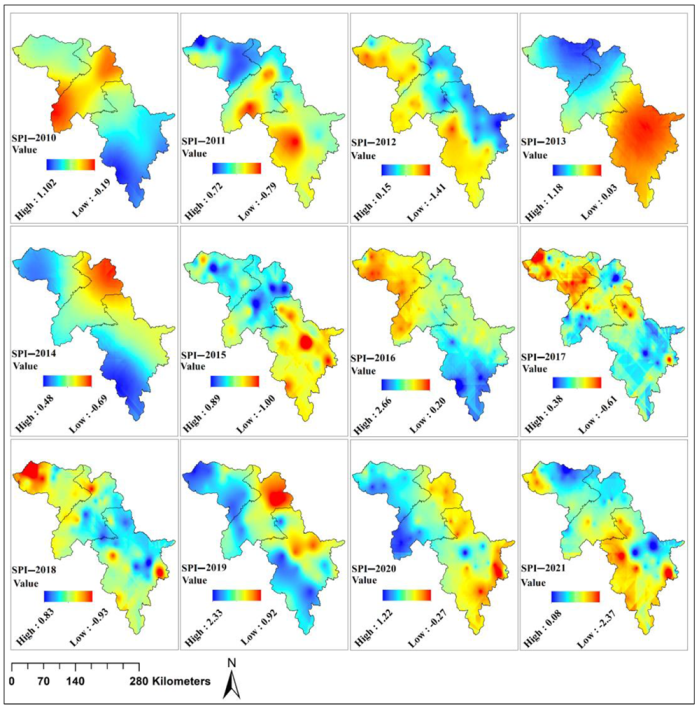
3.3. Standardized Precipitation Index SPI
3.4. Spatial Pattern Variation of Precipitation
3.5. The Correlation Coefficient
4. Discussion
5. Conclusions
Author Contributions
Funding
Institutional Review Board Statement
Informed Consent Statement
Data Availability Statement
Acknowledgments
Conflicts of Interest
Appendix A

| Station No. | Station Name | Lat- | Long- | DEM (m) | AP (mm) | Station No. | Station Name | Lat- | Long- | DEM (m) | AP (mm) |
|---|---|---|---|---|---|---|---|---|---|---|---|
| 1 | Erbil | 36.1911 | 44.0092 | 412.7 | 337.3 | 31 | Mangish | 37.0351 | 43.0925 | 1030.2 | 689.0 |
| 2 | Qushtapa | 36.0009 | 44.0285 | 390.8 | 301.3 | 32 | Deraluke | 37.0586 | 43.6493 | 706.8 | 819.5 |
| 3 | Khabat | 36.2728 | 43.6739 | 285.9 | 317.0 | 33 | Akre | 36.7414 | 43.8933 | 683.1 | 633.7 |
| 4 | Bnaslawa | 36.1538 | 44.1400 | 540.7 | 338.9 | 34 | Amadia | 37.0925 | 43.4872 | 1148.5 | 790.7 |
| 5 | Harir | 36.5511 | 44.3648 | 837.3 | 576.8 | 35 | Sarsink | 37.0503 | 43.3503 | 957.1 | 905.9 |
| 6 | Soran | 36.6385 | 44.5614 | 701.6 | 647.2 | 36 | Bamarni | 37.1151 | 43.2693 | 1203.0 | 763.4 |
| 7 | Shaqlawa | 43.9851 | 36.2094 | 966.5 | 762.9 | 37 | Bardarash | 36.5082 | 43.5894 | 363.6 | 418.4 |
| 8 | Khalifan | 36.5986 | 44.4038 | 697.1 | 699.3 | 38 | Qasrok | 36.7009 | 43.5980 | 414.8 | 533.7 |
| 9 | Choman | 36.6374 | 44.8893 | 1178.4 | 750.8 | 39 | SU | 35.5572 | 45.4356 | 870.8 | 617.3 |
| 10 | Sidakan | 36.7974 | 44.6714 | 1011.3 | 835.3 | 40 | Bazian | 35.5890 | 45.1395 | 943.7 | 652.9 |
| 11 | Rwanduz | 36.6119 | 44.5247 | 801.6 | 719.6 | 41 | Halabja | 35.1864 | 45.9739 | 716.6 | 641.4 |
| 12 | Mergasur | 36.8382 | 44.3062 | 1108.9 | 1370.3 | 42 | Penjwen | 35.6197 | 45.9414 | 1442.9 | 1004.2 |
| 13 | Dibaga | 35.8730 | 43.8050 | 328.3 | 267.5 | 43 | Chwarta | 35.7197 | 45.5747 | 1011.6 | 741.1 |
| 14 | Gwer | 36.0449 | 43.4808 | 309.7 | 256.6 | 44 | Dukan | 35.9542 | 44.9528 | 700.4 | 586.4 |
| 15 | Barzewa | 36.6268 | 44.6333 | 798.3 | 722.9 | 45 | Qaladiza | 36.1755 | 45.1333 | 628.2 | 711.7 |
| 16 | Bastora | 36.3389 | 44.1605 | 630.0 | 436.8 | 46 | Rania | 36.2391 | 44.8855 | 607.8 | 753.5 |
| 17 | Makhmoor | 35.7833 | 43.5833 | 287.7 | 244.3 | 47 | Said Sadiq | 35.3437 | 45.8534 | 544.1 | 564.6 |
| 18 | Koya | 36.0994 | 44.6481 | 724.5 | 501.8 | 48 | Qaradagh | 35.3093 | 45.3896 | 887.9 | 784.9 |
| 19 | Taqtaq | 35.8874 | 44.5856 | 397.5 | 386.2 | 49 | Arbat | 35.4246 | 45.5868 | 701.6 | 515.2 |
| 20 | Shamamk | 36.0400 | 43.8467 | 310.6 | 297.4 | 50 | KaniPanka | 35.3850 | 45.7046 | 685.8 | 549.6 |
| 21 | Duhok | 36.8679 | 42.9790 | 588.3 | 520.0 | 51 | Byara | 35.2251 | 46.1163 | 1333.5 | 693.3 |
| 22 | Semel | 36.8733 | 42.8540 | 491.6 | 445.2 | 52 | Mawat | 35.9007 | 45.4105 | 1063.8 | 735.4 |
| 23 | Zakho | 37.1436 | 42.6819 | 501.4 | 547.0 | 53 | D-dikhan | 35.1163 | 45.6863 | 534.6 | 577.4 |
| 24 | Batel | 36.9595 | 42.7217 | 531.0 | 461.1 | 54 | Chamchamal | 35.5333 | 44.8333 | 726.6 | 452.5 |
| 25 | Dam-DU | 36.8758 | 43.0029 | 605.6 | 538.3 | 55 | Kalar | 34.6411 | 45.3293 | 243.2 | 313.9 |
| 26 | Dar. hajam | 37.1988 | 42.8227 | 649.8 | 533.7 | 56 | Agjalar | 35.7483 | 44.8974 | 702.3 | 410.6 |
| 27 | Zaxo-farh | 37.1599 | 42.6587 | 447.1 | 542.6 | 57 | Bngrd | 36.0660 | 45.0299 | 841.2 | 683.5 |
| 28 | Batifa | 37.1840 | 37.1840 | 930.2 | 713.6 | 58 | Sangaw | 35.2862 | 45.1825 | 704.4 | 484.9 |
| 29 | Kani Masi | 37.2291 | 37.2291 | 1332.3 | 795.6 | 59 | Bawanor | 34.8233 | 45.5087 | 358.4 | 379.9 |
| 30 | Zaweta | 36.9058 | 36.9058 | 1006.4 | 775.6 | 60 | Kifri | 34.6833 | 44.9664 | 238.7 | 279.2 |
| Date Years | Sensor | Target_WRS_Path Target_WRS_Row Path/Row | Date_Acquired | Resolutions |
|---|---|---|---|---|
| 1998 | Landsat 5 TM | 170/34,170/35, 169/35, 169/34, 168/35, 168/36 | 10/04, 10/04, 21/05, 21/05, 30/05, 30/05 | 30 m |
| 1999 | Landsat 5 TM | 170/34,170/35, 169/35, 169/34, 168/35, 168/36 | 13/04, 13/04, 22/04, 22/04,01/05, 01/05 | 30 m |
| 2000 | Landsat 5 TM Landsat 7 ETM+ | 170/34, 170/35, 169/35, 169/34, 168/35, 168/36 | 15/05, 15/05, 16/04, 16/04, 25/04, 25/04 | 30 m |
| 2001 | Landsat 7 ETM+ | 170/34,170/35, 169/35, 169/34, 168/35, 168/36 | 26/04, 26/04, 21/05, 21/05, 28/04, 28/04 | 30 m |
| 2002 | Landsat 7 ETM+ | 170/34,170/35, 169/35, 169/34, 168/35, 168/36 | 13/04, 13/04, 08/05, 08/05, 01/05, 01/05 | 30 m |
| 2003 | Landsat 7 ETM+ | 170/34,170/35, 169/35, 169/34, 168/35, 168/36 | 02/05, 02/05, 11/05, 11/05, 20/05, 20/05. | 30 m |
| 2004 | Landsat 7 ETM+ | 170/34,170/35, 169/35, 169/34, 168/35, 168/36 | 06/05, 06/05,11/04, 27/04, 06/05, 06/05 | 30 m |
| 2005 | Landsat 7 ETM+ | 170/34,170/35, 169/35, 169/34, 168/35, 168/36 | 23/04, 23/04, 30/04, 30/04, 23/04, 23/04 | 30 m |
| 2006 | Landsat 7 ETM+ | 170/34,170/35, 169/35, 169/34, 168/35, 168/36 | 26/05, 26/05, 19/05, 19/05, 12/05, 28/05 | 30 m |
| 2007 | Landsat 5 TM Landsat 7 ETM+ | 170/34,170/35, 169/35, 169/34, 168/35, 168/36 | 05/05,05/05, 20/04, 13/04, 07/05, 07/05 | 30 m |
| 2008 | Landsat 7 ETM+ | 170/34,170/35, 169/35, 169/34, 168/35, 168/36 | 15/05, 15/05, 22/04, 24/05, 15/04, 15/04 | 30 m |
| 2009 | Landsat 5 TM Landsat 7 ETM+ | 169/35, 169/34, 170/34,170/35, 168/35, 168/36 | 03/05, 03/05, 02/05, 02/05, 20/05, 20/05 | 30 m |
| 2010 | Landsat 5 TM Landsat 7 ETM+ | 170/34,170/35, 169/35, 169/34, 168/35, 168/36 | 26/05, 29/05, 22/05, 04/04, 05/04, 19/04 | 30 m |
| 2011 | Landsat 5 TM Landsat 7 ETM+ | 170/34,170/35, 169/34, 168/35, 168/36169/35, | 16/05, 16/05, 08/05, 16/04, 16/04, 15/04 | 30 m |
| 2012 | Landsat 7 ETM+ | 170/34,170/35, 169/35, 169/34, 168/35, 168/36 | 26/04, 26/04, 19/05, 19/05, 26/04, 26/04 | 30 m |
| 2013 | Landsat 8 OLI | 170/34,170/35, 169/35, 169/34, 168/35, 168/36 | 05/05, 05/05, 28/04, 28/04, 23/05, 23/05, | 30 m |
| 2014 | Landsat 8 OLI | 170/34,170/35, 169/35, 169/34, 168/35, 168/36 | 06/04, 06/04, 15/04, 01/05, 24/04, 24/04 | 30 m |
| 2015 | Landsat 8 OLI | 170/34,170/35, 169/35, 169/34, 168/35, 168/36 | 09/04, 25/04,18/04, 01/04, 27/04, 27/04 | 30 m |
| 2016 | Landsat 8 OLI | 170/34,170/35, 169/35, 169/34, 168/35, 168/36 | 13/05, 13/05, 20/04, 20/04, 15/05, 15/05 | 30 m |
| 2017 | Landsat 8 OLI | 170/34,170/35, 169/35, 169/34, 168/35, 168/36 | 30/04, 30/04, 09/05, 09/05, 18/05, 18/05 | 30 m |
| 2018 | Landsat 8 OLI | 170/34,170/35, 169/35, 169/34, 168/35, 168/36 | 04,10/04, 10/04, 26/04, 19/04, 19/04 | 30 m |
| 2019 | Landsat 8 OLI | 170/34,170/35, 169/35, 169/34, 168/35, 168/36 | 4/04, 4/04, 13/04, 13/04, 24/05, 24/05 | 30 m |
| 2020 | Landsat 8 OLI | 170/34,170/35, 169/35, 169/34, 168/35, 168/36 | 08/05, 08/05, 15/04, 15/04, 23/03, 23/03 | 30 m |
| 2021 | Landsat 8 OLI | 170/34,170/35, 169/35, 169/34, 168/35, 168/36 | 25/4, 10/05, 20/04, 20/04, 26/03, 26/03 | 30 m |
| Station No. | Long- | Lat- | 1997–1998 | 1998–1999 | 1999–2000 | 2000–2001 | 2001–2002 | 2002–2003 | 2003–2004 | 2004–2005 | 2005–2006 | 2006–2007 | 2007–2008 | 2008–2009 |
|---|---|---|---|---|---|---|---|---|---|---|---|---|---|---|
| 1 | 44.009 | 36.191 | −0.68 | −1.94 | −0.76 | −0.15 | 0.61 | 1.31 | 1.17 | 0.71 | 0.69 | 0.45 | −1.16 | −0.46 |
| 2 | 44.028 | 36.001 | −1.11 | −1.44 | −1.24 | 0.08 | 0.68 | 0.79 | 0.66 | 0.49 | 0.11 | 0.63 | −0.57 | −0.37 |
| 3 | 43.674 | 36.273 | 0.05 | −1.01 | −0.84 | 0.32 | 0.25 | 0.74 | 0.65 | 0.25 | 0.56 | −0.01 | −1.52 | −0.9 |
| 4 | 44.14 | 36.154 | −0.64 | −1.62 | −0.6 | −0.08 | 0.16 | 0.98 | 1.06 | 0.49 | 0.53 | 0.48 | −1.38 | −0.95 |
| 5 | 44.365 | 36.551 | 0.26 | −1.44 | −1.02 | −0.72 | 0.69 | 0.71 | 0.77 | 0.32 | 0.38 | 0.58 | −1.44 | −0.57 |
| 6 | 44.561 | 36.638 | −0.32 | −0.75 | −1.57 | −1.01 | 0.76 | 0.9 | 0.79 | 0.34 | 0.8 | 0.64 | −1.37 | −0.52 |
| 7 | 43.985 | 36.209 | 0.35 | −1.58 | −1.25 | −0.39 | 0.64 | 1.05 | 0.8 | 0.47 | 0.54 | 0.81 | −1.71 | −0.65 |
| 8 | 44.404 | 36.599 | −0.27 | −1.68 | −1.68 | 0.07 | 0.87 | 0.8 | 0.54 | 0.01 | 0.64 | 0.53 | −1.01 | −0.45 |
| 9 | 44.889 | 36.637 | −0.17 | −2.09 | −1.29 | −0.59 | 0.65 | 0.27 | 1.03 | 0.04 | 0.31 | 0.56 | −1.13 | −0.39 |
| 10 | 44.671 | 36.797 | 0.6 | −1.27 | −1.24 | −0.49 | 0.67 | 0.45 | 0.82 | 0.34 | 0.86 | 0.32 | −1.68 | −0.73 |
| 11 | 44.525 | 36.612 | 1.01 | −1.3 | −0.53 | 0.24 | −0.06 | 0.25 | 0.99 | 0.42 | 0.87 | 0.94 | −2.03 | −0.81 |
| 12 | 44.306 | 36.838 | −0.91 | −1.94 | −1.86 | 0 | 0.71 | 0.16 | 0.54 | 0.27 | 0.94 | 0.22 | −1.29 | −0.56 |
| 13 | 43.805 | 35.873 | −1.12 | −1.4 | −0.78 | −0.2 | 0.71 | 1.02 | 0.38 | 0.14 | 0.77 | 0.42 | −0.94 | −0.42 |
| 14 | 43.481 | 36.045 | −0.82 | −1.22 | −0.47 | 0.13 | 1.05 | 1.75 | 0.22 | 0.07 | 0.41 | −0.91 | −0.82 | −1.07 |
| 15 | 44.633 | 36.627 | 0.53 | −0.99 | −1.34 | 0.55 | 0.3 | 2.89 | 0.39 | 0.23 | 0.23 | 0.61 | −1.81 | −0.91 |
| 16 | 44.16 | 36.339 | 0.52 | −0.74 | −0.53 | −0.08 | 0.69 | 0.61 | 0.57 | −0.13 | −0.14 | −0.53 | −1.72 | −1.57 |
| 17 | 43.583 | 35.783 | −0.52 | −1.45 | −0.46 | 0 | 0.93 | 1.28 | 0.9 | 0.3 | 0.63 | 0.29 | −0.97 | −0.82 |
| 18 | 44.648 | 36.099 | 0.23 | −1.01 | −0.62 | −0.61 | 0.04 | 0.52 | −0.22 | −0.32 | 0.1 | 0.88 | −1.43 | −1.15 |
| 19 | 44.586 | 35.887 | 0.56 | −0.89 | −1 | −0.41 | 0.04 | 0.35 | 0.47 | 0.18 | 0.27 | 0.51 | −1.72 | −1.56 |
| 20 | 43.847 | 36.04 | −0.53 | −1.62 | −0.45 | 0.04 | 0.81 | 1.56 | 0.8 | −0.17 | 0.21 | 0.17 | −0.84 | −0.68 |
| 21 | 42.979 | 36.868 | −0.11 | −1.26 | −1.39 | 0.4 | 0.24 | 0.9 | 0.31 | 0.3 | 0.77 | 0.11 | −1.4 | −0.92 |
| 22 | 42.854 | 36.873 | 0.08 | −0.99 | −0.63 | 0.65 | 0.19 | 0.47 | 0.55 | 0.19 | 0.62 | 0.4 | −1.83 | −0.96 |
| 23 | 42.682 | 37.144 | 0.58 | −1.58 | −0.74 | 0.14 | 0.49 | 0.74 | 0.25 | 0.17 | 0.53 | 0.32 | −1.71 | −0.9 |
| 24 | 42.722 | 36.959 | 0.71 | −0.9 | −1.02 | 0.3 | 0.25 | 0.73 | 0.4 | 0.48 | 0.87 | 0.33 | −1.89 | −0.53 |
| 25 | 43.003 | 36.876 | −0.08 | −1.47 | −0.46 | −0.28 | 0.23 | 0.72 | 0.46 | 0.2 | 0.69 | 0.53 | −1.43 | −1.01 |
| 26 | 42.823 | 37.199 | 0.04 | −1.32 | −1.43 | 0.26 | 0.66 | 1.02 | 0.61 | −0.67 | 0.18 | −0.63 | −0.96 | −0.5 |
| 27 | 42.659 | 37.16 | 0.06 | −1.17 | −1.38 | −0.1 | 0.28 | 0.5 | 0.48 | 0.26 | 0.44 | 0.27 | −1.61 | −0.96 |
| 28 | 43.013 | 37.184 | −0.26 | −1.57 | −1.6 | −0.45 | 0.3 | 0.7 | 0.23 | 0.32 | 0.75 | 0.53 | −0.91 | −0.65 |
| 29 | 43.441 | 37.229 | −0.61 | −1.28 | −1.34 | −1.01 | 0.4 | 0.16 | 0.24 | 0.38 | 0.59 | 0.55 | −1.18 | −0.15 |
| 30 | 43.143 | 36.906 | −0.38 | −1.53 | −0.28 | 0.07 | 0.25 | 0.49 | 0.37 | −0.03 | 0.76 | 0.18 | −0.91 | −1.13 |
| 31 | 43.093 | 37.035 | −0.3 | −1.87 | −1.08 | −0.24 | 0.2 | 0.54 | 0.3 | 0.01 | 0.73 | 0.33 | −1.11 | −0.58 |
| 32 | 43.649 | 37.059 | −0.71 | −1.47 | −1.44 | 0 | 0.55 | 0.4 | 0.64 | −0.11 | 0.71 | 0.32 | −0.69 | −0.75 |
| 33 | 43.893 | 36.741 | 0.72 | −1.26 | −0.74 | −0.15 | 0.23 | 0.52 | 0.36 | 0.25 | 0.5 | 0.25 | −1.03 | −1.39 |
| 34 | 43.487 | 37.093 | 0.06 | −1.4 | −0.8 | −0.45 | 0.5 | 0.23 | −0.07 | −0.15 | 0.32 | 0.67 | −0.99 | −1.03 |
| 35 | 43.35 | 37.05 | −0.73 | −1.83 | −1.14 | 0.25 | 0.54 | 0.28 | 0.09 | 0.13 | 0.57 | 0.19 | −0.96 | −0.89 |
| 36 | 43.269 | 37.115 | −0.64 | −1.34 | −1.29 | −0.21 | 0.78 | 0.25 | 0.1 | 0.06 | 0.93 | 0.51 | −1.1 | −0.93 |
| 37 | 43.589 | 36.508 | 0.25 | −0.71 | −0.67 | −0.49 | −0.31 | 0.79 | 0.75 | 0.67 | 1.0 | 0.33 | −1.23 | −1.23 |
| 38 | 43.598 | 36.701 | −0.06 | −1.11 | −0.93 | 0.04 | 0.3 | 0.57 | 0.55 | 0.44 | 0.89 | 0.19 | −1.4 | −1.46 |
| 39 | 45.436 | 35.557 | 1.28 | −1.78 | −0.83 | −0.21 | 0.71 | 1.0 | 0.92 | 0.28 | 0.6 | 0.11 | −0.92 | −0.66 |
| 40 | 45.14 | 35.589 | 0.7 | −1.28 | −0.64 | 0.05 | 0.4 | 0.69 | 0.5 | 0.35 | 0.41 | 0.17 | −1.59 | −0.91 |
| 41 | 45.974 | 35.186 | 1.62 | −2.16 | −1.38 | −1.01 | 1.08 | 0.76 | 1.46 | 0.96 | 1.17 | 0.32 | −2.14 | −0.77 |
| 42 | 45.941 | 35.62 | −0.13 | −1.68 | −1.74 | −0.65 | 0.72 | 1.02 | 0.64 | 0.3 | 0.69 | 0.41 | −1.19 | −0.76 |
| 43 | 45.575 | 35.72 | 0.81 | −1.28 | −1.1 | −0.4 | 0.35 | 0.46 | 0.58 | 0.22 | 0.42 | −0.03 | −1.15 | −0.78 |
| 44 | 44.953 | 35.954 | 1.71 | −1.28 | −0.83 | −0.41 | 0.65 | 0.76 | 1.17 | 0.98 | 0.41 | 0.22 | −1.85 | −1.38 |
| 45 | 45.133 | 36.176 | 0.01 | −1.68 | −1.37 | −0.48 | 0.91 | 1.23 | 1.05 | 0.15 | 0.13 | −0.43 | −1.19 | −0.47 |
| 46 | 44.886 | 36.239 | 0.99 | −1.35 | −1.05 | −0.24 | 0.72 | 0.78 | 0.87 | 0.49 | 0.15 | 0.48 | −1.44 | −1.06 |
| 47 | 45.853 | 35.344 | 1.59 | −1.26 | −1.27 | −0.83 | 0.81 | 0.47 | 0.48 | −0.07 | 0.81 | 0.12 | −1.47 | −1.0 |
| 48 | 45.39 | 35.309 | 0.59 | −1.15 | −0.86 | −0.33 | 0.43 | 0.48 | 0.37 | 0.28 | 0.46 | 0.1 | −2.25 | −0.93 |
| 49 | 45.587 | 35.425 | 1.55 | −1.49 | −0.5 | −0.46 | 0.74 | 0.42 | 0.34 | 0.02 | 0.32 | 0.02 | −1.74 | −0.92 |
| 50 | 45.705 | 35.385 | 0.79 | −1.29 | −0.9 | −0.68 | 0.5 | 0.22 | 0.19 | 0.09 | 0.8 | 0.08 | −1.27 | −0.81 |
| 51 | 46.116 | 35.225 | 0.95 | −1.42 | −1.46 | −0.61 | 0.65 | 0.58 | 0.57 | 0.38 | −0.69 | 0.06 | −1.1 | −0.64 |
| 52 | 45.411 | 35.901 | 1.28 | −1.23 | −0.86 | −0.86 | 0.72 | 0.69 | 0.9 | 0.38 | −0.49 | 0.23 | −1.61 | −1.14 |
| 53 | 44.787 | 36.21 | 0.62 | −1.45 | −1.15 | −1.0 | 1.13 | 0.84 | 0.59 | 0.56 | 0.42 | −0.2 | −1.62 | −0.78 |
| 54 | 45.686 | 35.116 | 0.25 | −0.86 | −1.12 | 0.01 | 0.54 | 0.72 | 0.77 | 0.6 | −0.03 | −0.55 | −1.66 | −0.88 |
| 55 | 44.833 | 35.533 | 0.78 | −0.06 | 0.1 | 0.16 | 0.96 | −0.16 | −0.17 | 0.2 | −0.03 | −0.53 | −2.09 | −0.73 |
| 56 | 44.897 | 35.748 | 0.45 | −0.73 | −0.92 | −0.28 | 0.6 | 0.99 | 1.01 | 0.76 | 0.45 | −0.22 | −1.83 | −1.09 |
| 57 | 45.03 | 36.066 | 1.29 | −1.24 | −1.04 | −0.29 | 0.86 | 0.64 | 0.94 | 0.84 | 0.43 | 0.27 | −1.98 | −1.02 |
| 58 | 45.183 | 35.286 | 0.62 | −0.81 | −0.85 | −0.28 | 0.61 | 0.48 | 0.57 | 0.18 | 1.24 | 1.09 | −1.97 | −1.12 |
| 59 | 45.509 | 34.823 | 0.66 | −0.48 | −0.54 | 0.35 | 0.7 | 0.22 | −0.04 | 0.2 | −0.67 | −0.51 | −1.67 | −1.07 |
| 60 | 44.966 | 34.683 | 0.91 | −0.68 | −0.56 | 0.15 | 0.17 | −0.75 | −1.15 | −0.38 | −0.1 | −0.22 | −0.56 | −0.19 |
| Station No. | Long- | Lat- | 2009–2010 | 2010–2011 | 2011–2012 | 2012–2013 | 2013–2014 | 2014–2015 | 2015–2016 | 2016–2017 | 2017–2018 | 2018–2019 | 2019–2020 | 2020–2021 |
| 1 | 44.009 | 36.191 | 0.25 | −0.09 | −1.05 | 0.65 | −0.35 | 0.02 | 0.56 | −0.28 | 0.25 | 1.8 | 0.59 | −1.3 |
| 2 | 44.028 | 36.001 | 0.22 | −0.73 | −1.12 | 0.62 | 0.12 | 0.4 | 0.85 | 0.06 | 0.38 | 1.9 | 1.03 | −1.06 |
| 3 | 43.674 | 36.273 | −0.3 | −0.03 | −0.5 | 0.82 | −0.1 | 0.36 | 0.64 | −0.38 | 0.03 | 2.19 | 1.0 | −0.76 |
| 4 | 44.14 | 36.154 | −0.2 | −0.25 | −0.51 | 0.88 | 0.02 | 0.56 | 0.64 | −0.31 | 0.46 | 1.79 | 0.64 | −0.66 |
| 5 | 44.365 | 36.551 | 0.3 | −0.4 | −0.43 | 0.8 | −0.64 | 0.5 | 0.88 | −0.19 | 0.29 | 1.65 | 0.76 | −0.65 |
| 6 | 44.561 | 36.638 | −0.01 | −0.56 | −0.48 | 0.53 | −0.54 | 0.79 | 0.95 | 0.09 | 0.39 | 1.17 | 0.69 | −0.32 |
| 7 | 43.985 | 36.209 | 0.31 | −0.21 | −0.85 | 1.42 | −0.34 | 0.07 | 0.77 | −0.56 | −0.01 | 1.71 | 0.4 | −1.24 |
| 8 | 44.404 | 36.599 | 0.23 | −0.57 | −0.61 | 0.92 | −0.22 | 0.37 | 0.95 | −0.01 | 0.46 | 1.54 | 0.5 | −0.52 |
| 9 | 44.889 | 36.637 | 0.08 | 0.26 | −0.27 | 1.09 | −0.37 | 0.79 | 1.2 | −0.38 | 0.45 | 1.25 | 0.43 | −0.61 |
| 10 | 44.671 | 36.797 | −0.12 | 0.01 | −0.31 | 0.57 | −1.18 | 0.31 | 1.29 | 0.44 | 0.39 | 1.3 | 0.2 | −0.68 |
| 11 | 44.525 | 36.612 | −0.27 | −0.5 | −0.99 | 0.97 | −0.93 | 0.55 | 1.26 | −0.27 | 0.17 | 1.27 | 0.4 | −1.08 |
| 12 | 44.306 | 36.838 | 0.59 | 0.21 | 0.05 | 1.46 | −0.32 | 0.27 | 1.33 | −0.04 | −0.25 | 1.49 | 0.23 | −0.7 |
| 13 | 43.805 | 35.873 | 0.03 | −0.5 | −0.8 | 0.98 | 0.0 | 0.28 | 0.41 | 0.03 | 0.21 | 2.09 | 1.05 | −0.8 |
| 14 | 43.481 | 36.045 | −0.21 | 0.08 | −0.78 | 0.37 | 0.41 | 0.06 | 0.56 | 0.18 | 0.2 | 1.82 | 1.07 | −0.38 |
| 15 | 44.633 | 36.627 | −0.41 | −0.36 | −0.8 | 0.47 | −0.73 | 0.72 | 0.72 | −0.4 | 0.16 | 0.9 | 0.24 | −0.84 |
| 16 | 44.16 | 36.339 | 0.02 | −0.3 | −0.38 | 1.06 | 0.17 | 0.85 | 0.98 | −0.11 | 0.64 | 1.7 | 0.68 | −0.79 |
| 17 | 43.583 | 35.783 | −0.26 | −0.15 | −1.05 | 0.6 | −0.23 | −0.03 | 0.32 | −0.24 | 0.13 | 1.89 | 1.14 | −0.8 |
| 18 | 44.648 | 36.099 | 0.76 | 0.09 | 0.05 | 0.53 | −0.09 | 0.41 | 1.18 | −0.23 | 0.5 | 1.95 | 0.82 | −0.94 |
| 19 | 44.586 | 35.887 | 0.51 | 0.01 | −0.33 | 0.72 | 0.14 | 0.47 | 1.26 | −0.16 | 0.65 | 1.6 | 0.8 | −1.35 |
| 20 | 43.847 | 36.04 | 0.12 | −0.28 | −1.17 | 0.36 | −0.22 | 0.21 | 0.68 | 0.08 | 0.36 | 2.16 | 0.76 | −1.06 |
| 21 | 42.979 | 36.868 | 0.43 | −0.12 | −1.03 | 1.21 | 0.68 | 0.27 | 0.39 | −0.44 | −0.04 | 1.96 | 0.87 | −1.06 |
| 22 | 42.854 | 36.873 | 0.39 | −0.1.0 | −1.17 | 0.77 | 0.38 | 0.36 | 0.2 | −0.35 | −0.04 | 2.09 | 1.13 | −1.23 |
| 23 | 42.682 | 37.144 | 0.44 | 0.35 | −0.88 | 0.56 | −0.38 | 0.42 | 1.18 | −0.52 | −0.3 | 2.26 | 0.51 | −1.22 |
| 24 | 42.722 | 36.959 | 0.42 | −0.23 | −1.36 | 0.36 | −0.11 | 0.11 | 0.53 | −0.11 | 0.2 | 2.15 | 0.7 | −1.45 |
| 25 | 43.003 | 36.876 | 0.6 | −0.08 | −1.07 | 1.28 | 0.63 | 0.19 | 0.25 | −0.57 | −0.03 | 2.03 | 0.88 | −1.22 |
| 26 | 42.823 | 37.199 | 0.48 | 0.71 | −0.2 | 0.99 | 0.68 | −0.17 | 0.17 | −0.65 | −0.94 | 2.23 | 0.91 | −0.57 |
| 27 | 42.659 | 37.16 | 0.45 | 0.41 | −0.79 | 0.44 | 0.48 | 0.46 | 1.47 | −0.52 | −0.34 | 2.33 | 0.5 | −1.36 |
| 28 | 43.013 | 37.184 | 0.51 | 0.14 | −0.68 | 0.63 | 0.15 | 0.33 | 0.58 | 0.14 | 0.02 | 2.23 | 0.64 | −0.68 |
| 29 | 43.441 | 37.229 | 0.68 | 0.27 | −1.0 | 1.26 | 0.08 | 0.29 | 0.84 | −0.05 | 0.52 | 1.64 | 0.58 | 0.07 |
| 30 | 43.143 | 36.906 | 0.43 | −0.14 | −1.21 | 1.14 | 0.29 | 0.47 | 0.58 | −0.28 | 0.03 | 2.04 | 1.05 | −0.72 |
| 31 | 43.093 | 37.035 | 0.61 | 0.06 | −1.02 | 1.02 | 0.43 | 0.9 | 0.47 | −0.17 | −0.23 | 2.06 | 0.87 | −0.54 |
| 32 | 43.649 | 37.059 | 0.28 | 0.47 | −0.75 | 0.9 | −0.15 | 0.23 | 0.82 | −0.18 | 0.26 | 1.94 | 0.9 | −0.44 |
| 33 | 43.893 | 36.741 | 0.7 | 0.44 | −1.26 | 1.01 | 0.13 | 0.12 | 0.44 | −0.59 | 0.04 | 2.13 | 0.67 | −0.84 |
| 34 | 43.487 | 37.093 | 0.5 | 0.3 | −0.68 | 1.28 | −0.01 | 0.46 | 0.76 | −0.34 | 0.18 | 1.97 | 0.79 | −0.53 |
| 35 | 43.35 | 37.05 | 0.37 | 0.15 | −0.71 | 1.2 | 0.15 | 0.53 | 0.93 | 0.03 | 0.45 | 1.8 | 0.74 | −0.42 |
| 36 | 43.269 | 37.115 | 0.66 | 0.4 | −0.97 | 1.02 | 0.13 | 0.32 | 0.92 | −0.33 | 0.19 | 1.95 | 0.55 | −0.59 |
| 37 | 43.589 | 36.508 | 0.22 | 0.44 | −1.2 | 0.57 | −0.38 | 0.38 | 0.3 | −0.38 | 0.17 | 2.22 | 0.79 | −1.0 |
| 38 | 43.598 | 36.701 | 0.47 | 0.46 | −0.9 | 0.71 | 0.09 | 0.47 | 0.37 | −0.52 | 0.22 | 2.12 | 0.7 | −0.86 |
| 39 | 45.436 | 35.557 | 0.76 | −0.04 | −0.12 | −0.62 | −0.58 | −1.01 | 0.65 | −0.1 | 0.24 | 1.72 | 0.59 | −0.88 |
| 40 | 45.14 | 35.589 | 0.58 | −0.32 | −0.5 | −0.23 | −0.06 | 0.07 | 0.69 | −0.14 | 0.38 | 1.33 | 1.42 | 0.19 |
| 41 | 45.974 | 35.186 | 1.2 | 0.03 | −0.16 | 0.26 | −0.78 | −0.37 | 0.84 | −0.65 | −0.48 | 1.98 | −0.43 | −2.51 |
| 42 | 45.941 | 35.62 | 0.65 | −0.03 | 0.17 | 0.26 | −0.07 | −0.07 | 1.02 | −0.09 | 0.42 | 1.73 | 0.2 | −0.64 |
| 43 | 45.575 | 35.72 | 0.75 | −0.08 | −0.47 | −0.06 | −0.08 | 0.23 | 0.68 | 0.01 | 0.44 | 1.32 | 1.07 | 0.13 |
| 44 | 44.953 | 35.954 | 0.05 | −0.35 | −0.61 | 0 | −0.47 | 0.17 | 0.94 | −0.15 | 0.42 | 1.66 | 0.03 | −1.39 |
| 45 | 45.133 | 36.176 | 0.34 | 0.03 | −0.09 | 0.47 | 0.11 | −0.04 | 1.01 | −0.31 | 0.59 | 1.78 | 0.29 | −0.79 |
| 46 | 44.886 | 36.239 | 0.41 | −0.09 | −0.49 | 0.37 | −0.35 | −0.06 | 0.64 | −0.48 | 0.41 | 1.96 | 0.61 | −0.99 |
| 47 | 45.853 | 35.344 | 0.7 | −0.03 | −0.46 | 0.08 | −0.24 | −0.04 | 1.3 | −0.03 | 0.15 | 2.1 | −0.09 | −1.19 |
| 48 | 45.39 | 35.309 | 0.4 | −0.19 | −0.14 | 0.02 | 0.24 | 0.1 | 1.32 | 0.25 | 0.66 | 1.67 | 0.88 | −0.51 |
| 49 | 45.587 | 35.425 | 0.74 | 0.03 | −0.39 | 0.09 | −0.1 | −0.04 | 0.97 | −0.24 | 0.42 | 1.84 | 0.54 | −0.99 |
| 50 | 45.705 | 35.385 | 0.76 | 0.13 | −0.39 | 0.06 | −0.08 | −0.08 | 0.82 | −0.07 | 0.85 | 1.9 | 0.91 | −0.54 |
| 51 | 46.116 | 35.225 | 0.8 | −0.02 | −0.15 | 0.23 | −0.04 | 0.12 | 0.99 | 0.06 | 0.19 | 1.63 | 0.93 | −0.4 |
| 52 | 45.411 | 35.901 | 0.69 | −0.11 | −0.13 | 0.26 | −0.34 | 0.19 | 0.9 | 0.01 | 0.43 | 1.66 | 0.37 | −0.84 |
| 53 | 44.787 | 36.21 | 0.86 | 0.3 | −0.53 | 0.35 | −0.22 | −0.15 | 1.22 | −0.25 | 0.1 | 2.23 | 0.1 | −1.48 |
| 54 | 45.686 | 35.116 | 0.5 | −0.25 | −1.2 | 0.56 | 0.37 | 0.29 | 1.12 | 0.07 | 0.52 | 1.72 | 0.69 | −0.66 |
| 55 | 44.833 | 35.533 | 0.66 | −0.43 | −1.46 | 0.62 | 0.34 | −0.1 | 1.68 | −0.21 | −0.18 | 2.29 | 0.53 | −1.91 |
| 56 | 44.897 | 35.748 | 0.49 | −0.08 | −1.11 | 0.04 | −0.13 | 0.19 | 0.86 | −0.11 | 0.53 | 1.69 | 0.71 | −0.93 |
| 57 | 45.03 | 36.066 | 0.64 | −0.18 | −0.47 | −0.03 | −0.24 | −0.25 | 0.96 | −0.51 | 0.41 | 1.65 | 0.34 | −1.29 |
| 58 | 45.183 | 35.286 | 0.88 | −0.78 | −1.12 | −0.1 | 0.06 | 0.01 | 1.15 | −0.26 | 0.12 | 2.13 | 0.12 | −1.64 |
| 59 | 45.509 | 34.823 | 0.8 | −0.06 | −1.04 | 0.51 | 0.33 | 0.02 | 1.98 | −0.32 | 0.22 | 2.29 | −0.07 | −1.08 |
| 60 | 44.966 | 34.683 | 1.24 | −0.31 | −1.05 | −0.04 | 0.65 | −0.28 | 2.82 | −0.23 | −0.04 | 1.85 | 0.47 | −1.39 |
| /** Kawa Hakzi 2022 [email protected] MSAVI2 */ // Assign a common name to the sensor-specific bands. var LC9_BANDS = ['B2', 'B3', 'B4', 'B5', 'B6', 'B7', 'B10']; //Landsat 8 var LC8_BANDS = ['B2', 'B3', 'B4', 'B5', 'B6', 'B7', 'B10']; //Landsat 8 var LC7_BANDS = ['B1', 'B2', 'B3', 'B4', 'B5', 'B7', 'B6_VCID_2']; //Landsat 7 var LC5_BANDS = ['B1', 'B2', 'B3', 'B4', 'B5', 'B7', 'B6']; //Llandsat 5 var STD_NAMES = ['blue', 'green', 'red', 'nir', 'swir1', 'swir2', 'temp']; var l9 = ee.ImageCollection('LANDSAT/LC09/C02/T1_TOA').select(LC9_BANDS, STD_NAMES)// Landsat 8 //Bands are not arranged yet var l8 = ee.ImageCollection('LANDSAT/LC08/C01/T1_TOA').select(LC8_BANDS, STD_NAMES)// Landsat 8 //print(l8, 'Landsat 8') var l7 = ee.ImageCollection('LANDSAT/LE07/C01/T1_TOA').select(LC7_BANDS, STD_NAMES) //Landsat 7 //print(l7, 'Landsat 7') var l5 = ee.ImageCollection('LANDSAT/LT05/C01/T1_TOA').select(LC5_BANDS, STD_NAMES) //Landsat 5 //print(l5, 'Landsat 5') var images = ee.ImageCollection(l5.merge(l7).merge(l8));//.merge(l9) var table = ee.FeatureCollection("projects/ee-kawa/assets/kurdistan"), Map.addLayer(table); //var images = ee.ImageCollection('LANDSAT/LC08/C01/T1_TOA') .filterBounds(table) .filterDate('2019-04-01', '2019-05-01') .select('B4', 'B5', 'B2', 'B3'); print(images.size()); var nir = images.select('B5'); var red = images.select('B4'); var ndvi = nir; var clipnir = nir.filterBounds(table).mosaic().clip(table); var clipred = red.filterBounds(table).mosaic().clip(table); var msavi2imgmosaic = clipnir.multiply(2).add(1) .subtract(clipnir.multiply(2).add(1).pow(2) .subtract(clipnir.subtract(clipred).multiply(8)).sqrt() ).divide(2).rename("MSAVI2"); Map.addLayer(msavi2imgmosaic); Map.centerObject(table, 7); Export.image.toDrive({ image: msavi2imgmosaic, description: 'imageToDrive_year()', crs: 'EPSG:4326', scale: 30, maxPixels:200000000, region: table )}; |


References
- Tsatsaris, A.; Kalogeropoulos, K.; Stathopoulos, N.; Louka, P.; Tsanakas, K.; Tsesmelis, D.E.; Krassanakis, V.; Petropoulos, G.P.; Pappas, V.; Chalkias, C. Geoinformation Technologies in Support of Environmental Hazards Monitoring under Climate Change: An Extensive Review. ISPRS Int. J. Geo-Inf. 2021, 10, 94. [Google Scholar] [CrossRef]
- Bhaga, T.D.; Dube, T.; Shekede, M.D.; Shoko, C. Impacts of Climate Variability and Drought on Surface Water Resources in Sub-Saharan Africa Using Remote Sensing: A Review. Remote Sens. 2020, 12, 4184. [Google Scholar] [CrossRef]
- Gaznayee, H.A.A.; Al-Quraishi, A.M.F.; Al-Sulttani, A.H.A. Drought Spatiotemporal Characteristics Based on a Vegetation Condition Index in Erbil, Kurdistan Region, Iraq. Iraqi J. Sci. 2021, 62, 4545–4556. [Google Scholar] [CrossRef]
- Yang, F.; Wang, G.F.; Long, J.M.; Wang, B.L. Influence of Surface Energy on the Pull-in Instability of Electrostatic Nano-Switches. J. Comput. Theor. Nanosci. 2013, 10, 1273–1277. [Google Scholar] [CrossRef]
- Das, S.; Angadi, D.P. Land Use Land Cover Change Detection and Monitoring of Urban Growth Using Remote Sensing and GIS Techniques: A Micro-Level Study. GeoJournal 2022, 87, 2101–2123. [Google Scholar] [CrossRef]
- Martínez-Vilalta, J.; Lloret, F. Drought-Induced Vegetation Shifts in Terrestrial Ecosystems: The Key Role of Regeneration Dynamics. Glob. Planet. Change 2016, 144, 94–108. [Google Scholar] [CrossRef]
- Gaznayee, H.A.A.; Al-Quraishi, A.M.F.; Mahdi, K.; Ritsema, C. A Geospatial Approach for Analysis of Drought Impacts on Vegetation Cover and Land Surface Temperature in the Kurdistan Region of Iraq. Water 2022, 14, 927. [Google Scholar] [CrossRef]
- Al-Quraishi, A.M.F.; Negm, A.M. Environmental Remote Sensing and GIS in Iraq; Springer: Berlin/Heidelberg, Germany, 2020; ISBN 9783030213435. [Google Scholar]
- Zhao, S.; Cong, D.; He, K.; Yang, H.; Qin, Z. Spatial-Temporal Variation of Drought in China from 1982 to 2010 Based on a Modified Temperature Vegetation Drought Index (MTVDI). Sci. Rep. 2017, 7, 1–12. [Google Scholar] [CrossRef]
- Sharma, A. Spatial Data Mining for Drought Monitoring: An Approach Using Temporal NDVI and Rainfall Spatial Data Mining for Drought Monitoring: An Approach Using Temporal NDVI and Rainfall. MSc Thesis, University of Twente, Faculty of Geo-Information Sci, Enschede, The Netherlands, 2006. Unpublished. [Google Scholar]
- Habibi, M.; Babaeian, I.; Schöner, W. Changing Causes of Drought in the Urmia Lake Basin—Increasing Influence of Evaporation and Disappearing Snow Cover. Water 2021, 13, 3273. [Google Scholar] [CrossRef]
- Fan, Y.; Wang, L.; Su, T.; Lan, Q. Spring Drought as a Possible Cause for Disappearance of Native Metasequoia in Yunnan Province, China: Evidence from Seed Germination and Seedling Growth. Glob. Ecol. Conserv. 2020, 22, e00912. [Google Scholar] [CrossRef]
- Al-Quraishi, A.M.F.; Gaznayee, H.A.A.; Crespi, M. Drought Trend Analysis in a Semi-Arid Area of Iraq Based on Normalized Difference Vegetation Index, Normalized Difference Water Index and Standardized Precipitation Index. J. Arid Land 2021, 13, 413–430. [Google Scholar] [CrossRef]
- Gaznayee, H.A.A.; Al-Quraishi, A.M.F. Analysis of Agricultural Drought, Rainfall, and Crop Yield Relationships in Erbil Province, the Kurdistan Region of Iraq Based on Landsat Time-Series Msavi2. J. Adv. Res. Dyn. Control Syst. 2019, 11, 536–545. [Google Scholar] [CrossRef]
- Husain, Y. Monitoring and Calculating the Surface Area of Lakes in Northern Iraq. Appl. Res. J. 2016, 2, 54–62. [Google Scholar]
- Yaseen, A.; Mahmood, M.I.; Yaseen, G.; Ali, A.A. Area Change Monitoring of Dokan & Darbandikhan Iraqi Lakes Using Satellite Data. Sustain. Resour. Manag. J. 2018, 3, 1–16. [Google Scholar] [CrossRef]
- Anderson, M.C.; Zolin, C.A.; Sentelhas, P.C.; Hain, C.R.; Semmens, K.; Tugrul Yilmaz, M.; Gao, F.; Otkin, J.A.; Tetrault, R. The Evaporative Stress Index as an Indicator of Agricultural Drought in Brazil: An Assessment Based on Crop Yield Impacts. Remote Sens. Environ. 2016, 174, 82–99. [Google Scholar] [CrossRef]
- Samui, P.; Sitharam, T.G. Machine Learning Modelling for Predicting Soil Liquefaction Susceptibility. Nat. Hazards Earth Syst. Sci. 2011, 11, 1–9. [Google Scholar] [CrossRef]
- Wilhite, D. Breaking the Hydro-Illogical Cycle: Progress or Status Quo for Drought Management in the United States. Eur. Water 2011, 34, 5–18. [Google Scholar]
- Toma, J.J. Limnological Study of Dokan, Derbendikhan and Duhok Lakes, Kurdistan Region of Iraq. Open J. Ecol. 2013, 03, 23–29. [Google Scholar] [CrossRef]
- Abdullah, S.M.A. Parasitic Fauna of Some Freshwater Fishes from Darbandikhan Lake, North of Iraq. J. Dohuk Univ. 2016, 8, 29–35. [Google Scholar]
- Ahamed, A.; Bolten, J.; Doyle, C.; Fayne, J. Near Real-Time Flood Monitoring and Impact Assessment Systems Case Study: 2011 Flooding in Southeast Asia. Remote Sens. Hydrol. Extrem. 2017, 105–118. [Google Scholar] [CrossRef]
- Menon, D.K.; Bhavana, V. An Overview of Drought Evaluation and Monitoring Using Remote Sensing and GIS. Pdfs.Semant.org 2016, 3, 32–37. [Google Scholar]
- McKee, T.B. Drought Monitoring with Multiple Time Scales. In Proceedings of the Conference on Applied Climatology, Boston, MA, USA, 15–20 January 1995. [Google Scholar]
- Indexed, S.; Kadhim, K.N. Estimating of Consumptive Use of Water in Babylon Governorate-Iraq. Int. J. Civ. Eng. Technol. 2018, 9, 798–807. [Google Scholar] [CrossRef]
- Thomas, B.; McKee, N.J.D. Analysis of Standardized Precipitation Index (SPI) Data for Drought Assessment. In Proceedings of the Eighth Conference on Applied Climatology, Anaheim, CA, USA, 17–22 January 1993; Volume 26, pp. 1–72. [Google Scholar] [CrossRef]
- Arshad, S.; Morid, S.; Mobasheri, M.R.; Alikhani, M.A. Development of Agricultural Drought Risk Assessment Model for Kermanshah Province (Iran), Using Satellite Data and Intelligent Methods. In Proceedings of the: The First International Ionference on Drought Management, Zaragoza, Spain, 12–14 June 2008; 12, pp. 303–310. [Google Scholar]
- Salih, S.; Alzwainy, F. Microstructure Analysis and Residual Strength of Fiber Reinforced Eco-Friendly Self- Consolidating Concrete Subjected To. Glob. Planet. Change 2018, 144, 94–108. [Google Scholar]
- Gessner, U.; Machwitz, M.; Conrad, C.; Dech, S. Estimating the Fractional Cover of Growth Forms and Bare Surface in Savannas. A Multi-Resolution Approach Based on Regression Tree Ensembles. Remote Sens. Environ. 2013, 129, 90–102. [Google Scholar] [CrossRef] [Green Version]
- Baugh, W.M.; Groeneveld, D.P. Broadband Vegetation Index Performance Evaluated for a Low-Cover Environment. Int. J. Remote Sens. 2006, 27, 4715–4730. [Google Scholar] [CrossRef]
- Vanselow, K.A.; Samimi, C. Predictive Mapping of Dwarf Shrub Vegetation in an Arid High Mountain Ecosystem Using Remote Sensing and Random Forests. Remote Sens. 2014, 6, 6709–6726. [Google Scholar] [CrossRef]
- Saleh, A.M. Relationship Betweenvegetation Indicesof Landsat-7 ETM+, MSS Data and Some Soil Properties: Case Study of Baqubah, Diyala, Iraq. IOSR J. Agric. Vet. Sci. Ver. II 2015, 8, 2319–2372. [Google Scholar] [CrossRef]
- Keya, D.R. Building Models to Estimate Rainfall Erosivity Factor from Rainfall Depth in Iraqi Kurdistan Region. Ph.D. Thesis, Salahaddin University, Erbil, Iraq, 2020; pp. 1–3. [Google Scholar]
- Gaznayee, H.A.A. Modeling Spatio-Temporal Pattern of Drought Severity Using Meteorological Data and Geoinformatics Techniques for the Kurdistan Region of Iraq. Ph.D. Thesis, Salahaddin University, Erbil, Iraq, 2020; pp. 1–11. [Google Scholar]
- UNESCO Survey of Infiltration Karez in Northern Iraq. In History and Current Status of Underground Aqueducts A Report Prepared for UNESCO; A report prepared for UNESCO; Department of Geography, Oklahoma State University: Stillwater, OK, USA, 2009; p. 56.
- UNESCO Integrated Drought Risk Management–DRM Executive. In National Framework for Iraq, an Analysis Report, Technical Report, 2nd ed.; UNESCO Office: Jordan, Iraq, 2014; Available online: http://www.unesco.org/new/fileadmin/MULTIMEDIA/FIELD/Iraq/pdf/Publications/DRM.pdf (accessed on 28 May 2022).
- Al-Quraishi, A.M.F.; Mustafa, Y.T.; Negm, A.M. Environmental Degradation in Asia: Land Degradation, Environmental Contamination, and Human Activities; Springer: Cham, Switzerland, 2022; ISBN 978-3-031-12111-1. (In production) [Google Scholar]
- Eklund, L.; Persson, A.; Pilesjö, P. Cropland Changes in Times of Conflict, Reconstruction, and Economic Development in Iraqi Kurdistan. Ambio 2016, 45, 78–88. [Google Scholar] [CrossRef]
- Chander, G.; Markham, B.L.; Helder, D.L. Summary of Current Radiometric Calibration Coefficients for Landsat MSS, TM, ETM+, and EO-1 ALI Sensors. Remote Sens. Environ. 2009, 113, 893–903. [Google Scholar] [CrossRef]
- Wang, H.; Lin, H.; Liu, D. Remotely Sensed Drought Index and Its Responses to Meteorological Drought in Southwest China. Remote Sens. Lett. 2014, 5, 413–422. [Google Scholar] [CrossRef]
- Qi, J.; Kerr, Y.; Chehbouni, A. External Factor Consideration in Vegetation Index Development. In Proceedings of the 6th International Symposium on Physical Measurements and Signatures in Remote Sensing, ISPRS, Val d’Isère, France, 17–21 January 1994; pp. 723–730. [Google Scholar] [CrossRef]
- Ahmad, F. Spectral Vegetation Indices Performance Evaluated for Cholistan Desert. J. Geogr. Reg. Plan. 2012, 5, 165–172. [Google Scholar] [CrossRef]
- Jassim, M.A. TIN Model Extraction for Dukan Lake Bed Using HYPACK System. ZANCO J. Pure Appl. Sci. 2016, 27, 113–120. [Google Scholar]
- McFeeters, S.K. The Use of the Normalized Difference Water Index (NDWI) in the Delineation of Open Water Features. Int. J. Remote Sens. 1996, 17, 1425–1432. [Google Scholar] [CrossRef]
- Rajsekhar, D.; Singh, V.P.; Mishra, A.K. Multivariate Drought Index: An Information Theory Based Approach for Integrated Drought Assessment. J. Hydrol. 2015, 526, 164–182. [Google Scholar] [CrossRef]
- Mishra, A.K.; Desai, V.R.; Singh, V.P. Drought Forecasting Using a Hybrid Stochastic and Neural Network Model. J. Hydrol. Eng. 2007, 12, 626–638. [Google Scholar] [CrossRef]
- Mishra, A.K.; Desai, V.R. Drought Forecasting Using Stochastic Models. Stoch. Environ. Res. Risk Assess. 2005, 19, 326–339. [Google Scholar] [CrossRef]
- Feilhauer, H.; Schmid, T.; Faude, U.; Sánchez-Carrillo, S.; Cirujano, S. Are Remotely Sensed Traits Suitable for Ecological Analysis? A Case Study of Long-Term Drought Effects on Leaf Mass per Area of Wetland Vegetation. Ecol. Indic. 2018, 88, 232–240. [Google Scholar] [CrossRef]
- Saavedra, C. Estimating Spatial Patterns of Soil Erosion and Deposition in the Andean Region Using Geo-Information Techniques: A Case Study in Cochabamba, Bolivia; Wageningen University and Research: Wageningen, The Netherlands, 2005; ISBN 9798516031052. [Google Scholar]
- Curtis, A.; Byron, I.; MacKay, J. Integrating Socio-Economic and Biophysical Data To Underpin Collaborative Watershed Management 1. JAWRA J. Am. Water Resour. Assoc. 2005, 41, 549–563. [Google Scholar] [CrossRef]
- Thiébault, S.; Moatti, J.-P. The Mediterranean region under climate change: The 22nd Conference of the Parties to the United Nations Framework Convention on Climate Change. In Proceedings of the 22nd Conference of the Parties to the United Nations Framework Convention on Climate Change COP22, Morocco, Marrakech, 7–18 November 2016; Chapter 2. pp. 71–72, ISBN 978-2-7099-2219-7. [Google Scholar]
- Jaradat, A. Agriculture in Iraq: Resources, Potentials, Constraints, Research Needs and Priorities. Agriculture 2003, 1, 83. [Google Scholar]
- Båld, M. Water Scarcity & Migration: A Comparative Case Study of Egypt and Iraq. . Iraq’s Drought Crisis and the Damaging Effects on Communities “Our Source of Living Has Dried Up”. Master Thesis, Uppsala University, Uppsala, Sweden, 2022. [Google Scholar]
- Lucani, P.; Saade, M. Iraq Agriculture Sector Note. FAO Investment Centre. Food and Agriculture Organisation of the United Nations and the World Bank. Near East North Afr. Rep. 2012, 1–75. Available online: http://www.fao.org/3/a-i2877e (accessed on 28 May 2022).
- Abdullah, T.O.; Ali, S.S.; Al-Ansari, N.A.; Knutsson, S. Hydrogeochemical Evaluation of Groundwater and Its Suitability for Domestic Uses in Halabja Saidsadiq Basin, Iraq. Water 2019, 11, 11. [Google Scholar] [CrossRef]
- Al-Saady, Y.; Merkel, B.; Al-Tawash, B.; Al-Suhail, Q. Land Use and Land Cover (LULC) Mapping and Change Detection in the Little Zab River Basin (LZRB), Kurdistan Region, NE Iraq and NW Iran. FOG-Freib. Online Geosci. 2015, 43, 1–32. [Google Scholar]
- Talab, A.A. Evaluation of Some Irrigation Projects in Dukan Watershed as Controlling and Conservation of Water Resources; Iraqi Ministry of Water Resources: Baghdad, Iraqi, 2007. [Google Scholar]
- Gitz, V.; Meybeck, A.; Lipper, L.; Young, C.D.; Braatz, S. Climate Change and Food Security: Risks and Responses; Risks and Responses. Food Agric. Organ. United Nations Rep 2016, 110, 2–4, ISBN 978925108998. [Google Scholar]
- Mzuri, R.T.; Mustafa, Y.T.; Omar, A.A. Land Degradation Assessment Using AHP and GIS-Based Modelling in Duhok District, Kurdistan Region, Iraq. Geocarto Int. 2021, 36, 1–19. [Google Scholar] [CrossRef]
- Rahimzadeh-Bajgiran, P.; Omasa, K.; Shimizu, Y. Comparative Evaluation of the Vegetation Dryness Index (VDI), the Temperature Vegetation Dryness Index (TVDI) and the Improved TVDI (ITVDI) for Water Stress Detection in Semi-Arid Regions of Iran. ISPRS J. Photogramm. Remote Sens. 2012, 68, 1–12. [Google Scholar] [CrossRef]
- Hameed, M.; Ahmadalipour, A.; Moradkhani, H. Apprehensive Drought Characteristics over Iraq: Results of a Multidecadal Spatiotemporal Assessment. Geosciences 2018, 8, 58. [Google Scholar] [CrossRef]
- Fadhil, A.M. Land Degradation Detection Using Geo-Information technology for Some Sites in Iraq. J. Al-Nahrain Univ. Sci. 2009, 12, 94–108. [Google Scholar] [CrossRef]
- Fadhil, A.M. Drought Mapping Using Geoinformation Technology for Some Sites in the Iraqi Kurdistan Region. Int. J. Digit. Earth 2011, 4, 239–257. [Google Scholar] [CrossRef]
- Seeyan, S.; Merkel, B.; Abo, R. Investigation of the Relationship between Groundwater Level Fluctuation and Vegetation Cover by Using NDVI for Shaqlawa Basin, Kurdistan Region–Iraq. J. Geogr. Geol. 2014, 6, 187–202. [Google Scholar] [CrossRef]
- Saeed, M.A. Analysis of Climate and Drought Conditions in the Fedral. Int. Sci. J. Environ. Sci. 2012, 2, 953. [Google Scholar]
- Chakraborty, S.; Pandey, R.P.; Chaube, U.C.; Mishra, S.K. Trend and Variability Analysis of Rainfall Series at Seonath River Basin, Chhattisgarh (India). Int. J. Appl. Sci. Eng. Res. 2013, 2, 425–434. [Google Scholar] [CrossRef]
- Karim, T.H.; Talab, A.A.; Yaseen, A.; Mahmood, M.I.; Yaseen, G.; Ali, A.A.; Karim, T.H.; Keya, D.R.; Amin, Z.A.; Profile, S.E.E. Temporal and Spatial Variations in Annual Rainfall Distribution in Erbil Province. Outlook Agric. 2018, 3, 1–16. [Google Scholar] [CrossRef]
- Zakaria, S.; Mustafa, Y.T.; Mohammed, D.A.; Ali, S.S.; Al-Ansari, N.; Knutsson, S. Estimation of Annual Harvested Runoff at Sulaymaniyah Governorate, Kurdistan Region of Iraq. Nat. Sci. 2013, 5, 1272–1283. [Google Scholar] [CrossRef]
- Al-Shwani, F.M.A. Land Cover Change Detection in Erbil Governorate Using Remote Sensing Techniques. Master’s Thesis, Salahaddin University, Erbil, Iraq, 2009. [Google Scholar]
- Razvanchy, H.A.S. Modelling Some of the Soil Propertiesin the Iraqi Kurdistan Region Using Landsat Datasets and Spectroradiometer. Master’s Thesis, Salahaddin University, Erbil, Iraq, 2008. [Google Scholar]
- Bazzaz, A.O.H. Drought Monitoring Using Geoinformatics Techniques in Several Districts of Iraqi Kurdistan Region. Master’s Thesis, Salahadin Universty, Erbil, Iraq, 2016; pp. 1–68. [Google Scholar]
- Karavitis, C.A.; Alexandris, S.; Tsesmelis, D.E.; Athanasopoulos, G. Application of the Standardized Precipitation Index (SPI) in Greece. Water 2011, 3, 787–805. [Google Scholar] [CrossRef]


| SPI | Class |
|---|---|
| 2.0 or more | Extremely wet |
| 1.5 to 1.99 | Very wet |
| 1.0 to 1.49 | Moderately wet |
| 0.99 to −0.99 | Near normal |
| −1.0 to −1.49 | Moderate drought |
| −1.5 to −1.99 | Severe drought |
| −2.0 or less | Extreme drought |
| Class 1 | Class 2 | Class 3 | |||||||||||||
|---|---|---|---|---|---|---|---|---|---|---|---|---|---|---|---|
| Values <0.2 | Values 0.2−<0.6 | Values 0.6−1 | |||||||||||||
| Years | Max | Min. | Mean | Std. Dev. | Very Low MSAVI2 | Low to Moderately Low MSAVI2 | Moderately High to High MSAVI2 | Sparse and Non-Vegetation | Total Vegetative Cover | Total Study Area | |||||
| (km2) | (%) | (km2) | (%) | (km2) | (%) | (km2) | (km2) | (%) | (+ −%) | (km2) | |||||
| 1998 | 1.00 | 0.20 | 0.42 | 0.15 | 0.0 | 0.0 | 21,347.0 | 86.2 | 3411.3 | 13.7 | 25,506.1 | 24,758.3 | 49.2 | −5.8 | 50,350.6 |
| 1999 | 0.99 | 0.22 | 0.39 | 0.12 | 0.0 | 0.0 | 23,223.8 | 94.6 | 1336.6 | 5.4 | 25,695.5 | 24,560.5 | 48.8 | −6.2 | 50,350.6 |
| 2000 | 0.99 | 0.03 | 0.02 | 0.19 | 7865.6 | 42.9 | 9199.60 | 50.2 | 1274.5 | 6.9 | 31,917.9 | 18,339.6 | 36.4 | −18.5 | 50,350.6 |
| 2001 | 0.84 | 0.19 | 0.41 | 0.14 | 764.9 | 3.3 | 19,843.3 | 86.4 | 2362.8 | 10.2 | 27,289.9 | 22,971.0 | 45.6 | −9.3 | 50,350.6 |
| 2002 | 0.84 | 0.16 | 0.38 | 0.14 | 2906.1 | 10.5 | 22,677.0 | 81.9 | 2111.8 | 7.6 | 22,563.3 | 27,694.9 | 55.0 | 0.0 | 50,350.6 |
| 2003 | 0.84 | 0.13 | 0.38 | 0.15 | 3769.2 | 13.8 | 21,276.2 | 77.7 | 2352.8 | 8.6 | 22,861.1 | 27,398.1 | 54.4 | −0.6 | 50,350.6 |
| 2004 | 0.84 | 0.10 | 0.35 | 0.15 | 5542.4 | 19.2 | 22,003.7 | 76.2 | 1337.6 | 4.6 | 21,371.6 | 28,883.7 | 57.4 | 2.4 | 50,350.6 |
| 2005 | 0.84 | 0.14 | 0.34 | 0.13 | 3813.5 | 15.7 | 19,858.4 | 81.7 | 647.9 | 2.7 | 25,933.4 | 24,319.8 | 48.3 | −6.7 | 50,350.6 |
| 2006 | 0.88 | 0.09 | 0.36 | 0.17 | 5834.1 | 22.6 | 17,734.6 | 68.8 | 2190.5 | 8.5 | 24,499.9 | 25,759.2 | 51.2 | −3.8 | 50,350.6 |
| 2007 | 0.84 | 0.21 | 0.44 | 0.13 | 0.00 | 0.0 | 26,028.6 | 88.5 | 3388.6 | 11.5 | 20,844.9 | 29,417.2 | 58.4 | 3.5 | 50,350.6 |
| 2008 | 0.78 | 0.05 | 0.23 | 0.13 | 10,018 | 50.0 | 9856.50 | 49.2 | 154.60 | 0.8 | 30,222.3 | 20,029.1 | 39.8 | −15.2 | 50,350.6 |
| 2009 | 0.92 | 0.15 | 0.39 | 0.14 | 2348.8 | 9.4 | 20,656.6 | 82.5 | 2030.0 | 8.1 | 25,223.3 | 25,035.4 | 49.7 | −5.2 | 50,350.6 |
| 2010 | 0.84 | 0.23 | 0.43 | 0.12 | 0.00 | 0.0 | 25,131.1 | 89.2 | 3034.1 | 10.7 | 22,096.2 | 28,165.1 | 55.9 | 1.0 | 50,350.6 |
| 2011 | 0.86 | 0.15 | 0.36 | 0.15 | 3540.8 | 14.7 | 18,352.7 | 76.1 | 2217.4 | 9.2 | 26,148.9 | 24,110.9 | 47.9 | −7.1 | 50,350.6 |
| 2012 | 0.84 | 0.10 | 0.35 | 0.15 | 4391.9 | 18.9 | 17,575.1 | 75.5 | 1324.5 | 5.7 | 26,964.8 | 23,291.5 | 46.3 | −8.7 | 50,350.6 |
| 2013 | 0.77 | 0.28 | 0.44 | 0.10 | 0.0 | 0.0 | 26,300.6 | 93.3 | 1880.4 | 6.7 | 22,076.3 | 28,181.0 | 56.0 | 1.0 | 50,350.6 |
| 2014 | 0.77 | 0.30 | 0.45 | 0.09 | 0.0 | 0.0 | 29,578.3 | 93.2 | 2161.0 | 6.8 | 18,518.1 | 31,739.3 | 63.0 | 8.1 | 50,350.6 |
| 2015 | 0.78 | 0.29 | 0.46 | 0.10 | 0.0 | 0.0 | 30,243.0 | 91.6 | 2787.5 | 8.4 | 17,228.6 | 33,030.4 | 65.6 | 10.6 | 50,350.6 |
| 2016 | 0.84 | 0.30 | 0.46 | 0.09 | 0.0 | 0.0 | 29,637.6 | 92.2 | 2498.5 | 7.8 | 18,122.3 | 32,136.1 | 63.8 | 8.9 | 50,350.6 |
| 2017 | 0.78 | 0.30 | 0.44 | 0.09 | 0.0 | 0.0 | 26,111.7 | 96.7 | 896.8 | 3.3 | 23,245.4 | 27,008.5 | 53.6 | −1.3 | 50,350.6 |
| 2018 | 0.90 | 0.20 | 0.30 | 0.28 | 10,529.2 | 32.8 | 15,936.6 | 49.7 | 5593.3 | 17.4 | 18,291.5 | 32,059.1 | 63.7 | 8.7 | 50,350.6 |
| 2019 | 0.93 | 0.20 | 0.36 | 0.16 | 9501.9 | 22.6 | 20,926.6 | 49.9 | 11,547.8 | 27.5 | 8374.3 | 41,976.3 | 83.4 | 28.4 | 50,350.6 |
| 2020 | 0.99 | 0.10 | 0.30 | 0.14 | 10,998.5 | 28.0 | 20,420.2 | 51.9 | 7920.5 | 20.1 | 11,011.4 | 39,339.2 | 78.1 | 23.2 | 50,350.6 |
| 2021 | 0.90 | 0.10 | 0.25 | 0.12 | 10,772.9 | 44.9 | 10,707.3 | 44.6 | 2535.9 | 10.6 | 26,334.5 | 24,016.1 | 47.7 | −7.3 | 50,350.6 |
| Time, Year | (LD) Area (km2) | Area Ave. | % (+ −) |
|---|---|---|---|
| 1998 | 258 | 195 | 62 |
| 1999 | 140 | 195 | −55 |
| 2000 | 137 | 195 | −58 |
| 2001 | 185 | 195 | −10 |
| 2002 | 225 | 195 | 30 |
| 2003 | 267 | 195 | 72 |
| 2004 | 254 | 195 | 59 |
| 2005 | 238 | 195 | 43 |
| 2006 | 216 | 195 | 21 |
| 2007 | 189 | 195 | −6 |
| 2008 | 135 | 195 | −60 |
| 2009 | 125 | 195 | −70 |
| 2010 | 159 | 195 | −37 |
| 2011 | 137 | 195 | −59 |
| 2012 | 170 | 195 | −26 |
| 2013 | 200 | 195 | 5 |
| 2014 | 158 | 195 | −37 |
| 2015 | 149 | 195 | −46 |
| 2016 | 229 | 195 | 33 |
| 2017 | 224 | 195 | 28 |
| 2018 | 207 | 195 | 12 |
| 2019 | 282 | 195 | 87 |
| 2020 | 220 | 195 | 25 |
| 2021 | 185 | 195 | −10 |
| SPI Class | Extremely Wet | Very Wet | Moderately Wet | Near Normal | Moderate Drought | Severe Drought | Extreme Drought | |
|---|---|---|---|---|---|---|---|---|
| Station No. | Station Name | 2.00 or More | 1.50 to 1.99 | 1.00 to 1.49 | 0.99 to −0.99 | −1.00 to −1.49 | −1.50 to −1.99 | −2 or Less |
| Erbil | ||||||||
| 1 | Erbil | 0 | 2 | 1 | 16 | 2 | 1 | 2 |
| 2 | Qushtapa | 0 | 1 | 1 | 18 | 1 | 1 | 2 |
| 3 | Khabat | 1 | 0 | 3 | 15 | 3 | 1 | 1 |
| 4 | Bnaslawa | 0 | 1 | 3 | 17 | 1 | 1 | 1 |
| 5 | Harir | 0 | 1 | 4 | 16 | 1 | 2 | 0 |
| 6 | Soran | 0 | 0 | 7 | 14 | 1 | 2 | 0 |
| 7 | Shaqlawa | 0 | 2 | 1 | 17 | 2 | 2 | 0 |
| 8 | Khalifan | 0 | 1 | 4 | 16 | 1 | 0 | 2 |
| 9 | Choman | 0 | 1 | 3 | 17 | 1 | 1 | 1 |
| 10 | Sidakan | 0 | 1 | 3 | 16 | 1 | 2 | 1 |
| 11 | Rwanduz | 0 | 0 | 6 | 13 | 4 | 0 | 1 |
| 12 | Mergasur | 0 | 1 | 3 | 17 | 1 | 0 | 2 |
| 13 | Dibaga | 1 | 2 | 4 | 12 | 3 | 2 | 0 |
| 14 | Gwer | 1 | 2 | 1 | 14 | 5 | 1 | 0 |
| 15 | Barzewa | 1 | 0 | 0 | 20 | 2 | 1 | 0 |
| 16 | Bastora | 0 | 1 | 3 | 18 | 0 | 0 | 2 |
| 17 | Makhmor | 0 | 2 | 3 | 15 | 3 | 0 | 1 |
| 18 | Koya | 0 | 2 | 2 | 17 | 1 | 1 | 1 |
| 19 | Taqtaq | 0 | 2 | 1 | 16 | 3 | 0 | 2 |
| 20 | Shamamk | 2 | 0 | 3 | 15 | 2 | 1 | 1 |
| Duhok | ||||||||
| 21 | Duhok | 2 | 2 | 9 | 7 | 4 | 0 | 0 |
| 22 | Semel | 1 | 1 | 13 | 6 | 1 | 2 | 0 |
| 23 | Zakho | 2 | 1 | 11 | 7 | 1 | 2 | 0 |
| 24 | Batel | 1 | 3 | 9 | 8 | 2 | 1 | 0 |
| 25 | Dam-DU | 2 | 1 | 9 | 9 | 3 | 0 | 0 |
| 26 | Darkar.H | 1 | 4 | 7 | 10 | 2 | 0 | 0 |
| 27 | Zaxo-A.S | 2 | 0 | 12 | 7 | 2 | 1 | 0 |
| 28 | Batifa | 1 | 2 | 11 | 8 | 0 | 2 | 0 |
| 29 | Kani Masi | 1 | 2 | 10 | 8 | 3 | 0 | 0 |
| 30 | Zaweta | 2 | 2 | 10 | 7 | 2 | 1 | 0 |
| 31 | Mangish | 1 | 3 | 9 | 10 | 0 | 1 | 0 |
| 32 | Deraluke | 0 | 4 | 8 | 10 | 0 | 2 | 0 |
| 33 | Akre | 1 | 3 | 10 | 7 | 3 | 0 | 0 |
| 34 | Amadia | 1 | 3 | 8 | 11 | 0 | 1 | 0 |
| 35 | Sarsink | 1 | 2 | 12 | 8 | 0 | 1 | 0 |
| 36 | Bamarni | 0 | 5 | 8 | 9 | 2 | 0 | 0 |
| 37 | Bardarash | 2 | 3 | 7 | 8 | 4 | 0 | 0 |
| 38 | Qasrok | 1 | 2 | 11 | 8 | 2 | 0 | 0 |
| Sulaimaniyah | ||||||||
| 39 | SU | 0 | 2 | 3 | 15 | 3 | 0 | 1 |
| 40 | Bazian | 0 | 0 | 5 | 16 | 1 | 1 | 1 |
| 41 | Halabja | 0 | 1 | 4 | 15 | 1 | 2 | 1 |
| 42 | Penjwen | 0 | 1 | 2 | 18 | 1 | 0 | 2 |
| 43 | Chwarta | 0 | 0 | 6 | 14 | 2 | 2 | 0 |
| 44 | Dukan | 0 | 2 | 3 | 15 | 2 | 1 | 1 |
| 45 | Qaladiza | 0 | 2 | 3 | 16 | 0 | 2 | 1 |
| 46 | Rania | 0 | 1 | 4 | 15 | 2 | 2 | 0 |
| 47 | Said Sadiq | 1 | 2 | 1 | 15 | 4 | 1 | 0 |
| 48 | Qaradagh | 0 | 2 | 0 | 18 | 3 | 0 | 1 |
| 49 | Arbat | 1 | 1 | 3 | 16 | 1 | 1 | 1 |
| 50 | K-Panka | 0 | 1 | 4 | 15 | 2 | 2 | 0 |
| 51 | Byara | 0 | 1 | 3 | 17 | 1 | 2 | 0 |
| 52 | Mawat | 0 | 2 | 2 | 15 | 3 | 1 | 1 |
| 53 | Dar-Dikhan | 1 | 1 | 3 | 14 | 3 | 2 | 0 |
| 54 | Chamchamal | 0 | 2 | 2 | 15 | 3 | 1 | 1 |
| 55 | Kalar | 2 | 1 | 2 | 17 | 0 | 1 | 1 |
| 56 | Agjalar | 0 | 1 | 4 | 16 | 3 | 0 | 0 |
| 57 | Bngrd | 0 | 1 | 4 | 14 | 3 | 1 | 1 |
| 58 | Sangaw | 1 | 0 | 4 | 15 | 2 | 1 | 1 |
| 59 | Bawanor | 2 | 0 | 1 | 17 | 3 | 0 | 1 |
| 60 | Kifri | 1 | 1 | 2 | 17 | 3 | 0 | 0 |
| Station No. | Geographical Coordinates | Record (Years) | Maximum Rainfall (mm) | Minimum Rainfall (mm) | Average (Annual Rainfall) (mm) | Standard Deviation | Coefficient of VariationCV | |
|---|---|---|---|---|---|---|---|---|
| Longit | Latitude | |||||||
| Erbil | ||||||||
| 1 | 44.009 | 36.191 | 24 | 645.6 | 114.2 | 337.3 | 125.4 | 37.2 |
| 2 | 44.028 | 36.001 | 24 | 681.5 | 106.1 | 301.3 | 132.2 | 43.9 |
| 3 | 43.674 | 36.273 | 24 | 733.0 | 125.7 | 317.0 | 122.9 | 38.8 |
| 4 | 44.140 | 36.154 | 24 | 694.1 | 118.0 | 338.9 | 131.6 | 38.8 |
| 5 | 44.365 | 36.551 | 24 | 1042.1 | 264.5 | 576.8 | 188.0 | 32.6 |
| 6 | 44.561 | 36.638 | 24 | 963.3 | 290.5 | 647.2 | 193.6 | 29.9 |
| 7 | 43.985 | 36.209 | 24 | 1295.5 | 360.5 | 762.9 | 241.9 | 31.7 |
| 8 | 44.404 | 36.599 | 24 | 1241.3 | 263.6 | 699.3 | 235.3 | 33.6 |
| 9 | 44.889 | 36.637 | 24 | 1131.0 | 271.3 | 750.8 | 221.9 | 29.6 |
| 10 | 44.671 | 36.797 | 24 | 1173.0 | 463.7 | 835.3 | 192.6 | 23.1 |
| 11 | 44.525 | 36.612 | 24 | 1012.4 | 342.4 | 719.6 | 188.0 | 26.1 |
| 12 | 44.306 | 36.838 | 24 | 2111.1 | 624.7 | 1370.3 | 392.9 | 28.7 |
| 13 | 43.805 | 35.873 | 24 | 663.9 | 94.0 | 267.5 | 125.0 | 46.7 |
| 14 | 43.481 | 36.045 | 24 | 601.6 | 93.0 | 256.6 | 132.2 | 51.5 |
| 15 | 44.633 | 36.627 | 24 | 1889.0 | 284.2 | 722.9 | 309.3 | 42.8 |
| 16 | 44.160 | 36.339 | 24 | 870.4 | 139.7 | 436.8 | 169.1 | 38.7 |
| 17 | 43.583 | 35.783 | 24 | 530.3 | 92.0 | 244.3 | 103.4 | 42.3 |
| 18 | 44.648 | 36.099 | 24 | 1047.6 | 216.8 | 501.8 | 184.1 | 36.7 |
| 19 | 44.586 | 35.887 | 24 | 677.6 | 154.9 | 386.2 | 126.7 | 32.8 |
| 20 | 43.847 | 36.040 | 24 | 746.4 | 91.0 | 297.4 | 142.9 | 48.1 |
| Duhok | ||||||||
| 21 | 42.979 | 36.868 | 24 | 1120.0 | 217.2 | 531.0 | 210.0 | 39.6 |
| 22 | 42.854 | 36.873 | 24 | 995.0 | 142.7 | 455.5 | 172.9 | 38.0 |
| 23 | 42.682 | 37.144 | 24 | 1165.4 | 232.5 | 557.9 | 193.8 | 34.7 |
| 24 | 42.722 | 36.959 | 24 | 1004.0 | 157.4 | 472.2 | 167.4 | 35.5 |
| 25 | 43.003 | 36.876 | 24 | 1135.0 | 233.1 | 550.0 | 202.9 | 36.9 |
| 26 | 42.823 | 37.199 | 24 | 1187.0 | 242.0 | 540.4 | 210.7 | 39.0 |
| 27 | 42.659 | 37.160 | 24 | 1165.4 | 247.8 | 554.0 | 194.1 | 35.0 |
| 28 | 43.013 | 37.184 | 24 | 1705.5 | 257.2 | 724.8 | 288.1 | 39.7 |
| 29 | 43.441 | 37.229 | 24 | 1688.0 | 269.5 | 798.2 | 350.8 | 44.0 |
| 30 | 43.143 | 36.906 | 24 | 1768.6 | 280.1 | 788.7 | 319.2 | 40.5 |
| 31 | 43.093 | 37.035 | 24 | 1657.0 | 175.4 | 699.3 | 309.5 | 44.3 |
| 32 | 43.649 | 37.059 | 24 | 1867.0 | 286.8 | 830.1 | 344.3 | 41.5 |
| 33 | 43.893 | 36.741 | 24 | 1425.8 | 274.9 | 644.7 | 246.4 | 38.2 |
| 34 | 43.487 | 37.093 | 24 | 1650.0 | 349.4 | 800.4 | 286.6 | 35.8 |
| 35 | 43.350 | 37.050 | 24 | 2015.0 | 219.2 | 918.0 | 393.4 | 42.9 |
| 36 | 43.269 | 37.115 | 24 | 1677.5 | 316.4 | 774.6 | 316.2 | 40.8 |
| 37 | 43.589 | 36.508 | 24 | 1014.6 | 187.1 | 427.2 | 179.4 | 42.0 |
| 38 | 43.598 | 36.701 | 24 | 1262.5 | 201.8 | 543.9 | 222.2 | 40.8 |
| Sulaimaniyah | ||||||||
| 39 | 45.436 | 35.557 | 24 | 1147.5 | 230.2 | 627.7 | 219.5 | 35.0 |
| 40 | 45.140 | 35.589 | 24 | 1209.8 | 201.6 | 652.9 | 246.5 | 37.8 |
| 41 | 45.974 | 35.186 | 24 | 1081.4 | 295.4 | 658.1 | 215.2 | 32.7 |
| 42 | 45.941 | 35.620 | 24 | 1873.4 | 384.0 | 1017.6 | 341.3 | 33.5 |
| 43 | 45.575 | 35.720 | 24 | 1212.5 | 355.4 | 741.4 | 220.8 | 29.8 |
| 44 | 44.953 | 35.954 | 24 | 1058.2 | 224.6 | 599.5 | 217.7 | 36.3 |
| 45 | 45.133 | 36.176 | 24 | 1374.5 | 271.2 | 723.1 | 257.6 | 35.6 |
| 46 | 44.886 | 36.239 | 24 | 1618.4 | 307.4 | 768.6 | 293.4 | 38.2 |
| 47 | 45.853 | 35.344 | 24 | 1159.9 | 265.0 | 575.8 | 217.3 | 37.7 |
| 48 | 45.390 | 35.309 | 24 | 1727.5 | 103.6 | 798.0 | 350.7 | 44.0 |
| 49 | 45.587 | 35.425 | 24 | 1029.7 | 184.3 | 525.0 | 193.4 | 36.8 |
| 50 | 45.705 | 35.385 | 24 | 1275.0 | 205.4 | 558.3 | 239.4 | 42.9 |
| 51 | 46.116 | 35.225 | 24 | 1300.7 | 285.5 | 700.6 | 246.4 | 35.2 |
| 52 | 45.410 | 35.901 | 24 | 1296.6 | 326.2 | 746.6 | 238.9 | 32.0 |
| 53 | 44.787 | 36.210 | 24 | 1338.6 | 218.1 | 592.1 | 249.8 | 42.2 |
| 54 | 45.686 | 35.116 | 24 | 914.3 | 148.9 | 459.8 | 175.7 | 38.2 |
| 55 | 44.833 | 35.533 | 24 | 681.8 | 106.3 | 320.4 | 121.7 | 38.0 |
| 56 | 44.897 | 35.748 | 24 | 805.0 | 125.0 | 418.6 | 156.5 | 37.4 |
| 57 | 45.030 | 36.066 | 24 | 1213.5 | 241.4 | 695.9 | 241.5 | 34.7 |
| 58 | 45.182 | 35.286 | 24 | 1089.0 | 144.4 | 499.1 | 214.5 | 43.0 |
| 59 | 45.509 | 34.823 | 24 | 900.0 | 139.1 | 389.9 | 175.3 | 45.0 |
| 60 | 44.966 | 34.683 | 24 | 868.8 | 134.3 | 293.1 | 166.2 | 56.7 |
| Crop Area (km2) | (LD) Area (km2) | MSAVI2 (km2) | SPI | MSAVI2 (Mean) | Precipitation (mm) | Crop Yield (Ton)/Year | |
|---|---|---|---|---|---|---|---|
| Crop Area (km2) | 1 | −0.05 | 0.37 | 0.28 | 0.35 | 0.28 | 0.71 ** |
| (LD) Area (km2) | −0.05 | 1 | 0.33 | 0.68 ** | 0.22 | 0.69 ** | 0.05 |
| MSAVI2 Area(km2) | 0.37 | 0.33 | 1 | 0.69 ** | 0.78 ** | 0.68 ** | 0.73 ** |
| SPI | 0.281 | 0.68 ** | 0.69 ** | 1 | 0.53 * | 0.995 ** | 0.42 |
| MSAVI2 (Mean Value) | 0.35 | 0.22 | 0.77 ** | 0.53 * | 1 | 0.51* | 0.61 ** |
| Precipitation (mm) | 0.28 | 0.69 ** | 0.68 ** | 0.995 ** | 0.51 * | 1 | 0.39 |
| Crop Yield (Ton)/Year | 0.71 ** | 0.05 | 0.73 ** | 0.42 | 0.61 ** | 0.39 | 1 |
Publisher’s Note: MDPI stays neutral with regard to jurisdictional claims in published maps and institutional affiliations. |
© 2022 by the authors. Licensee MDPI, Basel, Switzerland. This article is an open access article distributed under the terms and conditions of the Creative Commons Attribution (CC BY) license (https://creativecommons.org/licenses/by/4.0/).
Share and Cite
Gaznayee, H.A.A.; Al-Quraishi, A.M.F.; Mahdi, K.; Messina, J.P.; Zaki, S.H.; Razvanchy, H.A.S.; Hakzi, K.; Huebner, L.; Ababakr, S.H.; Riksen, M.; et al. Drought Severity and Frequency Analysis Aided by Spectral and Meteorological Indices in the Kurdistan Region of Iraq. Water 2022, 14, 3024. https://doi.org/10.3390/w14193024
Gaznayee HAA, Al-Quraishi AMF, Mahdi K, Messina JP, Zaki SH, Razvanchy HAS, Hakzi K, Huebner L, Ababakr SH, Riksen M, et al. Drought Severity and Frequency Analysis Aided by Spectral and Meteorological Indices in the Kurdistan Region of Iraq. Water. 2022; 14(19):3024. https://doi.org/10.3390/w14193024
Chicago/Turabian StyleGaznayee, Heman Abdulkhaleq A., Ayad M. Fadhil Al-Quraishi, Karrar Mahdi, Joseph P. Messina, Sara H. Zaki, Hawar Abdulrzaq S. Razvanchy, Kawa Hakzi, Lorenz Huebner, Snoor H. Ababakr, Michel Riksen, and et al. 2022. "Drought Severity and Frequency Analysis Aided by Spectral and Meteorological Indices in the Kurdistan Region of Iraq" Water 14, no. 19: 3024. https://doi.org/10.3390/w14193024