Article

Impact of Environmental Conditions and Seasonality on Ecosystem Transpiration and Evapotranspiration Partitioning (T/ET Ratio) of Pure European Beech Forest

1
Department of Matter and Energy Fluxes, Global Change Research Institute, Czech Academy of Sciences, 60200 Brno, Czech Republic
2
Institute of Meteorology and Climate Research—Atmospheric Environmental Research, Karlsruhe Institute of Technology KIT, 82470 Garmisch-Partenkirchen, Germany
3
Department of Vegetation Ecology, Institute of Botany, Czech Academy of Sciences, 60200 Brno, Czech Republic
*
Author to whom correspondence should be addressed.
Water 2022, 14(19), 3015; https://doi.org/10.3390/w14193015
Submission received: 23 August 2022 / Revised: 20 September 2022 / Accepted: 22 September 2022 / Published: 25 September 2022
(This article belongs to the Special Issue Advances in Forest Hydrology and Biogeochemistry)

Abstract

:
Partitioning of evapotranspiration (ET) into transpiration (T) and residual evaporation (E) is a challenging but important task in order to assess the dynamics of increasingly scarce water resources in forest ecosystems. The T/ET ratio has been linked to the ecosystem water use efficiency of temperate forests, and thus is an important index for understanding utilization of water resources under global climate change. We used concurrent sap flow and eddy-covariance measurements to quantify the ET partitioning in pure European beech forest during the 2019–2020 period. The sap flow data were upscaled to stand level T and combined with stand level ET to calculate the T/ET ratio. We analysed intra-annual dynamics, the effect of seasonality and the impact of meteorological conditions on T, ET and T/ET. Annual T/ET of a pure European beech ecosystem was 0.48, falling at the lower end of reported global T/ET values for forest ecosystems. T/ET showed significant seasonal differences throughout spring (T/ET = 0.28), summer (T/ET = 0.62) and autumn (T/ET = 0.35). Air temperature (R2 = 0.45–0.63), VPD (R2 = 0.47–0.6) and PAR (R2 = 0.32–0.63) affected the daily dynamics of T, ET and T/ET; however, soil water content (SWC) had no significant effect. Mature European beech trees showed more anisohydric behaviour and relatively stable T/ET, even under decreasing SWC. The results improve the understanding of ecosystem scale T, ET and T/ET intra-annual dynamics and environmental constraints in anisohydric mature European beech.

1. Introduction

Evapotranspiration (ET) is a major variable of terrestrial water cycle. It consists mainly of transpiration (T) via the stomata of plants, evaporation from the soil, and evaporation of water intercepted by the plant canopy and litter layer [1,2]. Determining the contribution of T to ET (hereafter T/ET) is a challenging task but necessary for understanding the response of ecosystem water balance under climate change [3,4,5]. A growing awareness of the importance of ecohydrology has motivated efforts to partition ET into its components, as a key to unravelling processes underlying ecosystem water use and its response to climate change [6,7]. Whereas evaporation is controlled by meteorological conditions, T is mainly controlled by stomatal conductance that relates to plant physiology and can be affected by abiotic environmental conditions [8], but also by plant species interactions [9,10], atmospheric CO2 concentration [11] and nutrient availability [12].
Currently occurring global climate change (GCC) is driven mostly by rapid increase of atmospheric CO2 concentration linked mainly to anthropogenic factors [13]. As atmospheric CO2 concentration increases, plants reduce the opening of their stomata, thereby reducing T rates [14]. This reduction in plant T leads to weaker evaporative cooling, and this can exacerbate the increase in leaf surface temperatures [15,16,17]. Warmer and dryer climatic conditions can also lead to earlier leaf senescence, thus further reducing plant T [18,19,20]. On the other hand, numerous recent studies report higher transpiration due to GCC, despite the lower stomatal conductance, due to higher evaporative demand, and conclude that the predictions of future global transpiration dynamics are highly uncertain [21,22,23,24]. Because the T process correlates with plant growth and the carbon cycle [25,26,27,28], quantitative estimation of T contribution to ET has long been acknowledged to play a crucial role in water resource management, ecosystem productivity estimation and the ecosystem water use efficiency, from the regional to global scale [7,29,30]. Several sap flow methods have been developed in order to characterize T fluxes at the tree scale, which can be then scaled up to the stand level [31,32,33]. Other recent methods for ET partitioning include stable isotopic composition of water [34], T/ET ratio based on solar-induced chlorophyll fluorescence [35] and modelling approaches [3].
Previous studies show that the ecosystem T/ET ratio varies greatly among ecosystems and timescales; however, on an annual basis, it is mostly in the range of 40–70% [36,37,38,39]. This range of ratios emphasizes that even in water-limited environments, plants do not use all of the precipitation input, and major water losses occur, mainly through soil evaporation and runoff [40,41]. One of the main constraining parameters of T/ET is the leaf area index (LAI), often used for T/ET partitioning estimates [3,5,42]. The T/ET variation can be also explained by abiotic factors, where T/ET generally decreases with higher aridity and lower precipitation, and increases with latitude [36,43]. The T/ET ratio increases at the ecosystem scale with greater depth of water uptake, as well as for soils with better infiltration regimes than more impermeable soils [44,45,46]. Drought induces a reduction of T in plants due to increasing water potential which leads to stomatal closure, which contributes to a lower T/ET ratio [47]. Oppositely, mature European beech has been characterized as a strongly anisohydric species, keeping its stomata open for a longer period under drought conditions [48,49]. Anisohydric behaviour would then promote maintenance of high T/ET values even under increasing aridity. Raising the global temperature and increasing aridity may drive a further increase of T/ET of European beech forests [50]. The T/ET ratio is highly positively correlated with ecosystem water use efficiency (WUE) across temperate and subtropical forests [51]. Quantifying T/ET is key to predicting ecosystem survival and productivity, especially in water-limited regions [6]. This is extremely important in light of the drying and warming trends predicted for the near future under GCC.
Although widely studied and vastly important, ET partitioning variability is still subject to great debate [52,53]. In recent years, a number of studies have been conducted to explore global-scale ET and its partitioning in a changing environment. Jasechko et al. [54] used the distinct isotope effects of T and evaporation (E) to show that T is by far the largest water flux from the Earth’s continents, representing 80–90% of terrestrial ET. Coenders-Gerrits et al. [55] revised the input data in the modelling of Jasechko et al. [54] and proposed a more conservative ratio of T to ET (T/ET), i.e., 35–80%. At the plot scale, T/ET values estimated from scaled sap flow can be 15% lower than those estimated by the isotope approach [56]. Wei et al. [57] also reported 10–20% T/ET differences between estimations using isotopes and estimations using a two-source ET model simulation. Most recent studies reported a global mean terrestrial T/ET ratio around 0.6 [36,41]. It also seems that GCC is promoting an increasing trend of T/ET due to a rise in vegetation transpiration over the semiarid and subhumid grasslands, croplands and forestlands under the influence of prolonged growing seasons and increasing temperatures [58,59].
Understanding of T/ET dynamics is crucial for the correct modelling of forest water fluxes and water use efficiency assessments. Accurate ecohydrological modelling is a base for the proper decision making of foresters, stakeholders and policy makers. The objective of this study was, first, to define the intra-annual dynamics of T, ET and T/ET, and test the influence of seasonality in the 2019–2020 period. Second, we aimed to identify the main environmental factors which are affecting T, ET and T/ET, especially the impact of soil water content to characterize if European beech shows isohydric or anisohydric behaviour.

2. Materials and Methods

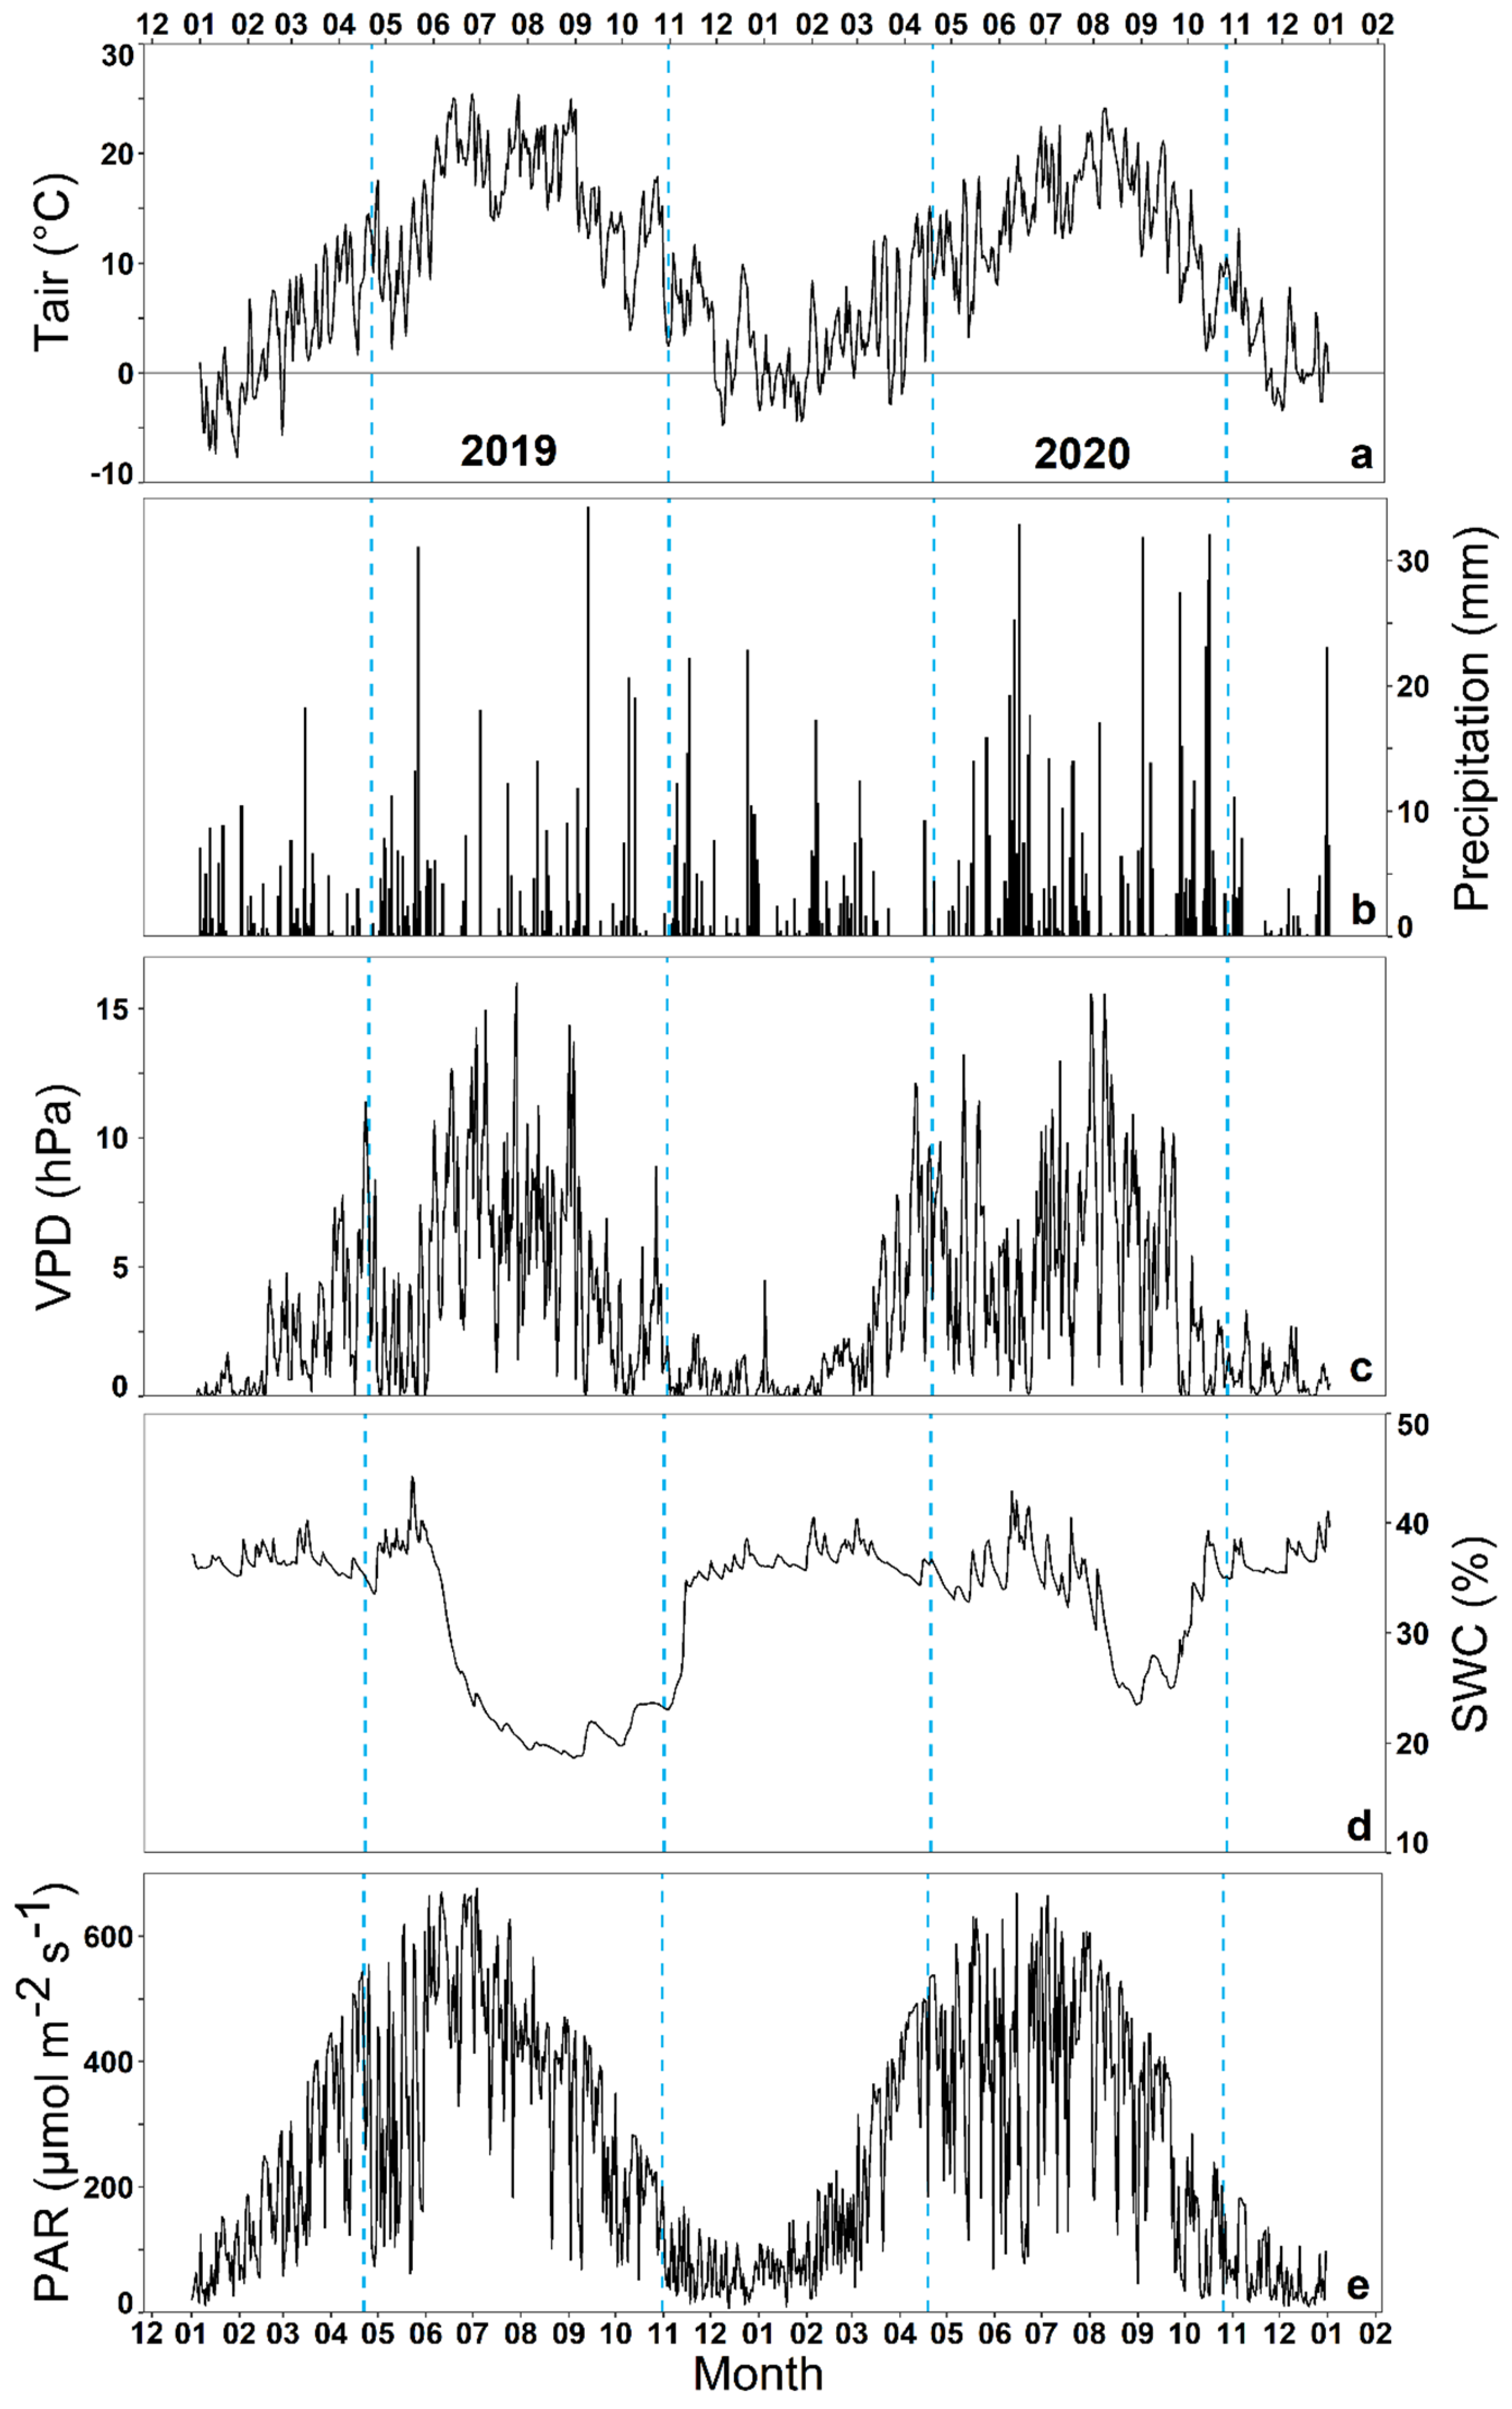
2.1. Site Information

The site is a managed even-aged mature European beech stand, approximately 110 years old, at 49°02″10 N and 17°58″12 E in the Czech Republic at 550 m a.s.l. The annual average air temperature of the site was 8.5 °C and the average annual precipitation sum was 762 mm during the 2010–2020 period. The stand average diameter at breast height (DBH) was 37.64 cm, average height was 31 m and cumulative basal area was 48.16 m2. The site is located at 10° slope with west-south-west exposition. The main soil type of the site is Eutric Cambisol with a shallow soil depth of 0.6–0.7 m. Most of the soil at this site is covered by thick layer of European beech leaf fall. The site is part of the CzeCOS, information available online: http://www.czecos.cz (accessed on 22 August 2022) network of eddy-covariance towers spread across Czech Republic and part of the FLUXNET network, information available online: https://www.icos-cp.eu/data-products/2G60-ZHAK (accessed on 22 August 2022).

2.2. Energy Balance

The net radiation (Rn) incident on a surface is equal to the downwelling short-wave (K↓) and long-wave (L↓) radiation minus the upwelling short-wave (K↑) and long-wave (L↑) radiation. The net radiation represents the amount of radiation energy captured or released by the ecosystem. The captured radiation energy is partitioned into different energy fluxes, which can be described using the surface energy balance equation (in W m−2):
R n = H + L E + G + J
where H is the energy transferred between the surface and the atmosphere as sensible heat, LE is the energy flux associated with evapotranspiration (ET), J is the energy stored within the canopy air and biomass and the energy absorbed during the process of photosynthesis, and G is the soil heat flux. Hence, available energy (AE) is equal to Rn-G-J.

2.3. Eddy-Covariance and Meteorological Measurements

The eddy covariance (EC) system consisted of a LI-COR infrared gas analyser (LI-7200, LI-COR, Lincoln, NE, USA) and a Gill ultrasonic anemometer (HS-50, Lymington, Gill Instruments, UK). The system was installed on a meteorological tower at a height of 44 m above ground. Eddy covariance measurements of H, LE and friction velocity (u*, in m s−1) were done at 20 Hz resolution during the 2019–2020 period. The processing of EC raw data measured included spike detection and removal [60], time lag compensation, sonic temperature correction [61], and high [62,63] and low frequency spectral corrections [64]. Coordinate rotation was carried out using the planar-fit method [65], and fluxes were computed at half-hourly time intervals using the block-averaging method. All EC processing was done with the EddyPro software v7.0.6 (LI-COR, Lincoln, NE, USA). A thorough data quality checking procedure was applied to EC measurements using the R package ‘openeddy’ (https://github.com/lsigut/openeddy, accessed on 25 September 2022) [66]. In McGloin et al. [66], it was found that the bulk energy balance closure fraction varied with wind direction, with particularly low closure fractions (≈0.5) for SE, S and SW winds at the site. Thus, an additional quality check was applied to measurements as the days with closure fraction lower than 0.5 were excluded from the analysis. Evapotranspiration (ET) was calculated as LE divided by latent heat of vaporization (λ). Latent heat of vaporization is a function of air temperature (Tair) and was estimated according to Allen et al. [67]:
λ = 2.501 ( 2.361 × 10 3 ) × T air
Air temperature and relative humidity (RH) measurements were conducted with EMS33 temperature and humidity sensors (EMS Brno, Brno, Czech Republic) at 2 m height. Precipitation measurements were conducted with 386 Met One precipitation gauges (Met One Instruments, Grants pass, OR, USA). Potential evapotranspiration (PET) was calculated according to the FAO Penman-Monteith equation (FAO56 R Package) [67,68]. Soil water content (SWC) was measured with three randomly placed ThetaProbes (Delta-T, Burwell, United Kingdom) at 30 cm depth. Incident photosynthetic active radiation (PAR) was measured by a LI-190R Quantum Sensor (LI-COR, Lincoln, NE, USA) at 44 m height above ground. The seasonal averages of all meteorological conditions during the 2019–2020 period are visualized in Table 1, and daily dynamics of all environmental conditions are visualized in Figure 1. The year 2019 was similar to the long-term average (2009–2016) in terms of temperature and precipitation, and the year 2020 was slightly colder with more rainfall than the long-term average.

2.4. Sap Flow Measurements and Upscaling

The sap flow of nine European beech individuals was measured using the trunk heat balance (THB) method with internal heating and sensing during the vegetation seasons of 2019 and 2020 [69]. The EMS81 sap flow sensors (EMS Brno, Brno, Czech Republic) were installed at the tree’s breast height (1.3 m). The THB system measurements are integrated over the heated space [69,70,71]. The system measured in 2-min intervals, stored 10-min averages and expressed values as specific sap flow (Q) per unit of trunk circumference (kg day−1 cm−1). Sap flow for the entire tree (Qtree) was calculated by multiplying Q with the tree circumference, excluding the bark and phloem layer, and was aggregated to daily sums. The upscaling of Qtree from individuals to stand transpiration (T) was conducted according to the methodology formulated by Čermák et al. [69]. Qtree of the DBH classes was calculated based on scaling curves of tree DBH and Qtree for the years 2019 and 2020 separately (Supplementary Figure S1). Stand level sap flow (Qstand) was then obtained as Qtree values of mean trees of individual DBH classes multiplied by numbers of trees in classes, ni, and summarized for the stand area unit of 1 ha:
Q s t a n d = i = 1 i = m ( Q t r e e ) × n i
The nondimensional coefficient S was subsequently computed by dividing the sap flow of the stand (Qstand) by the sap flow of the trees (Qtree), for which it was directly measured according to Nalevanková et al. [50]:
S =   Q s t a n d   Q t r e e
The S coefficient was used to multiply the measured values of the sap flow to obtain the values of the sap flow at a stand level. At the daily timescale, the sap flow was considered to be equal to daily T, as the time-lag between the breast height measurement and crown T is eliminated. The dendrometric characteristics of the inventory data of the upscaled stand are visualized in Supplementary Figure S1.

2.5. Statistical Analysis

All statistical analysis were conducted in R 4.2.1 software (R Core Team, Vienna, Austria). ANOVA assumptions of normal distribution of transpiration (T), evapotranspiration (ET) and their ratio (T/ET) data were tested by the Shapiro–Wilk test and homoscedasticity between months was tested by the Bartlett’s test. Afterwards, the statistical differences between month averages of T, ET and T/ET were tested by one-way ANOVA and Tukey’s HSD post hoc test. The impact of environmental conditions on T, ET and T/ET were tested by linear and logarithmic regression.

3. Results

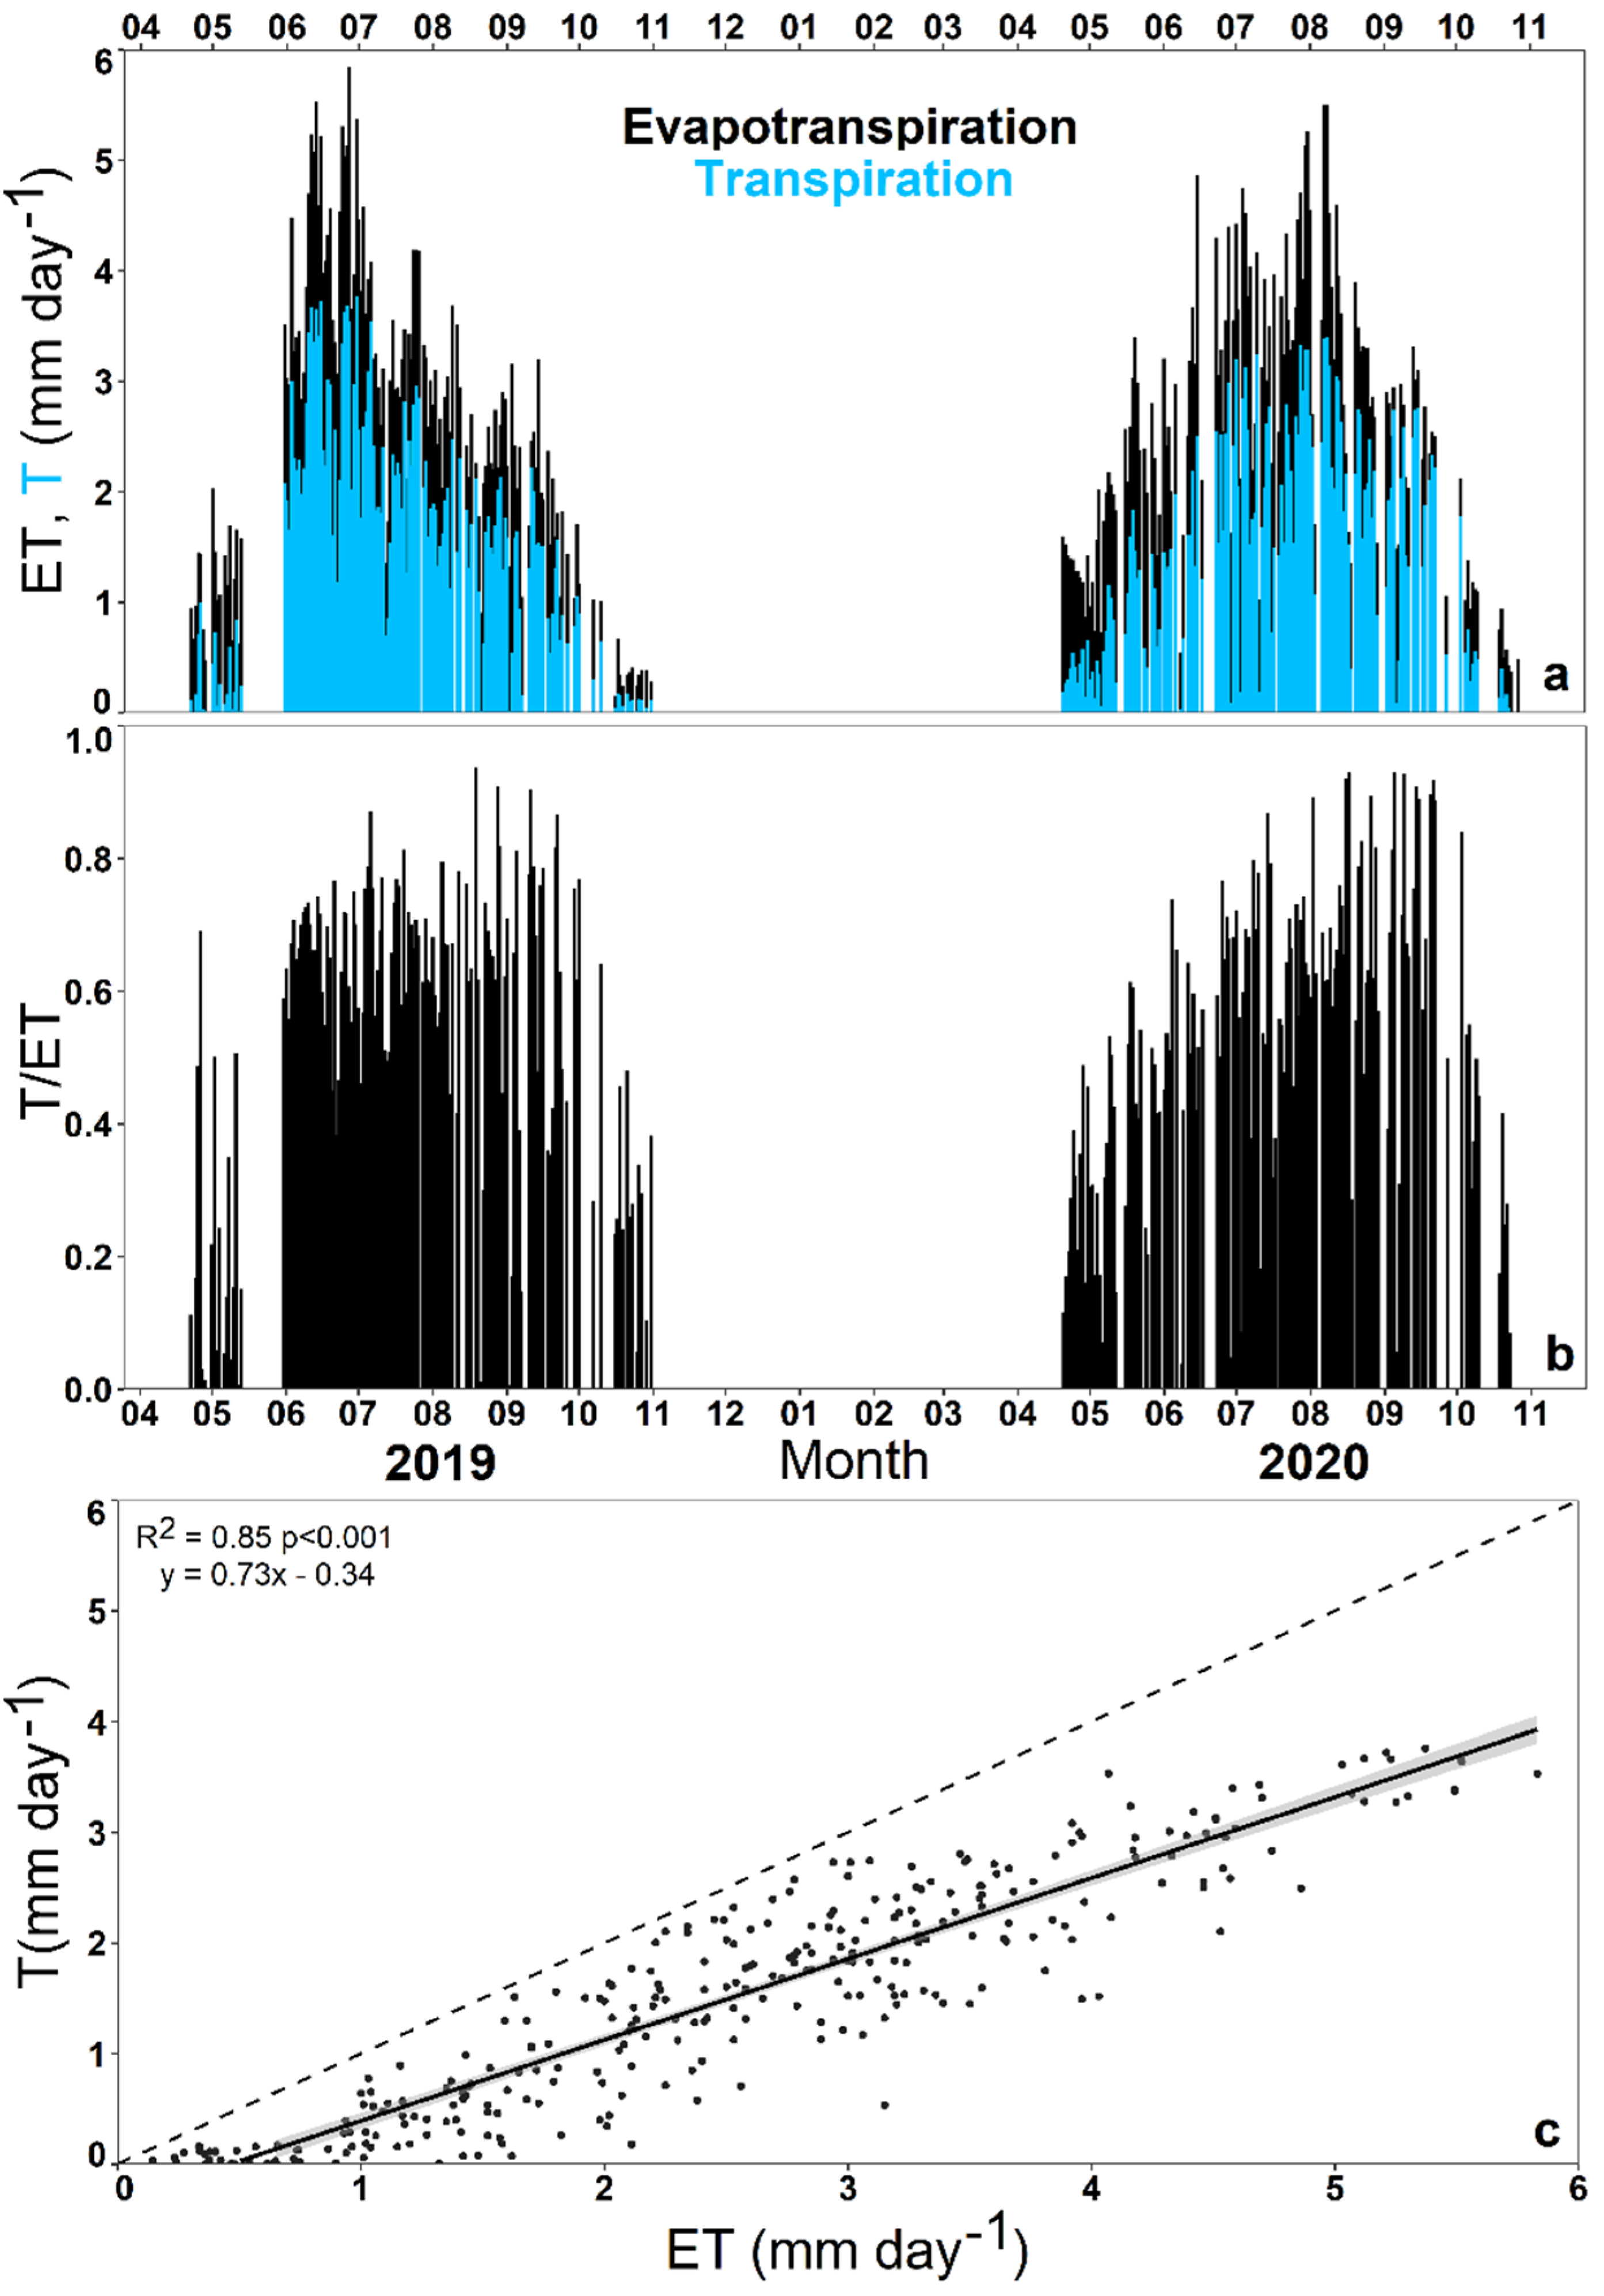
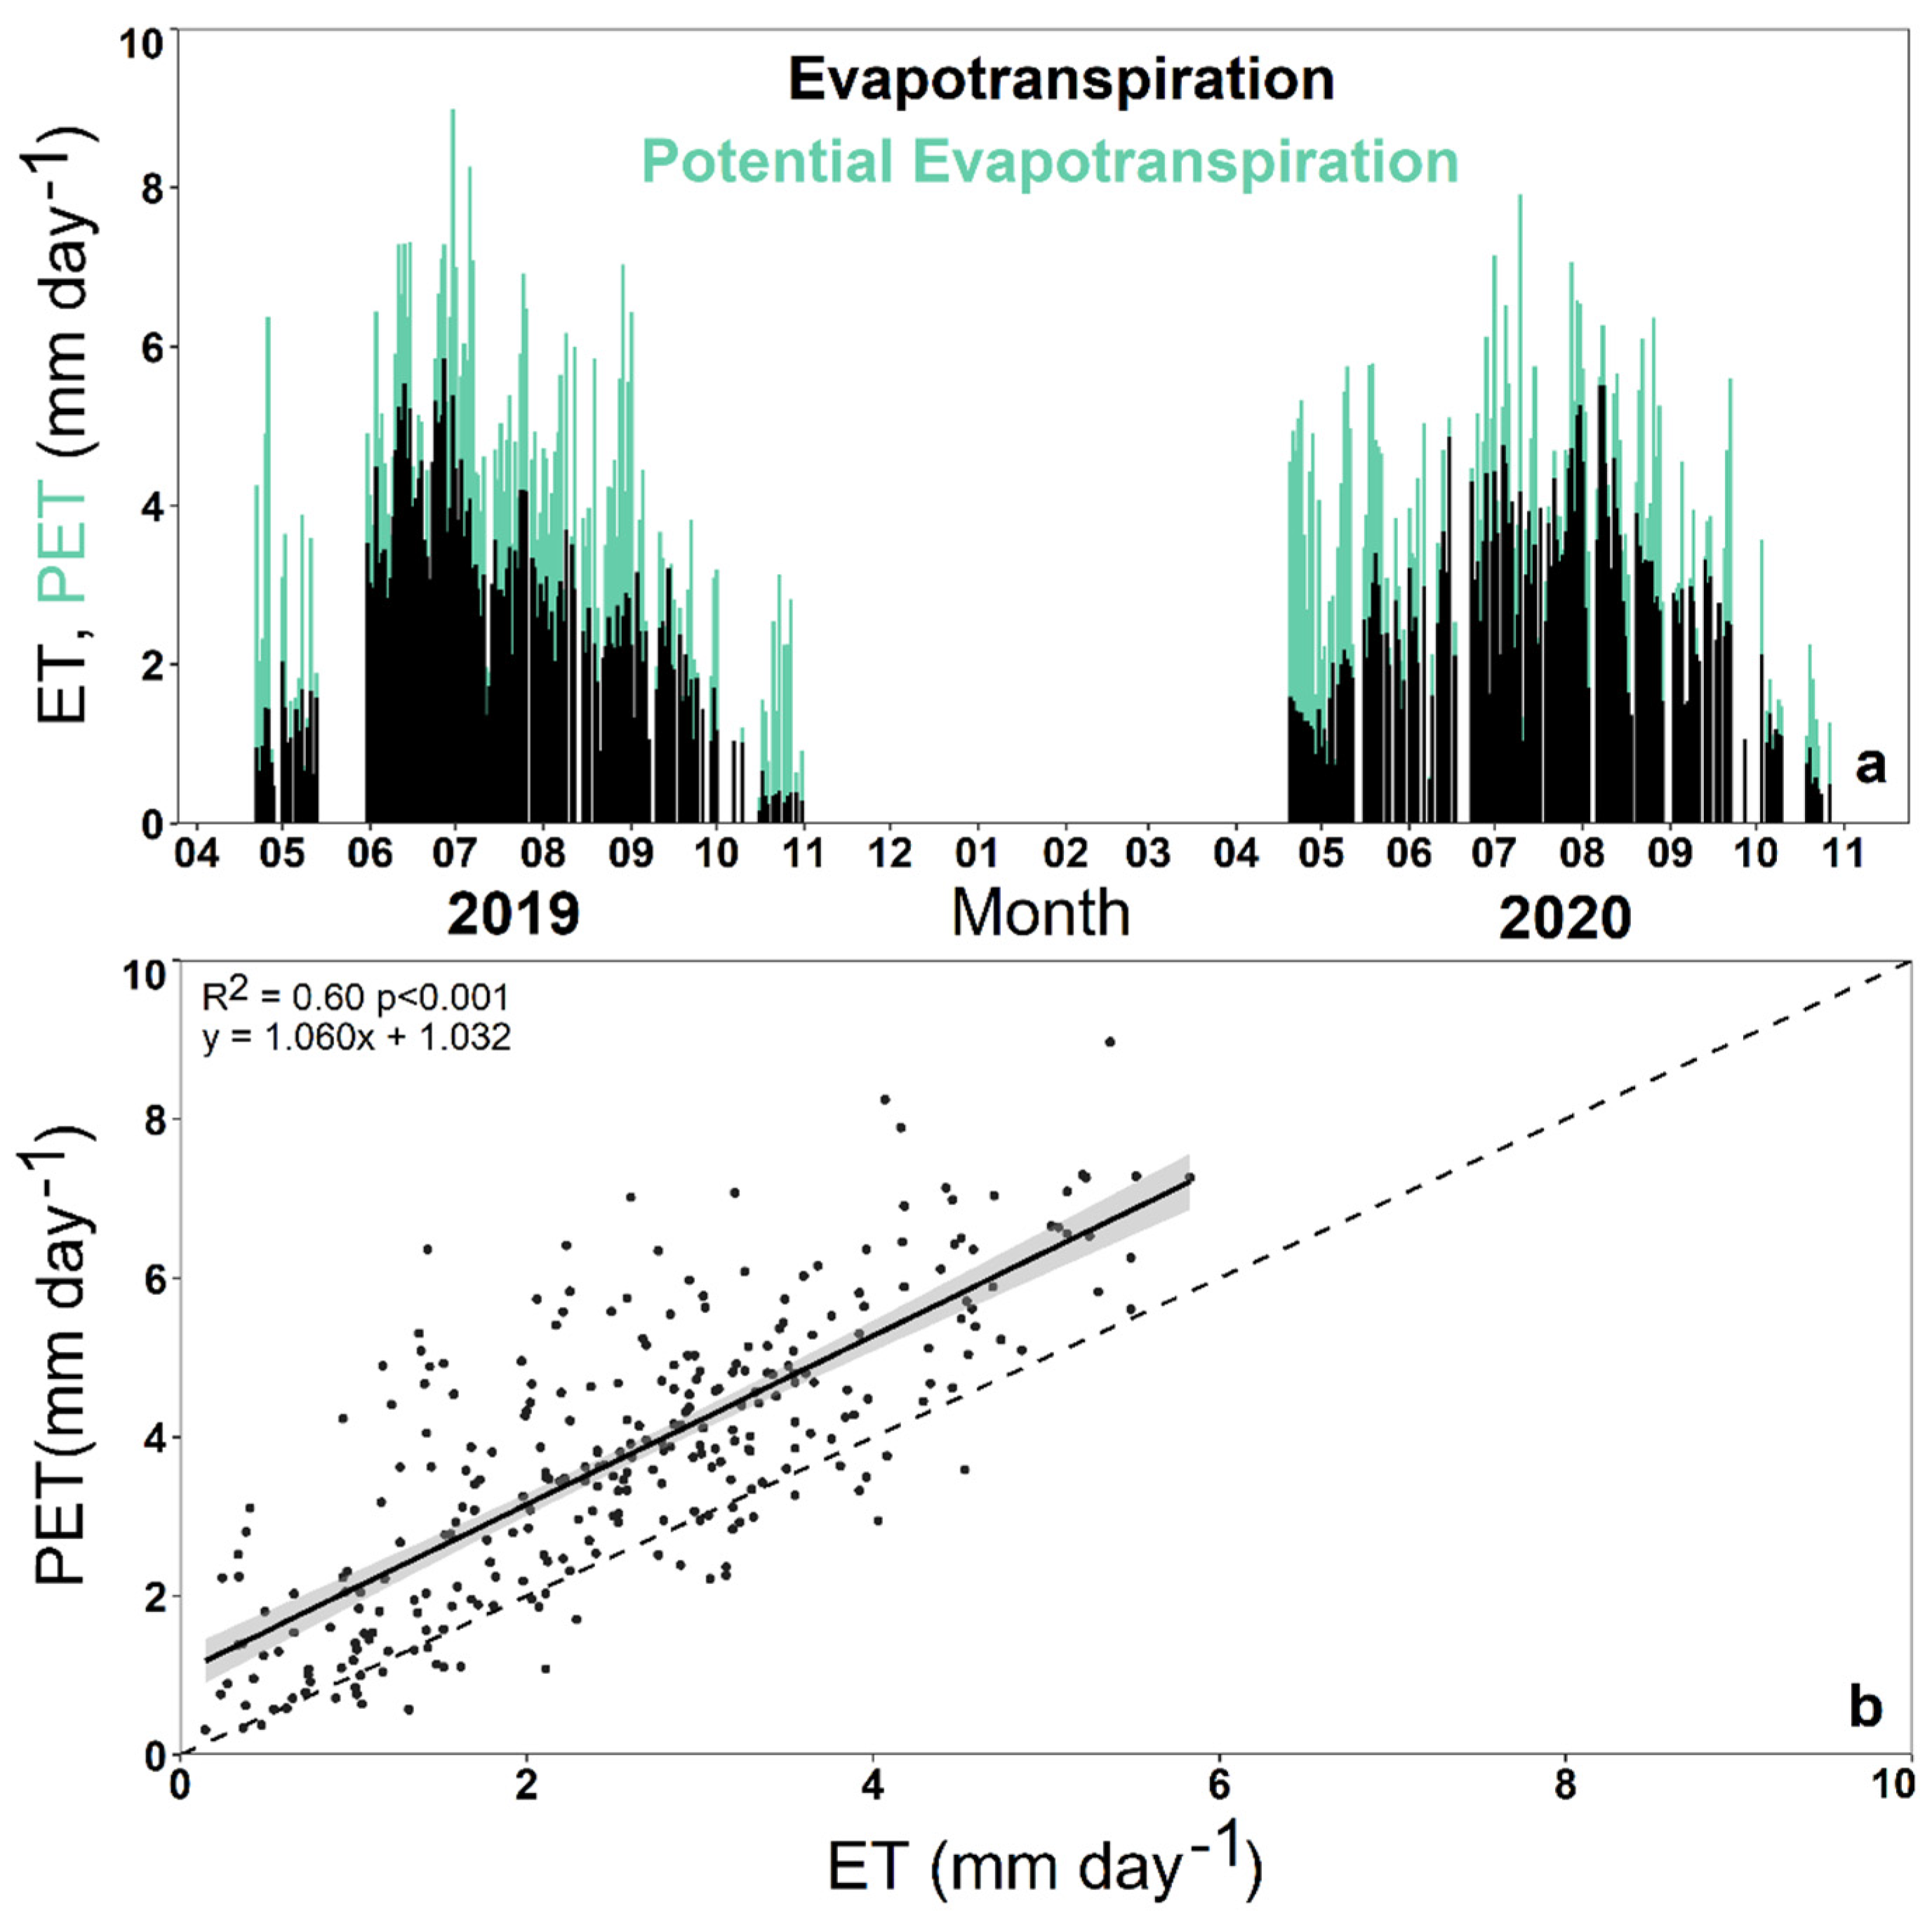
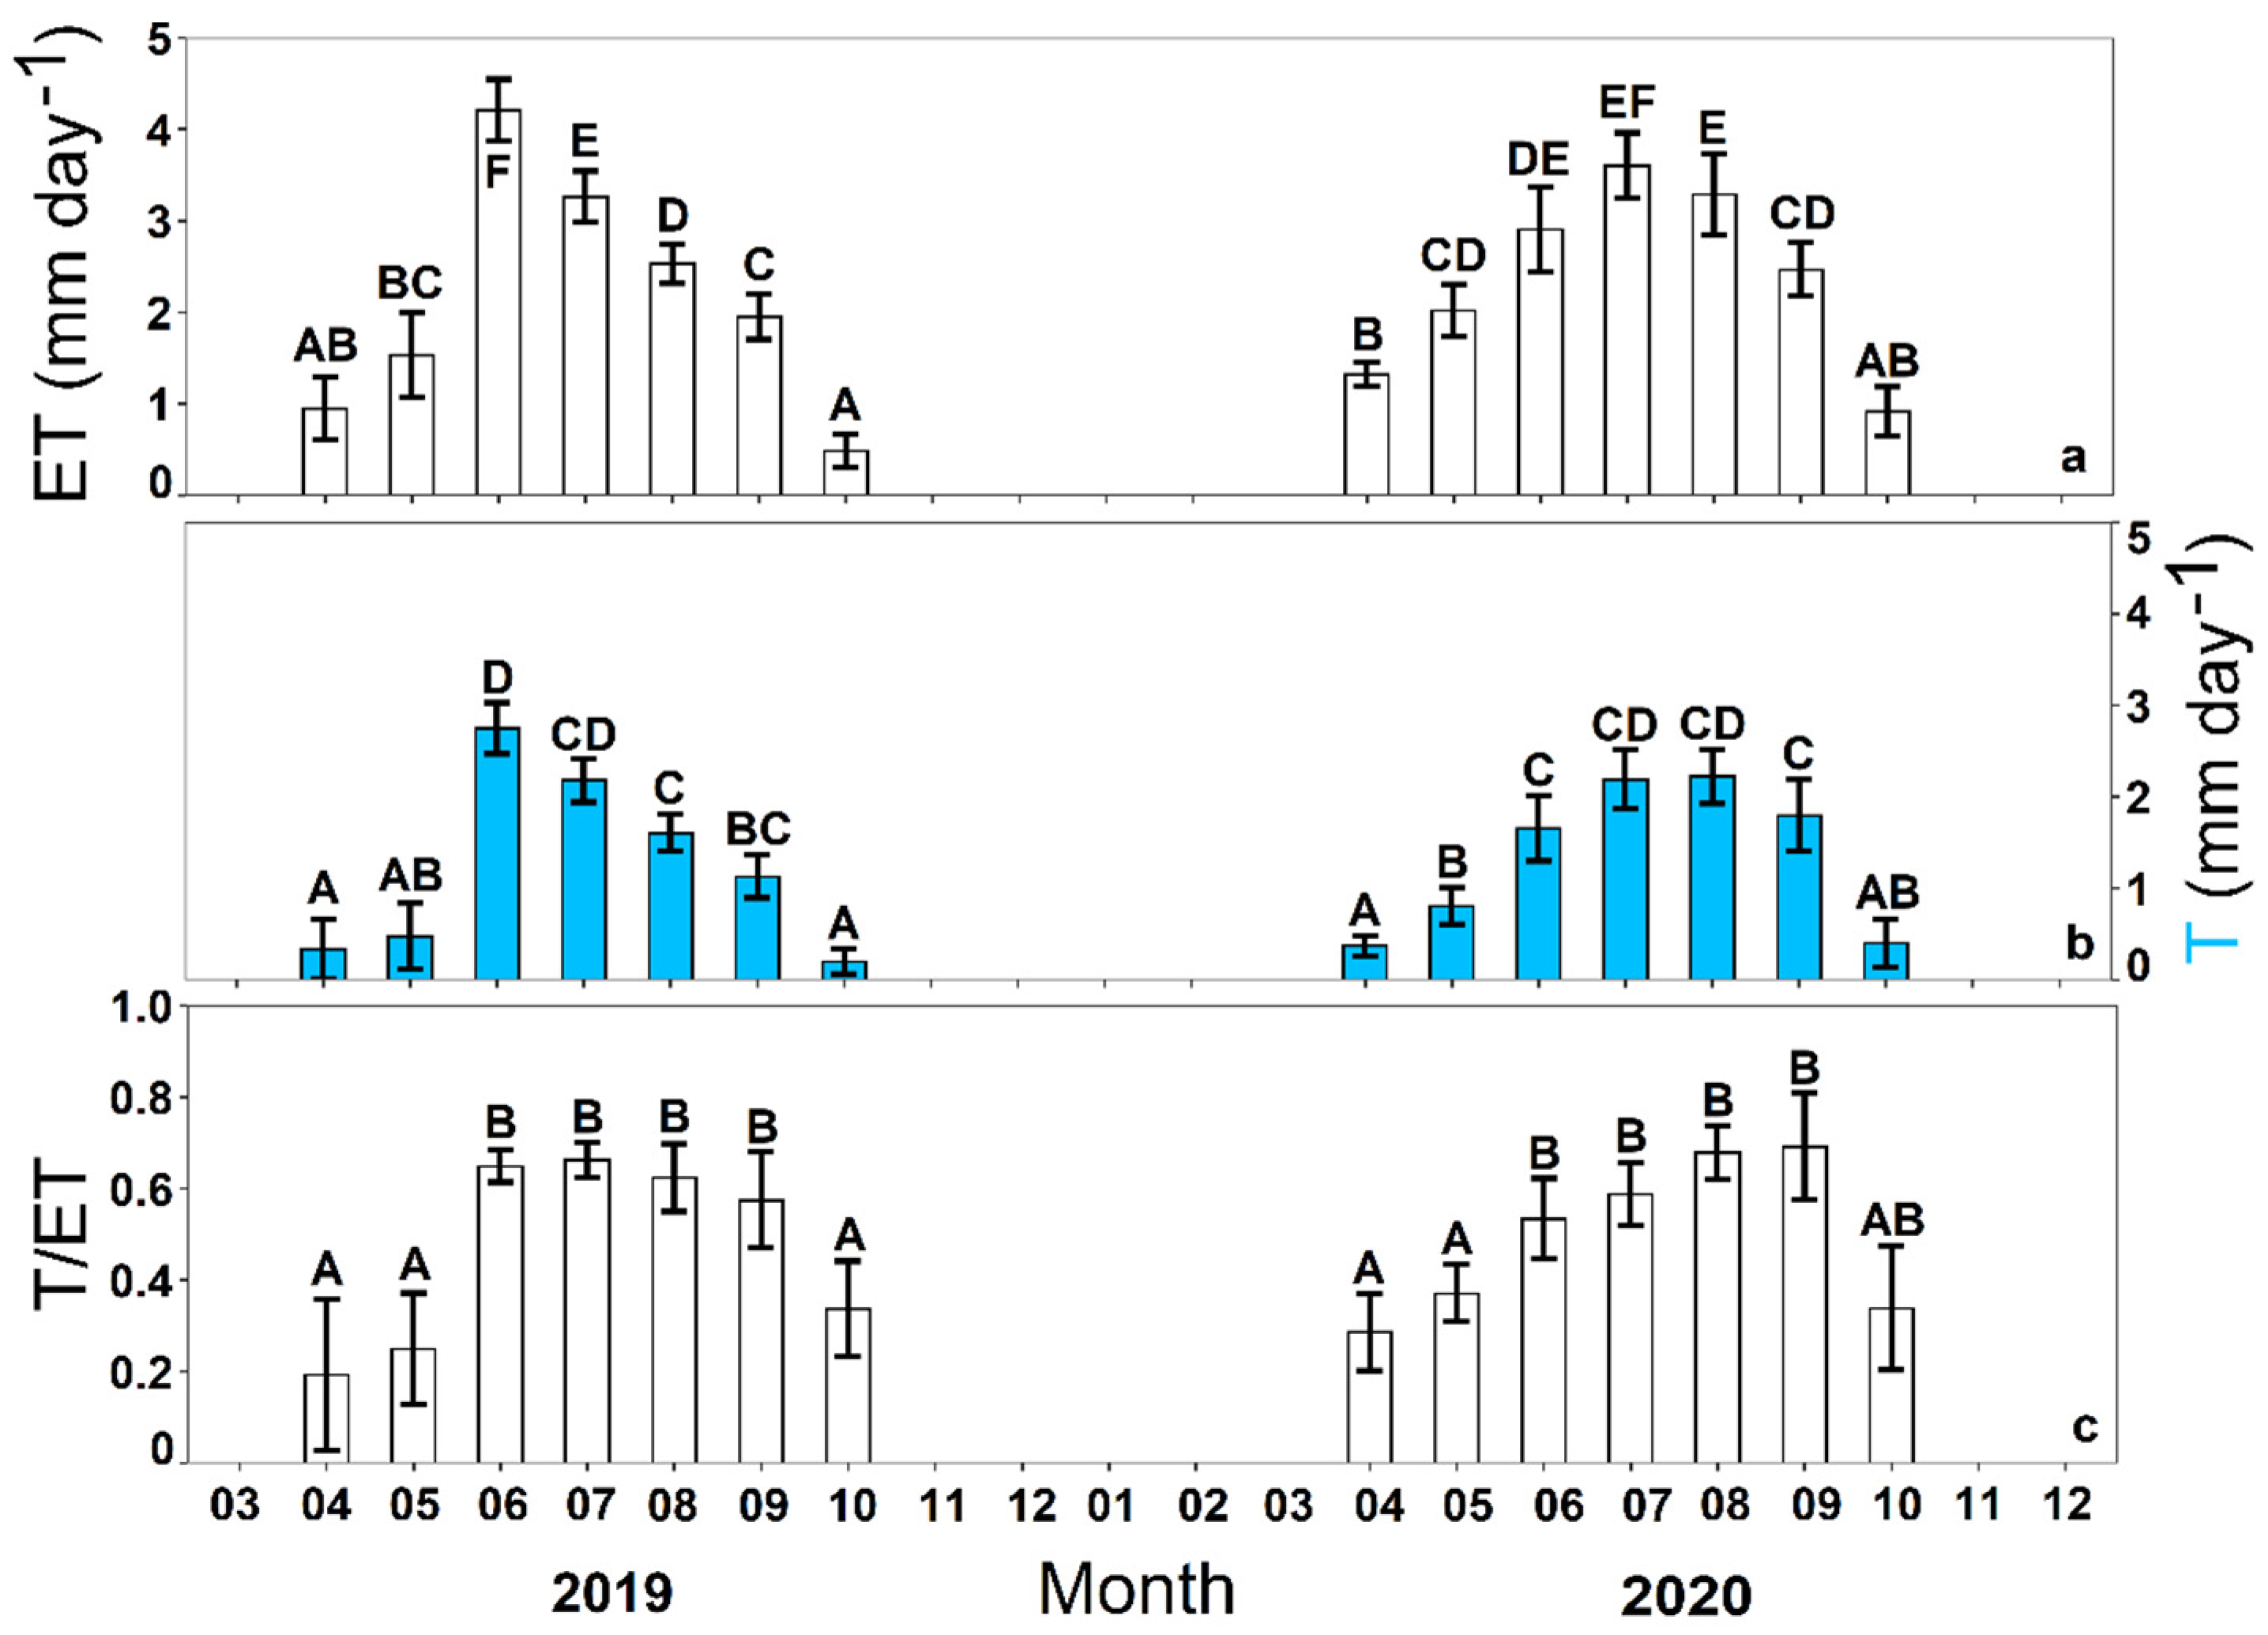
3.1. Seasonal Dynamics of Ecosystem Transpiration and Evapotranspiration

The ecosystem transpiration (T) derived from upscaled sap flow (Qtree) measurements corresponds to evapotranspiration (ET) variability derived from eddy-covariance measurements during the two observed years (Figure 2). There was no occurrence of overestimation of T values above ET during the whole period for ET data points filtered with the energy closure quality check (Figure 2c). The linear regression between T and ET showed that ecosystem T increased by 0.73 mm day−1 per 1 mm day−1 of ecosystem ET. The mean value for the observed period (April–October 2019–2020) of T was 1.29 mm day−1, ET was 2.25 mm day−1 and the mean annual T/ET ratio was 0.48. The potential evapotranspiration (PET) calculated with the FAO Penman–Monteith equation was in most cases higher than the measured ET (Figure 3a). The relationship between measured ET and calculated PET show that ET is not reaching the possible PET values (Figure 3b). Results of one-way ANOVA showed that there were significant differences between the months for the T, ET and T/ET ratio (Table 2). We observed significantly different between periods of spring, summer and autumn for T, ET and T/ET during both years 2019 and 2020 (Figure 4). The ET and T values peaked in June of 2019 and in July–August of 2020 with comparable daily ET values around 3.5–4 mm day−1 and T values around 2–3 mm day−1 in both years. April and October mean values were the lowest, with daily ET values of 1.13mm day−1 and T values of 0.35 mm day−1 for both 2019 and 2020. Comparison of the two years reveals similar intra-annual dynamics with the exception of significantly higher ET and T values during the June of 2019 compared to June of 2020. The mean monthly ET during the June of 2019 was 29% higher and the T mean was 40% higher compared to the June of 2020. The differences of T and ET during these periods correspond to differences of VPD during June of 2019 and 2020 (Figure 1c). Another anomaly was the significantly higher ET in August of 2020 compared to August of 2019, with an approximately 20% increase. The T proportion of ET did not significantly change during the period from June to September for both 2019 and 2020 (Figure 4). During this stable period, T accounted on average for around 70% of total ET. Nevertheless, the T could account for more than 85% of total ET during some days within the vegetation peak. The T/ET ratio dropped to 20–40% during the spring and autumn months, and thus the ET was dominated by evaporation. The ET/T ratio shows similar variability between the two analysed years. Residual evaporation from soil and interception therefore dominates the ecosystem ET during spring and autumn.

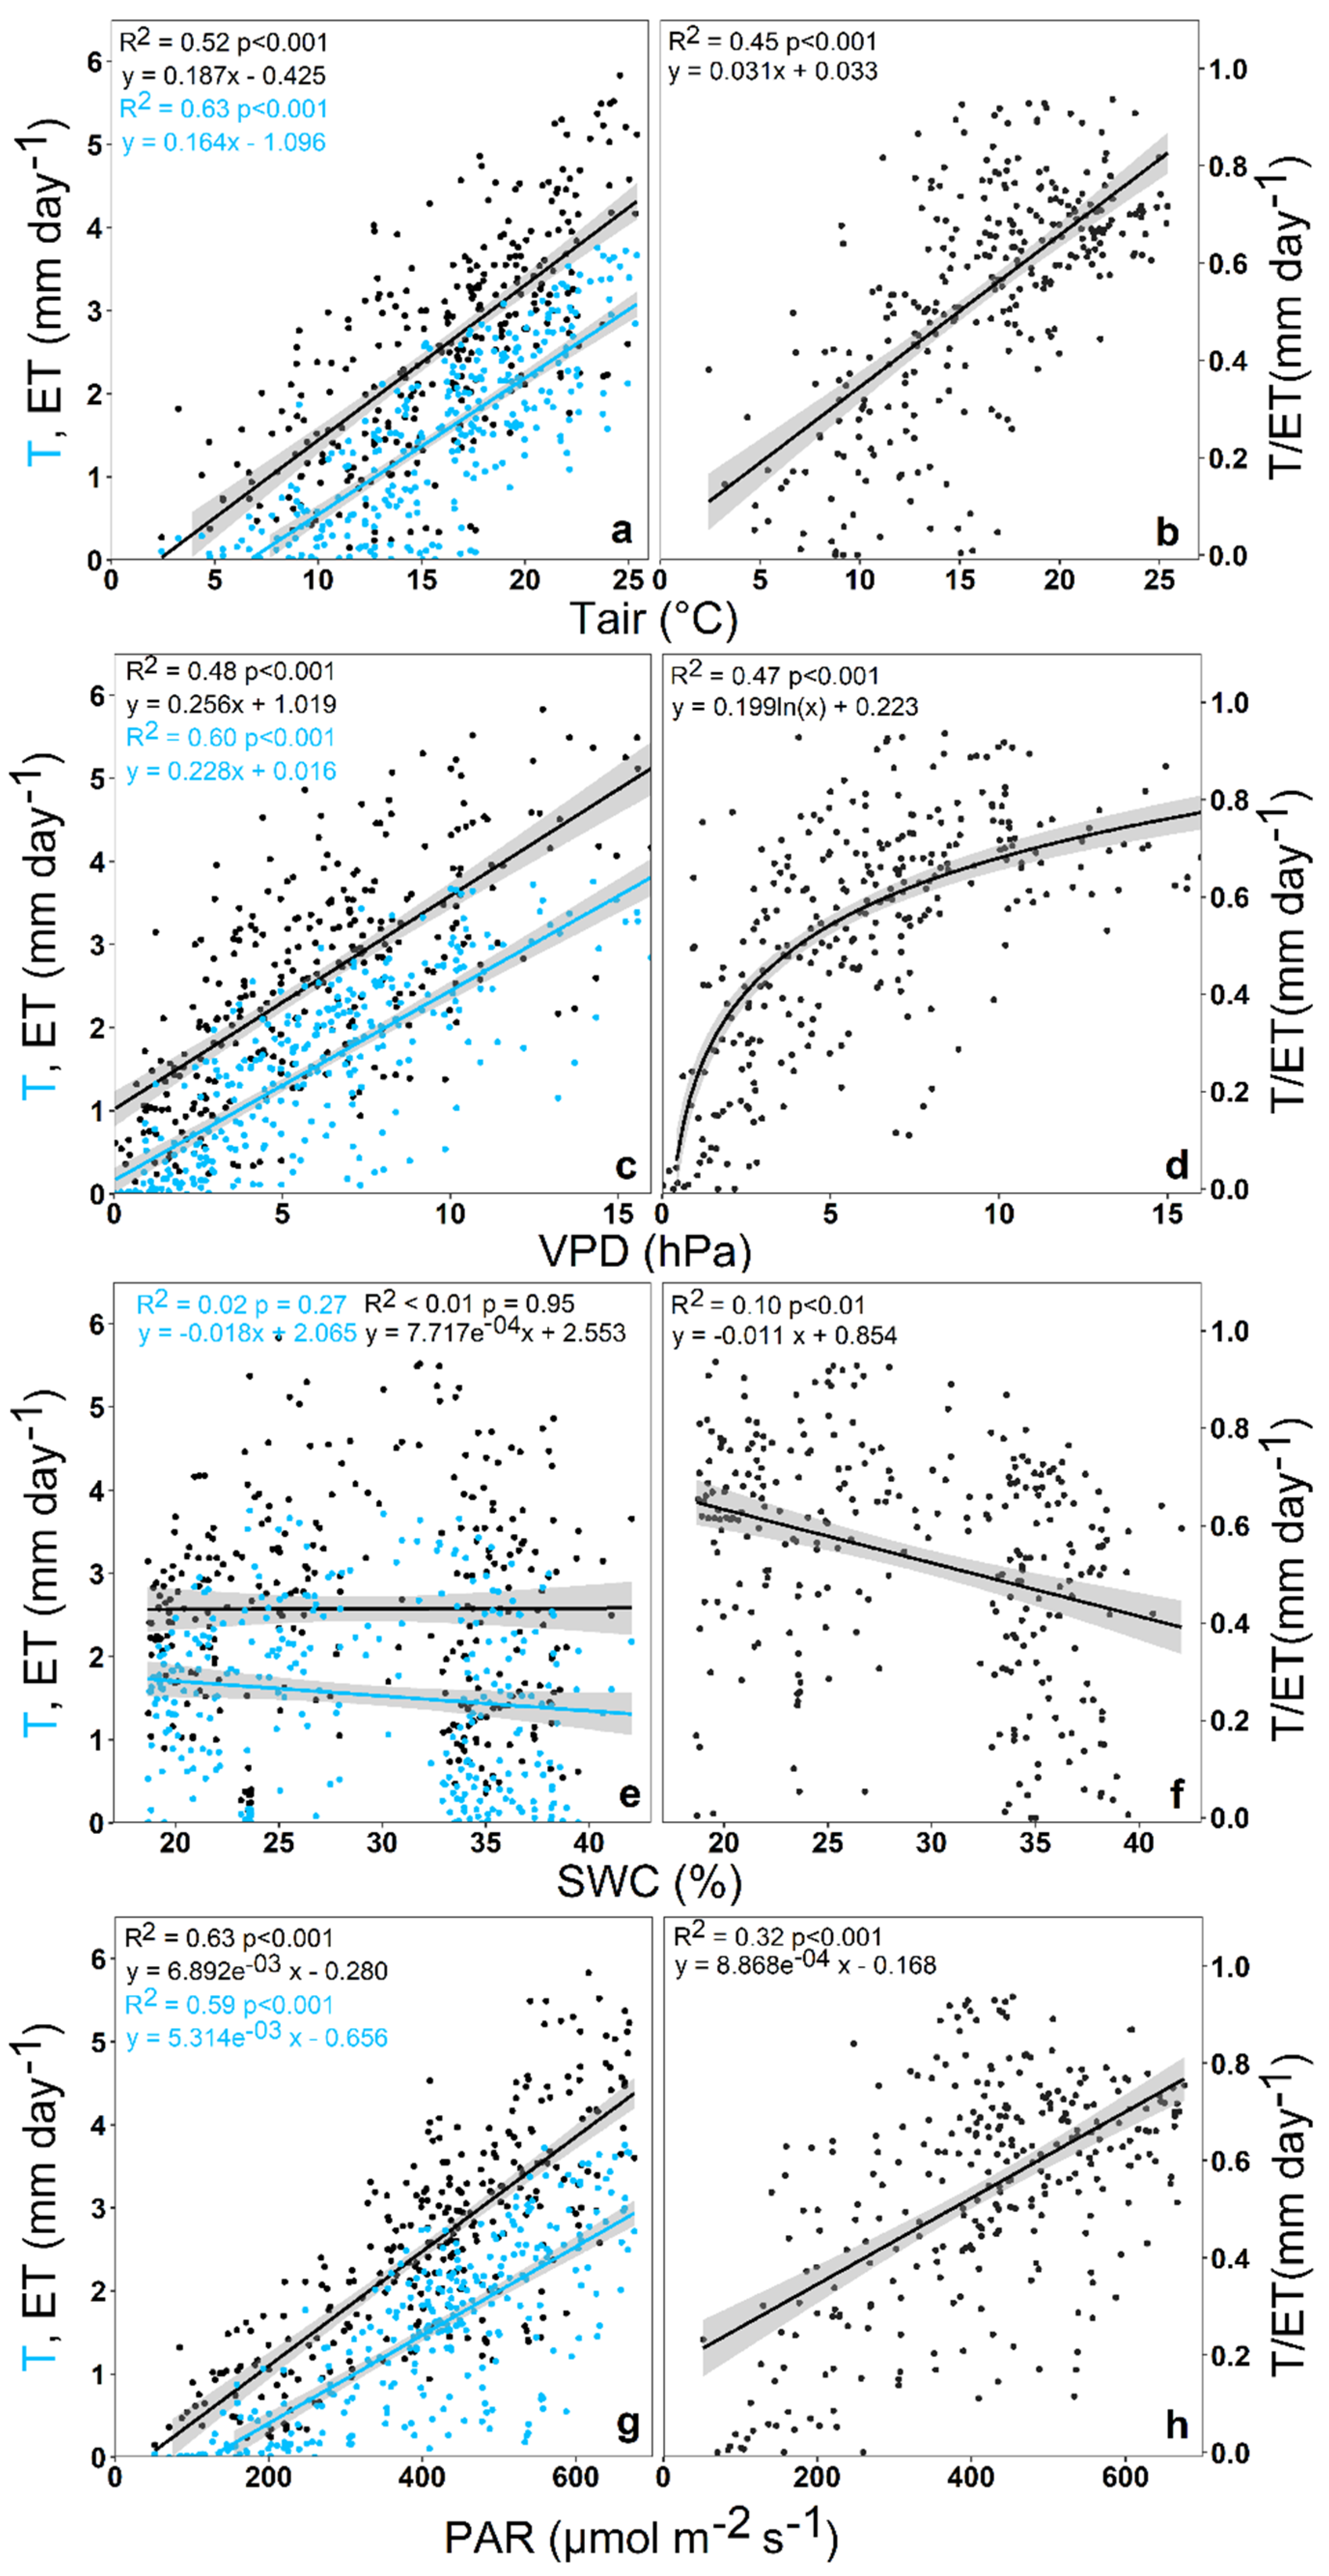
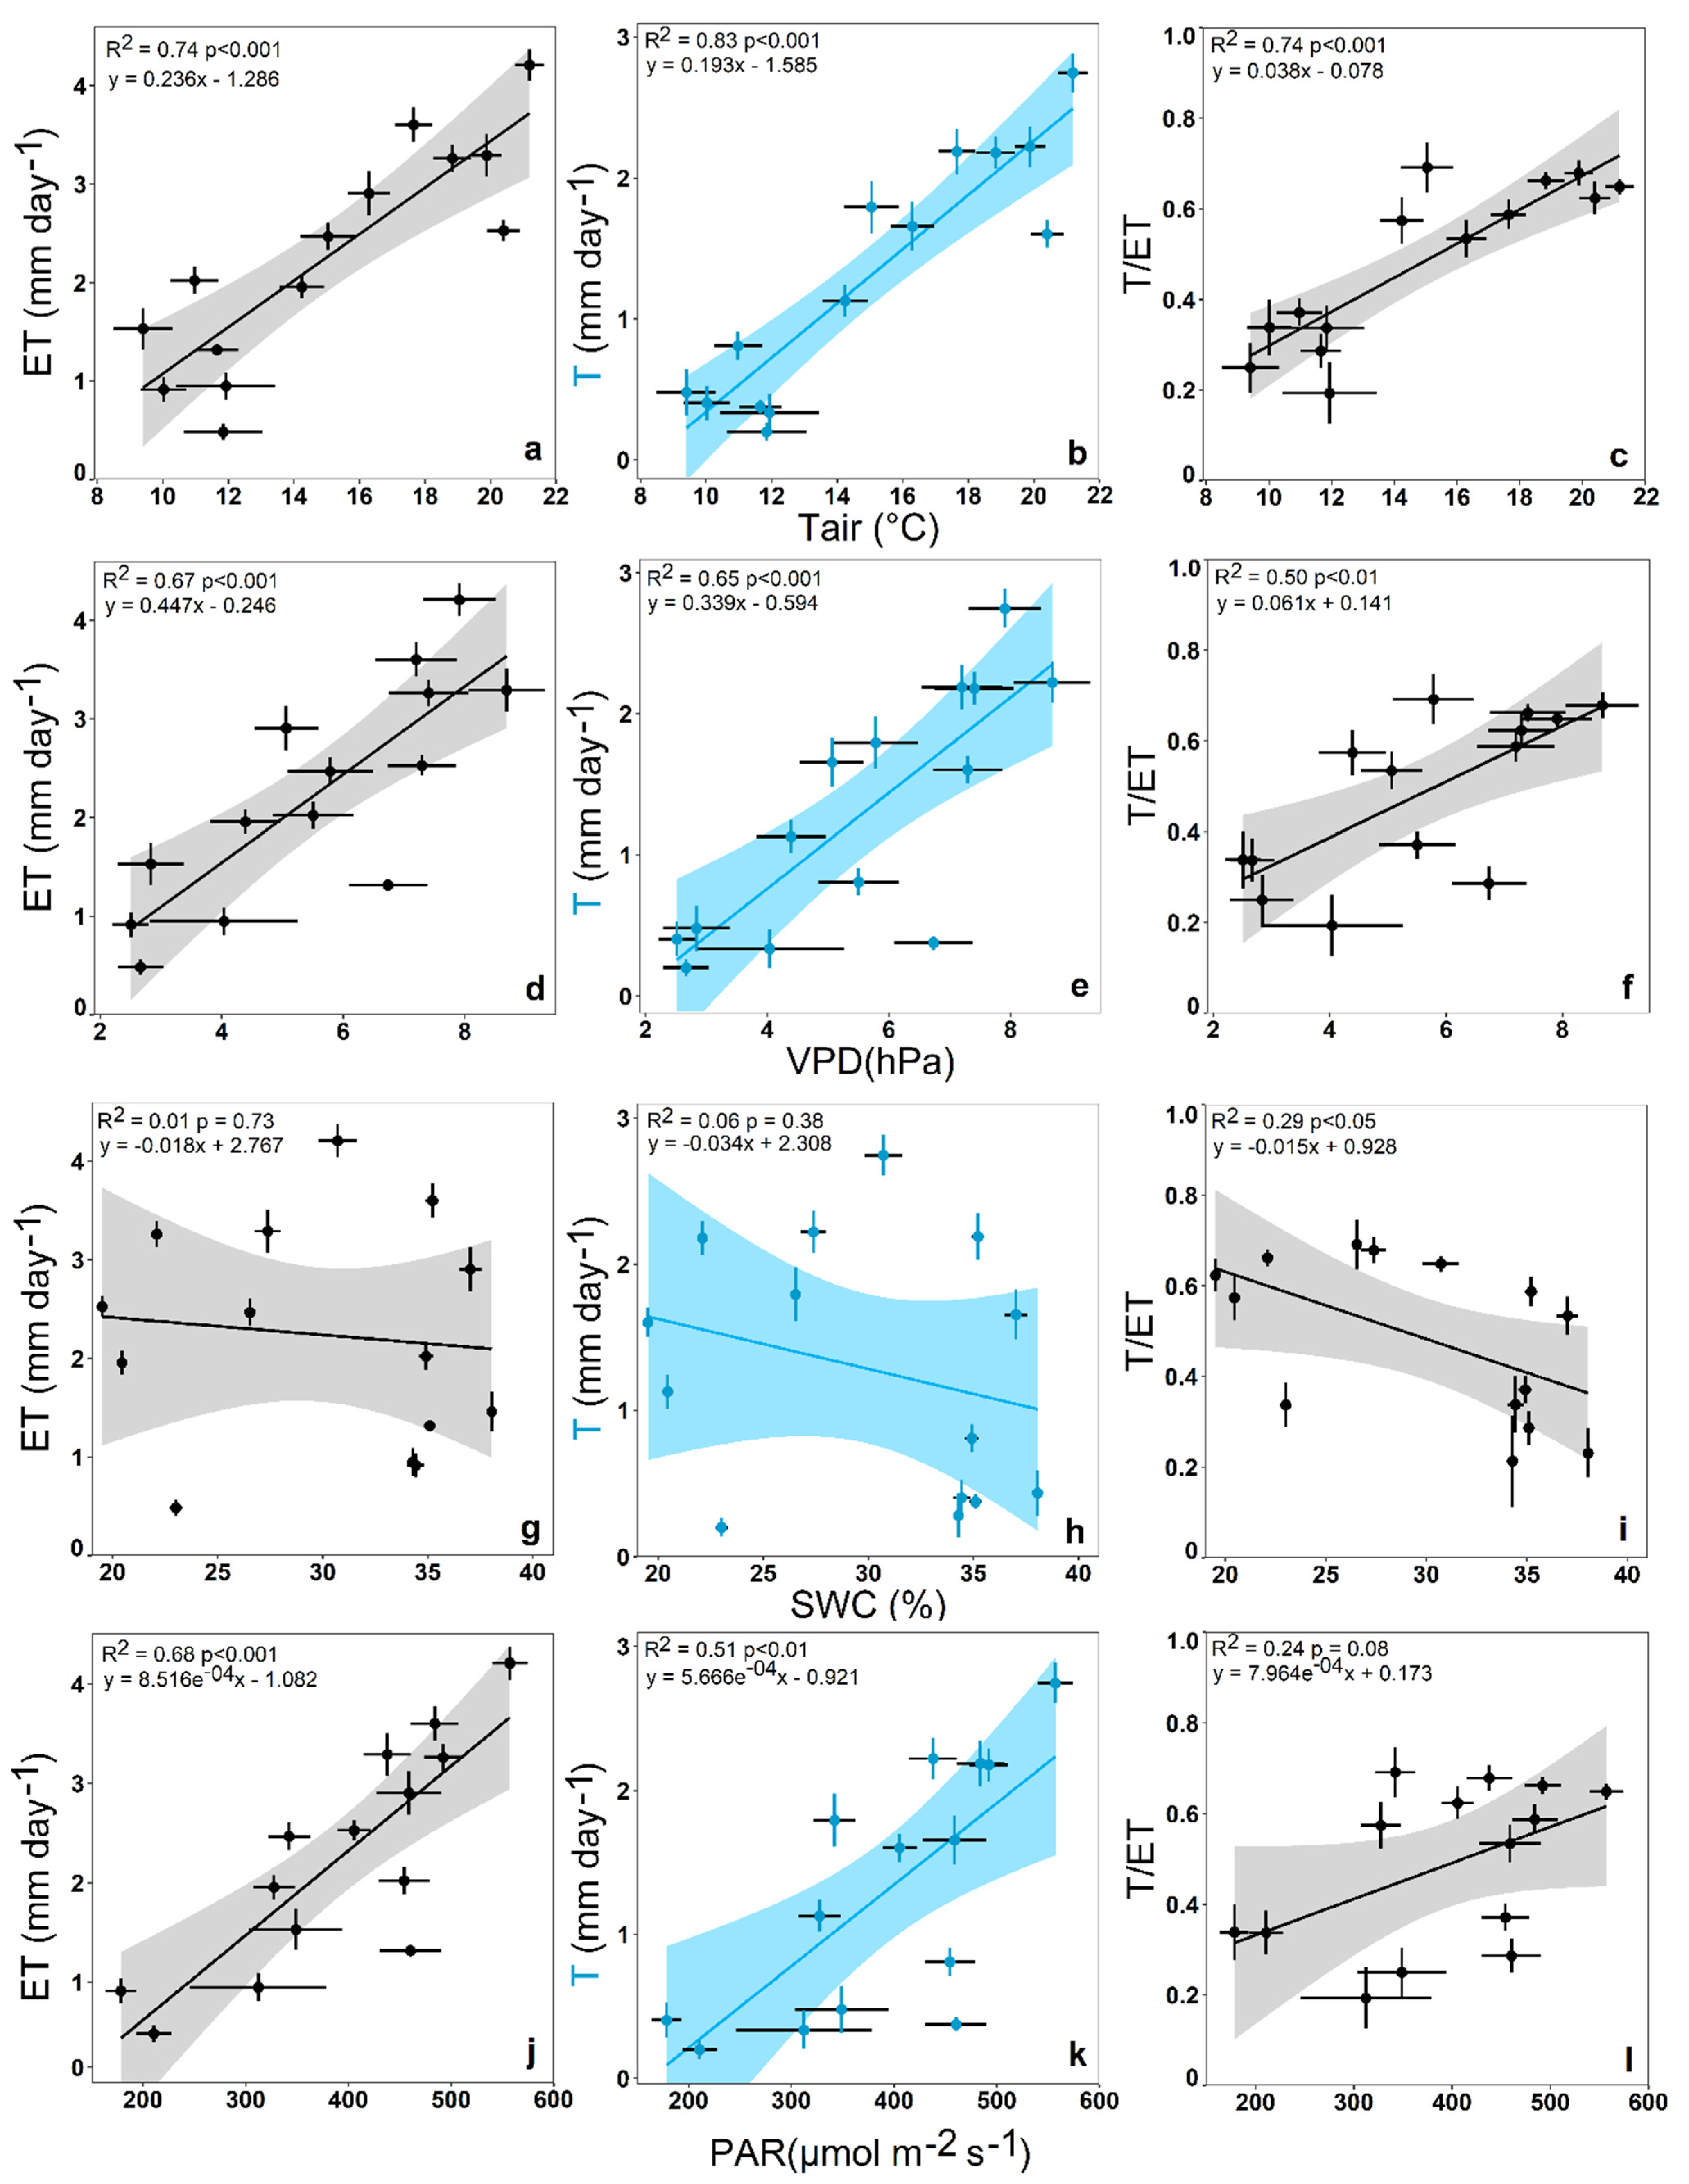
3.2. Impact of Environmental Variables on Ecosystem Transpiration and Evapotranspiration

The impact of environmental variables on daily dynamics of T, ET and T/ET was tested for the combined data of both the 2019 and 2020 years (April–October). Air temperature (Tair), vapour pressure deficit (VPD) and photosynthetically active radiation (PAR) showed a great explanatory power for T variability with determination coefficients around 0.6 (Figure 5a–c). As for ET, the best explanatory variable was PAR, with R2 = 0.63. Both Tair and VPD showed weaker R2 for ET around 0.5. This relationship revealed that a 1 °C increase of Tair led to a 0.16 mm increase of T and a 0.187 mm increase of ET (Figure 5a–c). Surprisingly, soil water content (SWC) had no significant impact on either T or ET. Additionally, the relationship between VPD and both T and ET was linear, without apparent asymptotic trends. The ecosystem ET increased with increasing VPD at a rate of 0.26 mm day−1 hPa−1 and the ecosystem T increased at a rate of 0.23 mm day−1 per 1 hPa. The ET increased for 0.6 mm per 100 μmol m−2 s−1 of PAR and T increased at a rate of 0.5 mm per 100 μmol m−2 s−1 of PAR (Figure 5g). Tair had a positive linear effect on the daily dynamics of T/ET, with a 0.031 increase rate per 1 °C (Figure 5b). The T/ET increased with increasing VPD, but then reached a plateau described by a logarithmic relationship (Figure 5d). SWC had a limited effect on T/ET variability (Figure 5e) with R2 = 0.1. PPAR explained only 30% of observed T/ET ratio variability and the response rate was 11% of the T/ET increase per 100 μmol m−2 s−1 1 (Figure 5h). The T/ET reached maximal values on warm sunny days with moderate VPD, where T accounted for around 90% of total ecosystem ET. The impact of environmental conditions on T, ET and T/ET during the peak of the season (June–August) is visualized in the supplementary materials (Supplementary Figure S2).
Furthermore, the impact of monthly mean environmental variables on monthly mean T, ET and T/ET was investigated. Tair was a predictor for ET monthly level variability with an R2 of 0.74, and then PAR with an R2 of 0.68 and VPD with an R2 of 0.67 (Figure 6a,d,j). Linear regression between monthly mean Tair and T showed an R2 of 0.83, which captured both the latent phenological effect and the temperature response effect (Figure 6b). VPD explained 65% and PAR 0.51% of monthly mean T variability (Figure 6e,k). Mean monthly SWC had no significant effect on either T or ET during the observed period (Figure 6g,h). Monthly rising of mean Tair 1 °C corresponded to a 0.24 mm increase of monthly mean ET and a 0.19 mm increase of monthly mean T. The strongest predictor for T/ET variability was Tair, with R2 of 0.74, and then VPD with an R2 of 0.5 (Figure 6c,f). An increase of monthly mean Tair by 1 °C led to a rise of T/ET by 0.04, or 4% increased T contribution towards total ET. A monthly mean VPD rise of 1 hPa corresponded to a 0.06 increase of T/ET ratio. SWC had a significant negative effect on monthly mean T/ET with an R2 of 0.29 (Figure 6i). The reduction of SWC by 1% corresponded to a decrease of monthly mean T/ET by 0.01. On the other hand, PAR had no significant effect on monthly mean T/ET (Figure 6l).

4. Discussion

4.1. Seasonal Changes of Ecosystem Transpiration and Evapotranspiration Partitioning

We observed no apparent decoupling between the ecosystem transpiration (T) and evapotranspiration (ET) during the two observed years which were derived from upscaled sap flow and eddy-covariance data. The mean value of T during the June–August period was 1.73 mm day−1, and for ET it was 3.29 mm day−1. A study by Davi et al. [72], which utilized a combined simulated and measured approach, showed a similar range of values for both T and ET in a European beech forest in France, ranging from 2–5 mm day−1 during the peak of the vegetation season. Analysis of intra-annual monthly variability showed significant differences between spring, summer and autumn seasons, with peaking T/ET (0.75) during the June–September period and the lowest T/ET values during April–May (0.28) and October (0.35). In comparison to our results, the T/ET ratio of European beech derived from sap flow and ET calculated based on PAR transmittance showed greater values during spring (0.5), lower values during the autumn (0.15) and similar values during the summer (0.8) [73]. Moreover, the lower T values and subsequently smaller T/ET ratio during the April–May period observed in this study can be linked to cambial activity and sap flow rise due to phenological onset and propagation [73]. Another factor reducing spring T could be leaf development [74] and stomatal maturation [75,76]. After the leaves are fully developed, the T/ET ratio seems stable until the autumn senescence, as similarly observed by Wilson et al. [77] in a mixed broadleaf forest. The reduction of T during autumn was observed for Fagus sylvatica in mixed forest and was linked to declining hydraulic conductance [78]. The mean T/ET ratio of 0.497 observed in our study corresponds to more novel and reserved estimates within the 0.35–0.6 range [35,39,54]. In comparison, American boreal spruce forests have higher annual T/ET ratio between 0.7–0.8, European boreal evergreen forests show T/ET values around 0.5 and evergreen deciduous forests show a T/ET ratio of around 0.7–0.8 [79]. The T/ET ratio seems very stable from the annual perspective and differs only slightly between 2019 and 2020. A similar stable T/ET ratio was observed in a study of mixed temperate forest which included European beech with 40% abundance [80]. A study by Paul-Limoges et al. [80] reported an annual T/ET ratio of 0.74 in the mixed temperate forest, without T/ET drops during spring and autumn due to the presence of evergreen trees. The low T/ET ratio of European beech forest during spring and autumn due to the phenological development of leaves might pose a disadvantage in comparison to evergreen forests from the annual perspective.

4.2. Environmental Impact on Ecosystem Transpiration and Evapotranspiration

We have not observed decoupling between T and ET, and thus have demonstrated the weak stomatal control of European beech under high evaporative demand. The relationship between VPD and T was linear without apparent limitation at higher VPD levels. Moreover, the soil water content (SWC) had no significant impact on T variability with a determination coefficient of 0.06. A linear response of T to VPD without apparent asymptotic change at high VPD and no significant impact of SWC on T suggests more anisohydric behaviour. Similarly, a recent paper by Leuschner et al. [49] has found that mature European beech trees exhibited anisohydric behaviour based on a relationship between stomatal conductance and leaf water potential. Nalevanková et al. [48] also did not find a significant impact of soil water potential on transpiration values in a mature European beech forest under drought. A mature European beech stand will therefore keep their stomata open to maintain photosynthesis even under water-deficit, maximizing carbon assimilation but risking hydraulic failure. Long-term transpiration development derived from carbon isotope ratios of tree ring cellulose of Fagus crenata has shown no decrease of T under increasing VPD, which could be explained by the anisohydric strategy of the species [81]. In contrast, the T from isohydric species is reduced via stomatal control due to the reduction of soil water potential or soil water content [82,83,84]. It should be noted that we measured SWC at a 30 cm depth, which could skew the real relationship for deep-rooting European beech. Nevertheless, the site has very shallow soil (60–70 cm), and therefore the differences might not be so pronounced. We also think that, at this site, there is no reachable groundwater table due to the topography; however, we do not have empirical evidence of that. Temperature, VPD and PAR showed significant impact on both T and ET due to their effect on evaporative demand. Empirical connection between T derived from sap flow and evaporative demand are well documented for a plethora of tree species [48,85,86,87]. Similar results for ET were observed by water balance modelling of European beech stands based on precipitation and runoff dynamics [88]. The diurnal ET dynamics of temperate mixed forests were also controlled mostly by the air temperature and global radiation, but not by soil temperature [89]. The positive linear impact of temperature on transpiration is probably driven by increasing stomatal conductance linked to rising temperature, even under constant VPD [90].

4.3. Environmental Impact on T/ET Ratio

The T/ET ratio is positively correlated with ecosystem water use efficiency (WUE) in temperate forests [51]. Therefore, it is an important target for the assessment of forest ecosystem productivity under increasing aridity due to GCC. It seems that climate warming is having a positive effect on T/ET partitioning and therefore WUE in forest ecosystems [6,58]. Jiang et al. [91] found that agroforestry ecosystems can control its WUE via regulation of T/ET by LAI adjustment. Air temperature explained around 50% of T/ET variability in our study as it probably captures the phenological development of the foliage. Positive correlation between air temperature on T/ET ratio has been also observed for wheat and barley [5]. SWC in our study showed the very small explanatory power of T/ET with R2 of 0.15. Contrary to that, a study by Nie et al. [6] found a strong negative correlation between the T/ET and SWC across various forest types at a global scale. A strong influence of SWC on T/ET has been observed also in subtropical forests and was linked to stomatal control under a soil water deficit [92]. The differences could be explained by the anisohydric response strategy of the mature European beech. As suggested in a recent study by Paul-Limoges et al. [5], knowledge of empirical relationships between environmental conditions and T/ET ratios for specific phenological stages can be beneficial also for empirical T estimation, based on reliable eddy-covariance measurements of ET. Given that the T/ET ratio for a tree species is stable under certain phenological conditions, gained knowledge can improve the ecosystem T estimates needed for proper understanding of forest water fluxes under GCC. Further exploration of isohydric species with strong stomatal control is needed to properly quantify the effect of water deficit and/or drought on ecosystem-level T/ET partitioning.

5. Conclusions

European beech forest has significant intra-annual variability of transpiration, evapotranspiration, and transpiration/evapotranspiration ratio. Spring and autumn phenological development leads to the reduction of transpiration and total transpiration/evapotranspiration ratio. The values of all three parameters seem stable at the inter-annual level between the slightly drier 2019 and the more humid 2020. The main environmental factors affecting daily and monthly transpiration and evapotranspiration dynamics was air temperature. Surprisingly, SWC had no significant impact on transpiration and/or evapotranspiration dynamics, on the daily or monthly scale. The relationship between VPD and transpiration was linear, without limitation of transpiration at high VPD. The combination of non-significant response to soil water content and linear response to VPD suggests the more anisohydric behaviour of mature European beech.

Supplementary Materials

The following supporting information can be downloaded at: https://www.mdpi.com/article/10.3390/w14193015/s1, Figure S1: The scaling curves for transpiration upscaling based on diameter at breast height (DBH) for the years 2019 (a) and 2020 (b). The DBH distribution of the trees within the area of interest used for the upscaling (c); Figure S2: Impact of daily mean air temperature (a,b), vapour pressure deficit (c,d), soil water content (e,f) and photosynthetic active radiation (g,h) on daily sums of ecosystem transpiration, evapotranspiration, and transpiration/evapotranspiration ratio during the 2019–2020 (June–August) period.

Author Contributions

Conceptualization, P.P., M.P. and I.Z.; methodology, I.Z., J.S., N.K. and L.Š.; software, L.Š. and P.P.; formal analysis, P.P.; resources, M.P.; data curation, L.Š. and I.Z.; writing—original draft preparation, P.P. and A.P.-P.; writing—review and editing, all co-authors.; visualization, P.P.; supervision, M.P. and G.J. All authors have read and agreed to the published version of the manuscript.

Funding

This work was supported by the Ministry of Education, Youth and Sports of CR within the CzeCOS program, grant number LM2018123 and project SustES “Adaptation strategies for sustainable ecosystem services and food security under adverse environmental conditions” (CZ.02.1.01/0.0/0.0/ 16_019/0000797).

Data Availability Statement

Data are available upon reasonable request from the corresponding author.

Acknowledgments

We are thankful to the technicians for their help with the maintenance of the infrastructure. We are also grateful for phenology data from Ondrej Nezval.

Conflicts of Interest

The authors declare no conflict of interest.

References

  1. Dimitriadou, S.; Nikolakopoulos, K.G. Evapotranspiration Trends and Interactions in Light of the Anthropogenic Footprint and the Climate Crisis: A Review. Hydrology 2021, 8, 163. [Google Scholar] [CrossRef]
  2. Zhang, Y.; Wang, X.; Pan, Y.; Hu, R.; Chen, N. Global Quantitative Synthesis of Effects of Biotic and Abiotic Factors on Stemflow Production in Woody Ecosystems. Global Ecol. Biogeogr. 2021, 30, 1713–1723. [Google Scholar] [CrossRef]
  3. Nelson, J.A.; Pérez-Priego, O.; Zhou, S.; Poyatos, R.; Zhang, Y.; Blanken, P.D.; Gimeno, T.E.; Wohlfahrt, G.; Desai, A.R.; Gioli, B.; et al. Ecosystem Transpiration and Evaporation: Insights from Three Water Flux Partitioning Methods across FLUXNET Sites. Glob. Chang. Biol. 2020, 26, 6916–6930. [Google Scholar] [CrossRef] [PubMed]
  4. da Silva, J.B.; Valle Junior, L.C.G.; Faria, T.O.; Marques, J.B.; Dalmagro, H.J.; Nogueira, J.S.; Vourlitis, G.L.; Rodrigues, T.R. Temporal Variability in Evapotranspiration and Energy Partitioning over a Seasonally Flooded Scrub Forest of the Brazilian Pantanal. Agric. For. Meteorol. 2021, 308–309, 108559. [Google Scholar] [CrossRef]
  5. Paul-Limoges, E.; Revill, A.; Maier, R.; Buchmann, N.; Damm, A. Insights for the Partitioning of Ecosystem Evaporation and Transpiration in Short-Statured Croplands. JGR Biogeosci. 2022, 127, e2021JG006760. [Google Scholar] [CrossRef]
  6. Nie, C.; Huang, Y.; Zhang, S.; Yang, Y.; Zhou, S.; Lin, C.; Wang, G. Effects of Soil Water Content on Forest Ecosystem Water Use Efficiency through Changes in Transpiration/Evapotranspiration Ratio. Agric. For. Meteorol. 2021, 308–309, 108605. [Google Scholar] [CrossRef]
  7. Sun, H.; Wang, P.; Chen, Q.; Zhang, D.; Xing, Y. Coupling the Water Use of Populus Euphratica and Tamarix Ramosissima and Evapotranspiration Partitioning in a Desert Riparian Forest Ecosystem. Agric. For. Meteorol. 2022, 323, 109064. [Google Scholar] [CrossRef]
  8. Winbourne, J.B.; Jones, T.S.; Garvey, S.M.; Harrison, J.L.; Wang, L.; Li, D.; Templer, P.H.; Hutyra, L.R. Tree Transpiration and Urban Temperatures: Current Understanding, Implications, and Future Research Directions. BioScience 2020, 70, 576–588. [Google Scholar] [CrossRef]
  9. Grossiord, C.; Forner, A.; Gessler, A.; Granier, A.; Pollastrini, M.; Valladares, F.; Bonal, D. Influence of Species Interactions on Transpiration of Mediterranean Tree Species during a Summer Drought. Eur. J. For. Res. 2015, 134, 365–376. [Google Scholar] [CrossRef]
  10. Forrester, D.I. Transpiration and Water-Use Efficiency in Mixed-Species Forests versus Monocultures: Effects of Tree Size, Stand Density and Season. Tree Physiol. 2015, 35, 289–304. [Google Scholar] [CrossRef] [Green Version]
  11. Kirschbaum, M.U.F.; McMillan, A.M.S. Warming and Elevated CO2 Have Opposing Influences on Transpiration. Which Is More Important? Curr. For. Rep. 2018, 4, 51–71. [Google Scholar] [CrossRef]
  12. Alvarado-Barrientos, M.S.; Holwerda, F.; Geissert, D.R.; Muñoz-Villers, L.E.; Gotsch, S.G.; Asbjornsen, H.; Dawson, T.E. Nighttime Transpiration in a Seasonally Dry Tropical Montane Cloud Forest Environment. Trees 2015, 29, 259–274. [Google Scholar] [CrossRef]
  13. Höök, M.; Tang, X. Depletion of Fossil Fuels and Anthropogenic Climate Change—A Review. Energy Policy 2013, 52, 797–809. [Google Scholar] [CrossRef]
  14. Engineer, C.B.; Hashimoto-Sugimoto, M.; Negi, J.; Israelsson-Nordström, M.; Azoulay-Shemer, T.; Rappel, W.-J.; Iba, K.; Schroeder, J.I. CO2 Sensing and CO2 Regulation of Stomatal Conductance: Advances and Open Questions. Trends Plant Sci. 2016, 21, 16–30. [Google Scholar] [CrossRef]
  15. Šigut, L.; Holiova, P.; Klem, K.; Prtova, M.; Calfapietra, C.; Marek, M.V.; Punda, V.; Urban, O. Does Long-Term Cultivation of Saplings under Elevated CO2 Concentration Influence Their Photosynthetic Response to Temperature? Ann. Bot. 2015, 116, 929–939. [Google Scholar] [CrossRef]
  16. Monteiro, M.V.; Blanuša, T.; Verhoef, A.; Hadley, P.; Cameron, R.W.F. Relative Importance of Transpiration Rate and Leaf Morphological Traits for the Regulation of Leaf Temperature. Aust. J. Bot. 2016, 64, 32. [Google Scholar] [CrossRef]
  17. Markulj Kulundžić, A.; Kovačević, J.; Viljevac Vuletić, M.; Josipović, A.; Liović, I.; Mijić, A.; Lepeduš, H.; Matoša Kočar, M. Impact of Abiotic Stress on Photosynthetic Efficiency and Leaf Temperature in Sunflower. Poljoprivreda 2016, 22, 17–22. [Google Scholar] [CrossRef]
  18. Ruehr, N.K.; Gast, A.; Weber, C.; Daub, B.; Arneth, A. Water Availability as Dominant Control of Heat Stress Responses in Two Contrasting Tree Species. Tree Physiol. 2015, 36, 164–178. [Google Scholar] [CrossRef]
  19. Rossi, S.; Burgess, P.; Jespersen, D.; Huang, B. Heat-Induced Leaf Senescence Associated with Chlorophyll Metabolism in Bentgrass Lines Differing in Heat Tolerance. Crop Sci. 2017, 57, S-169–S-178. [Google Scholar] [CrossRef]
  20. Mariën, B.; Dox, I.; De Boeck, H.J.; Willems, P.; Leys, S.; Papadimitriou, D.; Campioli, M. Does Drought Advance the Onset of Autumn Leaf Senescence in Temperate Deciduous Forest Trees? Biogeosciences 2021, 18, 3309–3330. [Google Scholar] [CrossRef]
  21. Frank, D.C.; Poulter, B.; Saurer, M.; Esper, J.; Huntingford, C.; Helle, G.; Treydte, K.; Zimmermann, N.E.; Schleser, G.H.; Ahlström, A.; et al. Water-Use Efficiency and Transpiration across European Forests during the Anthropocene. Nat. Clim. Chang. 2015, 5, 579–583. [Google Scholar] [CrossRef]
  22. Novick, K.A.; Ficklin, D.L.; Stoy, P.C.; Williams, C.A.; Bohrer, G.; Oishi, A.C.; Papuga, S.A.; Blanken, P.D.; Noormets, A.; Sulman, B.N.; et al. The Increasing Importance of Atmospheric Demand for Ecosystem Water and Carbon Fluxes. Nat. Clim. Chang. 2016, 6, 1023–1027. [Google Scholar] [CrossRef]
  23. Martens, C.; Hickler, T.; Davis-Reddy, C.; Engelbrecht, F.; Higgins, S.I.; Maltitz, G.P.; Midgley, G.F.; Pfeiffer, M.; Scheiter, S. Large Uncertainties in Future Biome Changes in Africa Call for Flexible Climate Adaptation Strategies. Glob. Chang. Biol. 2021, 27, 340–358. [Google Scholar] [CrossRef] [PubMed]
  24. Vicente-Serrano, S.M.; Miralles, D.G.; McDowell, N.; Brodribb, T.; Domínguez-Castro, F.; Leung, R.; Koppa, A. The Uncertain Role of Rising Atmospheric CO2 on Global Plant Transpiration. Earth-Sci. Rev. 2022, 230, 104055. [Google Scholar] [CrossRef]
  25. Ben-Gal, A.; Karlberg, L.; Jansson, P.-E.; Shani, U. Temporal Robustness of Linear Relationships between Production and Transpiration. Plant Soil 2003, 251, 211–218. [Google Scholar] [CrossRef]
  26. Tardieu, F.; Parent, B. Predictable ‘Meta-Mechanisms’ Emerge from Feedbacks between Transpiration and Plant Growth and Cannot Be Simply Deduced from Short-Term Mechanisms: Meta-Mechanisms in Plant Water Relations. Plant Cell Environ. 2017, 40, 846–857. [Google Scholar] [CrossRef]
  27. Quan, Q.; Zhang, F.; Tian, D.; Zhou, Q.; Wang, L.; Niu, S. Transpiration Dominates Ecosystem Water-Use Efficiency in Response to Warming in an Alpine Meadow. J. Geophys. Res. Biogeosci. 2018, 123, 453–462. [Google Scholar] [CrossRef]
  28. Fricke, W. Night-Time Transpiration—Favouring Growth? Trends Plant Sci. 2019, 24, 311–317. [Google Scholar] [CrossRef]
  29. Gu, C.; Tang, Q.; Zhu, G.; Ma, J.; Gu, C.; Zhang, K.; Sun, S.; Yu, Q.; Niu, S. Discrepant Responses between Evapotranspiration- and Transpiration-Based Ecosystem Water Use Efficiency to Interannual Precipitation Fluctuations. Agric. For. Meteorol. 2021, 303, 108385. [Google Scholar] [CrossRef]
  30. An, X. Responses of Water Use Efficiency to Climate Change in Evapotranspiration and Transpiration Ecosystems. Ecol. Indic. 2022, 141, 109157. [Google Scholar] [CrossRef]
  31. Köstner, B.; Granier, A.; Cermák, J. Sapflow Measurements in Forest Stands: Methods and Uncertainties. Ann. For. Sci. 1998, 55, 13–27. [Google Scholar] [CrossRef]
  32. Flo, V.; Martinez-Vilalta, J.; Steppe, K.; Schuldt, B.; Poyatos, R. A Synthesis of Bias and Uncertainty in Sap Flow Methods. Agric. For. Meteorol. 2019, 271, 362–374. [Google Scholar] [CrossRef]
  33. Poyatos, R.; Granda, V.; Flo, V.; Adams, M.A.; Adorján, B.; Aguadé, D.; Aidar, M.P.M.; Allen, S.; Alvarado-Barrientos, M.S.; Anderson-Teixeira, K.J.; et al. Global Transpiration Data from Sap Flow Measurements: The SAPFLUXNET Database. Earth Syst. Sci. Data 2021, 13, 2607–2649. [Google Scholar] [CrossRef]
  34. Xiao, W.; Wei, Z.; Wen, X. Evapotranspiration Partitioning at the Ecosystem Scale Using the Stable Isotope Method—A Review. Agric. For. Meteorol. 2018, 263, 346–361. [Google Scholar] [CrossRef]
  35. Liu, Y.; Zhang, Y.; Shan, N.; Zhang, Z.; Wei, Z. Global Assessment of Partitioning Transpiration from Evapotranspiration Based on Satellite Solar-Induced Chlorophyll Fluorescence Data. J. Hydrol. 2022, 612, 128044. [Google Scholar] [CrossRef]
  36. Schlesinger, W.H.; Jasechko, S. Transpiration in the Global Water Cycle. Agric. For. Meteorol. 2014, 189–190, 115–117. [Google Scholar] [CrossRef]
  37. Kool, D.; Agam, N.; Lazarovitch, N.; Heitman, J.L.; Sauer, T.J.; Ben-Gal, A. A Review of Approaches for Evapotranspiration Partitioning. Agric. For. Meteorol. 2014, 184, 56–70. [Google Scholar] [CrossRef]
  38. Hadiwijaya, B.; Pepin, S.; Isabelle, P.-E.; Nadeau, D.F. The Dynamics of Transpiration to Evapotranspiration Ratio under Wet and Dry Canopy Conditions in a Humid Boreal Forest. Forests 2020, 11, 237. [Google Scholar] [CrossRef]
  39. Cao, R.; Huang, H.; Wu, G.; Han, D.; Jiang, Z.; Di, K.; Hu, Z. Spatiotemporal Variations in the Ratio of Transpiration to Evapotranspiration and Its Controlling Factors across Terrestrial Biomes. Agric. For. Meteorol. 2022, 321, 108984. [Google Scholar] [CrossRef]
  40. Raz-Yaseef, N.; Yakir, D.; Schiller, G.; Cohen, S. Dynamics of Evapotranspiration Partitioning in a Semi-Arid Forest as Affected by Temporal Rainfall Patterns. Agric. For. Meteorol. 2012, 157, 77–85. [Google Scholar] [CrossRef]
  41. Ungar, E.D.; Rotenberg, E.; Raz-Yaseef, N.; Cohen, S.; Yakir, D.; Schiller, G. Transpiration and Annual Water Balance of Aleppo Pine in a Semiarid Region: Implications for Forest Management. For. Ecol. Manag. 2013, 298, 39–51. [Google Scholar] [CrossRef]
  42. Zhou, S.; Yu, B.; Zhang, Y.; Huang, Y.; Wang, G. Water Use Efficiency and Evapotranspiration Partitioning for Three Typical Ecosystems in the Heihe River Basin, Northwestern China. Agric. For. Meteorol. 2018, 253–254, 261–273. [Google Scholar] [CrossRef]
  43. Gao, G.; Wang, D.; Zha, T.; Wang, L.; Fu, B. A Global Synthesis of Transpiration Rate and Evapotranspiration Partitioning in the Shrub Ecosystems. J. Hydrol. 2022, 606, 127417. [Google Scholar] [CrossRef]
  44. Jia, G.; Liu, Z.; Chen, L.; Yu, X. Distinguish Water Utilization Strategies of Trees Growing on Earth-Rocky Mountainous Area with Transpiration and Water Isotopes. Ecol. Evol. 2017, 7, 10640–10651. [Google Scholar] [CrossRef]
  45. Zhu, H.; Zhang, L.M.; Garg, A. Investigating Plant Transpiration-Induced Soil Suction Affected by Root Morphology and Root Depth. Comput. Geotech. 2018, 103, 26–31. [Google Scholar] [CrossRef]
  46. Wu, W.; Li, H.; Feng, H.; Si, B.; Chen, G.; Meng, T.; Li, Y.; Siddique, K.H.M. Precipitation Dominates the Transpiration of Both the Economic Forest (Malus pumila) and Ecological Forest (Robinia pseudoacacia) on the Loess Plateau after about 15 Years of Water Depletion in Deep Soil. Agric. For. Meteorol. 2021, 297, 108244. [Google Scholar] [CrossRef]
  47. Lüttschwager, D.; Jochheim, H. Drought Primarily Reduces Canopy Transpiration of Exposed Beech Trees and Decreases the Share of Water Uptake from Deeper Soil Layers. Forests 2020, 11, 537. [Google Scholar] [CrossRef]
  48. Nalevanková, P.; Ježík, M.; Sitková, Z.; Vido, J.; Leštianska, A.; Střelcová, K. Drought and Irrigation Affect Transpiration Rate and Morning Tree Water Status of a Mature European Beech ( Fagus Sylvatica L.) Forest in Central Europe: Ecophysiology of European Beech Exposed to Drought. Ecohydrology 2018, 11, e1958. [Google Scholar] [CrossRef]
  49. Leuschner, C.; Schipka, F.; Backes, K. Stomatal Regulation and Water Potential Variation in European Beech: Challenging the Iso/Anisohydry Concept. Tree Physiol. 2022, 42, 365–378. [Google Scholar] [CrossRef]
  50. Nalevanková, P.; Sitková, Z.; Kučera, J.; Střelcová, K. Impact of Water Deficit on Seasonal and Diurnal Dynamics of European Beech Transpiration and Time-Lag Effect between Stand Transpiration and Environmental Drivers. Water 2020, 12, 3437. [Google Scholar] [CrossRef]
  51. Zhu, X.; Yu, G.; Wang, Q.; Hu, Z.; Han, S.; Yan, J.; Wang, Y.; Zhao, L. Seasonal Dynamics of Water Use Efficiency of Typical Forest and Grassland Ecosystems in China. J. For. Res. 2014, 19, 70–76. [Google Scholar] [CrossRef]
  52. Nguyen, M.N.; Hao, Y.; Baik, J.; Choi, M. Partitioning Evapotranspiration Based on the Total Ecosystem Conductance Fractions of Soil, Interception, and Canopy in Different Biomes. J. Hydrol. 2021, 603, 126970. [Google Scholar] [CrossRef]
  53. Lai, J.; Liu, T.; Luo, Y. Evapotranspiration Partitioning for Winter Wheat with Shallow Groundwater in the Lower Reach of the Yellow River Basin. Agric. Water Manag. 2022, 266, 107561. [Google Scholar] [CrossRef]
  54. Jasechko, S.; Sharp, Z.D.; Gibson, J.J.; Birks, S.J.; Yi, Y.; Fawcett, P.J. Terrestrial Water Fluxes Dominated by Transpiration. Nature 2013, 496, 347–350. [Google Scholar] [CrossRef]
  55. Coenders-Gerrits, A.M.J.; van der Ent, R.J.; Bogaard, T.A.; Wang-Erlandsson, L.; Hrachowitz, M.; Savenije, H.H.G. Uncertainties in Transpiration Estimates. Nature 2014, 506, E1–E2. [Google Scholar] [CrossRef] [PubMed]
  56. Williams, D.G.; Cable, W.; Hultine, K.; Hoedjes, J.C.B.; Yepez, E.A.; Simonneaux, V.; Er-Raki, S.; Boulet, G.; de Bruin, H.A.R.; Chehbouni, A.; et al. Evapotranspiration Components Determined by Stable Isotope, Sap Flow and Eddy Covariance Techniques. Agric. For. Meteorol. 2004, 125, 241–258. [Google Scholar] [CrossRef]
  57. Wei, Z.; Lee, X.; Wen, X.; Xiao, W. Evapotranspiration Partitioning for Three Agro-Ecosystems with Contrasting Moisture Conditions: A Comparison of an Isotope Method and a Two-Source Model Calculation. Agric. For. Meteorol. 2018, 252, 296–310. [Google Scholar] [CrossRef]
  58. Niu, Z.; He, H.; Zhu, G.; Ren, X.; Zhang, L.; Zhang, K.; Yu, G.; Ge, R.; Li, P.; Zeng, N.; et al. An Increasing Trend in the Ratio of Transpiration to Total Terrestrial Evapotranspiration in China from 1982 to 2015 Caused by Greening and Warming. Agric. For. Meteorol. 2019, 279, 107701. [Google Scholar] [CrossRef]
  59. Li, M.; Wu, P.; Ma, Z.; Pan, Z.; Lv, M.; Yang, Q.; Duan, Y. The Increasing Role of Vegetation Transpiration in Soil Moisture Loss across China under Global Warming. J. Hydrometeorol. 2022, 23, 253–274. [Google Scholar] [CrossRef]
  60. Mauder, M.; Cuntz, M.; Drüe, C.; Graf, A.; Rebmann, C.; Schmid, H.P.; Schmidt, M.; Steinbrecher, R. A Strategy for Quality and Uncertainty Assessment of Long-Term Eddy-Covariance Measurements. Agric. For. Meteorol. 2013, 169, 122–135. [Google Scholar] [CrossRef]
  61. Schotanus, P.; Nieuwstadt, F.T.M.; De Bruin, H.A.R. Temperature Measurement with a Sonic Anemometer and Its Application to Heat and Moisture Fluxes. Bound.-Layer Meteorol. 1983, 26, 81–93. [Google Scholar] [CrossRef]
  62. Horst, T.W.; Lenschow, D.H. Attenuation of Scalar Fluxes Measured with Spatially-Displaced Sensors. Bound.-Layer Meteorol. 2009, 130, 275–300. [Google Scholar] [CrossRef]
  63. Ibrom, A.; Dellwik, E.; Flyvbjerg, H.; Jensen, N.O.; Pilegaard, K. Strong Low-Pass Filtering Effects on Water Vapour Flux Measurements with Closed-Path Eddy Correlation Systems. Agric. For. Meteorol. 2007, 147, 140–156. [Google Scholar] [CrossRef]
  64. Moncrieff, J.; Clement, R.; Finnigan, J.; Meyers, T. Averaging, Detrending, and Filtering of Eddy Covariance Time Series. In Handbook of Micrometeorology; Lee, X., Massman, W., Law, B., Eds.; Atmospheric and Oceanographic Sciences Library; Kluwer Academic Publishers: Dordrecht, The Netherlands, 2005; Volume 29, pp. 7–31. ISBN 978-1-4020-2264-7. [Google Scholar]
  65. Wilczak, J.M.; Oncley, S.P.; Stage, S.A. Sonic Anemometer Tilt Correction Algorithms. Bound.-Layer Meteorol. 2001, 99, 127–150. [Google Scholar] [CrossRef]
  66. McGloin, R.; Šigut, L.; Havránková, K.; Dušek, J.; Pavelka, M.; Sedlák, P. Energy Balance Closure at a Variety of Ecosystems in Central Europe with Contrasting Topographies. Agric. For. Meteorol. 2018, 248, 418–431. [Google Scholar] [CrossRef]
  67. Allen, R.G.; Pereira, L.S.; Raes, D.; Smith, M. Crop evapotranspiration—Guidelines for computing crop water requirements -FAO Irrigation and drainage paper No. 56. Rome: Food and Agriculture Organization of the United Nations. Fao Rome 1998, 56, e156. [Google Scholar]
  68. Kučera, J.; Brito, P.; Jiménez, M.S.; Urban, J. Direct Penman–Monteith Parameterization for Estimating Stomatal Conductance and Modeling Sap Flow. Trees 2017, 31, 873–885. [Google Scholar] [CrossRef]
  69. Čermák, J.; Kučera, J.; Nadezhdina, N. Sap Flow Measurements with Some Thermodynamic Methods, Flow Integration within Trees and Scaling up from Sample Trees to Entire Forest Stands. Trees 2004, 18, 529–546. [Google Scholar] [CrossRef]
  70. Lindroth, A.; Cermak, J.; Kucera, J.; Cienciala, E.; Eckersten, H. Sap Flow by the Heat Balance Method Applied to Small Size Salix Trees in a Short-Rotation Forest. Biomass Bioenergy 1995, 8, 7–15. [Google Scholar] [CrossRef]
  71. Urban, J.; Rubtsov, A.V.; Urban, A.V.; Shashkin, A.V.; Benkova, V.E. Canopy Transpiration of a Larix Sibirica and Pinus Sylvestris Forest in Central Siberia. Agric. For. Meteorol. 2019, 271, 64–72. [Google Scholar] [CrossRef]
  72. Davi, H.; Dufrêne, E.; Granier, A.; Le Dantec, V.; Barbaroux, C.; François, C.; Bréda, N. Modelling Carbon and Water Cycles in a Beech Forest. Ecol. Model. 2005, 185, 387–405. [Google Scholar] [CrossRef] [Green Version]
  73. Urban, J.; Bednárová, E.; Plichta, R.; Gryc, V.; Vavrčík, H.; Hacura, J.; Fajstavr, M.; Kučera, J. Links between Phenology and Ecophysiology in a European Beech Forest. iForest 2015, 8, 438–447. [Google Scholar] [CrossRef]
  74. Lavrič, M.; Eler, K.; Ferlan, M.; Vodnik, D.; Gričar, J. Chronological Sequence of Leaf Phenology, Xylem and Phloem Formation and Sap Flow of Quercus Pubescens from Abandoned Karst Grasslands. Front. Plant Sci. 2017, 8, 314. [Google Scholar] [CrossRef] [PubMed]
  75. Hovenden, M.J. The Influence of Temperature and Genotype on the Growth and Stomatal Morphology of Southern Beech, Nothofagus Cunninghamii (Nothofagaceae). Aust. J. Bot. 2001, 49, 427. [Google Scholar] [CrossRef]
  76. Spiegelhalder, R.P.; Raissig, M.T. Morphology Made for Movement: Formation of Diverse Stomatal Guard Cells. Curr. Opin. Plant Biol. 2021, 63, 102090. [Google Scholar] [CrossRef]
  77. Wilson, K.B.; Hanson, P.J.; Mulholland, P.J.; Baldocchi, D.D.; Wullschleger, S.D. A Comparison of Methods for Determining Forest Evapotranspiration and Its Components: Sap-Flow, Soil Water Budget, Eddy Covariance and Catchment Water Balance. Agric. For. Meteorol. 2001, 106, 153–168. [Google Scholar] [CrossRef]
  78. Aranda, I.; Gil, L.; Pardos, J.A. Seasonal Changes in Apparent Hydraulic Conductance and Their Implications for Water Use of European Beech (Fagus sylvatica L.) and Sessile Oak [Quercus petraea (Matt.) Liebl] in South Europe. Plant Ecol. 2005, 179, 155–167. [Google Scholar] [CrossRef]
  79. Liu, J.; Cheng, F.; Munger, W.; Jiang, P.; Whitby, T.G.; Chen, S.; Ji, W.; Man, X. Precipitation Extremes Influence Patterns and Partitioning of Evapotranspiration and Transpiration in a Deciduous Boreal Larch Forest. Agric. For. Meteorol. 2020, 287, 107936. [Google Scholar] [CrossRef]
  80. Paul-Limoges, E.; Wolf, S.; Schneider, F.D.; Longo, M.; Moorcroft, P.; Gharun, M.; Damm, A. Partitioning Evapotranspiration with Concurrent Eddy Covariance Measurements in a Mixed Forest. Agric. For. Meteorol. 2020, 280, 107786. [Google Scholar] [CrossRef]
  81. Kubota, T.; Kagawa, A.; Shichi, K.; Ono, K. The Promotional Effect of Increased Growth on Transpiration Exceeds the Inhibitory Effect of Increased Water Use Efficiency over the Life History of Fagus Crenata Trees. J. For. Res. 2022, 27, 1–11. [Google Scholar] [CrossRef]
  82. Fisher, R.A.; Williams, M.; Do Vale, R.L.; Da Costa, A.L.; Meir, P. Evidence from Amazonian Forests Is Consistent with Isohydric Control of Leaf Water Potential. Plant Cell Environ. 2006, 29, 151–165. [Google Scholar] [CrossRef]
  83. Yi, K.; Dragoni, D.; Phillips, R.P.; Roman, D.T.; Novick, K.A. Dynamics of Stem Water Uptake among Isohydric and Anisohydric Species Experiencing a Severe Drought. Tree Physiol. 2017, 37, 1379–1392. [Google Scholar] [CrossRef] [PubMed]
  84. Hesse, B.D.; Gebhardt, T.; Hafner, B.D.; Hikino, K.; Häberle, K.-H.; Grams, T.E.E. High Resilience of Water Related Physiology after Five Years of Repeated Summer Drought of Mature Beech and Spruce. Copernic. Meet. 2022, No. EGU22-2835. [Google Scholar] [CrossRef]
  85. Liu, X.; Biondi, F. Transpiration Drivers of High-Elevation Five-Needle Pines (Pinus longaeva and Pinus flexilis) in Sky-Island Ecosystems of the North American Great Basin. Sci. Total Environ. 2020, 739, 139861. [Google Scholar] [CrossRef] [PubMed]
  86. Fang, J.; Tian, Q.; He, Z.; Du, J.; Chen, L.; Lin, P.; Zhu, X. Response of Sap Flow in Qinghai Spruce (Picea crassifolia) to Environmental Variables in the Qilian Mountains of China. Trees 2022, 36, 1261–1272. [Google Scholar] [CrossRef]
  87. Wu, Y.; Zhang, Y.; An, J.; Liu, Q.; Lang, Y. Sap Flow of Black Locust in Response to Environmental Factors in Two Soils Developed from Different Parent Materials in the Lithoid Mountainous Area of North China. Trees 2018, 32, 675–688. [Google Scholar] [CrossRef]
  88. Dolschak, K.; Gartner, K.; Berger, T.W. The Impact of Rising Temperatures on Water Balance and Phenology of European Beech (Fagus sylvatica L.) Stands. Model. Earth Syst. Environ. 2019, 5, 1347–1363. [Google Scholar] [CrossRef]
  89. Wang, X.; Zhu, X.; Xu, M.; Wen, R.; Jia, Q.; Xie, Y.; Ma, H. Evapotranspiration Dynamics and Their Drivers in a Temperate Mixed Forest in Northeast China. PeerJ 2022, 10, e13549. [Google Scholar] [CrossRef] [PubMed]
  90. Urban, J.; Ingwers, M.; McGuire, M.A.; Teskey, R.O. Stomatal Conductance Increases with Rising Temperature. Plant Signal. Behav. 2017, 12, e1356534. [Google Scholar] [CrossRef]
  91. Jiang, S.; Liang, C.; Cui, N.; Zhao, L.; Liu, C.; Feng, Y.; Hu, X.; Gong, D.; Zou, Q. Water Use Efficiency and Its Drivers in Four Typical Agroecosystems Based on Flux Tower Measurements. Agric. For. Meteorol. 2020, 295, 108200. [Google Scholar] [CrossRef]
  92. Zhu, X.-J.; Yu, G.-R.; Hu, Z.-M.; Wang, Q.-F.; He, H.-L.; Yan, J.-H.; Wang, H.-M.; Zhang, J.-H. Spatiotemporal Variations of T/ET (the Ratio of Transpiration to Evapotranspiration) in Three Forests of Eastern China. Ecol. Indic. 2015, 52, 411–421. [Google Scholar] [CrossRef] [Green Version]
Figure 1. Daily dynamics of meteorological conditions during the 2019–2020 period. Air temperature (a), precipitation (b), vapour pressure deficit (c), soil water content (d) and photosynthetic active radiation (e). The vertical blue dashed lines represent the borders of analysed periods for evapotranspiration partitioning.
Water 14 03015 g001
Figure 2. Dynamics of ecosystem transpiration and evapotranspiration daily sums (a) and transpiration to evapotranspiration ratio (b) during the 2019–2020 period. Relationship between daily ecosystem transpiration and evapotranspiration rates (c).
Water 14 03015 g002
Figure 3. Dynamics of ecosystem evapotranspiration and potential evapotranspiration (daily sums) during the 2019–2020 period (a). Relationship between daily ecosystem evapotranspiration and potential evapotranspiration (b).
Water 14 03015 g003
Figure 4. Monthly averages with 95% confidence intervals for ecosystem evapotranspiration (a), transpiration (b) and transpiration/evapotranspiration ratio (c). Distinguishable groups derived from Tukey’s HSD post hoc test are represented by the capital letters.
Water 14 03015 g004
Figure 5. Impact of daily mean air temperature (a,b), vapour pressure deficit (c,d), soil water content (e,f) and photosynthetic active radiation (g,h) on daily sums of ecosystem transpiration, evapotranspiration, and transpiration/evapotranspiration ratio during the 2019–2020 (April–October) period.
Water 14 03015 g005
Figure 6. Impact of monthly mean air temperature (ac), vapour pressure deficit (df), soil water content (gi) and photosynthetic active radiation (jl) on monthly mean ecosystem transpiration, evapotranspiration, and transpiration/evapotranspiration ratio during the 2019–2020 (April–October) period.
Water 14 03015 g006
Table 1. Average values of air temperature (Tair) and vapour pressure deficit (VPD), and sum values of precipitation (P) for the whole year and the March–October period (3–11 subscript).
YearT airPVPDT air (3–11)P (3–11)VPD (3–11)
(°C)(mm)(hPa)(°C)(mm)(hPa)
20199.916533.3613.884274.66
20208.868353.5412.466694.92
2009–20169.266883.5512.295714.44
Table 2. Results of one-way ANOVA for statistical differences of transpiration, evapotranspiration, and transpiration to evapotranspiration ratio between the months.
DFSumSQMeanSQFp
Evapotranspiration
Month13311.823.98640.93<0.001
Residuals277162.30.586
Transpiration
Month13184.414.1933.78<0.001
Residuals277116.30.42
Transpiration/Evapotranspiration
Month136.4740.49815.92<0.001
Residuals2778.6630.031
Publisher’s Note: MDPI stays neutral with regard to jurisdictional claims in published maps and institutional affiliations.

