
Geochemical Composition, Source and Geothermometry of Thermal Water in the Bugok Area, South Korea

1
Department Construction and Safety Engineering, Daejeon University, Daejeon 34520, Korea
2
Geochemical Research Center, Graduate School of Science, The University of Tokyo, Tokyo 113-0033, Japan
*
Authors to whom correspondence should be addressed.
Water 2022, 14(19), 3008; https://doi.org/10.3390/w14193008
Submission received: 4 August 2022
/
Revised: 17 September 2022
/
Accepted: 20 September 2022
/
Published: 24 September 2022
(This article belongs to the Special Issue Hydrochemical Characteristics of Geothermal Water)
Abstract
:Thermal water from the hot springs around Bugok, South Korea, has the highest discharge temperature (78 °C), and the source of that heat is of primary interest. The key 3He/4He ratio runs along a single air-mixing line between the mantle and the crust, with the latter accounting for 97.0–97.3%. This suggests that the thermal source is radioactive decay in granodiorite, rock that intruded beneath the Cetaceous era sedimentary rock. Thermal water containing Na–HCO3 (SO4) evolved geochemically from stream water and groundwater containing Ca–HCO3. With respect to δ34S, there are two types of thermal water: low temperature with low δ34S (−3.00~+1.00‰), and high temperature with high δ34S (+4.60~+15.0‰), which is enriched by the kinetic fractionation of H2S. The thermal water samples, except for a few, reached partial chemical equilibrium. The thermal reservoir temperatures were estimated as in the range of 90–126 °C by the K–Mg geothermometer of Giggenbach and the thermodynamic equilibrium of quartz and muscovite. This study suggests a conceptual model for the formation of geothermal water, including the thermal reservoir in the Bugok area.
1. Introduction
Of all the 374 hot springs in South Korea, Bugok hot spring in the southeastern province of the Korean peninsula has the highest discharge water temperature (maximum 78 °C). Temperatures over 45 °C present at about 22% of hot springs, occurring mainly along a fracture zone of crystalline rock such as granite and gneiss [1]. However, Bugok thermal water, which includes sulfur gas, derives from Cretaceous sedimentary rock, which is not regarded as a major thermal. Hence, the geothermal source of the Bugok hot springs is attracting academic interest.
It is generally recognized that geothermal heat in South Korea, which is in a non-volcanic region, is associated with a high local geothermal gradient caused by the radioactive decay of elements such as 238U, 232Th, and 40K in crystalline rock [2]. The average gradient is about 29.34 °C/km. According to the geological era, the gradients in the rock strata are 39.70 °C/km (Cenozoic), 30.63 °C/km (Mesozoic), and 22.30–24.35 °C/km (Proterozoic and Precambrian) [3]. From the temperature logging data of the 11 geothermal wells in Bugok, the gradient varies widely from 2.5 to 21.8 °C/100 m, which corresponds to the thermal water discharge temperature [4].
An important clue concerning the heat source of Bugok thermal water derives from two elements that are reliable indicators of the circulation of volatile elements in the atmosphere and the Earth: neon (Ne) and helium (He). Helium has two isotopes: 4He is produced from the radioactive decay of elements in the crust such as uranium and thorium, whereas primordial 3He derives from the mantle and magma. Neon isotopic ratios in the mantle are characterized by higher composition ratios compared to the atmosphere [5,6,7]. The ratios of Ne and He are integral and the elements derives from three sources: (1) the atmospheric source of 3He/4He = 1.384 × 10⁻⁶ (1 Ra) [8] and 4He/20Ne = 0.317; (2) a mid-ocean ridge basalt (MORB)- type upper-mantle source of 3He/4He = 12 × 10−6 (8.5 ± 1 Ra) [8] and 4He/20Ne > 10,000; (3) a crustal source of 3He/4He = 5 × 10⁻⁹ (0.01–0.1 Ra) [9] and 4He/20Ne > 10,000 [9,10,11,12,13]. In addition, the 3He/4He ratios of Ocean Island Basalt (OIB) are in the range of 4.3–14.4 Ra, depending on the region [8,14,15,16]. The 3He/4He ratio in the geothermal waters is reported to be 0.014–1.759 × 10⁻⁶ (0.01–0.67 Ra) [17,18,19,20], which indicates a dominant crustal origin for 4He. Since both carbonated cold and thermal water show a 3He/4He ratio of 1.18–6.07 × 10⁻⁶ (0.85 to 4.39 Ra) [21,22] indications are that the primordial 3He source derives from the upper mantle [20].
Geothermometers (i.e., cation geothermometer, Giggenbach trilinear plot, and a silica-enthalpy model) are generally used to estimate thermal reservoir temperature [23,24,25,26,27,28,29,30], but a thermodynamic equilibrium model can also achieve this, provided that the equilibrium state between the minerals and water is temperature dependent. As a geothermometric estimation can result in divergent values according to the method used, it is often useful for different methods to be used simultaneously to obtain a reliable temperature.
This study investigated the geochemical composition and sulfur origin of thermal water in the hot springs around Bugok, South Korea, and determined the source of the thermal water by using an original mixing model of 3He/4He and 4He/20Ne and temperature logging data from thermal water wells. We also estimated the thermal reservoir temperature by using a Giggenbach diagram and a thermodynamic equilibrium model.
2. Study Site
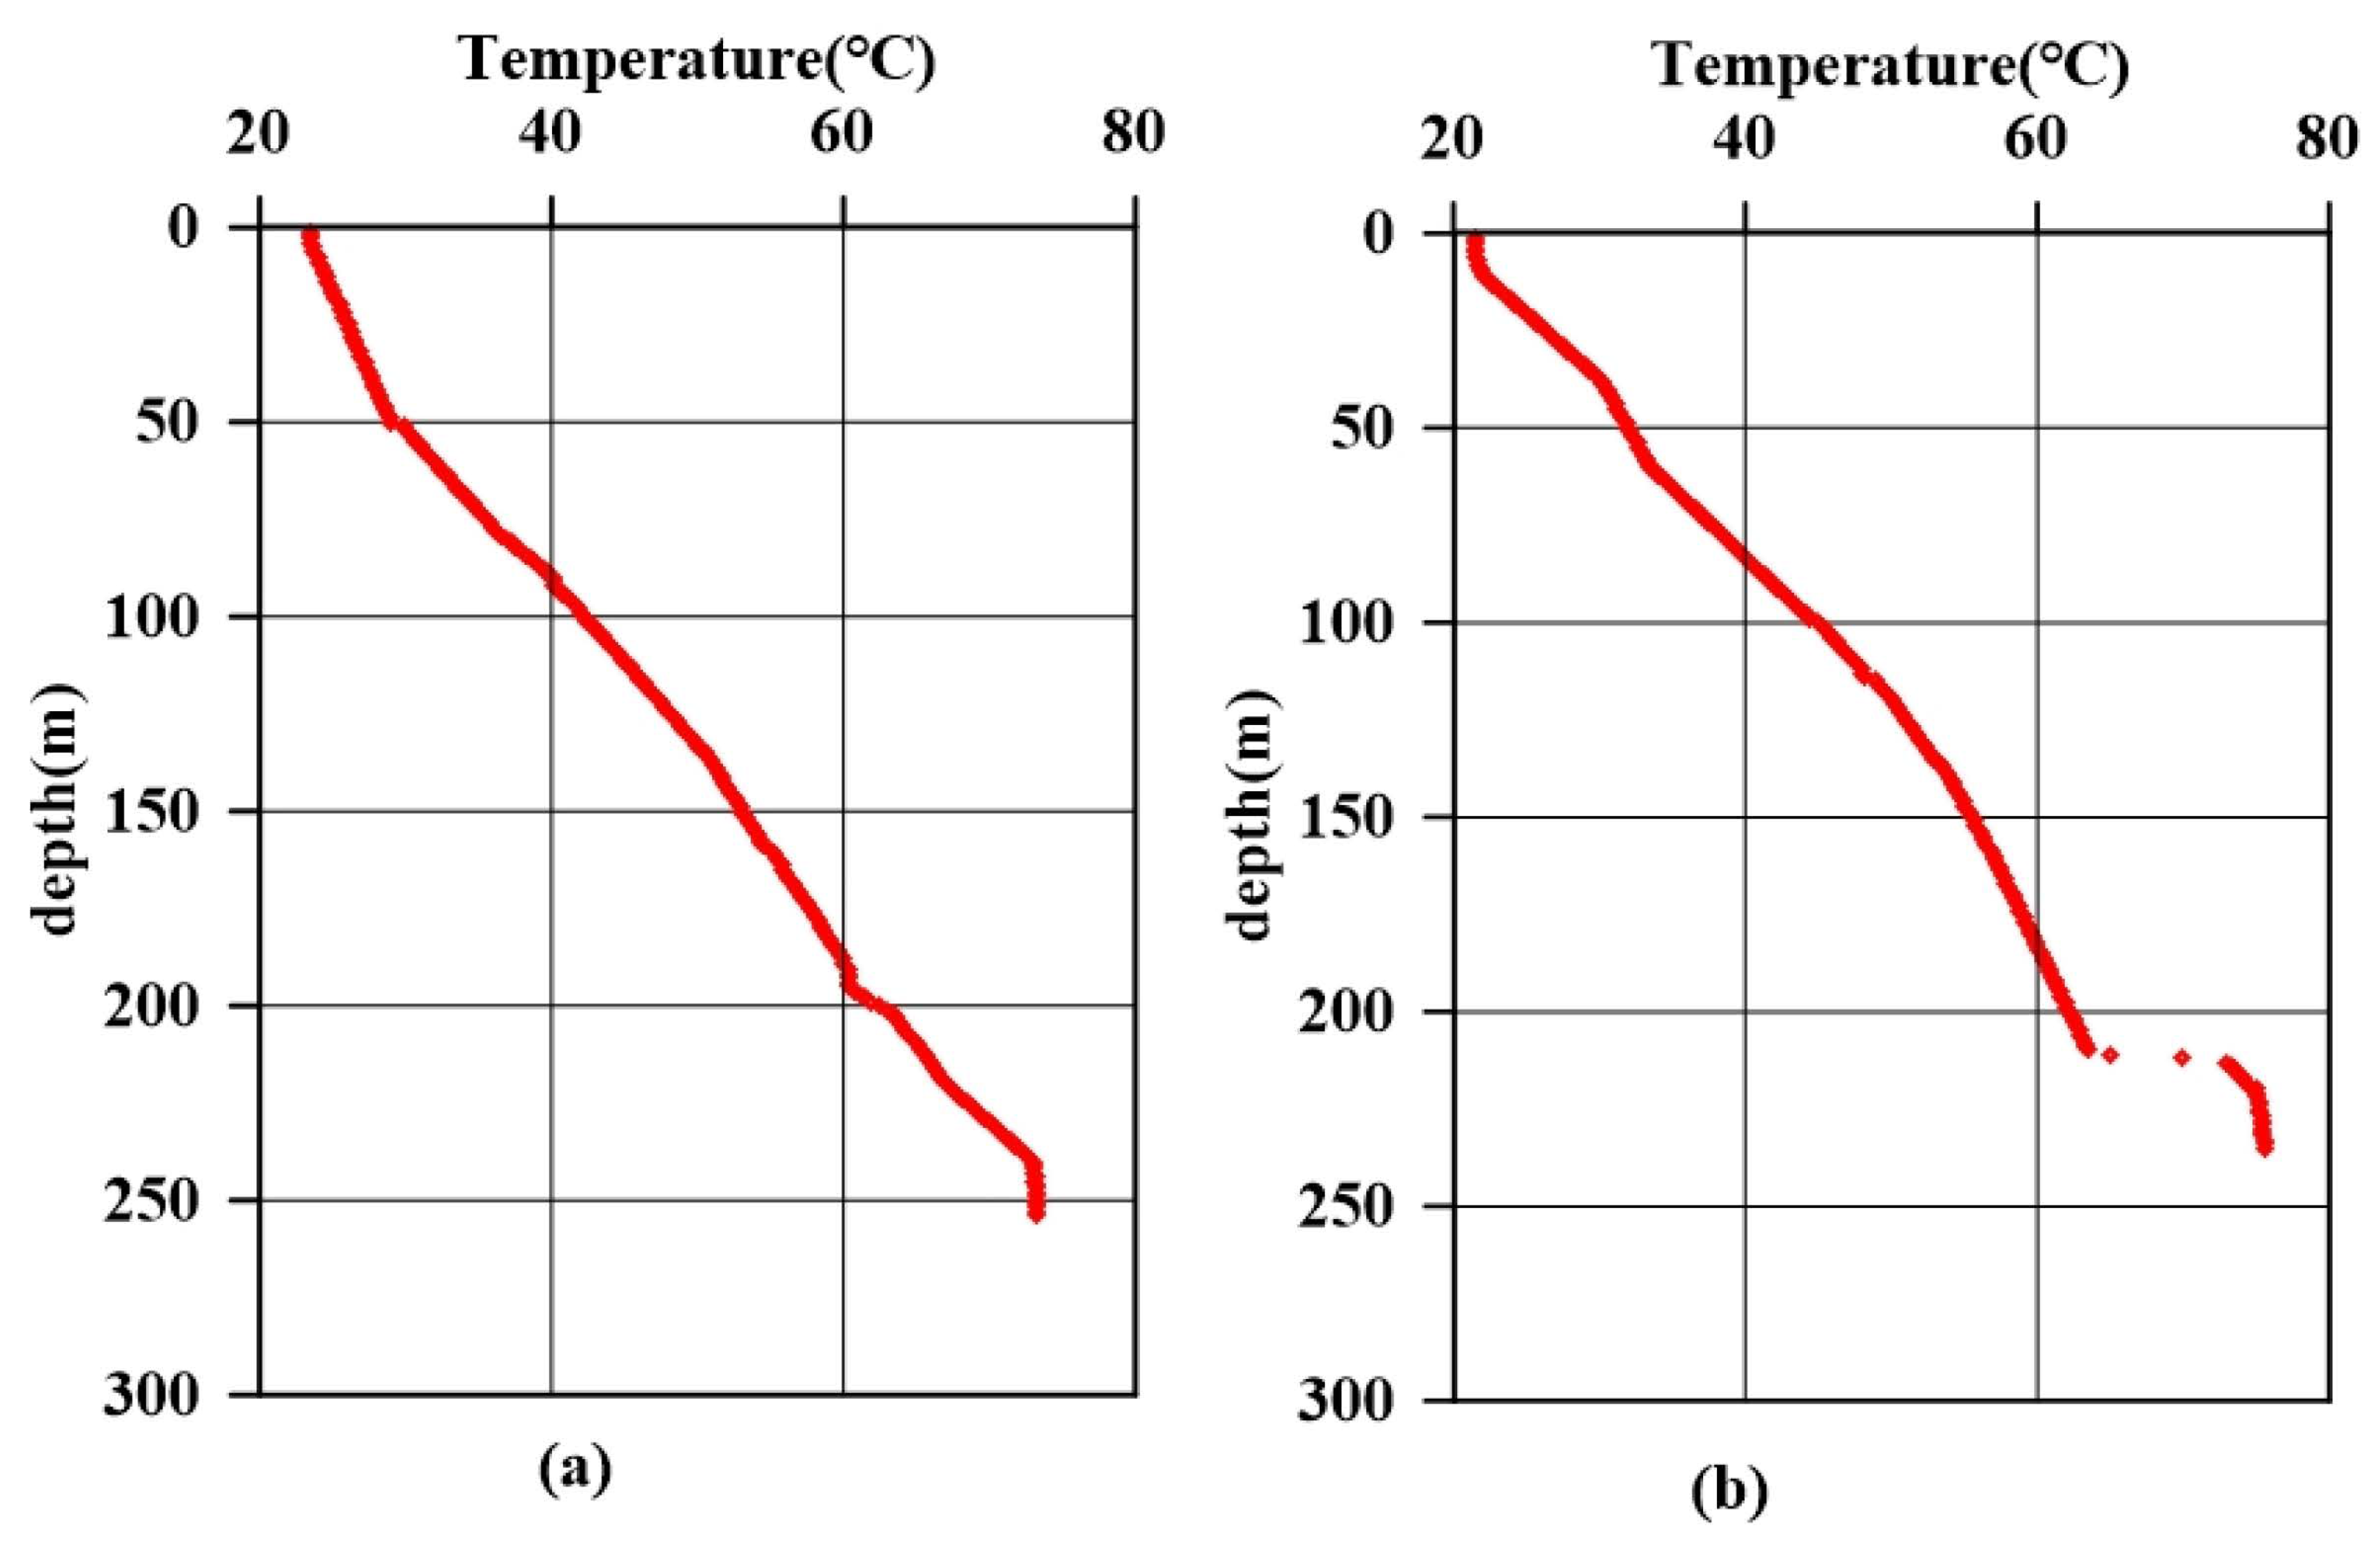
The Korean Peninsula is situated on the southeastern margin of the Eurasian plate (Figure 1a), and the Bugok area is about 300 km southeast of the capital Seoul in a small basin composed of granodiorite and andesite, meaning that the groundwater flow is concentrated at the center of the basin. The average annual temperature observed at the Miryang meteorological weather station (about 15 km away from Bugok) has ranged from 13.4 to 14.7 °C over the past decade. The annual precipitation for the last 10 years ranged from 588 to 1568 mm, of which approximately 38.8% was concentrated in the monsoon season in July and August. The average was 1193 mm/year. The geology of the Bugok area consists mainly of granodiorite intruding at the western part of the study area (Figure 1b) and a Cretaceous Chindong formation unconformably covered with Chusan andesite at the eastern part. The upper part of the formation consists mainly of alcos sandstone and shale intercalated with tuffaceous shale and coal shale, and dark-grey and greenish-grey shale are major rocks in the lower part [31]. The alcos sandstone is composed of the quartz, feldspar, and andesite fragments with a little plagioclase, coal, and iron. The Cretaceous sedimentary basin is known to have a relatively stable lacustrine environment under an overall dry climate [32]. Chusan andesite rock––andesite, pyroxene, trachyte andesite, brecciated andesite––is seen in lava flows, intruded rock, and a rock floor at the eastern part. The acidic and basic dykes are randomly found in a north-south direction, and the quartz and calcite veins are developed along a strike of the north−south or N40W direction. However, granodiorite and dykes were found at deep drilled cores to develop thermal wells [33], indicating that deep underground geology differs from surface geology. Hence, the granodiorite intrusion beneath the sedimentary rock is important for determining the thermal source. The temperature logging data of 11 thermal water wells showed two different thermal-gradient patterns: a steady increase with depth and an abrupt increase at a certain depth after a steady increase (Figure 2). It is also commonly recognized that increases in the temperature gradient are limited below a certain depth in all wells. The thermal water occurs along the N60–80W trending valley at, or very near, the intersection with a major N10–20W trending structure [34]. Two lineaments, N10° W (north–south) and N80° W (east–west), were recognized by aerial photography. The largest structure in the east–west direction is the Youngsan fault [4], a left-lateral strike-slip fault with a dip of 85°.
3. Materials and Methods
3.1. Sample and In-Situ Measurement
For this study, 11 geothermal water, 6 cold groundwater, and 6 stream water samples were collected. Their location is presented in Figure 1. The thermal water samples were collected about 10 min after purging to obtain stable temperatures. The temperature (oC), pH, oxidation-reduction potential (Eh, mV), dissolved oxygen content (DO, mg/L), and electrical conductivity (EC, μS/cm) of all water samples were measured in-situ using portable measurement devices (Orion three star and five star, Thermo Scientific, Beverly, MA, USA). The values of all parameters except temperature were adjusted to 25 °C and recorded in a stabilized state after continuous measurement at regular intervals for about 10 or 15 min. The alkalinity of water samples was measured by acid neutralization titration using 0.05 N of hydrochloric acid and expressed as bicarbonate content. The water samples for the chemical and isotopic analysis were filtered using a 0.45 μm membrane filter and preserved in 60 mL of high-density polyethylene (HDPE) bottles. The samples for the cation analysis were acidized to pH < 2 using ultrapure HNO3. All water samples were stored below 5 °C before the chemical analysis.
3.2. Chemical and Isotopic Analysis
The major cations (Ca, Mg, K, Na, Fe, Mn, Sr) and silica of the water samples were analyzed using atomic absorption spectrometry (AAS, Unicam model 989, Unicam Sistemas Analiticos, Lda, Lisbon, Portugal) and inductively coupled plasma atomic emission spectrometry (ICP-AES, Shimadzu model ICPS-1000 III, Kyoto, Japan). The anions (SO4, Cl, NO3, F) were measured using ion chromatography (Dionex DX-120, Dionex Corporation, California, CA, USA) at the Korean Basic Science Institute (KBSI) of Daejeon, South Korea. The analytical precision of major ions is within ±5%.
The δ18O and δD of the water samples were measured using a stable isotope ratio mass spectrometer (GV Instruments Isoprime model, GV Instruments, Manchester, UK). The isotope ratios were expressed as values relative to the Vienna standard mean ocean water (V-SMOW). The analytical precisions of δ18O and δD are within ±0.1‰ and ±1.0‰, respectively.
To analyze the δ34S as a sulfate, the collected field samples were acidified until pH < 4 using concentrated hydrochloric acid. Then, the precipitate of barium sulfate (BaSO4), after the addition of BaCl2, was extracted from the solution through a membrane filter. The δ34S was measured using an isotope ratio mass spectrometer (PRISM II, VG Isotech, Manchester, UK) at the Korean Basic Science Institute (KBSI) of Daejeon. Sulfur isotope ratios are expressed as values relative to the Cannon Diablo Troilite (CDT) ±0.2‰.
3.3. Noble Gas Analysis
The samples for the helium and neon isotope analysis in thermal water were collected in vacuum-tight lead-glass bottles with high vacuum stop-cocks at both ends. The bottle volume was approximately 50 cm3 and the analysis was performed at the University of Tokyo. Noble gases dissolved in the water samples were extracted by an all metal-Toepler pump system, which enabled us to measure noble gases under the condition of an ultra-low blank level. The Toepler pump system was specially designed because very low concentrations of noble gases were dissolved in the water samples.
The dissolved gases extracted from the thermal waters were compressed into a small volume connected to a noble gas purification line of a mass spectrometry system. They were extracted from the water samples using the Toepler pump, and those from the gas samples were purified by two Ti-Zr getters and separated into three fractions—He, Ne, and Ar-Kr-Xe—using charcoal traps and a cryogenically cooled sintered stainless-steel trap. The He and Ne isotopic ratios and their absolute abundances for this study were measured on a modified VG5400 (MS-III) noble gas mass spectrometer at the Laboratory for Earthquake Chemistry, University of Tokyo. The sensitivities and mass discrimination correction factors of the mass spectrometer system were determined by measuring known amounts of atmosphere using the same procedure applied to the samples (details described by Aka et al., 2001) [35].
3.4. Geothermometry
A reservoir temperature of thermal water can be estimated indirectly by cation and silica geothermometry. The estimated temperature can be valid under the following assumption: (1) chemical reactions in the deep environment are temperature dependent; (2) the chemical composition from geothermometry in the thermal aquifer is included; (3) chemical equilibrium exists between thermal water and rock in the deep environment; (4) there is hardly any dilution or mixture between thermal and cold water during the ascent of thermal water to the surface [36]. However, conditions satisfying all cases are almost nonexistent in the field. Nevertheless, geothermometry can be accepted as a valuable method for estimating comparatively deep thermal reservoir temperatures [24,25,26,27,28,29,30,31].
A Giggenbach diagram, widely accepted for estimating the reservoir temperature of thermal water, was used in this study. The saturation index (LogQ/K) between the minerals and thermal water was calculated using the PHREEQC (v.3.5) [37]. Hence, the LogQ/K value for each mineral provided a measure of the proximity of aqueous solution components that attain thermodynamic equilibrium with the minerals.
4. Results
4.1. Geochemical Composition
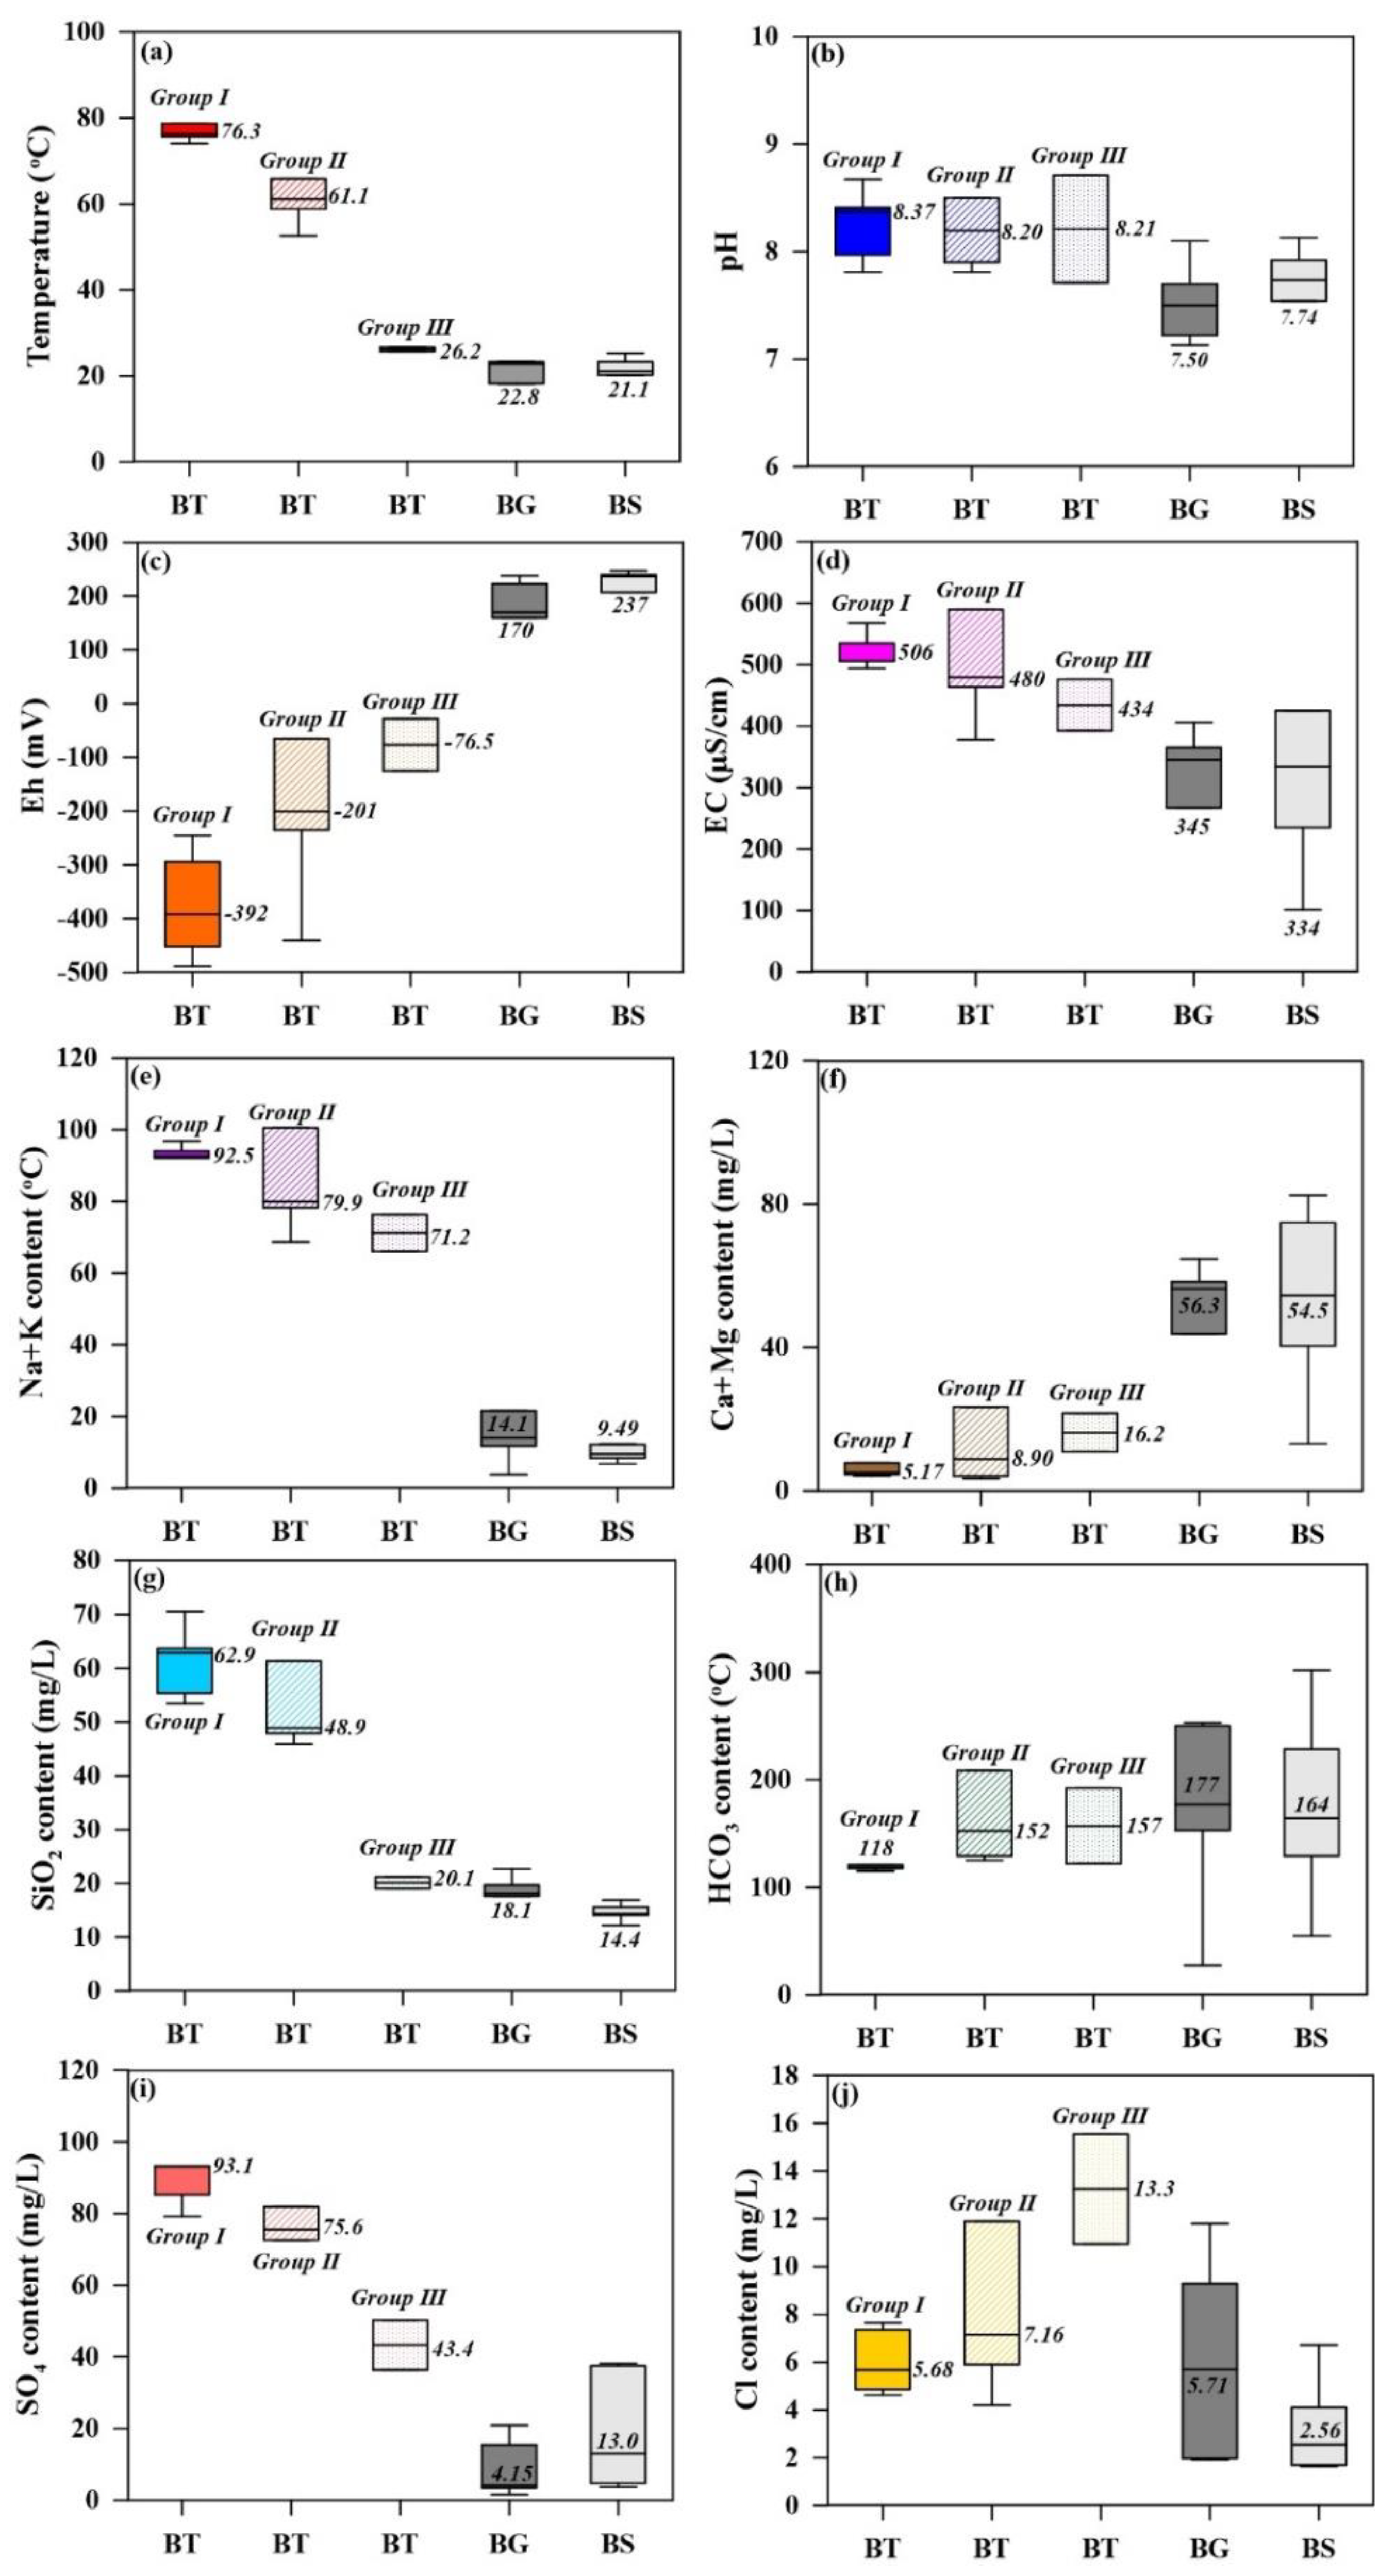
The geochemical data of all water samples are provided in Table 1 and Table 2. The in−situ measurements (pH, Eh, and temperature) of the data and chemical components (Na + K, Ca + Mg, SiO2, HCO3, SO4, and Cl) of all the water samples were statistically compared using the Box-whisker plot (Figure 3). Thermal water can be classified into Groups I, II, and III for temperature and Eh. Group I––high temperature (above 74 °C) with a negative Eh value (avg. −374 ± 48.6 mV); Group II––temperature between 52.6 °C and 65.8 °C with a negative Eh (avg. −227 ± 159 mV); Group III––low temperature (below 30 °C) with Eh (avg. −75.0 ± 48.6 mV). On the other hand, the content of Na + K, SiO2, SO4, and Cl revealed a distinct variation among the groups, while the pH and the content of Ca + Mg and HCO3 did not show a distinction among the thermal water groups.
Thermal water shows an alkaline pH (ave.8.15 ± 0.42) and reducing condition (Eh −28.0 ± 10 mV to −490 ± 10 mV) compared to the weak alkaline pH (avg. 7.58 ± 0.41) and oxidation condition (Eh of 3 ± 10 mV to 250 ± 10 mV) of groundwater and stream water. In major ions, thermal water has higher amounts of Na + K, SO4 and SiO2 than groundwater or stream water. In contrast, the concentration of Ca + Mg and HCO3 was lower compared with that of the groundwater and stream water. In particular, the Mg concentration was very low (< 1 mg/L), except for Group III, because of Mg absorption by clay minerals in high-temperature geothermal systems [38,39].
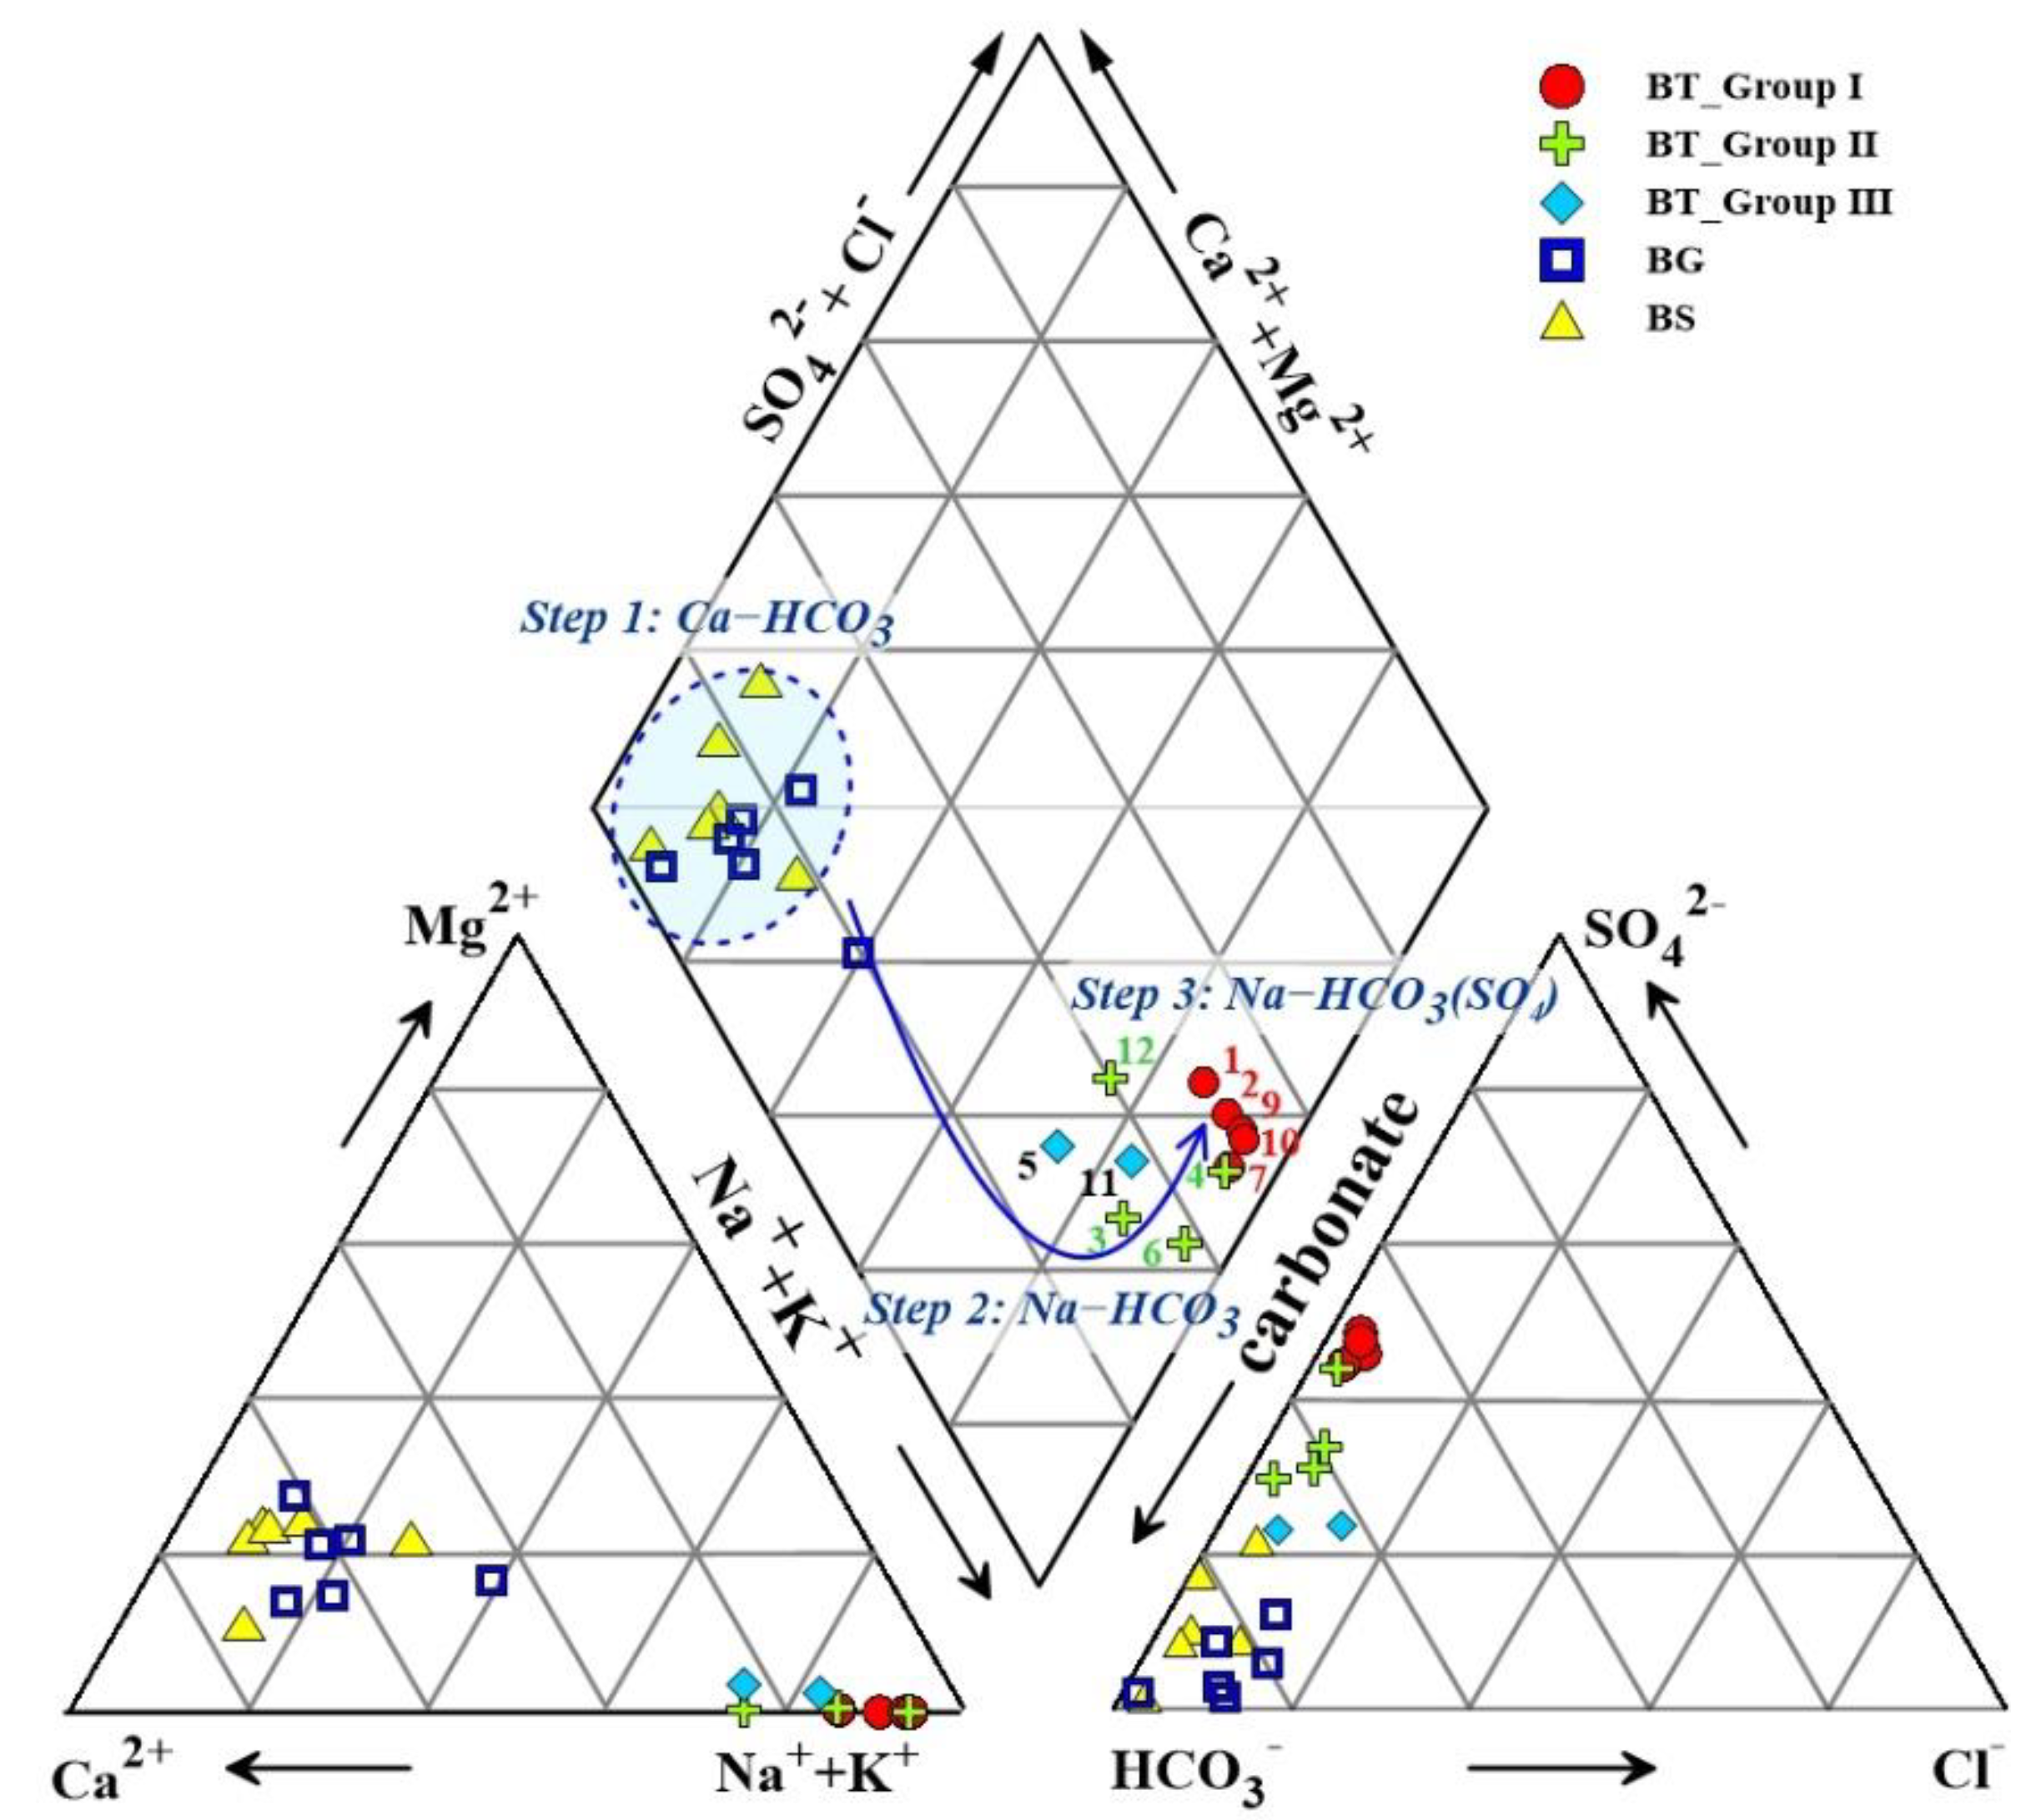
The major chemical data of all the water samples are plotted on the trilinear Piper diagram to identify the chemical type and the geochemical evolutionary path of thermal water from groundwater and stream water (Figure 4). Whereas groundwater and stream water belong to a Ca–HCO3 type, thermal water is considered a Na–HCO3 (SO4) type. Jeong et al. (1997) suggested that the Ca and Mg content of groundwater in granitic rocks showed an overall decreasing trend with the repeated dissolution of primary minerals and precipitation of secondary minerals. The Na ion, which is non-reactive, can be continuously concentrated in groundwater along the geochemical reaction path in a water-rock interaction system [40]. Hence, the thermal water in the Bugok area evolved from Ca–HCO3 type groundwater and stream water to Na–HCO3 type, to Na–HCO3 (SO4) type in a thermal environment. A rough proportional relationship between the thermal water temperature and SO4 content was likely to due to the more rigorous dissolution of magmatic pyrite in a thermal environment. The details regarding the origin of sulfate in thermal water are described in Section 4.3.
4.2. Oygen and Hydrogen Isotope
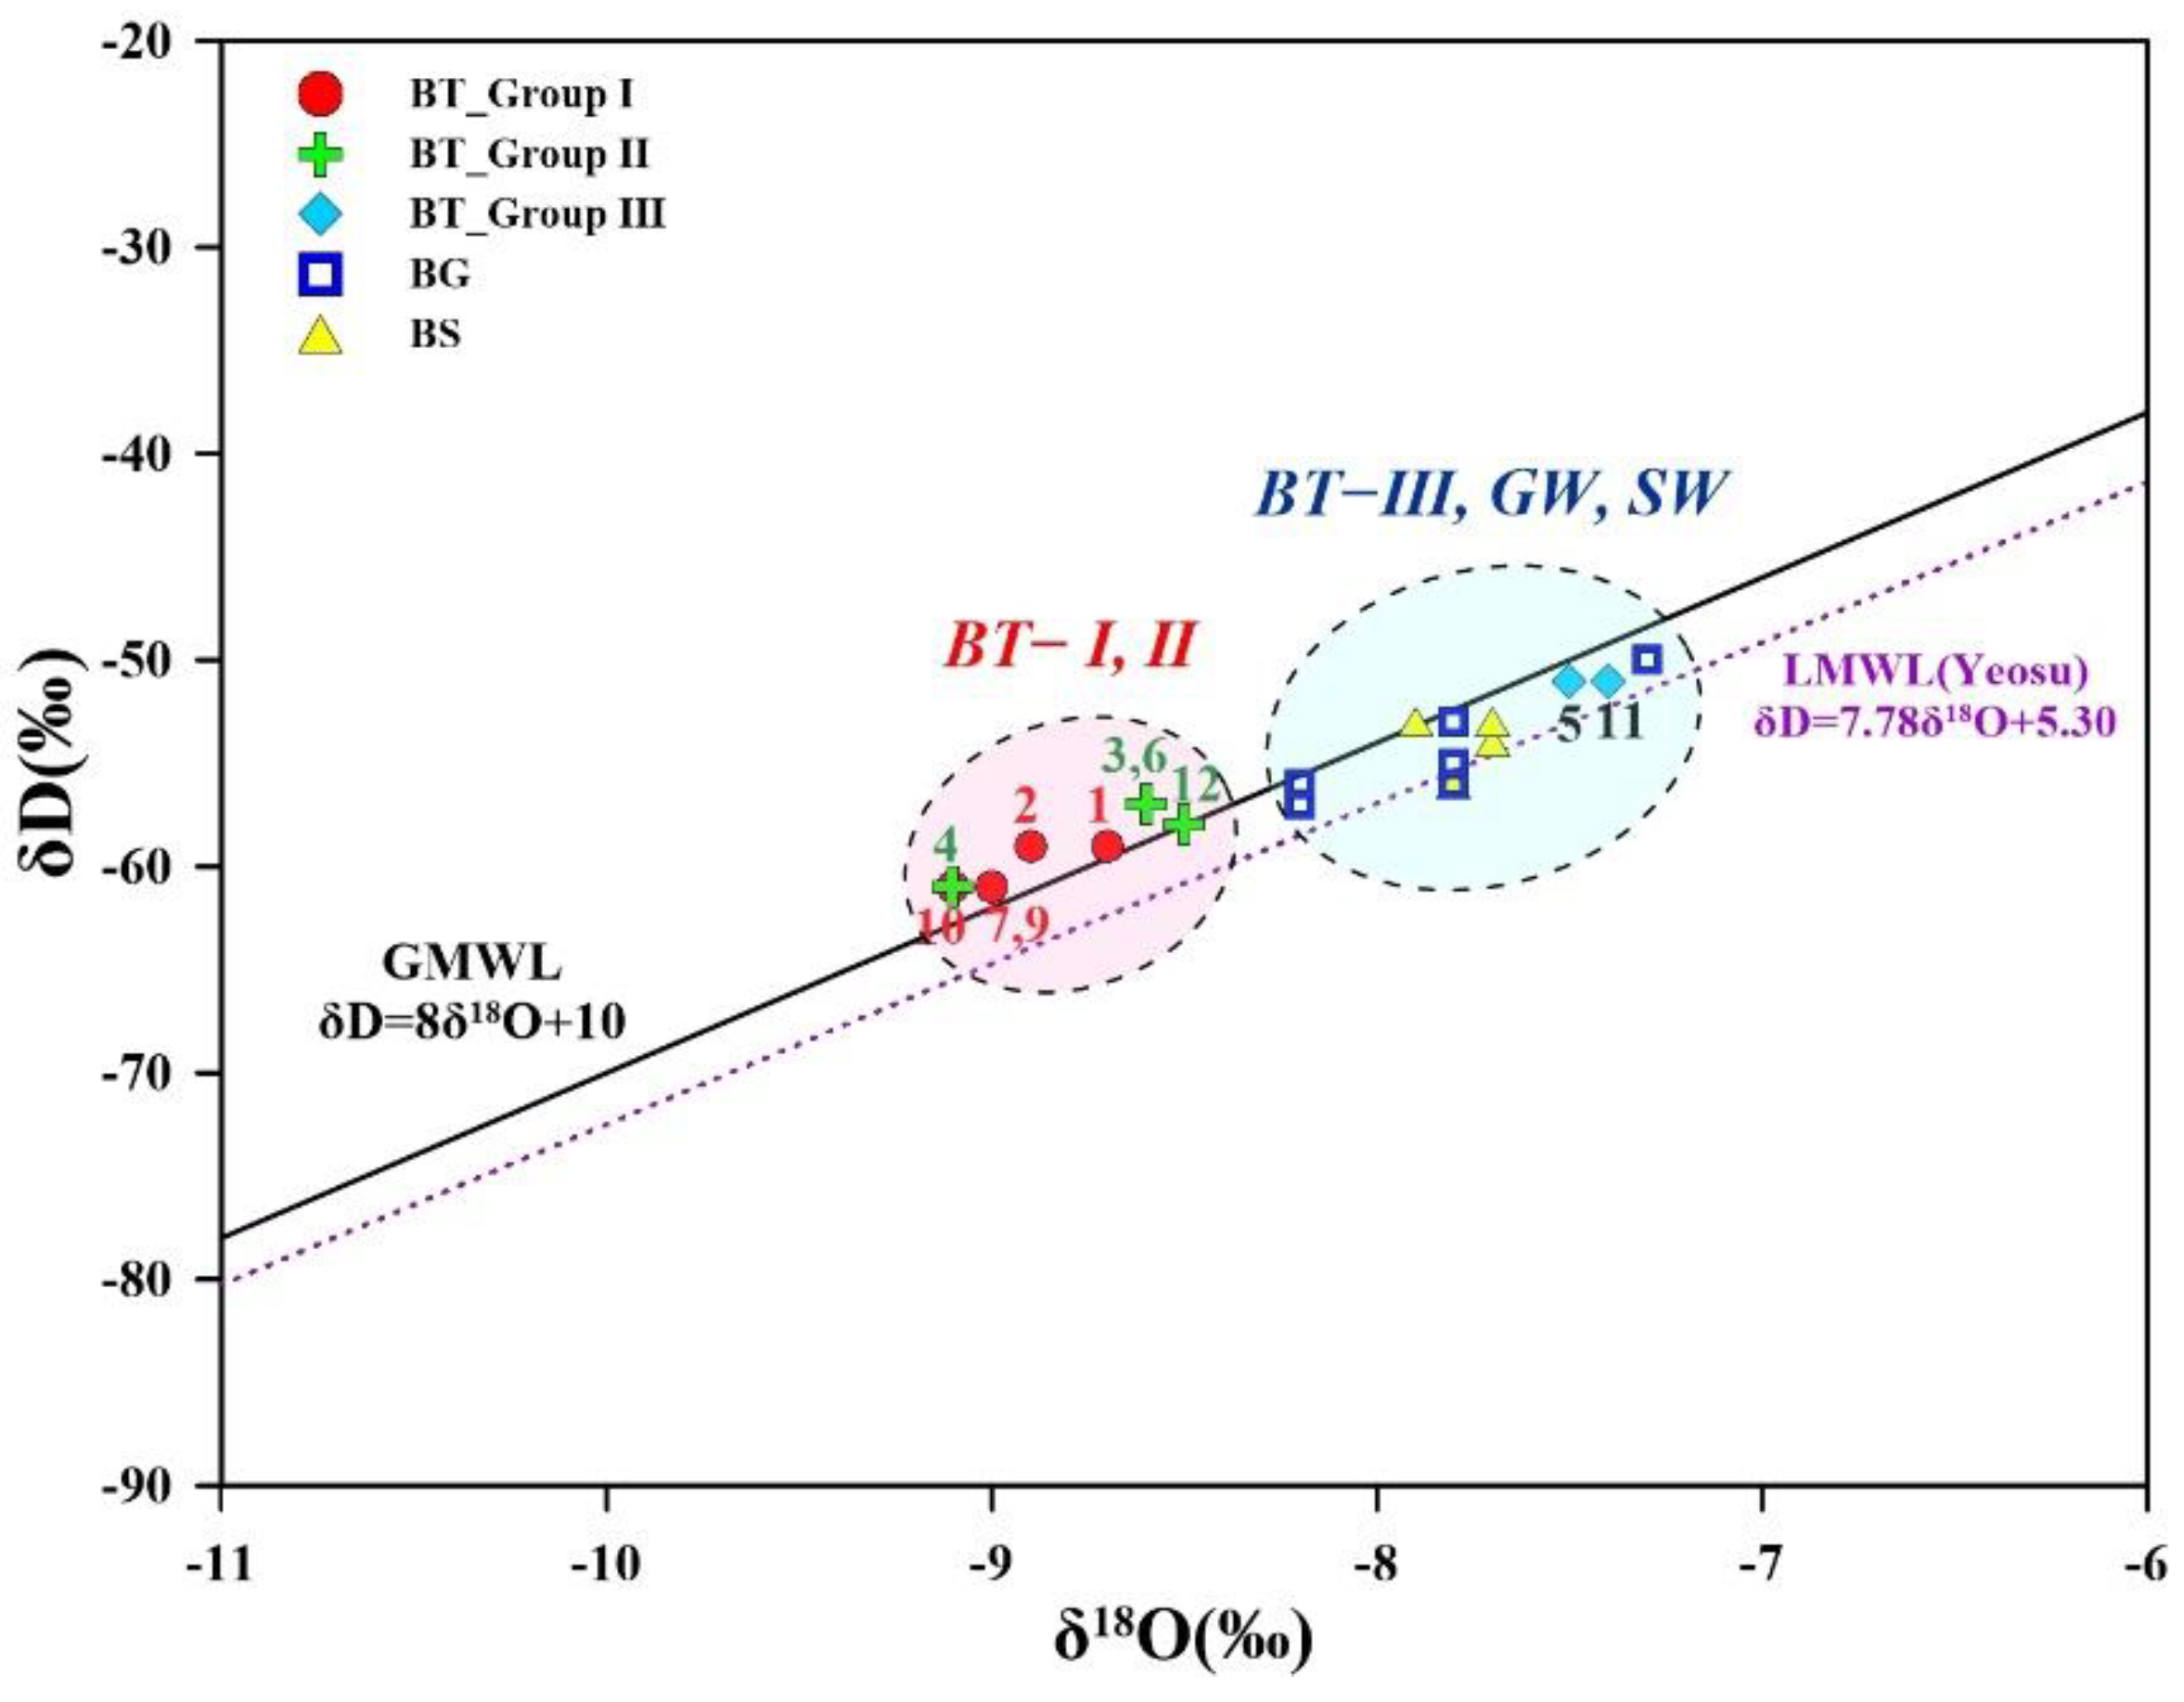
The δ18O and δD data from all the samples are presented in Table 1 and Table 2. Group Ⅰ and Ⅱ thermal water is plotted above or on the Global Meteoric Water Line (GMWL) [41] reflecting deuterium enrichment. Groundwater, stream water, and Group Ⅲ thermal water are plotted between the GMWL and the Local Meteoric Water Line (LMWL) [42] in Figure 5. It was reported that the isotopic fractionation of thermal water in the deep environment after the recharge of meteoric water caused deuterium enrichment through H2S exchange as follows [43,44]:
2H1HS(g) + 1H1HO(l) = 1H1HS(g) + 2H1HO(l)
The water samples can be divided into the two groups in Figure 5: (1) Group Ⅰ and Ⅱ thermal water with lower δ18O (−9.70‰ to −7.40‰) and δD (−61.0‰ to −51.0‰); (2) groundwater, stream water, and Group Ⅲ thermal water with higher δ18O (−8.20‰ to −7.30‰) and δD (−57.0‰ to −50.0‰). The depletion of δ18O and δD, which can reflect the altitude of the recharge area and the deep flow of thermal water and groundwater, followed in this order: Group I and II thermal water, groundwater, stream water and Group III thermal water. Data from δ18O and δD were also used to represent the flow of groundwater and thermal water in Section 4.6.
4.3. Sulfur Isotope
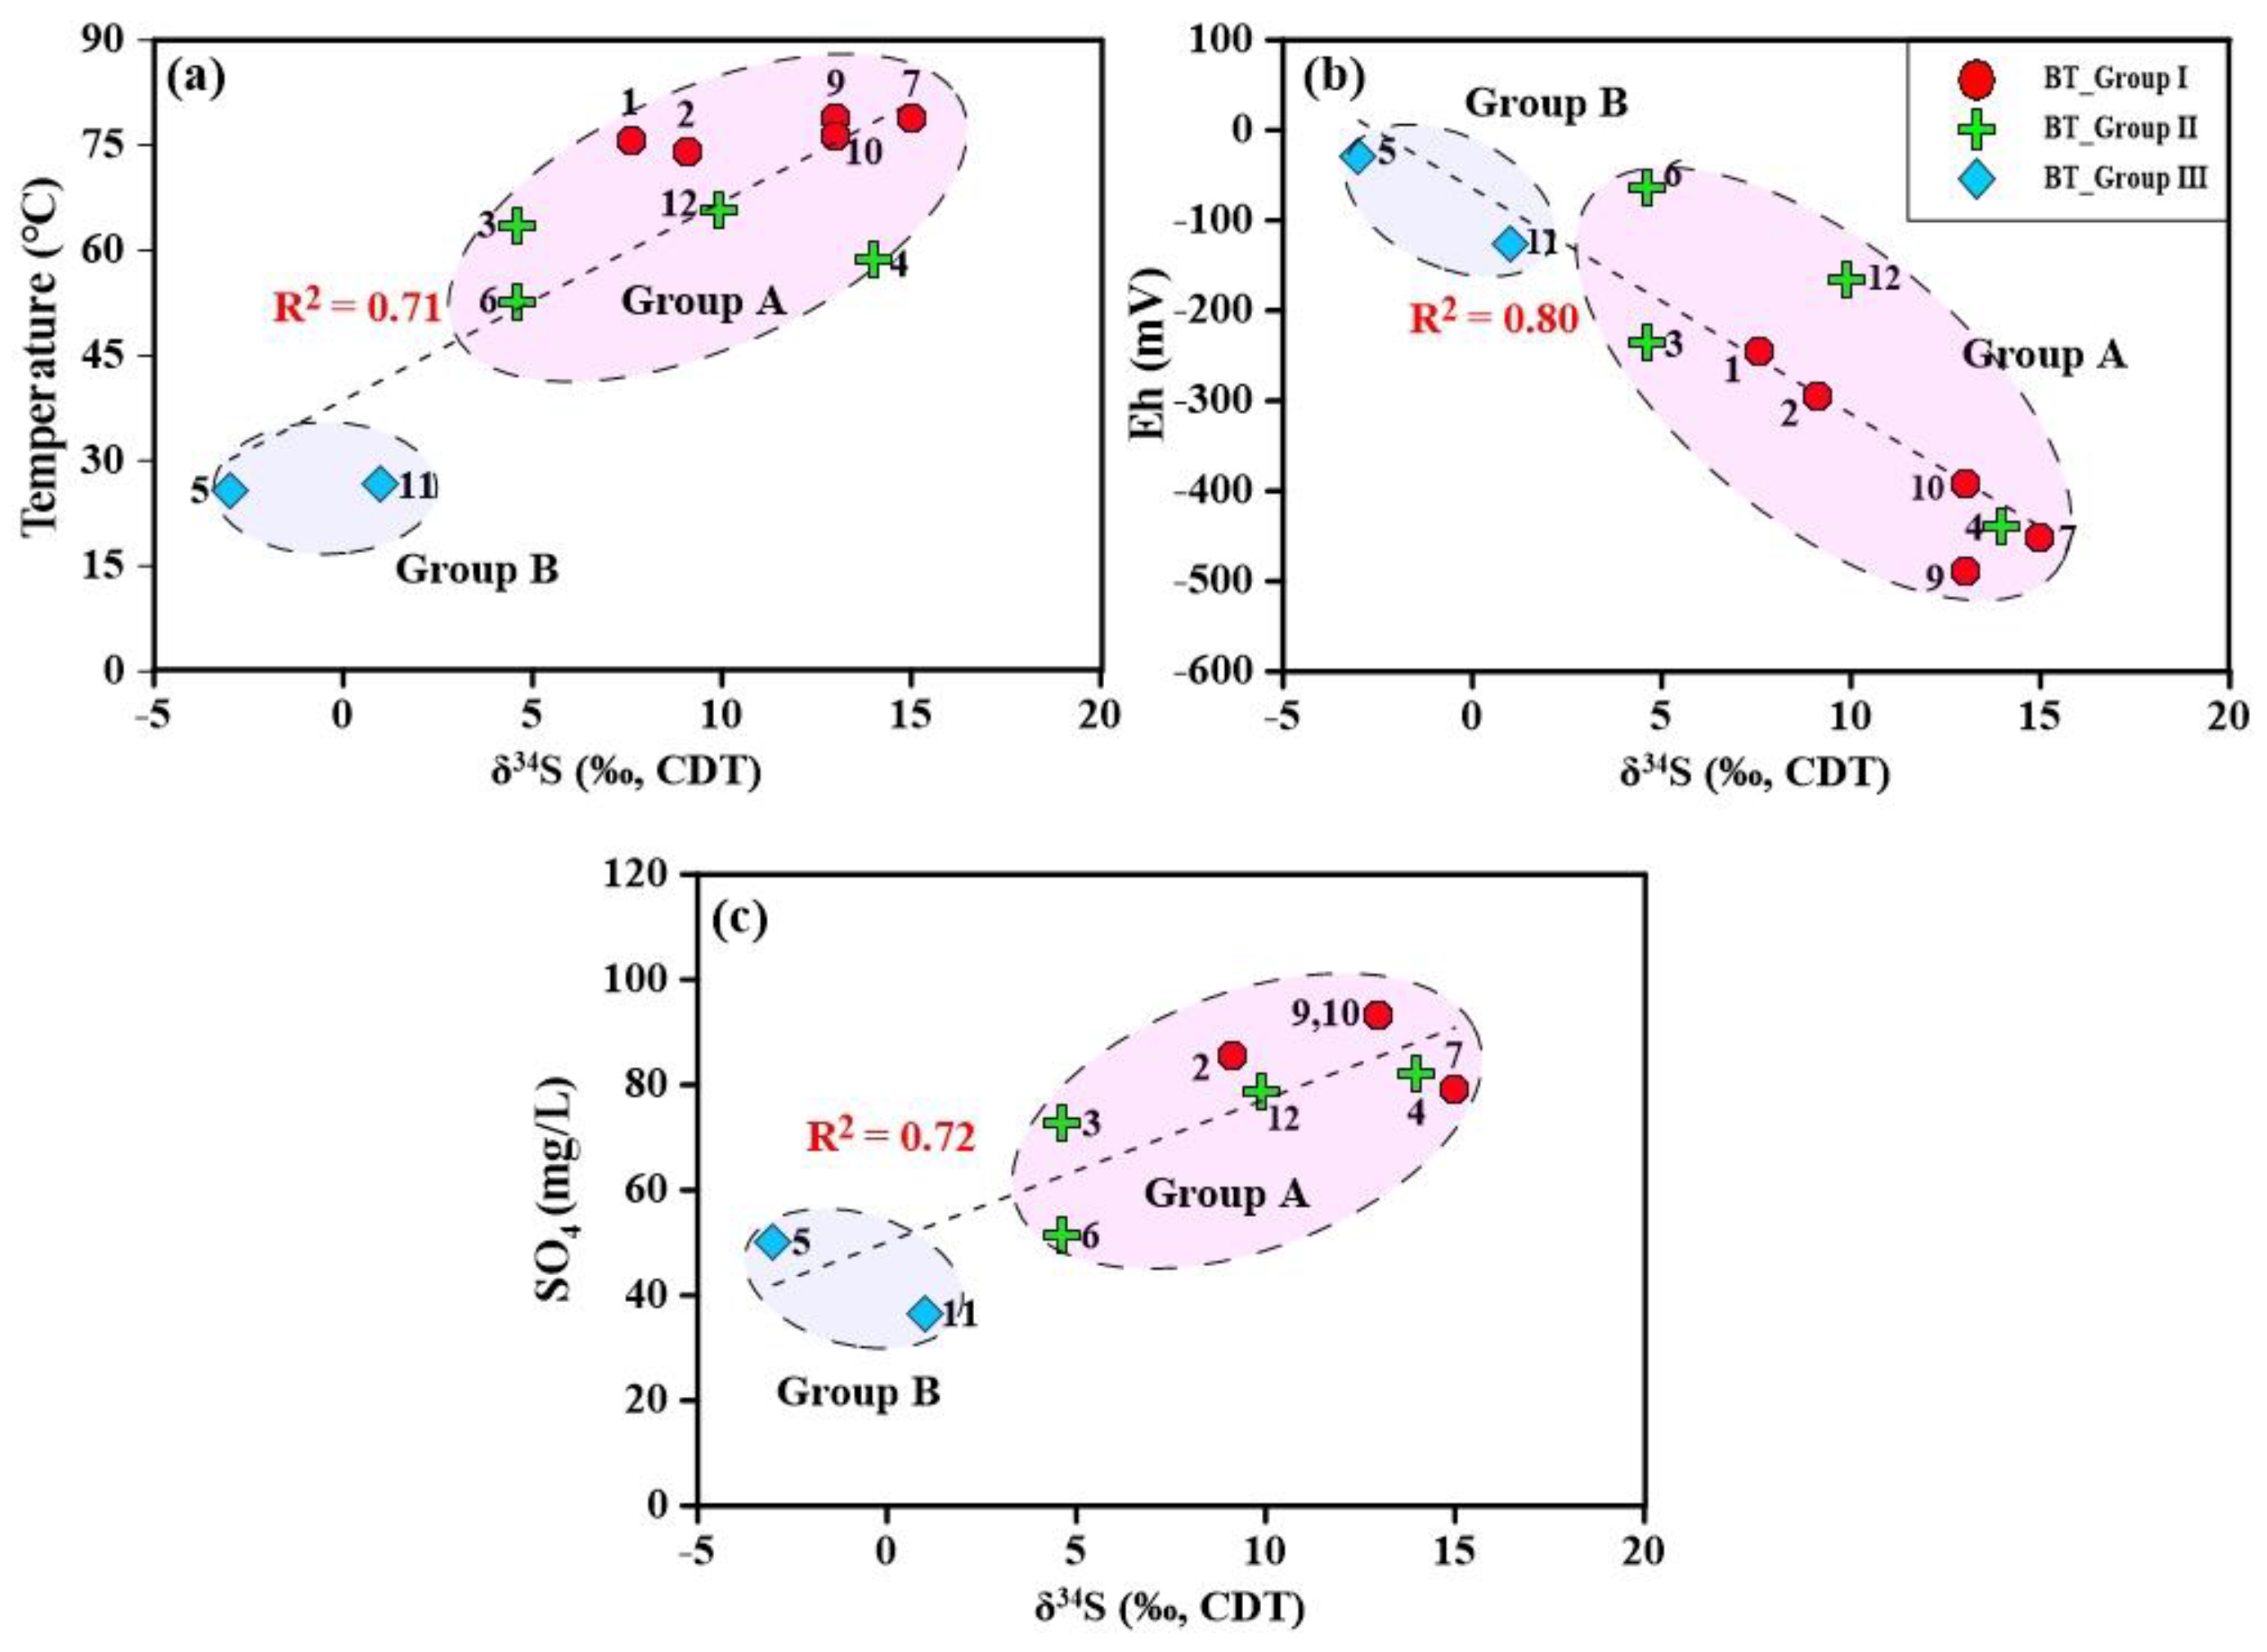
The δ34S of dissolved sulfate was measured from −3‰ to +15‰. Regarding δ34S and temperature, Bugok thermal water can be classified into two types: (1) a low δ34S type (−3‰ to +1‰) in low temperature (below 30 °C); (2) a high δ34S type (+4.6‰ to +15‰) in high temperature (above 50 °C) (Figure 6).
In previous studies, the δ34S of the sulfide minerals of ore deposits in South Korea ranged from −2.1 to +9.2‰ [45,46,47,48]. The δ34S in the atmospheric and seawater ranges from +6‰ to +7‰ and +20‰, respectively [33]. Lim and Jeong (1980) reported that Bugok thermal water retained H2S gas until it reached 9 ppm [49]. The δ34S of an evaporite such as gypsum is known to be in the range of +20 ± 0.2‰ [50,51]. Although a Cretaceous sedimentary basin has a dry climate, the occurrence of evaporate minerals has not been yet reported in Cretaceous rock [32]. Sulfur-reducing bacteria in a thermal anoxic aquifer environment can produce H2S by general metabolism:
where, CH2O represent generic organic matter [52].
2CH2O + SO42− → H2S + 2HCO3−
According to Equation (2), although the content of HCO3 in thermal water increased with the generation of H2S in a reducing condition, HCO3 content in Bugok thermal water, including H2S gas, had a lower value than in the stream water or groundwater (Figure 3h). This is because the added HCO3 can be consumed as a precipitate, such as CaCO3 with calcium under alkaline condition through a geochemical evolution. Thus, the concentration of calcium in thermal water steadily decreased during geochemical evolution in granitic rock (Figure 3f). The origin of sulfur in Bugok thermal water can be explained by two mechanisms, but not seawater mixing, which is yet to be recognized in chemical and isotopic data: (1) the lower δ34S is likely derived from the oxidation of magmatic pyrite; (2) the higher δ34S in higher temperature thermal water derives from the kinetic fractionation of reduced sulfur, thereby forming SO42−, enriched with δ 34S in a deep reducing thermal environment [53]. Li et al. (2014) and Robert (2006) also suggested that the δ34S of H2S gas by kinetic fractionation ranged from +4.0‰ to +14‰ [54,55].
Figure 6a–c show a positive correlation (R2 = 0.71–0.72) between temperature (SO4) and thermal water δ34S, and a negative correlation (R2 = 0.80) between Eh and thermal water δ34S, suggesting that δ34S in reducing higher temperature water was enriched by the kinetic fractionation of sulfur gas under a reducing condition.
4.4. Helium and Neon Isotopes
Noble gases can be an effective tracer to help understand the circulation of volatile elements in the atmosphere and earth [35]. The helium isotopes comprise different ratios from three distinguishable sources (mantle, crust and air). The ratio (3He/4He) can change because of physical processes such as mixing or degassing [56,57]. In continental settings, it has been long established that the presence of mantle helium correlates well with tectonic and magmatic activity [58,59,60,61].
Previous studies of thermal water in South Korea reported that 4He produced by the decay of radioactive elements such as uranium and thorium is a dominant isotope, and there is a roughly positive correlation between the temperature of thermal water and the 4He/20Ne ratio [62,63,64].
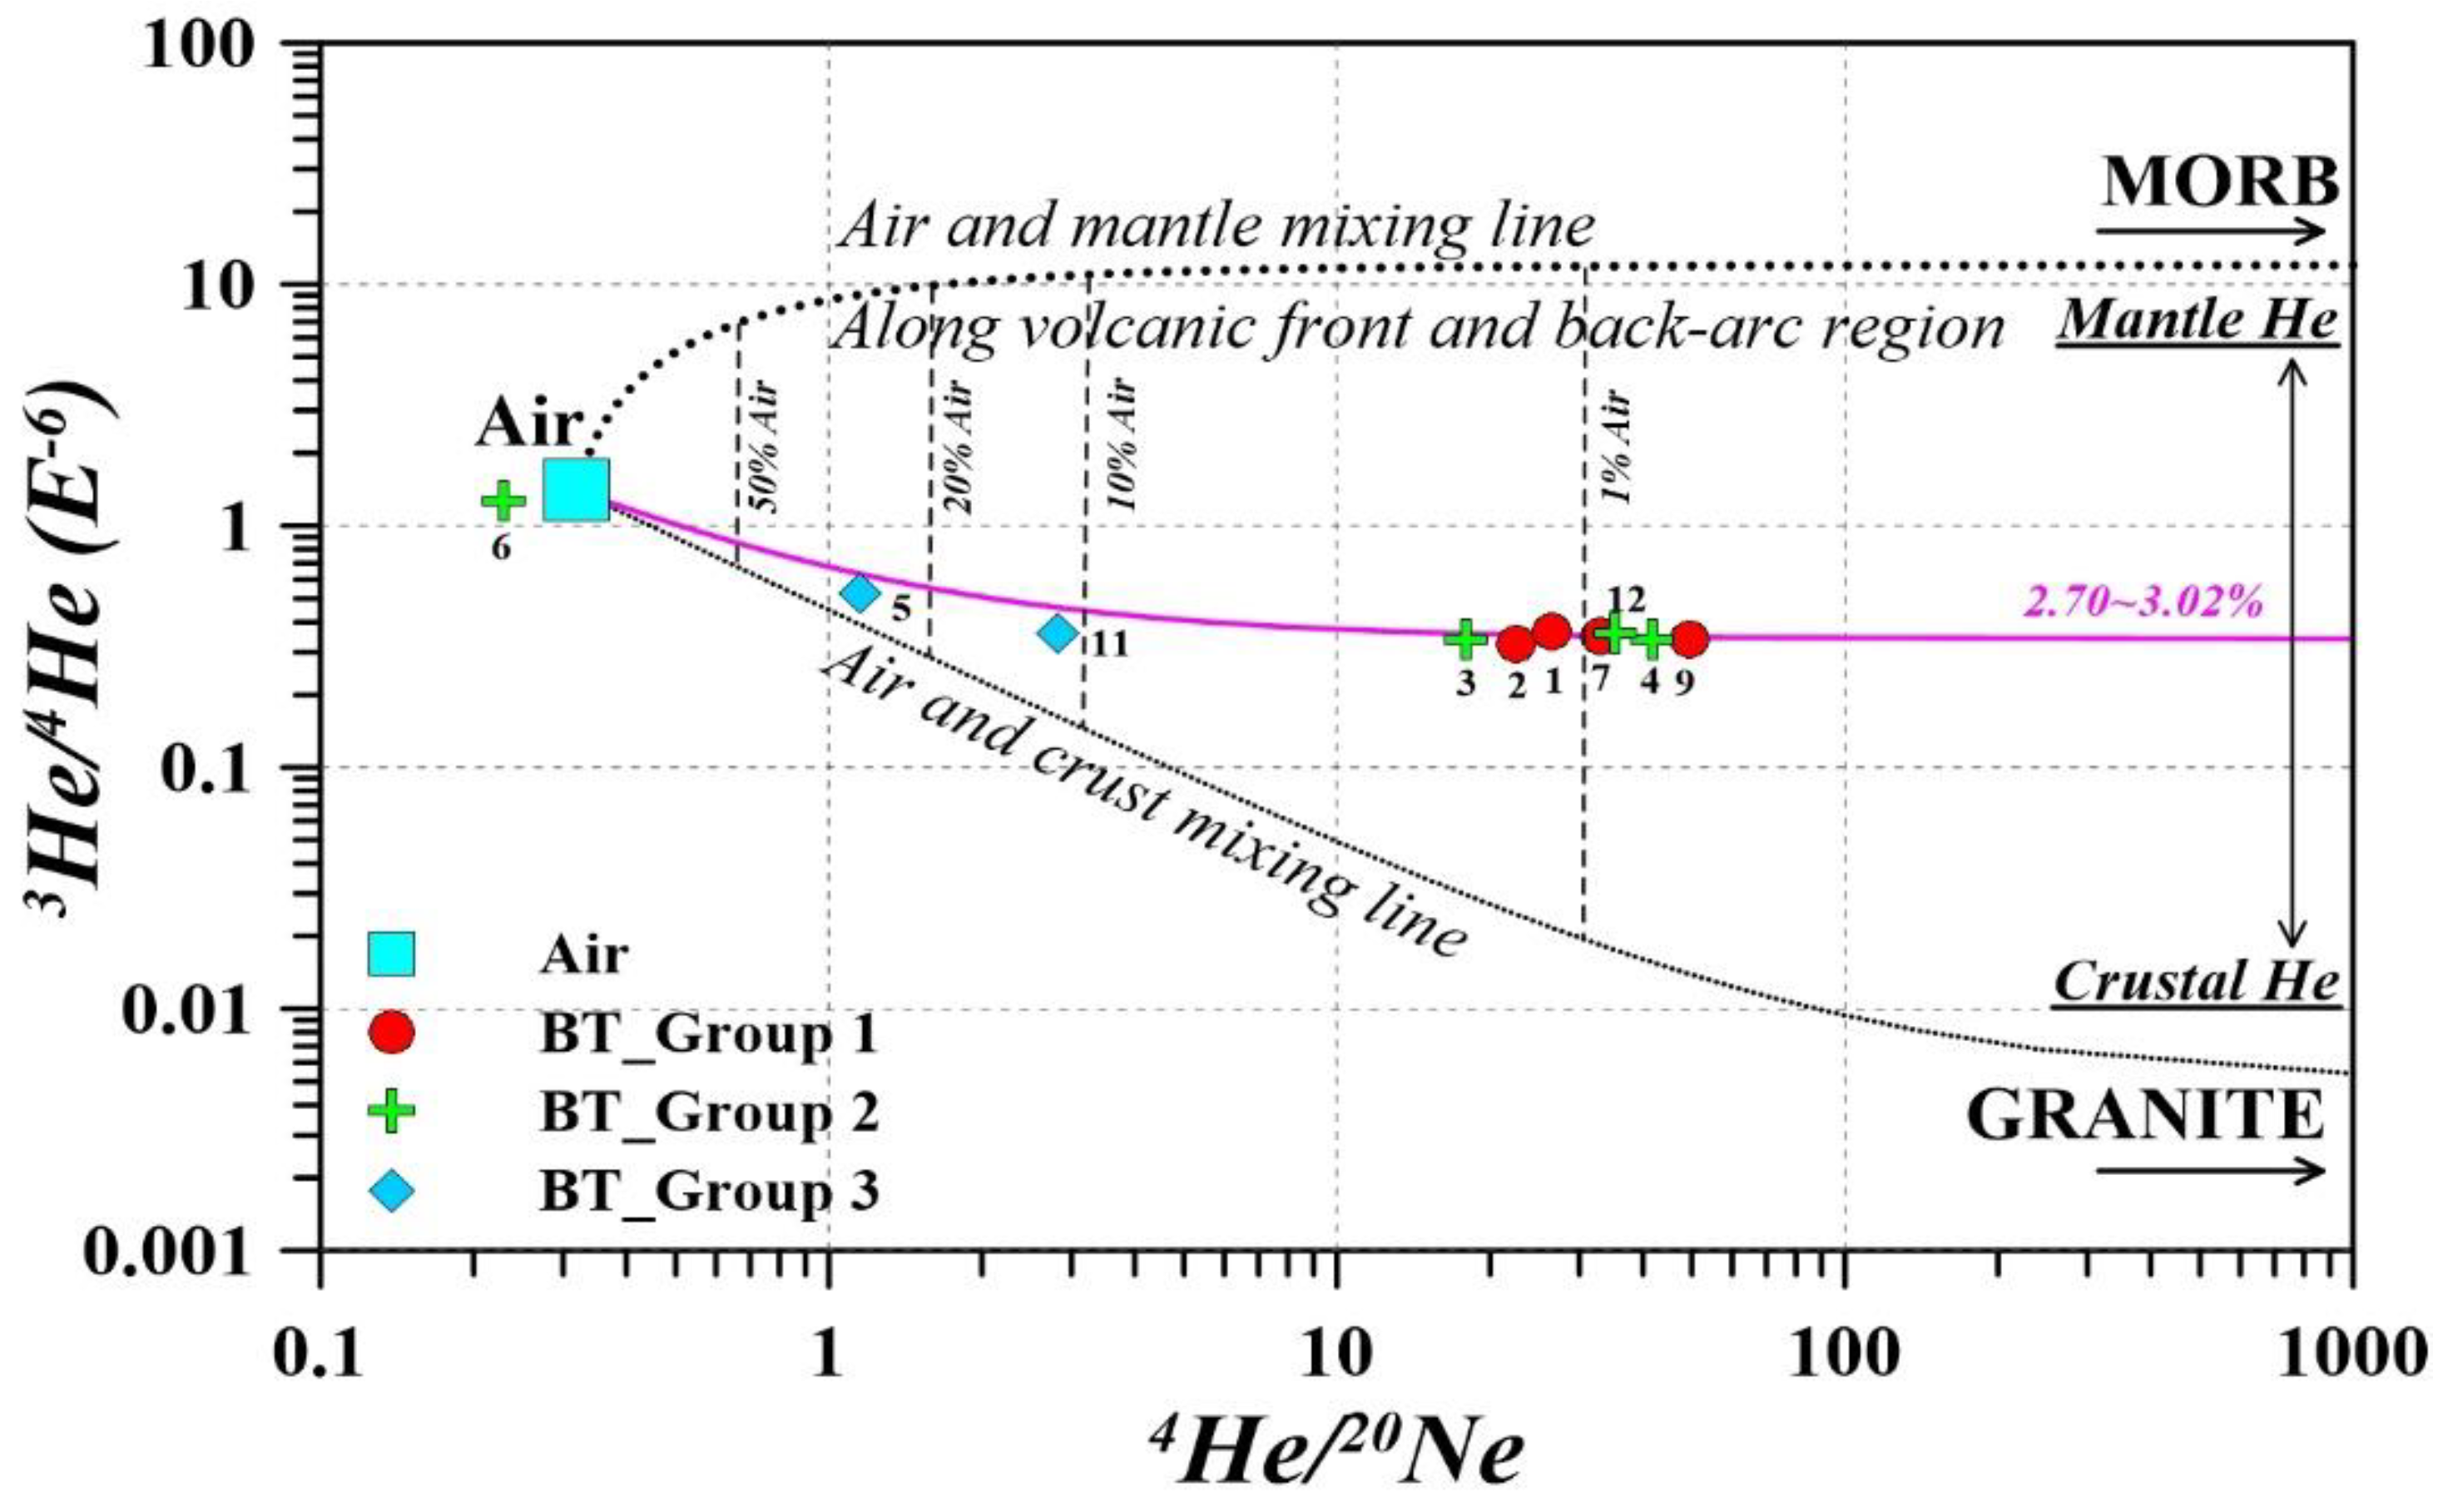
Figure 7 shows the atmosphere−mantle−crust end members such as air-derived helium (3He/4He = 1.4 × 10⁻⁶, 4He/20Ne > 0.317), upper mantle-derived helium (3He/4He = 11.0 × 10⁻⁶, 4He/20Ne > 10,000), and crust-derived helium (3He/4He = 5 × 10⁻⁶, 4He/20Ne > 10,000). The higher temperature-thermal water, except the air-contaminated sample BT-6, was plotted along a single mixing line between the mantle (2.70–3.02%) and crust (96.98–97.3%), with a small mixing amount of atmospheric helium (0.49–1.34%). It implied that the major source of helium in thermal water was crust-origin helium (4He) with a little mantle helium (3He) under the same source environment. On the mixing line of the 4He/20Ne axis in particular, the high temperature Group I and II thermal water (above 50 °C) showed the distinguishable air-mixing ratios compared to low temperature (below 30 °C) thermal waters. It was presumed that a little mantle helium (3He) in thermal waters was derived along the discontinuities such as a fault from a deep-seated source.
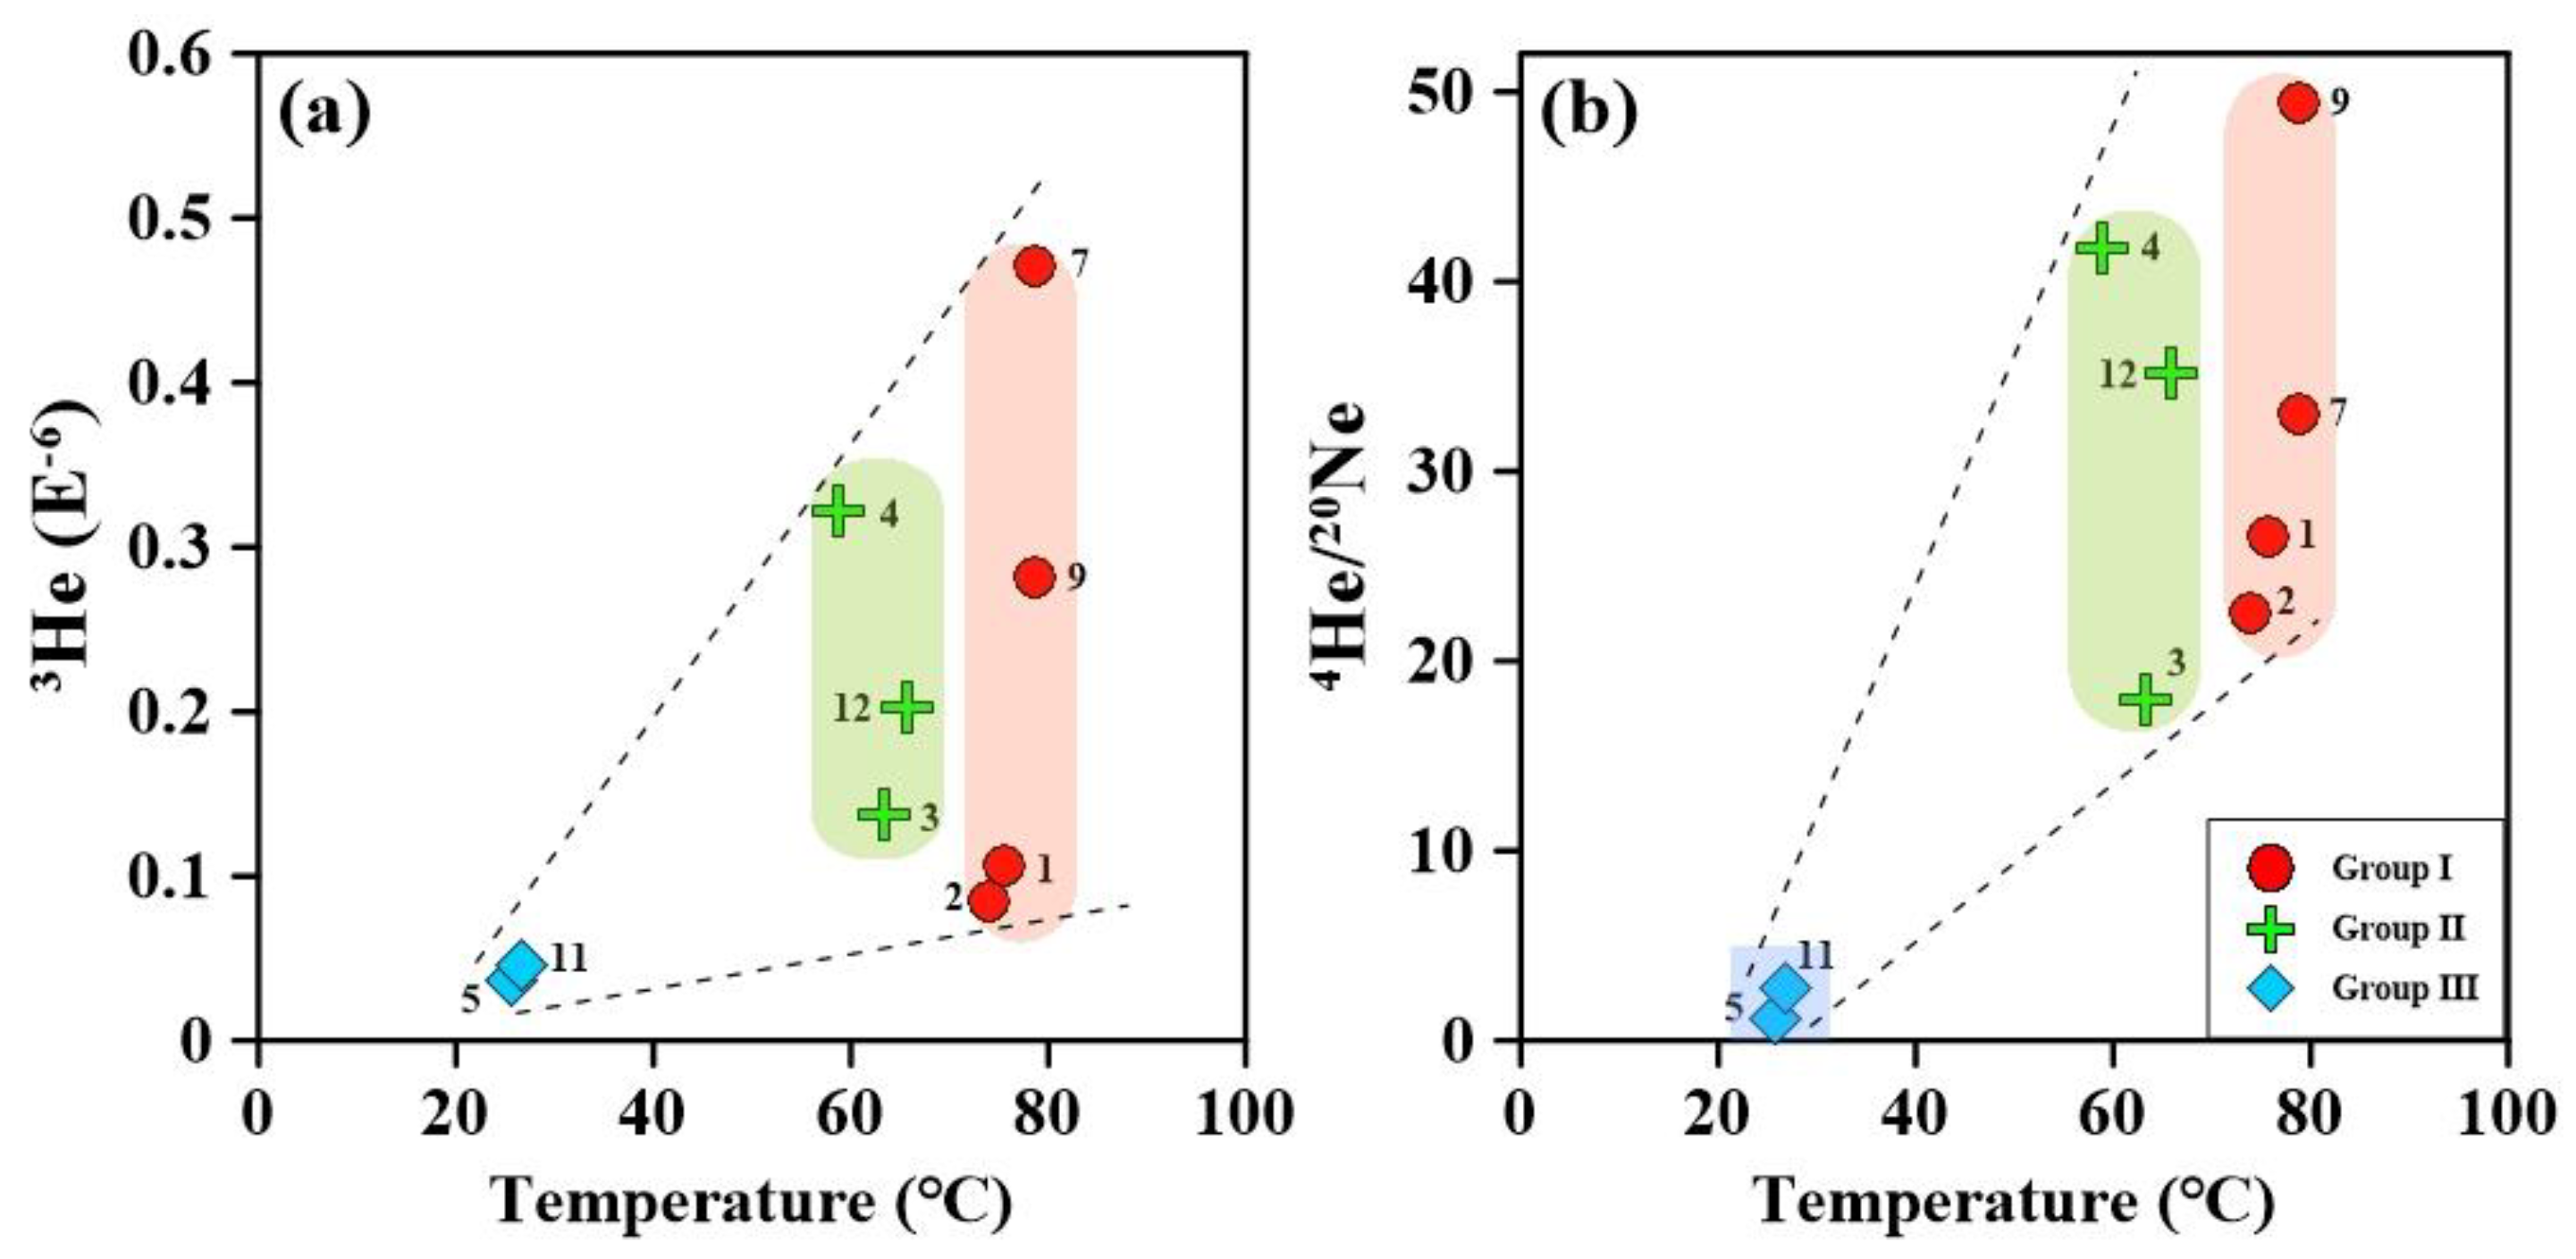
Figure 8 presents the correlation of thermal water temperature with 3He and 4He/20Ne. Although there was no clear correlation in either case, the distribution showed a cone-shaped increasing trend with temperature and a diverse range of helium concentration at high temperature. Even though the high content of 4He in thermal water is indirect evidence of radioactive decay, as helium gas can disperse into the fractures and pores of rocks and mix with cold groundwater, the helium concentration developed at the same thermal source would vary according to the local geometric structure and groundwater flow system surrounding the wells. Despite various factors controlling the helium concentration in a geothermal system, the positive increasing trend between 4He and temperature can be regarded as a meaningful estimation that supports radioactive decay as the thermal source.
Table 3 presents the mixing ratio of atmosphere, crust, and mantle for 4He and 3He. These ratios were calculated using the method of Kotaba and Nagao (2008) [65]. In thermal water, the crust-derived 4He contributed 78.6–96.8%, and mantle-derived 4He, 0.40–2.90% of the total. The mantle and crust-derived 3He contributions ranged from 1.10 to 1.40% and from 14.6 to 96.2%, respectively. Samples BT-5 and BT-11 had high 3He air-mixing ratios of 33.3 and 84.3%, respectively.
4.5. Thermal Reservoir Temperature
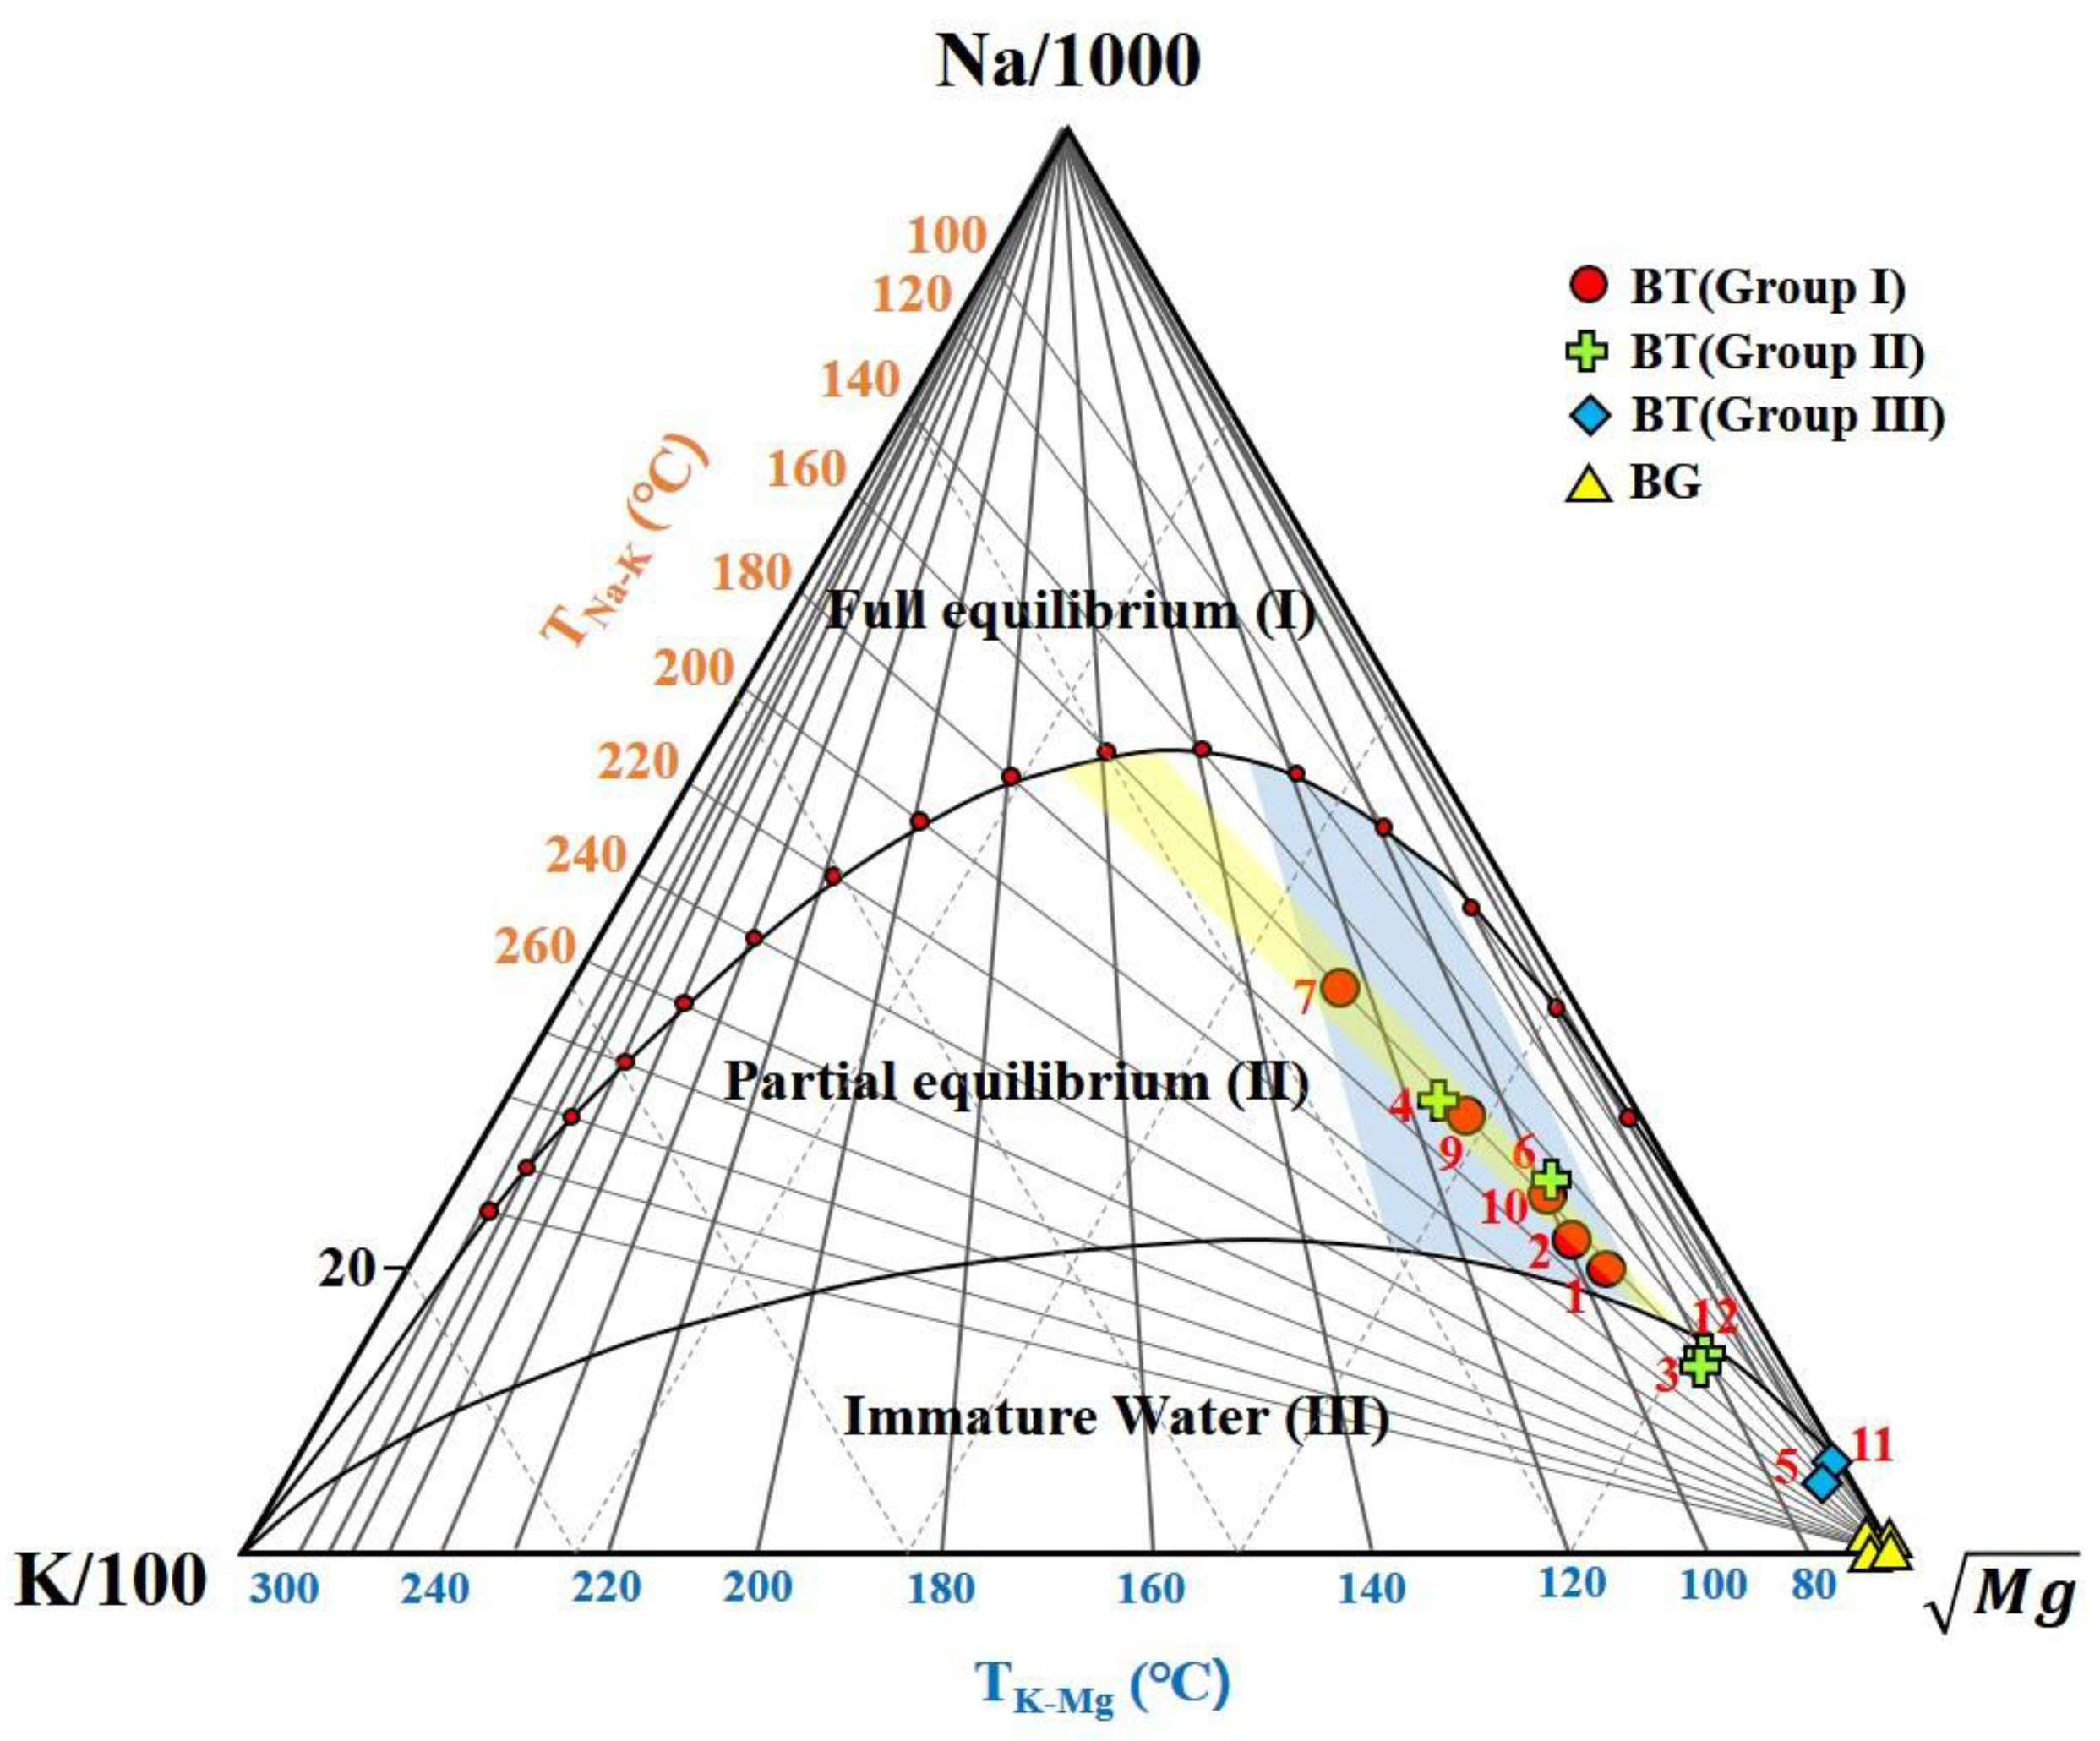
The results of Giggenbach geothermometry to estimate a reservoir temperature are plotted in a triangle diagram combining Na–K and K–Mg geothermometry [30], which is often used to discriminate immature, partially equilibrated, and fully equilibrated water from a deep geothermal reservoir (Figure 9). If the thermal water is plotted below the full equilibrium curve, it indicates partial equilibrium or immature water mixed with cold water. This method can also would indicate whether water from the deep geothermal reservoir is suitable or unsuitable for cation geothermometers [66]. Na–K geothermometry showed that the deep thermal system (usually with the highest temperature) responded for a long time. In contrast, the K–Mg geothermometry is very sensitive to cooling and mixing with shallow groundwaters (usually with a lower temperature) because of Mg with a faster rate of re-equilibrium during water−rock interaction. The Mg concentration can be used as a square root if the Na–K ratio does not change because the mix process would be presented by the curve [67]. Points plotted close to the corner indicated that there was a very high proportion of relatively mixed cold groundwater in the water system [68].
In Figure 9, the thermal water samples−except 3, 5, 11 and 12 samples−are plotted in the partial equilibrium zone. This implies that the water−rock interaction occurred partially, not fully. Thermal water may not reach complete equilibrium due to the mixing of cold groundwater in the aquifers. The reservoir temperature in the partial equilibrium zone in the Giggenbach triangular diagram was estimated at 95–126 °C for the K–Mg geothermometer, and 152–166 °C for the Na–K geothermometer. As shown in Table 4, the estimated results vary widely. As the Na–K geothermometer readjusted slowly in mixing systems, which made it less sensitive to the secondary processes (e.g., mixing and boiling), it yielded an overestimated result at a low temperature state [69]. For water plotting below full equilibrium on the Giggenbach diagram, the K–Mg temperatures were lower than the Na–K temperatures. Due to the faster rate equilibration in the system, the K–Mg values of tK–Mg were likely to reflect conditions below around 150 °C at shallower levels, while those of tNa–K were above 250 °C at a considerable depth [30]. Considering the partial equilibrium state and temperature below 150 °C of the thermal waters, the result of the K−Mg geothermometer seems to be a convincing temperature. The deviations from the reservoir temperatures by the K−Mg geothermometer probably result from the activities of clinochlore.
The thermal water samples are plotted linearly in the partial equilibrium area along a narrow yellow zone from the Mg end-point in the diagram. This indicates that they reacted chemically at different evolutionary steps according to the thermal influence and mixing with cold groundwater from the same thermal source. The source was also supported by the helium isotopic ratios plotted along an original mixing line, as mentioned in Section 4.4.
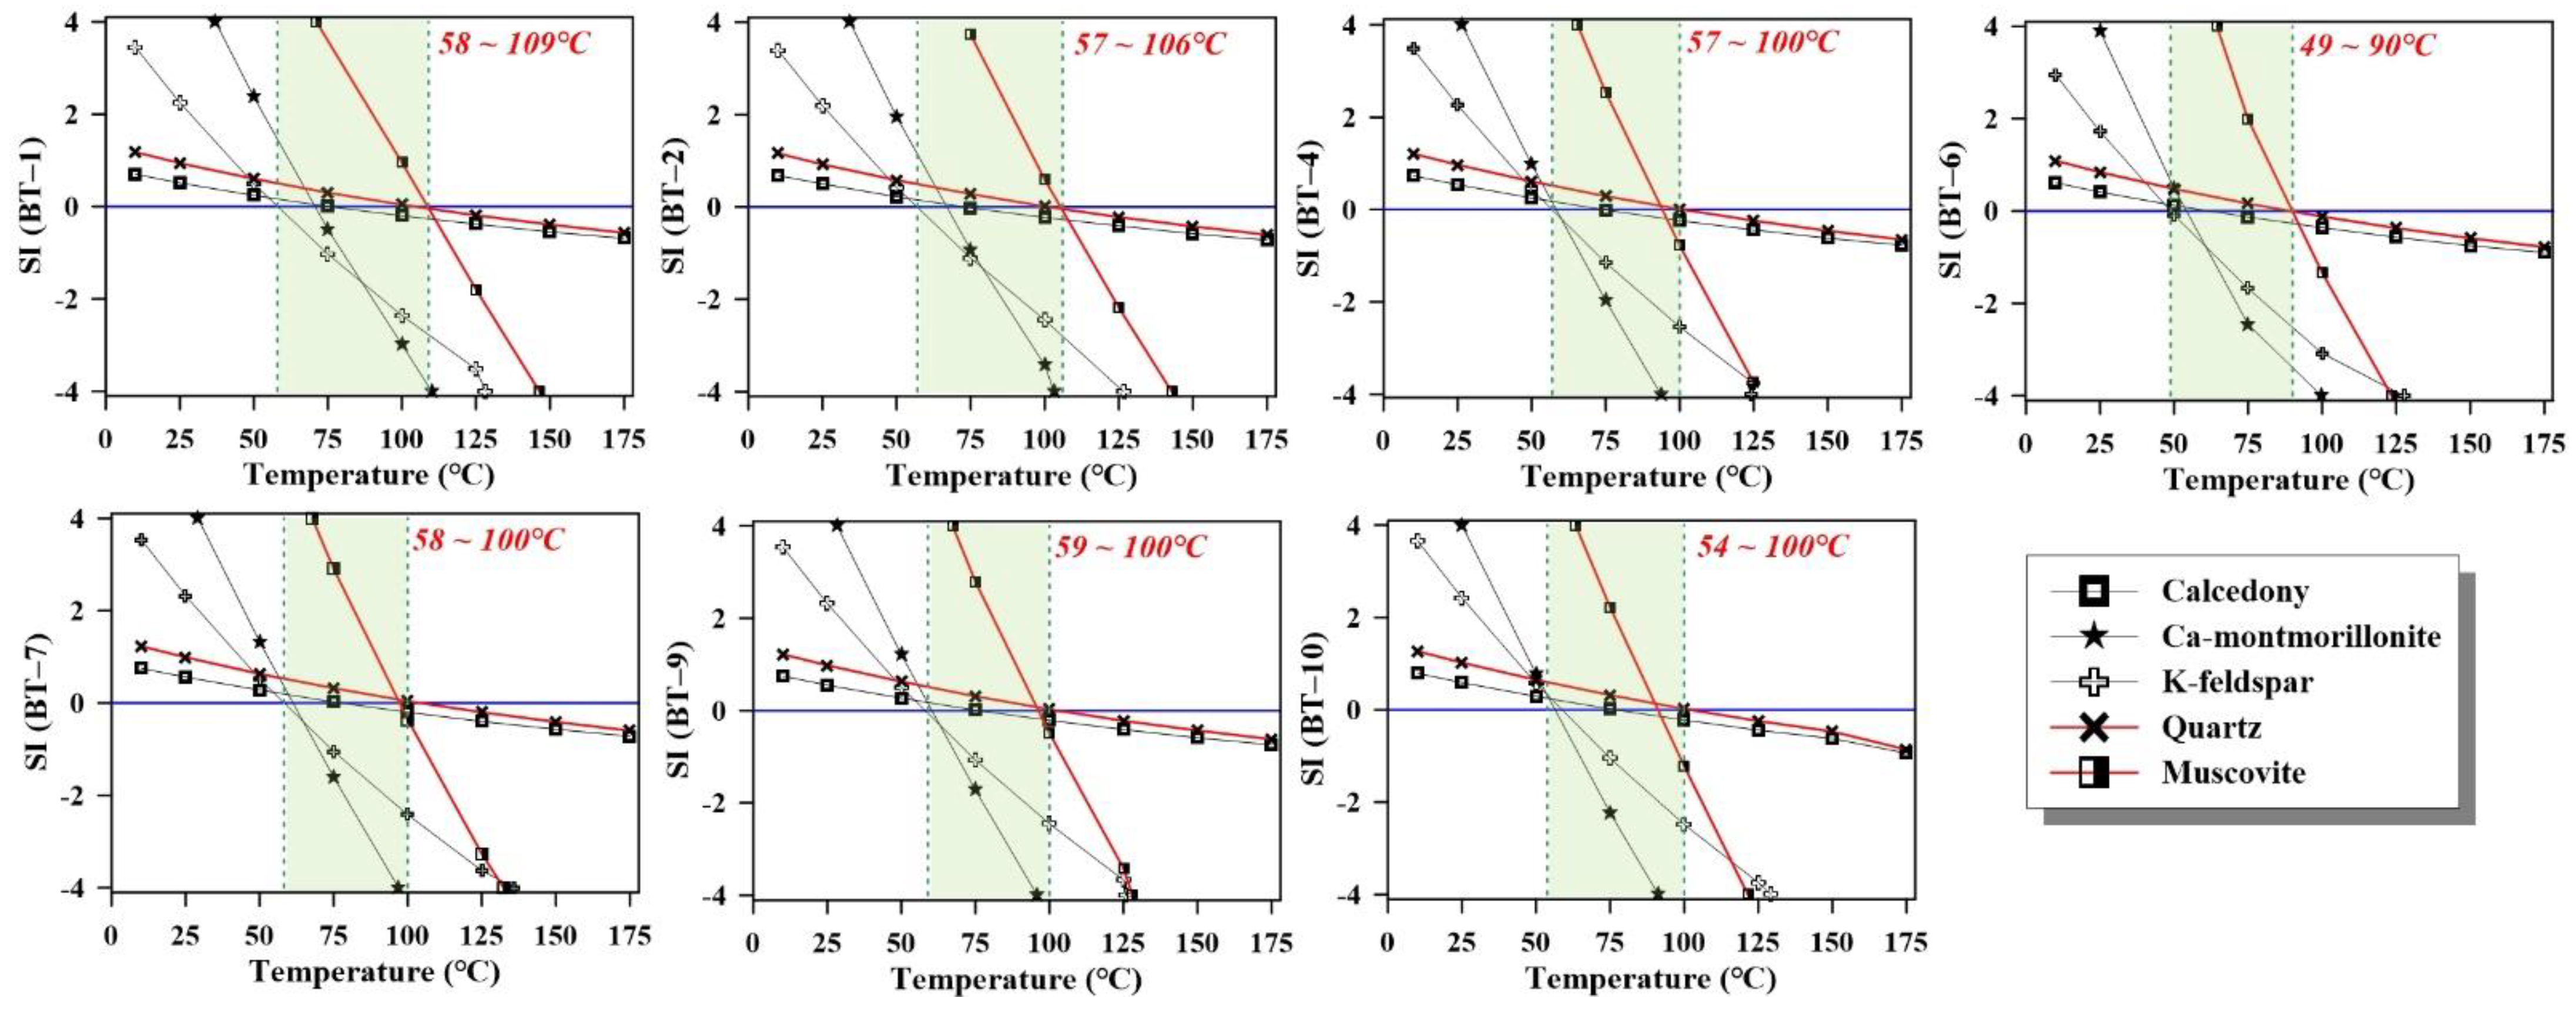
A multi-mineral saturation geothermometer was also used to estimate reservoir temperature when the thermal water in the reservoir reached mineral equilibrium [70,71]. Figure 10 shows the temperature of the thermal reservoir estimated from the equilibrium temperature between the thermal water and minerals using the chemical composition of the waters.
The hypothesis from the geothermometer estimation was that all minerals through the water−rock interaction in the deep environment chemically arrived at the equilibrium state (saturation index, SI = 0) under a specific temperature condition. Thus, the geothermometer not only provided useful information about the equilibrium state in the geothermal system, but also estimated the thermal reservoir temperature on the basis of multi-mineral equilibrium [71]. The saturation index (LogQ/K) was calculated from all thermal waters by the PHREEQC.
The saturation indices regarding major minerals as a function of temperature in a thermal environment are presented in Figure 10. The five minerals (chalcedony, quartz, Ca-montmorillonite, K-feldspar, muscovite) can be primary or secondary minerals of the host rock and were selected to deduce the reservoir temperature by the thermodynamic equilibrium between the minerals and thermal water. Since chalcedony, K-feldspar, and Ca-montmorillonite reach a chemical equilibrium state faster than quartz and muscovite, their estimated reservoir temperature (49–77 °C) showed a slightly lower value than the discharge temperature of thermal waters (58.8–78.7 °C). The reservoir temperatures estimated from the equilibrium between quartz (muscovite) and the thermal water suggested a range of 90 to 108 °C, which is a higher value than discharge temperature. It would be reasonable if the useful minerals for thermodynamic equilibrium were restricted to quartz and muscovite.
4.6. Conceptual Model for the Formation of Geothermal Water
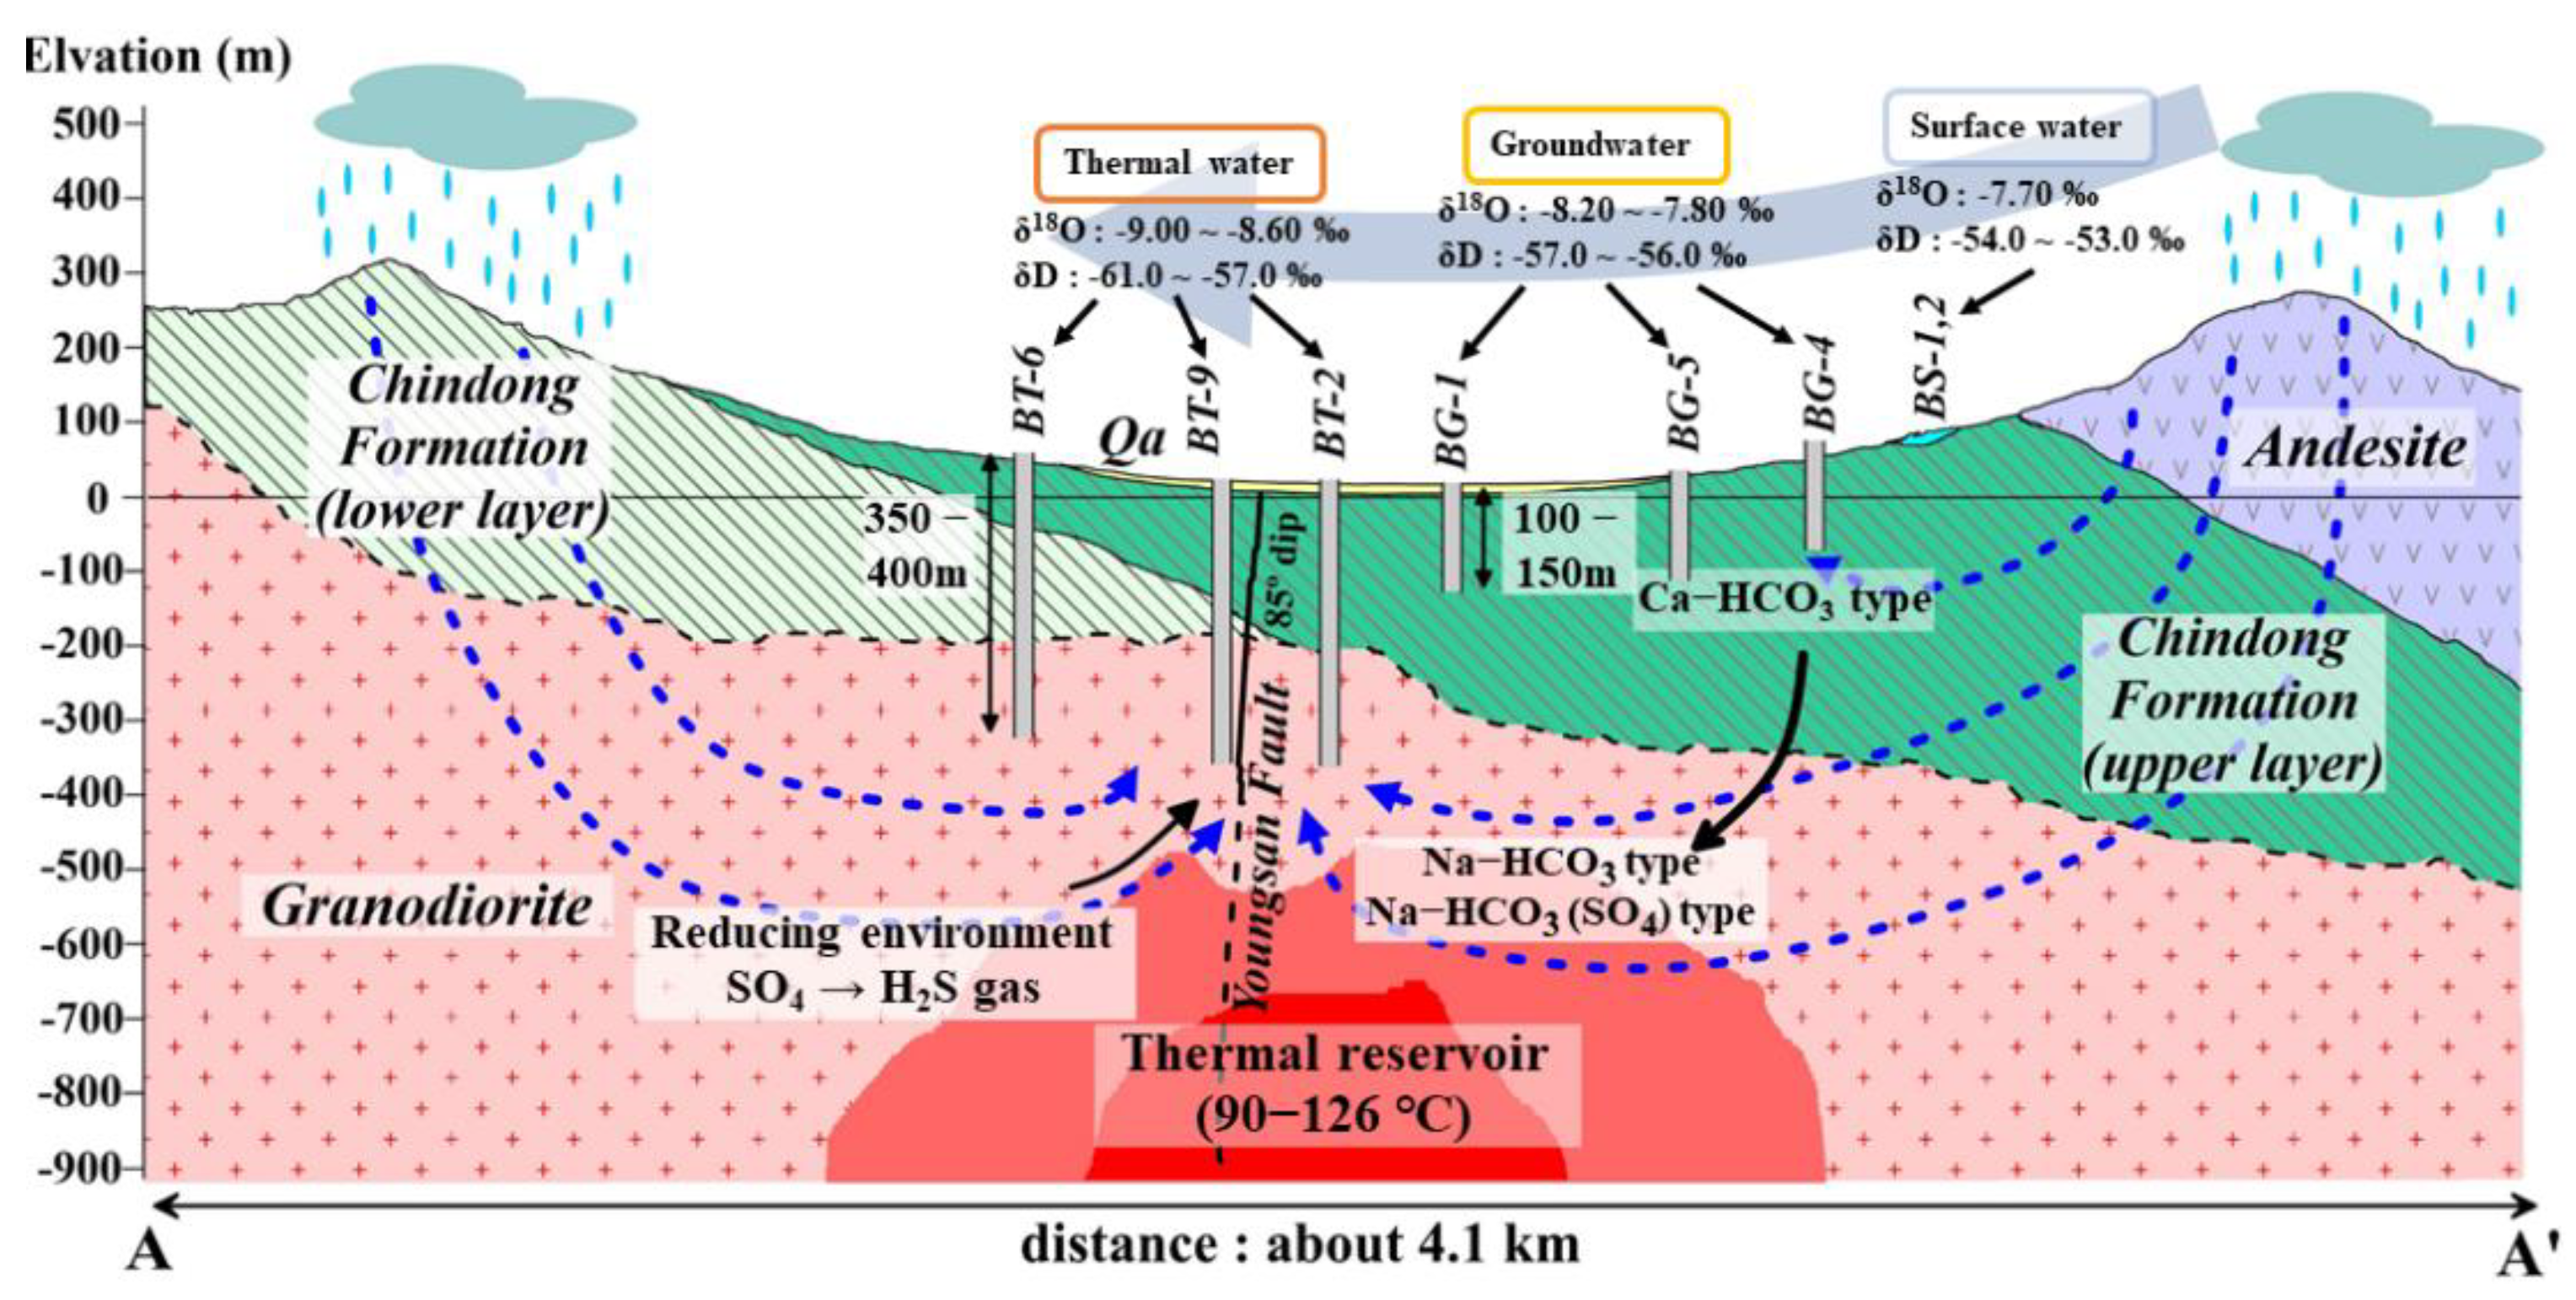
This study suggested a conceptual model for the formation of geothermal water in the Bugok area on the basis of geochemical composition; the isotopic data of δ18O, δD, δ34S, and 3He/4He; temperature logging data; and geothermometers (Figure 11). The thermal water is recharged by the infiltration of meteoric water (rain, snow) from the surrounding mountains. After flowing into a deep reducing environment, the thermal water mixed with cold Ca–HCO3 groundwater as it rose. The thermal reservoir revealed the temperature of 90–126 °C in a partial equilibrium state at shallower levels according to geothermometry. The thermal source is regarded as the granodiorite beneath sedimentary rocks.
5. Conclusions
Bugok thermal water, which has the highest hot spring discharge temperature (78.7 °C) in South Korea, showed two chemical types: Na–HCO3 and Na–HCO3 (SO4) water. These evolved from Ca–HCO3 type groundwater after the recharge of meteoric water (rain, snow) from the surrounding high mountains.
Although Bugok thermal water was pumped out of Cretaceous sedimentary rock such as alcos sandstone, shales, and andesite, granodiorite is regarded as the thermal source rock and was found about 250 m beneath the sedimentary rock in a drilled core. This deduction of the thermal source was supported by the original mixing model between 3He/4He and 4He/20Ne. That is, the high temperature thermal water (above 50 °C) was plotted along a single crust−mantle mixing line with dominant 4He (97.0–97.3%) on a ternary original helium−mixing diagram. Therefore, the thermal source was the energy from the decay of radioactive elements such as U and Th in the granodiorite.
Regarding δ34S and temperature, Bugok thermal water can be classified into two groups: a low δ34S (−3.00~+1.00‰) type of low temperature, and a high δ34S (+4.60~15.0‰) type of high temperature. The enriched δ34S was likely to due to the kinetic-controlled fractionation of H2S gas produced from magmatic pyrite in the deep reducing thermal environment.
The reservoir temperatures of the Bugok thermal water by the K−Mg geothermometer of Giggenbach and multi-mineral equilibrium geothermometer were estimated to be in the range of 90–126 °C. For the equilibrium method, quartz and muscovite were regarded as the useful minerals because of the fast equilibrium temperature of the other minerals. The K–Mg geothermometer of Giggenbach diagram provided a reasonable temperature compared to 152–165 °C of the Na–K geothermometer, which produced an overestimated result in a medium temperature state. A schematic cross-section was conclusively suggested as the conceptual model for the formation of thermal water including a thermal reservoir.
Author Contributions
C.J., Y.L. (Yujin Lee), Y.L. (Yongcheon Lee), S.A., and K.N. conceived and designed the research project. C.J., S.A. and K.N. performed the fieldwork and collected the water samples. K.N. conducted the noble-gas analyses. All authors have read and approved the manuscript.
Funding
This research was supported by Daejeon University Research Fund (20180268).
Data Availability Statement
The data presented in this study are available on request from the corresponding authors. The data are not publicly available due to the continuation of a follow-up study by the authors.
Conflicts of Interest
The authors declare no conflict of interest.
References
- Ministry of the Interior and Safety. The Hot Springs Status of all the Country in 2020; United Nations Office for Disaster Risk Reduction (UNDRR): Brussel, Belgium, 2020; pp. 1–115. [Google Scholar]
- Jeong, C.H.; Lee, B.D.; Yang, J.H.; Nagao, K.; Kim, K.H.; Ahn, S.W.; Lee, Y.C.; Lee, Y.J.; Jang, H.W. Geochemical and isotopic compositions and geothermometry of thermal waters in the Magumsan area, South Korea. Water 2019, 11, 1774. [Google Scholar] [CrossRef]
- Kim, H.C.; Lee, S.; Song, M.Y. Relationship analysis between lithology, geological time and geothermal gradient of South Korea. Econ. Environ. Geol. 2002, 35, 163–170. [Google Scholar]
- Lim, J.U. Resources Survey and Analysis Report of Bugok Hot Spring; Geological Survey of Korea: Daejeon, Korea, 1989.
- Honda, M.; Reynolds, J.H.; Roedder, E.; Epstein, S. Noble gases in diamonds: Occurrences of solar like helium and neon. J. Geophys. Res. 1987, 92, 12507–12521. [Google Scholar] [CrossRef]
- Ozima, M.; Zashu, S. Noble gases in submarine pillow volcanic glasses. Earth Planet. Sci. Lett. 1983, 62, 24–40. [Google Scholar] [CrossRef]
- Sarda, P.; Staudacher, T.; Allegre, C.J. Neon isotopes in submarine basalts. Earth Planet. Sci. Lett. 1988, 91, 73–88. [Google Scholar] [CrossRef]
- Graham, D.W.; Lupton, F.; Albarède, F.; Condomines, M. Extreme temporal homogeneity of helium isotopes at Piton de la Fournaise, Réunion. Nature 1990, 347, 545–548. [Google Scholar] [CrossRef]
- Ballentine, C.J.; Burnard, P.G. Production, release and transport of noble gases in continental crust. Rev. Mineral. Geochem. 2002, 47, 481–538. [Google Scholar] [CrossRef]
- Torgersen, T.; Jenkins, W.J. Helium isotopes in geothermal system: Iceland, The Geysers, Raft River and Steamboat Springs. Geochem. Cosmochim. Acta 1982, 46, 739–748. [Google Scholar] [CrossRef]
- Hulston, J.R.; Lupton, J.E. Helium isotope studies of geothermal fluids in the Taupo Volcanic Zone, New Zealand. J. Volcanol. Geotherm. Res. 1996, 74, 297–321. [Google Scholar] [CrossRef]
- Yokoyama, T.; Nakai, S.I.; Wakita, H. Helium and carbon isotopic compositions of hot spring gases in the Tibetan Plateau. J. Volcanol. Geotherm. Res. 1999, 88, 99–107. [Google Scholar] [CrossRef]
- Graham, D.W. Noble gas isotope geochemistry of mid-ocean ridge and ocean island basalts: Characterization of mantle source reservoirs. Rev. Mineral. Geochem. 2002, 47, 247–317. [Google Scholar] [CrossRef] [Green Version]
- Graham, D.W.; Humphris, S.E.; Jenkins, W.J.; Kurz, M.D. Helium isotope geochemistry of some volcanic rocks from Saint Helena. Earth Planet. Sci. Lett. 1992, 110, 121–131. [Google Scholar] [CrossRef]
- Class, C.; Goldstein, S.L.; Stute, M.; Kurz, M.D.; Scholsser, P. Grand Comore Island: A well-constrained “low 3He/4He” mantle plume. Earth Planet. Sci. Lett. 2005, 233, 391–409. [Google Scholar] [CrossRef]
- Füri, E.; Hilton, D.R.; Murton, B.J.; Hemond, C.; Dyment, J.; Day, J.M.D. Helium isotope variations between Réunion Island and the Central Indian Ridge (17°–21°S): New evidence for ridge-hotspot interaction. J. Geophys. Res. 2011, 116, B02207. [Google Scholar] [CrossRef]
- Jeong, C.H.; Hur, H.S.; Nagao, K.; Kim, K.H. Hydrochemical and isotopic characteristics, and origin of noble gas for low-temperature hot spring waters in the Honam area. Econ. Envion. Geol. 2007, 40, 635–649. [Google Scholar]
- Jeong, C.H.; Nagao, K.; Kim, K.H.; Choi, H.K.; Sumino, H.; Park, J.; Park, C.H.; Lee, J.I.; Hur, S.D. Hydrochemistry and noble gas origin of various hot spring waters from the eastern area in South Korea. J. Soil Groundw. Environ. 2008, 13, 1–12. [Google Scholar]
- Jeong, C.H.; Koh, Y.K.; Shin, S.H.; Nagao, K.; Kim, K.H.; Kim, G.Y. Hydrochemistry and noble gas origin of hot spring waters of Icheon and Pocheon area in Korea. J. Eng. Geol. 2009, 19, 529–541. [Google Scholar]
- Park, J.; Jeong, C.H.; Nagao, K.; Yang, J.H.; Sumino, H.; Kim, K.H.; Kim, M.S.; Lee, J.I.; Park, C.H.; Koh, Y.K.; et al. Hydrochemistry and noble gas geochemistry of geothermal water in Chungcheong province, South Korea. Geochem. J. 2016, 50, 89–103. [Google Scholar] [CrossRef]
- Jeong, C.H.; Yoo, S.W.; Kim, K.H.; Nagao, K. Hydrochemistry and origin of noble gases and CO2 Gas within carbonated mineral waters in the Kyeongbuk-Kangwon province, Korea. J. Eng. Geol. 2011, 21, 65–77. [Google Scholar] [CrossRef]
- Jeong, C.H.; Lee, Y.C.; Lee, Y.J.; Choi, H.Y.; Koh, G.W.; Moon, D.C.; Jung, C.Y.; Jo, S.B. Origin and hydrochemical characteristics of natural carbonated water at Seoqwipo, Jeju, Island. J. Eng. Geol. 2016, 26, 515–529. [Google Scholar] [CrossRef]
- Fournier, R.O.; Truesdell, A.H. An empirical Na-K-Ca geothermometer for natural waters. Geochim. Cosmochim. Acta 1973, 37, 1255–1275. [Google Scholar] [CrossRef]
- Truesdell, A.H. Summary of section III: Geochemical techniques in exploration. In Proceedings of the Second United Nations Symposium on the Development and Use of Geothermal Resources, San Francisco, CA, USA, 20–29 May 1975. [Google Scholar]
- Truesdell, A.H.; Fournier, R.O. Procedure for estimating the temperature of a hot-water component in a mixed water by using a plot of dissolved silica versus enthalpy. J. Res. Geol. Surv. 1977, 5, 49–52. [Google Scholar]
- Tonani, F.B. Some remarks on the application of geothermal techniques in geothermal exploration. In Advances in European Geothermal Research; Strub, A.S., Ungemach, P., Eds.; Springer: Dordrecht, The Netherlands, 1980; pp. 428–443. [Google Scholar]
- Fournier, R.O. Application of Water Geochemistry to Geothermal Exploration and Reservoir Engineering. In Geothermal System: Principles and Case Histories; John Willey & Sons: Now York, NY, USA, 1981. [Google Scholar]
- Arnórsson, S. Chemical equilibria in icelandic geothermal systems-implications for chemical geothermometry investigations. Geothermics 1983, 12, 119–128. [Google Scholar] [CrossRef]
- Nieva, D.; Nieva, R. Developments in geothermal energy in Mexico-Part 12. A cationic composition geothermometer for prospection of geothermal resources. Heat Recovery CHP 1987, 7, 243–258. [Google Scholar] [CrossRef]
- Giggenbach, W.F. Geothermal solute equilibria. Derivation of Na-K-Mg-Ca geoindicators. Geochim. Cosmochim. Acta 1988, 52, 2749–2765. [Google Scholar] [CrossRef]
- Kim, N.J.; Lee, H.K. The Geological Map of Yongsan Sheet (1:50,000); Korea Institute of Geoscience and Mineral Resources: Daejeon, Korea, 1964; pp. 1–31. [Google Scholar]
- Paik, I.S.; Kim, H.J.; Lee, J.D.; Kim, I.S.; Kim, J.S.; Moon, B.C. Comparative sedimentology for the lacustrine deposits of the upper Gyeonsang supergroup in the Southeastern Gyeongsang basin Korea. J. Korean Earth Sci. Soc. 2000, 21, 423–436. [Google Scholar]
- Koh, Y.K.; Yun, S.T.; Lim, C.S.; Bae, D.S.; Park, S.S. Geochemical evolution and deep environment of the geothermal waters in the Bogok area: Reconsideration on the origin of sulfate-type geothermal water. Econ. Environ. Geol. 2001, 37, 328–343. [Google Scholar]
- Kim, S.G. Investigation of geothermal sites in Korea. Eco. Environ. Geol. 1985, 18, 167–175. [Google Scholar]
- Aka, F.T.; Kusakabe, M.; Nagao, K.; Tanyileke, G. Noble gas isotopic compositions and water/gas chemistry of soda springs from the islands of Bioko, Saão Tomé and Annobon, along with Cameroon Volcanic Line, West Africa. Appl. Geochem. 2001, 16, 323–338. [Google Scholar] [CrossRef]
- Fournier, R.O.; White, D.E.; Truesdell, A.H. Geochemical Indicators of Subsurface Temperature-Part 1, Basic Assumptions; USGS: Reston, VA, USA, 1974.
- Parkjurst, D.L.; Appelo, C.A.J. Description of Input and Examples for PHREEQC Version 3—A Computer Program for Speciation, Batch-Reaction, One-Dimensional Transport, and Inverse Geochemical Calculations; USGS: Reston, VA, USA, 2013.
- Ongay, E. Hydrogeological and Hydrochemical Investigation of Balikesir-Pamukcu Geothermal Area and Its Vicinity. Master’s Thesis, Dokuz Eylul University, Izmir, Turkey, 2004. [Google Scholar]
- Yuce, G.; Taskiran, L. Isotope and Chemical Composition of Thermal Fluids at Tekman geothermal area (Eastern Turkey). Geochem. J. 2013, 47, 423–435. [Google Scholar] [CrossRef]
- Jeong, C.H.; Kim, C.S.; Kim, T.K.; Kim, S.J. Reaction path modeling on geochemical evolution of groundwater and formation of secondary minerals in water-gneiss reaction system. J. Mineral. Soc. Korea 1997, 10, 33–44. [Google Scholar]
- Craig, H. Isotopic variations in meteoric water. Science 1961, 133, 1702–1703. [Google Scholar] [CrossRef] [PubMed]
- Koh, Y.K.; Bae, D.S.; Kim, C.S.; Kim, K.S.; Chung, H.J.; Kim, S.Y. Consideration of the groundwater recharge based on environmental isotopic characteristics of the small basin in the Yeosu area. J. Soil Groundw. Environ. 2001, 6, 93–106. [Google Scholar]
- Geyh, M. Groundwater: Saturated and unsaturated zone. Environmental Isotopes in the Hydrological Cycle Principles and Applications, Technical Document in Hydrology; UNESCO: Paris, France, 2000; Volume 4, p. 196. [Google Scholar]
- D’amore, F.; Panichi, C. Geochemistry in geothermal exploration. Energy Res. 1985, 9, 277–298. [Google Scholar] [CrossRef]
- Yoo, B.C.; You, B.W. Geopung copper deposit in Ogcheon, Chungcheongbuk-do: Mineralogy, fluid inclusion and stable isotope studies. Eco.Environ. Geol. 2011, 44, 193–201. [Google Scholar] [CrossRef]
- Allegre, C.J. Isotope Geololgy; Cambridge University Press: Cambridge, UK, 2008; p. 534. [Google Scholar]
- Yoo, B.C. Genesis of the Ogcheon gold-silver deposite in Republic of Korea: Ore minerals, fluid inclusion and stable isotope studies. Eco. Environ. Geol. 2013, 46, 153–163. [Google Scholar] [CrossRef]
- Yu, H.M.; Shin, D.B. Mineralization and genetic environments of the central and main orebodies in the Manjang deposit, Goesan. Mineral. Soc. Korea 2018, 31, 87–101. [Google Scholar] [CrossRef]
- Lim, J.U.; Chung, S.Y. Geothermal Resources Survey in the Bugok Area (Changnyeong-Masan Area); Korea Institute of Geoscience and Mineral Resources: Daejeon, Korea, 1980. [Google Scholar]
- Sasaki, A. Variation in sulfur isotope composition of oceanic sulfate. Int. Geol. Congr. Sect. 1971, 1, 342–345. [Google Scholar]
- Zak, I.; Sakai, H.; Kaplan, R. Factors controlling the 18O/16O and 34S/32S isotopic ratios of ocean sulfates and interstitial sulfates from modern deep sea sediments. In Isotope Marine Chemistry; Goldberg, E.D., Horibe, Y., Saruhaki, K., Eds.; Geochemical Research Association: Tokyo, Japan, 1980; pp. 339–373. [Google Scholar]
- Berner, R.A. Sulphate Reduction, Organic Matter Decomposition and Pyrite Formation. R. Soc. 1985, 315, 25–38. [Google Scholar]
- Ohmoto, H.; Lasaga, A.C. Kinetics of Reactions between aqueous Sulfates and Sulfides in Hydrothermal System. Geochim. Cosmochim. Acta 1982, 46, 1727–1745. [Google Scholar] [CrossRef]
- Li, Z.; Li, J.; Cui, H.; Wang, D.; Gong, S.; Li, J.; Zhang, Y.; Ma, C.; Wang, Y. Geochemistry Characteristics of Hydrogen Sulphide-Bearing Gas Pools in Sichuan Basin. Energy Explor. Exploit. 2014, 32, 691–708. [Google Scholar] [CrossRef]
- Robert, R.S. Sulfur Isotope Geochemistry of Sulfide Minerals; USGS: Reston, VA, USA, 2006.
- Mamyrin, B.A.; Tolstikhin, I.N. Helium Isotopes in Nature, 1st ed.; Elsevier: Amsterdam, The Netherlands, 1984; p. 274. [Google Scholar]
- Ozima, M.; Podosek, F.A. Noble Gases in the Earth. In Noble Gas Geochemistry, 2nd ed.; Cambridge University Press: Cambridge, UK, 2002; pp. 217–249. [Google Scholar]
- Polyak, B.G.; Tolstikhin, I.N. Isotopic composition of the Earth’s helium and the motive forces of tectogenesis. Chem. Geol. 1985, 52, 9–33. [Google Scholar] [CrossRef]
- Italiano, F.G.; Martinelli, G.; Nuccio, P.M. Anomalies of mantle-derived helium during the 1997-1998 seismic swarm of Umbria-Marche, Italy. Geophys. Res. Lett. 2001, 28, 839–842. [Google Scholar] [CrossRef]
- Klemperer, S.L.; Mack Kennedy, B.; Satry, S.R.; Makovsky, Y.; Harinarayana, T.; Leech, M.L. Mantle fluids in the Karakoram fault: Helium isotope evidence. Earth Planet. Sci. Lett. 2013, 366, 59–70. [Google Scholar] [CrossRef]
- Bräuer, K.; Geissler, W.H.; Kämpf, H.; Niedermannn, S.; Rman, N. Helium and carbon isotope signatures of gas exhalations in the westernmost part of the Pannonian Basin (SE Austria/Ne Slovenia): Evidence for active lithospheric mantle degassing. Chem. Geol. 2016, 422, 60–70. [Google Scholar] [CrossRef]
- Jeong, C.H.; Park, J.; Nagao, K.; Sumino, H.; Kim, K.H.; Hur, S.D.; Lee, J.I.; Koh, Y.K.; Park, C.H. Hydrochemistry and origin of noble gases of hot spring water in Korea: Daejeon-Chungcheong area. In Proceedings of the Annual Meeting(Autumn Season) of KoSSGE, Jeonju University, Jeonju, Korea, 9–10 September 2004. [Google Scholar]
- Jeong, C.H.; Nagao, K.; Kim, K.H.; Sumino, H.; Park, J.S.; Lee, J.I.; Hur, S.D.; Ahn, S.W.; Choi, H.K.; Hur, H.S.; et al. Geochemical evolution, heat source and noble gas of hot spring, geothermal water and geological environment. In Proceedings of the 22th Joint Symposium of KSEEG and KSG, Daejeon University, Daejeon, Korea, 30 May 2006. [Google Scholar]
- Park, S.S. Hydrogeochemical Studies on the Origin and Geochemical Environments of Thermal Groundwaters in Bugok and Magumsan Area, Southern Korea. Master’s Thesis, Korea University, Seoul, South Korea, 2005. [Google Scholar]
- Kotarba, M.J.; Nagao, K. Composition and origin of natural gases accumulated in the Polish and Ukrainian parts of the Carpathian region: Gaseous hydrocarbons, noble gases, carbon dioxide and nitrogen. Chem. Geol. 2008, 255, 426–438. [Google Scholar] [CrossRef]
- Li, N.; Zhou, H.; Wen, Z.; Jakada, H. Formation mechanism and mixing behavior of Nanyang thermal spring, Xingshan County of Hubei Province, central China. Hydrogeol. J. 2019, 27, 2933–2953. [Google Scholar] [CrossRef]
- Han, S.J. A Study on the Hydrogeochemical Characteristics of Thermal and Groundwaters, in Dongrea-gu, Pusan. Master’s Thesis, Pusan National University, Pusan, Korea, 1999. [Google Scholar]
- Lajwe, G. Comparison, Characterization, and Interpretation of Geothermal Fluid Geochemistry in the Sedimentary Environments of Kibiro, Panyimur, and Öxarfjördur. In Proceedings of the Geothermal Training Programme, Tokyo, Japan; 2013. [Google Scholar]
- Wang, J.; Jin, M.; Jia, B.; Kang, F. Hydrochemical characteristics and geothermometry applications of thermal groundwater in northern Jinan, Shandong, China. Geothermics 2015, 57, 185–195. [Google Scholar] [CrossRef]
- Reed, M.; Spycher, N. Calculation of pH and Mineral Equilibria in Hydrothermal Waters with Application to Geothermometry and Studies of Boiling and Dilution. Geochim. Cosmochim. Acta 1984, 48, 1479–1492. [Google Scholar] [CrossRef]
- Pang, Z.H.; Reed, M. Theoretical Chemical Thermometry on Geothermal Waters: Problems and Methods. Geochim. Cosmochim. Acta 1998, 62, 1083–1091. [Google Scholar] [CrossRef]
Figure 1.
Location and geologic maps. (a) Northeast Asian plate tectonics including South Kore; (b) geologic map of Bugok area; (c) enlarged map of a rectangular box of geologic map (b) including the location of water samples.
Figure 1.
Location and geologic maps. (a) Northeast Asian plate tectonics including South Kore; (b) geologic map of Bugok area; (c) enlarged map of a rectangular box of geologic map (b) including the location of water samples.

Figure 2.
The graphs show two typical patterns (A type (a) and B type (b)) for the temperature logging data of the geothermal water wells [4].
Figure 2.
The graphs show two typical patterns (A type (a) and B type (b)) for the temperature logging data of the geothermal water wells [4].

Figure 3.
Box-whisker plot of temperature (a), pH (b), Eh (c), EC (d) and major ions(e−j) of the thermal water (BT), groundwater (BG), and stream water (BS).
Figure 3.
Box-whisker plot of temperature (a), pH (b), Eh (c), EC (d) and major ions(e−j) of the thermal water (BT), groundwater (BG), and stream water (BS).

Figure 4.
The trilinear plot of the major chemical compositions of thermal waters, groundwater, and stream waters (scale of diagram is expressed as the relative concentration percentage of ions in milli-equivalent unit).
Figure 4.
The trilinear plot of the major chemical compositions of thermal waters, groundwater, and stream waters (scale of diagram is expressed as the relative concentration percentage of ions in milli-equivalent unit).

Figure 5.
Relationship between δ18O and δD in the thermal water, groundwater, and stream water in the study area. GMWL: Global Meteoric Water Line; LMWL: Local Meteoric Water Line according to the precipitation data from the Yeosu area, about 114 km distant).
Figure 5.
Relationship between δ18O and δD in the thermal water, groundwater, and stream water in the study area. GMWL: Global Meteoric Water Line; LMWL: Local Meteoric Water Line according to the precipitation data from the Yeosu area, about 114 km distant).

Figure 6.
Relationships between temperature (a), Eh (b) and SO4 (c) and δ34S in Bugok thermal waters. BT 1 sample showing an exceptionally high SO4 concentration in (c) the graph was excluded for statistical significance.
Figure 6.
Relationships between temperature (a), Eh (b) and SO4 (c) and δ34S in Bugok thermal waters. BT 1 sample showing an exceptionally high SO4 concentration in (c) the graph was excluded for statistical significance.

Figure 7.
Plot of 3He/4He and 4He/20Ne ratios for air, crust and mantle mixing.

Figure 8.
Variation of 3He concentration (a) and 4He/20Ne ratio (b) as a function of thermal water temperature.
Figure 8.
Variation of 3He concentration (a) and 4He/20Ne ratio (b) as a function of thermal water temperature.

Figure 9.
Na−K−Mg triangular diagram and water−rock equilibrium temperatures for Bugok thermal water.
Figure 9.
Na−K−Mg triangular diagram and water−rock equilibrium temperatures for Bugok thermal water.

Figure 10.
Multicomponent geothermometry using saturation indices of several minerals concerning the chemical composition of thermal waters.
Figure 10.
Multicomponent geothermometry using saturation indices of several minerals concerning the chemical composition of thermal waters.

Figure 11.
Schematic cross−section of the conceptual, model for a groundwater flow system, chemical evolution and reduction environment of geothermal water, and underground geological setting in the Bugok area. A−A′: cross section of the geologic map in Figure 1.
Figure 11.
Schematic cross−section of the conceptual, model for a groundwater flow system, chemical evolution and reduction environment of geothermal water, and underground geological setting in the Bugok area. A−A′: cross section of the geologic map in Figure 1.


Table 1.
Geochemical and isotopic composition of thermal water samples (mg/L) in the study area.
| Sample ID | Temp. (°C) | pH | Eh (mV) | EC (μS/cm) | DO | Na+ | K+ | Ca2+ | Mg2+ | Sr2+ | Fe |
| BT-1 | 75.6 | 7.81 | −250 | 568 | 1.50 | 93.2 | 3.58 | 12.8 | 0.12 | 0.49 | 0.01 |
| BT-2 | 74.0 | 7.97 | −290 | 535 | 0.00 | 88.7 | 3.43 | 7.69 | 0.08 | 0.33 | 0.02 |
| BT-3 | 63.4 | 7.90 | −240 | 590 | 1.10 | 96.7 | 3.81 | 13.3 | 0.38 | 0.49 | 0.03 |
| BT-4 | 58.8 | 8.49 | −440 | 465 | 0.50 | 78.7 | 2.92 | 4.09 | 0.02 | 0.15 | 0.01 |
| BT-5 | 25.7 | 7.71 | −28 | 475 | 0.70 | 74.2 | 2.13 | 19.7 | 1.93 | 0.69 | 0.02 |
| BT-6 | 52.6 | 8.50 | −65 | 378 | 3.40 | 66.7 | 2.00 | 3.38 | 0.03 | 0.12 | 0.02 |
| BT-7 | 78.7 | 8.37 | −450 | 506 | 2.60 | 83.7 | 2.94 | 4.13 | 0.01 | 0.16 | 0.01 |
| BT-9 | 78.7 | 8.41 | −490 | 494 | 0.30 | 89.5 | 3.04 | 5.14 | 0.03 | 0.19 | 0.01 |
| BT-10 | 76.3 | 8.67 | −390 | 506 | 2.10 | 91.1 | 3.02 | 4.49 | 0.06 | 0.18 | <0.01 |
| BT-11 | 26.7 | 8.71 | −130 | 392 | 3.00 | 65.2 | 0.81 | 9.74 | 1.07 | 0.16 | 0.01 |
| BT-12 | 65.8 | 7.81 | −170 | 495 | 0.40 | 75.6 | 2.69 | 21.2 | 0.22 | 0.31 | 0.01 |
| Sample ID | Mn | SiO2 | HCO3− | F− | Cl− | SO42− | *E (%) | δ18O (‰) | δ2H (‰) | δ34S (‰) | Group |
| BT-1 | 1.98 | 55.4 | 148 | 0.73 | 7.65 | 110 | −1.77 | −8.70 | −59.0 | 7.60 | Group Ⅰ |
| BT-2 | 1.87 | 53.5 | 115 | 0.68 | 7.36 | 85.3 | 5.25 | −8.90 | −59.0 | 9.10 | Group Ⅰ |
| BT-3 | 3.80 | 47.9 | 209 | 0.51 | 5.91 | 72.6 | −1.18 | −8.60 | −57.0 | 4.60 | Group Ⅱ |
| BT-4 | 0.24 | 61.4 | 125 | 0.93 | 4.20 | 81.9 | −2.86 | −9.10 | −61.0 | 14.0 | Group Ⅱ |
| BT-5 | 2.59 | 21.2 | 192 | 0.36 | 11.0 | 50.3 | −1.03 | −7.50 | −51.0 | −3.00 | Group Ⅲ |
| BT-6 | 0.60 | 46.0 | 129 | 0.49 | 8.40 | 51.2 | −4.87 | −8.60 | −57.0 | 4.60 | Group Ⅱ |
| BT-7 | 0.26 | 63.7 | 118 | 1.26 | 4.64 | 79.2 | −1.60 | −9.00 | −61.0 | 15.0 | Group Ⅰ |
| BT-9 | 0.21 | 62.9 | 118 | 0.95 | 4.86 | 93.2 | 2.18 | −9.00 | −61.0 | 13.0 | Group Ⅰ |
| BT-10 | 0.23 | 70.6 | 121 | 0.99 | 5.68 | 93.1 | 2.55 | −9.10 | −61.0 | 13.0 | Group Ⅰ |
| BT-11 | 1.89 | 19.0 | 122 | 0.59 | 15.6 | 36.4 | 3.07 | −7.40 | −51.0 | 1.00 | Group Ⅲ |
| BT-12 | 1.73 | 49.8 | 176 | 0.57 | 11.9 | 78.5 | −2.90 | −8.50 | −58.0 | 9.90 | Group Ⅱ |
Note: *E: charge balance error.
Table 2.
Geochemical and isotopic composition of groundwater and stream water samples (mg/L) from the study area.
Table 2.
Geochemical and isotopic composition of groundwater and stream water samples (mg/L) from the study area.
| Sample ID | Temp. (°C) | pH | Eh (mV) | EC (μS/cm) | DO | Na+ | K+ | Ca2+ | Mg2+ | Sr2+ |
| BG-1 | 23.3 | 7.53 | 220 | 359 | 4.70 | 10.7 | 1.00 | 50.5 | 14.2 | 0.69 |
| BG-2 | 22.7 | 7.13 | 240 | 53.0 | 7.40 | 3.08 | 0.69 | 6.37 | 0.80 | 0.03 |
| BG-3 | 22.8 | 8.10 | 160 | 267 | 7.60 | 9.54 | 3.38 | 38.8 | 4.92 | 0.21 |
| BG-4 | 23.4 | 7.70 | 180 | 331 | 4.80 | 14.4 | 0.88 | 44.7 | 9.77 | 0.57 |
| BG-5 | 18.1 | 7.22 | 160 | 365 | 3.10 | 17.3 | 4.29 | 45.2 | 11.1 | 0.39 |
| BG-6 | 18.2 | 7.47 | 3 | 406 | 7.70 | 19.7 | 1.93 | 50.7 | 7.45 | 0.39 |
| BS-1 | 20.2 | 8.13 | 240 | 425 | 7.60 | 11.1 | 1.09 | 67.3 | 15.1 | 0.56 |
| BS-2 | 20.1 | 7.92 | 240 | 372 | 6.00 | 8.84 | 1.24 | 62.1 | 12.7 | 0.44 |
| BS-3 | 23.3 | 6.72 | 250 | 296 | 6.30 | 7.12 | 1.27 | 41.3 | 9.28 | 0.29 |
| BS-4 | 25.3 | 7.54 | 140 | 425 | 3.70 | 10.8 | 1.54 | 53.3 | 5.06 | 0.38 |
| BS-5 | 21.3 | 7.61 | 210 | 235 | 6.00 | 8.16 | 0.73 | 32.4 | 8.00 | 0.24 |
| BS-6 | 20.9 | 7.86 | 230 | 101 | 6.80 | 5.96 | 0.84 | 10.3 | 2.81 | 32.0 |
| Sample ID | Fe | Mn | SiO2 | HCO3− | F− | Cl− | SO42− | *E (%) | δ18O (‰) | δ2H (‰) |
| BG-1 | <0.01 | <0.01 | 17.7 | 253 | N.D | 1.98 | 4.15 | −1.57 | −8.20 | −57.0 |
| BG-2 | 0.01 | 0.01 | 8.90 | 27.5 | 0.04 | 1.93 | 1.60 | −2.79 | −7.80 | −53.0 |
| BG-3 | 0.00 | <0.01 | 17.6 | 153 | N.D | 5.38 | 4.15 | −0.86 | −7.80 | −55.0 |
| BG-4 | 0.00 | <0.01 | 22.7 | 190 | N.D | 6.04 | 15.5 | 0.03 | −7.80 | −56.0 |
| BG-5 | <0.01 | <0.01 | 18.6 | 250 | N.D | 9.29 | 3.42 | −6.71 | −8.20 | −56.0 |
| BG-6 | 3.02 | <0.01 | 19.7 | 165 | 0.19 | 11.8 | 20.9 | 6.25 | −7.30 | −50.0 |
| BS-1 | <0.01 | <0.01 | 14.1 | 229 | N.D | 1.64 | 38.2 | 5.39 | −7.70 | −54.0 |
| BS-2 | 0.01 | 0.01 | 15.6 | 302 | N.D | 2.73 | 3.75 | −6.08 | −7.70 | −53.0 |
| BS-3 | 0.21 | 0.21 | 12.2 | 159 | N.D | 6.72 | 37.5 | −6.02 | - | - |
| BS-4 | 0.12 | 0.12 | 16.9 | 169 | 0.13 | 4.11 | 16.0 | 4.13 | −7.80 | −52.0 |
| BS-5 | 0.03 | 0.03 | 14.4 | 129 | 0.04 | 1.70 | 10.0 | 4.85 | −7.90 | −53.0 |
| BS-6 | 0.07 | 0.07 | 14.4 | 54.9 | N.D | 2.39 | 4.75 | −3.61 | - | - |
Notes: *E: charge balance error; N.D: None Detected.
Table 3.
Original content ratio of 3He and 4He in Bugok thermal waters.
| Sample ID. | 4He | 3He | ||||
|---|---|---|---|---|---|---|
| Air % | Mantle % | Crust % | Air % | Mantle % | Crust % | |
| BT-1 | 0.90 | 2.90 | 96.2 | 3.50 | 95.2 | 1.30 |
| BT-2 | 1.07 | 2.50 | 96.4 | 4.60 | 93.9 | 1.50 |
| BT-3 | 1.34 | 2.60 | 96.0 | 5.50 | 93.1 | 1.40 |
| BT-4 | 0.57 | 2.70 | 96.7 | 2.40 | 96.2 | 1.40 |
| BT-5 | 21.0 | 0.40 | 78.6 | 84.3 | 14.6 | 1.10 |
| BT-7 | 0.70 | 2.80 | 96.5 | 2.90 | 95.7 | 1.40 |
| BT-9 | 0.49 | 2.70 | 96.8 | 2.00 | 96.6 | 1.40 |
| BT-11 | 8.54 | 2.20 | 89.5 | 33.3 | 65.4 | 1.20 |
| BT-12 | 0.70 | 2.80 | 96.5 | 2.70 | 96.0 | 1.40 |
Table 4.
Estimated reservoir temperature of Bugok thermal waters.
| Sample ID. | Discharge Temp. (°C) | Na−K−Mg Reservoir (°C) | Water−Mineral Equilibria Model (°C) | |||||
|---|---|---|---|---|---|---|---|---|
| Na−K (1) | K−Mg (2) | Calcedony | Quartz | Ca−Montmorillonite | K−Feldspar | Muscovite | ||
| BT-1 | 75.6 | 166 | 95 | (74) | 105 | (70) | (58.0) | 108 |
| BT-2 | 74.0 | 166 | 100 | (73) | 101 | (67) | (57) | 105 |
| BT-4 | 58.8 | 164 | 115 | 74 | 101 | (58) | (57) | 94 |
| BT-6 | 52.6 | 152 | 98 | 62 | 90 | 54 | (49) | 90 |
| BT-7 | 78.7 | 161 | 126 | (77) | 104 | (61) | (58) | 97 |
| BT-9 | 78.7 | 159 | 110 | (76) | 103 | (60) | (59) | 96 |
| BT-10 | 76.3 | 157 | 100 | 77 | 103 | (56) | (54) | 91 |
Publisher’s Note: MDPI stays neutral with regard to jurisdictional claims in published maps and institutional affiliations. |
© 2022 by the authors. Licensee MDPI, Basel, Switzerland. This article is an open access article distributed under the terms and conditions of the Creative Commons Attribution (CC BY) license (https://creativecommons.org/licenses/by/4.0/).
Share and Cite
MDPI and ACS Style
Jeong, C.; Lee, Y.; Lee, Y.; Ahn, S.; Nagao, K. Geochemical Composition, Source and Geothermometry of Thermal Water in the Bugok Area, South Korea. Water 2022, 14, 3008. https://doi.org/10.3390/w14193008
AMA Style
Jeong C, Lee Y, Lee Y, Ahn S, Nagao K. Geochemical Composition, Source and Geothermometry of Thermal Water in the Bugok Area, South Korea. Water. 2022; 14(19):3008. https://doi.org/10.3390/w14193008
Chicago/Turabian StyleJeong, Chanho, Yujin Lee, Yongcheon Lee, Sangwon Ahn, and Keisuke Nagao. 2022. "Geochemical Composition, Source and Geothermometry of Thermal Water in the Bugok Area, South Korea" Water 14, no. 19: 3008. https://doi.org/10.3390/w14193008
Note that from the first issue of 2016, this journal uses article numbers instead of page numbers. See further details here.