Article

Groundwater Quality for Irrigation Purposes in the Diass Horst System in Senegal

by
Ousmane Coly Diouf
1,*,
Hameth Khassim Sarr
1,
Mathias Diedhiou
1,
Lutz Weihermüller
2,
Ndeye Maguette Dieng
1,
Seynabou Cissé Faye
1,
Harry Vereecken
2 and
Serigne Faye
1
1
Geology Department, Faculty of Sciences and Techniques, Cheikh Anta Diop University of Dakar, B.P 5005, Dakar-Fann 10700, Senegal
2
Forschungszentrum Jülich GmbH, Agrosphere Institute IBG-3, 52425 Juelich, Germany
*
Author to whom correspondence should be addressed.
Water 2022, 14(19), 3002; https://doi.org/10.3390/w14193002
Submission received: 12 August 2022 / Revised: 12 September 2022 / Accepted: 14 September 2022 / Published: 23 September 2022
(This article belongs to the Section Hydrogeology)

Abstract

:
Due to surface water scarcity and variability in rainwater events in the Thies region, Senegal, farmers mostly rely on groundwater resources to improve yield production, although water quality in the hydrosystem and its suitability may be an issue. The objective of this study is to evaluate suitability of the Maastrichtian and Paleocene aquifers located the central western part of Senegal in the Thies region for irrigation purposes. For this purpose, chemical analyses were carried out on the major ions on the Maastrichtian and Paleocene aquifers through a network of 62 sample locations (39 from the Maastrichtian and 23 from the Paleocene) sampled in June 2019. Different water suitability assessment indices were used to evaluate the potential for irrigation, including sodium absorption ration (SAR), percentage of sodium (Na%), permeability index, Kelly ratio (RK), and salinity potential (SP) together with Wilcox and USSL diagrams as methods. The results indicate, that the Ca-Mg-HCO3 water type is dominant in the Maastrichtian aquifer, while in the Paleocene aquifer, HCO3-Ca-Mg and Cl-Ca-Mg are the main water types. The combination of these computed index values indicates that the percentage of suitable water for irrigation purposes accounts for 89.7% and 86.9% of the samples for the Maastrichtian and the Paleocene aquifers, respectively. On the other hand, water samples unsuitable for irrigation purposes range between only 10.3% and 13.1% for the two aquifers.

1. Introduction

Worldwide, cultivated lands for agricultural crop production cover 1.6 billion ha, which accounts for about 12% of the global land area [1]. Fertile land is therefore a crucial natural resource for all sorts of agricultural production, including livestock farming. In Western Africa, the available agricultural land varies between 62 and 95% of the individual countries [2], where crop production through irrigation practices may reach two to four times the yield compared to rainfed agriculture yields [3,4]. In arid and semi-arid regions, where surface water occurrence is scarce and rainwater events are variable, groundwater constitutes the unique resource for drinking and socio-economic development, including agriculture [5,6]. The contribution of groundwater for irrigation purposes has increased steadily over the years from about 40% during the early 1980s to about 80% in recent years [7,8,9,10]. In the study region, irrigated agriculture using groundwater resources has increasingly developed over the past two decades by individual private farmers to agrobusiness due to arable and fertile soils. In addition to agriculture practices, the mining sector needs as well as urban and rural drinking water needs represent other pressures on the groundwater potential. As a consequence, high groundwater extraction rates occur, which may even increase in the future in this area to meet the competing domestic, agricultural, and industrial demand, leading to a continuous groundwater level decline and deterioration of the groundwater quality through salinization, e.g., by salt water intrusion [11,12].
In this paper, we focus mainly on the suitability of groundwater for agricultural irrigation, which takes into account the effects of the dissolved minerals on both soil and plants [13,14]. In fact, salt-rich irrigated waters can lead to: 1/ salt precipitation at the soil surface, causing inherent losses in crop production [15]; 2/ high salt concentrations in the top soil profile as well as physico-chemical soil characteristics which may directly interfere with crop productivity (as pore water salinity becomes too high for growing plants) [16,17,18]. For example, the increase in the sodium concentration in the soil pore water can lead to the dispersion of clays, causing degradation of the soil structure [19]. In addition, soil degradation changes the hydraulic characteristics of the soils, such as water and air permeability and water retention [20,21,22,23], which can lead to reduction in the root zone aeration [24] and crop productivity. In general, the soil’s vulnerability with regard to salinization depends not only on the chemical quality of the irrigated water but also on the physico-chemical characteristics of the soil itself, in addition to inadequate anthropogenic drainage systems [25,26,27,28,29,30]. In the region, farmers currently use pumped groundwaters from boreholes with limited knowledge of their quality and suitability with regards to irrigated crops. Thereby, an assessment of the water quality oriented to suitability in agriculture is of prime importance to promote best agricultural yield and appropriate management strategies.
In this prospect, water quality indices are effective tools [4,13,30,31,32,33] to evaluate water quality for drinking and irrigation purpose, and they constitute key parameters for the assessment and management of groundwater reservoirs. In this present work, we estimate the suitability of groundwater for irrigation purposes by measuring, e.g., the electrical conductivity (EC), sodium adsorption ratio (SAR), salinity potential, permeability index (PI), and relative proportions of Na+ expressed by Na% in the Maastrichtian and Paleocene aquifers in order to assess the possible risks to crops production and soil degradation through use of unsuitable water for irrigation.

2. Materials and Methods
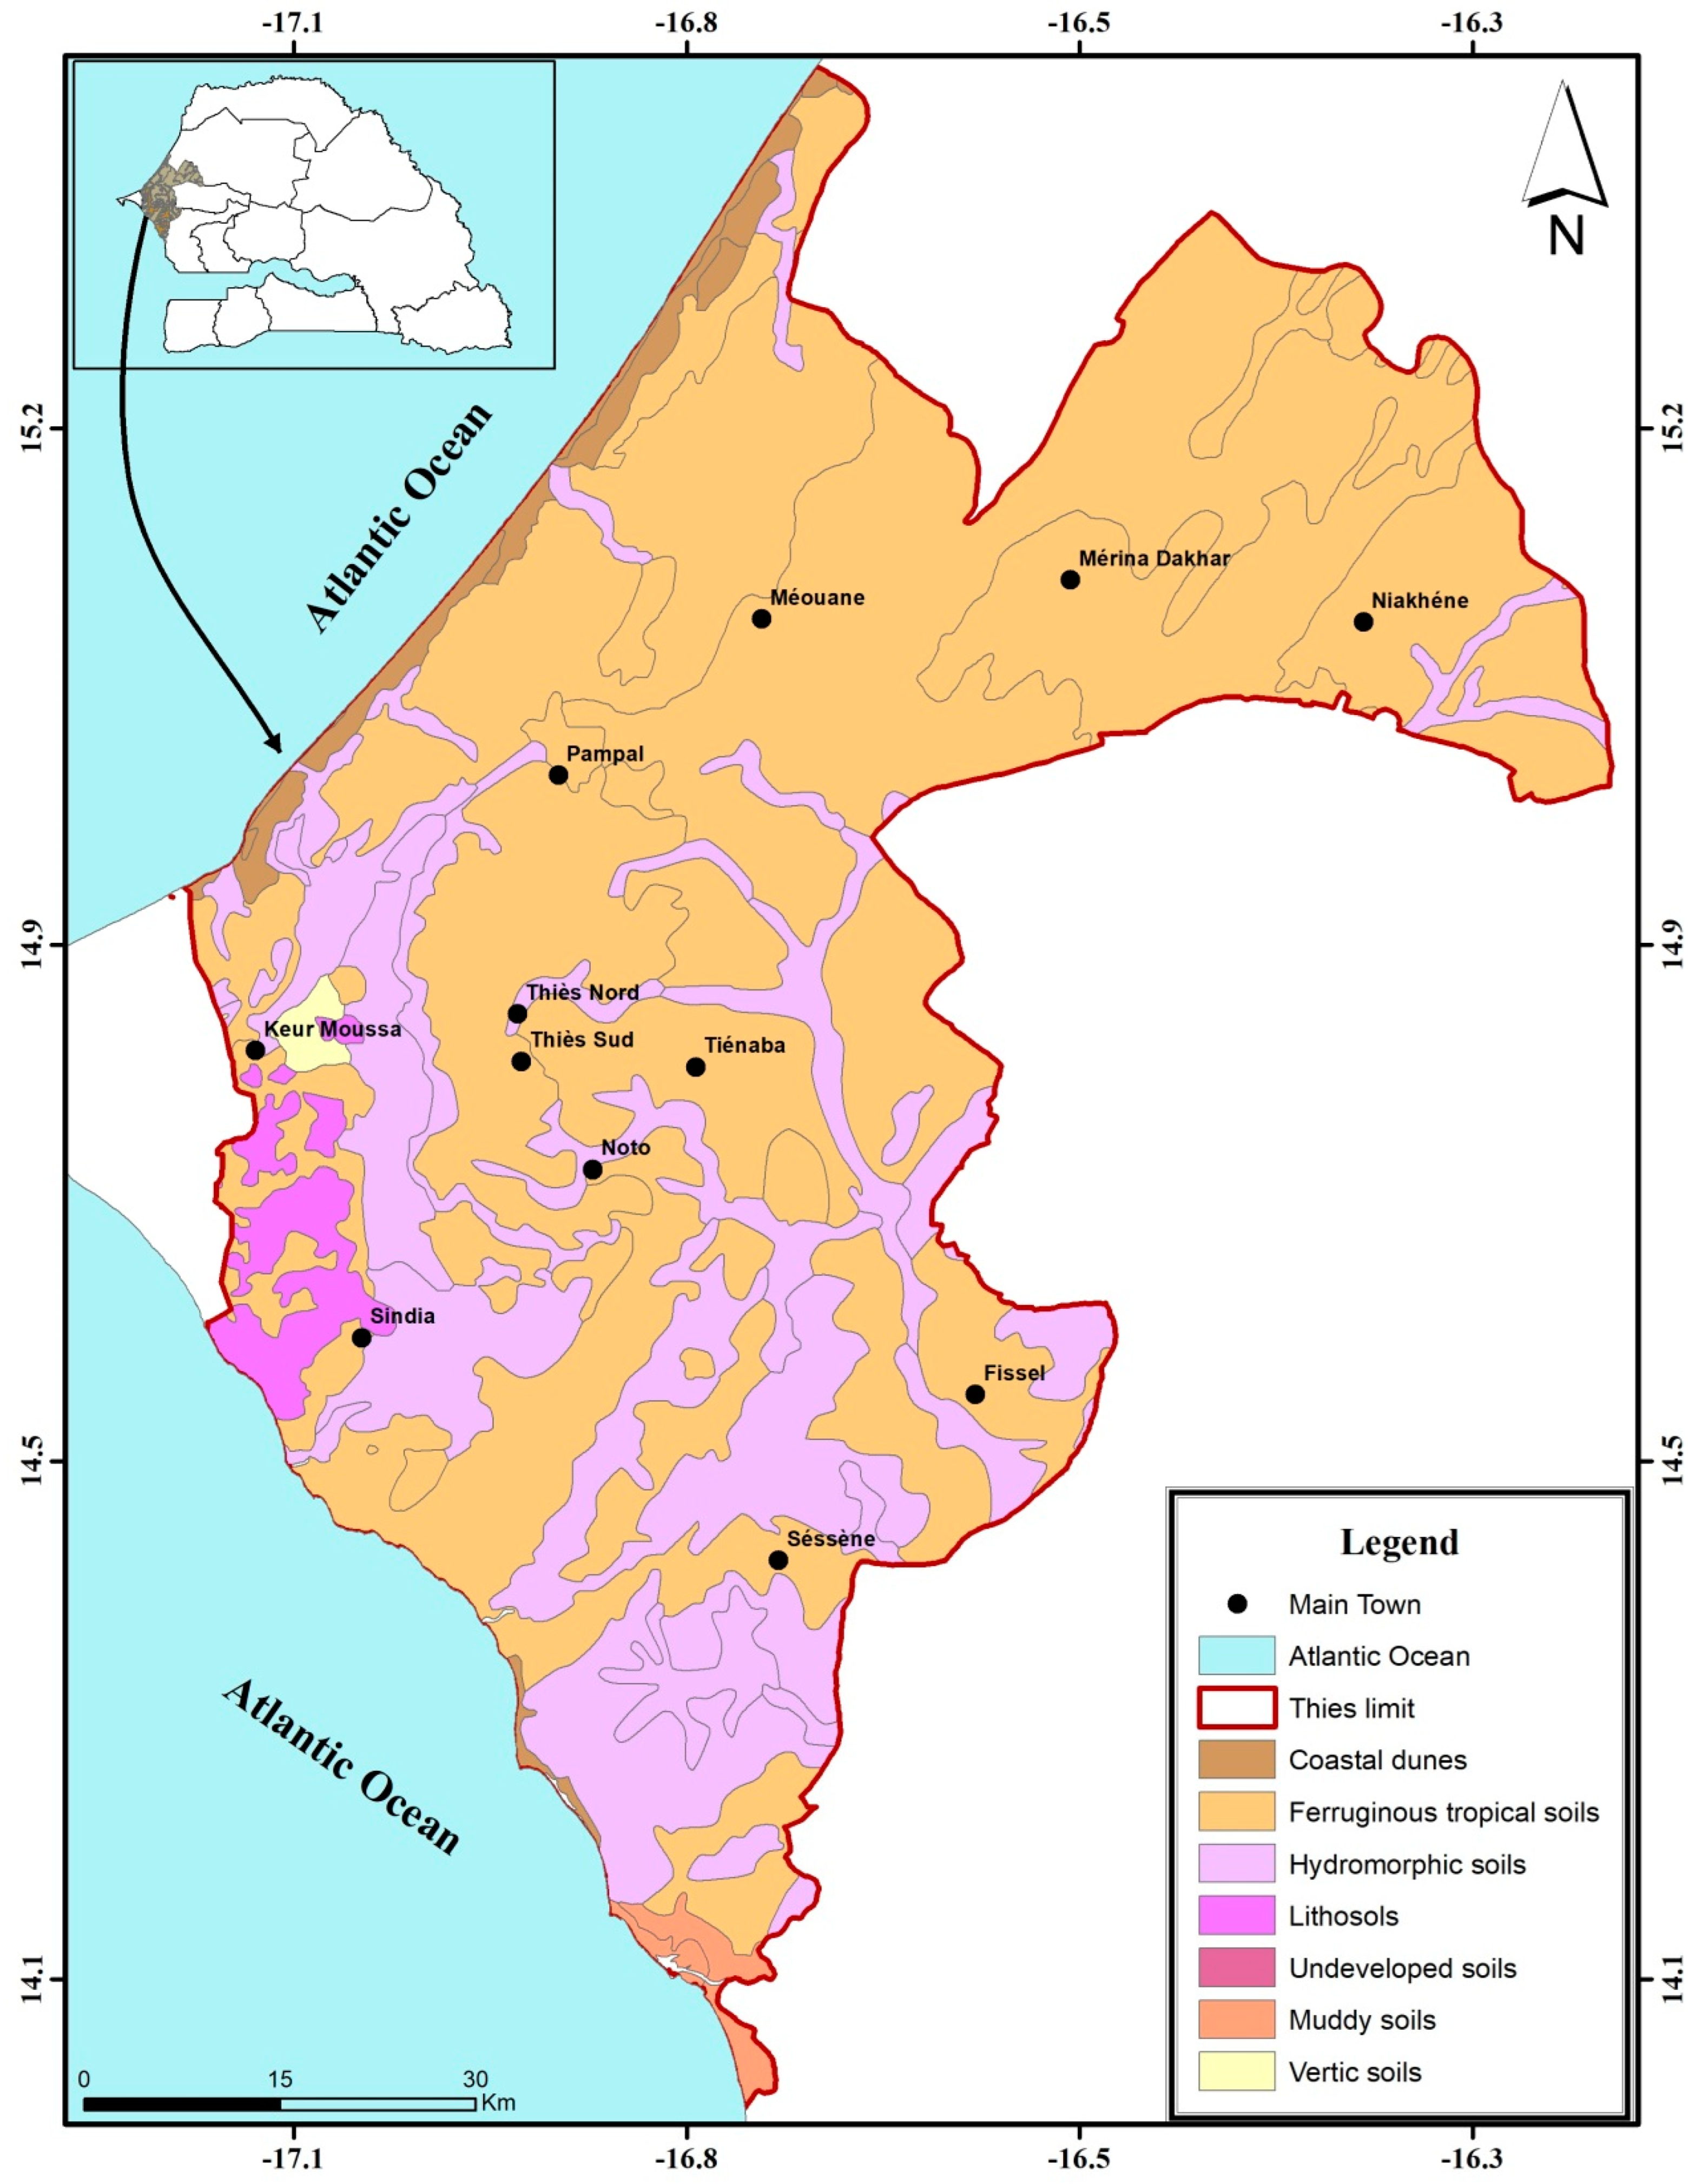
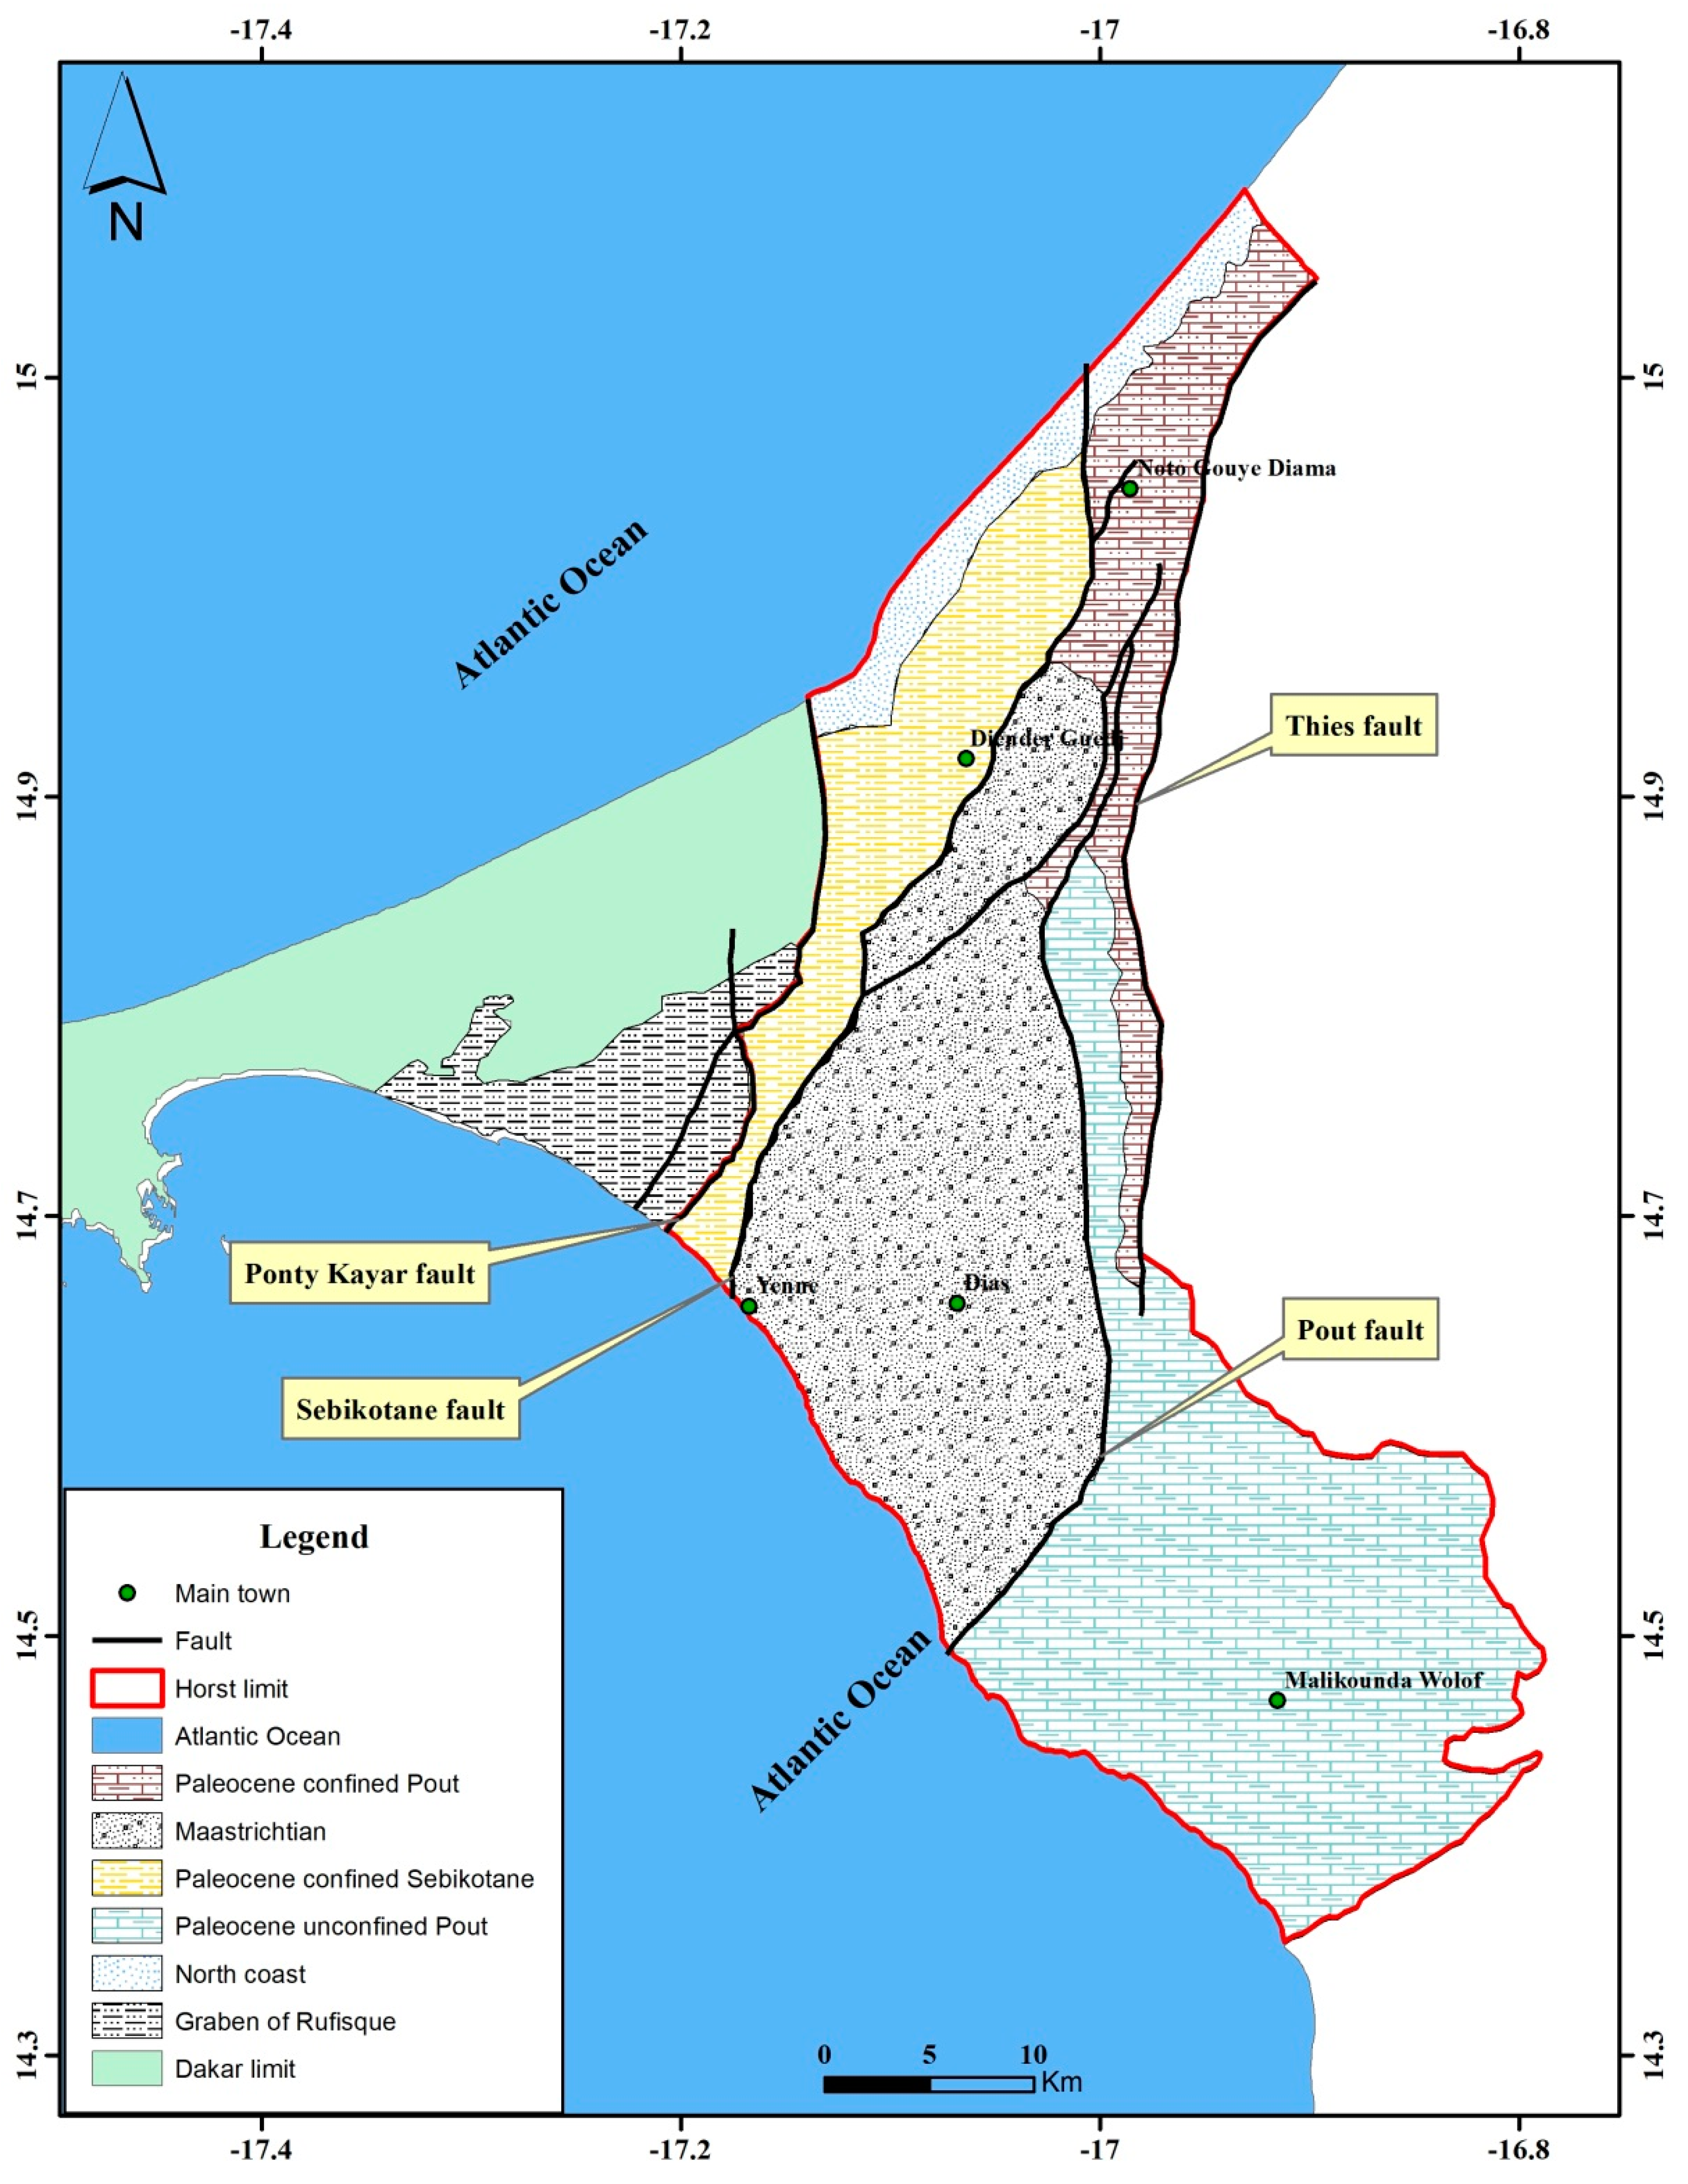
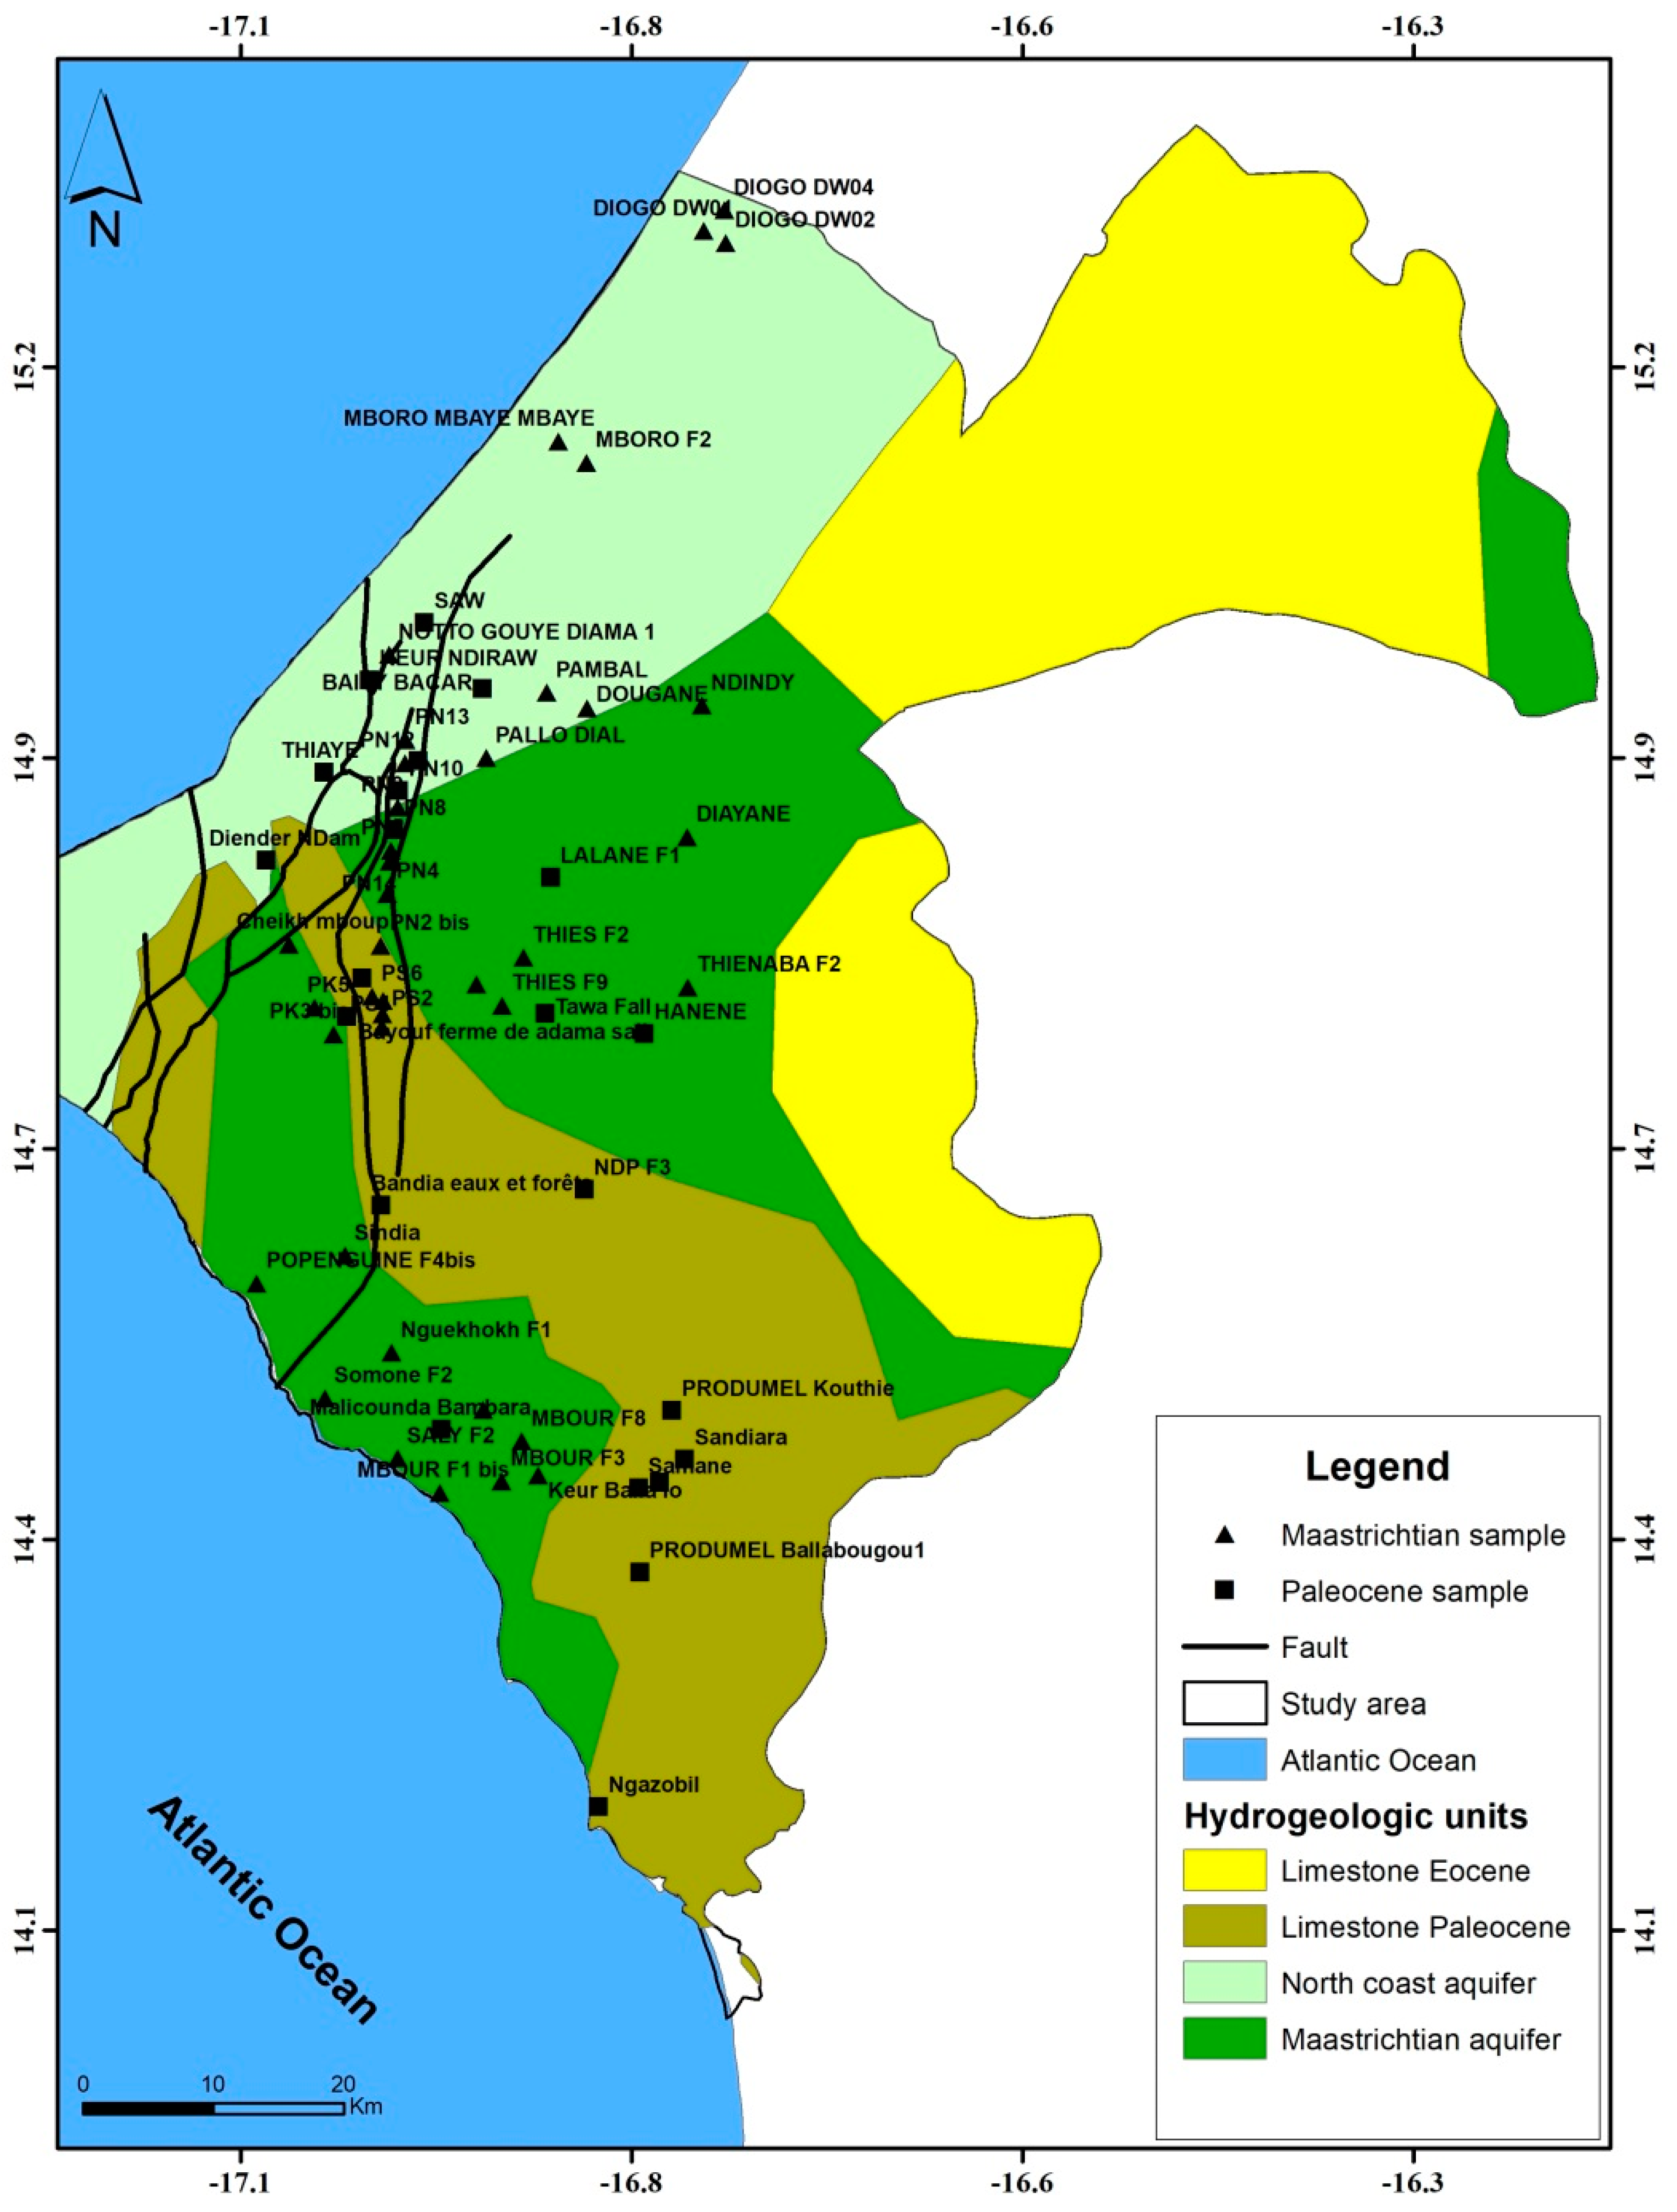
2.1. Study Area

The Thies region is one of the fourteen administrative regions of Senegal. It is located in the western part of Senegal between 14°02′15″–15°26′09″ N and 17°08′58″–16°29′44″ W and covers an area of 6601 km2. It is bound to the north, south, and east by the Louga, Fatick, and Diourbel–Fatick regions and to the west by the region of Dakar and the Atlantic Ocean. It has two maritime coasts, one in the north (called “Grande Cote”), where the main market gardening area of the “Niayes” area is located, and the other one in the south (call “Petite Cote”), which is one of the most touristic areas in Senegal (Figure 1).
The region is characterized by a semi-arid climate with a rainy season between June to October. Climatic data collected from the Senegal National Civil Aviation and Meteorological Agency (ANACIM) show that annual rainfall varies strongly between the years (234.9 mm in 2014 and 664.4 mm in 2010) with a long-term annual mean of 445.7 mm (1989–2019). Maximum air temperature is on average 35 °C (1989–2019) and occurs from March to October, corresponding to the beginning and the end of the rainy season. Minimum air temperature is observed from January to February (18.5 °C).
Geologically, the Thies region belongs to the Senegalese-Mauritanian basin, whose sedimentary formations start from the Trias–Lias to the Quaternary without interruption. The lithostratigraphic description of this region begins from the Upper Cretaceous with the Maastrichtian formations until the late Quaternary deposits. This description is essentially based on data from geological profiles, water and especially hydrocarbon exploration, and on the synthesis of published studies by [11,35,36,37,38,39].
The Maastrichtian formation is observed throughout the Senegalese basin and outcrops at the Diass horst under sandy and clayey facies. Composed mainly of clayey to coarse sands, the Maastrichtian aquifer is exploited by more than 1500 boreholes in most parts of the country. Its thickness increases towards the west quite rapidly from 60 m at Dendoudi in the Est, reaching 85 m at Dioumanan, 310 m at Sagata located at the center of the basin, 405 m at Mbour, and more than 2000 m at the longitude of Dakar [35]. The Paleocene is known to outcrop in the peninsula of Dakar, around the horst of Diass. It is a transgressive formation and slightly in unconformation with variable facies and is thin over the Maastrichtian in the horst zone. In the system, the sedimentation was predominantly terrigenous during the Cretaceous. However, it became through a trangressive phase during the Paleogene a chemical characteristic [36] with predominance of clay-marly and limestone facies [38,40].
The tectonics of the region is very complex, especially in the Diass featured by the William Ponty, Sebikhotane, Pout, Fouloume, and Thies faults.
From a hydrogeological point of view, the study area includes two major aquifers, namely, the Maastrichtian and Paleocene aquifers, which play an important role in the water supply of households, industries, agriculture, market gardening, and mining. Due to major faults, the hydraulic system is configured into three compartments: 1/ the Sebikotane compartment at the West between the Ponty–Kayar and Sebikotane faults featured by the Paleocene limestone aquifer; 2/ the horst compartment at the center where the Maastrichtian sandstone aquifer is outcropped; 3/ the Pout compartment at the East where the Paleocene aquifer underlies the Maastrichtian sandstone aquifer. (Figure 2) [11,35,36,37,39].
The soil map of the study area (Figure 1) was extracted from the soil map at 1:50,0000 compiled by [34]. The most important soil classes include ferruginous, hydromorphic, and alluvial-colluvial soils occurring in the low plains. These soils are characterized by a grey humus topsoil horizon of few centimeters thick, followed by a clay and light brown iron nodules horizon. They are composed of fine sand on the surface and sandy-clayey in deep zones.

2.2. Sample Collection and Analysis

The sampling campaign was carried out in June 2019 in a network of boreholes tapping the Maastrichtian and Paleocene aquifers. A total of 62 boreholes were sampled, with 39 boreholes in the Maastrichtian and 23 boreholes in the Paleocene (Figure 3). These boreholes are used for the drinking water supply of the Dakar region and for irrigation in the area. Electrical conductivity (EC), temperature (T°), and pH were measured in situ. Samples were collected in plastic bottles which were thoroughly rinsed three times prior sampling. The bottles were then carefully sealed, labeled, and stored at low temperature during the transport and at the laboratory before analyses. Water samples were analyzed at the chemistry laboratory of the Geology Department of the Cheikh Anta Diop University of Dakar (UCAD). Major anions (Cl, SO42−, HCO3, and NO3) and cations (Ca2+, Mg2+, Na+, and K+) were determined by ion chromatography using the Dionex DX120 chromatograph (ThermoFischer Scientifics, Waltham, MA, USA).

2.3. Water Quality for Irrigation Purposes (Water Indices)

In this study, five indices were used to evaluate the water quality for irrigation purpose, namely the sodium absorption ratio (SAR), the salinity potential (SP), the Kelly ratio (KR), the permeability index (PI), and the percentage of Na+ (Na%). In addition to these indices, USSL diagrams (SAR versus EC) [41] and Wilcox diagrams (Na% versus EC) [14] were used to assess the soil salinization and sodium hazard, whereby the USSL diagram describes the alkalinizing power of the water. These tools were combined to assess the potential risk of soil salinization and to control their negative effects on soils and plants.
Salinity hazard of irrigation water based on the electrical conductivity (EC) discriminates four classes [14,42]. Water with EC values ≤ 250 µS cm−1 characterizes low salinity water suitable for all types of crops and soils, EC values between 250 and 750 µS cm−1 indicate medium salinity waters, which can be used if a moderate amount of leaching occurs, range values between 750 and 2250 µS cm−1 characterizes high salinity which is unsuitable for soil with restricted drainage, and values between 2250 and 5000 µS cm−1 represent very unsuitable high salinity water for irrigation.
The sodium absorption ratio (SAR), which generally provides information on the risk of alkalinity, is a parameter which computes the proportion of sodium (Na+), calcium (Ca2+), and magnesium (Mg2+) ions in a water sample. As mentioned priorly, high Na+ concentrations may impact the soil negatively through the degradation of aggregates and increase in the concentration of free clay particles which can clog fine soil pores [30,43]. The SAR is expressed by Equation (1) according to [13]:
SAR = ( Na + ) ( Ca 2 + + Mg 2 + ) / 2  
whereby all ions are expressed in meq L−1.
Classification of irrigation water based on SAR distinguishes four classes [13]. Waters with SAR values between 0 to 10 (S1) are low in sodium and are suitable for all types of crops and soil, except for those crops which are sensitive to sodium. Values ranging between 10 and 18 (S2) characterize waters exhibiting medium sodium suitable for coarse texture or organic soil with high permeability but is relatively unsuitable for fine textured soil. Values ranging between 18 and 26 (S3) represent waters with high sodium content, which are harmful for almost all type of soils. These latter require good drainage and additionally high leaching of gypsum. Finally, SAR values exceeding 26 (S4) are associated with very high sodium content waters, which are unsuitable for irrigation purposes.
Soluble salts in waters can be expressed by either EC or by the salinity potential, SP. The SP also controls the suitability of water for irrigation. Hereby, it is assumed that low soluble salts accumulate in the soil and are therefore beneficial for irrigation [30,31]. Salinity potential values for irrigation water can be distinguished into tree classes in soil of medium permeability [30,44]. SP values less than 5 are class I, characterized by good to excellent water for irrigation. Values between 5 and 10 are related to class II, characterized by a medium water type, and class III has SP values exceeding 10, characterized by poor water for irrigation.
The salinity potential is calculated by Equation (2) [44]:
SP   =   Cl + 1 2 ( SO 4 2 )  
where, again, Cl and SO42− ions are expressed in meq L−1.
Kelly et al. (1940) suggested that the sodium problem in irrigation water can be conveniently described by a ratio of Na+ and Ca2+ + Mg2+ ions. The so-called Kelly’s ratio is provided by Equation (3) [45]:
KR = Na + Ca 2 + + Mg 2 +
where, again, Na+, Ca2+, and Mg2+ are expressed in meq L−1.
A Kelly’s ratio higher than one indicates an excess of sodium contents in waters, which is unsuitable for irrigation, while a Kelly’s ratio smaller one indicates suitable waters for irrigation [30].
The permeability index (PI) is an important factor inferring information on the quality of irrigation water with respect to changes in the arable soils, as the soil permeability can be impacted by an excess of ions such as Na+, Ca2+, HCO3, and Mg2+ [46,47]. The PI is calculated by Equation (4) according to [44], who classified the water into Class I, Class II, and Class III. Class I and II waters are categorized as good for irrigation with 75% or more of maximum permeability and class III water is unsuitable with 25% of maximum permeability.
PI = ( Na + + HCO 3 ) * 100 ( Ca 2 + + Mg 2 + + Na + + K + )  
A high Na+ percentage (Na%) in irrigation water can lead to degradation of the soil structure, hence causing low aeration and poor water infiltrability. The classification of groundwater according to the Na% allows the definition of five classes: excellent (Na% < 20), good (20 < Na% < 40), permissible (40 < Na% < 60), doubtful (60 < Na% < 80), and unsuitable (Na% > 80) [14]. The Na% can be calculated by Equation (5) [48,49], whereby all ion concentrations are in meq L−1.
Na % = ( Na + +   K + ) ( Ca 2 + +   Mg 2 + +   Na + +   K + ) * 100

3. Results and Discussions

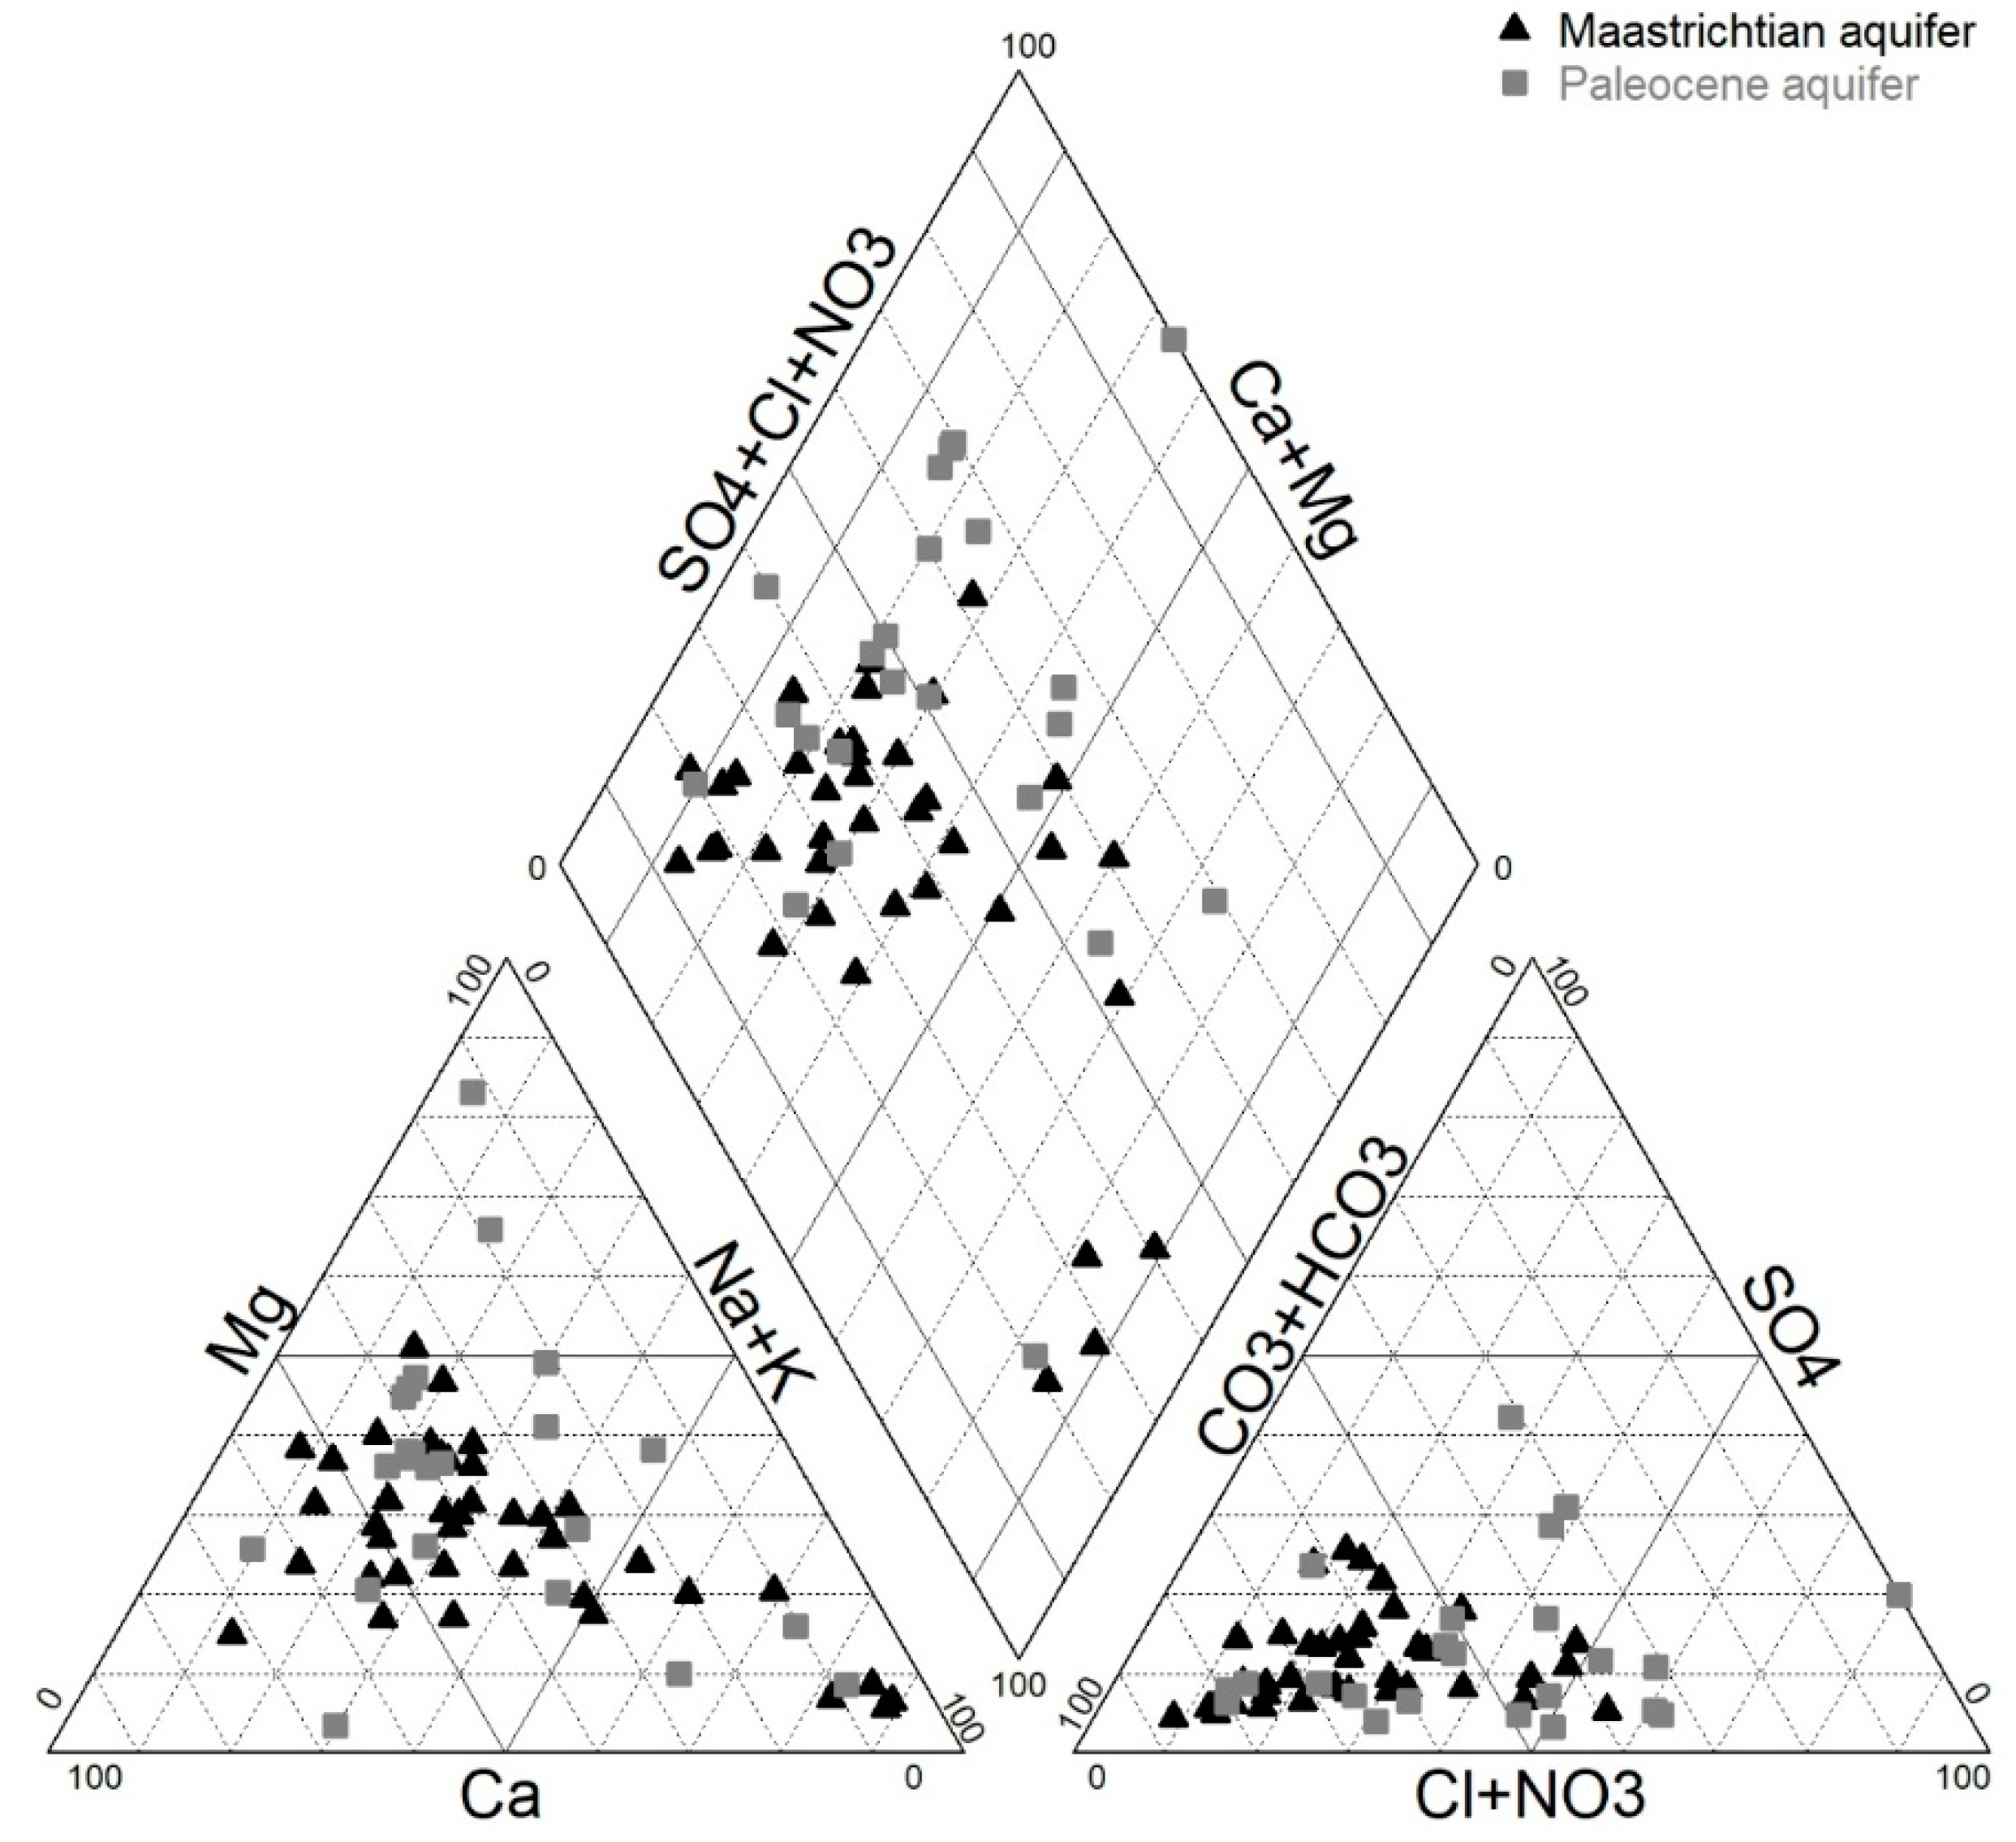
3.1. General Characterization of the Aquifer Waters

The statistics of the chemical composition of Maastrichtian and Paleocene groundwater samples of the Thies area are summarized in the Table 1 and Table 2. In general, the pH-value influences the form and availability of nutrients in waters essential for crop development is optimal [50], and the pH of irrigation water should be between 6.5 and 8.54 [51]. In the Maastrichtian aquifer, pH values vary between 6.98 and 7.8 with a median of 7.51 (Table 1), indicating suitable water for irrigation purpose. In the Paleocene aquifer (Table 2), neutral to basic pH values are observed with a minimum of 6.96 at the sampling location Baba Diaw F1 and a maximum of 8.11 at Produmel Ballabougou (median = 7.50).
Electrical conductivity (EC), which expresses dissolved salt contents in the groundwater, plays an important role in assessing the suitability of water for irrigation. The United States Department of Agriculture Salinity Laboratory uses EC values to classify irrigation water into four salinity classes. From measured data in the system, groundwater samples showed range EC values of 274–1403 µS cm−1 with a median of 462 µS cm−1 and between 204 and 2860 µS cm−1 (median of 823 µS cm−1) for the Maastrichtian and the Paleocene aquifers, respectively.
Chemical data (expressed in meq L−1) of the groundwater sampled in the two aquifers indicate a general order of magnitude as follows: HCO3 > Cl > SO42 > NO3 for the anions and Na+ > Ca2+ > Mg2+ > K+ for the cations. Values plotted in the Piper trilinear diagram [52] identified dominant HCO3-Ca-Mg water type in the Maastrichtian aquifer, while in the Paleocene aquifer, both HCO3-Ca-Mg and Cl-Ca-Mg water types occur (Figure 4).

3.2. Suitability of the Aquifer Water for Irrigation Purposes

In the horst area, the two main aquifers are heavily exploited to meet demands for drinking water supply, industries, mining, and agriculture. Many factors affect the quality of irrigation water, including temperature, pH, salinity, and alkalinity. Irrigation water requirements depend essentially on temperature and the pH value of the groundwater. However, the water quality for irrigation water is generally evaluated using salt and alkali damage [32]. For this evaluation of the suitability of the groundwater for irrigation, the electrical conductivity (EC) and the sodium absorption ratio (SAR), Kelly ratio (RK), salinity potential (SP), permeability index (PI), and the percentage of sodium (Na%) were calculated. Additionally, the risks of soil salinization and sodium hazard were assessed using USSL and Wilcox diagrams.

3.2.1. Electrical Conductivity (EC)

The electrical conductivity (EC), which represents a measure of the total dissolved ions, is the most widely used water quality index for irrigation water control as it measures the water salinity hazard. High EC in groundwater samples may be inferred by leaching or dissolution of the aquifer minerals, mixing with saline sources, or a combination of these processes [51,52]. The EC values of the Maastrichtian aquifer vary between 274 (piezometer PS4 bis) and 1403 µS cm−1 (Mbour F1 bis) with a median of 462 µS cm−1, while for the Paleocene aquifer, EC values vary between 204 (Toude Ndiop) and 2860 µS cm−1 (Ngazobil) with a median of 823 µS cm−1 (see Table 3 and Figure 3). Classification of the sampled Maastrichtian and Paleocene aquifers according to EC values shows four classes. Overall, 79.5% of the sampled Maastrichtian groundwater presents a moderate risk of salinization corresponding to class C2 (located around Thies F9, F6, Pout sud 4 bis), and 20.5% of the water is of high risk of salinization and corresponds to class C3 (at Mbour F1 bis, Mbour F3, and Diogo DW04) (see Table 3). On the other hand, for the sampled Paleocene groundwater, 65.4% presents high risk of class C3 (Produmel Ballabougou 1, Produmel Kouthie, and Baity Bacar), 26.0% of moderate risk (C2) (at Bandia, Baba diaw, F1, and F2 Pout), 4.3% without risk (C1) around Toude Ndiop, and 4.3% of very high risk (C4) of salinization (at the Ngazobil) (Table 3).

3.2.2. Sodium Absorption Ratio (SAR)
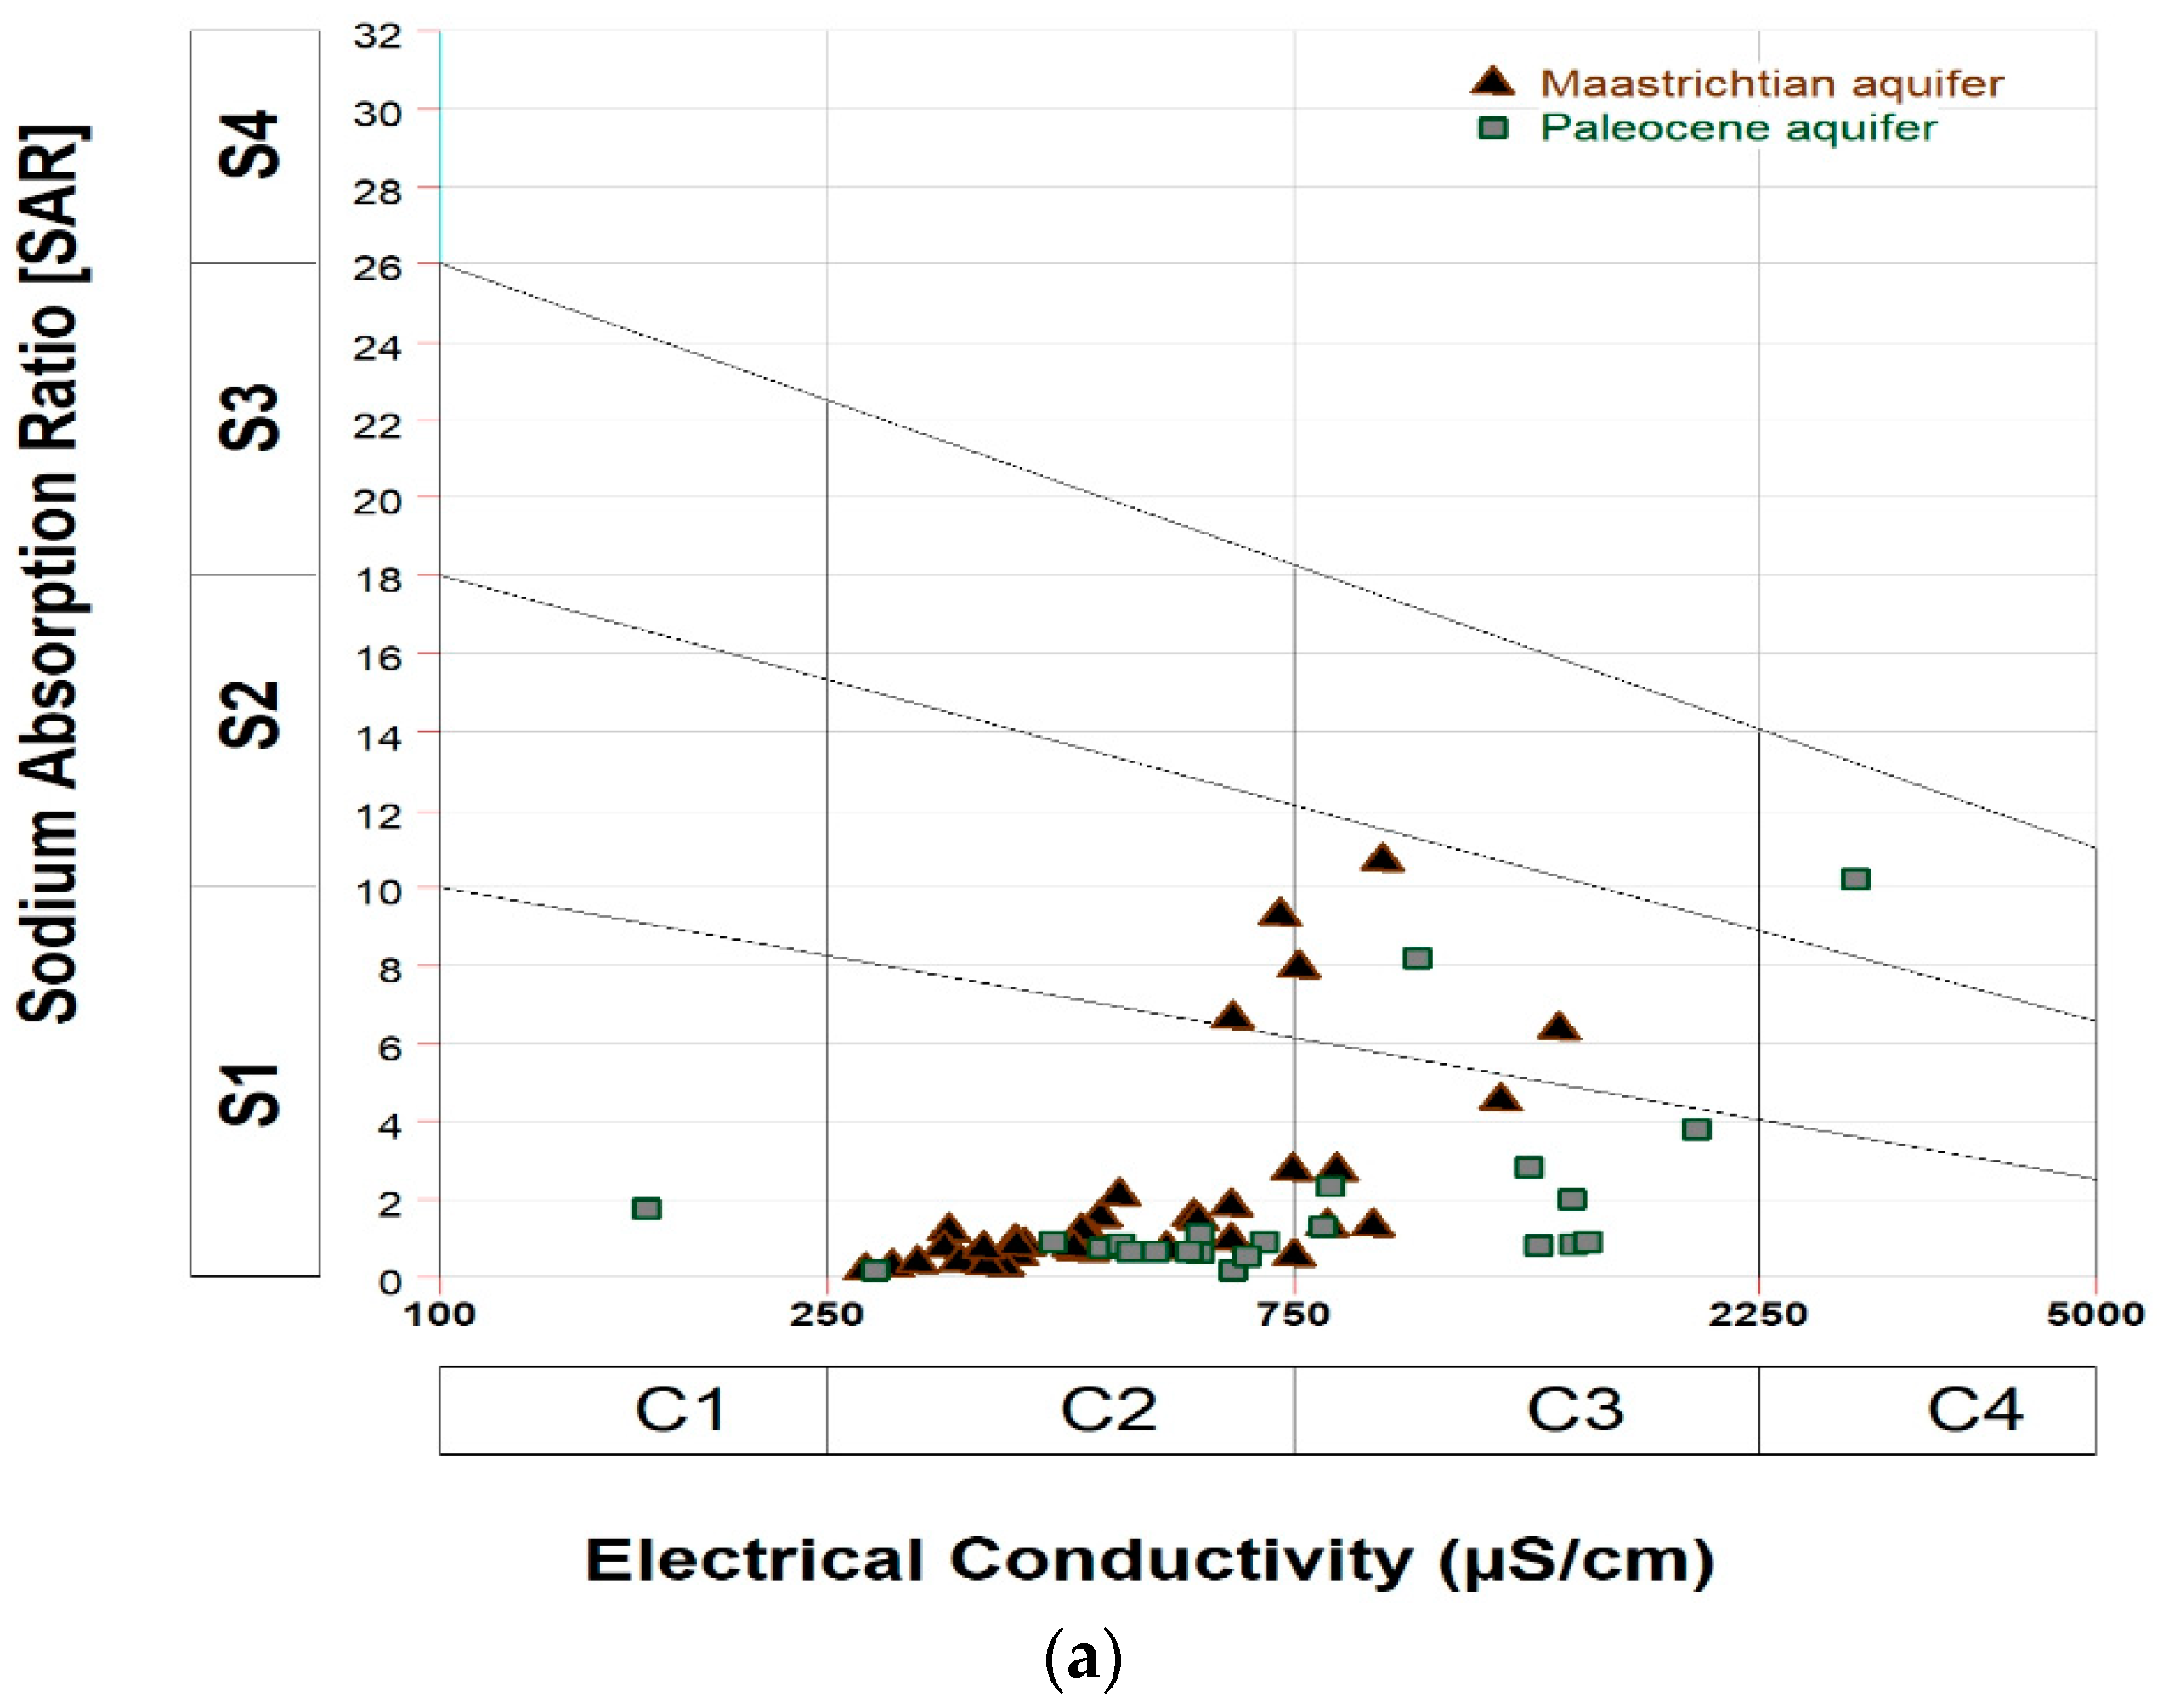
Groundwater salinity and SAR can be used to evaluate water quality for irrigation purposes. In general, the salinity in groundwater originates from salt leaching from soils, anthropogenic sources (e.g., fertilizer salts, waste water infiltration), weathering of the evaporate minerals, mixing of saline sources, or a combination of these processes [53,54,55]. The SAR values of the Maastrichtian aquifer samples vary between 0.24 and 15.1 meq L−1 with a median of 1.38 meq L−1 (Table 4). For the Paleocene aquifer, the SAR values exhibit the same range as for Maastrichtian aquifer. Minimum and maximum SAR are 0.23 and 14.5 meq L−1 with a median of 1.27 meq L−1 (Table 4). As noticed, from Table 4, more than 90% of the sampled groundwaters from the two aquifers belong to class S1 and are therefore suitable for irrigation if only the SAR values are considered.

3.2.3. USSL Diagram

The United States Department of Agriculture Salinity Laboratory diagram (USSL) shows a detailed analysis of groundwater with respect to irrigational suitability [41]. Based on this classification, the Maastrichtian and Paleocene groundwaters of the study area can be grouped into classes C2S1, C2S2, C3S1, and C3S2 and C1S1, C2S1, C2S2, C3S1, and C4S3, respectively (Figure 5a). For this classification, C and S values ≤ 3 indicate lower EC and lower SAR. Overall, 87.2% of the sampled Maastrichtian groundwater and 87.0% of the sampled Paleocene groundwater indicate low to medium salinity and medium alkalinity, which can be used for irrigation in almost all types of soils with no danger of exchangeable sodium. C3S1 (which characterizes highly saline–low sodic hazard) and C3S2 (for highly saline–medium sodic type) occur in the Maastrichtian groundwater located in the north part of the horst at Diogo and in the south of the study area. These types are considered as acceptable water for the irrigation of salt-tolerant crops on well-drained or high-permeability soils whose salinity must be controlled. C4S3, which depicts very highly saline–high sodic type soil, is encountered in the Paleocene aquifer with EC values ranging between 2250 and 5000 μS cm−1. This salty water type found towards Ngazobil is not recommended for irrigation due to its harmful effects on plants and soils (Figure 5a).

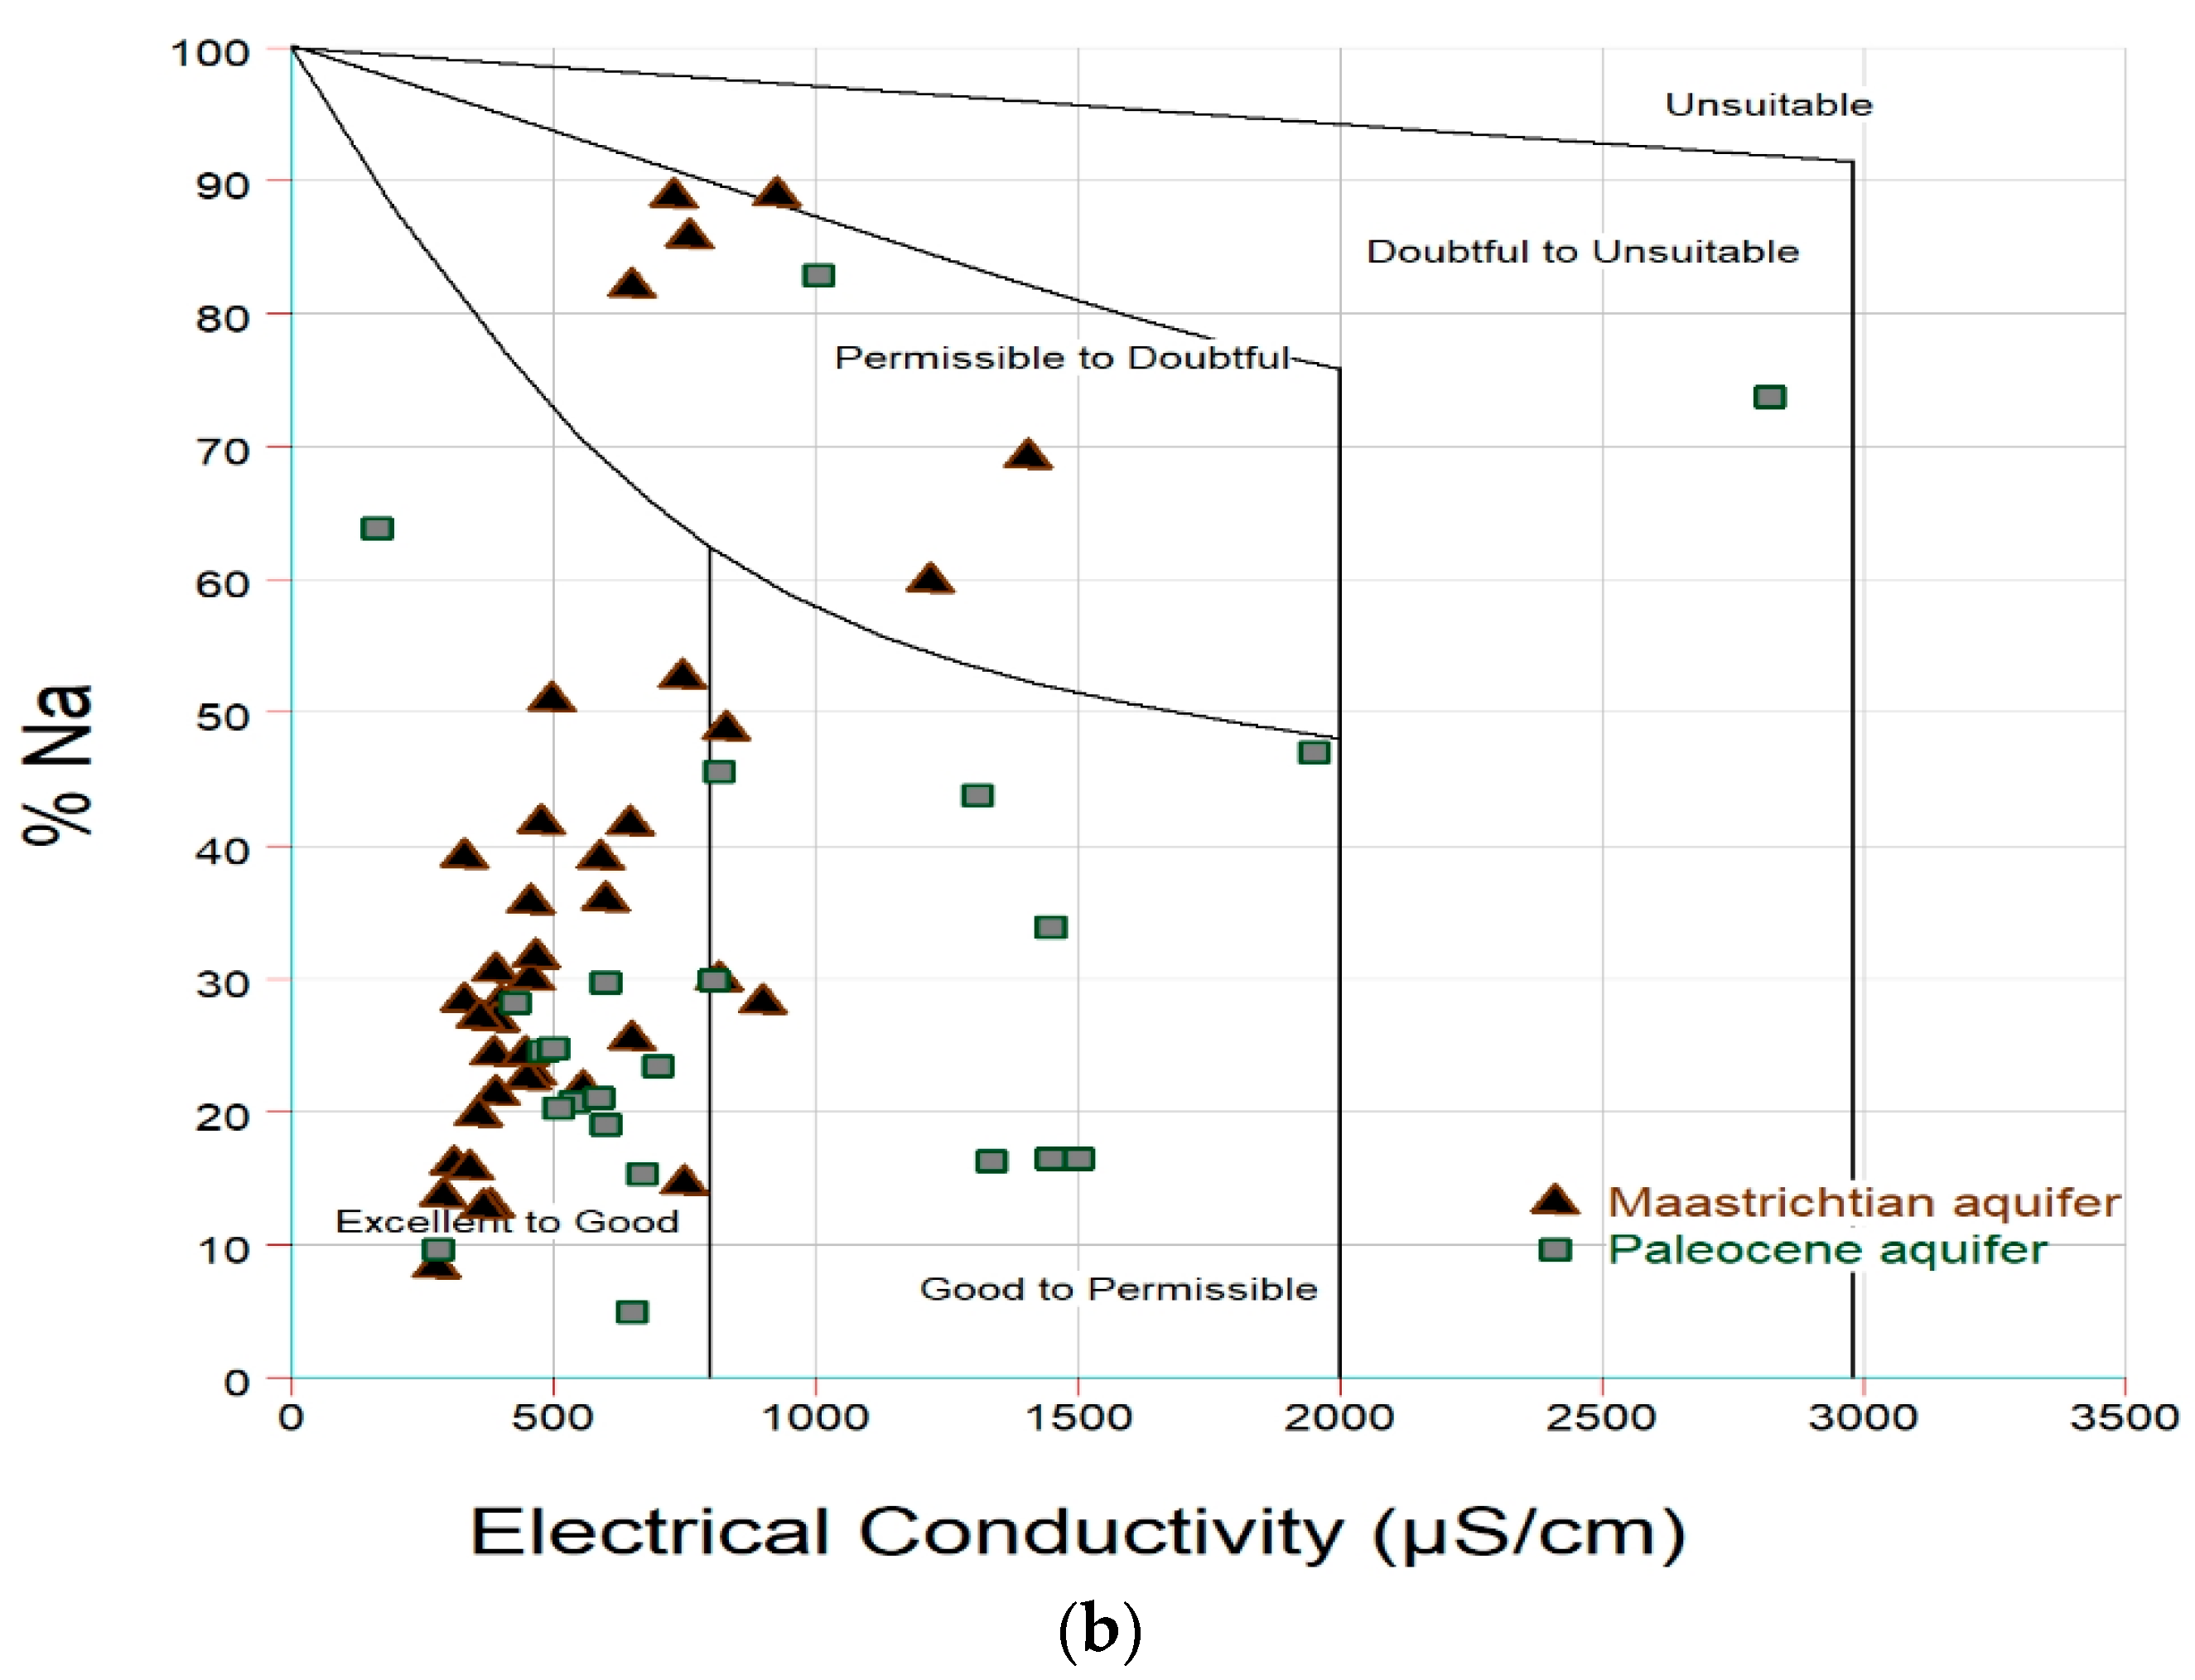
3.2.4. Percentage of Sodium (Na%)

In the study area, the Na% values range between 8.24 and 88.9%, with an average of 35.8% and median of 28.33% for the Maastrichtian aquifer and between 4.95 and 82.8% (mean = 30.9% and median = 24.54%) for the Paleocene aquifer (Table 5 and Table 6). Using this index parameter to evaluate suitability, samples from the Maastrichtian aquifer are classified into three quality classes (C1 to C3), with 51.3% exhibiting good water quality for irrigation, followed by class C3 with 28.2% of permissible water quality for irrigation. Among the good quality classes, 20.5% of the samples are qualified as excellent in quality (see Table 5). On the other hand, sampled Paleocene groundwaters exhibit four classes (C1 to C4), where 30.4% represent excellent water quality class C1 and 43.5% of class C2 with good water quality.
The samples falling into C3 with permissible water quality and C4 with doubtful water quality are 28.2% and 13%, respectively, for the Maastrichtian and the Paleocene. This evidences that the groundwater in the Maastrichtian aquifer is overall more suitable for irrigation than that of the Paleocene.
The Na% versus EC graph is also an important tool to evaluate the irrigation water suitability [23,56]. These two parameters plotted in Wilcox diagram (Figure 5b) are based on the Na%–EC relationship, where water quality can be distinguished into five classes: (i) excellent to good, (ii) good to permissible, (iii) permissible to doubtful, (iv) doubtful to unsuitable, and (iiv) unsuitable [14]. Figure 5 shows that 84.61% and 91.3% of the Maastrichtian and Palecene water samples are classified as excellent to good for irrigation purposes, respectively.

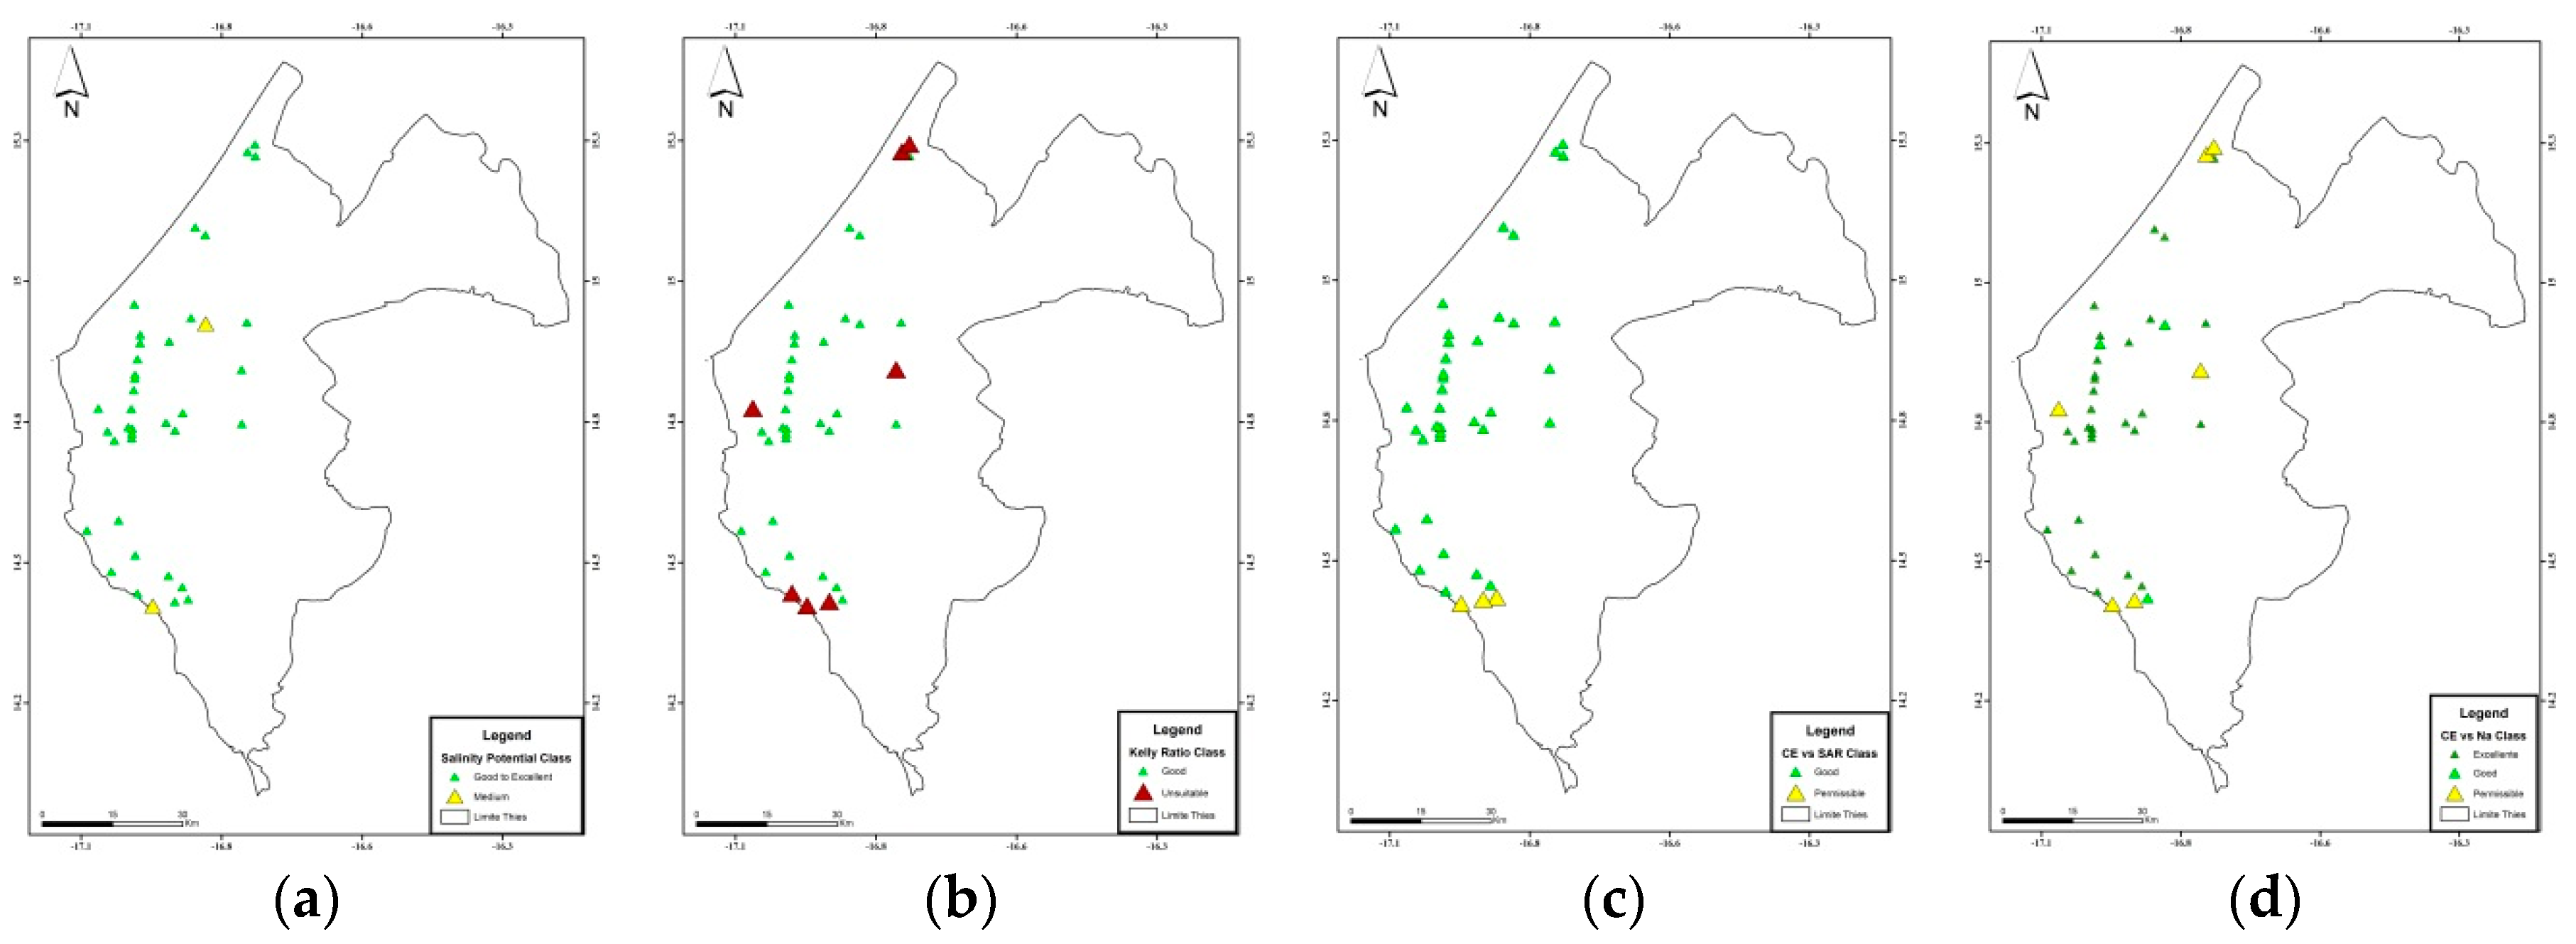
3.2.5. Salinity Potential (SP)

Assessing salinity is important because excess of salt in the irrigation water. In fact, salinity increases the soil water osmotic pressure and infers on roots soil water uptake [57] and plants physiological water stress [28,30]. Additionally, high salt contents in the root zone caused by salty irrigation water can directly damage the plant root system through so-called “root burns” [50]. The SP parameter, which sums up the chloride and sulfate concentrations in the water, is a widely accepted salinity indicator [15,42]. The computed SP values in the Maastrichtian aquifer vary between 0.7 and 6.38 meq L−1 with a mean of 2.19 meq L−1 and median of 1.82 meq L−1. On the other hand, for the Paleocene aquifer, the SP values vary between 0.7 and 16.64 meq L−1 (mean = 4.44 meq L−1 and median = 2.85 meq L−1) (see Table 6). As for the EC and SAR values, the SP values can be also classified according to [28,42] into three classes in soil of medium permeability. Most of the sampled Maastrichtian waters (97.4%) are classified as good to excellent quality, with SP values less than five, and 2.56% are of medium quality (SP values between 5 and 10). The medium quality class waters are located at Dougane and Mbour F1 Bis. For the Paleocene aquifer, 13.0% of the sampled waters are of poor quality and are located around Produmel Ballabougou1 (SP = 10.53 meq L−1), Produmel Kouthie (SP = 12.28 meq L−1), and Ngazobil (SP = 16.87 meq L−1), while 69.6% of the samples are of good to excellent quality (Table 7).

3.2.6. The Kelly Ratio (KR)

The KR values of the Maastrichtian aquifer vary between 0.08 and 7.55 meq L−1 (mean = 1.07 meq L−1 and median = 0.37 meq L−1) and those of the Paleocene between 0.05 and 4.58 meq L−1 (with a mean of 0.68 meq L−1 and a median of 0.30 meq L−1). Table 8 shows the classification of Maastrichtian and Paleocene sampled waters according to the KR, whereby the majority of the sampled points in the Maastrichtian aquifer (82%) are classified as good for irrigation. However, 18% of the samples have poor quality water. These points are located at Diogo DW01 (KR = 4.35 meq L−1), Diogo DW04 (KR = 7.54 meq L−1), Cheikh mboup (KR = 5.61 meq L−1), and the Diayane point (KR = 7.31 meq L−1). For the Paleocene aquifer, 87% of the water samples are of good quality, and only 13% are not suitable for irrigation according to the KR. The latter are found in Ngazobil (KR = 2.74 meq L−1) and Keur Ndiraw (KR = 4.58 meq L−1).

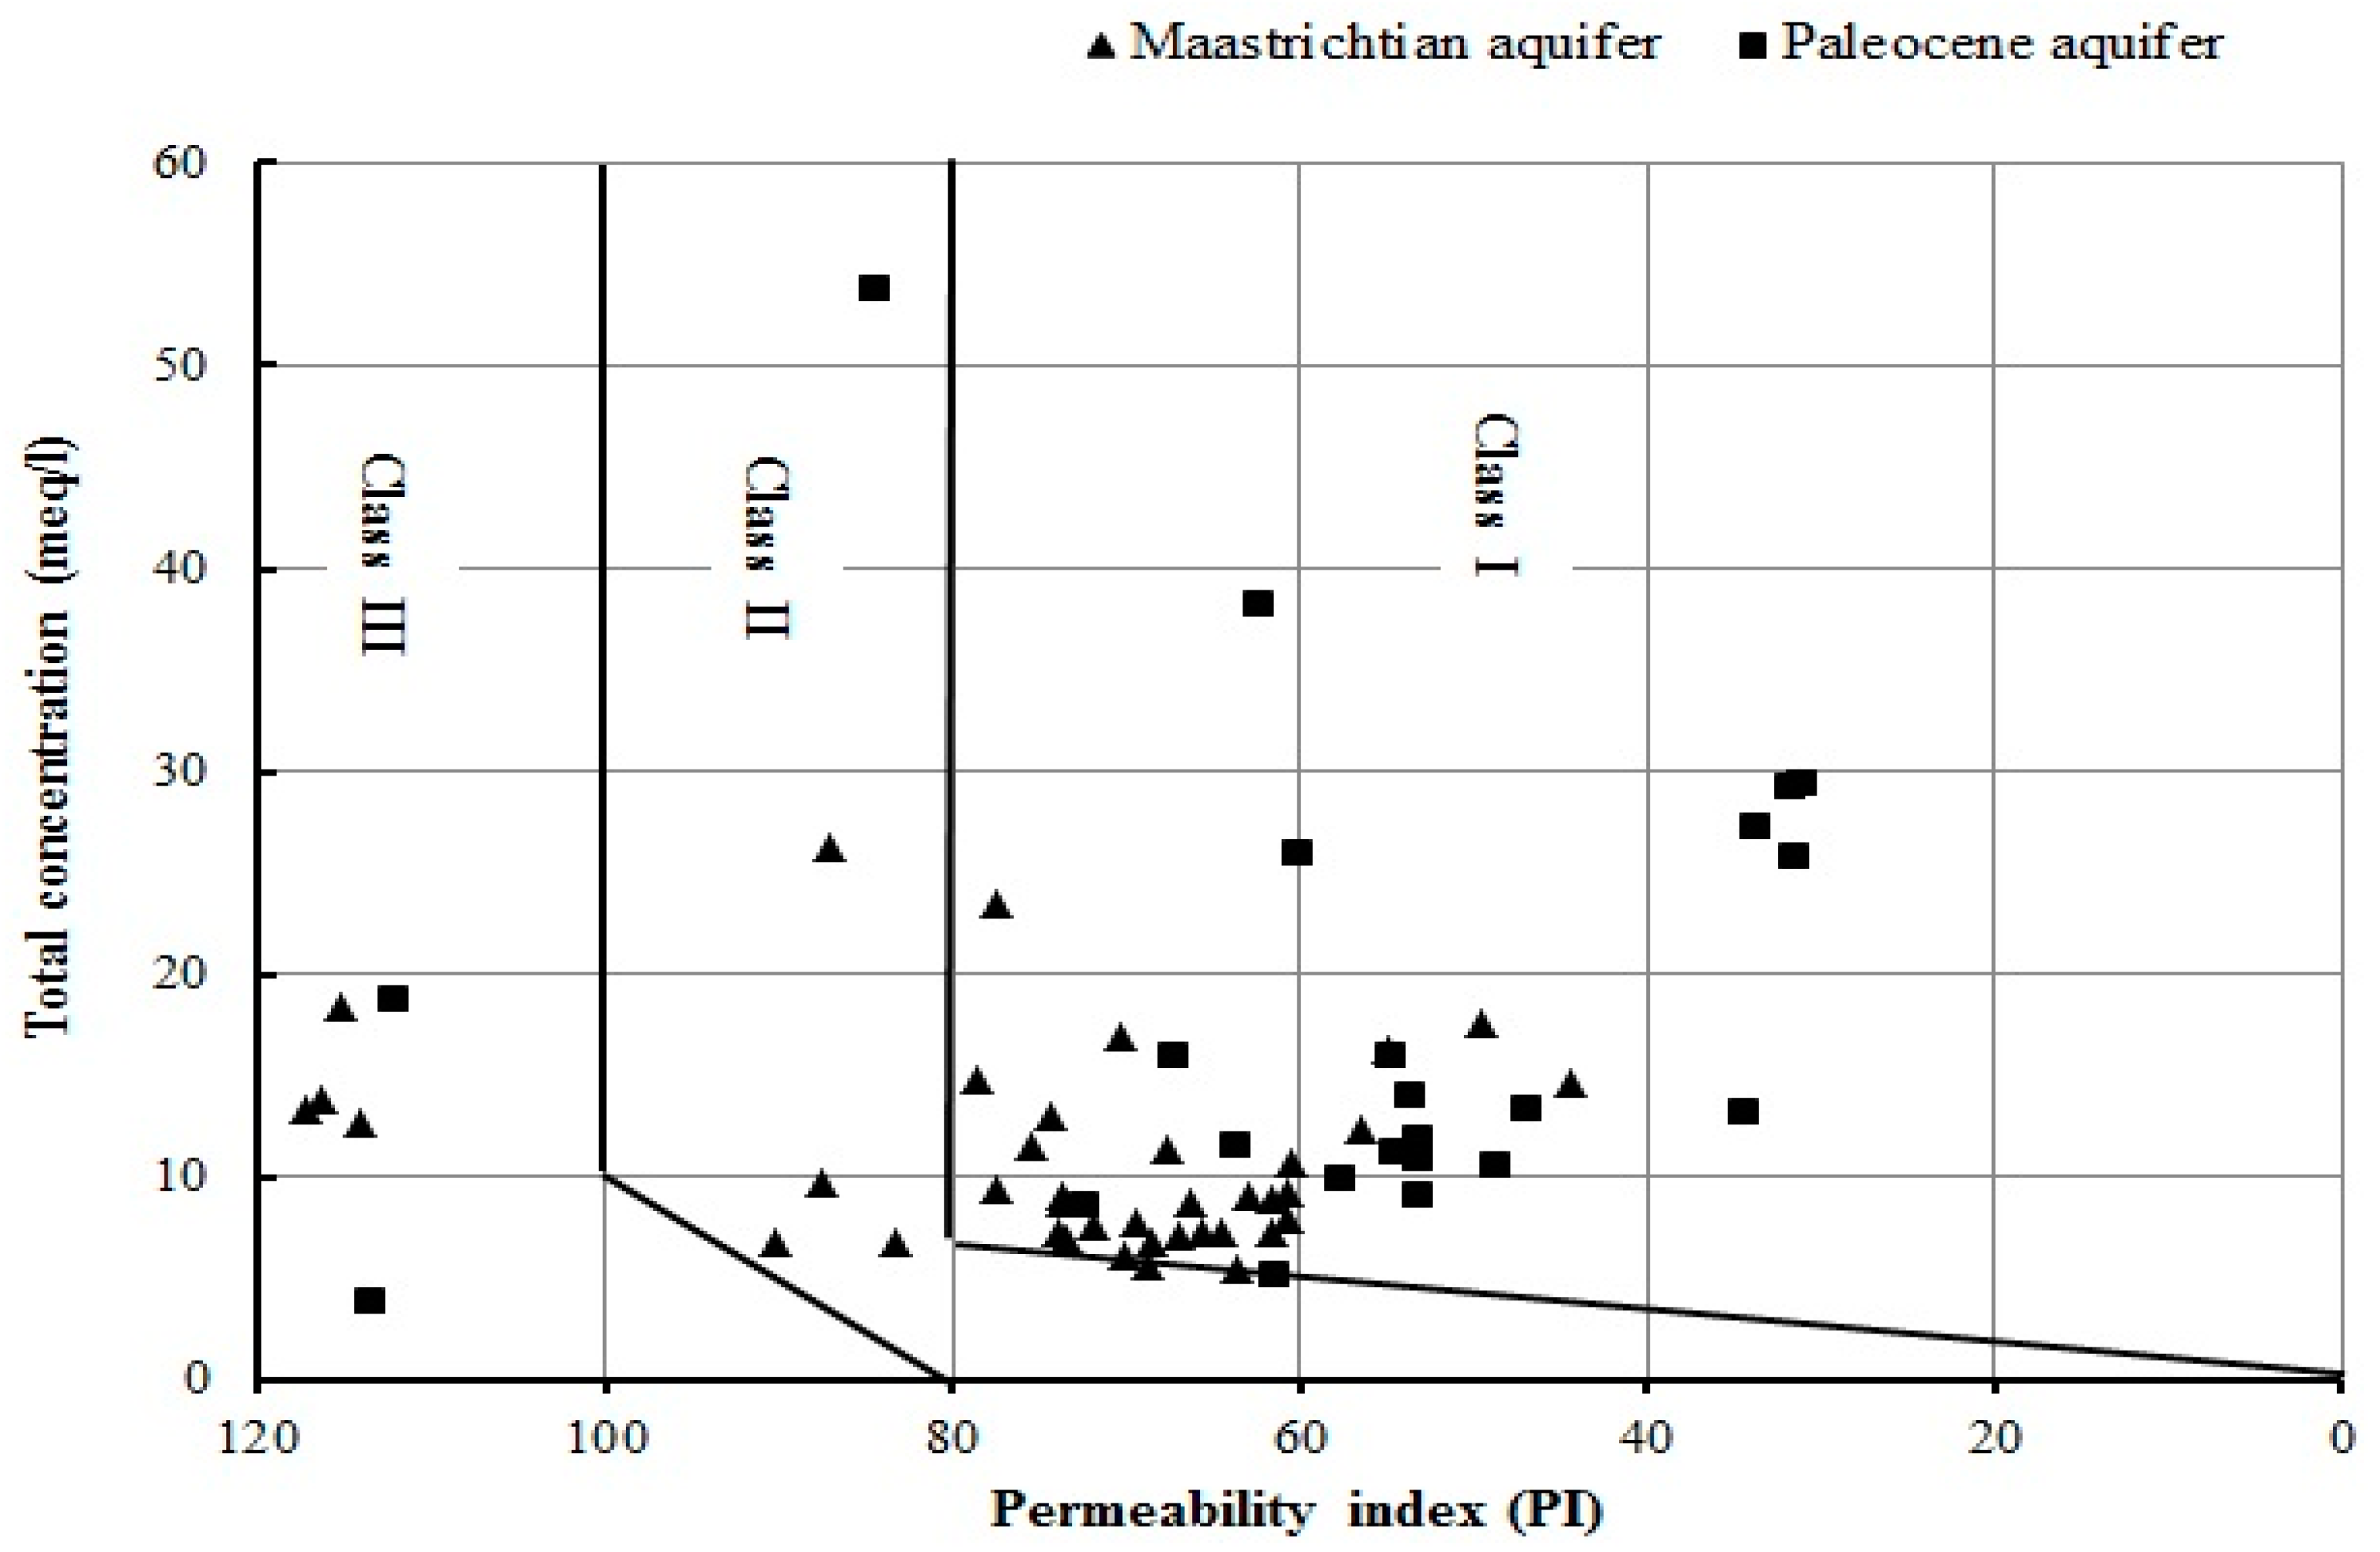
3.2.7. Permeability Index (PI)

The permeability index (PI) of the Maastrichtian aquifer varies between 44.4 and 118%, with a mean of 73.77% and a median of 70.1%. As shown in Figure 6 and Table 6, 90% of the Maastrichtian sampled waters are suitable for irrigation according to PI and only 10.2% of the samples belong to class III. Among the suitable water, 79.5% belong to class I, 10.3% to class II. For the Paleocene aquifer, the PI ranges between 31.2 and 115% with a mean of 58.27% and median of 54.73%. Class I and class II represent up to 91.3% of the sampled waters (Figure 6).
Water samples were classified by combining all the indices in order to determine an average water quality suitable for irrigation. Thus, the samples were grouped into three classes according to the water suitability for irrigation. Classes 1 and 2 include samples that are good to excellent (≥50% classified as suitable for indices) and permissible (25–50% classified as suitable for indices) for irrigation purposes, respectively. Class 3 was classified as unsuitable for irrigation, representing ≤25%. Based on this combined classification, most sampled Maastrichtian waters are considered as good to excellent (84.6%), especially from the region Pout North and Pout South; 5.1% as permissible class; and 10.8% as the unsuitable class. These latter samples are located around Diogo DW, Cheikh Mboup, and Diayane points (Figure 7 and Figure 8).
In the Paleocene aquifer, the majority of samples are considered as good to excellent class (78.3%) and are found in the central and southern part of the study area, whereas 8.7% are classified as permissible and 13.0% as unsuitable water quality (located in around Ngazobil, Keur ndiraw, and Toude Diop areas) (Figure 8).

4. Summary and Conclusions

Groundwater is the major source of drinking water in most parts of Senegal, including the study area. In this latter area, groundwater is also used to meet the irrigation, industrial, and mining sector demands. This study focused on the water suitability assessment for irrigation of the Maastrichtian and Paleocene aquifers in the Thies area in western Senegal. Piper diagrams indicate the dominancy of the HCO3-Ca-Mg water type in the Maastrichtian aquifer and both the HCO3-Ca-Mg and Cl-Ca-Mg water types in the Paleocene aquifer. Five water quality indices were used for the assessment, namely, the sodium absorption ratio (SAR), the salinity potential (SP), the Kelly ratio (KR), the permeability index (PI), and the percentage of sodium (Na%). Additionally, Wilcox and USSL diagrams were used to illustrate the quality of groundwater and its suitability for irrigation in the study area. The Electrical conductivity (EC), which expresses the degree of mineralization of water samples, is relatively high in the Maastrichtian aquifer, where 20.5% of the water sampled represents high risk of salinization corresponding to class C3. In the Paleocene aquifer, the risk of salinization is higher with the presence of classes C3 (high risk of salinization) and C4 (very high risk of salinization). The report of the chemical data in the USSL diagram shows that the Maastrichtian water samples do not present a significant risk for irrigation purpose (C3S1 and C3S2). However, waters of C4S3 class, which present a very high risk of salinization, are observed in the Paleocene aquifer. Potential salinity water values show that most of the Maastrichtian water samples (97.4%) are considered as good to excellent quality and only 2.6% as medium quality. For the Paleocene aquifer, 69.6% of the water has Sp values between 5 and 10, revealing good quality for irrigation. The percentage of sodium (Na%) shows that the Maastrichtian groundwater samples are of excellent to acceptable quality, while Paleocene Na% values range from excellent to unsuitable for irrigation. The combination of PS, KR and Na% indices and USSL, Wilcox, and Doneen classification reveals that the percentage of water samples suitable for irrigation purposes is 89.7% and 86.9% of the samples for the Maastrichtian and the Paleocene aquifers, respectively. However, due to the high groundwater extraction rates and agricultural and mining activity in the study area, an evaluation of the spatial and temporal evolution of groundwater quality is required to ensure effective and sustainable management of the water resource.

Author Contributions

Conceptualization, O.C.D. and L.W.; methodology, O.C.D. and L.W.; Software, O.C.D., H.K.S. and N.M.D.; validation, H.V. and S.F.; formal analysis, O.C.D. and L.W; investiga-tion, L.W., M.D. and S.C.F.; resources, H.K.S., M.D. and S.C.F.; data curation, O.C.D., H.K.S. and L.W.; writing—original draft preparation, O.C.D., H.K.S. and L.W.; writing—review and editing, O.C.D., L.W., H.V. and S.F.; visualization, S.F. and H.V.; supervision, L.W., H.V. and S.F.; project administration, L.W., H.V. and S.F.; funding acquisition, all authors. All authors have read and agreed to the published version of the manuscript.

Funding

This research received no external funding.

Conflicts of Interest

The authors declare no conflict of interest.

References

  1. FAO. The State of the World’s Land and Water Resources for Food and Agriculture (SOLAW): Managing Systems at Risk; Food and Agriculture Organization of the United Nations (FAO): Rome, Italy, 2011; 48p. [Google Scholar]
  2. FAO. The Role of Livestock in Food Security, Poverty Reduction and Wealth Creation in West Africa; Food and Agriculture Organization of the United Nations (FAO): Rome, Italy, 2020; 237p, ISBN 978-92-5-132339-7. [Google Scholar]
  3. Tao, Y.; Li, J.; Feng, K.W. Analysis of the guarantee degree of irrigation water resources and its spatial difference in Shaanxi Province. Chin. J. Agric. Resour. Reg. Plan. 2018, 39, 97–104. [Google Scholar]
  4. Xu, P.; Feng, W.; Qian, H.; Zhang, Q. Hydrogeochemical Characterization and Irrigation Quality Assessment of Shallow Groundwater in the Central-Western Guanzhong Basin, China. Int. J. Environ. Res. Public Health 2019, 16, 1492. [Google Scholar] [CrossRef]
  5. Eissa, M.A.; de Dreuzy, J.-R.; Parker, B. Integrative management of saltwater intrusion in poorly-constrained semi-arid coastal aquifer at Ras El-Hekma, Northwestern Coast, Egypt. Groundw. Sustain. Dev. 2018, 6, 57–70. [Google Scholar] [CrossRef]
  6. Batarseh, M.; Imreizeeq, E.; Tilev, S.; Al Alaween, M.; Suleiman, W.; Al Remeithi, A.M.; Al Tamimi, M.K.; Al Alawneh, M. Assessment of groundwater quality for irrigation in the arid regions using irrigation water quality index (IWQI) and GIS-Zoning maps: Case study from Abu Dhabi Emirate, UAE. Groundw. Sustain. Dev. 2021, 14, 100611. [Google Scholar] [CrossRef]
  7. Morris, B.L.; Lawrence, A.R.L.; Chilton, P.J.C.; Adams, B.; Calow, R.C.; Klinck, B.A. Groundwater and Its Susceptibility to Degradation: A Global Assessment of the Problem and Options for Management; Early Warning and Assessment Report Series 03–3; United Nations Environment Programme: Nairobi, Kenya, 2003; p. 126. Available online: http://nora.nerc.ac.uk/id/eprint/19395/1/Groundwater_INC_cover.pdf (accessed on 22 November 2018).
  8. Wu, J.; Wang, L.; Wang, S.; Tian, R.; Xue, C.; Feng, W.; Li, Y. Spatiotemporal variation of groundwater quality in an arid area experiencing long-term paper wastewater irrigation, northwest China. Environ. Earth Sci. 2017, 76, 460. [Google Scholar] [CrossRef]
  9. Zhang, Y.; Wu, J.; Xu, B. Human health risk assessment of groundwater nitrogen pollution in Jinghui canal irrigation area of the loess region, northwest China. Environ. Earth Sci. 2018, 77, 273. [Google Scholar] [CrossRef]
  10. Rahman, M.M.; Mondal, T.M.A. Assessment of groundwater pollution and its impact on soil properties along with plant growth. Bangladesh. J. Agric. Sci. 2015, 34, 39–42. [Google Scholar]
  11. Martin, A. Les Nappes de la Presqu’île du Cap-Vert: Leur Utilisation pour L’alimentation en Eau de Dakar; BRGM: Paris, France, 1970; 56p.
  12. Madioune, D.H.; Faye, S.; Orban, P.; Brouyère, S.; Dassargues, A.; Mudry, J.; Stumpp, C.; Maloszewski, P. Application of isotopic tracers as a tool for understanding hydraulic behavior for the highly exploited Diass aquifer system. J. Hydrol. 2014, 511, 443–459. [Google Scholar] [CrossRef]
  13. Richards, L.A. Diagnosis and Improvement of Saline and Alkaline Soils. Soil Sci. 1947, 64, 432. [Google Scholar] [CrossRef]
  14. Wilcox, L.V. Classification and Use of Irrigation Waters; US Department of Agriculture ADC: Washington, DC, USA, 1955; p. 969.
  15. Shahid, S.A. Developments in Salinity Assessment, Modeling, Mapping, and Monitoring from Regional to Submicroscopic Scales. In Developments in Soil Salinity Assessment and Reclamation—Innovative Thinking and Use of Marginal Soil and Water Resources in Irrigated Agriculture; Shahid, S.A., Abdelfattah, M.A., Taha, F.K., Eds.; Springer: Berlin/Heidelberg, Germany, 2013; pp. 3–43. [Google Scholar]
  16. Franklin, W.T.; Follett, R.H. Crop Tolerance to Soil Salinity; No. 505. Service in Action; Colorado State University Extension Service: Fort Collins, CO, USA, 1985. [Google Scholar]
  17. Udom, E.; Ekpo, A.; Oluka, S. Assessment of irrigation water qualities of Abak River, Abak, Akwa Ibom State, Nigeria. Glob. J. Pure Appl. Sci. 2019, 25, 135–144. [Google Scholar] [CrossRef]
  18. Shahid, S.A.; Rahman, K.R. Soil salinity development, classification, assessment and management in irrigated agriculture. In Handbook of Plant and Crop Stress; Passarakli, M., Ed.; CRC Press/Taylor & Francis Group: Boca Raton, FL, USA, 2011; pp. 23–39. [Google Scholar]
  19. Edelstein, M.; Plaut, Z.; Ben-Hur, M. Water salinity and sodicity effects on soil structure and hydraulic properties. Adv. Hortic. Sci. 2010, 24, 154–160. [Google Scholar]
  20. Pagliai, M.; Vignozzi, N. Soil porosity as an indicator of soil health. Ann. Arid Zone 2006, 45, 259–286. [Google Scholar]
  21. Singh, V.; Singh, U.C. Assessment of groundwater quality of parts of Gwalior (India) for agricultural purposes. Indian J. Sci. Technol. 2008, 1, 1–5. [Google Scholar] [CrossRef]
  22. Joshi, D.M.; Kumar, A.; Agrawal, N. Assessment of the Irrigation Water Quality of River Ganga in Haridwar District. Indian J. Chem. 2009, 2, 285–291. [Google Scholar]
  23. Khan, T.A.; Abbasi, M.A. Synthesis of parameters used to check the suitability of water for irrigation purposes. Int. J. Environ. Sci. 2013, 3, 2031–2038. [Google Scholar]
  24. Lloyd, J.W.; Heathcote, J.A. Natural Inorganic Hydrochemistry in Relation to Groundwater; Clarendon: Oxford, UK, 1985; p. 294. [Google Scholar]
  25. Thorne, D.W.; Peterson, H.B. Irrigated Soils; Constable and Company Limited London: London, UK, 1954; p. 113. [Google Scholar] [CrossRef]
  26. Essouli, O.F.; Gladima-Siby, A.S.; Diouf, O.C.; Faye, A. The continental terminal aquifer in Sine Saloum: Chemical quality and irrigation impact. J. Sci. Technol. 2008, 6, 58–67. [Google Scholar]
  27. Bradaï, A.; Douaoui, A.; Marlet, S. Qualité des eaux souterraines utilisées en irrigation et risques de dégradation des sols dans la plaine du Bas-Cheliff, Algérie. In Proceedings of the Actes du Quatrième Atelier Régional du Projet Sirma, Mostaganem, Algeria, 26–28 May 2008; Cirad: Montpellier, France, 2008. [Google Scholar]
  28. Ravikumar, P.; Somashekar, R.K.; Angami, M. Hydrochemistry and evaluation of groundwater suitability for irrigation and drinking purposes in the Markandeya River basin, Belgaum District, Karnataka State, India. Environ. Monit. Assess. 2010, 173, 459–487. [Google Scholar] [CrossRef] [PubMed]
  29. Gouidia, L.; Guefaifia, O.; Boudoukha, A.; Hemila, M.L. Evaluation de la salinité des eaux souterraines utilisées en irrigation et risques de dégradation des sols: Exemple de la plaine de Meskiana, nord-est algérien. Geo. Eco. Trop. 2013, 37, 141–160. [Google Scholar] [CrossRef]
  30. Orou, R.K.; Soro, G.; Soro, D.T.; Traoré, A.; Fossou, R.M.N.; Soro, N. Aptitudes À L’agriculture Des Eaux Souterraines Du Departement d’Agboville (Sud-Est De La Côte d’Ivoire). Eur. Sci. J. ESJ 2016, 12, 1857–7881. [Google Scholar] [CrossRef]
  31. Ogunfowokan, A.O.; Ogunkoya, O.O.; Obisanya, J.F. Salinity and sodium hazards of three streams of different agricultural land use systems in Ile-Ife, Nigeria. Appl. Water Sci. 2013, 3, 19–28. [Google Scholar] [CrossRef]
  32. Yahong, Z.; Peiyue, L.; Leilei, X.; Zihan, D.; Duo, L. Solute geochemistry and groundwater quality for drinking and irrigation purposes: A case study in Xinle City, North China. Geochemistry 2020, 80, 125609. [Google Scholar] [CrossRef]
  33. Xia, C.; Liu, G.; Xia, H.; Jiang, F.; Meng, Y. Influence of saline intrusion on the wetland ecosystem revealed by isotopic and hydrochemical indicators in the Yellow River Delta, China. Ecol. Indic. 2021, 133, 108422. [Google Scholar] [CrossRef]
  34. USAID. Cartographie et Télédétection des Ressources de la République du Sénégal. Etude de la Géologie, de L’hydrologie, des Sols, de la Végétation et des Potentiels D’utilisation des Sols; SDSU-RSI-86-01 Direction de l’Aménagement du Territoire; Agency for International Development, Remote Sensing Institute; USAID: Washington, DC, USA, 1986; 653p.
  35. Faye, A. Contribution à L’étude Géologique et Hydrogéologique du Horst de Diass et de Ses Environs (Sénégal). Ph.D. Thesis, Université de Dakar, Dakar, Senegal, 1983; 175p. [Google Scholar]
  36. Bellion, Y.J.C. Historique Géodynamique Post-Paléozoïque de L’Afrique de L’ouest D’après L’étude de Quelques Bassins Sédimentaires (Sénégal, Taoudenni, Iullemmeden, Tchad). Ph.D. Thesis, Université d’Avignon, Paris, France, 1987; 302p. [Google Scholar]
  37. Travi, Y. Hydrochimie et Hydrologie Isotopique des Aquifères Fluorurés du Bassin du Sénégal, Origine et Conditions de Transport du Fluor dans Les Eaux Souterraines. Ph.D. Thesis, Université de Paris Sud, Centre d’Orsay, Orsay, France, 1988; 10p. [Google Scholar]
  38. Gladima-Siby, A.S. Utilisation des Méthodes Géophysiques pour la Caractérisation de la Nappe Maastrichtienne du Sénégal. Contribution à la Connaissance de la Stratigraphie et de la Structure du Bassin Sénégalo-Mauritanien. Ph.D. Thesis, Université Cheikh Anta Diop de Dakar, Dakar, Sénégal, 1997; 118p. [Google Scholar]
  39. Madioune, D.H. Etude Hydrogéologique du Système Aquifère du Horst de Diass en Condition D’exploitation Intensive (Bassin Sédimentaire Sénégalais): Apport des Techniques de Télédétection, Modélisation, Géochimie et Isotopie. Ph.D. Thesis, Université Cheikh Anta Diop de Dakar, Dakar, Sénégal, 2012; 303p. [Google Scholar]
  40. Tessier, F. Contribution à la stratigraphie et à la paléontologie de la partie ouest du Sénégal (Crétacé et Tertiaire). Bull. Dir. Mines Afr. Français 1952, 14, 267. [Google Scholar]
  41. USSL. Diagnosis and Improvement of Saline and Alkaline Soils; United States Salinity Laboratory, US Department of Agriculture: Washington, DC, USA, 1954. [Google Scholar]
  42. Durand, J.H. Utilisation des Eaux Salines pour L’irrigation. Etude Pédologique. Ph.D. Thesis, CNRA, Yamoussoukro, Côte d’Ivoire, France, 1956; pp. 39–58. [Google Scholar]
  43. Trivedy, R.K.; Goel, P.K. Chemical and Biological Methods for Water Pollution Studies; Environmental Publication: Karad, India, 1984. [Google Scholar]
  44. Donnen, L.D. The Influence of Crops and Soil on Percolating Water. In Proceedings of the 1961 Biennial Conference on GroundWater Recharge, CA, USA, 1–2 September 1961; pp. 156–163. [Google Scholar]
  45. Kelley, W.P. Use of Saline Irrigation Water. Soil Sci. 1963, 95, 355–391. [Google Scholar] [CrossRef]
  46. Haritash, A.K.; Gaur, S.; Garg, S. Assessment of water quality and suitability analysis of River Ganga in Rishikesh, India. Appl. Water Sci. 2014, 6, 383–392. [Google Scholar] [CrossRef]
  47. Gopinath, S.; Srinivasamoorthy, K.; Saravanan, K.; Prakash, R.; Suma, C.S.; Khan, F.; Senthilnathan, D.; Sarma, V.S.; Devi, P. Hydrogeochemical characteristics of coastal groundwater in Nagapattinam and Karaikal aquifers: Implications for saline intrusion and agricultural suitability. Coast Sci. J. 2015, 2, 1–11. [Google Scholar] [CrossRef]
  48. Sadashivaiah, C.; Ramakrishnaiah, C.; Ranganna, G. Hydrochemical analysis and evaluation of groundwater quality in Tumkur Taluk, Karnataka State, India. Int. J. Environ. Res. Public Health 2008, 5, 158–164. [Google Scholar] [CrossRef] [PubMed]
  49. Prasad, D.S.R.; Sadashivaiah, C.; Rangnna, G. Hydrochemical Characteristics and Evaluation of Groundwater Quality of Tumkur Amanikere Lake Watershed, Karnataka, India. E-J. Chem. 2009, 6 (Suppl. 1), S211–S218. [Google Scholar] [CrossRef]
  50. Couture, I. Principaux Critères pour Evaluer la qualité de L’eau en Micro-Irrigation; Centre de Référence en Agriculture et Agroalimentaire du Quebec: Quebec, VI, Canada, 2006; 8p. [Google Scholar]
  51. Bauder, T.A.; Waskom, R.M.; Davis, J.G. Irrigation Water Quality Criteria, Colorado State University Extension. 2010. Available online: http://www.ext.colostate.edu/pubs/crops/00506.html (accessed on 1 October 2014).
  52. Piper, A.M. A graphic procedure in the geochemical interpretation of water-analyses. Eos Trans. Am. Geophys. Union 1944, 25, 914–928. [Google Scholar] [CrossRef]
  53. Hem, J.D. Study and Interpretation of the Chemical Characteristics of Natural Waters. Book 2254, 3rd ed.; Scientific Publishers: Jodhpur, India, 1991; p. 263. [Google Scholar]
  54. Hounslow, A.W. Water Quality Data Analysis and Interpretation; CRC Press: Boca Raton, FL, USA, 1995. [Google Scholar]
  55. Prasanna, M.V.; Chidambaram, S.; Gireesh, T.V.; Jabir Ali, T.V. A study on hydrochemical characteristics of surface and subsurface water in and around Perumal Lake, Cuddalore District, Tamil Nadu, South India. Environ. Earth Sci. 2011, 64, 1419–1431. [Google Scholar]
  56. Khodapanah, L.; Sulaiman, W.N.A.; Khodapanah, N. Groundwater quality assessment for different purposes in Eshtehard District, Tehran, Iran. Eur. J. Sci. Res. 2009, 36, 543–553. [Google Scholar]
  57. Ramesh, K.; Elango, L. Groundwater quality and its suitability for domestic and agricultural use in Tondiar river basin, Tamil Nadu, India. Environ. Monit. Assess. 2011, 184, 3887–3899. [Google Scholar] [CrossRef] [PubMed]
Figure 1. Localization of the study area and distribution of the different soil types [34] modified.
Water 14 03002 g001
Figure 2. Aquifer formations in the Peninsula of Dakar (modified from [39]).
Water 14 03002 g002
Figure 3. Location of the boreholes for groundwater sampling in the Thies region in 2019.
Water 14 03002 g003
Figure 4. Piper diagram of the Paleocene and Maastrichtian aquifers.
Water 14 03002 g004
Figure 5. USSL diagram (SAR versus EC plot) (a) and Wilcox diagram (Na% versus EC plot) (b) of the Maastrichtian and Paleocene groundwater samples (June 2019).
Water 14 03002 g005aWater 14 03002 g005b
Figure 6. Doneen’s chart for the permeability index for the Maastrichtian and Paleocene samples.
Water 14 03002 g006
Figure 7. Salinity potential (a), Kelly ratio (b), CE vs. SAR (c), CE vs. Na% (d), PI vs. TC (e), and combined (f) suitability maps of Maastrichtian aquifer for irrigation purpose.
Water 14 03002 g007aWater 14 03002 g007b
Figure 8. Salinity potential (a), Kelly ratio (b), CE vs. SAR (c), CE vs. Na% (d), PI vs. TC (e), and combined (f) suitability maps of Paleocene aquifer for irrigation purpose.
Water 14 03002 g008aWater 14 03002 g008b
Table 1. Summary statistics of the Maastrichtian groundwater quality parameters sampled in June 2019.
Chemical Parameters of the Maastrichtian Aquifer
VariablesUnitNumber ofSamplesMeanMedianMinimumMaximumEcart-Type
pH-397.507.516.987.80.17
Temperature°C3932.831.728.240.93.5
EC(µS cm−1)39557.9462.0274.01403.0253.6
HCO3(mg L−1)39204.27183.0134.20366.061.95
Cl(mg L−1)3950.9532.7810.55193.743.88
SO42(mg L−1)3929.5027.677.8970.9015.85
NO3(mg L−1)398.502.430.81164.725.98
Na+(mg L−1)3948.9727.354.31211.950.89
K+(mg L−1)394.713.571.3817.73.69
Ca2+(mg L−1)3934.9934.357.9671.814.07
Mg2+(mg L−1)3916.4214.554.8244.98.76
Table 2. Summary statistics of the Paleocene groundwater quality parameters measured in June 2019.
Chemical Parameters of the Paleocene Aquifer
VariablesUnitNumber of SamplesMeanMedianMinimumMaximumEcart-Type
pH-237.537.506.968.110.64
Temperature°C2329.6129.624.533.32.2
EC(µS cm−1)231025.7823.0204.02860.0579.4
HCO3(mg L−1)23238.56244.00.00530.70130.08
Cl(mg L−1)23132.8372.610.52537.65132.62
SO42(mg L−1)2367.0236.023.33302.1977.09
NO3(mg L−1)2310.036.881.1949.7311.76
Na+(mg L−1)2369.4534.425.11441.0795.09
K+(mg L−1)235.864.271.5215.524.26
Ca2+(mg L−1)2352.1148.298.14108.1927.17
Mg2+(mg L−1)2337.7325.471.8687.5327.56
Table 3. Classification of groundwater aquifer by measured electrical conductivity (EC).
AquiferClassesElectrical Conductivity
(µS cm−1)
Water Quality% of Samples
MaastrichtianC2250 < EC < 750Moderate risk of salinization79.5
C3750 < EC < 2250High risk of salinization20.5
PaleoceneC1EC < 250No risk of salinization4.3
C2250 < EC < 750Moderate risk of salinization26.0
C3750 < EC < 2250High risk of salinization65.4
C42250 < EC < 5000Very high risk of salinization4.3
Table 4. Classification of the groundwater quality according to the sodium adsorption ratio (SAR).
AquiferClassesSAR (meq L−1)Water Quality% of Samples
MaastrichtianS1<10Excellent with low alkalinization hazard92.30
S210 < SAR < 18Good without special control7.70
PaleoceneS1<10Excellent with low alkalinization hazard91.30
S210 < SAR < 18Good without special control8.70
Table 5. Classification of the water samples according to the percentage of Na (Na%).
AquiferClassesNa%Water Quality% of Samples
MaastrichtianC1<20Excellent water quality for irrigation20.5
C220 < Na% < 40Good water quality for irrigation51.3
C340 < Na% < 60Permissible water quality for irrigation28.2
C460 < Na% < 80Doubtful water quality for irrigation0
C5Na% > 80Unsuitable water quality for irrigation0
PaleoceneC1<20Excellent water quality for irrigation30.4
C220 < Na% < 40Good water quality for irrigation43.5
C340 < Na% < 60Permissible water quality for irrigation13
C460 < Na% < 80
Na% > 60
Doubtful water quality for irrigation13.1
C5Na% > 80Unsuitable water quality for irrigation0
Table 6. Summary of geochemical classification of irrigation indices.
Maastrichtian Aquifer
VariablesUnitMeanMedianMinimumMaximumEcart-Type
SAR(meq L−1)2.851.380.2415.092.25
Kelly ratio (KR)(meq L−1)1.070.370.087.551.85
Salinity potential (SP)(meq L−1)2.191.820.706.381.36
Na%(meq L−1)35.7628.338.2488.8921.81
Paleocene Aquifer
VariablesUnitsMeanMedianMinimumMaximumEcart-Type
SAR(meq L−1)2.671.270.2314.503.52
Kelly ratio (KR)(meq L−1)0.680.300.054.581.04
Salinity potential (SP)(meq L−1)4.772.850.7016.874.08
Na%(meq L−1)30.8824.544.9582.8320.08
Table 7. Classification of water according to their salinity potential (SP).
AquiferSPClasses% of Samples
Paleocene<5Good to excellent69.6
5 < SP < 10Medium17.4
>10Poor13.0
Maastrichtian<5Good to excellent97.4
5 < SP < 10Medium2.6
Table 8. Water classification according to the Kelley ratio (KR).
AquiferRKWater Quality% of Samples
Maastrichtian<1good for irrigation82
RK > 1not good for irrigation18
Paleocene<1good for irrigation87
RK > 1not good for irrigation13
Publisher’s Note: MDPI stays neutral with regard to jurisdictional claims in published maps and institutional affiliations.

