
Prediction of Multi-Scale Meteorological Drought Characteristics over the Yangtze River Basin Based on CMIP6

School of Resource and Environmental Engineering, Wuhan University of Technology, Wuhan 430070, China
*
Author to whom correspondence should be addressed.
Water 2022, 14(19), 2996; https://doi.org/10.3390/w14192996
Submission received: 2 September 2022
/
Revised: 13 September 2022
/
Accepted: 20 September 2022
/
Published: 23 September 2022
(This article belongs to the Section Water and Climate Change)
Abstract
:Drought is a common and greatly influential natural disaster, yet its reliable estimation and prediction remain a challenge. The object of this paper is to investigate the spatiotemporal evolution of drought in the Yangtze River basin. The multi-time scale drought characteristics were analyzed based on 19 models and 3 emission scenarios of CMIP6. The results show that the CMIP6 model generally has moisture deviation in the Yangtze River basin, but the accuracy has been improved after correction and ensemble. The drought conditions in the near future (2030–2059) of the Yangtze River basin will be more severe than those in the historical period (1981–2010), with the drought intensity increasing by 7.47%, 18.24%, 18.34%, and 41.48% in the order of 1-month, 3-month, 6-month, and 12-month scales, but it will be alleviated in the far future (2070–2099) to 5.97%, 11.86%, −4.09%, and −8.97% of the historical period, respectively. The 1-month scale drought events are few, and the spatial heterogeneity is strong under different scenarios; areas of high frequency of the 3-month, 6-month, and 12-month scale drought events shift from the upper and middle reaches, middle and lower reaches in the historical period to the southwestern part of the entire basin in the future, and the harm of drought in these regions is also higher. The Yangtze River basin will get wetter, and the variability will increase in the future. The larger the time scale is, the more intense the change will be, with the 12-month scale varying about three times as much as the 1-month scale.
1. Introduction
Drought is a frequent disaster with serious effects on both human society and nature, which hinders economic development, reduces primary productivity, and destroys ecological balance [1,2]. More specifically, the economic loss caused by drought can amount to USD 6–8 billion per year. In the context of climate change, droughts are likely to become more frequent and more severe [3,4,5,6].
Drought characteristics derived from global-scale research are not equivalent to the conclusions at a regional scale. Drought characteristics of the same region vary significantly at different spatial scales, implying that drought characteristics are spatially scale-dependent [7,8]. In addition, because the spatial details offered by large-scale studies are insufficient for local decision making [9], regional studies are indispensable for providing more helpful information for policy and planning. Many previous studies indicate that drought conditions, such as extent, frequency, and intensity, have increased throughout China over the last 50 years and will continue to do so in the future [10,11]. In particular, the North China Plain to the lower reaches of the Yangtze River are among the regions with severe droughts [12], and the droughts in the upper reaches of the Yangtze River are becoming increasingly serious [13]. The Yangtze River basin is China’s first major basin, which has an important impact on China’s economic development as well as industrial and agricultural production, and it has a high vulnerability to natural disasters [14]. Many scholars have investigated droughts in this region, but few have taken the characteristics of drought events as the main research subject [15,16,17,18]. Furthermore, the remarkable monsoon climate of the region means that its response to climate change is complex and volatile, which is reflected in droughts as drought events with short-term fluctuations; therefore, studying droughts in the region is complex and requires consideration of time scales. At present, the following drought indices are applicable worldwide: Standard Precipitation Index (SPI), Standard Precipitation Evapotranspiration Index (SPEI), Palmer Drought Severity Index (PDSI), Standard Runoff Index (SRI), Crop Moisture Index (CMI), etc. The SPI is easy to calculate and can reflect not only the intensity and duration of the drought but also the drought conditions at different time scales.
In recent years, scientists have widely used model simulations output from the Coupled Model Intercomparison Project (CMIP) for climate research [19,20]. For example, based on the model data of CMIP5, the global continental drought was simulated, and the results show that the accuracy needs to be improved [21]. Moreover, there was a reproduction of China’s climate [22,23] and simulation, as well as prediction of extreme climate events [24,25]. With the gradual release of CMIP6 data, some researchers have conducted studies using the latest data, and a trend of increasing drought in numerous regions throughout the globe has been concluded [26]. When compared with CMIP5, CMIP6 has greater resolution and more comprehensive parameters and shows general improvement in simulating temperature and precipitation in China [27,28,29,30]. However, the climate simulation ability of CMIP6 for the Yangtze River basin is less clear.
In this study, we selected the Yangtze River basin as the study area. We analyzed the distribution patterns of drought events at different time scales for a 30-year period from 1981 to 2010 based on the observed data. In addition, the precipitation simulation ability of 19 models in CMIP6 was evaluated, then the models with higher precision were selected for the ensemble to predict the future drought changes according to the ranking. In this way, we explored and analyzed the change characteristics of dry conditions in the Yangtze River basin under different scenarios. The research results can help provide a reference for drought disaster management and water resources planning, as well as provide a buffer period and theoretical basis for relevant departments to formulate and implement response strategies to mitigate the losses caused by drought disasters.
2. Date and Methods
2.1. Date
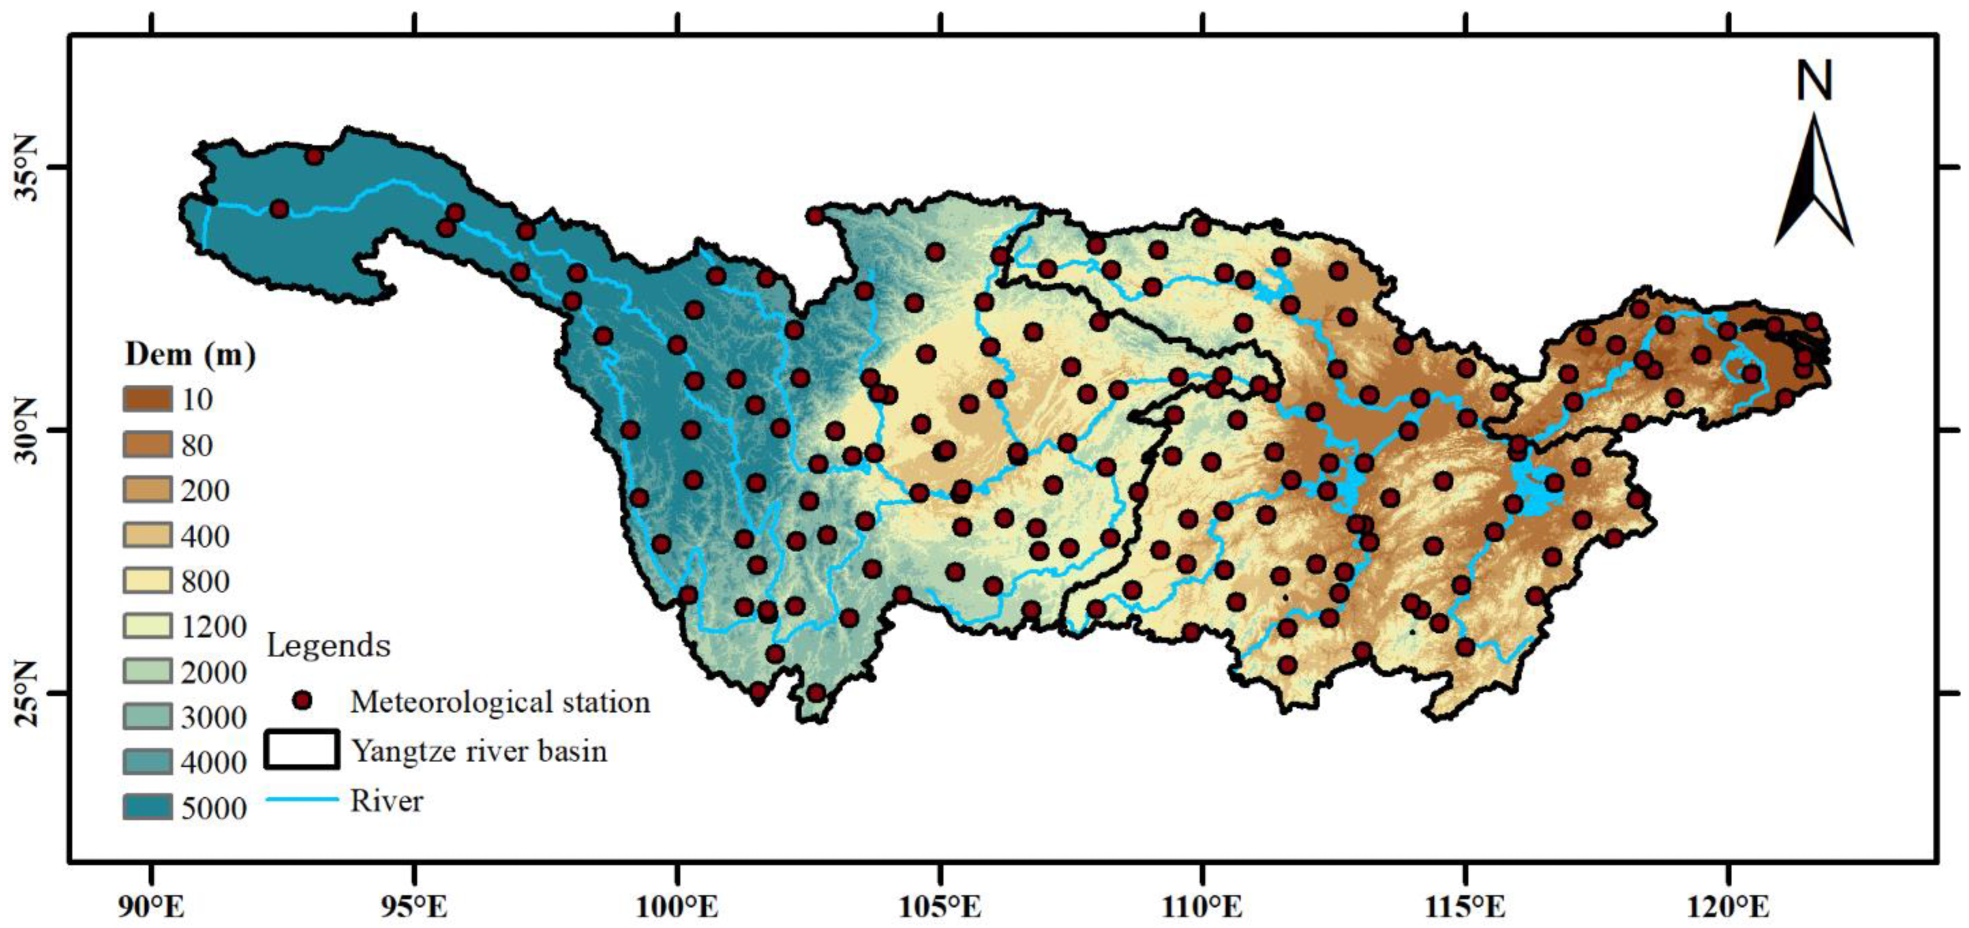
The Yangtze River basin (90°33′ E–122°25′ E, 24°30′ N–35°45′ N) is the third-largest basin in the world, with a population of over 450 million (Figure 1). It covers a total area of 1.8 × 10⁶ km2, accounting for about one-fifth of China’s land area, with an area ratio of 25:17:3 in the upper, middle, and lower reaches [31]. The source area of the Yangtze River basin belongs to the plateau climate, whereas most of the rest areas have a typical subtropical monsoon climate, with an average temperature of about 14℃ and average annual precipitation of about 1000 mm. The Yangtze River basin is an important resource-rich region of China due to its advantageous geographical location. For example, its water resources account for almost one-third of China’s total water resources, and it is also one of China’s most developed economic regions, with its GDP accounting for about 41% of China’s GDP [32]. In addition, the Yangtze River basin is also one of the three major grain production bases in China, with its grain output accounting for roughly 30% of China’s grain output in 2015 [33].
The daily precipitation grid data from 19 global climate models of CMIP6 (Table 1) were used and processed into monthly average data. The historical reference period was chosen as 1981–2010, and the future projection period was divided into two time periods: 2030–2059 (near future) and 2070–2099 (far future), all of which correspond to the 30-year reference period. CMIP6 has eight future climate change scenarios, and three scenarios (SSP2-4.5, SSP3-7.0, and SSP5-8.5) were selected for analysis in this paper. Because 19 global climate models have different spatial resolutions, the bilinear interpolation method was used to unify the data spatial resolution to 0.5° × 0.5°. To assess the simulation capability of climate variables output from the climate models over the historical period and to analyze the characteristics of drought events, the monthly precipitation grid data from CRU TS v3.25 (Climatic Research Unit Timeseries version 3.25) were considered as observations with a resolution of 0.5° × 0.5°.
2.2. Methods
2.2.1. Bias Correction
Based on observation data for the reference period and model data for the reference period and the future period, the equidistant cumulative distribution function matching method (EDCDFm) was used to correct the bias of the model data after bilinear interpolation. This method reduces the systematic error of the model and improves the simulation accuracy by adjusting the difference between the cumulative distribution function of the climate elements simulated by the model and the measured climate elements [34]. The corrected model precipitation value in the historical period is given by
where xm−c is the model precipitation value in the historical period; Fm−c is the CDF of the model data in the historical period; is the quantile function of the observation data. The corrected model precipitation value in the future period is given by
where xm−p is the model precipitation value in the future period; Fm−p is the CDF of the model data in the future period; and are the quantile functions of the observation data and model data in the historical period.
2.2.2. Precision Evaluation
- (1)
- To evaluate the simulation ability of the model in the time dimension, we considered the basin as a whole to find the basin means and then combined the correlation coefficient and standard deviation between the time series of the model and observations into a quantified index T, which was used to assess the degree of model simulation ability [35].where R is the correlation coefficient between the model and the observation; R0 is the maximum correlation coefficient that can be achieved here it is taken as 0.999; , STDm is the model standard deviation; and STDo is the observation standard deviation. The closer the model value is to the observed value, the closer T is to 1, and the better its simulation ability is.
- (2)
- To evaluate the simulation ability of the model in the spatial dimension, we presented the spatial skills score (S), which takes into account the spatial correlation coefficient between the model and the observation and bias [36].where MSE(m,o) is the mean square error between the model and observation; MSE(,o) is the mean square error of the observation field; rm,o is the spatial correlation coefficient between the model and observation; and sm and so are the standard deviation of the model and observation, respectively. The closer the model value is to the observed value, the closer S is to 1, and the better its simulation ability is.
- (3)
- The ranking of each model can be obtained according to index T and index S, and then we calculated the composite rating index [37]. The result is the final ranking.where m is the total number of models, m = 19; n is the number of indicators, n = 2; and ranki is the ranking of each model, with the best simulation ability being 1 and the worst being 19. The closer to 1 the MR value is, the better the model’s capacity to imitate each index is.
2.2.3. Drought Index
In this paper, the Standardized Precipitation Index (SPI) was used as the meteorological drought index, which considers the time series of regional precipitation to obey a skewed distribution [38]. In order to calculate SPI, it is first necessary to build monthly precipitation sliding accumulation series for different time scales and divide them into 12 seasons according to the end month of the precipitation sliding accumulation data, that is, to build 12 sets of time series. These 12 time series are then fitted with a skewed distribution respectively (gamma distribution here) to account for seasonal differences in precipitation; the SPI corresponding to the specific precipitation data can be calculated by normalizing the precipitation data obeyed skew distribution. The standard normalization process needs to be carried out for each of the 12 seasonal actual series at a specific time scale, and then the calculated SPI is arranged in natural time order so as to obtain the monthly SPI time series. It is easy to calculate and can analyze drought at different time scales, and the specific calculation steps are described in the reference paper [39]. In this paper, the SPI of 1-month, 3-month, 6-month, and 12-month time scales were selected to study the drought characteristics of monthly, seasonal, semi-annual, and annual scales in the Yangtze River basin. Based on the calculated SPI series, the drought events were identified by using the run theory, which is the most widely used identification method and can easily extract the characteristics of drought events. Moreover, three characteristic variables (number of events, drought duration, and drought severity) were selected. Drought duration is the number of months that the drought event lasts, and drought severity is the accumulation of SPI per month during the duration of the drought event. The conditions for identifying drought events in this paper were set as SPI < −1, and the duration is 3 months or more.
3. Results
3.1. Model Correction and Selection
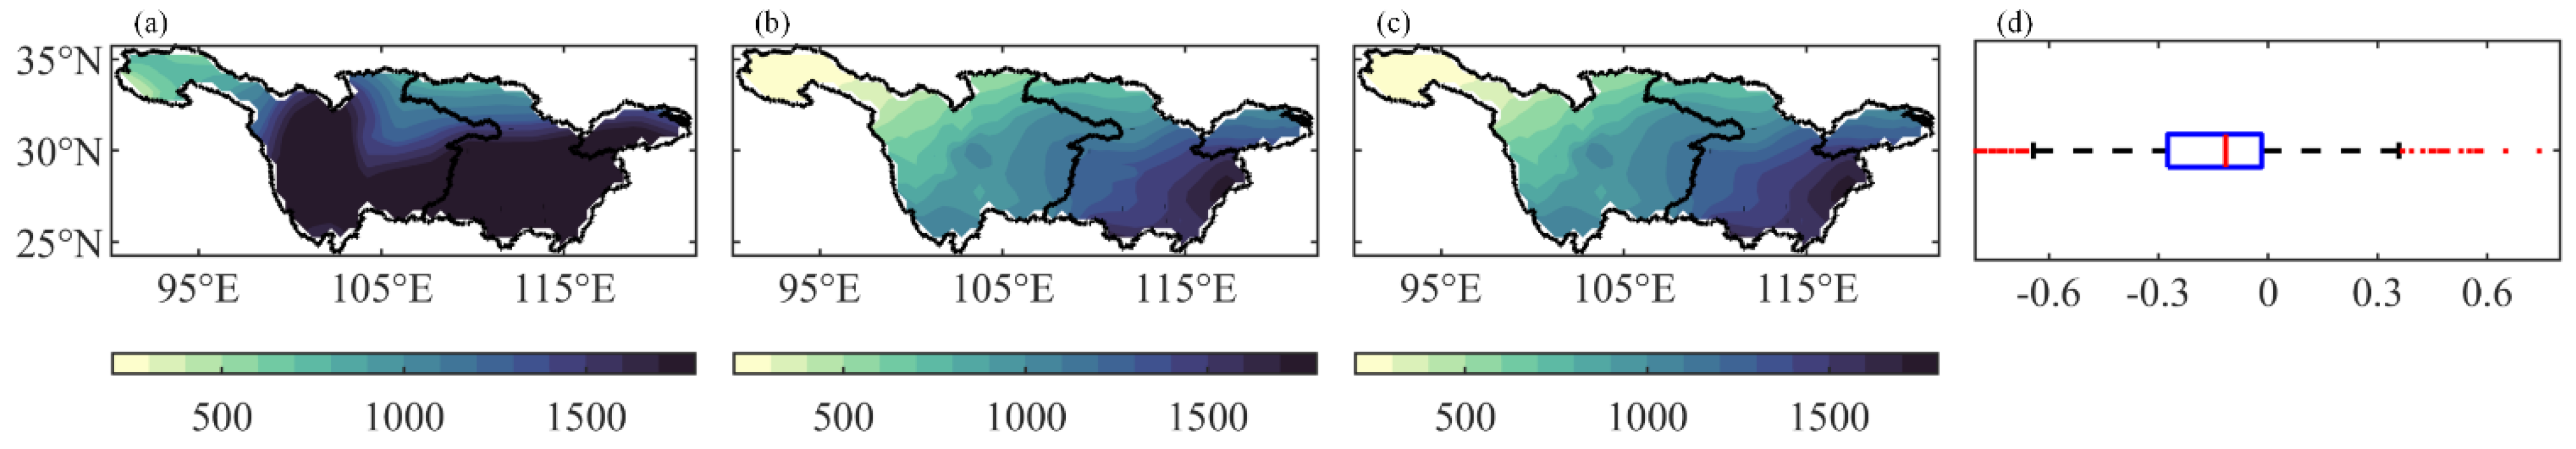
Taking ACCESS-CM2 as an example, it can be observed that the original model does not accurately reproduce the precipitation distribution in the Yangtze River basin, and there is a wide range of overestimation (Figure 2). The observed average annual precipitation in 1981–2010 is 997.94 mm, while the average annual precipitation in the original model is 1745.40 mm. Specifically, the observed precipitation in this area increases gradually from northwest to southeast, while the spatial distribution of precipitation in the original model has a high value in the upper reaches, and the overestimation rate in the west of the upper reaches is within 300%. After bias correction, the absolute value of the difference between the model and observed annual mean precipitation is mostly within 1 (Figure 2). Accordingly, it is necessary to use the EDCDFm method for bias correction.
After bias correction, the simulation accuracy of the 19 models was quantitatively evaluated and ranked (Table 2). The top 4 models in the index T are INM-CM4-8, EC-Earth3-Veg, EC-Earth3, and IPSL-CM6A-LR; the top 4 models in the index S are IPSL-CM6A-LR, ACCESS-CM2, EC-Earth3, and EC-Earth3-Veg. In addition, the final rating index MR was calculated by combining the two indicators, then we selected the models with MR scores greater than 0.8, namely IPSL-CM6A-LR, EC-Earth3, and EC-Earth3-Veg. The comprehensive simulation effect of these three models is the best. After averaging these 3 models, the model ensemble’s scores of index T and index S are better than the scores of any one of the 19 models and also better than the scores of the 19 models ensemble.
3.2. Drought Characteristics in Historical Period
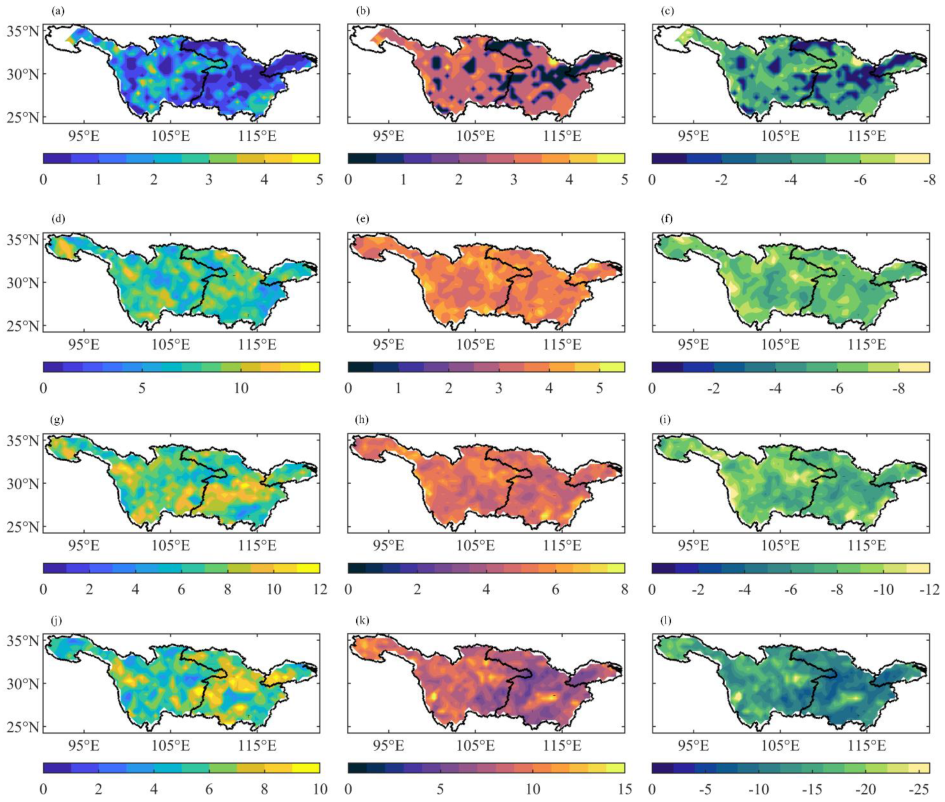
Table 3 was obtained after the regional statistics of Figure 3. From the comparison of different time scales, the number of drought events increases first and then decreases as the time scale becomes larger. That is, it is the least on a monthly scale with the mean value of 1.22 per unit grid point and the most on a seasonal scale with the mean value of 7.79. Spatially, the drought frequency area gradually moves from upstream to middle and downstream with the increase of time scale. At the same time, the average duration and average intensity of drought events both increase as the time scale becomes larger, and spatially, the damage upstream is greater.
The drought characteristics vary greatly at different time scales. For the 1-month scale, the number of drought events decreases from upstream to downstream (Figure 3), and the high values of average time and intensity are located in the midstream mainstem area. Of note is the southern part of the downstream, where droughts are less frequent and shorter but more intense. For the 3-month scale, the distribution of drought events is relatively uniform. The average duration and intensity are spatially consistent. They increase from the middle to the surrounding in the upstream; in the middle and lower reaches, the Dongting Lake basin and the northern part of the downstream have a relatively long average duration and stronger intensity. The northwestern part of the midstream and the southern part of the downstream have more drought events but less duration and intensity, i.e., less harmful, while the Dongting Lake basin and the northern part of the downstream have fewer drought events but are more harmful. The absolute values of duration and intensity characteristics of monthly and seasonal scale drought events in the Yangtze River basin do not differ much. For the 6-month scale, the regions with a higher number of drought events are concentrated in the midstream, and the spatial distribution of average duration and intensity is very close to the distribution of the 3-month scale but with an increase in the absolute values. For the 12-month scale, the regions with more drought events are concentrated in the middle and downstream, with spatial consistency in duration and intensity, and the spatial pattern of both is opposite to the number of events. There are fewer drought events in the upstream, but the average duration reaches 8.8 months, and the average intensity reaches −14, which is 1.4 months longer and 2.8 more than that in the middle and downstream. The annual scale drought events are less frequent and more hazardous in the upstream and more frequent and less hazardous in the middle and downstream.
3.3. Drought Characteristics Projection
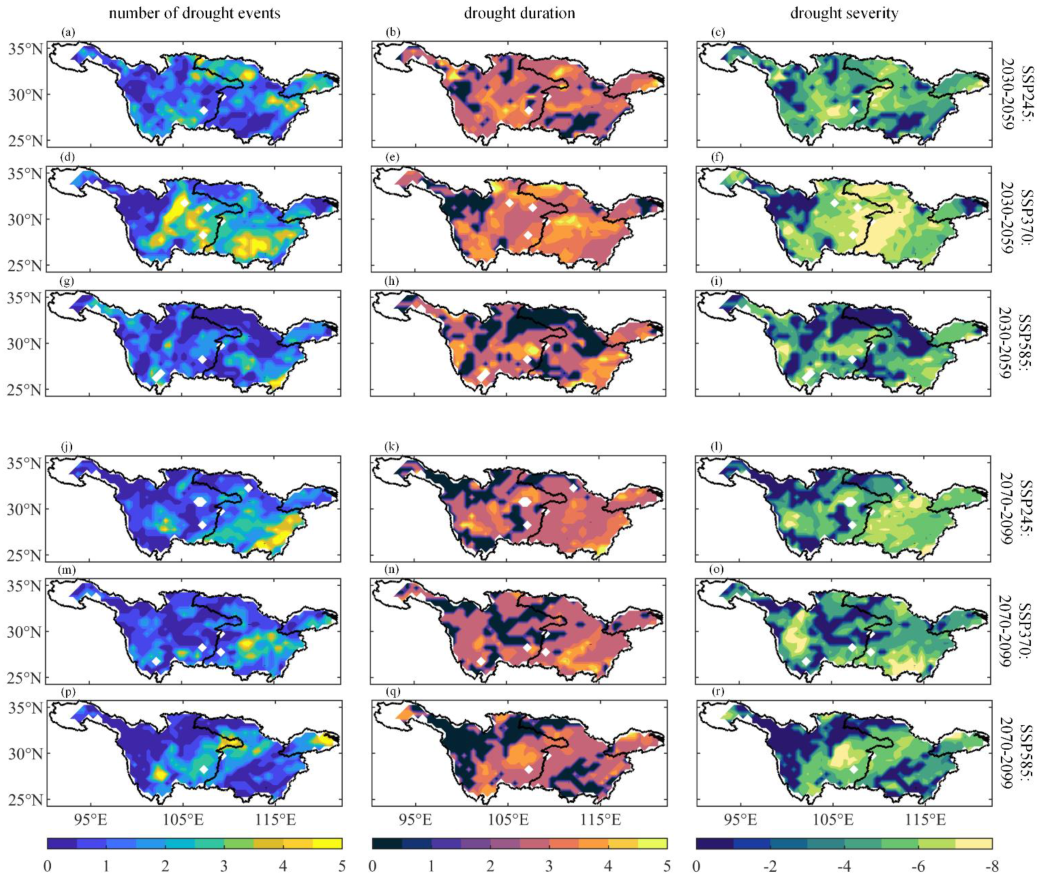
Similar to the reference period, the number of drought events increases and then decreases as the time scale becomes larger. The monthly scale has the least number of drought events, with the mean value of unit grid point in the near future and far future being 1.65 and 1.48, respectively, and the seasonal scale has the most, 7.03 and 5.48, respectively. With the increase in time scale, the drought frequency area gradually shifts from the middle and downstream to the southwestern part of the basin. The duration and intensity of drought events both increase with time scale, and spatially, the more hazardous areas transfer from the midstream to the downstream and then to the upstream and downstream with the time scale.
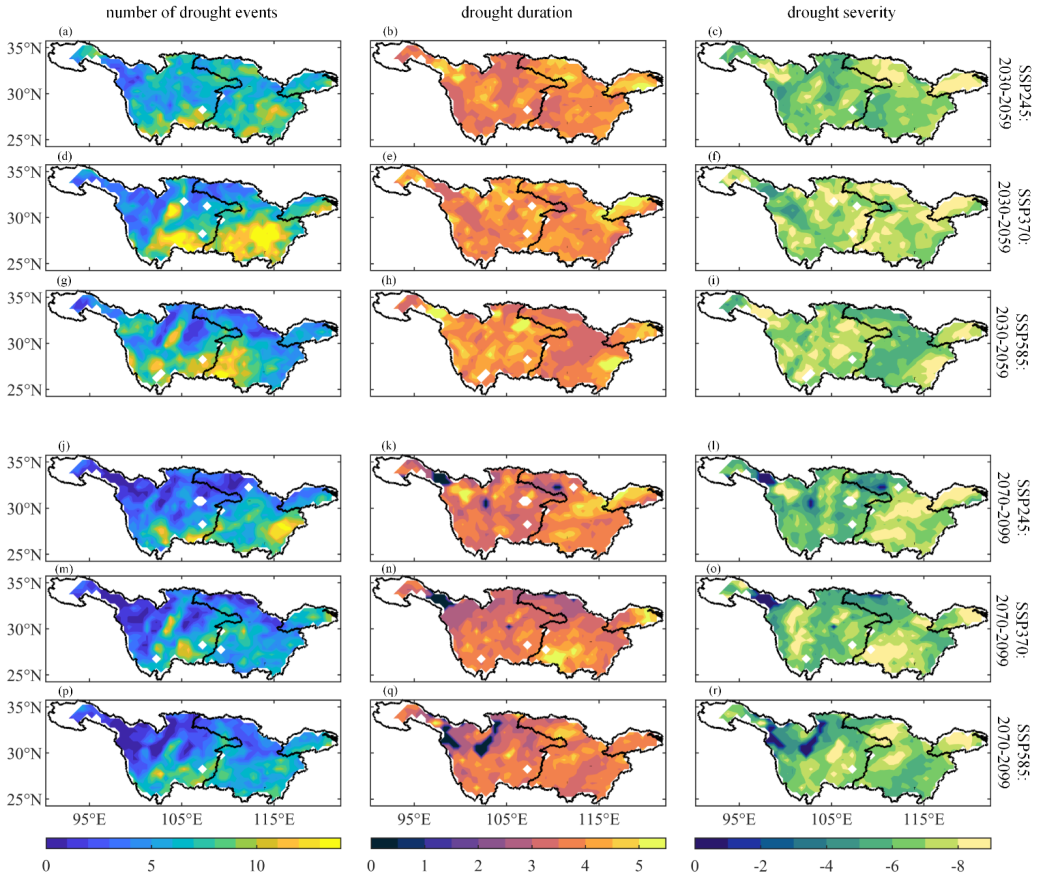
For the 1-month scale, the areas without drought events in SSP245 and SSP370 are mainly in the upstream, while those in SSP585 are concentrated in the upstream and midstream. Because of the rapid change of SPI on a monthly scale, the spatial characteristics of drought events under different scenarios and periods are very different. In SSP245, the number of droughts is the most in the downstream in the near future and the most in the midstream in the far future (Figure 4); in SSP370, the most in the midstream in both periods; in SSP585, the most in the downstream in both periods. For duration and severity, the differences in absolute values between regions within the basin are small from an overall perspective, and only the near future in SSP370 has a large difference, which is midstream > upstream > downstream.
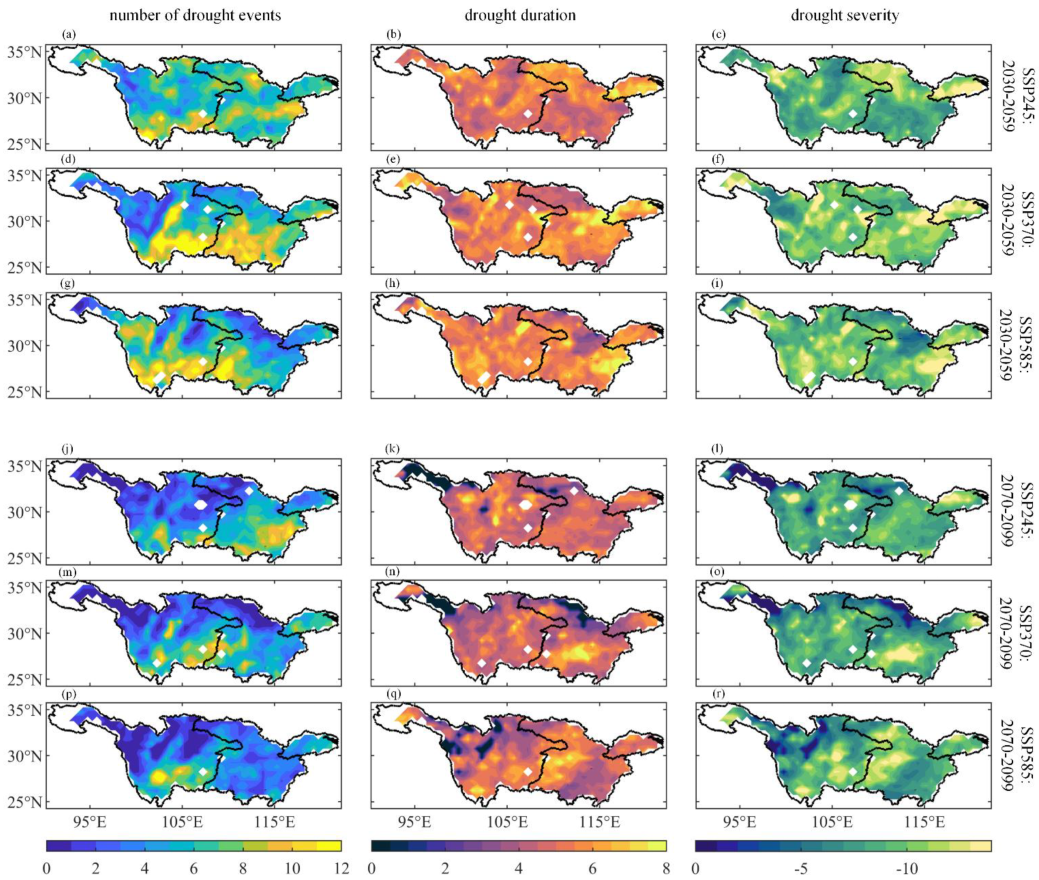
For the 3-month scale, the regions with more droughts in the near future are concentrated in the Minjiang River basin, Tuojiang River basin, the southern part of the upstream, Dongting Lake basin, and Poyang Lake basin (Figure 5); in the far future, the overall number of drought events in the Yangtze River basin decreases, but still shows a spatial pattern of high values in the south and low in the north, with high values still concentrated in the southern part of the upstream. There is a no drought region in the northwestern part of the upstream. In addition, the number of drought events in SSP370 is the most among the three scenarios. The spatial patterns of the mean duration and severity are similar in SSP245 and SSP370, which is higher in the north and lower in the south, with the high values concentrated in the Hanjiang River basin and the downstream in the near future (Figure 5) and in the Dongting Lake basin and the downstream in the far future. In SSP585, the high values move from the upstream to the east of the upstream and the west of the midstream. Only the downstream is high in different scenarios and different periods.
For the 6-month scale, the spatial distributions of drought frequency, mean duration, and intensity (Figure 6) are very similar to those of the 3-month scale. In addition, the differences are mainly in the northern midstream in the near future under the SSP370 scenario and the central midstream in the far future under the SSP245 scenario. These areas are all of higher severity in the 3-month time scale, while their severity is low in the 6-month scale.
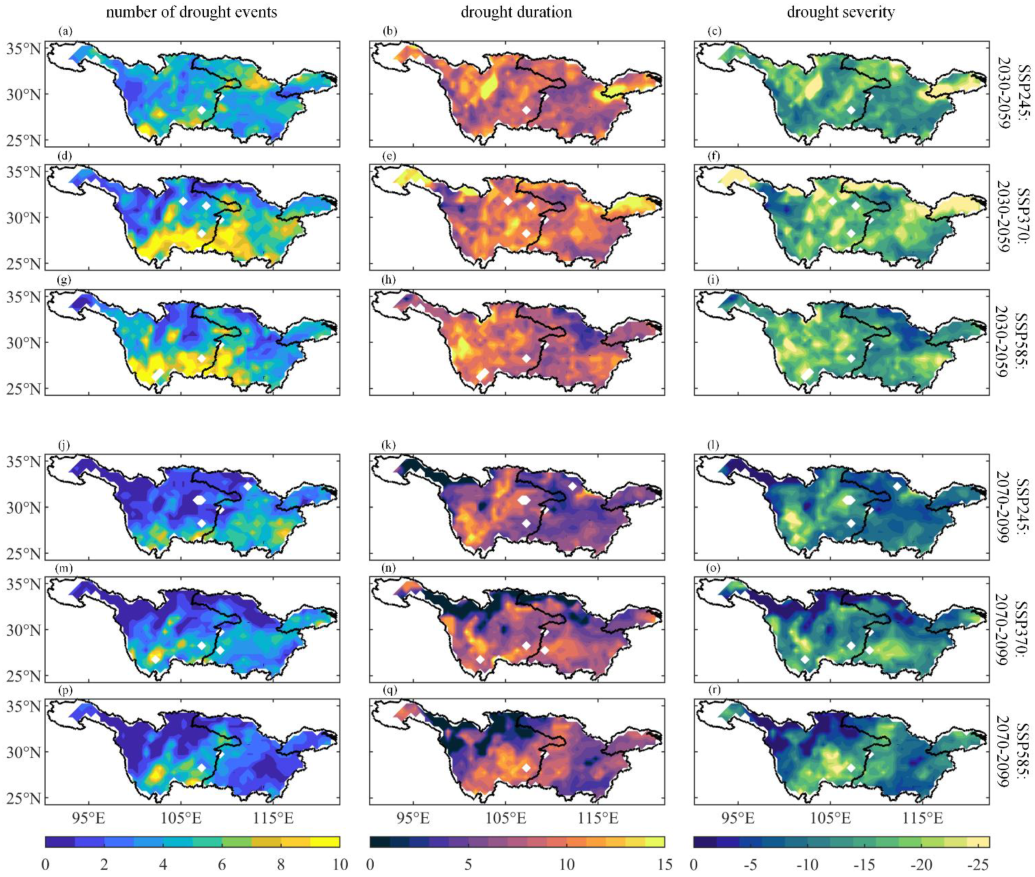
For the 12-month scale, the spatial distribution of drought frequency is very similar to that on the 3-month scale. In the near future, more drought events will occur in the southern part of the upstream and the southwestern part of the midstream, and by the far future, the north of the basin will have a region without drought events, with high values still concentrated in the south of the upstream. The mean duration and severity have different characteristics under different scenarios in the near future. The high values in SSP245 are located in the northwest of the upstream, especially in the Minjiang River basin, Tuojiang River basin, and the downstream mainstem area (Figure 7); in the SSP370, the spatial distribution is relatively uniform, but the characteristics of high values in the north and low in the south can also be observed; in SSP585, they decrease from the upstream to the downstream. The common point of all three scenarios is that the upstream values are higher, which indicates that the drought hazard in the upstream is higher. In the far future, the characteristics of the three scenarios are similar, with the high values in the south of the upstream.
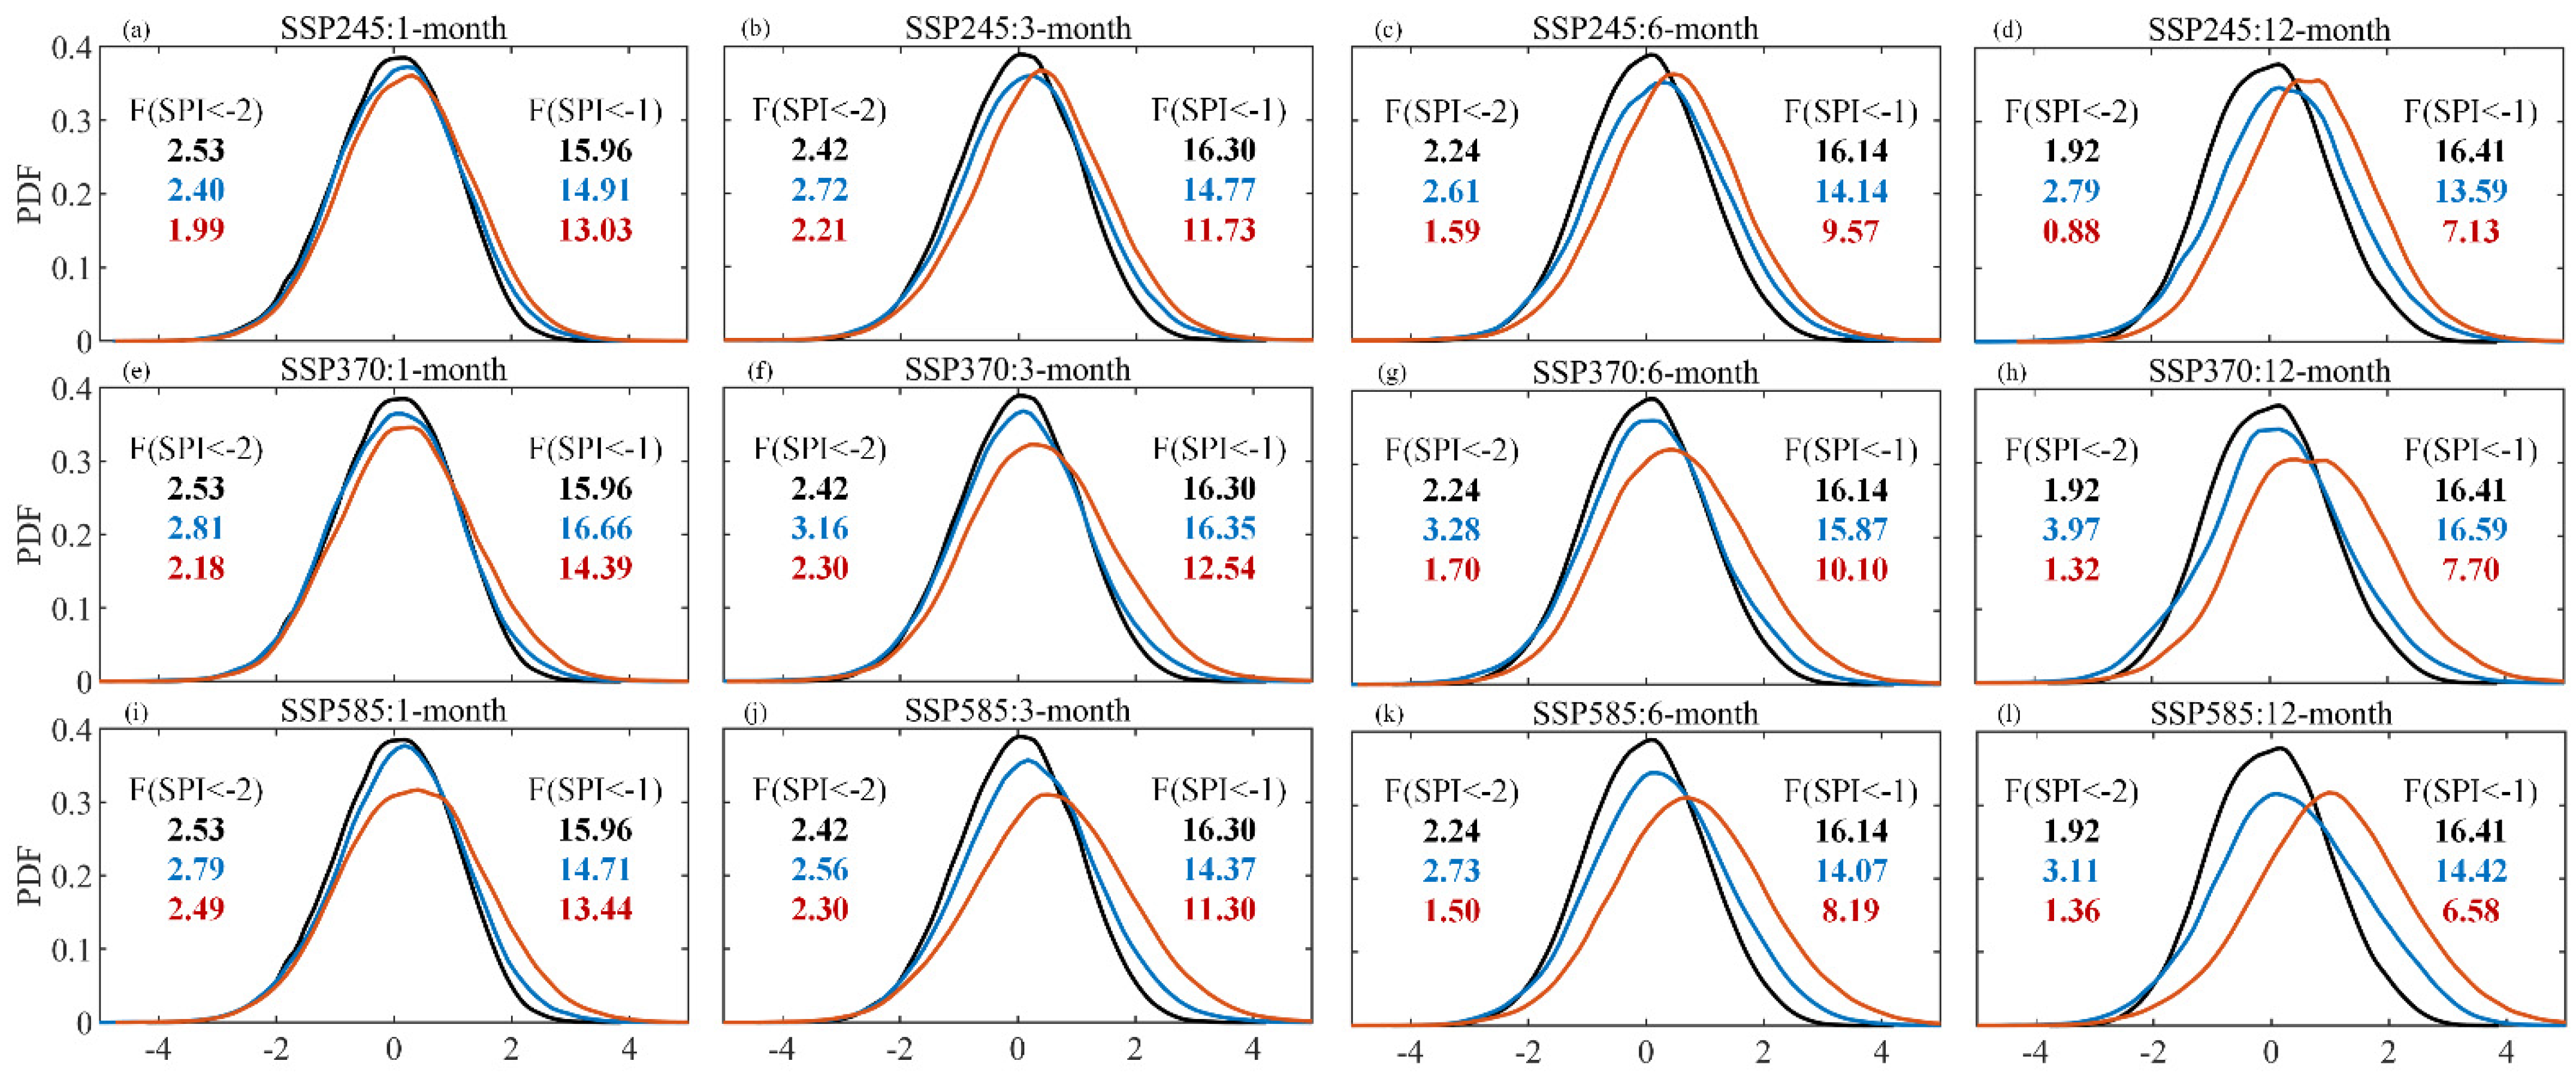
Under different time scales and different scenarios, most of the probability distributions show the trend that the average value moves in the positive direction and the peak value decreases, which means that the Yangtze River basin will become wetter in the future (Figure 8). The magnitude of the positive shift of the probability mean increases with the increase of the time scale. The probability mean of the 1-month, 3-month, 6-month, and 12-month scales will increase from 0 to 0.09, 0.14, 0.19, and 0.24 in the near future, and 0.26, 0.44, 0.59, and 0.80 in the far future, respectively. The probability of basic drought (SPI < −1) decreases as the time scale becomes larger in the future, unlike the reference period, where it becomes larger with a larger time scale.
Under the 1-month time scale (Figure 8), the probability distributions of all three scenarios widen with time, especially in the far future of SSP585; the peak value decreases from 38.5% to 32% since the historical period, indicating a substantial increase in its variability. While the probability mean value shifts to the right in both SSP245 and SSP585, the difference is that the mean value of the near future under SSP370 does not move significantly compared with that in the historical period, which is only 0.03. Therefore, it can be seen from Figure 4 that drought events of the 1-month scale in the near future under SSP370 are much more than those under the other two scenarios. Under the 3-month time scale, the probability changes are similar to those in the 1-month scale. In the 1-month and 3-month scales, it can be seen that the risk of extreme drought tends to remain stable, and the area with a larger change in the probability distribution is in the right humid zone. The probability of extreme drought (SPI < −2) is relatively constant, about 2.48% in the historical period, 2.74% in the near future, and 2.25% in the far future. Under the 6-month scale, the probability mean value for the far future starts to move more sharply toward the positive direction, so the probability of basic drought (SPI < −1) decreases from 11.86% in the 3-month scale to 9.29%, and the probability of extreme drought (SPI < −2) decreases from 2.27% in the 3-month scale to 1.60%. Under the 12-month scale, the probability distribution of SPI changes more drastically than that in the 1-month, 3-month, and 6-month scales. In the near future, the peak values in all three scenarios decline from 38% of the historical period to 35%, 35%, and 32% in the order of SSP245, SSP370, and SSP585, respectively, and the frequency of extreme drought events is higher than that in the historical period, from 1.92% to 2.79%, 3.97%, and 3.11%, respectively. By the far future period, drought events will be less than the historical period because the probability averages are all shifted significantly to the right, 0.65, 0.74, and 1.00, respectively. The probability characteristic of SPI < −1 is that it gradually decreases over time for both SSP245 and SSP585, while SSP370 is slightly higher in the near future than in the historical period, increasing first and then decreasing. It is worth noting that the probability of SPI < −1 on the 12-month scale will be significantly reduced in the far future. Comparing the three scenarios, SSP370 is characterized by a smaller rightward shift of the probability mean in the near future than the other two scenarios, so it is reflected in the drought event characteristics. As shown in Figure 4, Figure 5, Figure 6 and Figure 7, the drought events under SSP370 are more than those under the other two scenarios.
4. Discussion
Climate change affects the hydrological cycle of the world [40], and the response varies greatly among regions. However, the low resolution and systematic errors of global climate models make it difficult to apply to regional scale directly [41]; therefore, downscaling and bias correction are needed. At present, there is no single model that can well simulate the characteristics of precipitation in the Yangtze River basin in both time and space dimensions [42], and a multi-model ensemble can improve the simulation efficiency and reduce uncertainty [43,44]; however, a multi-model ensemble can be less accurate due to models with larger errors [45], so we selected better models from 19 models, and then averaged the optimal model set, with the obtained results being used for future forecasting.
Compared with the previous studies’ results, the drought prediction in China based on CMIP5 indicated that the precipitation would increase, i.e., there would be an alternating short period of drought and flooding, and the drought would be aggravated, especially in the southwest [46,47]. Moreover, the global research based on CMIP6 also observed that the Yangtze River basin is trending to become wetter in the future, and the intensity of drought increases with high values in the upper reaches [48,49]. CMIP6 has a significant improvement over CMIP5; however, the multi-model ensemble of CMIP6 is still not very effective for simulating precipitation in western China, mainly because of the complex topography [30] and different circulation systems [42]. The drought under SSP370 is the most severe in the results of this study because the setting conditions of this path are that both emission mitigation and human adaptation face great challenges, while SSP585 has a strong human adaptation ability with only emission mitigation facing challenges. The increasing harmfulness of drought in the future will pose greater challenges to people’s life, food production, and resource allocation in the Yangtze River basin, so supporting measures should be implemented in different regions in conjunction with the predicted results of droughts at different time scales.
In this paper, the SPI was selected to evaluate drought in the Yangtze River basin. The SPI assesses drought with only precipitation as input, without considering evapotranspiration. The temperature is another factor affecting drought, and increasing future global temperature [50] may weaken the benefit of increased precipitation. In the future, we will add the temperature factor for prediction, as well as compare multiple drought indicators for improvement.
5. Conclusions
This paper quantitatively evaluated the simulation performance of CMIP6 models on precipitation in the Yangtze River basin and analyzed the characteristics of drought events in the historical period and future under three SSP scenarios in terms of the number of drought events, average duration, and average intensity based on SPI and the run theory. The main conclusions are as follows.
- (1)
- The correction results using the EDCDFm method fit well with the observed data, and the correction results of three models, IPSL-CM6A-LR, EC-Earth3, and EC-Earth3-Veg, are more suitable for the Yangtze River basin. The simulation accuracy of the ensemble of these three models is higher than any single model used in this paper.
- (2)
- Within the same period, as the time scale becomes larger, the number of drought events in the Yangtze River basin increases first and then decreases, and the average duration and intensity increase, i.e., the number of monthly scale events is the least, the number of seasonal scale events is the most, and the annual scale events are the most hazardous. Within the basin, the drought frequency area moves from upstream to middle and downstream with increasing time scale in the reference period, and from middle and downstream to the southwestern part of the basin in the future; as for the area with strong harmfulness, it is upstream in the reference period and moves from midstream to upstream and downstream with increasing time scale in the future. All three drought characteristics in the 1-month scale are increasing first and then decreasing with time, and the number of droughts in the 3-month, 6-month, and 12-month scale is gradually decreasing, but the severity is increasing first and then decreasing, so the drought in the near future is to be more serious than that in the historical reference period.
- (3)
- The probability distribution of SPI increases in average value and decreases in peak value with time, and the range of changes increases with time scale, i.e., the Yangtze River basin will become wetter and more variable in the future, and the larger the time scale, the more drastic the change. As the time scale becomes larger, the probability of occurrence of basic drought (SPI < −1) decreases in the future, from 15.43% on a monthly scale to 14.86% on an annual scale in the near future, and from 13.62% to 7.14% in the far future.
Author Contributions
Conceptualization, J.Y., H.Z., J.H. and Y.Y.; methodology, J.Y. and H.Z.; software, J.Y.; validation, J.Y.; formal analysis, J.Y.; investigation, J.Y.; resources, H.Z.; data curation, J.Y.; writing—original draft preparation, J.Y.; writing—review and editing, J.Y. and H.Z.; visualization, J.Y.; supervision, J.H. and Y.Y.; project administration, J.Y., H.Z., J.H. and Y.Y.; funding acquisition, H.Z. All authors have read and agreed to the published version of the manuscript.
Funding
This research was funded by the National Natural Science Foundation of China (No. 42001018, 52079101, and 42171415).
Data Availability Statement
The CMIP6 model simulations are freely available from https://esgf-node.llnl.gov/search/cmip6/ (accessed on 1 September 2020).
Conflicts of Interest
The authors declare no conflict of interest.
References
- Touma, D.; Ashfaq, M.; Nayak, M.A.; Kao, S.-C.; Diffenbaugh, N.S. A Multi-Model and Multi-Index Evaluation of Drought Characteristics in the 21st Century. J. Hydrol. 2015, 526, 196–207. [Google Scholar] [CrossRef]
- MacKay, S.L.; Arain, M.A.; Khomik, M.; Brodeur, J.J.; Schumacher, J.; Hartmann, H.; Peichl, M. The Impact of Induced Drought on Transpiration and Growth in a Temperate Pine Plantation Forest: Drought Impacts on Forest Transpiration and Growth. Hydrol. Process. 2012, 26, 1779–1791. [Google Scholar] [CrossRef]
- Dai, A. Increasing Drought under Global Warming in Observations and Models. Nat. Clim. Chang. 2013, 3, 52–58. [Google Scholar] [CrossRef]
- Griffin, D.; Anchukaitis, K.J. How Unusual Is the 2012–2014 California Drought? Geophys. Res. Lett. 2014, 41, 9017–9023. [Google Scholar] [CrossRef]
- Markonis, Y.; Kumar, R.; Hanel, M.; Rakovec, O.; Máca, P.; AghaKouchak, A. The Rise of Compound Warm-Season Droughts in Europe. Sci. Adv. 2021, 7, eabb9668. [Google Scholar] [CrossRef]
- Vicente-Serrano, S.M.; Quiring, S.M.; Peña-Gallardo, M.; Yuan, S.; Domínguez-Castro, F. A Review of Environmental Droughts: Increased Risk under Global Warming? Earth-Sci. Rev. 2020, 201, 102953. [Google Scholar] [CrossRef]
- Leelaruban, N.; Padmanabhan, G. Drought Occurrences and Their Characteristics across Selected Spatial Scales in the Contiguous United States. Geosciences 2017, 7, 59. [Google Scholar] [CrossRef]
- Hellwig, J.; Stahl, K.; Ziese, M.; Becker, A. The Impact of the Resolution of Meteorological Data Sets on Catchment-Scale Precipitation and Drought Studies. Int. J. Climatol. 2018, 38, 3069–3081. [Google Scholar] [CrossRef]
- Abatzoglou, J.T.; McEvoy, D.J.; Redmond, K.T. The West Wide Drought Tracker: Drought Monitoring at Fine Spatial Scales. Bull. Am. Meteorol. Soc. 2017, 98, 1815–1820. [Google Scholar] [CrossRef]
- Chen, H.; Sun, J. Changes in Drought Characteristics over China Using the Standardized Precipitation Evapotranspiration Index. J. Clim. 2015, 28, 5430–5447. [Google Scholar] [CrossRef]
- Huang, J.; Zhai, J.; Jiang, T.; Wang, Y.; Li, X.; Wang, R.; Xiong, M.; Su, B.; Fischer, T. Analysis of Future Drought Characteristics in China Using the Regional Climate Model CCLM. Clim. Dyn. 2018, 50, 507–525. [Google Scholar] [CrossRef]
- Xu, K.; Yang, D.; Yang, H.; Li, Z.; Qin, Y.; Shen, Y. Spatio-Temporal Variation of Drought in China during 1961–2012: A Climatic Perspective. J. Hydrol. 2015, 526, 253–264. [Google Scholar] [CrossRef]
- Hong, X.; Guo, S.; Zhou, Y.; Xiong, L. Uncertainties in Assessing Hydrological Drought Using Streamflow Drought Index for the Upper Yangtze River Basin. Stoch. Environ. Res. Risk Assess. 2015, 29, 1235–1247. [Google Scholar] [CrossRef]
- Huang, J.; Liu, Y.; Ma, L.; Su, F. Methodology for the Assessment and Classification of Regional Vulnerability to Natural Hazards in China: The Application of a DEA Model. Nat. Hazards 2013, 65, 115–134. [Google Scholar] [CrossRef]
- Huang, H.; Zhang, B.; Cui, Y.; Ma, S. Analysis on the Characteristics of Dry and Wet Periods in The Yangtze River Basin. Water 2020, 12, 2960. [Google Scholar] [CrossRef]
- Zhao, Z.; Zhang, Y.; Liu, L.; Hu, Z. The Impact of Drought on Vegetation Conditions within the Damqu River Basin, Yangtze River Source Region, China. PLoS ONE 2018, 13, e0202966. [Google Scholar] [CrossRef]
- Zhang, N.; Xia, Z.; Zhang, S.; Jiang, H. Temporal and Spatial Characteristics of Precipitation and Droughts in the Upper Reaches of the Yangtze River Basin (China) in Recent Five Decades. J. Hydroinform. 2012, 14, 221–235. [Google Scholar] [CrossRef]
- Jiang, W.; Wang, L.; Feng, L.; Zhang, M.; Yao, R. Drought Characteristics and Its Impact on Changes in Surface Vegetation from 1981 to 2015 in the Yangtze River Basin, China. Int. J. Clim. 2020, 40, 3380–3397. [Google Scholar] [CrossRef]
- Taylor, K.E.; Stouffer, R.J.; Meehl, G.A. An Overview of CMIP5 and the Experiment Design. Bull. Am. Meteorol. Soc. 2012, 93, 485–498. [Google Scholar] [CrossRef]
- Eyring, V.; Bony, S.; Meehl, G.A.; Senior, C.A.; Stevens, B.; Stouffer, R.J.; Taylor, K.E. Overview of the Coupled Model Intercomparison Project Phase 6 (CMIP6) Experimental Design and Organization. Geosci. Model Dev. 2016, 9, 1937–1958. [Google Scholar] [CrossRef] [Green Version]
- Nasrollahi, N.; AghaKouchak, A.; Cheng, L.; Damberg, L.; Phillips, T.J.; Miao, C.; Hsu, K.; Sorooshian, S. How Well Do CMIP5 Climate Simulations Replicate Historical Trends and Patterns of Meteorological Droughts? Water Resour. Res. 2015, 51, 2847–2864. [Google Scholar] [CrossRef]
- Sun, Q.; Miao, C.; Duan, Q. Comparative Analysis of CMIP3 and CMIP5 Global Climate Models for Simulating the Daily Mean, Maximum, and Minimum Temperatures and Daily Precipitation over China: Assessment of CMIP3 and CMIP5 over China. J. Geophys. Res. Atmos. 2015, 120, 4806–4824. [Google Scholar] [CrossRef]
- Jiang, Z.; Li, W.; Xu, J.; Li, L. Extreme Precipitation Indices over China in CMIP5 Models. Part I: Model Evaluation. J. Clim. 2015, 28, 8603–8619. [Google Scholar] [CrossRef]
- Dong, S.; Xu, Y.; Zhou, B.; Shi, Y. Assessment of Indices of Temperature Extremes Simulated by Multiple CMIP5 Models over China. Adv. Atmos. Sci. 2015, 32, 1077–1091. [Google Scholar] [CrossRef]
- Xu, Y.; Gao, X.; Giorgi, F.; Zhou, B.; Shi, Y.; Wu, J.; Zhang, Y. Projected Changes in Temperature and Precipitation Extremes over China as Measured by 50-Yr Return Values and Periods Based on a CMIP5 Ensemble. Adv. Atmos. Sci. 2018, 35, 376–388. [Google Scholar] [CrossRef]
- Cook, B.I.; Mankin, J.S.; Marvel, K.; Williams, A.P.; Smerdon, J.E.; Anchukaitis, K.J. Twenty-First Century Drought Projections in the CMIP6 Forcing Scenarios. Earth’s Future 2020, 8, e2019EF001461. [Google Scholar] [CrossRef]
- Chen, H.; Sun, J.; Lin, W.; Xu, H. Comparison of CMIP6 and CMIP5 Models in Simulating Climate Extremes. Sci. Bull. 2020, 65, 1415–1418. [Google Scholar] [CrossRef]
- Jiang, D.; Hu, D.; Tian, Z.; Lang, X. Differences between CMIP6 and CMIP5 Models in Simulating Climate over China and the East Asian Monsoon. Adv. Atmos. Sci. 2020, 37, 1102–1118. [Google Scholar] [CrossRef]
- Zhou, T.; Chen, Z.; Zou, L.; Chen, X.; Yu, Y.; Wang, B.; Bao, Q.; Bao, Y.; Cao, J.; He, B.; et al. Development of Climate and Earth System Models in China: Past Achievements and New CMIP6 Results. J. Meteorol. Res. 2020, 34, 1–19. [Google Scholar] [CrossRef]
- Zhu, H.; Jiang, Z.; Li, J.; Li, W.; Sun, C.; Li, L. Does CMIP6 Inspire More Confidence in Simulating Climate Extremes over China? Adv. Atmos. Sci. 2020, 37, 1119–1132. [Google Scholar] [CrossRef]
- Zhang, D.; Zhang, Q.; Werner, A.D.; Liu, X. GRACE-Based Hydrological Drought Evaluation of the Yangtze River Basin, China. J. Hydrometeorol. 2016, 17, 811–828. [Google Scholar] [CrossRef]
- Zhang, D.; Liu, X.; Bai, P. Assessment of Hydrological Drought and Its Recovery Time for Eight Tributaries of the Yangtze River (China) Based on Downscaled GRACE Data. J. Hydrol. 2019, 568, 592–603. [Google Scholar] [CrossRef]
- Xu, X.; Hu, H.; Tan, Y.; Yang, G.; Zhu, P.; Jiang, B. Quantifying the Impacts of Climate Variability and Human Interventions on Crop Production and Food Security in the Yangtze River Basin, China, 1990–2015. Sci. Total Environ. 2019, 665, 379–389. [Google Scholar] [CrossRef] [PubMed]
- Li, H.; Sheffield, J.; Wood, E.F. Bias Correction of Monthly Precipitation and Temperature Fields from Intergovernmental Panel on Climate Change AR4 Models Using Equidistant Quantile Matching. J. Geophys. Res. 2010, 115, D10101. [Google Scholar] [CrossRef]
- Taylor, K.E. Summarizing Multiple Aspects of Model Performance in a Single Diagram. J. Geophys. Res. 2001, 106, 7183–7192. [Google Scholar] [CrossRef]
- Pierce, D.W.; Barnett, T.P.; Santer, B.D.; Gleckler, P.J. Selecting Global Climate Models for Regional Climate Change Studies. Proc. Natl. Acad. Sci. USA 2009, 106, 8441–8446. [Google Scholar] [CrossRef]
- Schuenemann, K.C.; Cassano, J.J. Changes in Synoptic Weather Patterns and Greenland Precipitation in the 20th and 21st Centuries: 1. Evaluation of Late 20th Century Simulations from IPCC Models. J. Geophys. Res. 2009, 114, D20113. [Google Scholar] [CrossRef]
- McKee, T.B.; Doesken, N.J.; Kleist, J. The Relationship of Drought Frequency and Duration to Time Scales. In Proceedings of the 8th Conference on Applied Climatology, Boston, MA, USA, 17–22 January 1993; Volume 17, pp. 179–183. [Google Scholar]
- Zhou, H.; Liu, Y. SPI Based Meteorological Drought Assessment over a Humid Basin: Effects of Processing Schemes. Water 2016, 8, 373. [Google Scholar] [CrossRef]
- AghaKouchak, A.; Chiang, F.; Huning, L.S.; Love, C.A.; Mallakpour, I.; Mazdiyasni, O.; Moftakhari, H.; Papalexiou, S.M.; Ragno, E.; Sadegh, M. Climate Extremes and Compound Hazards in a Warming World. Annu. Rev. Earth Planet. Sci. 2020, 48, 519–548. [Google Scholar] [CrossRef]
- Thompson, D.W.J.; Barnes, E.A.; Deser, C.; Foust, W.E.; Phillips, A.S. Quantifying the Role of Internal Climate Variability in Future Climate Trends. J. Clim. 2015, 28, 6443–6456. [Google Scholar] [CrossRef]
- Li, Y.; Yan, D.; Peng, H.; Xiao, S. Evaluation of Precipitation in CMIP6 over the Yangtze River Basin. Atmos. Res. 2021, 253, 105406. [Google Scholar] [CrossRef]
- Wang, X.; Yang, T.; Li, X.; Shi, P.; Zhou, X. Spatio-Temporal Changes of Precipitation and Temperature over the Pearl River Basin Based on CMIP5 Multi-Model Ensemble. Stoch. Environ. Res. Risk Assess. 2017, 31, 1077–1089. [Google Scholar] [CrossRef]
- Yu, Z.; Gu, H.; Wang, J.; Xia, J.; Lu, B. Effect of Projected Climate Change on the Hydrological Regime of the Yangtze River Basin, China. Stoch. Environ. Res. Risk Assess. 2018, 32, 1–16. [Google Scholar] [CrossRef]
- Yang, X.; Zhou, B.; Xu, Y.; Han, Z. CMIP6 Evaluation and Projection of Temperature and Precipitation over China. Adv. Atmos. Sci. 2021, 38, 817–830. [Google Scholar] [CrossRef]
- Wang, L.; Chen, W. A CMIP5 Multimodel Projection of Future Temperature, Precipitation, and Climatological Drought in China: A Multimodel Projection of Climate in China. Int. J. Climatol. 2014, 34, 2059–2078. [Google Scholar] [CrossRef]
- Sun, F.; Mejia, A.; Zeng, P.; Che, Y. Projecting Meteorological, Hydrological and Agricultural Droughts for the Yangtze River Basin. Sci. Total Environ. 2019, 696, 134076. [Google Scholar] [CrossRef]
- Ukkola, A.M.; De Kauwe, M.G.; Roderick, M.L.; Abramowitz, G.; Pitman, A.J. Robust Future Changes in Meteorological Drought in CMIP6 Projections Despite Uncertainty in Precipitation. Geophys. Res. Lett. 2020, 47, e2020GL087820. [Google Scholar] [CrossRef]
- Zhao, T.; Dai, A. CMIP6 Model-Projected Hydroclimatic and Drought Changes and Their Causes in the Twenty-First Century. J. Clim. 2022, 35, 897–921. [Google Scholar] [CrossRef]
- Pörtner, H.O.; Roberts, D.C.; Adams, H.; Adler, C.; Aldunce, P.; Ali, E.; Begum, R.A.; Betts, R.; Kerr, R.B.; Biesbroek, R.; et al. Climate Change 2022: Impacts, Adaptation and Vulnerability. Available online: https://www.ipcc.ch/report/ar6/wg2/ (accessed on 10 September 2022).
Figure 1.
Topographic map of the Yangtze River basin (Dem refers to Digital Elevation Model). The sub-basins from left to right are the upper, middle, and lower reaches, respectively.
Figure 1.
Topographic map of the Yangtze River basin (Dem refers to Digital Elevation Model). The sub-basins from left to right are the upper, middle, and lower reaches, respectively.

Figure 2.
Mean annual precipitation (mm/a) in the Yangtze River basin from 1981 to 2010: (a) ACCESS-CM2, (b) corrected ACCESS-CM2, (c) observation, (d) the absolute value of the difference between the corrected model and observed annual mean precipitation (mm).
Figure 2.
Mean annual precipitation (mm/a) in the Yangtze River basin from 1981 to 2010: (a) ACCESS-CM2, (b) corrected ACCESS-CM2, (c) observation, (d) the absolute value of the difference between the corrected model and observed annual mean precipitation (mm).

Figure 3.
Drought Characteristics in the Yangtze River basin from 1981 to 2010 in the 1-month (a–c), 3-month (d–f), 6-month (g–i) and 12-month (j–l) scale, with the first column showing the number of drought events, the second showing the average duration (month), and the last showing the average severity.

Figure 4.
Spatial distribution of the number of drought events (a,d,g,j,m,p), average duration (b,e,h,k,n,q), and average severity (c,f,i,l,o,r) in the 1-month scale in the Yangtze River basin from 2030–2059 (a–i) and 2070–2099 (j–r) under the three scenarios of SSP245 (a–c,j–l), SSP370 (d–f,m–o), and SSP585 (g–i,p–r).

Figure 5.
Spatial distribution of the number of drought events (a,d,g,j,m,p), average duration (b,e,h,k,n,q), and average severity (c,f,i,l,o,r) in the 3-month scale in the Yangtze River basin from 2030–2059 (a–i) and 2070–2099 (j–r) under the three scenarios of SSP245 (a–c,j–l), SSP370 (d–f,m–o), and SSP585 (g–i,p–r).

Figure 6.
Spatial distribution of the number of drought events (a,d,g,j,m,p), average duration (b,e,h,k,n,q), and average severity (c,f,i,l,o,r) in the 6-month scale in the Yangtze River basin from 2030–2059 (a–i) and 2070–2099 (j–r) under the three scenarios of SSP245 (a–c,j–l), SSP370 (d–f,m–o), and SSP585 (g–i,p–r).

Figure 7.
Spatial distribution of the number of drought events (a,d,g,j,m,p), average duration (b,e,h,k,n,q), and average severity (c,f,i,l,o,r) in the 12-month scale in the Yangtze River basin from 2030–2059 (a–i) and 2070–2099 (j–r) under the three scenarios of SSP245 (a–c,j–l), SSP370 (d–f,m–o), and SSP585 (g–i,p–r).

Figure 8.
Probability distributions of 1-month (a,e,i), 3-month (b,f,j), 6-month (c,g,k), and 12-month (d,h,l) scale SPI under SSP245 (a–d), SSP370 (e–h), and SSP585 (i–l) scenarios. The black, blue, and red lines represent the probability distributions for the historical period (1981–2010), 2030–2059, and 2070–2099, respectively, and the black, blue, and red letters represent the probabilities (%) of SPI < −2 and SPI < −1 for the corresponding periods.


Table 1.
Information on the 19 CMIP6 climate models used in this study.
| Model Name | Institute | No. of Grids (lat × lon) |
|---|---|---|
| ACCESS-CM2 | Commonwealth Scientific and Industrial Research Organisation, Australian Research Council Centre of Excellence for Climate System Science, Australia | 144 × 192 |
| ACCESS-ESM1-5 | Commonwealth Scientific and Industrial Research Organisation, Australia | 145 × 192 |
| BCC-CSM2-MR | Beijing Climate Center, China | 160 × 320 |
| CanESM5 | Canadian Centre for Climate Modelling and Analysis, Canada | 64 × 128 |
| CESM2-WACCM | National Center for Atmospheric Research, USA | 192 × 288 |
| CMCC-CM2-SR5 | Euro-Mediterranean Centre for Climate Change, Italy | 192 × 288 |
| EC-Earth3 | EC-Earth-Consortium, Europe | 256 × 512 |
| EC-Earth3-Veg | EC-Earth-Consortium, Europe | 256 × 512 |
| GFDL-ESM4 | National Oceanic and Atmospheric Administration, Geophysical Fluid Dynamics Laboratory, USA | 180 × 288 |
| INM-CM4-8 | Institute for Numerical Mathematics, Russia | 120 × 180 |
| INM-CM5-0 | Institute for Numerical Mathematics, Russia | 120 × 180 |
| IPSL-CM6A-LR | Institut Pierre Simon Laplace, France | 143 × 144 |
| KACE-1-0-G | National Institute of Meteorological Sciences, Korea Meteorological Administration, Korea | 144 × 192 |
| MIROC6 | Japan Agency for Marine-Earth Science and Technology, Atmosphere and Ocean Research Institute, National Institute for Environmental Studies, and RIKEN Center for Computational Science, Japan | 128 × 256 |
| MPI-ESM1-2-HR | Max Planck Institute for Meteorology, Germany | 192 × 384 |
| MPI-ESM1-2-LR | Max Planck Institute for Meteorology, Germany | 96 × 192 |
| MRI-ESM2-0 | Meteorological Research Institutea, Japan | 160 × 320 |
| NorESM2-LM | NorESM Climate modeling Consortium consisting of CICERO, Norway | 96 × 144 |
| NorESM2-MM | NorESM Climate modeling Consortium consisting of CICERO, Norway | 192 × 288 |
Table 2.
Ranking of precipitation simulation capability of 19 models.
| Model Name | T Rank | S Rank | MR Score |
|---|---|---|---|
| ACCESS-CM2 | 6 | 2 | 0.79 |
| ACCESS-ESM1-5 | 7 | 15 | 0.42 |
| BCC-CSM2-MR | 13 | 14 | 0.29 |
| CanESM5 | 17 | 19 | 0.05 |
| CESM2-WACCM | 11 | 13 | 0.37 |
| CMCC-CM2-SR5 | 9 | 17 | 0.32 |
| EC-Earth3 | 3 | 3 | 0.84 |
| EC-Earth3-Veg | 2 | 4 | 0.84 |
| GFDL-ESM4 | 16 | 16 | 0.16 |
| INM-CM4-8 | 1 | 18 | 0.50 |
| INM-CM5-0 | 5 | 5 | 0.74 |
| IPSL-CM6A-LR | 4 | 1 | 0.87 |
| KACE-1-0-G | 10 | 11 | 0.45 |
| MIROC6 | 8 | 10 | 0.53 |
| MPI-ESM1-2-HR | 14 | 12 | 0.32 |
| MPI-ESM1-2-LR | 19 | 7 | 0.32 |
| MRI-ESM2-0 | 12 | 6 | 0.53 |
| NorESM2-LM | 18 | 8 | 0.32 |
| NorESM2-MM | 15 | 9 | 0.37 |
Table 3.
Variable Statistics of Drought Characteristics in sub-basins of the Yangtze River basin, 1981–2010.
Table 3.
Variable Statistics of Drought Characteristics in sub-basins of the Yangtze River basin, 1981–2010.
| Time Scale | Sub-Basin | Number of Drought Events Per Unit Grid Point | Average Duration (Month) | Average Severity |
|---|---|---|---|---|
| 1-month | upstream | 1.70 | 3.16 | −4.96 |
| midstream | 1.16 | 3.13 | −4.93 | |
| downstream | 0.80 | 3.02 | −5.01 | |
| 3-month | upstream | 8.01 | 3.81 | −6.35 |
| midstream | 7.85 | 3.77 | −6.09 | |
| downstream | 7.50 | 3.79 | −6.00 | |
| 6-month | upstream | 7.57 | 5.20 | −8.53 |
| midstream | 7.76 | 4.96 | −7.67 | |
| downstream | 7.09 | 5.06 | −7.92 | |
| 12-month | upstream | 5.78 | 8.81 | −14.01 |
| midstream | 6.66 | 7.37 | −11.07 | |
| downstream | 6.57 | 7.51 | −11.43 |
Publisher’s Note: MDPI stays neutral with regard to jurisdictional claims in published maps and institutional affiliations. |
© 2022 by the authors. Licensee MDPI, Basel, Switzerland. This article is an open access article distributed under the terms and conditions of the Creative Commons Attribution (CC BY) license (https://creativecommons.org/licenses/by/4.0/).
Share and Cite
MDPI and ACS Style
Yu, J.; Zhou, H.; Huang, J.; Yuan, Y. Prediction of Multi-Scale Meteorological Drought Characteristics over the Yangtze River Basin Based on CMIP6. Water 2022, 14, 2996. https://doi.org/10.3390/w14192996
AMA Style
Yu J, Zhou H, Huang J, Yuan Y. Prediction of Multi-Scale Meteorological Drought Characteristics over the Yangtze River Basin Based on CMIP6. Water. 2022; 14(19):2996. https://doi.org/10.3390/w14192996
Chicago/Turabian StyleYu, Jiaxin, Han Zhou, Jiejun Huang, and Yanbin Yuan. 2022. "Prediction of Multi-Scale Meteorological Drought Characteristics over the Yangtze River Basin Based on CMIP6" Water 14, no. 19: 2996. https://doi.org/10.3390/w14192996
Note that from the first issue of 2016, this journal uses article numbers instead of page numbers. See further details here.