
New Stage–Discharge Relationship for Triangular Broad-Crested Weirs

Department of Agricultural, Food and Forest Sciences, University of Palermo, Viale delle Scienze, Building 4, 90128 Palermo, Italy
*
Author to whom correspondence should be addressed.
Water 2022, 14(19), 2993; https://doi.org/10.3390/w14192993
Submission received: 6 September 2022
/
Revised: 16 September 2022
/
Accepted: 19 September 2022
/
Published: 23 September 2022
(This article belongs to the Section Hydraulics and Hydrodynamics)
Abstract
:Simple hydraulic structures, such as weirs, allow measuring flow discharge by using the upstream flow depth and a stage–discharge relationship. In this relationship, a discharge coefficient is introduced to correct all the effects neglected in the derivation (viscosity, surface tension, velocity head in the approach channel, flow turbulence, non-uniform velocity profile, and streamline curvature due to weir contraction). In this paper, the dimensional analysis and the incomplete self-similarity theory are used to investigate the outflow process of triangular broad-crested weirs, characterized by different values of the ratio between crest height p and channel width B, and to theoretically deduce a new stage–discharge relationship. A new theoretical stage–discharge relationship is suggested for the free-flow condition, and it is tested using experimental data available in the literature for the hydraulic condition p/B > 0. The obtained stage–discharge equation, characterized by low errors in discharge estimate, is useful for laboratory and field investigations. Finally, specific analysis for the triangular broad-crested weirs with p/B > 0 was developed to modify the stage–discharge relationship obtained for the case p/B = 0. This specific stage–discharge relationship allows to reduce the errors, which are generally less than ±5%, in the estimate of discharge for triangular broad-crested weirs with p/B > 0 and is also applicable for the case p/B = 0.
1. Introduction
Flow measurement in open channels is an old and well-studied hydraulic topic that has a lot of practical involvements, such as the management of irrigation and drainage systems, and control of irrigation water. Field discharge measurements are also useful to verify if an irrigation system operates correctly. Weirs of different shapes are employed to measure discharge conveyed or to regulate the upstream water levels in irrigation channels [1,2,3] and have been extensively investigated in laboratory applications [2,4,5,6,7,8,9,10].
Simple hydraulic structures, such as weirs, allow obtaining the flow discharge Q by using the upstream flow depth h, measured from the horizontal plane localized at the weir crest [11]. The stage–discharge relationship, i.e., the relationship between discharge Q and h, is primarily dependent on the shape and size of the weir [4,6,8,9,12,13,14].
Weirs with different cross-section shapes, having a finite crest length, are classified [12,13,14,15] according to the h/Ld ratio, where Ld is the crest length, into the following four groups: long-crested weirs (0 < h/Ld < 0.1), broad-crested weirs (0.1 < h/Ld < 0.4), short-crested weirs (0.4 < h/Ld < 2), and sharp-crested weirs (h/Ld > 2).
For broad-crested weirs, the stage–discharge relationship is often derived from the energy balance [11,16,17] and the classical theoretical solution of the efflux problem [18,19] is obtained neglecting both the upstream velocity head (i.e., the upstream energy head is equal to h) and the energy losses between the cross-section upstream the weir where h is measured and the cross-section within the crest length in which the critical flow condition occurs. In other words, the upstream energy head, assumed to be coincident with h, is equal to the energy head E of the critical flow within the crest length. This theoretical solution (E = h) must be adjusted to consider the difference between the theoretical outflow velocity and the measured one. To this aim, the concepts of vena contracta [19] and the measured discharge coefficient Cd, less than the unit, are used [20]. Many authors [3,21,22] studied the discharge coefficient, which includes all the effects neglected in the derivation (viscosity, surface tension, velocity head in the approach channel, flow turbulence, non-uniform velocity profile, and streamline curvature due to weir contraction) of the stage–discharge equation.
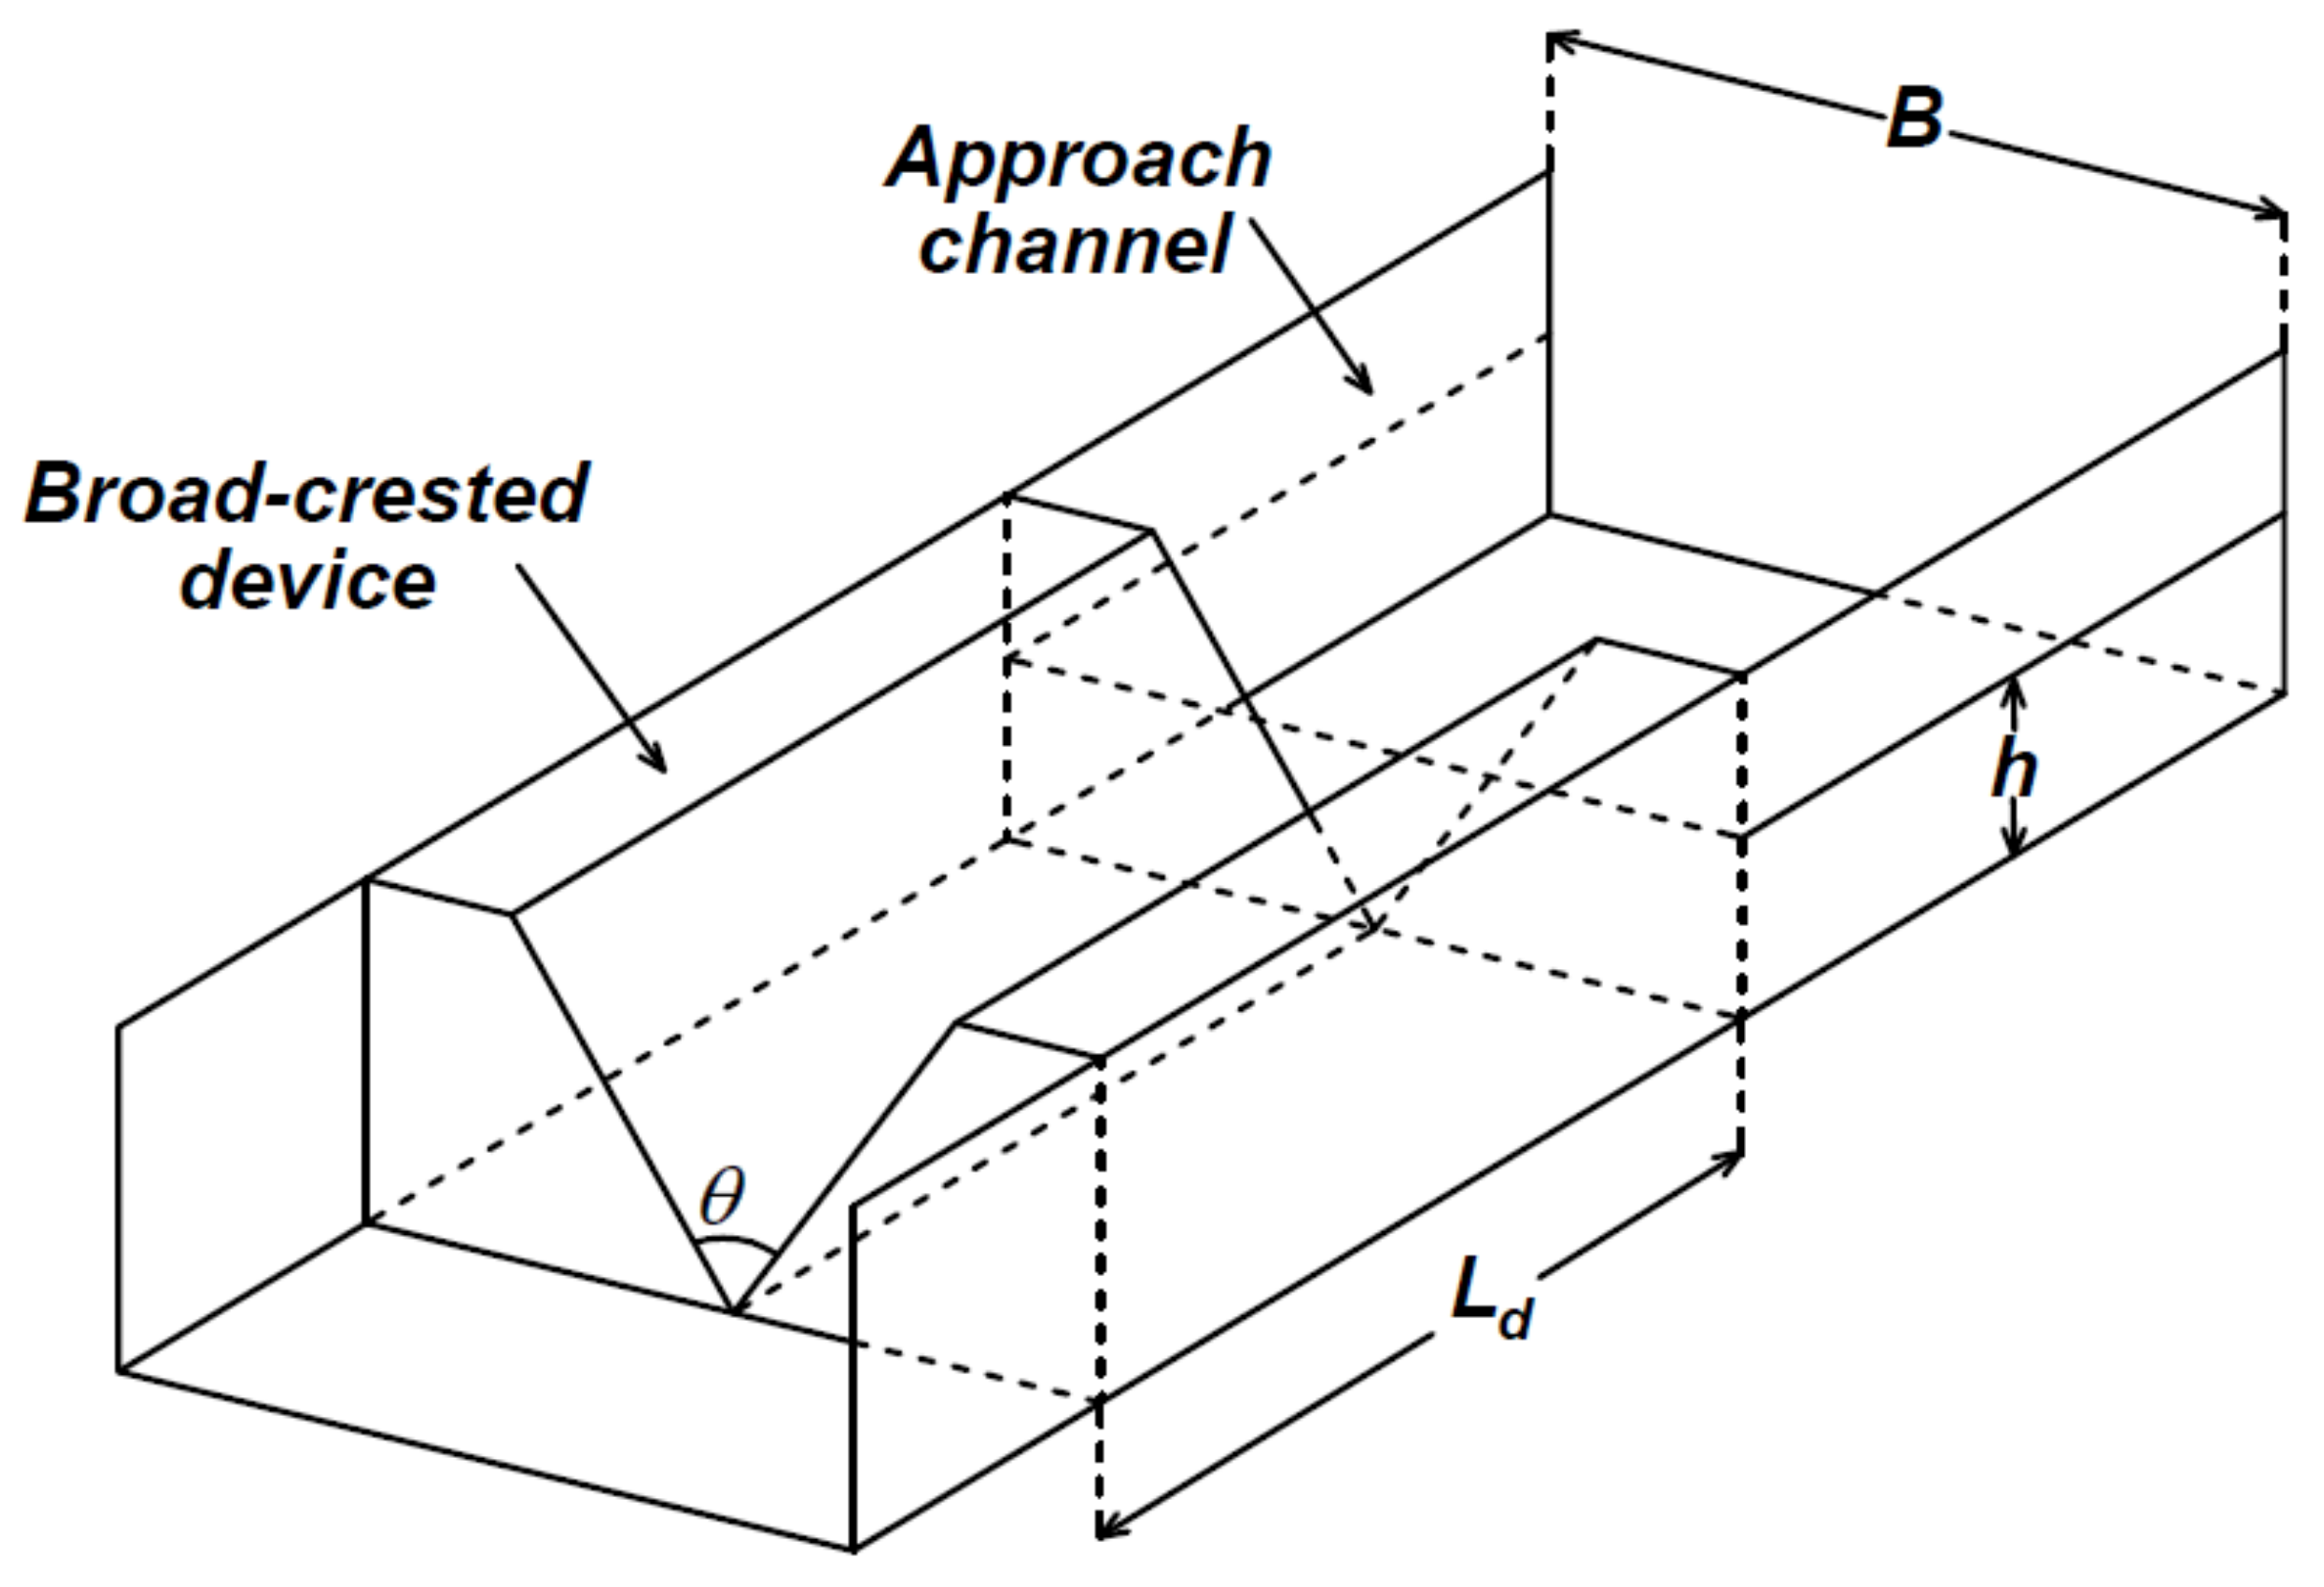
The triangular broad-crested weir (Figure 1) combines the advantages of a triangular weir, which can be used to measure accurately small flows and is also capable of conveying large discharge without a high increase in the upstream water depth, with those of a broad-crested weir which is unaffected by downstream submergence up to critical water depth [23]. Notwithstanding the described advantages of this type of weir, few investigations on triangular broad-crested weir with crest height p have been carried out [23,24,25,26].
Smith and Liang [23] carried out some experimental runs by a 90° V-notch broad-crested weir with four different values of the weir length. Other authors determined the stage–discharge relationship using an energy approach [11,17] coupled with the condition that the critical depth k for a triangular channel is 4/5 of its critical energy head E.
For the critical cross-section inside the broad-crested triangular weir having an apex angle θ (Figure 1), if the upstream velocity head and the head loss between the cross-section upstream the weir where h is measured and the critical section (E = h) are neglected, the discharge Q is given by
Equation (1) can be rearranged obtaining the following stage–discharge relationship:
in which m = tan (θ/2).
For a 90° V-notch broad-crested weir (m = 1), Equation (2) becomes
which is strictly applicable if the following four conditions are satisfied: (i) the head loss between the cross-section where h is measured, and the critical section is negligible; (ii) flow over the weir crest occurs with parallel streamlines and a hydrostatic pressure distribution; (iii) the velocity distribution is uniform; and (iv) submergence effects do not affect the stage–discharge relationship (free-flow condition). Smith and Liang [23] suggested using a stage–discharge relationship with the same mathematical shape of Equation (3) Q = C h5/2, in which C is a weir coefficient which was experimentally determined, and which adjusts the deviations from the four listed conditions to be satisfied.
Boiten and Pitlo [24] carried out measurements with a V-shaped broad-crested weir with apex angles of 90°, 120°, 150° and 180° for free and submerged flow conditions. The theoretical derived stage–discharge relationship for the free-flow condition was corrected introducing a characteristic discharge coefficient obtained by a large collection of laboratory data. This study demonstrated that the discharge coefficient is affected by boundary layer effects (crest roughness, lateral pressure gradients upstream and downstream of the critical cross-section, and lateral contraction upstream of the critical cross-section). For each apex angle, a relationship between the discharge coefficient and the h/Ld ratio was plotted.
Hoseini [25] experimentally studied the discharge coefficient of triangular broad-crested weirs having p = 0.2 m and three different values of the apex angle. These authors established a relationship between the discharge coefficient Cd, the ratio h/Ld, and the flow Froude number. The proposed relationship was calibrated by the measurements of all investigated apex angles, and this choice could justify the limited agreement between the calculated and measured discharge coefficient values. Furthermore, the proposed relationship involves the Froude number, which is generally unknown when a flowmeter problem has to be solved.
Lately, Achour and Amara [21] investigated a triangular broad-crested weir with p = 0 with a self-cleaning and semi-modular hydraulic behavior. The primary objective of their investigation was theoretically deriving the Q-h equation and Cd considering the influence of the approach flow velocity. The theoretical stage–discharge relationship suggested by these authors takes into account the geometrical characteristics of both the device and the approach channel. This stage–discharge relationship is characterized by a low systematic underestimation (−0.57%) of the measured discharge.
Recently, Ferro [8,26] analyzed the outflow process of weirs characterized by different geometrical shapes (triangular, Bazin, etc.), and applied the dimensional analysis and the self-similarity theory [27,28] to theoretically deduce the stage–discharge equation. Equation (2) can be rearranged to obtain the stage–discharge relationship as follows:
in which B is the channel width.
For a triangular broad-crested device without crest height, Nicosia and Ferro [29] proposed the following theoretical stage–discharge relationship:
which was calibrated and tested using the experimental data of Achour and Amara [21]. This new stage–discharge relationship is characterized by errors in the estimate Er, which are not systematic and are very low (ranging from −0.60% to 0.55%) and are normally distributed.
In the present paper, the stage–discharge equation for triangular broad-crested weirs was theoretically deduced applying Buckingham’s theorem and the self-similarity theory. The experimental data by Delft Hydraulics Laboratory [30], Boiten and Pitlo [24], and Achour and Amara [21] were used to estimate the coefficients of the new stage–discharge relationship. The main aim of this analysis is considering, in the obtained equation, the effects of the dimensionless height of the weir crest, differently from that conducted by Nicosia and Ferro [29].
2. Deduction of the Theoretical Stage–Discharge Relationship for Triangular Broad-Crested Weirs
For triangular broad-crested weir (Figure 1), the following functional equation can represent the Q-h relationship:
in which F is a functional symbol, h is the upstream water depth, which is less than or equal to the height H of the triangular weir (Figure 1) and ρ, μ, and σ are respectively the density, viscosity, and surface tension of water.
Since Equation (6) expresses a physical phenomenon that is independent of the choice of measurement units, according to the Π-theorem [27,28], it can be rewritten in a dimensionless form as follows:
in which 𝜙 is a functional symbol and Π1, Π2, Π3, Π4, Π5, Π6, and Π7 are dimensionless groups.
Introducing B, g, and ρ as dimensional independent variables, the following dimensionless groups are obtained [28]:
Coupling Equations (9) and (12), a new dimensionless group can be obtained:
where Re is the Reynolds number.
From Π1 and Π6, the following dimensionless group can be deduced:
where We is the Weber number.
The dimensionless group Π7 is
Considering that some groups were coupled to obtain other dimensionless groups, which are common in hydraulics, Equation (7) assumes the following form:
in which f is a functional symbol.
Considering the above-derived expression of each dimensionless group, Equation (17) can be rewritten as
Since for triangular broad-crested weirs, the Reynolds and Weber numbers have negligible influence, except for very low values of h [31,32,33,34], Equation (18) becomes
Considering that the influence of Ld is not significant if the ratio h/Ld satisfies the broad-crested criteria [14,15], the functional relationship (19) becomes
Applying the self-similarity condition [28] and replacing the dimensionless group Π4 with the ratio 1−p/B, which is a simple transformation of the dimensionless group Π4 [28], Equation (20) assumes the following form:
where a, b, c, and d are numerical constants to be determined experimentally. Equation (4) can be obtained as a particular case of Equation (21) with a = 0.286 √2, b = 2.5, c = 0, and d = 1, and Equation (5) can be obtained from Equation (21) with a = 0.2602 √2, b = 2.53, c = 0, and d = 1.0348.
3. Experimental Data
The theoretical stage–discharge relationship (21) was calibrated using all the available literature measurements carried out assuming a free-flow condition by Delft Hydraulics Laboratory [30], Boiten and Pitlo [24], and Achour and Amara [21].
The experimental runs of the Delft Hydraulics Laboratory [30] were performed using V-shaped broad-crested weirs, with apex angles of 90°, 120° and 150°, installed in a calibration flume with a width B = 0.80 m. All the weirs were made of P.V.C., and variations were carried out in crest length Ld (0.45 and 0.90 m), with three values of the ratio p/B (0.3125, 0.3812, 0.45), and in each of the runs, a wide range of the h/ Ld ratio was covered by changing the discharge. The available measurements correspond to 209 (h, Q) pairs, with 3.3 ≤ h ≤ 39.7 cm and 0.47 ≤ Q ≤ 128.4 L s−1. The discharge was measured by a volumetric calibration, while water levels were measured by a point gauge.
The experimental runs by Boiten and Pitlo [24] correspond to 22 (h, Q) pairs measured in the same flume of the Delft Hydraulics Laboratory using a weir with an apex angle of 90°, a crest length Ld = 0.90 m and a p/B ratio of 0.3125. Additionally, in this case, the discharge was measured by a volumetric calibration, while water levels were measured by a point gauge.
Achour and Amara [21] performed experiments in a horizontal rectangular flume (length 12 m, width 0.40 m, and depth 0.485 m), using four values of the apex angle (20°, 25°, 30°, and 43°) of the triangular broad-crested device, characterized by Ld = 0.25 m and p = 0. For this database, the top width of the weir is less than the approach channel width B (Figure 2). The authors [21] ensured the correct hydraulic behavior of the device since the used Ld allowed the occurrence of a control section inside the device. A double-precision Vernier point gauge was used to measure h, whereas an ultrasonic flowmeter was used to measure Q, for a total of 159 measurements.
For the whole original database, all the runs for which h ≤ H (flows within the triangular weir) were considered, and the available measurements (Table 1) were split into calibrating (196 data) and testing (194 data) datasets, selecting alternatively one experimental run for the calibrating dataset and one for the testing one.
4. Results and Discussion
Since the stage–discharge relationship of a triangular broad-crested weir can be assumed as a function of the upstream water depth, the weir height, and the apex angle, Equation (21) can be applied. Firstly, this stage–discharge relationship was calibrated using the 196 experimental (h, Q) pairs, corresponding to different p/B (0, 0.3125, 0.3812, 0.45) and apex angles (20°, 25°, 30°, 43°, 90°, 120°, and 150°) obtaining the following equation:
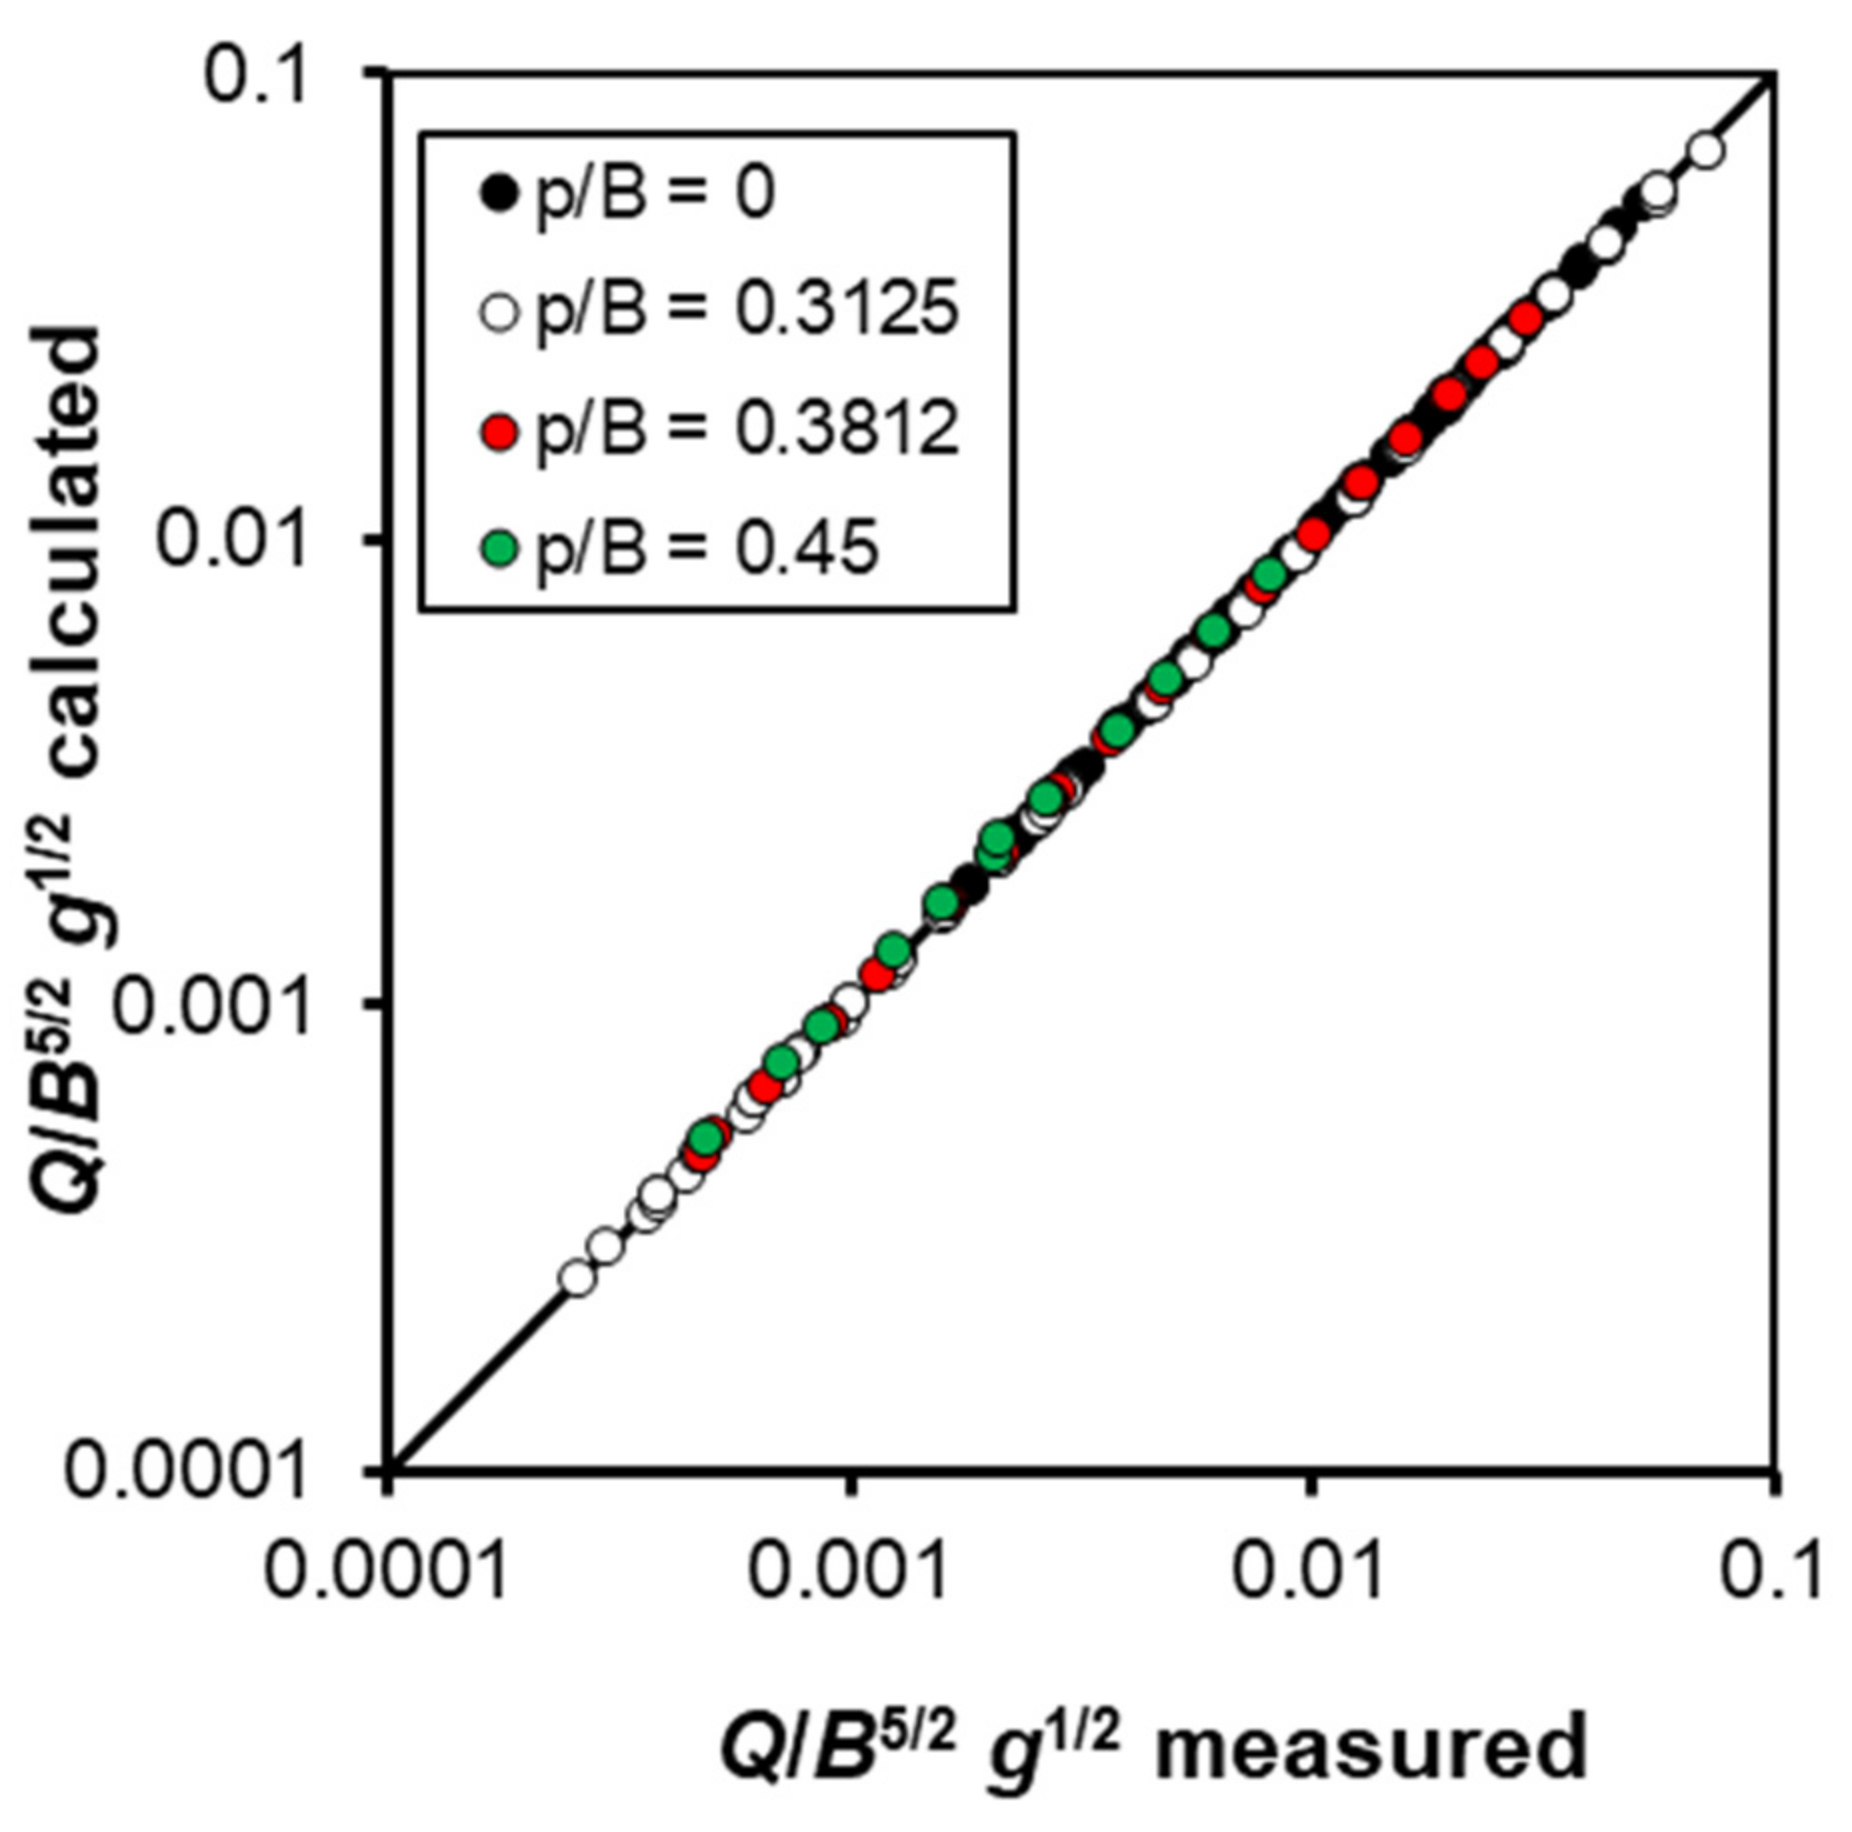
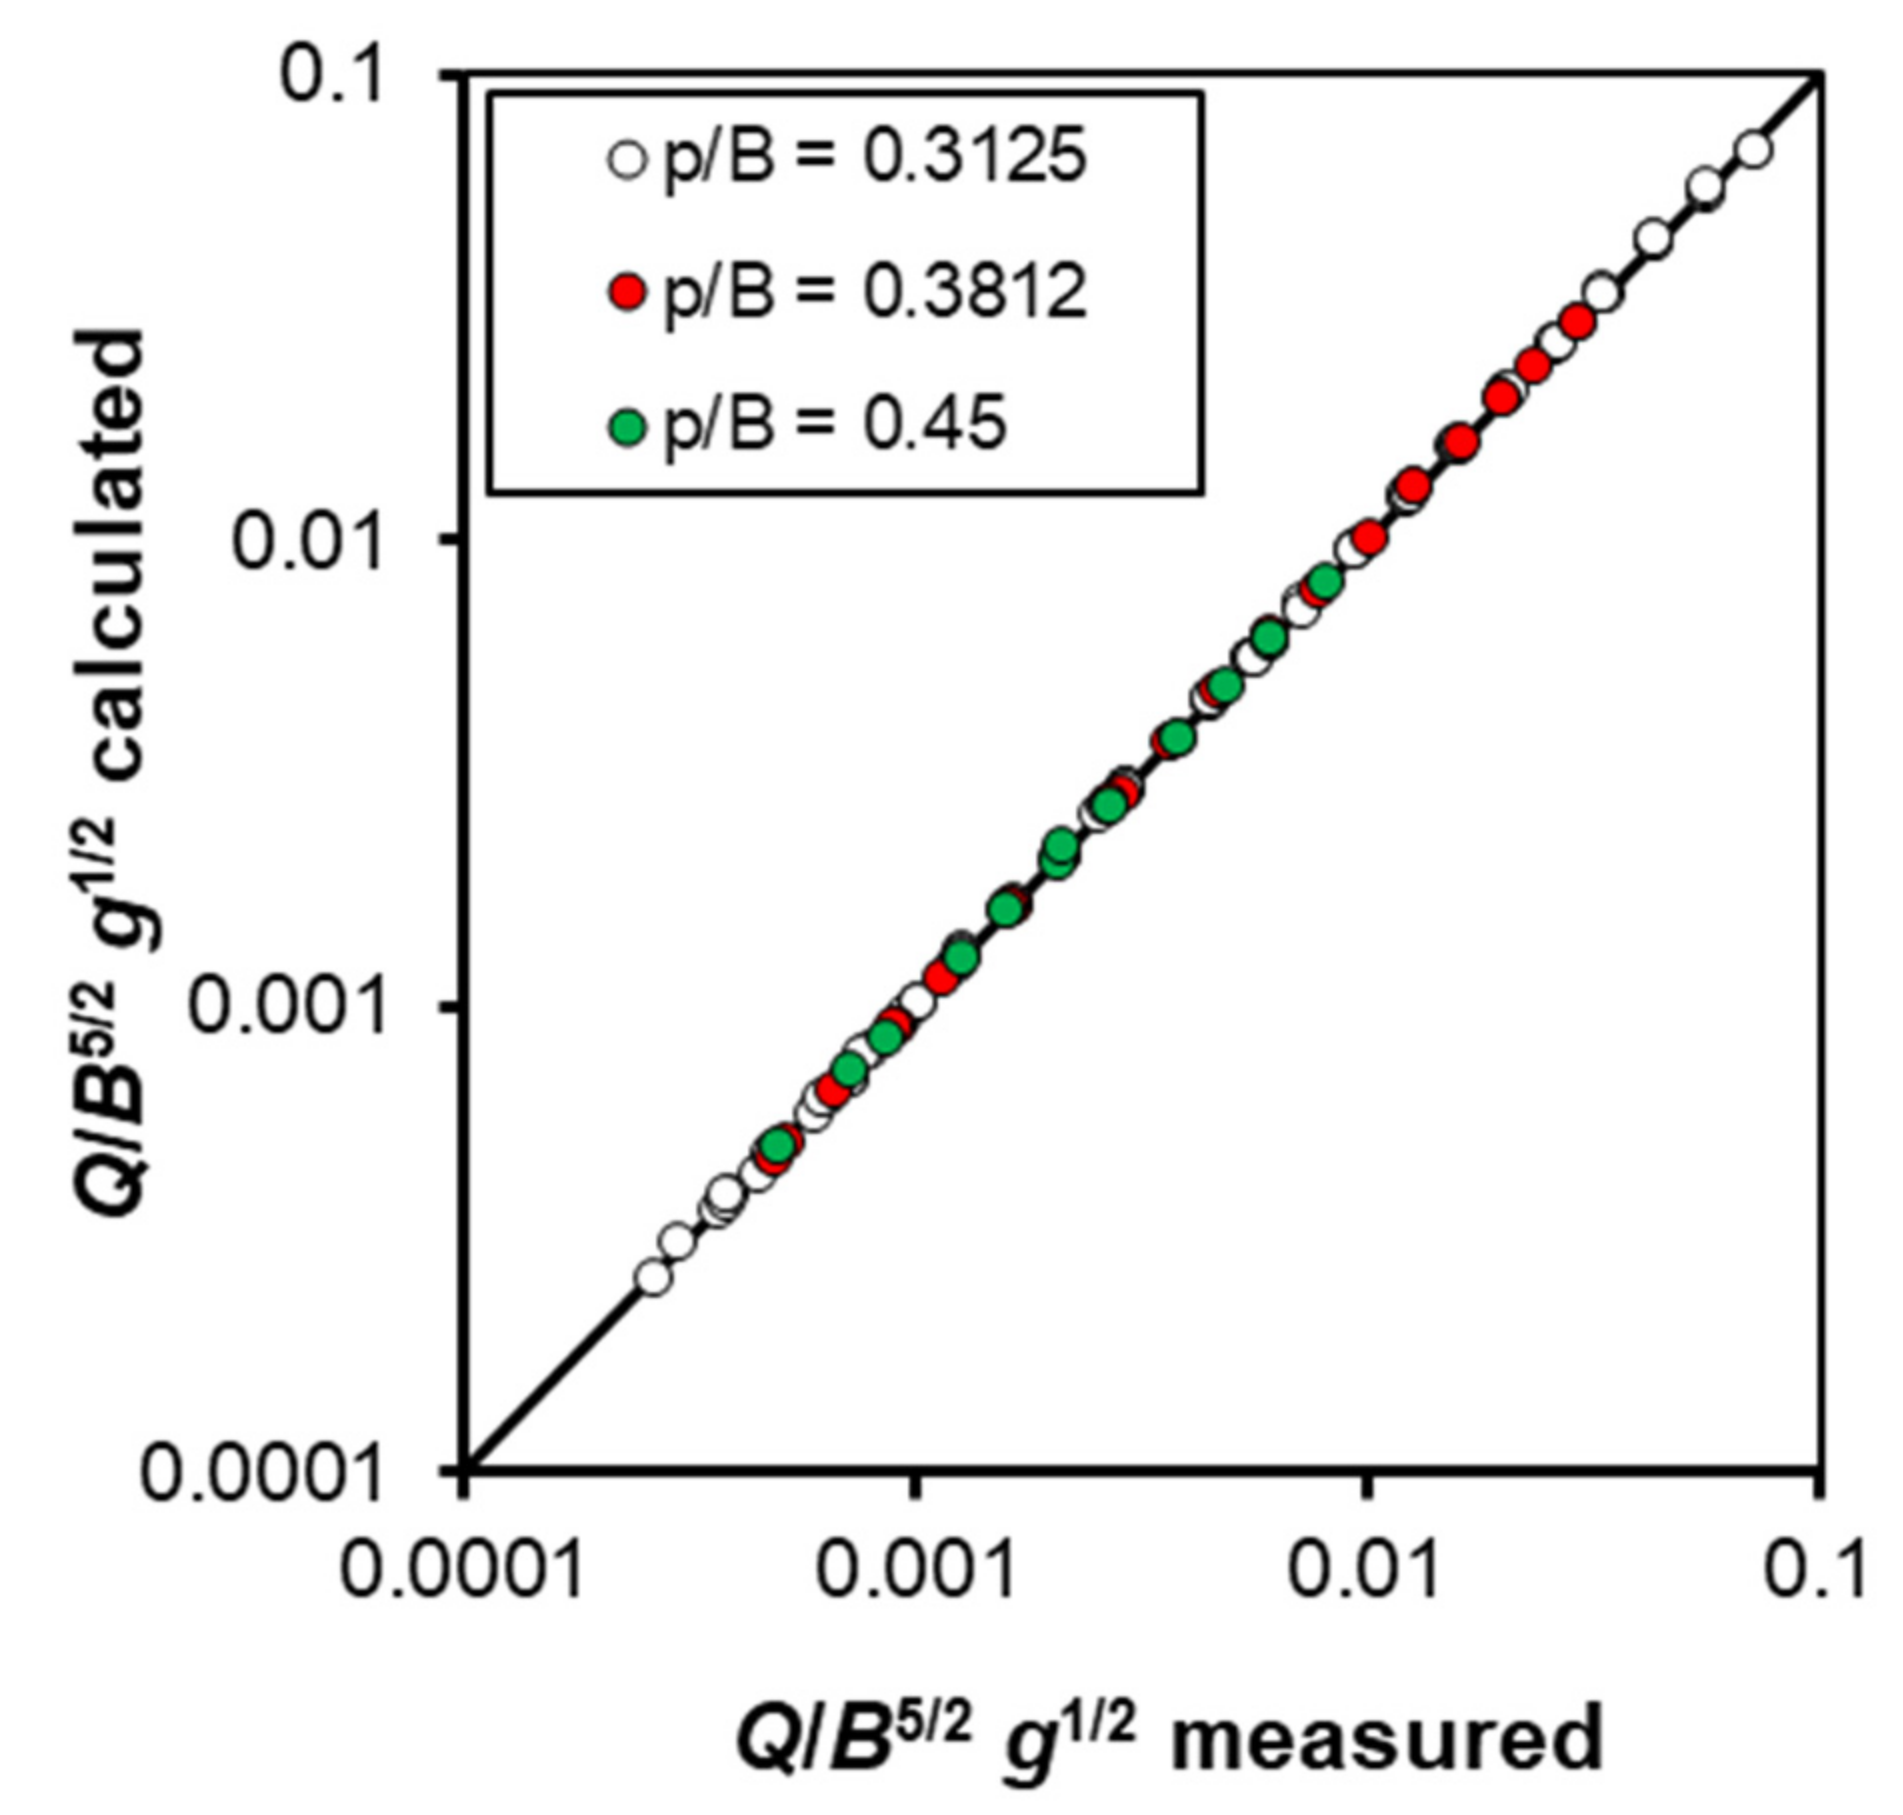
which is characterized by a determination coefficient of 0.9998 and a mean square error equal to 2.41 × 10⁻⁷. For the investigated broad-crested weirs, characterized by different p/B values, Figure 3 shows the comparison between the measured values and those calculated by Equation (22) for the calibrating dataset. This figure shows a good agreement between the measured and calculated values.
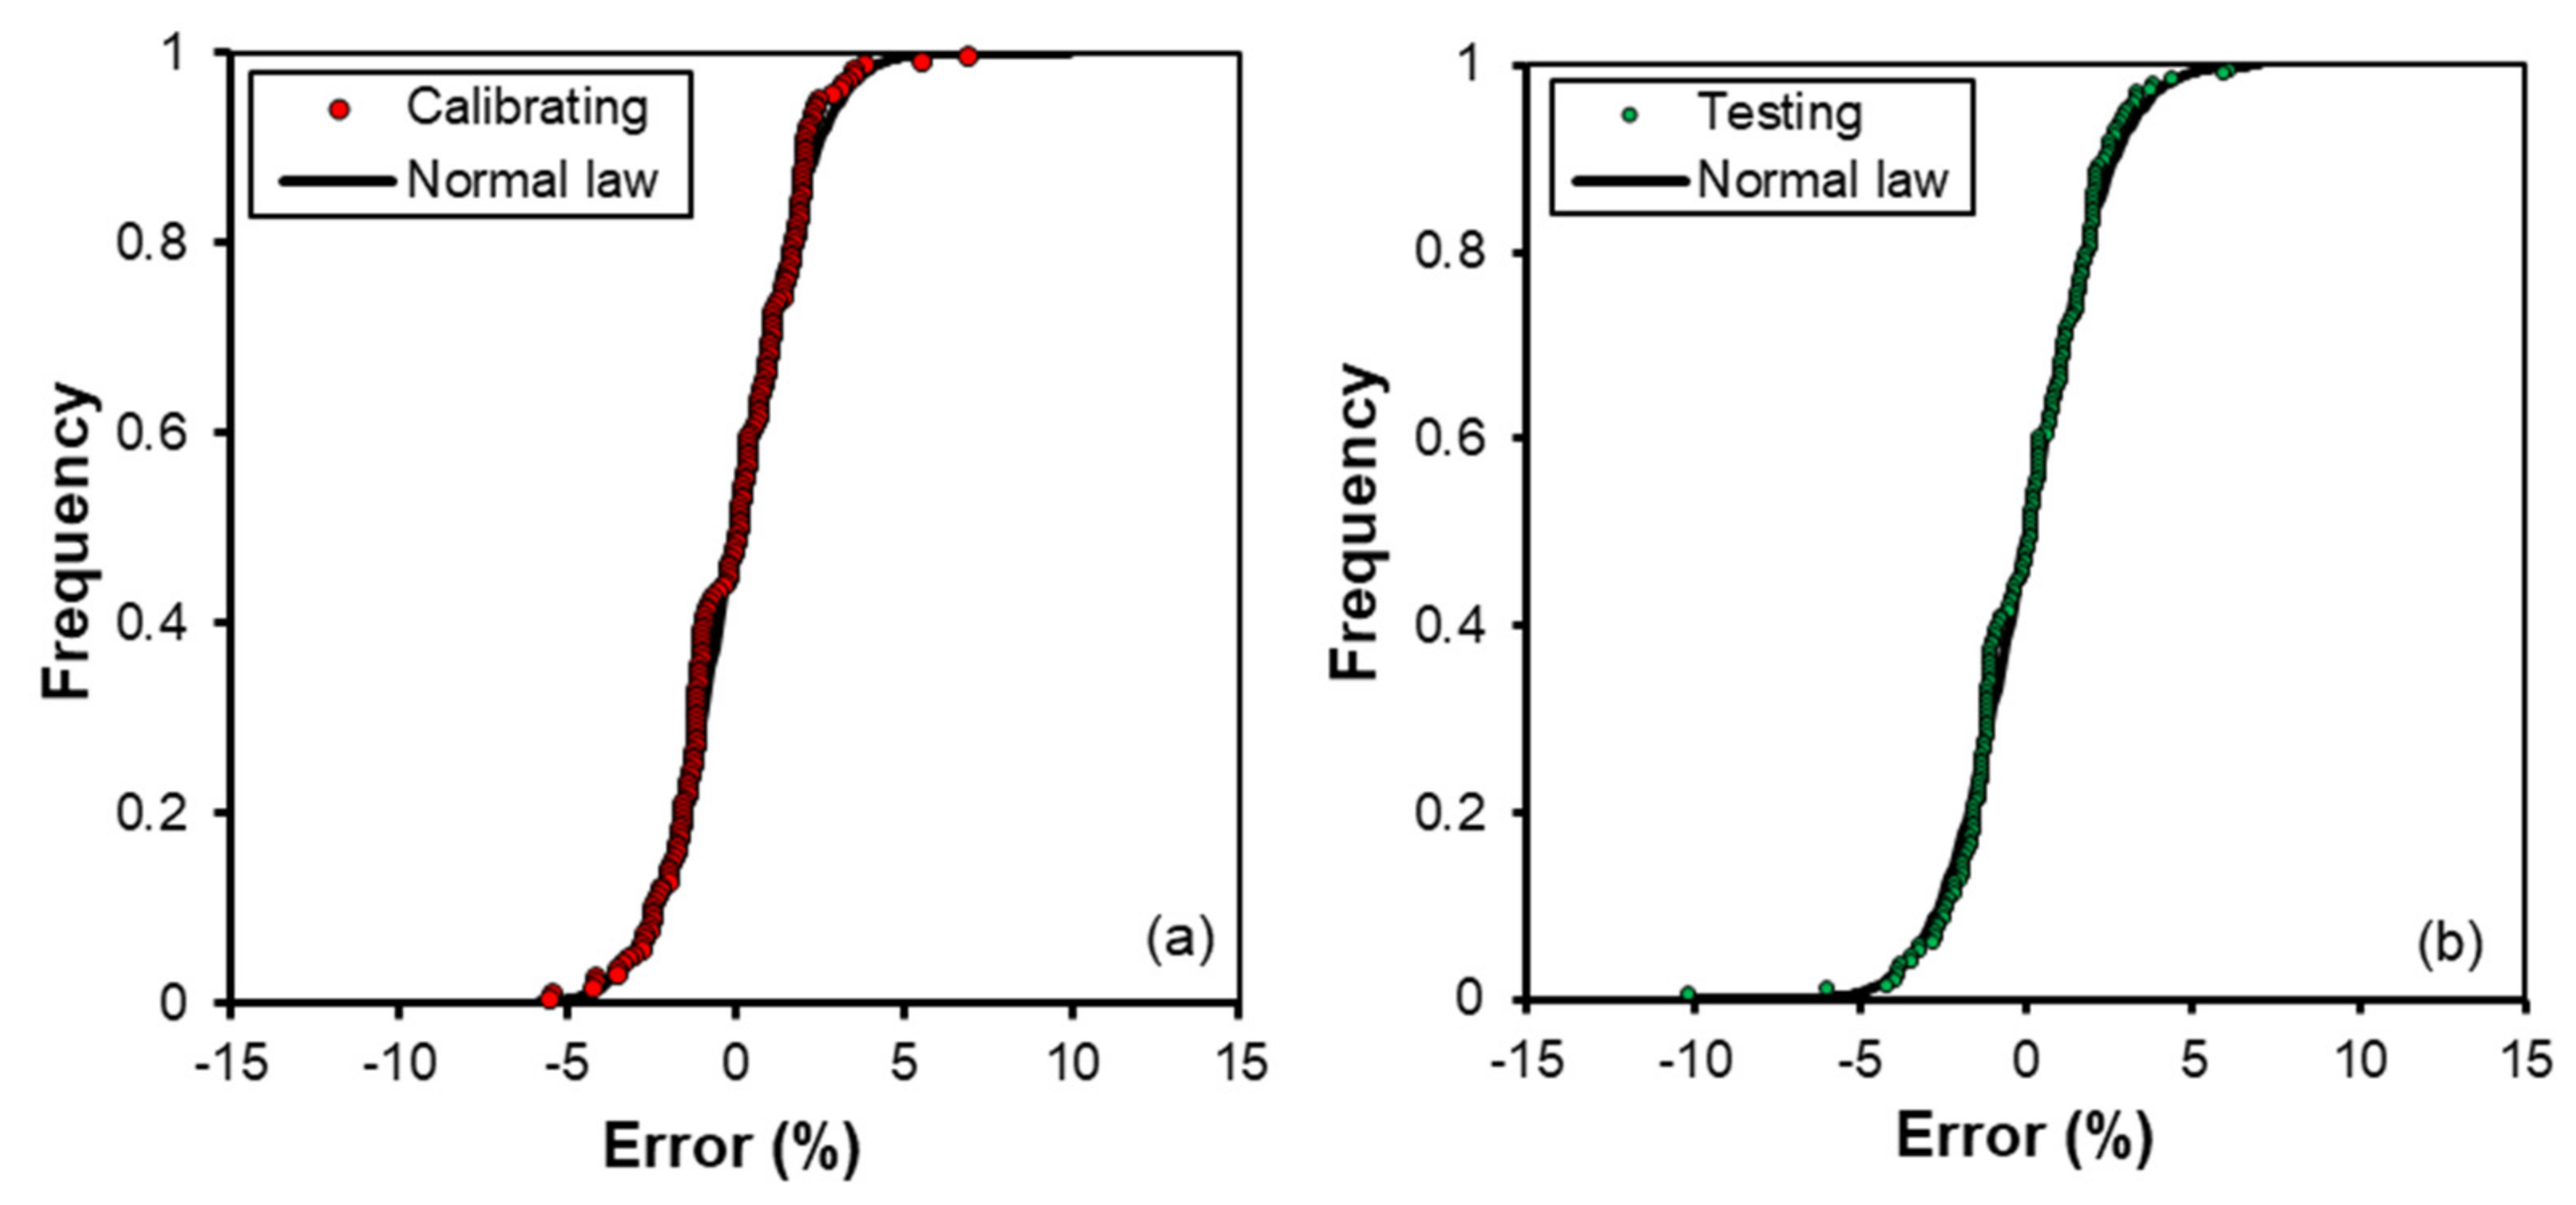
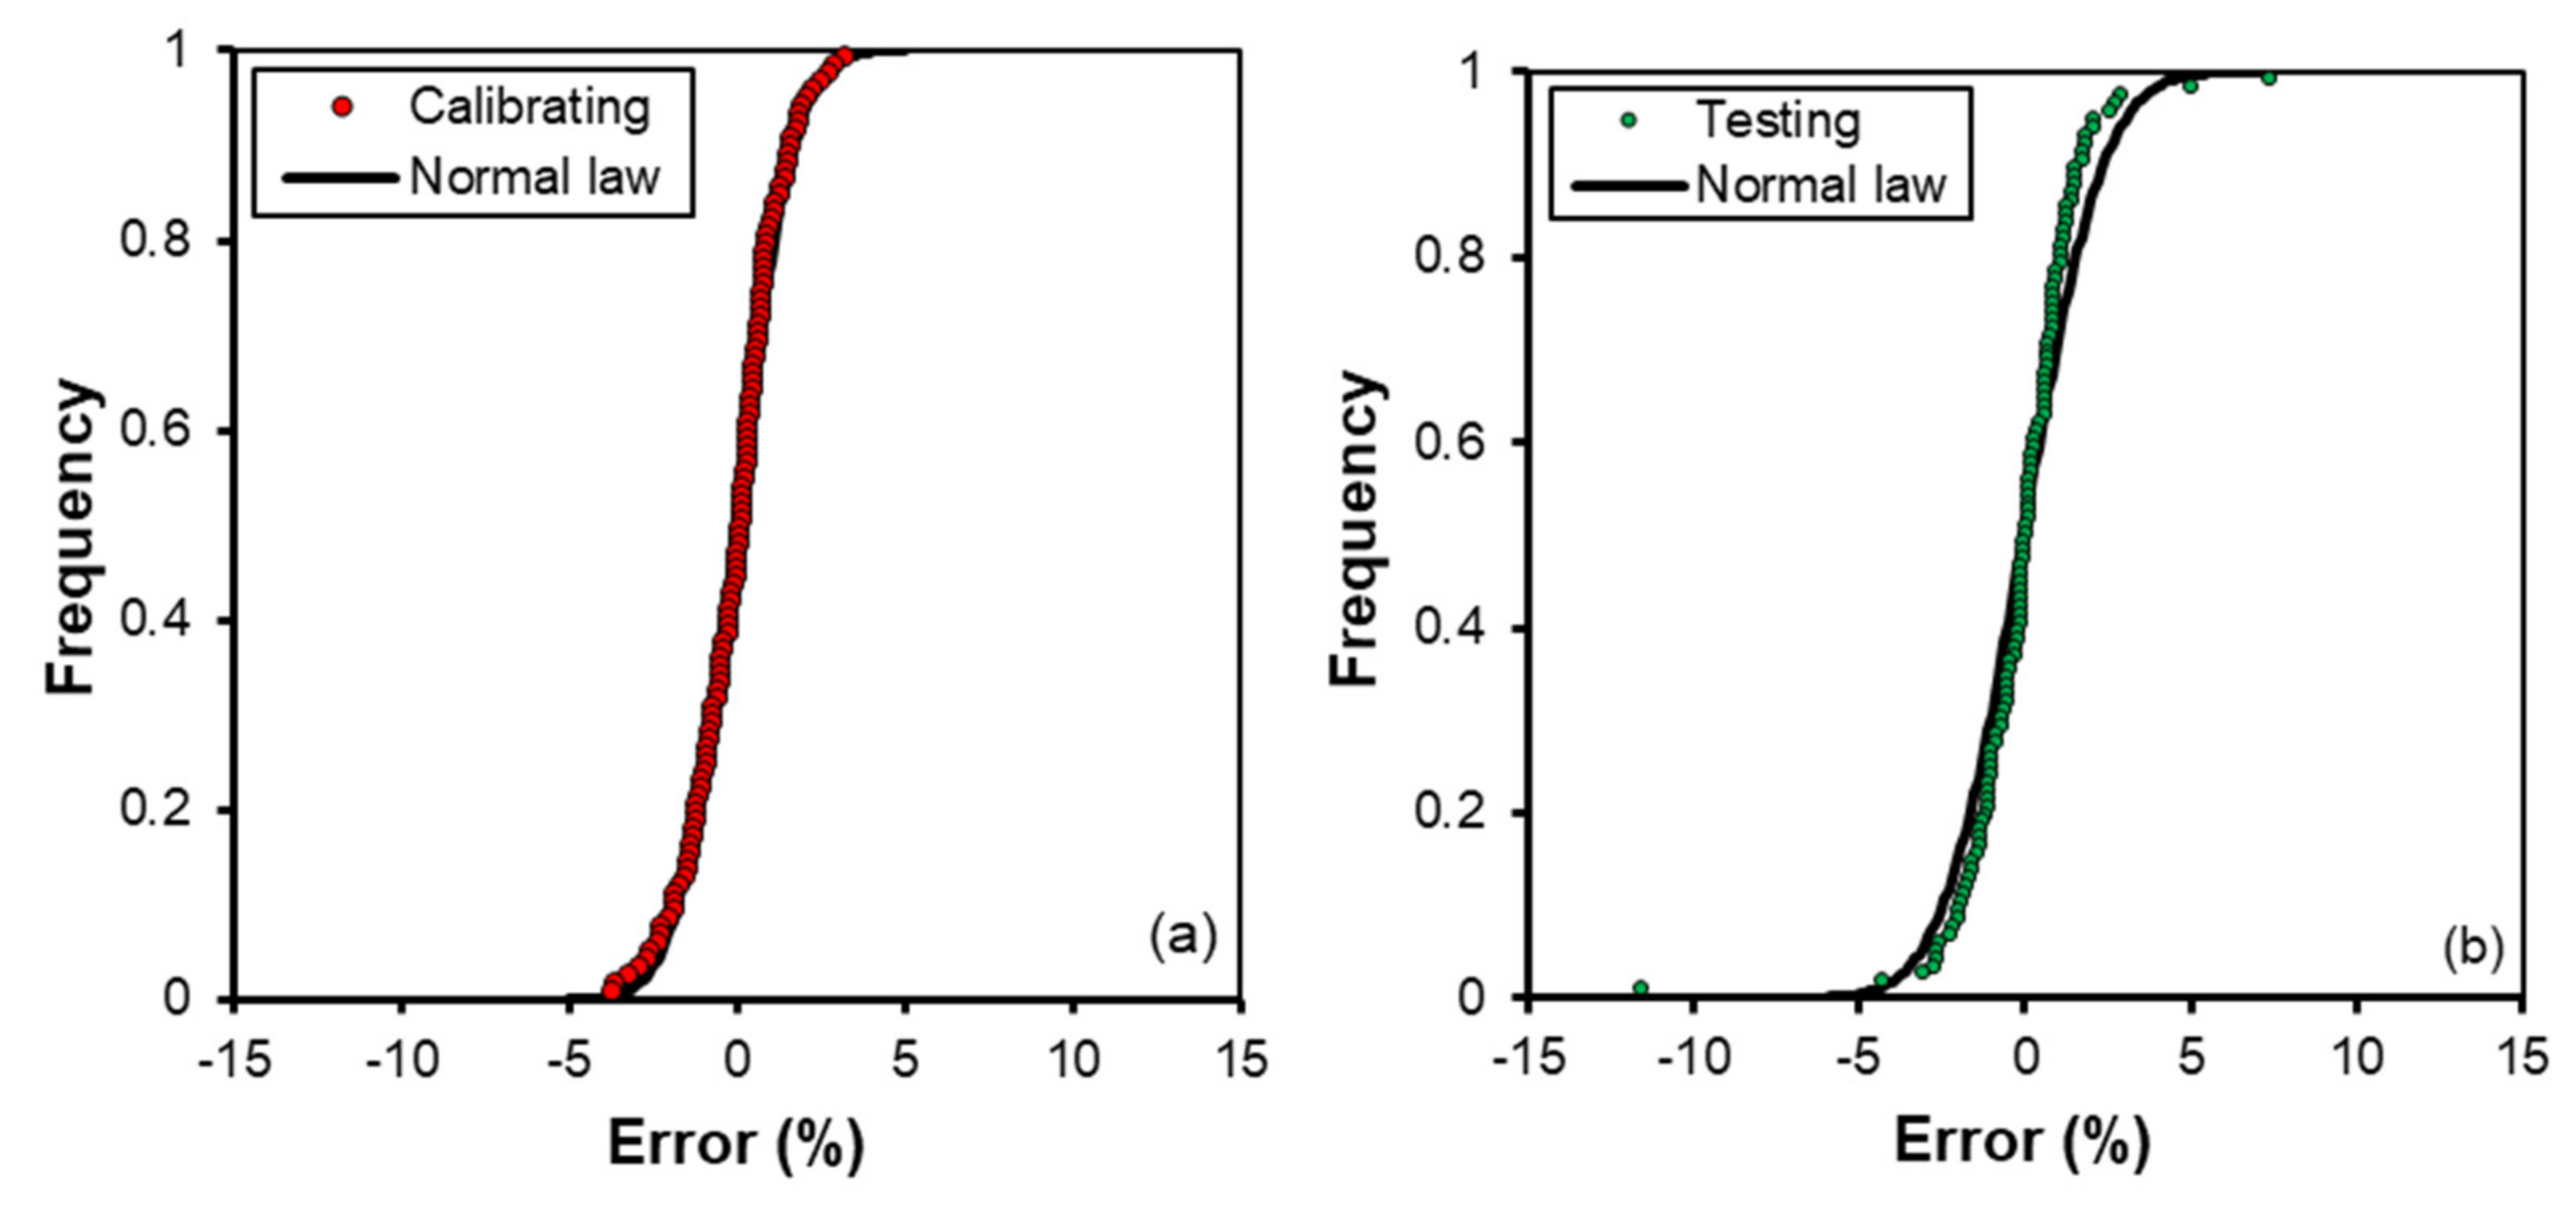
For the investigated weirs, Figure 4a demonstrates that the errors in discharge estimate Er = 100 (Qc-Qm)/Qm, in which Qm is the measured discharge and Qc is the one calculated by Equation (22), range from −5.4% to 6.9%. In particular, the errors Er are less than or equal to ±5% for 97.9% of the cases and less than or equal to ±2.5% for 87.7% of cases. Figure 4a also demonstrates that the errors Er are normally distributed, and this result was verified by the Kolmogorov–Smirnov test with a significance level of 5%. This circumstance assures that the applied (Equation (22)) is a complete model, and no other dimensionless group should be considered.
The calibrated stage–discharge relationship (Equation (22)) was also tested using other 194 experimental (h, Q) pairs, corresponding to different p/B (0, 0.3125, 0.3812, 0.45) and apex angles (20°, 25°, 30°, 43°, 90°, 120°, and 150°).
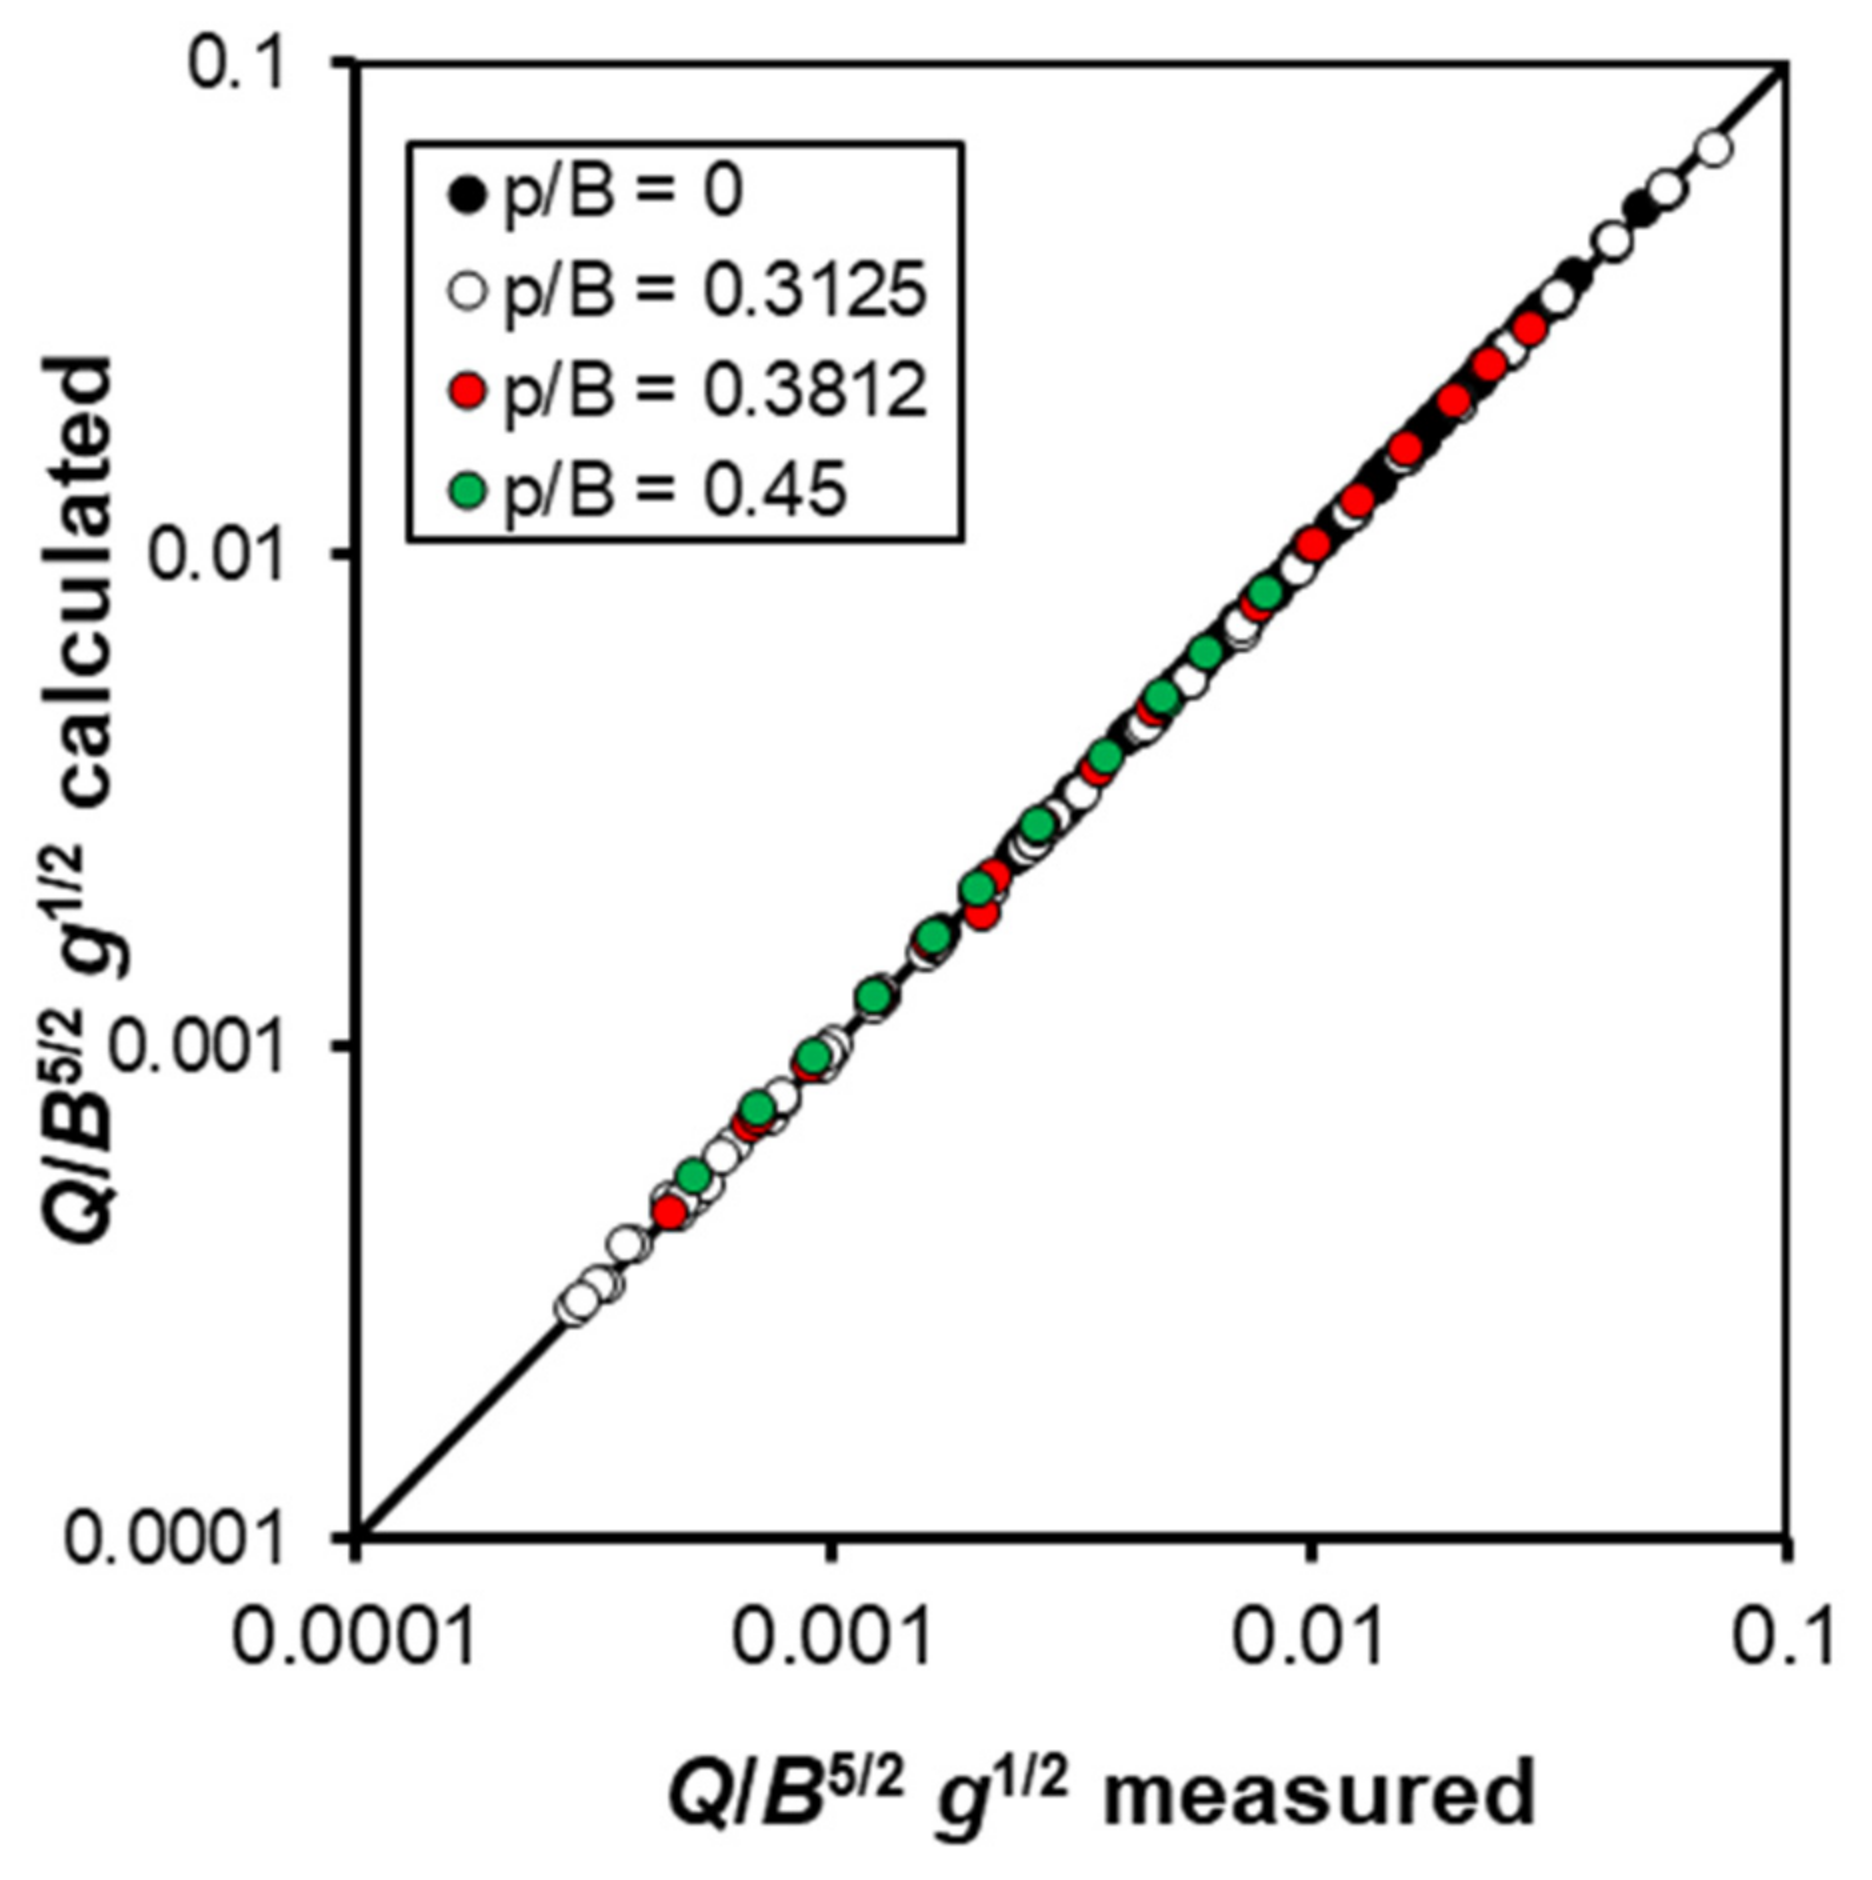
For the independent testing dataset, Figure 5 shows the comparison between the 194 measured values and those calculated by Equation (22) and demonstrates good agreement between measured and calculated values, which is characterized by a mean square error equal to 1.93 × 10⁻⁷.
For the dataset used for testing Equation (22), Figure 4b demonstrates that the errors in discharge estimate Er are low and range from −10.1% to 6.1%. In particular, the errors in discharge estimate Er are less than or equal to ±5% for 97.9% of the cases and less than or equal to ±2.5% for 83.0% of cases. Figure 4b also highlights that the errors Er are normally distributed, and this result was verified by the Kolmogorov–Smirnov test with a significance level of 5%. This result confirms that for the testing dataset, the applied Equation (22) is a complete model, and no other dimensionless group should be considered.
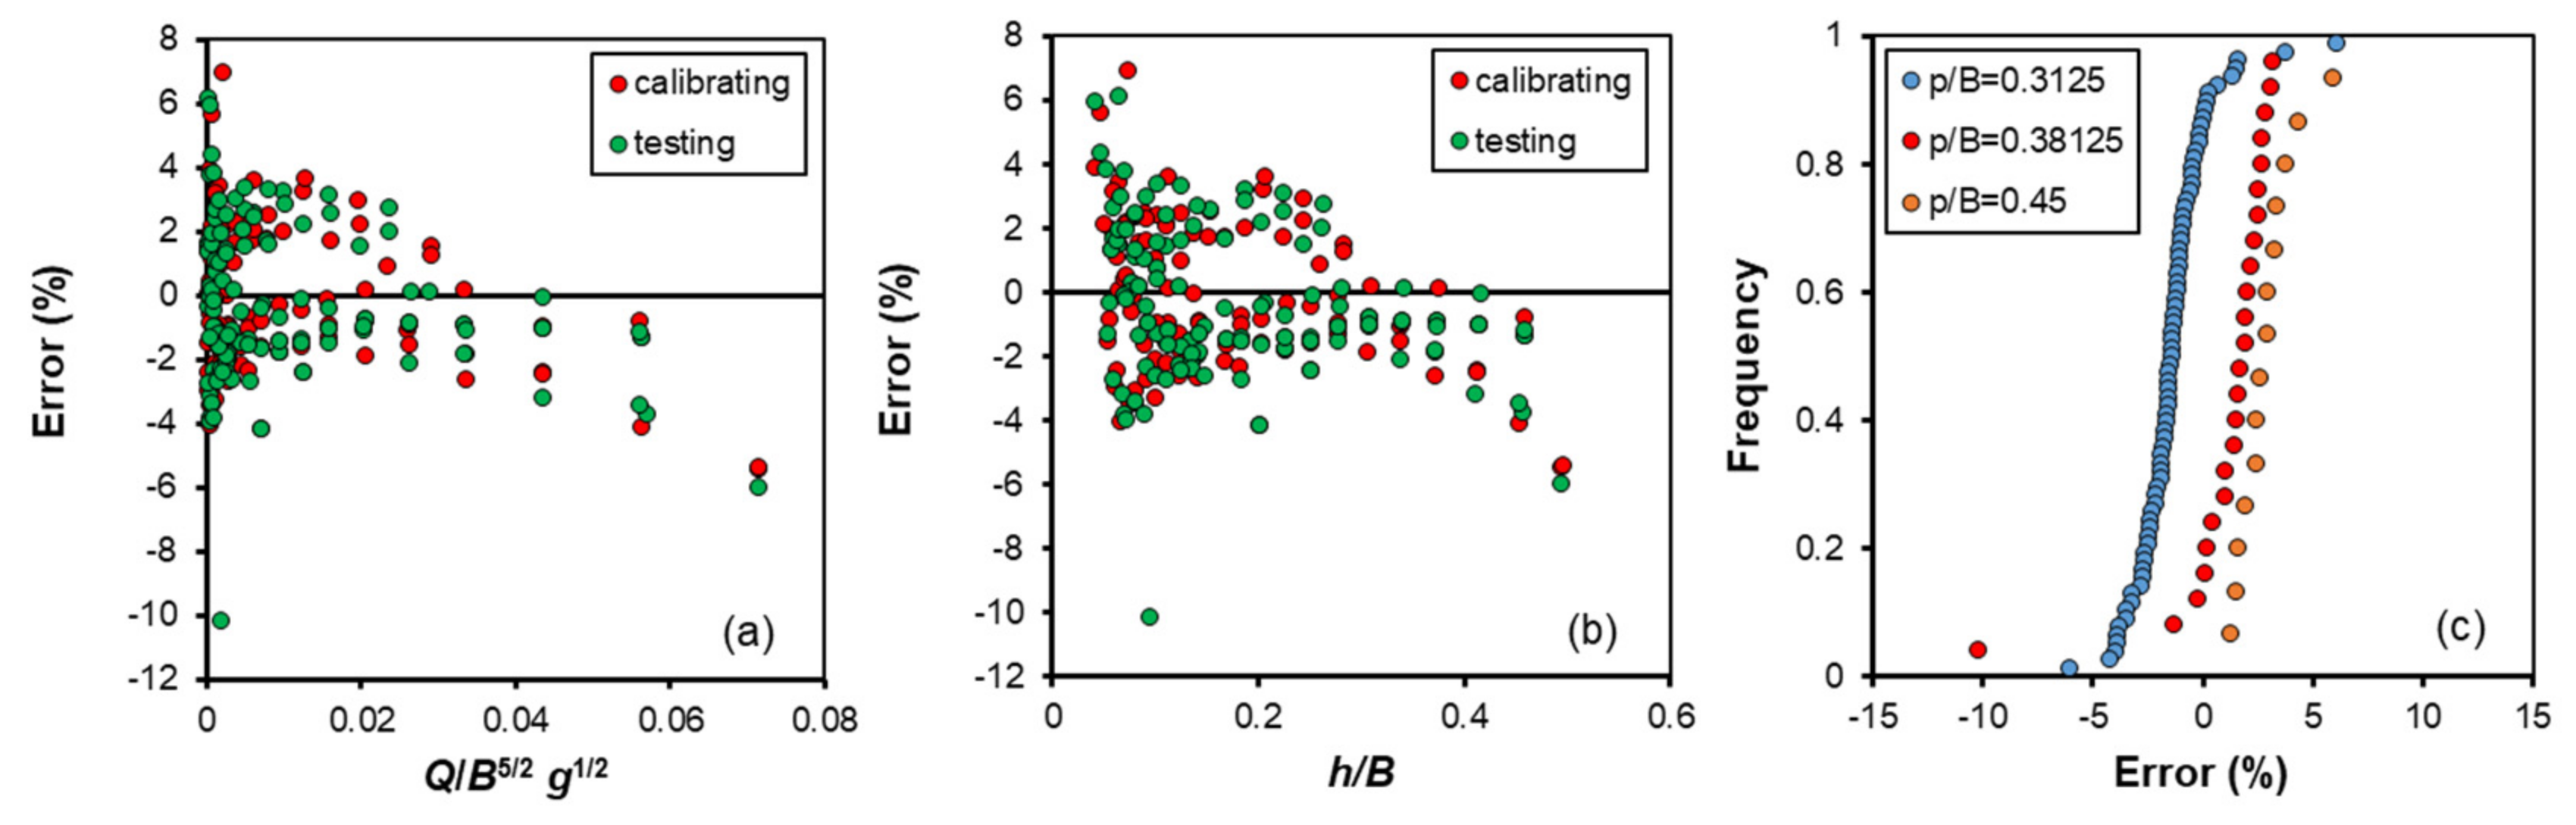
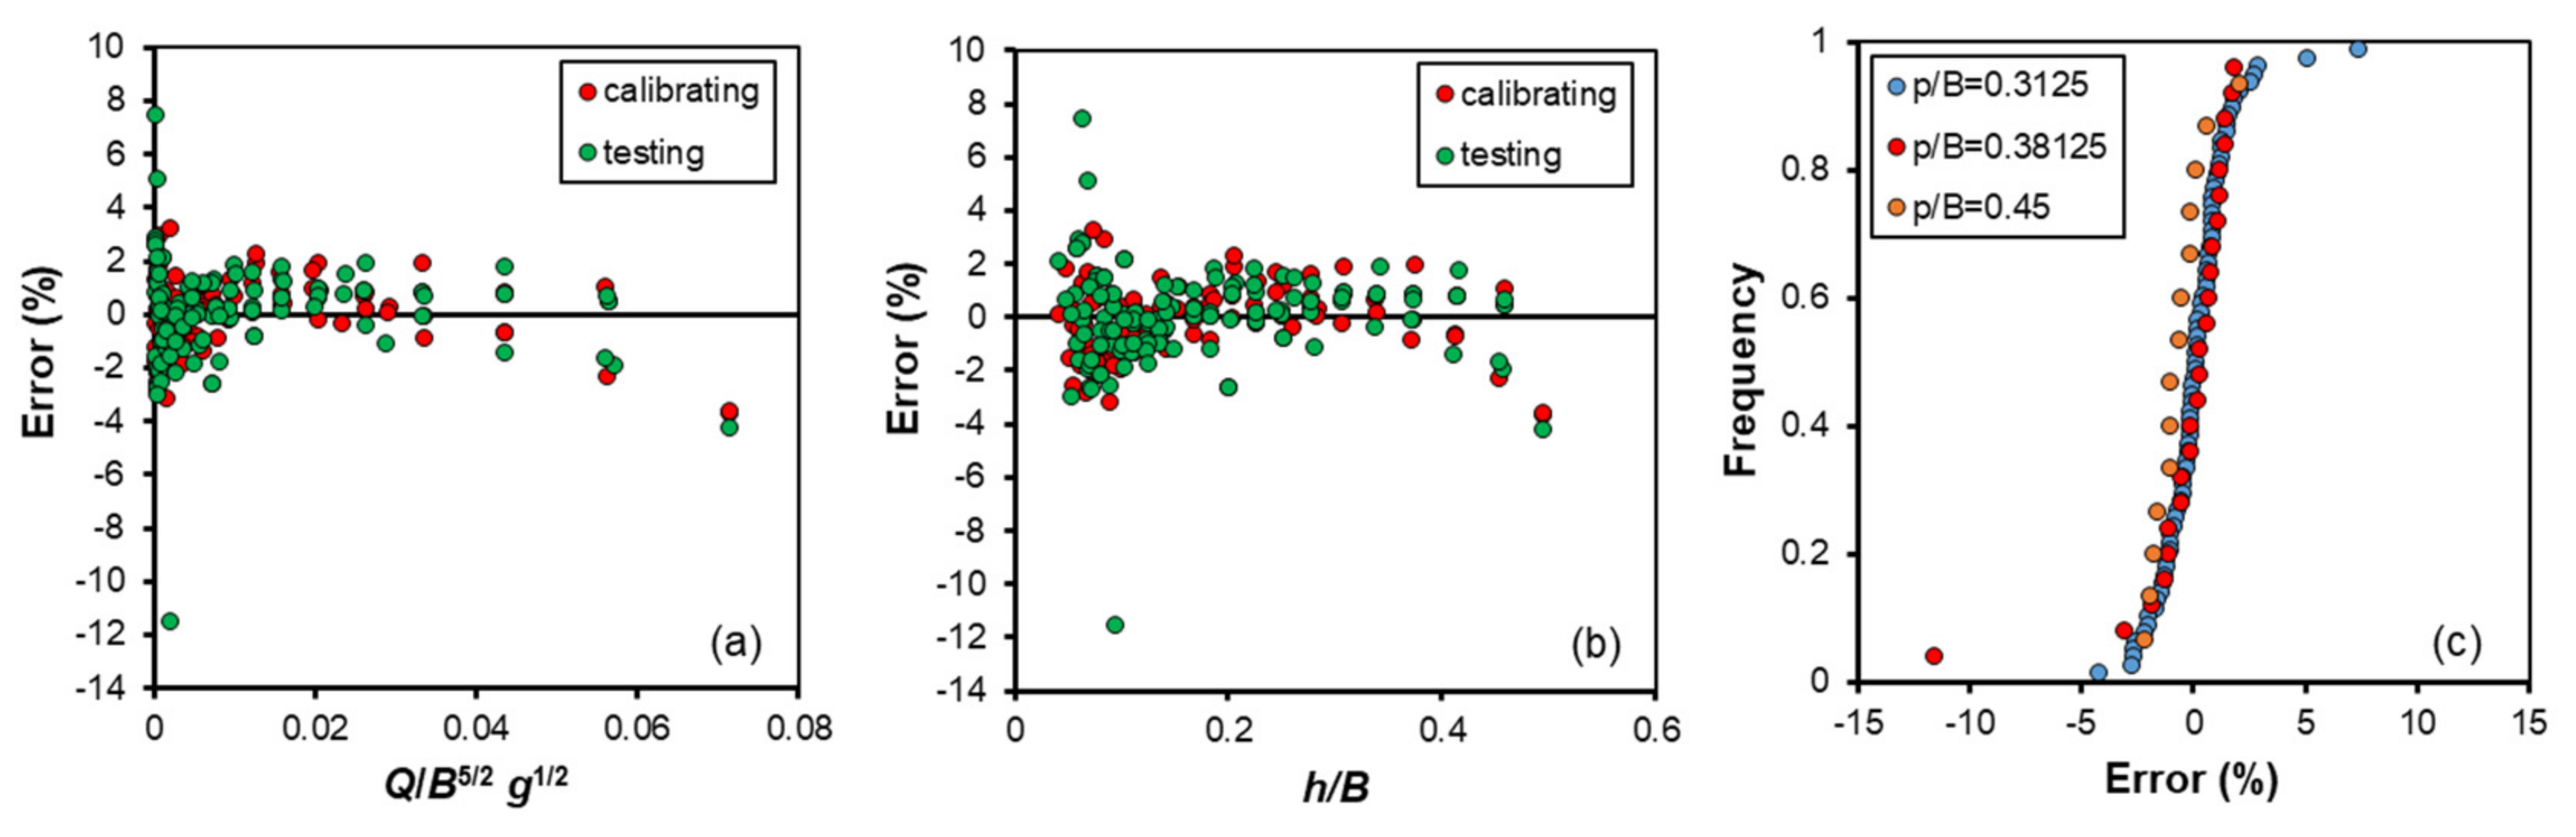
Figure 6 shows the relationships between the errors Er in the discharge estimate obtained by Equation (22) and the main characteristics of the investigated data Q/B5/2 g1/2 (a), h/B (b), and p/B (c). This figure clearly shows that for the variables Q/B5/2 g1/2 (Figure 6a) and h/B (Figure 6b), there is a weak linear trend with the errors, which is more evident for the highest values of each variable. Instead, Figure 6c clearly highlights that the frequency distribution of the errors in the estimate shifts rightward for increasing p/B values. In particular, the errors in the estimate range from −6 to +6.1 for p/B = 0.3125, from −10.2 to +3.2 for p/B = 0.38125, and from 1.3 to +5.9 for p/B = 0.45.
In conclusion, the calibrated Equation (22) allows to obtain an accurate estimate of the flow discharge for both calibrating and testing datasets, considering all the variables involved in the flow motion over triangular broad-crested weirs, even if the errors in the estimate are dependent on p/B.
Considering that Equation (5) is applicable for the condition p/B = 0, the stage–discharge relationship for a triangular broad-crested weir with p/B > 0 can be expressed by
in which Fc is a correction factor, which modifies the values calculated by Equation (5), for taking into account the effect of the ratio p/B and for considering that the measurements by Achour and Amara [21] are characterized by a ratio between the top weir width and B less than 1. The Equation (23) results are coincident with Equation (5) assuming Fc = 1 when p/B = 0. Using the 116 experimental data of the calibrating dataset corresponding to 0.3125 ≤ p/B ≤ 0.45, Equation (23) allows to detect a low variability of Fc and to estimate a mean value 1.1027 for p/B = 0.3125, 1.0860 for p/B = 0.3812 and 1.0741 for p/B = 0.45. These mean Fc values can be estimated by the following empirical equation:
which is characterized by a coefficient of determination of 0.984 and is applicable exclusively in the range 0.3125 ≤ p/B ≤ 0.45.
Combining Equation (23) and Equation (24), a stage–discharge relationship, having the same mathematical shape of Equation (21) with a = 0.4242, b = 2.53, c = 0.1173 and d = 1.0348, is obtained. The range of applicability of this stage–discharge relationship is related to the measurements which are currently available to estimate a, b, c, and d.
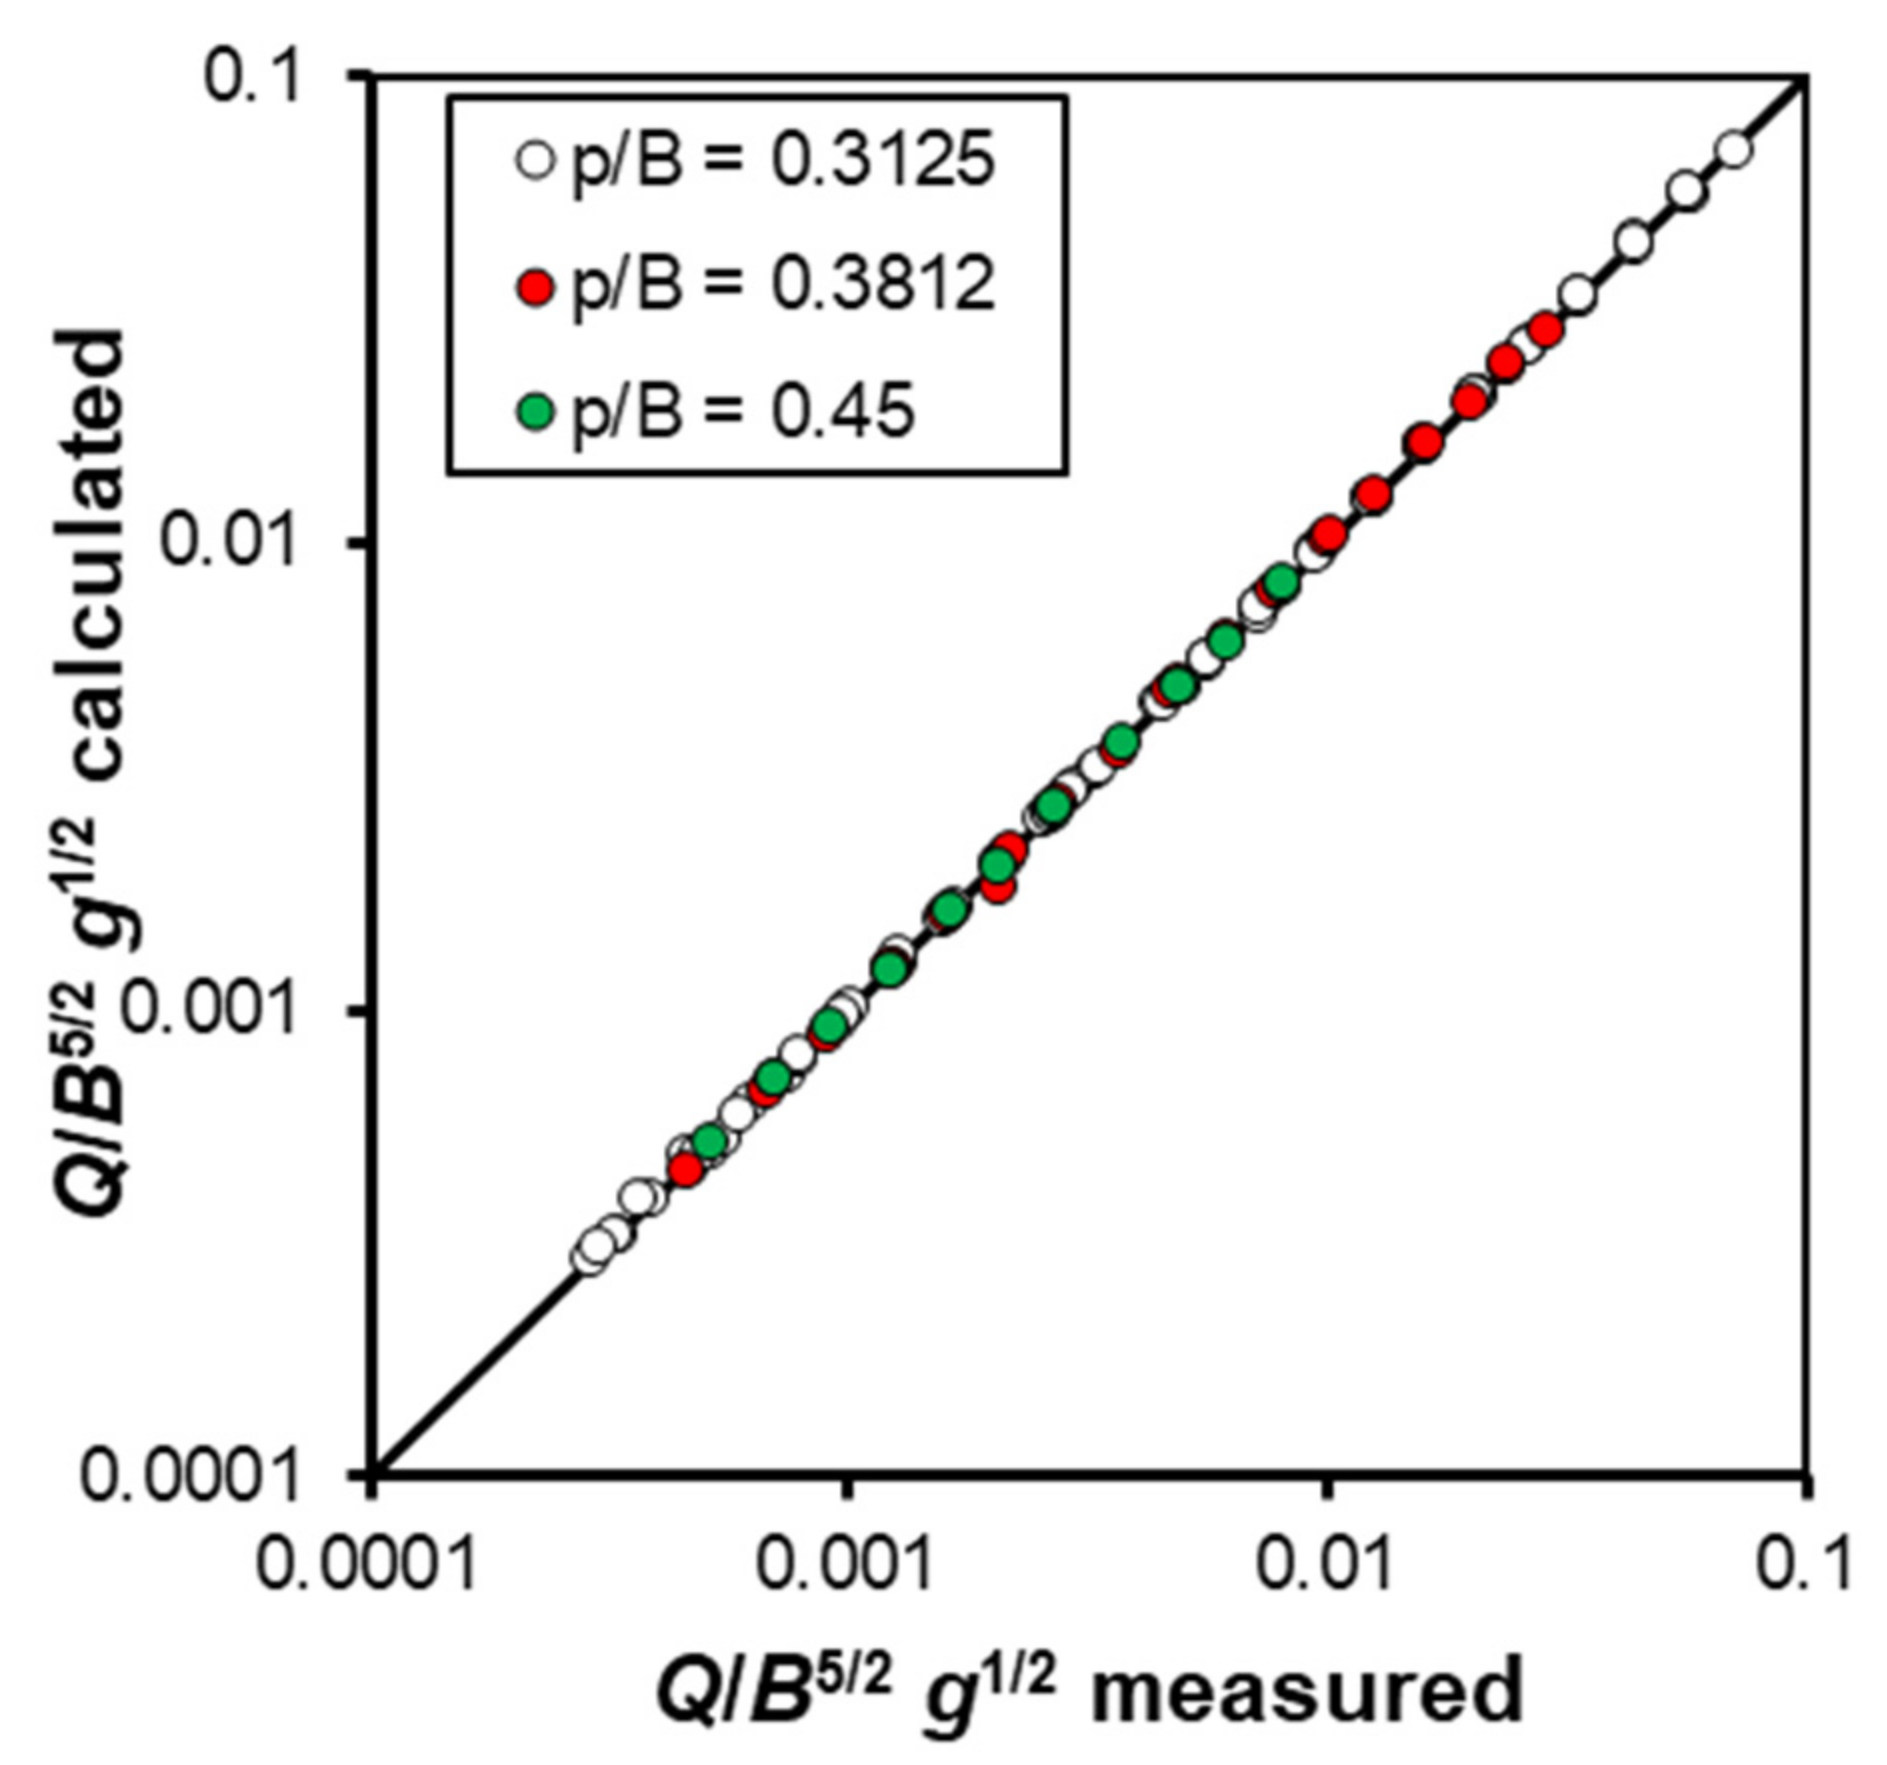
For the investigated broad-crested weirs with p/B > 0, Figure 7 shows the comparison between the measured values and those calculated by Equations (23) and (24) for the calibrating dataset. The agreement between measured and calculated values is characterized by errors in discharge estimate Er, which range from −3.69% to 3.22% (Figure 8a). In particular, these errors Er are always less than ±5% and less than or equal to ±2.5% for 91.4% of cases.
Figure 8a demonstrates that the errors Er are normally distributed, and this result was verified by the Kolmogorov–Smirnov test with a significance level of 5%. This circumstance assures that the applied Equation (23), joined with Equation (24), is a complete model, and no other dimensionless group should be considered.
Then the calibrated stage–discharge relationship Equation (23) was tested using the 115 experimental pairs (h, Q) of the independent testing dataset. Figure 9 shows good agreement between the measured and calculated values, which are also characterized by errors in discharge estimate Er ranging from −11.5% to 7.42%. In particular, the errors in discharge estimate Er are less than or equal to ±5% for 97.4% of the cases and less than or equal to ±2.5% for 89.6% of cases. Figure 8b also demonstrates that the errors Er are normally distributed, and this result was verified by the Kolmogorov–Smirnov test with a significance level of 5%. This result confirms that, for the testing dataset, the applied Equation (23) is a complete model.
Figure 10 shows the relationships between errors Er in the discharge estimate obtained by Equation (23) and the main dimensionless group characteristic of the investigated runs Q/B5/2 g1/2 (a), h/B (b), and p/B (c). This figure clearly shows that, in this case Equation (23), there is no trend between the errors and the main dimensionless group characteristic. In particular, Figure 10c highlights that the errors in the estimate, neglecting a single value, range from −4.2 to 7.4 for the investigated p/B values.
In conclusion, Equation (23) allows reducing, in comparison with Equation (22), the errors in the estimate of the discharge for triangular broad-crested weirs with p/B > 0 and for Equation (23), the errors are independent of the main characteristics (Q/B5/2 g1/2, h/B, and p/B).
5. Conclusions
In this paper, the dimensional analysis and the incomplete self-similarity theory were used to investigate the outflow process of triangular broad-crested weirs and deduce the stage–discharge relationship.
The developed analysis allowed concluding that a power equation, Equation (21), in which the influence of the weir height and the apex angle are included, can be used to establish the stage–discharge relationship.
The new stage–discharge equation was calibrated and tested by two independent sets of measurements and is characterized by very low errors in the discharge estimate (less than or equal to ±5% for 97.9% of the cases). The developed analysis also verified that the errors are normally distributed, and this circumstance assures that the applied Equation (21) is a complete model, and no other dimensionless group should be considered.
Further analysis was developed for the triangular broad-crested weirs with p/B > 0 and demonstrated that the discharge estimate can be improved by a specific stage–discharge relationship, which can be also applicable for p/B = 0.
Author Contributions
Conceptualization, A.N., F.G.C., C.D.S. and V.F.; Formal analysis, A.N., F.G.C., C.D.S. and V.F.; Investigation, A.N., F.G.C., C.D.S. and V.F.; Methodology, A.N., F.G.C., C.D.S. and V.F.; Project administration, V.F.; Software, A.N., F.G.C., C.D.S. and V.F.; Supervision, V.F.; Writing—original draft, A.N., F.G.C., C.D.S. and V.F.; Writing—review and editing, A.N., F.G.C., C.D.S. and V.F. All authors have read and agreed to the published version of the manuscript.
Funding
This research received no external funding.
Institutional Review Board Statement
Not applicable.
Informed Consent Statement
Not applicable.
Data Availability Statement
Data are available in the original papers.
Conflicts of Interest
The authors declare no conflict of interest.
Notation List
| B | channel width (m) |
| Cd | discharge coefficient |
| h | upstream water depth measured from the horizontal plane localized at the weir crest (m) |
| E | specific energy (m) |
| Er | errors in the discharge estimate |
| Fc | correction factor |
| g | gravitational acceleration (m s−2) |
| H | height of the triangular weir (m) |
| k | critical depth (m) |
| Ld | crest length (m) |
| m | tan (θ/2) |
| p | crest height (m) |
| Q | flow discharge (m3 s−1) |
| θ | apex angle of the weir (rad) |
| μ | water viscosity (kg s m−2) |
| ρ | water density (kg s2 m−4) |
| σ | surface tension of water (N m−1) |
References
- Johnson, M.C. Discharge coefficient analysis for flat-topped and sharp-crested weirs. Irrig. Sci. 2000, 19, 133–137. [Google Scholar] [CrossRef]
- Bijankhan, M.; Ferro, V. Dimensional analysis and stage-discharge relationship for weirs: A review. J. Agric. Eng. 2017, 48, 1–11. [Google Scholar] [CrossRef]
- Vatankhah, A.R.; Khamisabadi, M. Stage-discharge relationship for triangular and curved-edge triangular weirs. Flow Meas. Instrum. 2019, 69, 101609. [Google Scholar] [CrossRef]
- Kandaswamy, P.K.; Rouse, H. Characteristics of flow over terminal weirs and sills. J. Hydraul. Div. ASCE 1957, 83, 1345-1–1345-13. [Google Scholar] [CrossRef]
- Kindsvater, C.E.; Carter, R.W. Discharge Characteristics of Rectangular Thin-Plate Weirs. J. Hydraul. Div. ASCE 1957, 83, 1453-1–1453-36. [Google Scholar] [CrossRef]
- Swamee, P.K. Generalized rectangular weir equations. J. Hydraul. Eng. ASCE 1988, 114, 945–952. [Google Scholar] [CrossRef]
- Herschy, H. Hydrometry. Principles and Practices; Wiley: New York, NY, USA, 1999; pp. 55–60. [Google Scholar]
- Ferro, V. A new theoretical solution of the stage-discharge relationship for sharp-crested and broad weirs. J. Irrig. Drain. Eng. ASCE 2012, 128, 257–265. [Google Scholar] [CrossRef]
- Di Stefano, C.; Ferro, V.; Bijankhan, M. New Theoretical Solution of the Outflow Process for a Weir with Complex Shape. J. Irrig. Drain. Eng. ASCE 2016, 142, 04016036. [Google Scholar] [CrossRef]
- Igathinathane, C.; Srikanth, I.; Prakash, K.; Ramesh, B.; Womac, A.R. Development of parabolic weirs for simplified discharge measurements. Biosyst. Eng. 2007, 96, 111–119. [Google Scholar] [CrossRef]
- Boiten, W. Hydrometry; A.A. Balkema Publishers: Rotterdam, The Netherlands, 2000. [Google Scholar]
- Govinda Rao, N.S.; Muralidhar, D. Discharge characteristics of weirs of finite-crest width. Houille Blanche 1963, 49, 537–545. [Google Scholar] [CrossRef] [Green Version]
- Hager, W.H.; Schwalt, M. Broad-Crested Weir. J. Irrig. Drain. Eng. ASCE 1994, 120, 13–26. [Google Scholar] [CrossRef]
- Bijankhan, M.; Di Stefano, C.; Ferro, V.; Kouchakzadeh, S. New Stage-Discharge Relationship for Weirs of Finite Crest Length. J. Irrig. Drain. Eng. ASCE 2014, 140, 06013006-1–06013006-8. [Google Scholar] [CrossRef]
- Azimi, A.H.; Rajaratnam, N. Discharge characteristics of weirs of finite crest length. J. Irrig. Drain. Eng. ASCE 2009, 135, 1081–1085. [Google Scholar] [CrossRef]
- Di Stefano, C.; Ferro, V.; Bijankhan, M. Discussion of “Discharge Characteristics of Weirs of Finite Crest Length with Upstream and Downstream Ramps” by Amir Hossein Azimi, Nallamuthu Rajaratnam, and David Z. Zhu. J. Irrig. Drain Eng. ASCE 2014, 140, 07013002. [Google Scholar] [CrossRef]
- Aydin, I.; Altan-Sakarya, A.B.; Sisman, C. Discharge formula for rectangular sharp-crested weirs. Flow Meas. Instrum. 2011, 22, 144–151. [Google Scholar] [CrossRef]
- Torricelli, E. Opera Geometrica; Amatoris Masse & Laurentij de Landis: Florence, Italy, 2014. [Google Scholar]
- Bernoulli, D. Hydrodynamica Sive de Viribus Motibus Fluidorum Commentarii; Johann Reinhold Dulsecker: Strassburg, Austria, 1738. [Google Scholar]
- Ferro, V.; Aydin, I. New Theoretical solution of stage-discharge relationship for slit weirs. J. Irrig. Drain. Eng. ASCE 2018, 144, 06018001-1–06018001-7. [Google Scholar] [CrossRef]
- Achour, B.; Amara, L. Flow measurement using a triangular broad crested weir theory and experimental validation. Flow Meas. Instrum. 2022, 83, 102088. [Google Scholar] [CrossRef]
- Clemmens, A.J.; Wahl, T.L.; Bos, M.G.; Replogle, J.A. Water Measurement with Flumes and Weirs; Water Resources Publications: Littleton, CO, USA, 2001. [Google Scholar]
- Smith, C.D.; Liang, W.S. Triangular broad-crested weir. J. Irrig. Drain. Div. ASCE 1969, 95, 493–502. [Google Scholar] [CrossRef]
- Boiten, W.; Pitlo, R.H. The V-shaped broad-crested weir. J. Irrig. Drain. Eng. ASCE 1982, 108, 142–160. [Google Scholar] [CrossRef]
- Hoseini, S.H. Experimental investigation of flow over a triangular broad-crested weir. ISH J. Hydraul. Eng. 2014, 20, 230–237. [Google Scholar] [CrossRef]
- Ferro, V. Closure to ‘New theoretical solution of the stage-discharge relationship for sharp-crested and broad weirs’ by V. Ferro. J. Irrig. Drain. Eng. ASCE 2013, 129, 518–520. [Google Scholar] [CrossRef]
- Barenblatt, G.I. Similarity, Self-Similarity and Intermediate Asymptotics; Consultants Bureau: New York, NY, USA, 1979. [Google Scholar]
- Barenblatt, G.I. Dimensional Analysis. Gordon & Breach; Science Publishers Inc.: Amsterdam, The Netherlands, 1987. [Google Scholar]
- Nicosia, A.; Ferro, V. A new approach for deducing the stage-discharge relationship of a triangular broad-crested device. Flow Meas. Instrum. 2022, 85, 102160. [Google Scholar] [CrossRef]
- Delft Hydraulics Laboratory. The V-Shaped Broad-Crested Weir; Report on basic research, S170-VI; Waterloopkundig Laboratorium: Delft, The Netherlands, 1980. [Google Scholar]
- Rao, S.S.; Shukla, M.J. Characteristics of flow over weirs of finite crest width. J. Hydraul. Div. ASCE 1971, 97, 1807–1816. [Google Scholar] [CrossRef]
- Sargison, E.J. The influence of surface tension on weir flow. J. Hydraul. Res. 1972, 10, 431–446. [Google Scholar] [CrossRef]
- Ranga Raju, K.G.; Asawa, G.L. Viscosity and surface tension effects on weir flow. J. Hydraul. Div. ASCE 1977, 103, 1227–1231. [Google Scholar] [CrossRef]
- De Martino, G.; Ragone, A. Effects of viscosity and surface tension on slot weirs flow. J. Hydraul. Res. 1984, 22, 327–341. [Google Scholar] [CrossRef]
Figure 1.
Scheme of the triangular broad-crested weir placed in a rectangular channel.

Figure 2.
Scheme of the triangular broad-crested weir placed in a rectangular channel used by Achour and Amara [21].
Figure 2.
Scheme of the triangular broad-crested weir placed in a rectangular channel used by Achour and Amara [21].

Figure 3.
Comparison between the measured values and those calculated by Equation (22) for calibrating dataset.
Figure 3.
Comparison between the measured values and those calculated by Equation (22) for calibrating dataset.

Figure 4.
Frequency distribution of the errors in discharge estimate Er for calibrating (a) and testing (b) datasets.
Figure 4.
Frequency distribution of the errors in discharge estimate Er for calibrating (a) and testing (b) datasets.

Figure 5.
Comparison between the measured values and those calculated by Equation (22) for testing dataset.
Figure 5.
Comparison between the measured values and those calculated by Equation (22) for testing dataset.

Figure 6.
Relationships between the errors Er in the discharge estimate obtained by Equation (22) and the main characteristics of the investigated data Q/B5/2 g1/2 (a), h/B (b), and p/B (c).
Figure 6.
Relationships between the errors Er in the discharge estimate obtained by Equation (22) and the main characteristics of the investigated data Q/B5/2 g1/2 (a), h/B (b), and p/B (c).

Figure 7.
Comparison between the measured values and those calculated by Equations (23) and (24) for the calibrating dataset.
Figure 7.
Comparison between the measured values and those calculated by Equations (23) and (24) for the calibrating dataset.

Figure 8.
Frequency distribution of the errors in discharge estimate Er applying Equations (23) and (24) for calibrating (a) and testing (b) datasets.
Figure 8.
Frequency distribution of the errors in discharge estimate Er applying Equations (23) and (24) for calibrating (a) and testing (b) datasets.

Figure 9.
Comparison between the measured values and those calculated by Equations (23) and (24) for the testing dataset.
Figure 9.
Comparison between the measured values and those calculated by Equations (23) and (24) for the testing dataset.

Figure 10.
Relationships between the errors Er in the discharge estimate obtained by Equation (23) and the main characteristics of the investigated data Q/B5/2 g1/2 (a), h/B (b), and p/B (c).
Figure 10.
Relationships between the errors Er in the discharge estimate obtained by Equation (23) and the main characteristics of the investigated data Q/B5/2 g1/2 (a), h/B (b), and p/B (c).


Table 1.
Characteristic data of the examined available database.
| Authors | Runs | p (m) | p/B | m | H (m) | h (m) |
|---|---|---|---|---|---|---|
| Delft Hydraulics Laboratory [30] | 132 | 0.25 | 0.3125 | 1 | 0.4 | 0.044–0.396 |
| Delft Hydraulics Laboratory [30] | 49 | 0.305 | 0.3812 | 1.73 | 0.231 | 0.044–0.227 |
| Delft Hydraulics Laboratory [30] | 28 | 0.36 | 0.45 | 3.73 | 0.107 | 0.033–0.1 |
| Boiten and Pitlo [24] | 22 | 0.25 | 0.45 | 1 | 0.4 | 0.047–0.367 |
| Achour and Amara [21] | 39 | 0 | 0 | 0.18 | n.a. | 0.109–0.375 |
| Achour and Amara [21] | 40 | 0 | 0 | 0.22 | n.a. | 0.087–0.3 |
| Achour and Amara [21] | 40 | 0 | 0 | 0.27 | n.a. | 0.088–0.25 |
| Achour and Amara [21] | 40 | 0 | 0 | 0.39 | n.a. | 0.07–0.205 |
n.a. = not available.
Publisher’s Note: MDPI stays neutral with regard to jurisdictional claims in published maps and institutional affiliations. |
© 2022 by the authors. Licensee MDPI, Basel, Switzerland. This article is an open access article distributed under the terms and conditions of the Creative Commons Attribution (CC BY) license (https://creativecommons.org/licenses/by/4.0/).
Share and Cite
MDPI and ACS Style
Nicosia, A.; Carollo, F.G.; Di Stefano, C.; Ferro, V. New Stage–Discharge Relationship for Triangular Broad-Crested Weirs. Water 2022, 14, 2993. https://doi.org/10.3390/w14192993
AMA Style
Nicosia A, Carollo FG, Di Stefano C, Ferro V. New Stage–Discharge Relationship for Triangular Broad-Crested Weirs. Water. 2022; 14(19):2993. https://doi.org/10.3390/w14192993
Chicago/Turabian StyleNicosia, Alessio, Francesco Giuseppe Carollo, Costanza Di Stefano, and Vito Ferro. 2022. "New Stage–Discharge Relationship for Triangular Broad-Crested Weirs" Water 14, no. 19: 2993. https://doi.org/10.3390/w14192993
Note that from the first issue of 2016, this journal uses article numbers instead of page numbers. See further details here.