Article

Analysis of Surface Water Quality and Sediments Content on Danube Basin in Djerdap-Iron Gate Protected Areas

1
Faculty of Mechanical Engineering, University Politehnica Timisoara, 300006 Timișoara, Romania
2
Technical Faculty in Bor, University of Belgrade, 19210 Bor, Serbia
3
Technical Faculty “Mihajlo Pupin” Zrenjanin, University of Novi Sad, 21101 Novi Sad, Serbia
*
Author to whom correspondence should be addressed.
Water 2022, 14(19), 2991; https://doi.org/10.3390/w14192991
Submission received: 3 August 2022 / Revised: 9 September 2022 / Accepted: 19 September 2022 / Published: 23 September 2022

Abstract

:
As water is essential to life and is an indispensable resource for ecosystems and their services and for nearly all human activities, the goal of this research was to evaluate the surface water quality of the Danube as it passes through the Romania–Serbia border in the nature reservations Djerdap and Iron Gate. The study aimed to assess the oxygen regime, nutrients and heavy metals contamination of the surface waters of the Danube on a length of about 240 km, between Bazias and Iron Gate II. Reference sampling and analytical methods (UV-VIS and AAS) were deployed to reach this goal. In addition, sediments were analyzed through back scattered SEM-EDAX for the elemental analysis of the sediment surface. Results obtained show a low environmental impact of heavy metals, while the Danube’s oxygen regime is under stress due to nutrients’ (nitrites and orthophosphates) significant concentration in the Danube surface water in the analyzed sector. Our approach can be applied to other water bodies in the area, to increase available scientific data together with societal awareness of the Danube’s environmental risks.

1. Introduction

Oxygen regime (DO, COD and BOD) and main nutrients concentrations (nitrates, nitrites, phosphates, etc.) are of significant importance for water bodies due to their direct impact on aquatic ecosystems. A significant impact is also induced by the presence of heavy metals, especially due to their long life span and bioaccumulation, with a significant potential of toxicity. Numerous studies show that exposure to heavy metals such as Ni, Hg, Zn, and Cd can lead to major health issues, from autoimmunity and organ failure to death [1].
The Danube River, the second longest river in Europe, along its flow makes a natural border and a remarkable area between Serbia and Romania—Iron Gate, the pearl of the Danube River. This area is proclaimed as a protected area on both the Serbian and Romanian sides. Hence, on Romania’s side, there is the national park Parcul natural Portile de Fier which covers 115,655 ha, the second largest national park in Romania. The national park Djerdap is the largest one in Serbia and covers a total area of 63,786 ha. In this border area, at about 100 km from the point of entry in Romania, the Danube forms its Iron Gate gorge, the deepest (170 m) and most unique in Europe. This area is the habitat of 1100 plant species (some unique in the world, such as Tulipa hungarica), more than 150 bird species and remarkable mammal diversity, in mostly forest-covered area [2].
The area has suffered significant anthropogenic interventions in the past years, from the Iron Gate I hydropower dam opening in 1972, which raised the Danube level by 35 m and formed an accumulation lake that spread up to the Danube confluence with the Tisa River, to visible climate change impact in the past years that led to the Danube’s surface water temperature rise, higher air temperatures and lower precipitation rates [3]. The importance of water sources protection is highlighted by EU water policy, and pollutants discharge from urban, agricultural and industrial sites in water sources being strictly regulated, including in Romania and Serbia, as both states have harmonized their legislation EU Directive 2000/60/EC, since 2000. As a result, significant improvement in surface water quality was observed, especially in reducing the excess of nutrients in the Danube and its main tributaries [4]. The reduction in nitrates concentration, not only in the Iron Gate area but in all of the Danube’s course, started in 1990–2000 with Directive 91/676/ECE and the rational use of fertilizers in Europe agriculture. In the past years, due to severe drought periods, scientists could link the increase in nitrates concentrations in river waters with waste waters because the influence of agriculture is minimal due to low infiltration in soil [5].
Another significant threat on Danube surface water quality in the Iron Gate Natural Park area is given by the changing hydrological temporal and spatial character within Europe. In past decades, it was recorded that precipitation increased in northern Europe and decreased in the southern part [6], bringing stress both on water availability and its quality.
A lack of major polluters’ presence in the investigated 240 km Danube length is important in terms of environmental status but also disadvantageous from a scientific point of view. While surface waters of the upper/middle [7,8,9] and lower Danube basin area [10,11,12] including tributaries are monitored constantly, in the area of current study the data coverage and availability are not so good. This is probably caused by the facts that the area is mountainous, with small scale agriculture, small urban agglomerations, and no major industrial facilities (mainly mining) as they were closed in the post-communist era and there is a lack of an academic/scientific local community.
Access to surface water quality data obtained through continuous monitoring systems is of high importance [13,14,15,16] for actual and correct management plans for major river basins. Where data gaps exist, studies which are discontinued but focused on targeted pollutants are important. Nutrients were for many years the main scientific concern for Danube waters [17,18], leading to European regulation to control their discharge (including heavy metals contamination), and more recently emerging pollutants (pharmaceuticals, microplastics, etc.) became of significant importance for ecological assessment [19,20].
The natural occurrence of heavy metals in surface waters is normal, especially in mountainous areas such as the Iron Gate area. However heavy metals are easily quantifiable in tributaries unaffected by anthropogenic activities due to its seasonal (rainfall) variability. In our region, the heavy metal sources originate from municipal waste, waste waters discharge [21] and mining activities at Moldova-Noua and Majdanpek. This led to our need to evaluate the sediments chemical composition, along with surface waters, especially as Danube is the main water source for all cities on its course through Iron Gate Natural Park. The final goal of the research is to attempt to quantify the level of the Danube and its main tributaries’ surface water quality and sediments composition, with a focus on oxygen regime, nutrients and heavy metals.

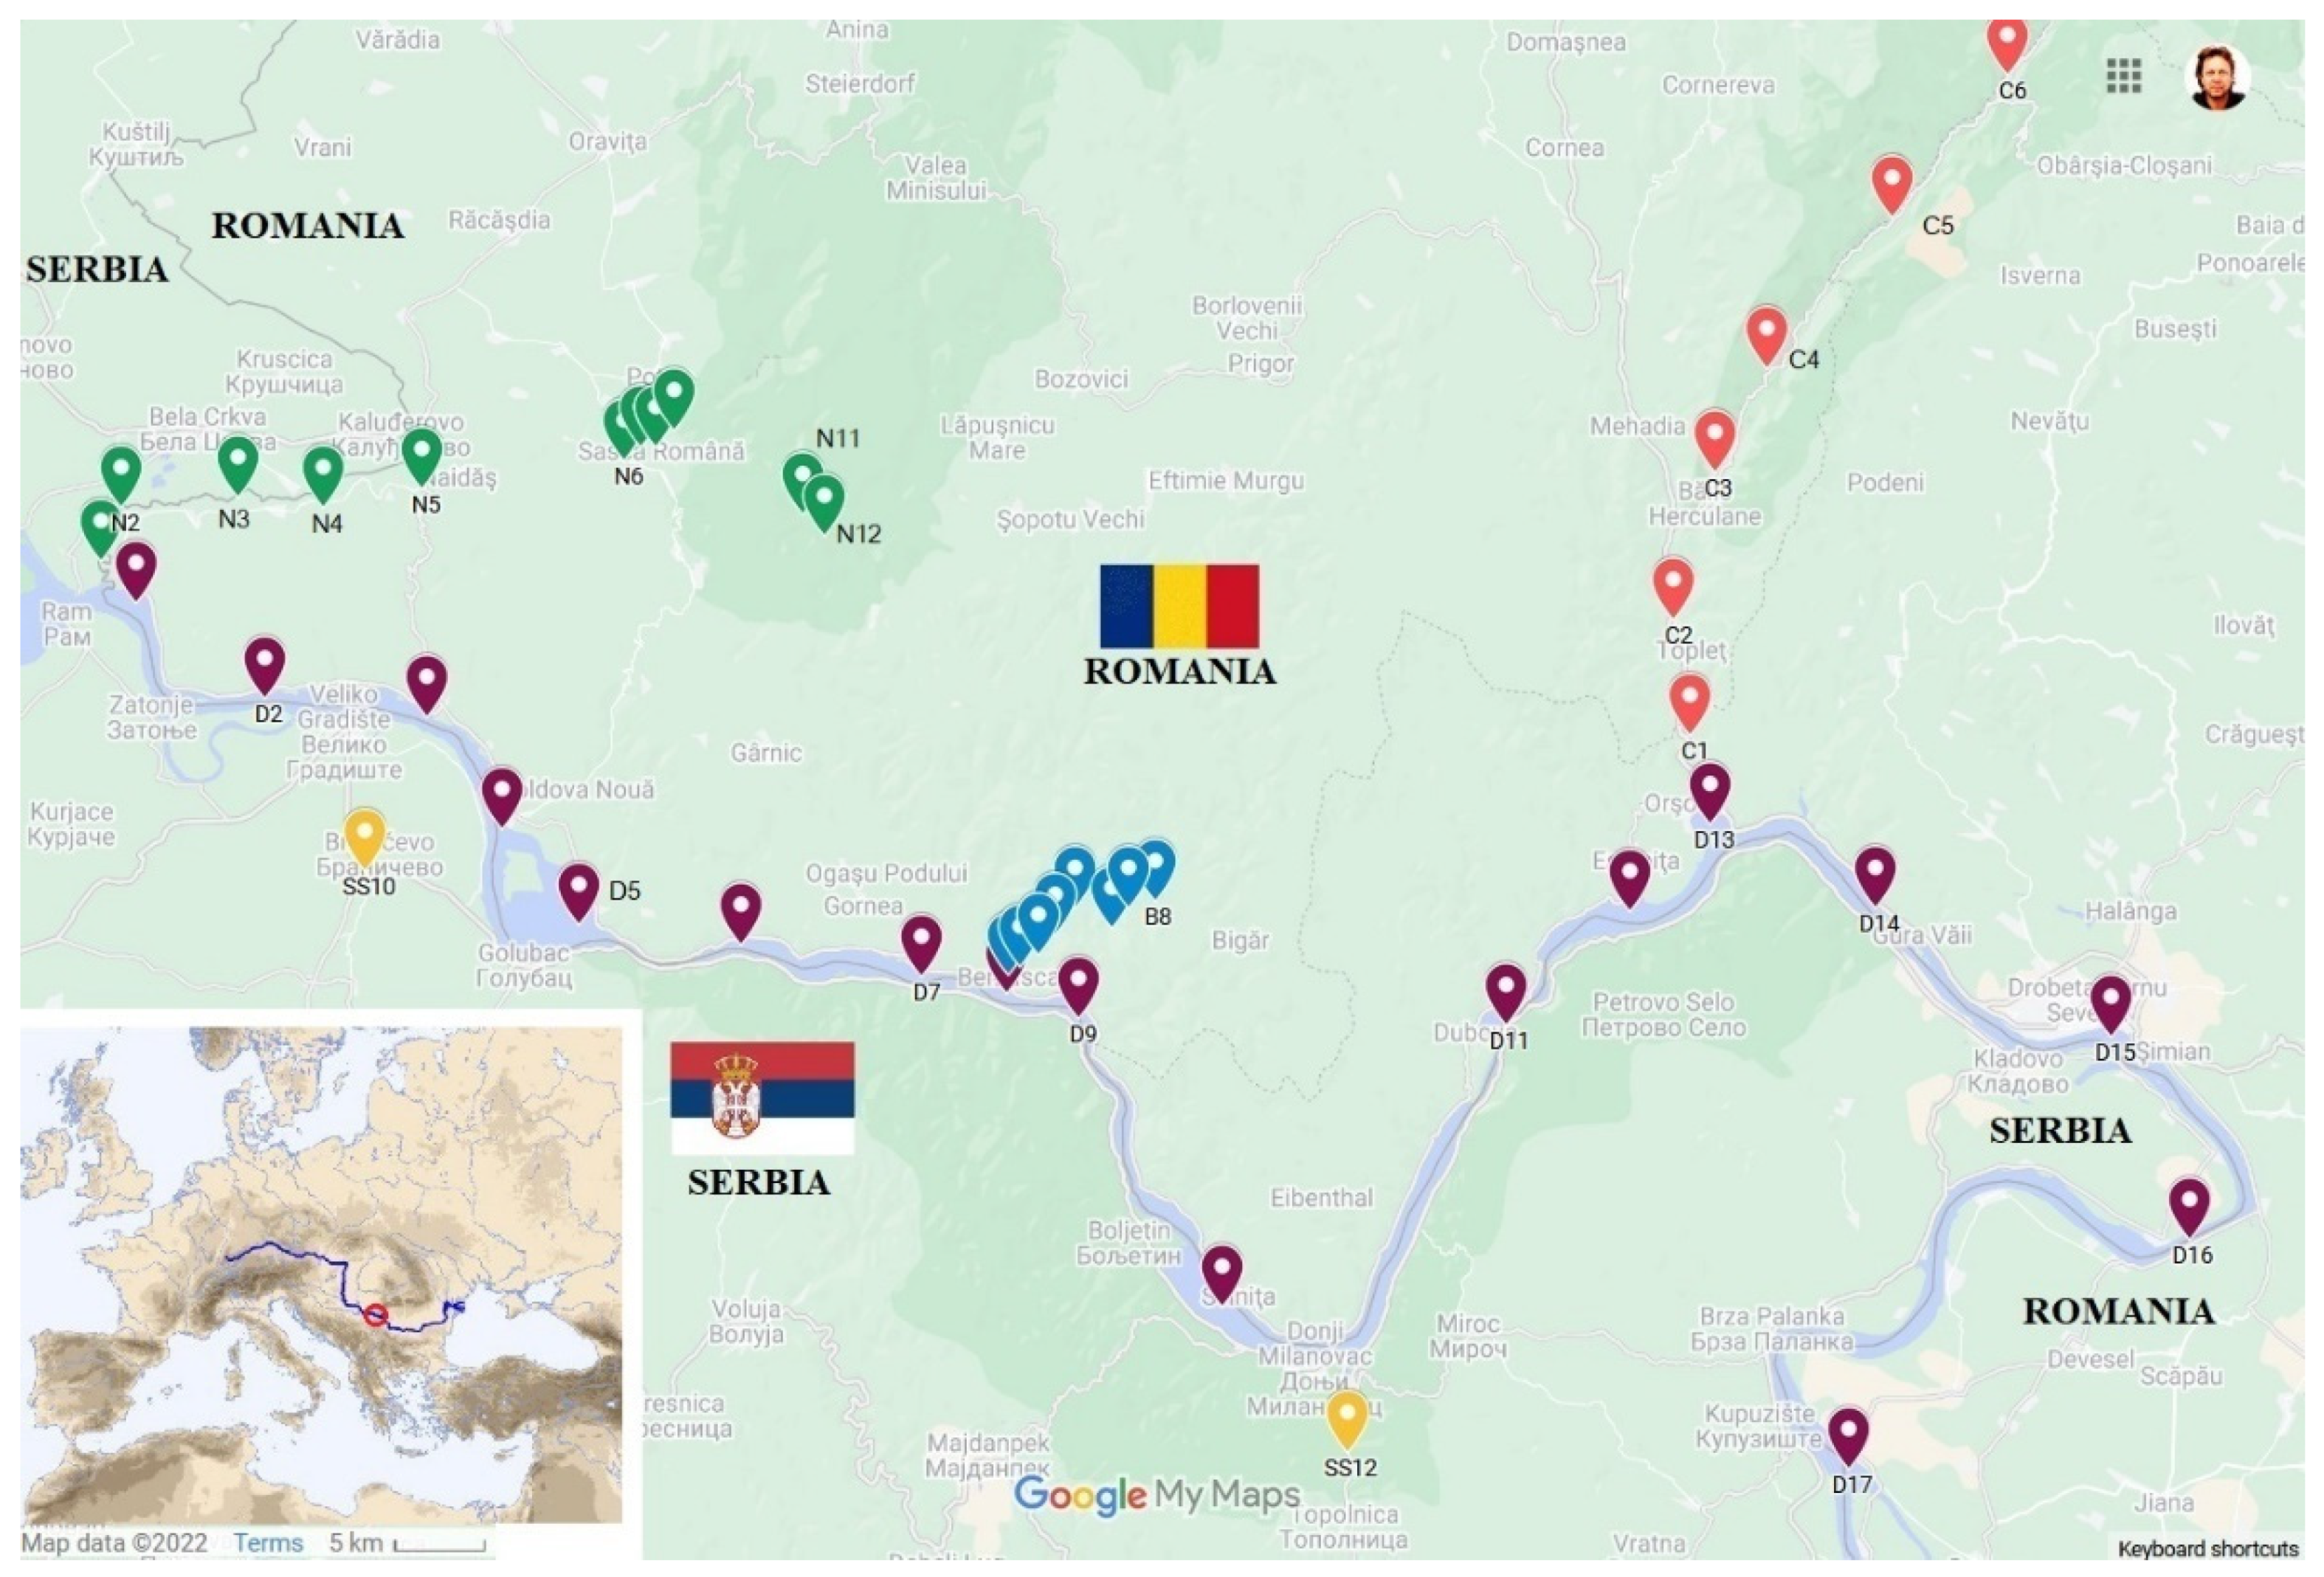
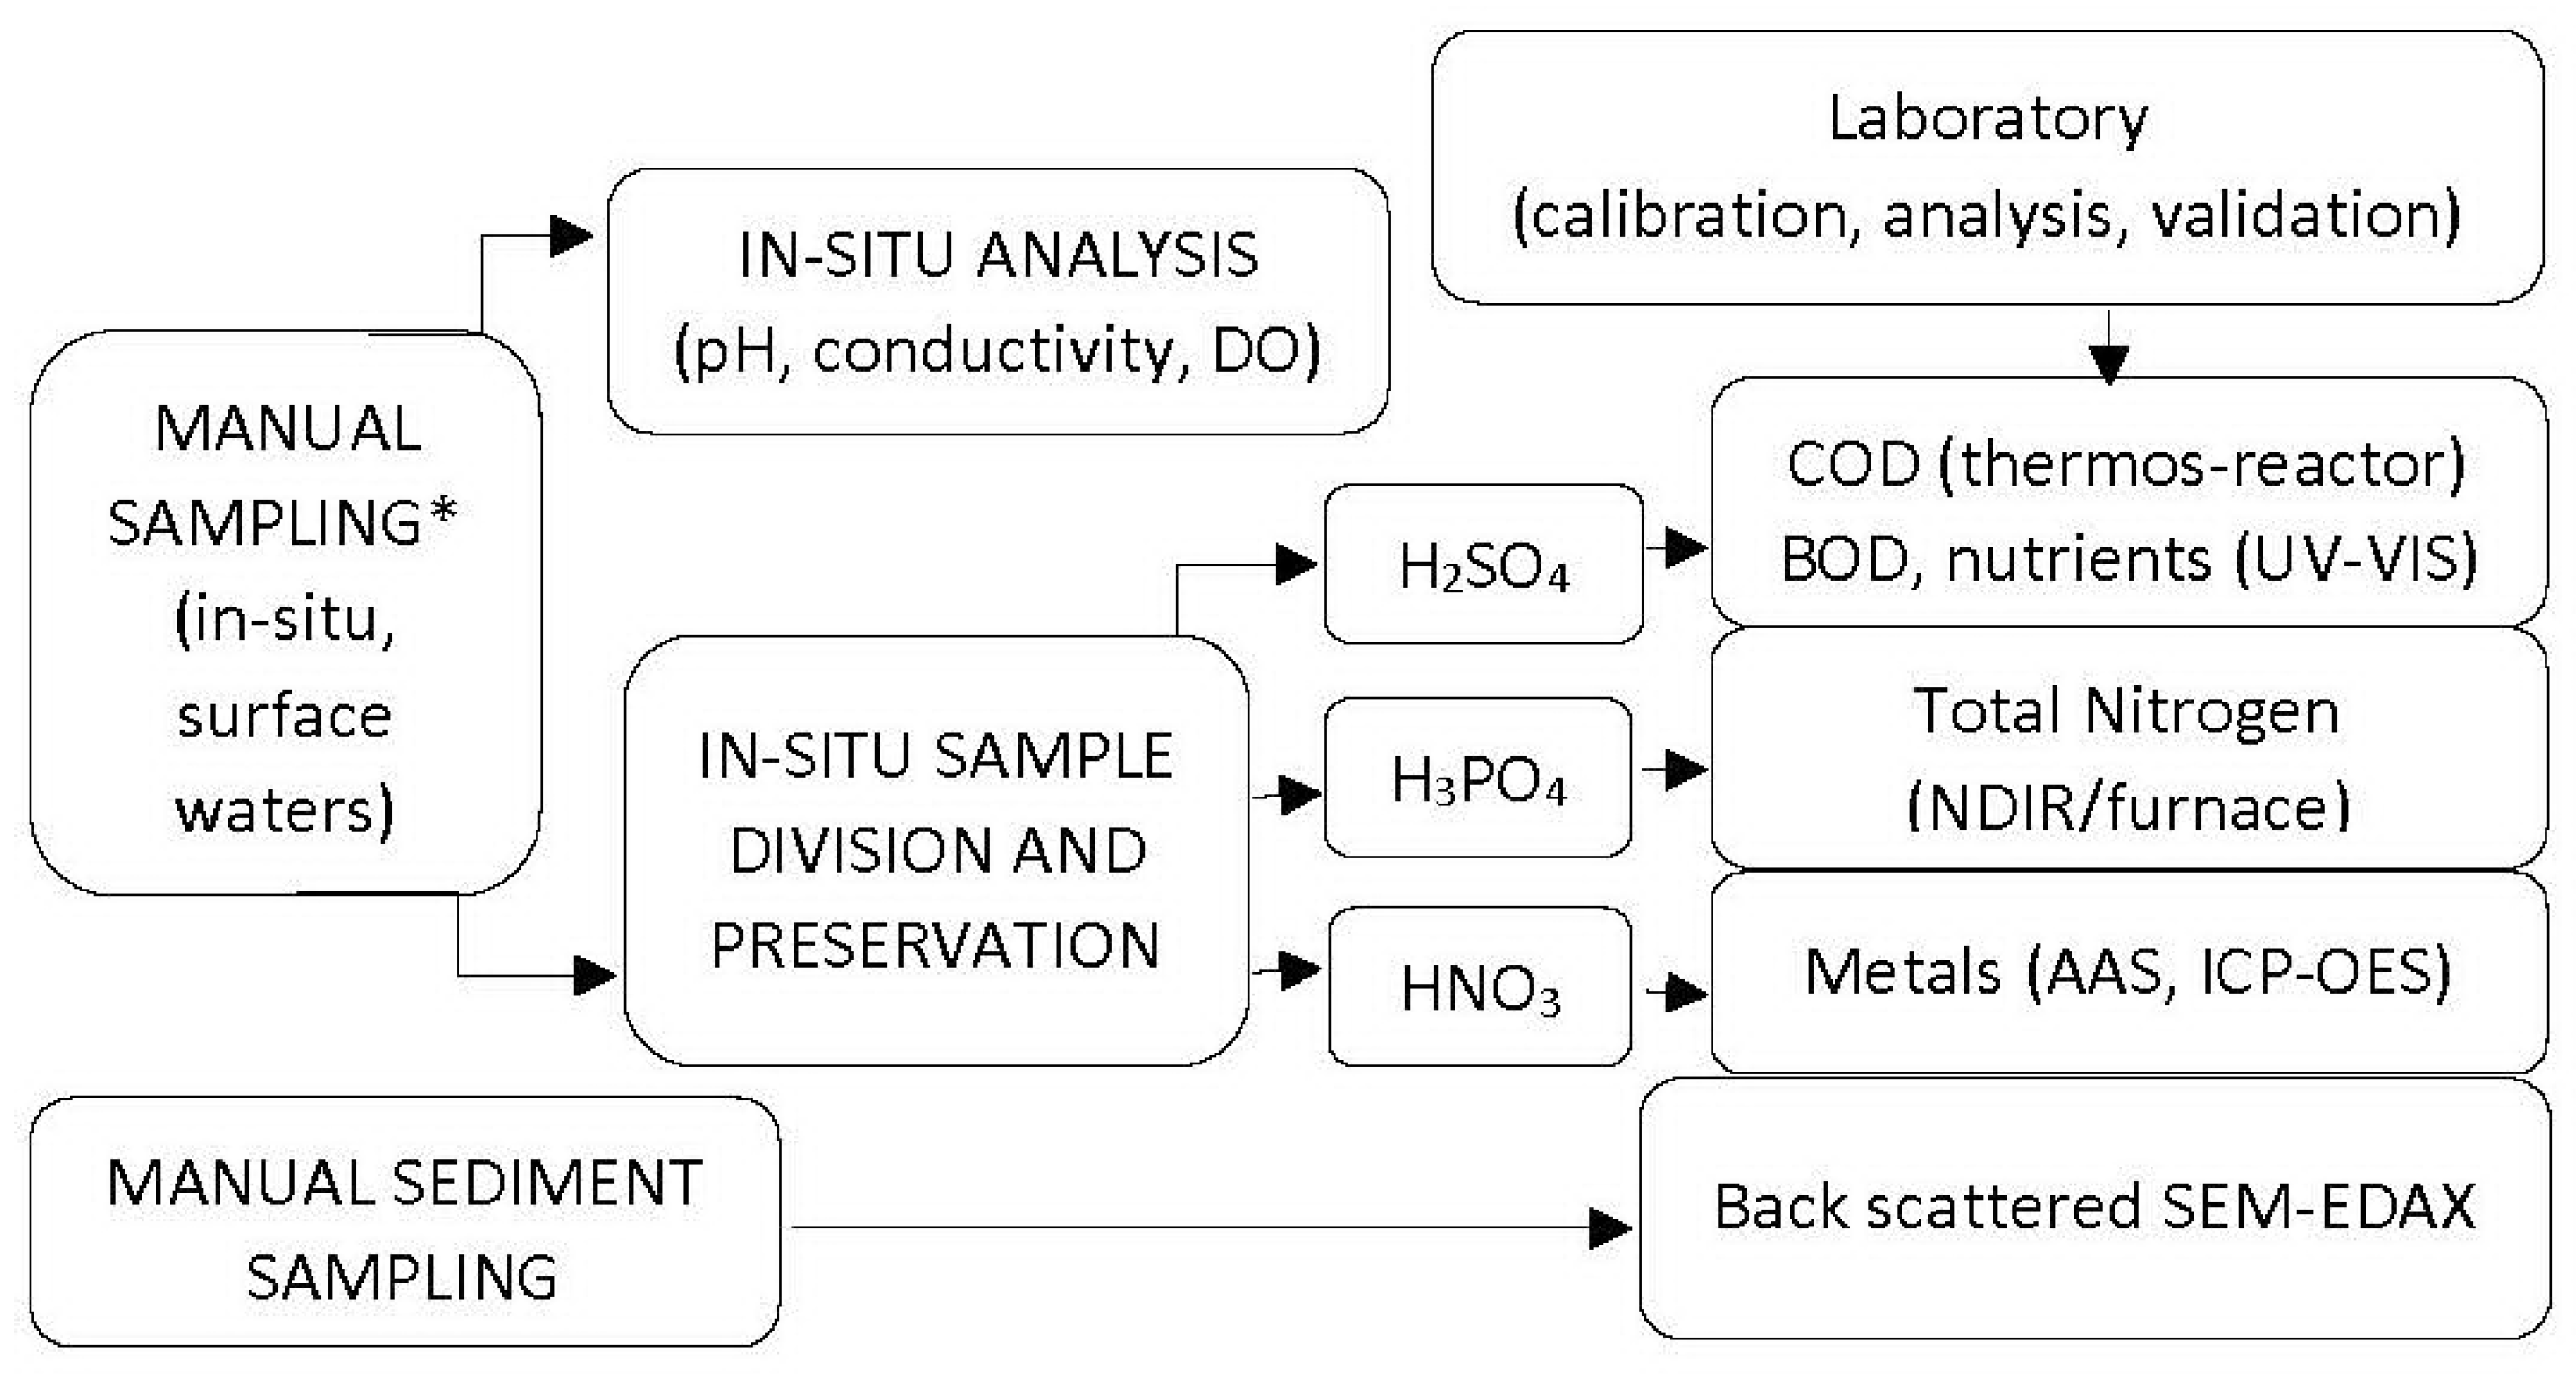
2. Materials and Methods

During the research, an in situ analysis of surface water samples was performed for parameters such as pH, temperature, total hardness, chromate (CrO42−) and dissolved oxygen (DO), while for laboratory analysis, samples were taken by kayak in large bodies of water such as the Danube and Nera Rivers. All surface water samples taken for laboratory analysis were prepared for preservation with acids: HNO3 (nitric acid) for metal concentration analysis [22,23,24,25], H3PO4 (phosphoric acid) for total nitrogen analysis and H2SO4 (sulfuric acid) for chemical oxygen demand analysis on Velp Eco6 and ammonia, phosphor, nitrite, nitrate, phosphate, etc. Sediment samples were collected from river banks in muddy/sandy areas where long-term depositions most likely occur. The sediment samples were oven-dried at low temperatures to avoid material losses.
International references and recognized analytical methods were used for laboratory analysis, as described in Table 1.
Surface water samples were collected in 48 sampling locations, as marked in Figure 1, from the Danube and its 5 main tributary rivers in the analyzed area of the Romania–Serbia border, in the natural parks of Iron Gate (Romanian side) and Djerdap (Serbian side). All samples were collected in July–September 2020.
In the area, 17 sampling locations were selected for Danube, 12 for Nera, 1 for Pek and Porecka, 8 for Berzasca and 6 for Cerna Rivers.
The total length of the analyzed water body is about 240 km.
Applied sampling, samples preservations and analytical techniques applied are presented in Figure 2. For each sampling point (Figure 1), surface waters were collected from 3 to 5 spots, at a ~20 min time frame and mixed in one 2 L bottle. From this unique sample, 4 analytical samples were separated in 0.5 L HDPE bottles, one being used for the in situ measurements of pH, conductivity and DO while the remaining 3 were preserved with specific acids for laboratory analysis (see Figure 2) [27,28,29].
Surface sediment samples were taken from river banks, in a column of maximum 2 cm, with a manual sampler and stored in 50 mL recipients. During transportation and storage for laboratory analysis, all samples were maintained at ~4 °C. The recommendations of ISO 5667-1(3) were followed during sampling, manipulation and sample preservation.

3. Results and Discussion

3.1. Chemical Analysis of Surface Waters

In Table 2, a selection of the results obtained for samples from the Danube River are presented, grouped by oxygen content, nutrients and heavy metals.
From the 17 sampling points, nine were selected from representability, equally distributed by Danube flow direction, from its point of entry in Romania at Bazias down to the area exit point (Iron Gate II) of the Romanian–Serbian border.
Sediments and surface water samples were collected during the summer of 2020, starting in July and ending in September, a period with relatively constant temperature, precipitation and Danube flow variations, avoiding the seasonal variability of pollutants concentration during sampling [30,31,32].
From a management point of view, the Danube River is divided into 15 water management regions and four main sectors, the Upper, Middle, Lower and Delta [33,34]. The results obtained and presented in Table 2 and Table 3 are specific and limited to the lower part of the Middle Danube section. Today, this section is characterized by minimal local anthropogenic chemical discharge influence with only two exceptions: Majdanpek/Bor mining activities with waste waters discharge through the Pek and Porecka Rivers [35,36,37,38] and Drobeta Turnu Severin/Kladovo relevant urban agglomeration. The results are interpreted in the tables in terms of ecochemical status [39], or “eco state”, classifying the surface water quality into five classes (color coded), from excellent to very poor, as described in Table 3.
Reference-certified materials (Certipur/Merck) were used for sample preparation for analysis on Zeenit 700P Atomic Absorbtion Spectrometer. ICP multi-element standard solution IV, traceable to NIST SRM, were used for instrument calibration. The instrument is controlled by AspectLS software, with automated sample analysis and results validation and control. The calibration curve parameter R2 and the measurement results’ standard deviation and residuals are presented in Table 3.
In Table 4, a selection of the results obtained for samples from the Danube’s main tributaries in the area are presented (the Nera, Pek, Berzasca, Porecka and Cerna Rivers), also grouped on oxygen content, nutrients and heavy metals.
In the case of COD—chemical oxygen demand—in two sampling sites, the Pek and Porecka Rivers, the COD-Mn method was used, as the analysis was conducted in Serbia, where the method of determining COD by the titration of sodium oxalate with potassium permanganate is widely used due to its advantage of not using pentavalent chromium and mercury sulphate, hazardous chemicals.

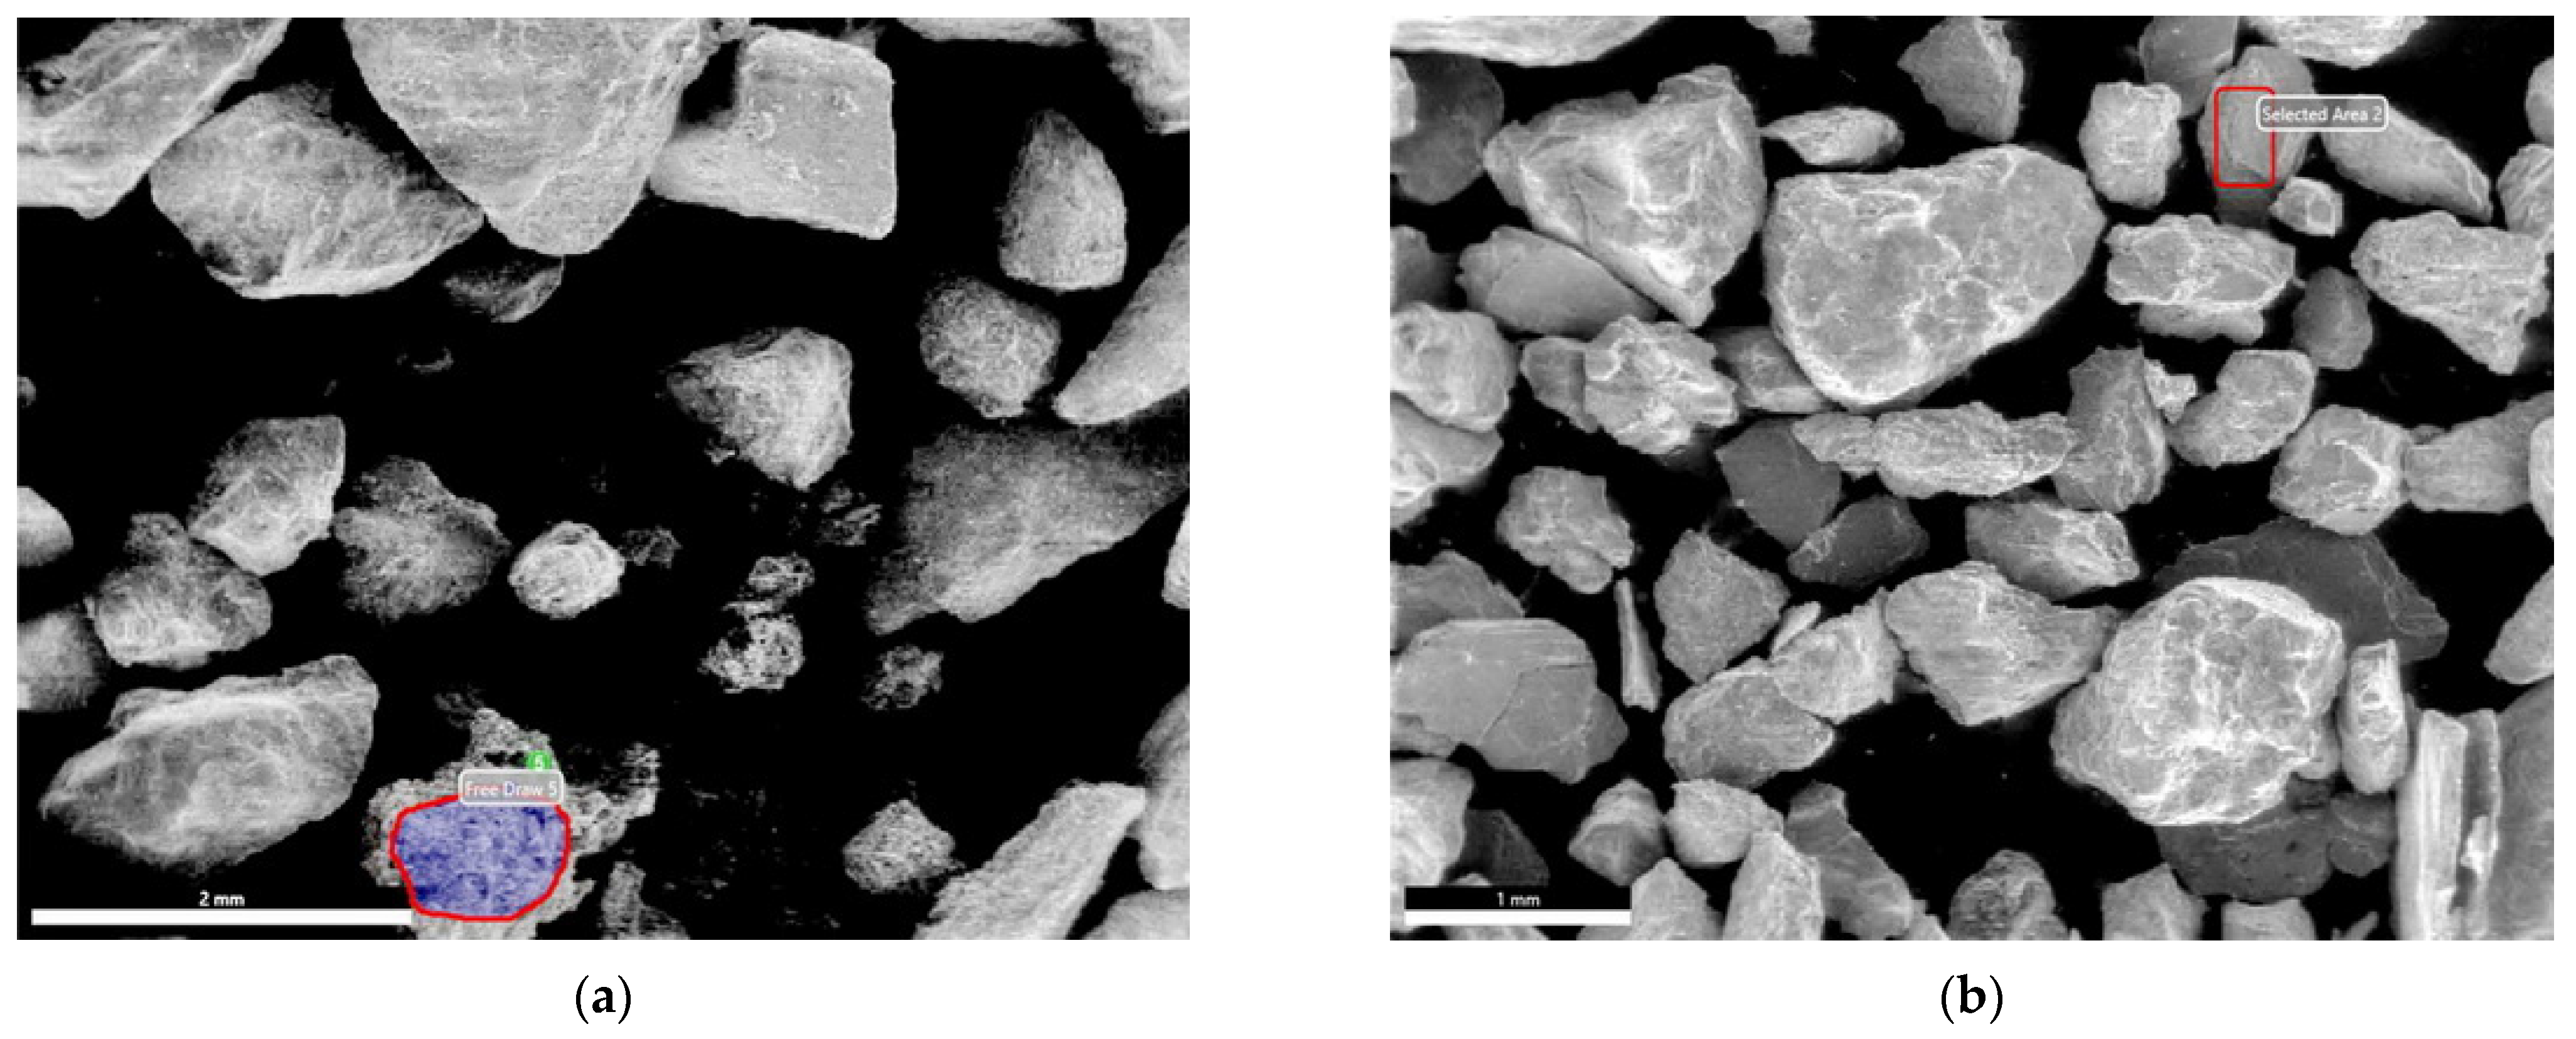
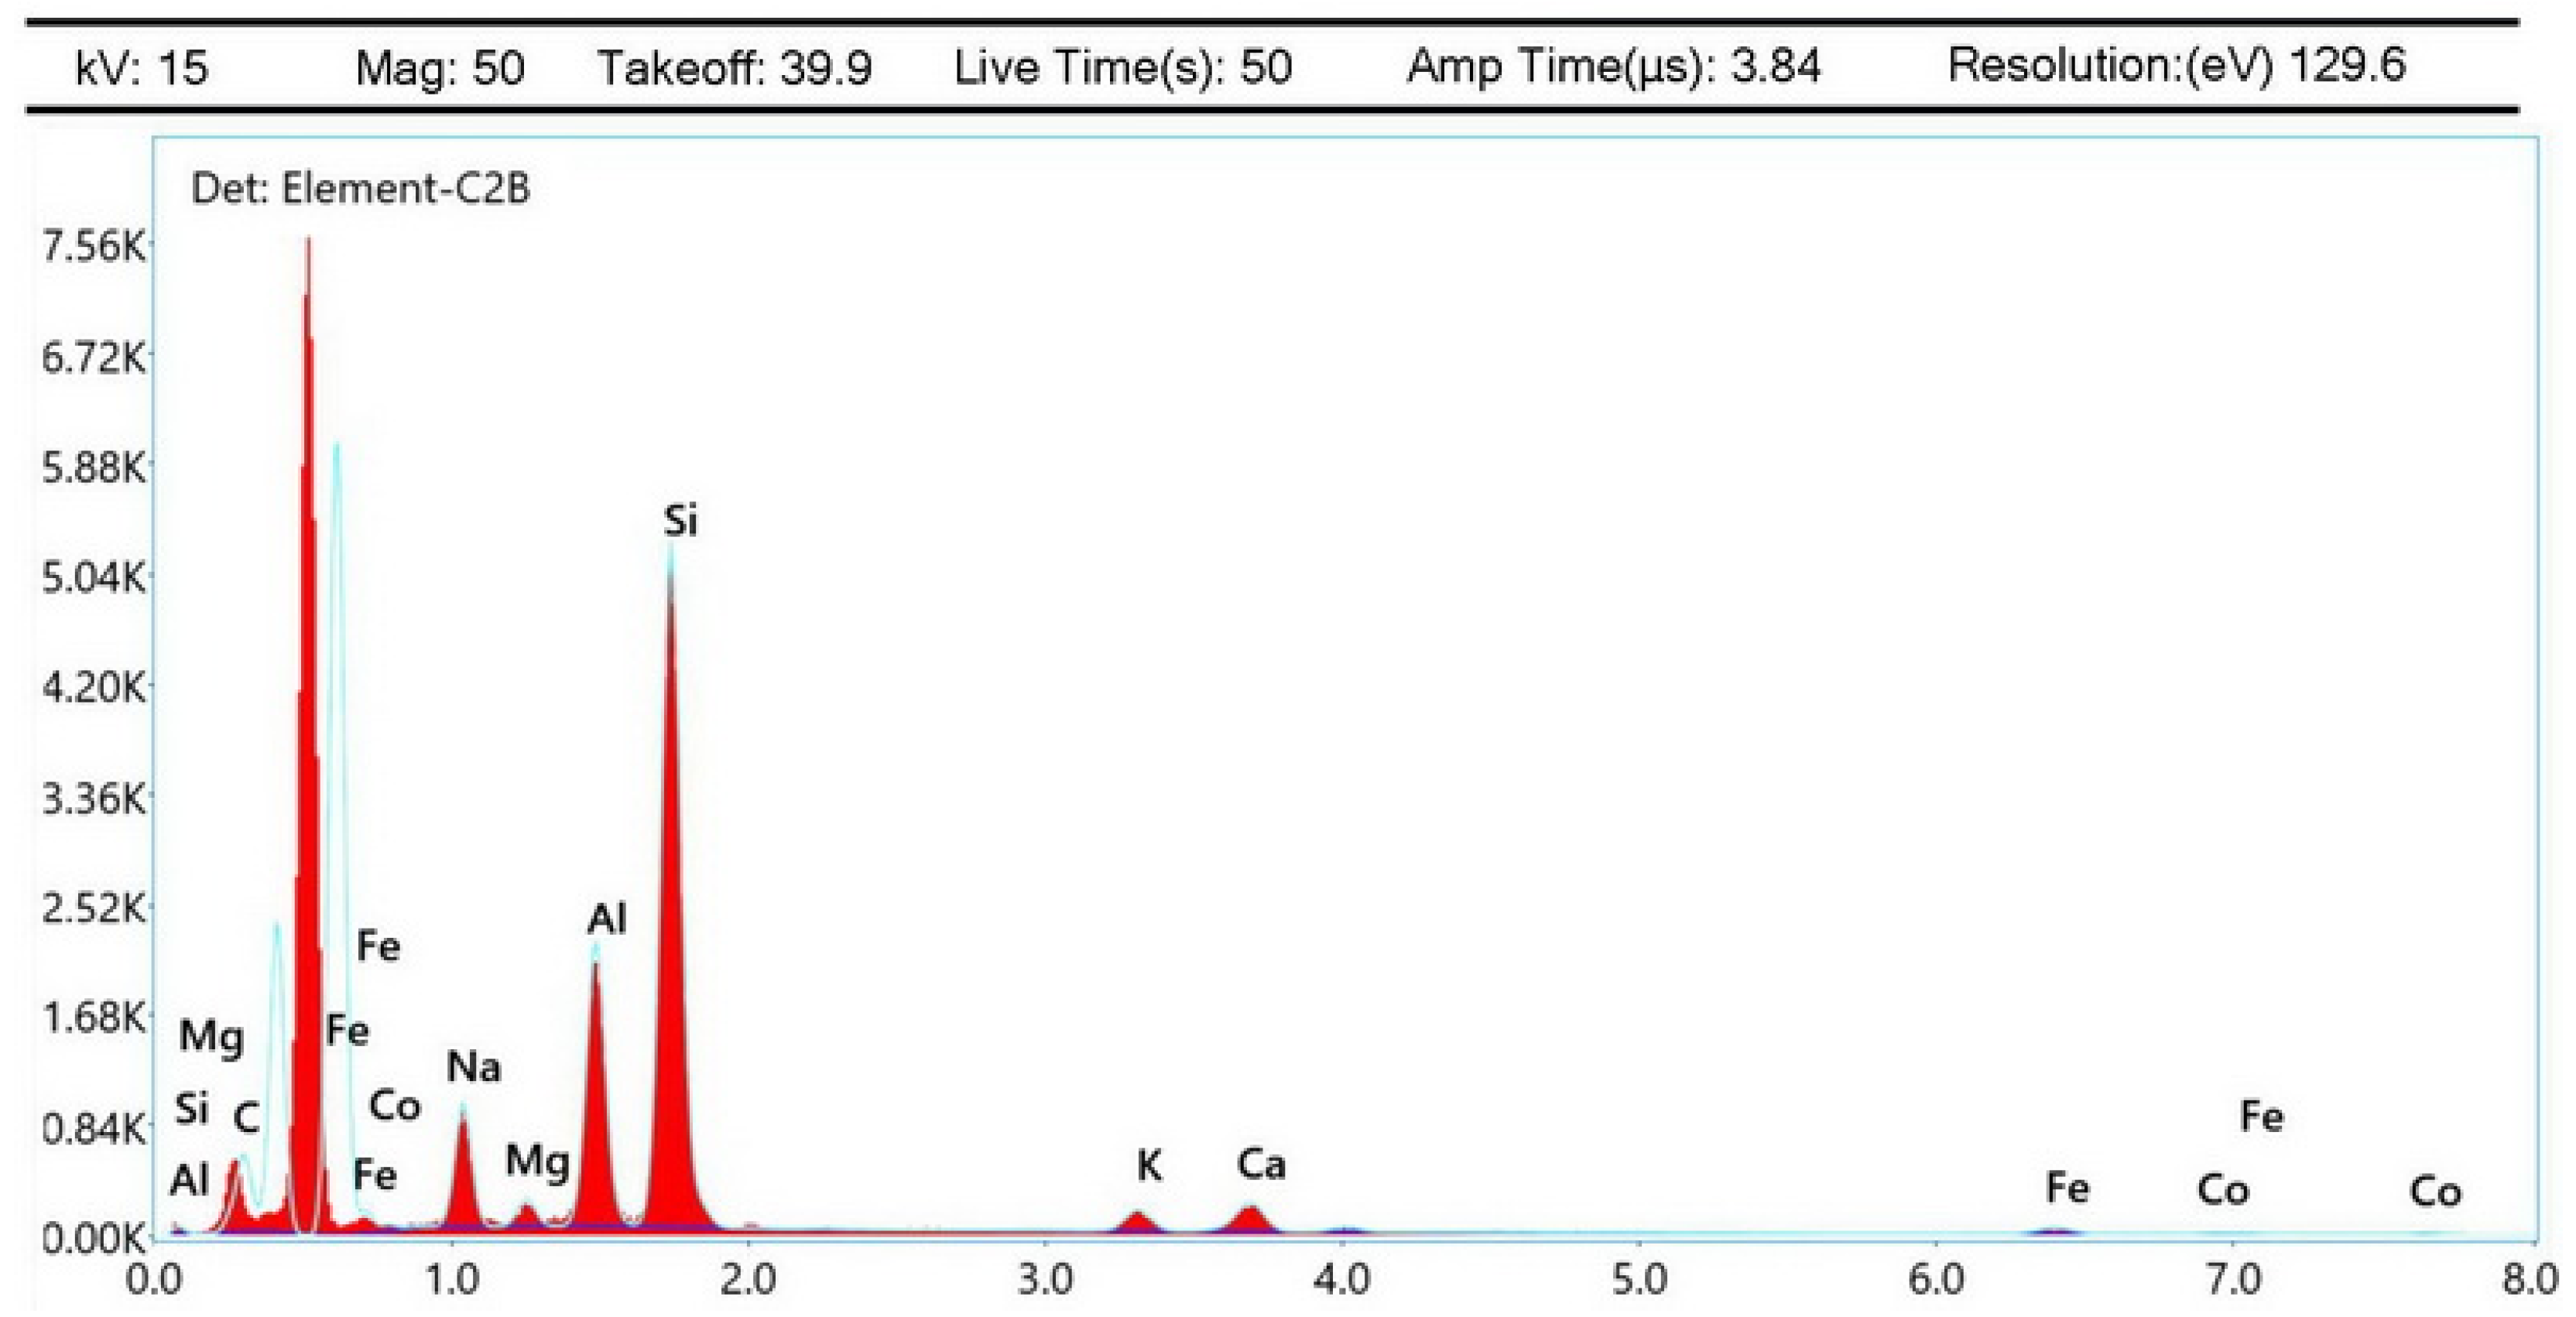
3.2. Chemical Composition Analysis of Surface Sediments

In addition to analyzing the chemical composition of surface water, we tried to analyze the composition of sediments by back scattered electron and energy dispersive spectroscopy (SEM-EDAX). The samples were taken from river banks (bays) where water had lower flows and sedimentation occurred constantly [40,41], and the results obtained are shown in Table 5.
Figure 3 shows the sample under an electronic microscope equipped with EDAX, for two samples from Danube and Cerna sediments, while Figure 4 presents the results obtained through EDAX elemental spectroscopy analysis.
Oxygen was removed from the EDAX results due to the risk of being present in the FEI microscope vacuum chamber due to sample manipulation.
This technique has the advantage that is applied directly to a dried sediment sample and can give a fast view on trace concentrations of heavy metals deposited on the surface of the sediment micro-pebble. The data obtained could be used to test and validate sediment deposition and transportation behavior through mathematical (CFD) models [42,43].
The goal of analyzing sediments surface composition instead of the standard mineralization method followed by atomic absorption spectrometry (or inductively coupled plasma-optical emission spectrometry) was to see if this much faster method could provide an overview of metals’ presence on sediment grains, for more targeted AAS/ICP-OES analysis.
In this frame and after analyzing the results obtained by the AEPS project team experts after sampling and analysis surface water on the Danube, one can observe that Ecological Status Classification varies from high (quality) to good on the Danube, with oxygen concentration parameters (DO, COD and BOD5) all IInd class, good; most of the nutrients (Na+, Ca2+, NH4−, NO3−, SO42−, TN) fall into Ist class, high quality, while orthophosphates P-PO43− concentrations classify Danube water quality in the IIIrd class, moderate.
The values of individual parameters for oxygen regime and nutrients concentration are similar with those observed during other scientific studies (for the summer season). For the middle Danube sector, the BOD ranged from 2.5 to 3.5 mg/L, ammonia from 0.1 to 0.2 mg/L, total nitrogen from 0.5 to 1.3 mg/L, nitrites from 0.06 to 0.12 mg/L, nitrates from 0.7 to 1.7 mg/L and orthophosphates from 0.04 to 0.07 mg/L on the Danube River in the region between Novi-Sad and Smederevo, Serbia [44,45,46]. A statistical analysis study [47] showed that in terms of nutrients Danube River surface water quality in Serbia has been slowly but constantly improving since 2013. Other studies focused on the Budapest region and found similar nutrient pollution values [48]. In the lower Danube basin, surface water quality shows improvement in the Galati area (main polluting source). In 2008, the water quality was classified in the fifth quality class for iron and copper, and in 2018 it was classified in the second quality class [49]. In the Lower Danube basin, the “hot spot” is given by the Galati area but significant improvements are observed. In 2010, in the Galati area the nitrites ranged between 0.2 and 0.6 mg/L and nitrates between 1.2 and 4.8 mg/L, mainly due to municipal and industrial waste waters discharge [50]. In the next years, mainly due to Romania accessing the EU structural funds, the situation improved, with nitrites values ranging between 0.04 and 0.1 mg/L and nitrates between 0.8 and 1.5 mg/L in 2015, lower than in pre-accession era [51]. Extensive studies on water quality in the Lower Danube basin, conducted on approximately 1500 samples analyzed between 2011 and 2017, showed that water quality can be characterized as moderately polluted (class III), indicating that the EU Water Framework Directives are not met [52]. A recent study conducted in the Galati-Tulcea area and analyzing 150 samples collected from 15 sampling points, in 2019, showed an improvement, with nitrites concentrations ranging from 0.02 to 0.036 mg/L [53].
The heavy metals concentration in Danube surface waters in the analyzed area were all (Hg, As, Pb, Zn, Cd and Mn) very low, well into Ist class, high quality. The only exception was found for Iron (Fe), whose values were constantly, at all lengths of the analyzed area, into IIIrd class, moderate water quality. With the exception of the Berzasca River, all other investigated rivers (Cerna, Nera, Pek and Porecka) showed a similar pattern for heavy metals. While all (Hg, As, Pb, Zn, Cd and Mn) showed concentration well under Ist class, iron (Fe) was constantly in the IInd or IIIrd quality class. This would bring to our minds that this pattern may suggest that high iron (Fe) concentration in the surface waters of the Danube, Nera, Cerna, Pek and Porecka may be caused by the regional geomorphic characteristics of the surrounding mountains and that iron concentrations are given by the washout of naturally occurring iron deposits.
Based on other studies focused on the heavy metal pollution of Danube surface waters, significant differences were recorded for the Middle and Lower Danube basins. In the Hungarian Pannonian area [54], the values of lead were 0.7–1.5 µg/L, of mercury were 0.02 µg/L, of arsenic were 0.9–2.6 µg/L and of zinc were <10 µg/L, while in Galati area [55], the values of lead were 2.49–3.88 µg/L and of zinc were 10–45 µg/L.
Another issue observed was on nutrients concentrations (orthophosphates, ammonia, nitrates, nitrites and sulphates). The issue was found on Nera, as the river flows through numerous villages, probably collecting washouts (or direct dump) from villages, house-holds and farms’ septic tanks. As both summer and autumn of 2020 were in extreme drought, it is unlikely that nutrients reaching the Nera River came from agricultural land washout. A similar or worse situation was found on the Pek and Porecka Rivers. Danube, on the other hand, was in the first class of water quality (high quality) in terms on nutrients, due to its volume and capacity of self-purification, with one exception, orthophosphates.
One significant cause for the high content of nutrients in Serbian river bodies can be deducted from Figure 5, which shows the technological status of urban waste treatment plants in Europe, in correlation with a population that benefits from centralized urban waste water collection systems. The most performant waste water treatment plants are so called “tertiary”, meaning that they provide phosphorus and nitrogen reduction before dumping.
The “secondary” waste water treatment plants provide only biological treatment, “primary” means that the system is only equipped with settling tanks and “collected without treatment” means that the urban waste water system only collects the waste waters from the population and dumps it without any treatment into natural water bodies.
Unfortunately, in the Serbian case, only a handful of urban waste water systems are in the “tertiary” zone, while more than 50% of the Serbian population that benefit from waste water systems are serviced by “collected without treatment”, bringing a significant stress onto the ecological status of Serbia rivers.
Up to 2000, Romania was in a similar situation as Serbia, in terms of waste water systems. The situation improved significantly (as seen in Figure 5 and Figure 6) with efforts to join the European Union Community and with 2007 as a target year to the enforcement of EU directives and with significant financial support through EU cohesion policy. However, even with significant progress in urban waste water treatment systems (such as in western Romania: Timisoara, Arad and Oradea), in other areas the progress was slow, as an example in Bucharest (with over 3 million inhabitants) the waste water system spills into the Dimbovita River (and subsequently into the Danube) about 50% of its waste waters without any treatment.
At the European level, the stress on surface waters quality has constantly decreased in the last 2 decades, with the main water quality parameters such as biological oxygen demand, ammonia, phosphates and nitrates following a significant decrease in concentration [58]. However, a new stress on the Danube basin is given nowadays by climate change in terms of water supply scarcity due to more frequent and for longer periods droughts in South-Eastern Europe, bringing into our attention that water is a resource that should be used in a sustainable way [59].
Nitrates (nutrients, in general) can be naturally removed from surface waters through deposition in floodplains, such as the Pannonian basin and Danube Delta [60,61,62]. The area investigated in the present study, the Iron Gate accumulation lake formed on the Danube by the Iron Gate I dam, also functions to remove pollutants through deposition, as it holds over 2200 million m3 of water, providing a buffer zone for the Lower Danube basin.
The decrease in BOD and ammonium concentrations is mainly because of a general improvement in waste water treatment throughout Europe. However, further improvement in waste water systems is needed on domestic, municipal and industrial sites [63,64,65]. The decrease in phosphorus concentration is likely related to improvements in waste water treatment and the reduction in phosphorus content in detergents. The decrease in nitrates is likely related to the effects of measures to reduce the agricultural inputs of nitrate and improvements in waste water treatment. In Central and Eastern European countries, the economic decline of the 1990s also contributed to a decrease in pollution from manufacturing industries [66].
In terms of the chemical status of surface waters in the Iron Gate Natural Park area, all surface waters investigated, the Danube, Nera, Pek, Cerna, Porecka and Berzasca Rivers, showed high quality or good quality chemical status. Chemical status is defined by concentrations of priority substances defined in the Environmental Quality Standards Directive 2008/105/EC amended by the Priority Substances Directive 2013/39/EU). Our findings are consistent with the Water Information System for Europe (WISE) in the frame of the Water Framework Directive map that contains information from the second River Basin Management Plans (RBMPs) reported by EU Member States, as seen in Figure 7.

4. Conclusions

In conclusion, in the area analyzed by us, the Djerdap and Iron Gate natural parks, the surface water quality of the Danube and its main tributaries in the area, the Nera, Porecka, Berzasca, Pek and Cerna Rivers, can be classified as high quality along its course and good or moderate quality on various segments of water bodies.
Results obtained are limited to a 240 km length of a part of the Middle Danube Basin defined by the Romanian–Serbian border. Another limitation of representativeness is given by the relatively low number of sampling locations, 17 on the Danube and 28 on the Danube tributaries in the studied area. However, the results presented fill in a lack of surface water quality data available for this specific area.
The main stresses identified in the analyzed area are from waste water treatment systems (or the lack of them), agricultural land washouts contributing to the pollution of surface waters with ammonia, phosphates and nitrites, and industrial activity with an emphasis on mining activity’s impact in Majdanpek on the water quality of the Pek River and in Moldova-Noua on the Danube directly.
The study aimed to obtain relevant data for the oxygen consumption, nutrients levels and heavy metals contamination of targeted surface waters, with an additional potential application of the SEM-EDAX characterization of heavy metals deposition on sediments’ micro-pebbles surface. Based on the fast SEM-EDAX result, one can analyze, for a specific heavy metal, if a time-consuming sediment sample mineralization followed by AAS detection is necessary.
In our Romania–Serbia cross-border area, especially as it is one of the most beautiful and wild parts of the entire Danube’s course to the Black Sea, we must give more focused attention to prevent organic pollution from waste water as well as diffuse runoff from agriculture, as they negatively affect aquatic ecosystems, causing a loss of oxygen and changes in species composition, deteriorating the ecological status of the Danube and its surrounding areas.

Author Contributions

Conceptualization and methodology, F.P. and M.T. (Milan Trumić); UV-VIS analysis, A.E.C., G.T.-T. and V.S.; AAS analysis; F.P. and B.V.; ICP-OS analysis, G.B. and M.T. (Maja Trumić); EDAX analysis, C.O.; writing—review, all authors; editing, F.P. All authors have read and agreed to the published version of the manuscript.

Funding

This research was funded by INTERREG IPA-CBC Romania-Serbia Programme, project RORS-462.

Data Availability Statement

Complete data set can be obtained by request to the corresponding author.

Acknowledgments

This research has been conducted under the cross-border cooperation project AEPS (aeps.upt.ro) “Academic Environmental Protection Studies on surface water quality in significant cross-border nature reservations Djerdap/Iron Gate national park and Carska Bara special nature reserve, with population awareness raising workshops”, funded by the INTERREG IPA-CBC Romania-Serbia Programme.

Conflicts of Interest

The authors declare no conflict of interest.

References

  1. Calmuc, V.A.; Calmuc, M.; Arseni, M.; Topa, C.M.; Timofti, M.; Burada, A.; Iticescu, C.; Georgescu, L.P. Assessment of Heavy Metal Pollution Levels in Sediments and of Ecological Risk by Quality Indices, Applying a Case Study: The Lower Danube River, Romania. Water 2021, 13, 1801. [Google Scholar] [CrossRef]
  2. Tetelea, C. Morphometric analysis to extrapolate geo-ecological potential of the rivers in the “Iron Gates” natural park (Banat, Romania). Transylv. Rev. Syst. Ecol. Res. 2014, 16, 29–46. [Google Scholar] [CrossRef]
  3. Dimkić, D.; Prohaska, S.; Stanković, B.; Pajić, P. Alluvial Water Source Capacity under the Climate Change and Other Impacts—Case Study of the Pek River in Serbia. Proceedings 2018, 2, 596. [Google Scholar] [CrossRef]
  4. European Environmental Agency, COM/2012/0673, A Blueprint to Safeguard Europe’s Water Resources. Available online: http://eur-lex.europa.eu/legal-content/EN/TXT/?uri=CELEX:52012DC0673 (accessed on 31 July 2022).
  5. Górski, J.; Dragon, K.; Kaczmarek, P.M.J. Nitrate pollution in the Warta River (Poland) between 1958 and 2016: Trends and causes. Environ. Sci. Pollut. Res. 2019, 26, 2038–2046. [Google Scholar] [CrossRef] [PubMed]
  6. Stahl, K.; Tallaksen, L.M.; Hannaford, J.; van Lanen, H.A.J. Filling the white space on maps of European runoff trends: Estimates from a multi-model ensemble. Hydrol. Earth Syst. Sci. 2012, 16, 2035–2047. [Google Scholar] [CrossRef]
  7. Pawellek, F.; Frauensten, F.; Veizer, J. Hydrochemistry and isotope geochemistry of the upper Danube River. Geochim. Cosmochim. Acta 2002, 66, 3839–3854. [Google Scholar] [CrossRef]
  8. Toth, B.; Bodis, E. Estimation of suspended loads in the Danube River at Göd (1668 river km), Hungary. J. Hydrol. 2015, 523, 139–146. [Google Scholar] [CrossRef]
  9. Baranya, S.; Jozsa, J. Estimation of suspended sediment concentrations with ADCP in Danube River. J. Hydrol. Hydromech. 2013, 61, 232–240. [Google Scholar] [CrossRef]
  10. Cozzi, S.; Ibáñez, C.; Lazar, L.; Raimbault, P.; Giani, M. Flow Regime and Nutrient-Loading Trends from the Largest South European Watersheds: Implications for the Productivity of Mediterranean and Black Sea’s Coastal Areas. Water 2019, 11, 1. [Google Scholar] [CrossRef]
  11. Bostan, V.; Dominik, J.; Bostina, M.; Pardos, M. Forms of particulate phosphorus in suspension and in bottom sediment in the Danube Delta. Lakes Reserv. Res. Manag. 2000, 5, 105–110. [Google Scholar] [CrossRef]
  12. Reschke, S.; Ittekkot, V.; Panin, N. The Nature of Organic Matter in the Danube River Particles and North-western Black Sea Sediments. Estuar. Coast. Shelf Sci. 2002, 54, 563–574. [Google Scholar] [CrossRef]
  13. Burt, T.; Howden, N.; Worrall, F. On the importance of very long-term water quality records. Wiley Interdiscip. Rev. Water 2013, 1, 41–48. [Google Scholar] [CrossRef]
  14. Frincu, R.M.; Iulian, O. Long-Term Water Quality Trends in the Lower Danube (1996–2017). UPB Sci. Bull. Ser. B 2020, 82, 147–158. [Google Scholar]
  15. Radu, V.-M.; Diacu, E.; Ionescu, P. Characterization of the eutrophication potential for the lower part of the Danube river. UPB Sci. Bull. Ser. B Chem. Mater. Sci. 2014, 76, 137–146. [Google Scholar]
  16. Hamchevici, C.; Udrea, I. Pollution by Nutrients in the Danube Basin. Handb. Environ. Chem. 2015, 39, 39–59. [Google Scholar]
  17. Diamantini, E.; Lutz, S.R.; Mallucci, S.; Majone, B.; Merz, R.; Bellin, A. Driver detection of water quality trends in three large European river basins. Sci. Total Environ. 2018, 612, 49–62. [Google Scholar] [CrossRef]
  18. Kortenkamp, A.; Faust, M.; Backhaus, T.; Altenburger, R.; Scholze, M.; Müller, C.; Ermler, S.; Posthuma, L.; Brack, W. Mixture risks threaten water quality: The European Collaborative Project SOLUTIONS recommends changes to the WFD and better coordination across all pieces of European chemicals legislation to improve protection from exposure of the aquatic environment to multiple pollutants. Environ. Sci. Eur. 2019, 31, 1–4. [Google Scholar] [CrossRef]
  19. Benefati, E.; Barcelo, D.; Johnson, I.; Galassi, S.; Levsen, K. Emerging organic contaminants in leachates from industrial waste landfills and industrial effluent. TrAC Trends Anal. Chem. 2003, 22, 757–765. [Google Scholar] [CrossRef]
  20. Gasparotti, C. The main factors of water pollution in Danube River basin. Euro Econ. 2014, 33, 93–106. [Google Scholar]
  21. Elkhatat, A.M.; Soliman, M.; Ismail, R.; Ahmed, S.; Abounahia, N.; Mubashir, S.; Khraisheh, M. Recent trends of copper detection in water samples. Bull. Natl. Res. Cent. 2021, 45, 218. [Google Scholar] [CrossRef]
  22. Tian, Y.; Jiang, Y.; Liu, Q.; Dong, M.; Xu, D.; Liu, Y.; Xu, X. Using a water quality index to assess the water quality of the upper and middle streams of the Luanhe River, northern China. Sci. Total Environ. 2019, 667, 142–151. [Google Scholar] [CrossRef] [PubMed]
  23. Behmel, S.; Damour, M.; Ludwig, R.; Rodriguez, M.J. Water quality monitoring strategies—A review and future perspectives. Sci. Total Environ. 2016, 571, 1312–1329. [Google Scholar] [CrossRef] [PubMed]
  24. Serbula, S.; Ristic, A.; Manasijević, S.; Dolić, N. Heavy metal ions in the wastewater of the Majdanpek copper mine. Mater. Prot. 2015, 56, 52–58. [Google Scholar] [CrossRef]
  25. Pu, X.; Hu, B.; Jiang, Z.; Huang, C. Speciation of dissolved iron(II) and iron(III) in environmental water samples by gallic acid-modified nanometer-sized alumina micro-column separation and ICP-MS determination. Analyst 2005, 130, 1175–1181. [Google Scholar] [CrossRef] [PubMed]
  26. Frîncu, R.-M. Long-Term Trends in Water Quality Indices in the Lower Danube and Tributaries in Romania (1996–2017). Int. J. Environ. Res. Public Health 2021, 18, 1665. [Google Scholar] [CrossRef] [PubMed]
  27. Enache, I.; Birghila, S.; Dumbrava, A. The Danube River water quality characteristics in the Braila Town. Ovidius Univ. Ann. Chem. 2009, 20, 146–152. [Google Scholar]
  28. Worsfold, P.J.; Lohan, M.C.; Ussher, S.J.; Bowie, A.R. Determination of dissolved iron in seawater: A historical review. Mar. Chem. 2014, 166, 25–35. [Google Scholar] [CrossRef]
  29. Halder, J.; Vystavna, Y.; Wassenaar, L.I. Nitrate sources and mixing in the Danube watershed: Implications for transboundary river basin monitoring and management. Sci. Rep. 2022, 12, 2150. [Google Scholar] [CrossRef]
  30. Barbulescu, A.; Barbes, L. Assessing the water quality of the Danube River (at Chiciu, Romania) by statistical methods. Environ. Earth Sci. 2020, 79, 122. [Google Scholar] [CrossRef]
  31. Birghila, S.; Baronescu, G.; Dumbrava, A. Seasonal variation and speciation of dissolved iron in an artificial surface water body. Ovidius Univ. Ann. Chem. 2017, 28, 43–48. [Google Scholar] [CrossRef]
  32. Morgan, B.; Lahav, O. The effect of pH on the kinetics of spontaneous Fe (II) oxidation by O2 in aqueous solution—Basic principles and a simple heuristic description. Chemosphere 2007, 68, 2080–2084. [Google Scholar] [CrossRef]
  33. Pekárová, P.; Onderka, M.; Pekár, J.; Rončák, P.; Miklánek, P. Prediction of Water Quality in the Danube River Under extreme Hydrological and Temperature Conditions. J. Hydrol. Hydromech. 2009, 57, 3–15. [Google Scholar] [CrossRef]
  34. Haas, M.B.; Guse, B.; Fohrer, N. Assessing the impacts of Best Management Practices on nitrate pollution in an agricultural dominated lowland catchment considering environmental protection versus economic development. J. Environ. Manag. 2017, 196, 347–364. [Google Scholar] [CrossRef] [PubMed]
  35. Malago, A.; Bouraoui, F.; Vigiak, O.; Grizzetti, B.; Pastori, M. Modelling water and nutrient fluxes in the Danube River Basin with SWAT. Sci. Total Environ. 2017, 603, 196–218. [Google Scholar] [CrossRef] [PubMed]
  36. Petrovic, N.V.; Markovic, D. Assessment of water quality of the Pek River based on physicochemical analysis. Arch. Tech. Sci. 2015, 13, 59–66. [Google Scholar] [CrossRef] [Green Version]
  37. Milanovic, A.; Kovacevic-Majkic, J.; Milojevic, M. Water quality analysis of Danube River in Serbia—Pollution and protection problems. Bull. Serb. Geogr. Soc. 2010, 90, 47–68. [Google Scholar] [CrossRef]
  38. Zivadinovic, I.; Ilijevic, K.; Grzetic, I.; Popovic, A. Longterm changes in the eco-chemical status of the Danube River in the region of Serbia. J. Serb. Chem. Soc. 2010, 75, 1125–1148. [Google Scholar] [CrossRef]
  39. Takic, L.; Mladenovic-Ranisavljevic, I.; Vukovic, M.; Mladenovic, I. Evaluation of the Ecochemical Status of the Danube in Serbia in Terms of Water Quality Parameters. Sci. World J. 2012, 2012, 930737. [Google Scholar] [CrossRef]
  40. Obolewski, K.; Habel, M.; Chalov, S. River sediment quality and quantity: Environmental, geochemical and ecological perspectives. Ecohydrol. Hydrobiol. 2021, 21, 565–569. [Google Scholar] [CrossRef]
  41. Chalov, S.; Golosov, V.; Tsyplenkov, A.; Theuring, P.; Zakerinejad, R.; Märker, M.; Samokhin, M. A toolbox for sediment budget research in small catchments. Geogr. Environ. Sustain. 2017, 10, 43–68. [Google Scholar] [CrossRef]
  42. Torok, G.T.; Jozsa, J.; Baranya, S. A Novel Sediment Transport Calculation Method-Based 3D CFD Model Investigation of a Critical Danube Reach. Pol. J. Environ. Stud. 2020, 29, 2889–2899. [Google Scholar] [CrossRef]
  43. Torok, G.T.; Baranya, S.; Ruther, N. 3D CFD modeling of Local Scouring, Bed Armoring and Sediment Deposition. Water 2017, 9, 56. [Google Scholar] [CrossRef]
  44. Durlevic, U. The Analysis of the Quality of Surface Water of Danube in the Republic of Serbia for 2018. Collect. Pap. Fac. Geogr. Univ. Belgrade 2020, 68, 53–70. [Google Scholar] [CrossRef]
  45. Takic, L.; Mladenovic-Ranisavljevic, I.; Vasovic, D.; Dordevic, L. The Assessment of the Danube RiverWater Pollution in Serbia. Water Air Soil Pollut. 2017, 228, 380. [Google Scholar] [CrossRef]
  46. Ilijevic, K.; Grzetic, I.; Zivadinovic, I.; Popovic, A. Long-term seasonal changes of the Danube River ecochemical status in the region of Serbia. Environ. Monit. Assess. 2012, 184, 2805–2828. [Google Scholar] [CrossRef]
  47. Leščešen, I.; Dolinaj, D.; Pantelić, M.; Savić, S.; Milošević, D. Statistical Analysis of Water Quality Parameters in Seven Major Serbian Rivers during 2004–2013 Period. Water Resour. 2018, 45, 418–426. [Google Scholar] [CrossRef]
  48. Nagy-Kovács, Z.; Davidesz, J.; Czihat-Mártonné, K.; Till, G.; Fleit, E.; Grischek, T. Water Quality Changes during Riverbank Filtration in Budapest, Hungary. Water 2019, 11, 302. [Google Scholar] [CrossRef]
  49. Wolfram, J.; Stehle, S.; Bub, S.; Petshick, L.L.; Shults, R. Water quality and ecological risks in European surface waters—Monitoring improves while water quality decreases. Environ. Int. 2021, 152, 106479. [Google Scholar] [CrossRef]
  50. Manoiu, V.M.; Craciun, A.I. Danube river water quality trends: A qualitative review based on the open access web of science database. Ecohydrol. Hydrobiol. 2021, 21, 613–628. [Google Scholar] [CrossRef]
  51. Gideon, A.A.; Cioroi, M.; Praisler, M.; Constantin, O.; Palela, M.; Bahrim, G. An Ecological Assessment of the Pollution Status of the Danube River Basin in the Galati Region—Romania. J. Water Resour. Prot. 2013, 5, 876–886. [Google Scholar] [CrossRef]
  52. Tuchiu, E. Impact of Human Activities on Nutrient Loads in the Lower Danube Water Bodies. Risks Catastr. J. 2019, 24, 7–30. [Google Scholar] [CrossRef]
  53. Radu, V.M.; Ionescu, P.; Deak, G.; Diacu, E.; Ivanov, A.A.; Zamfir, S.; Marcus, M.I. Overall assessment of surface water quality in the Lower Danube River. Environ. Monit. Assess. 2020, 192, 135. [Google Scholar] [CrossRef] [PubMed]
  54. Iticescu, C.; Georgescu, L.P.; Murariu, G.; Topa, C.; Timofti, M.; Pintilie, V.; Arseni, M.; Timofti, M. Lower Danube Water Quality Quantified through WQI and Multivariate Analysis. Water 2019, 11, 1305. [Google Scholar] [CrossRef]
  55. Calmuc, M.; Calmuc, V.; Arseni, M.; Topa, C.; Timofti, M.; Georgescu, L.P.; Iticescu, C. A Comparative Approach to a Series of Physico-Chemical Quality Indices Used in Assessing Water Quality in the Lower Danube. Water 2020, 12, 3239. [Google Scholar] [CrossRef]
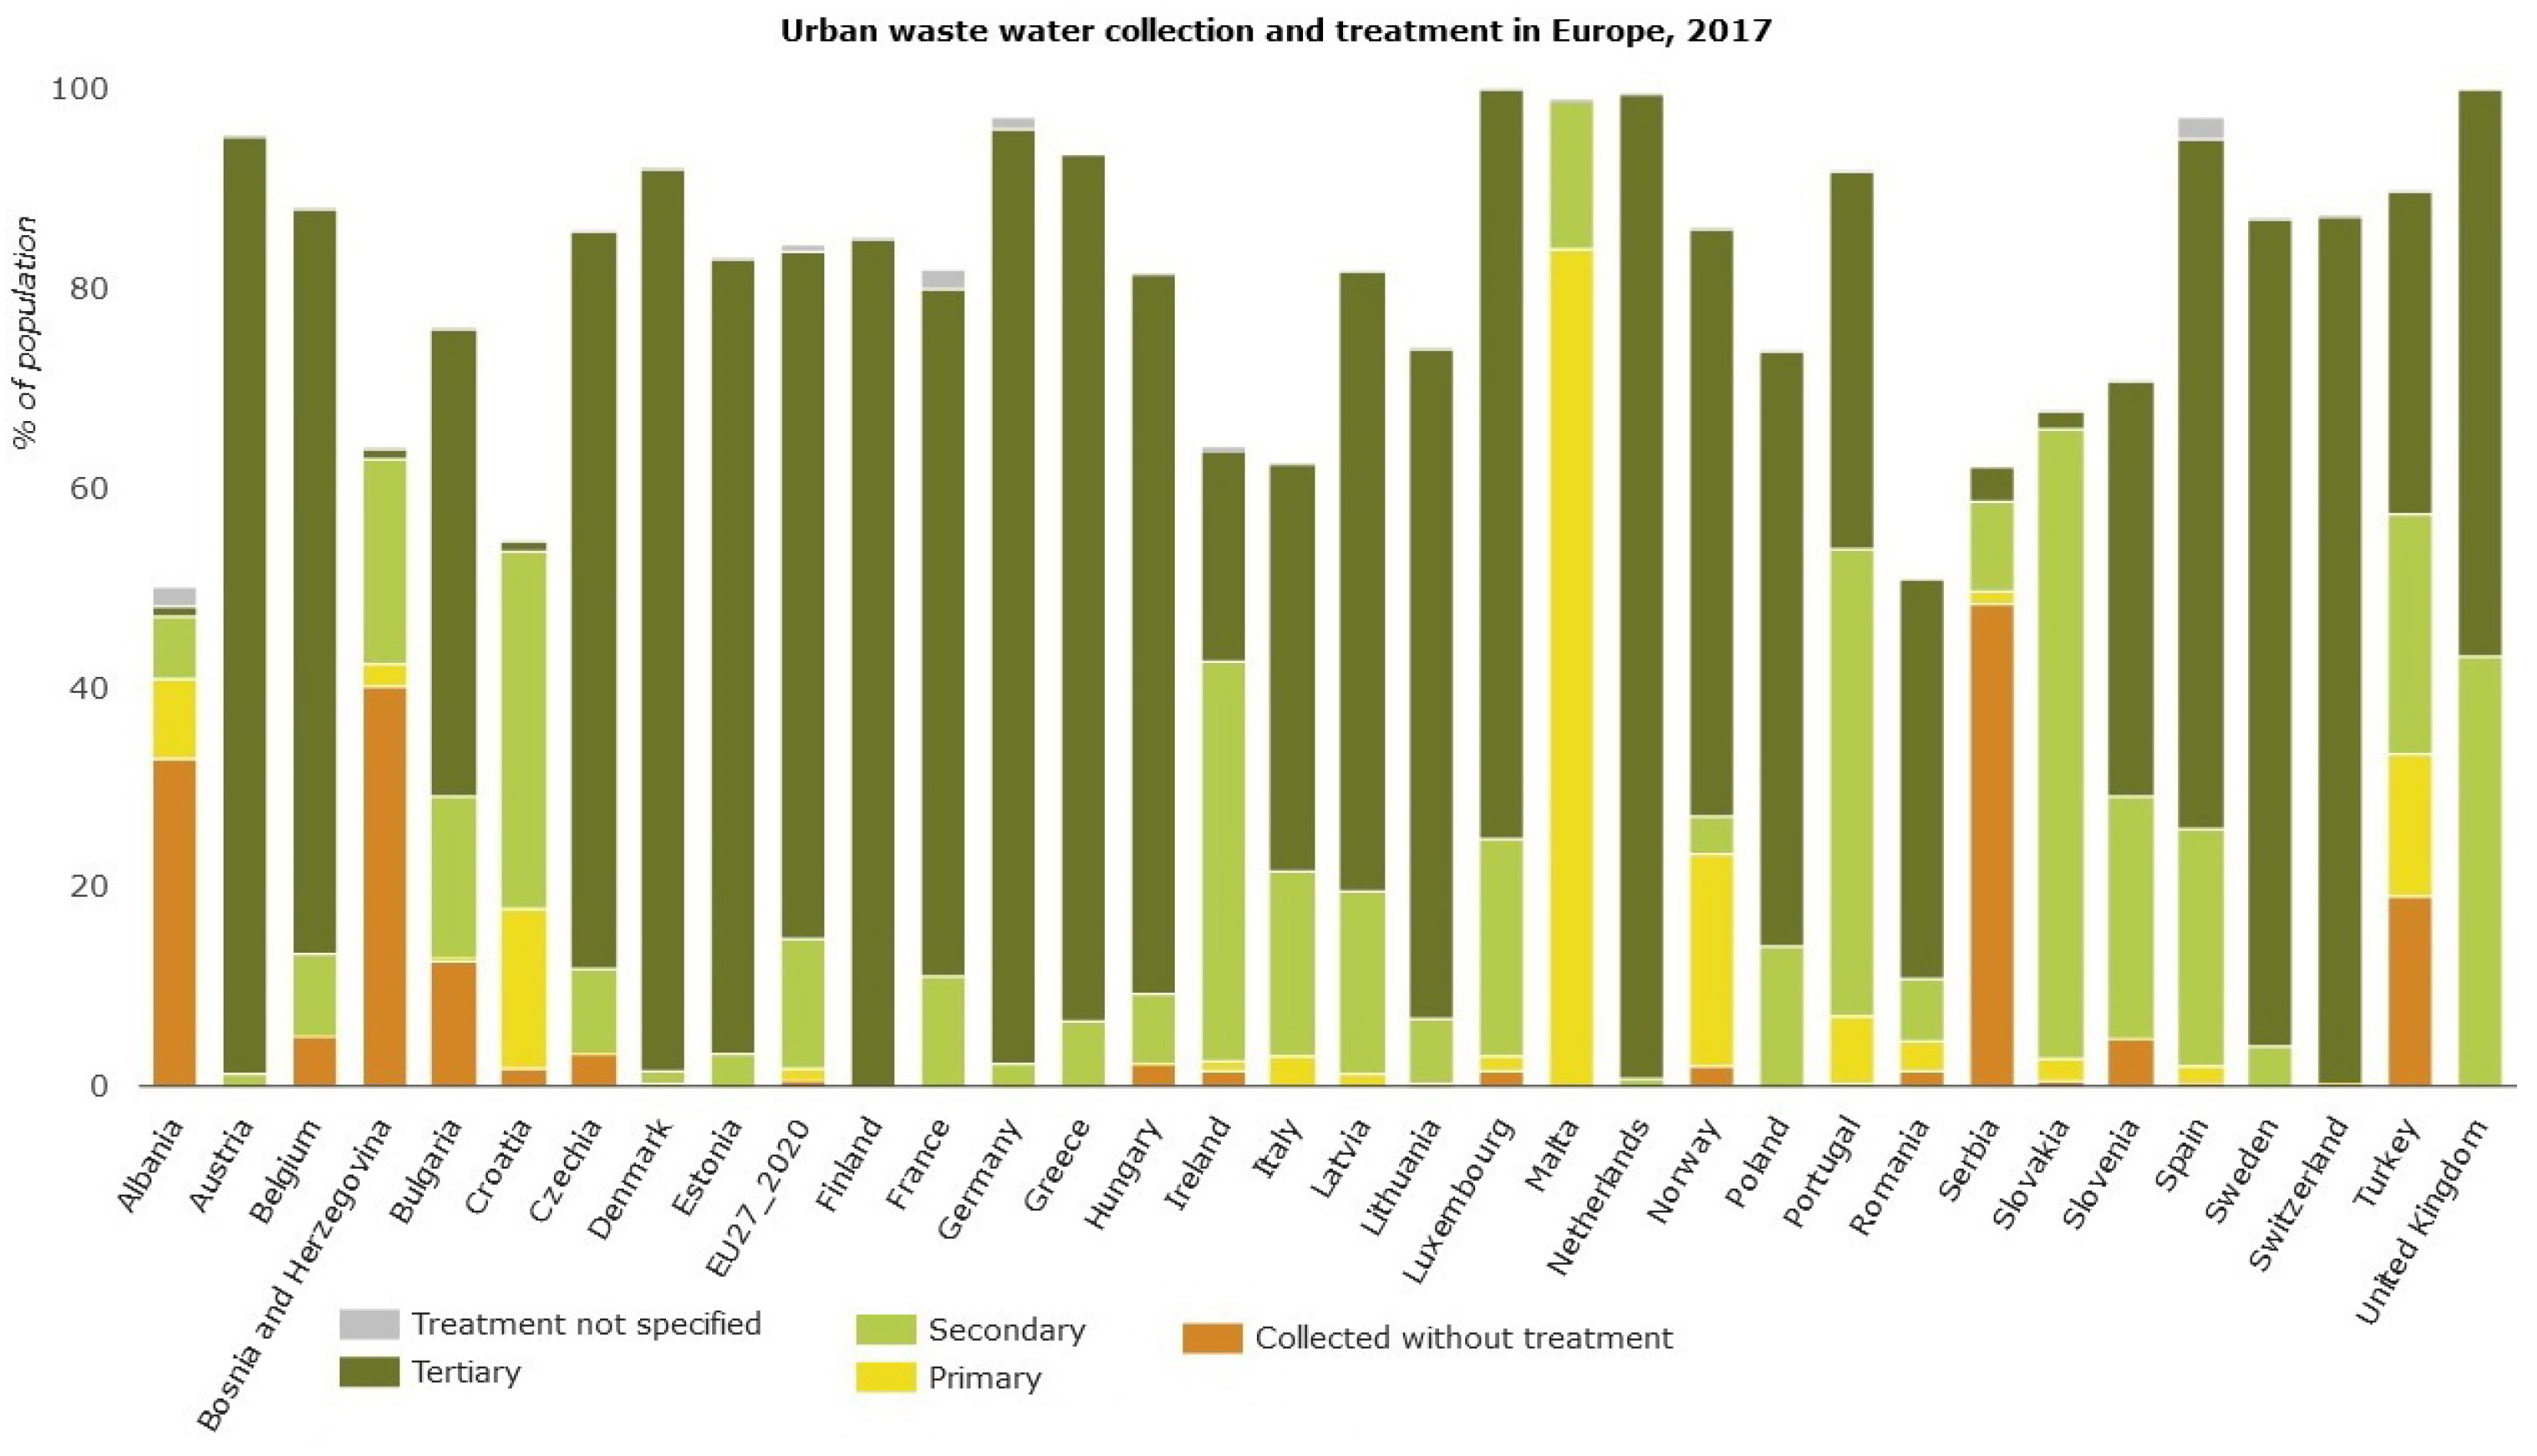
  56. European Environmental Agency. Urban Waste Water Collection and Treatment in Europe. 2017. Available online: https://www.eea.europa.eu/data-and-maps/daviz/urban-waste-water-treatment-in-europe#tab-chart_10673 (accessed on 30 July 2022).
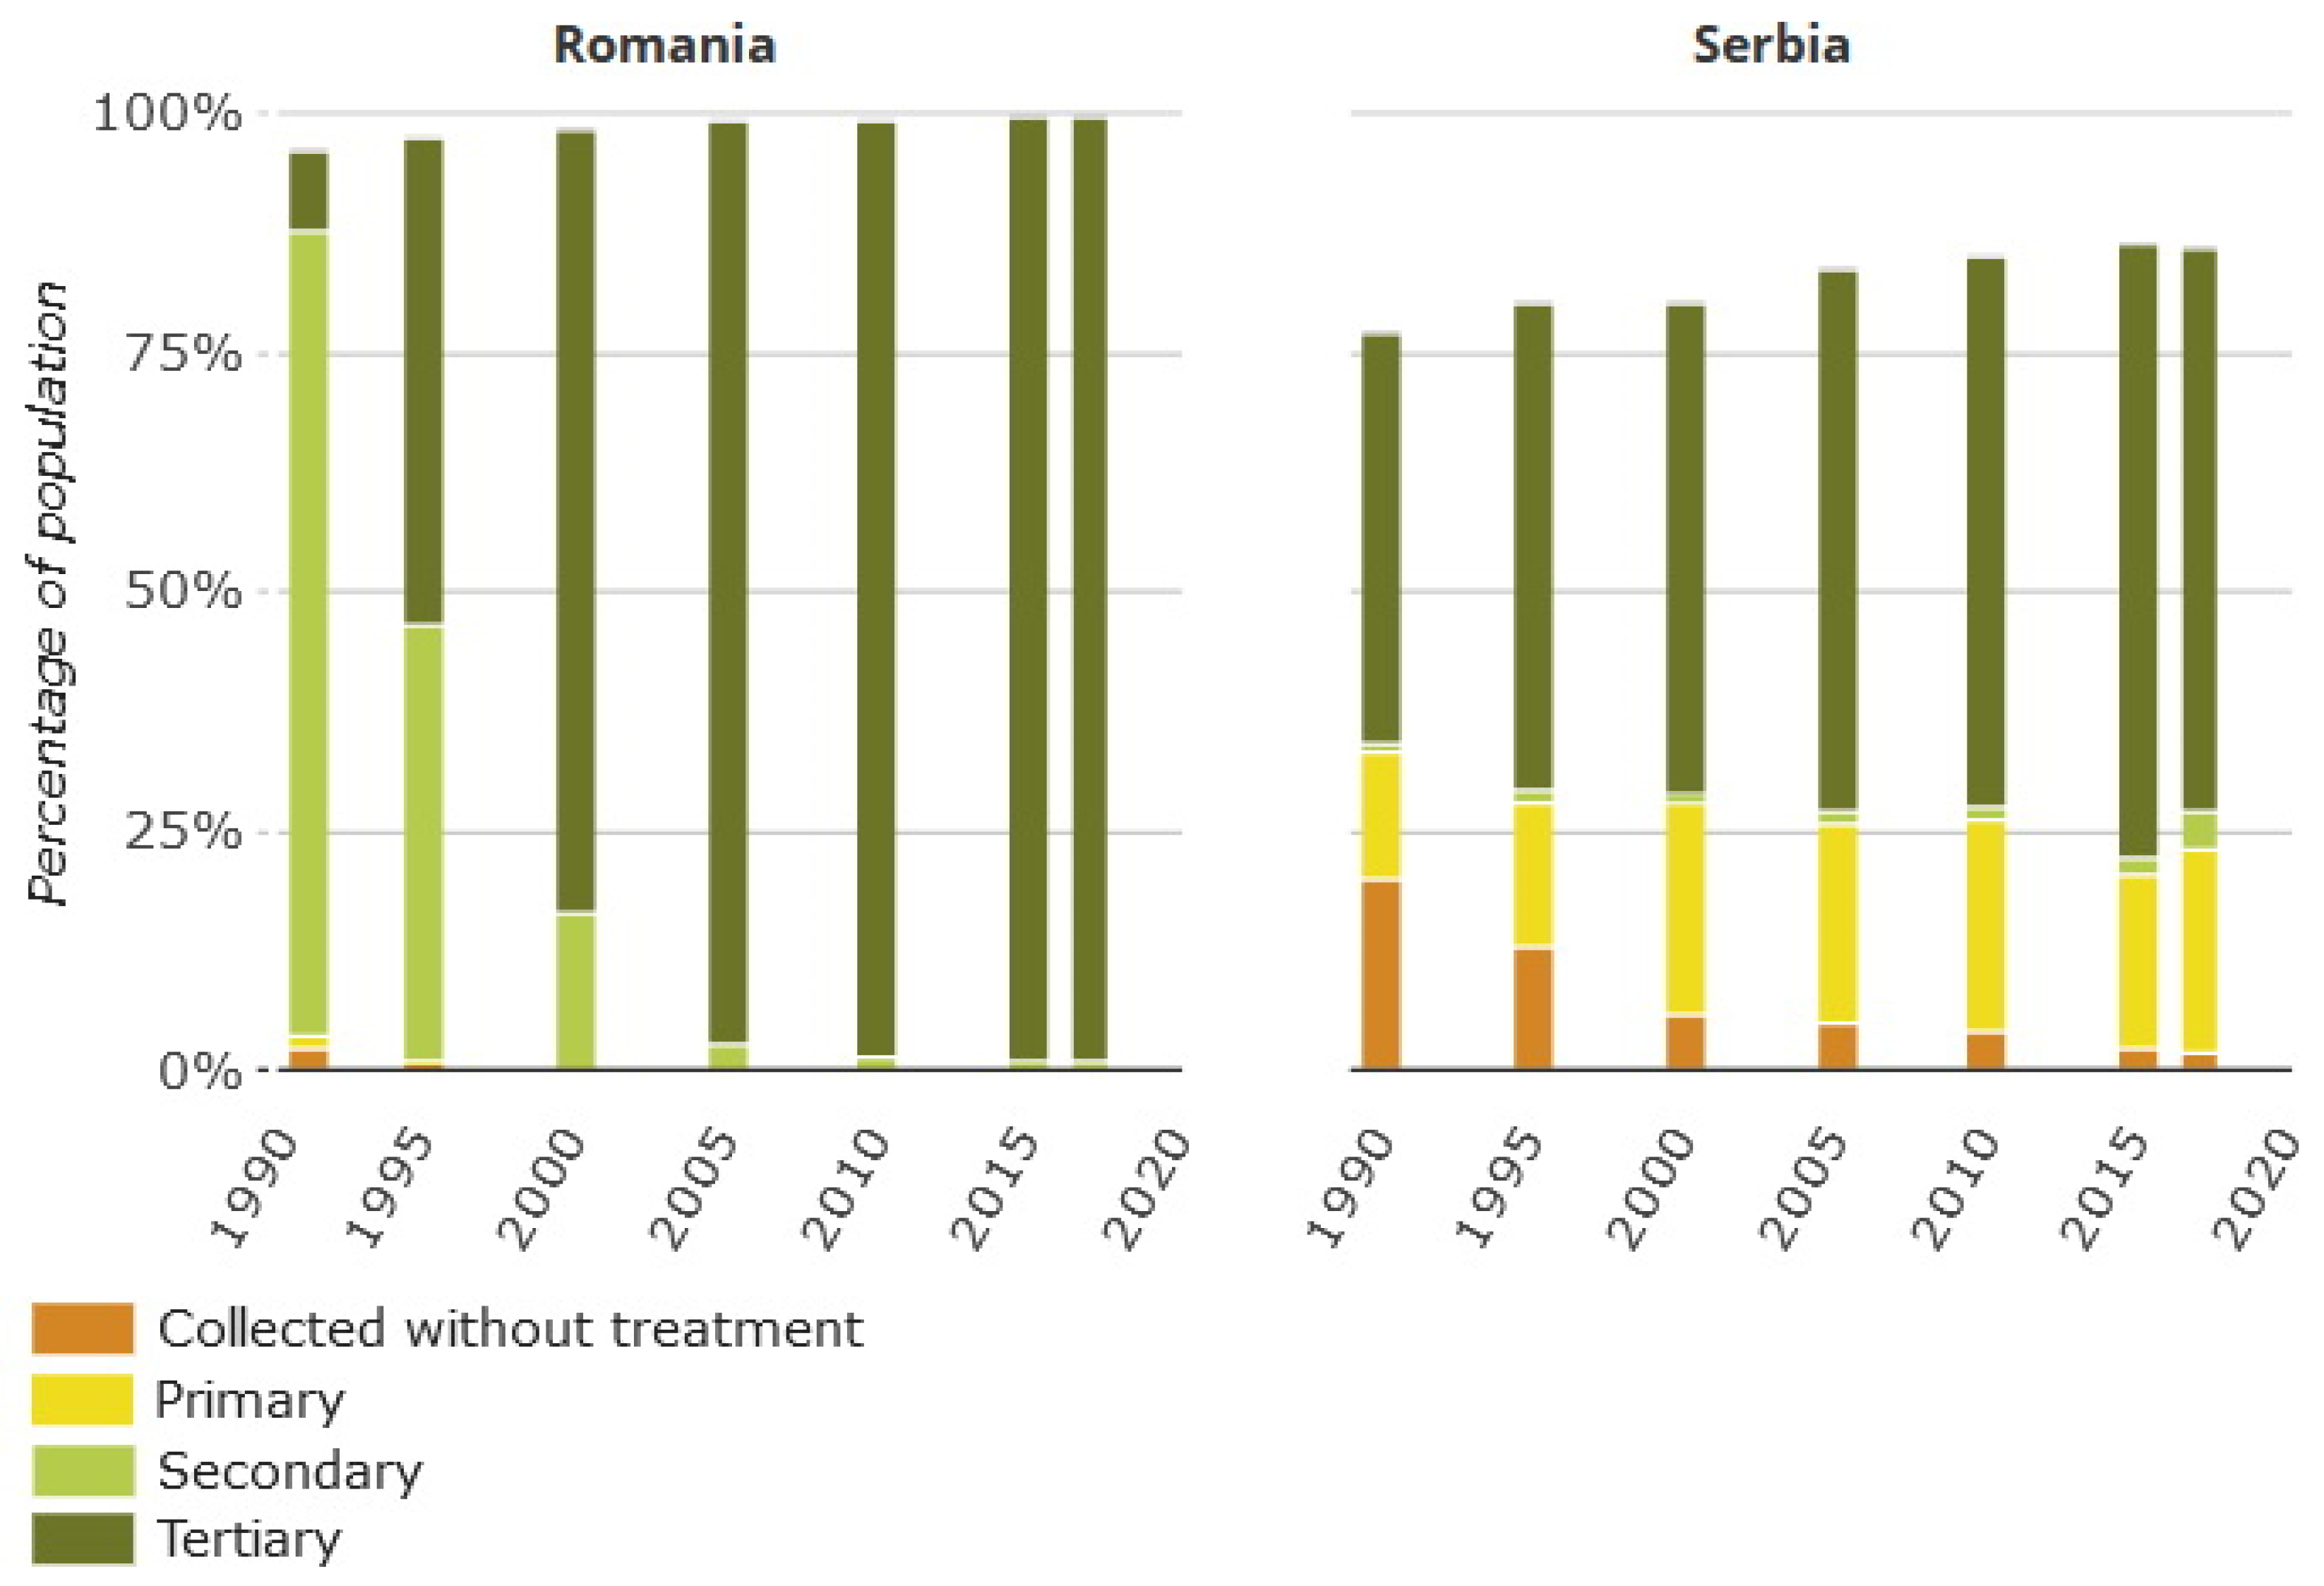
  57. European Environmental Agency. Change in Urban Waste Water Treatment in European Countries, 1990–2017. Available online: https://www.eea.europa.eu/data-and-maps/indicators/urban-waste-water-treatment/urban-waste-water-treatment-assessment-5 (accessed on 30 July 2022).
  58. Simionov, I.A.; Cristea, V.; Petrea, S.M.; Mogodan Antache, A.; Nica, A.; Strungaru, S.A.; Ene, A.; Sarpe, D. Heavy metal evaluation in the lower sector of Danube river. Sci. Pap. 2020, 9, 11–16. [Google Scholar]
  59. Simionov, I.A.; Cristea, D.S.; Petrea, S.M.; Mogodan, A.; Nicoara, N.; Plavan, G.; Baltag, E.S.; Jijie, R.; Strungaru, S.A. Preliminary investigation of lower Danube pollution caused by potentially toxic metals. Chemosphere 2021, 264, 128496. [Google Scholar] [CrossRef]
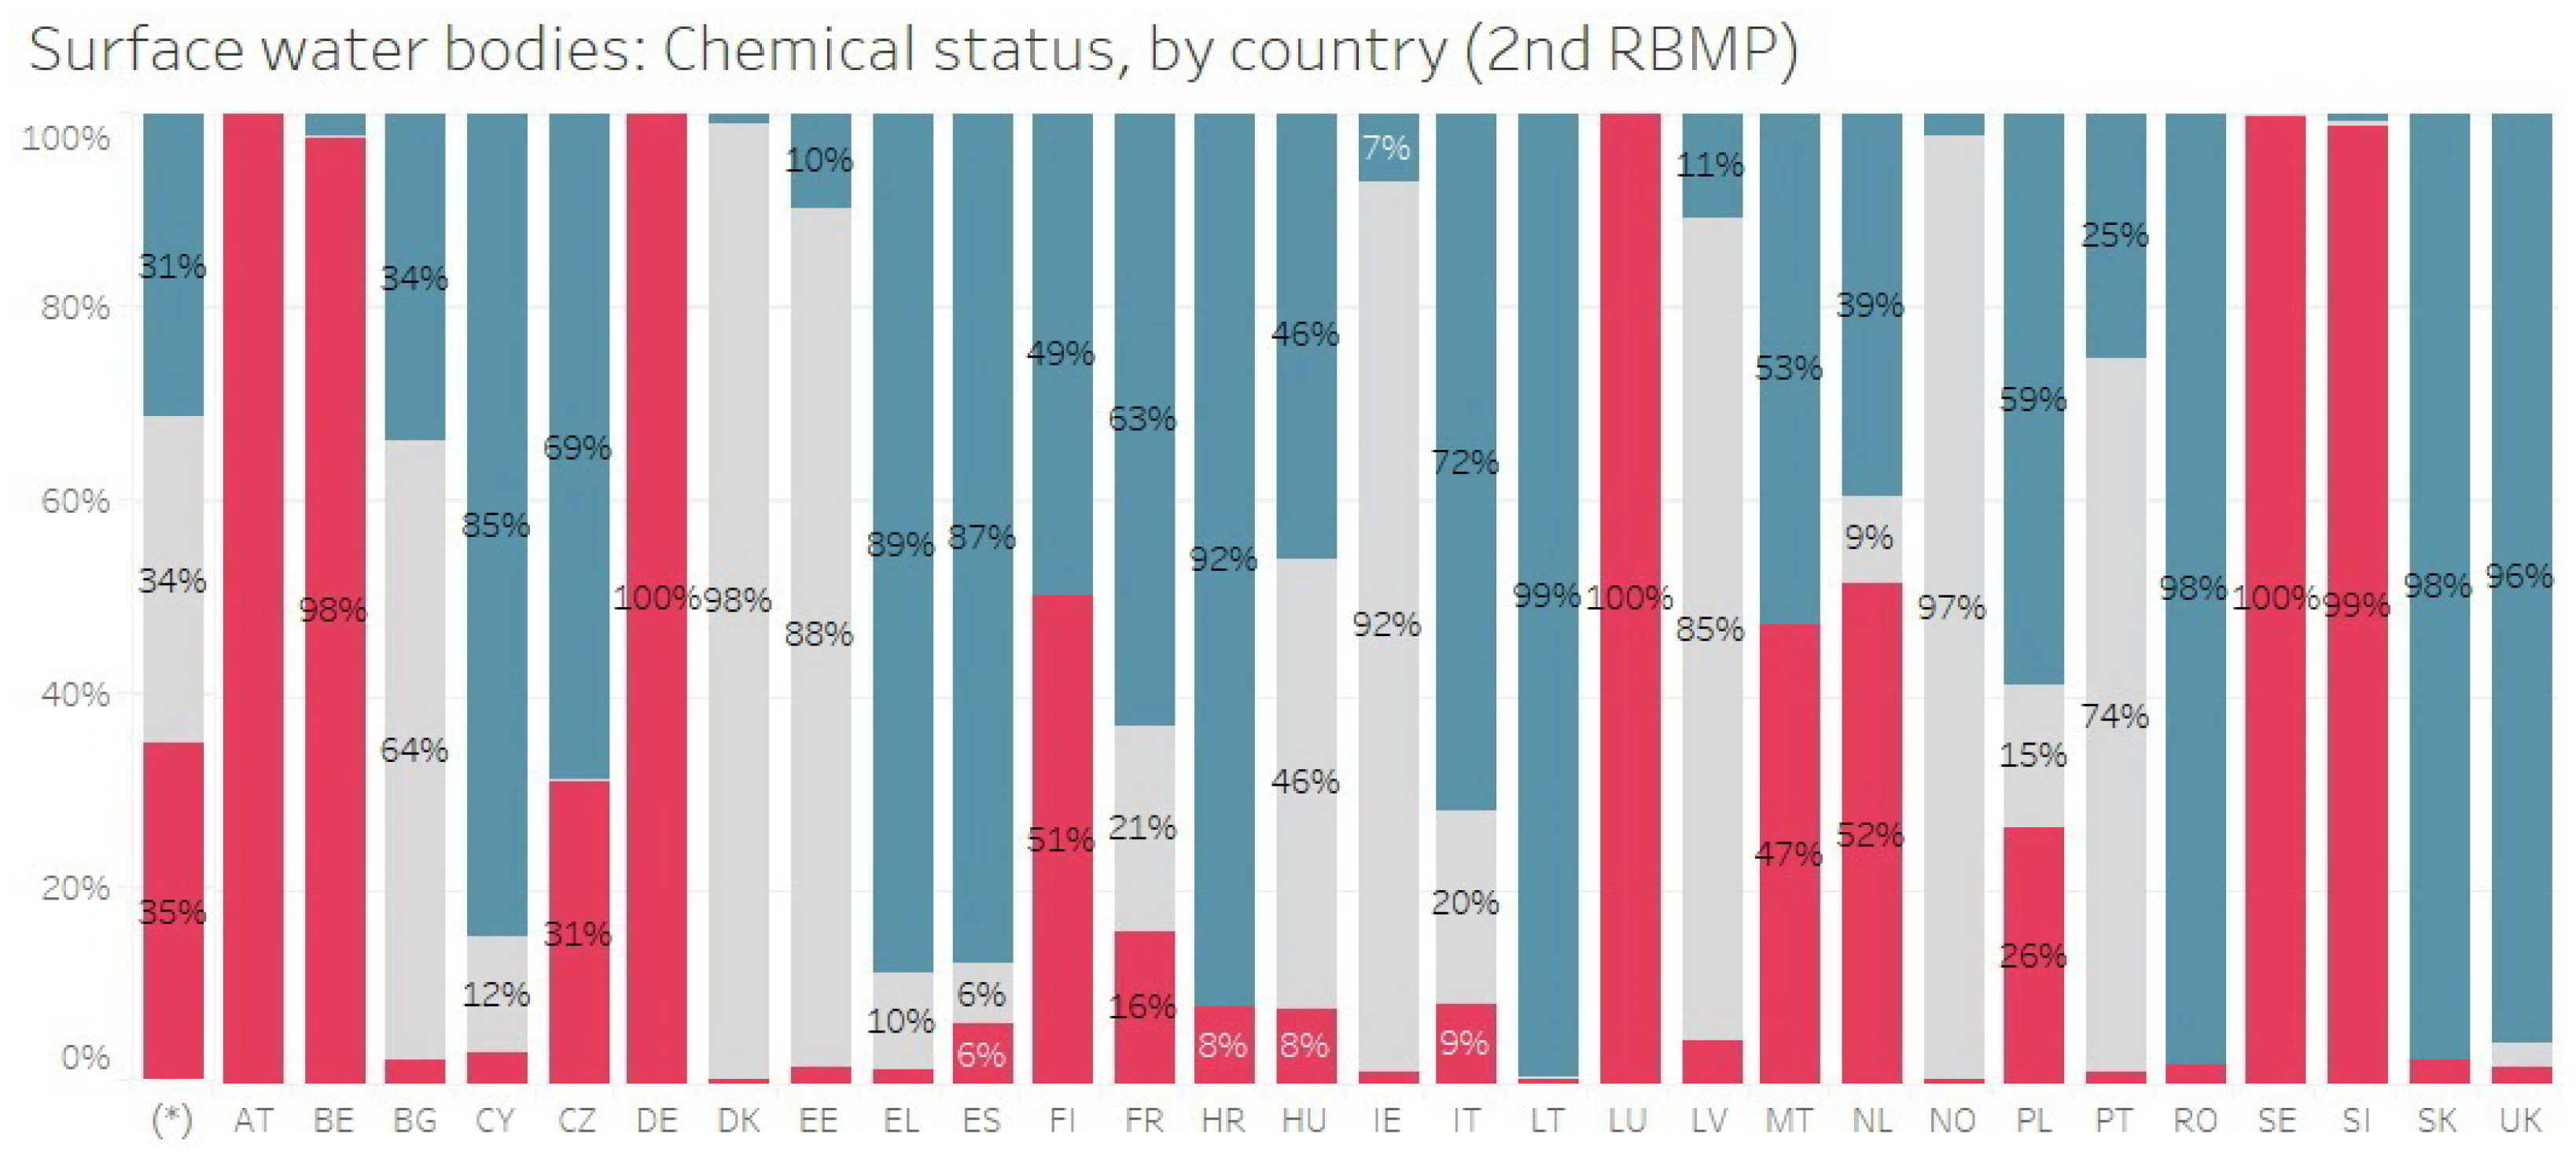
  60. European Environmental Agency; European Waters. Assessment of Status and Pressures 2018. Available online: https://www.eea.europa.eu/publications/state-of-water/at_download/file (accessed on 20 May 2022).
  61. Ferasso, M.; Bares, L.; Ogachi, D.; Blanco, M. Economic and Sustainability Inequalities andWater Consumption of European Union Countries. Water 2021, 13, 2696. [Google Scholar] [CrossRef]
  62. Tschikof, M.; Gericke, A.; Venohr, M.; Weigelhofer, G.; Bondar-Kunze, E.; Kaden, U.E.; Hein, T. The potential of large floodplains to remove nitrate in river basins—The Danube case. Sci. Total Environ. 2022, 843, 156879. [Google Scholar] [CrossRef]
  63. Bernard-Jannin, L.; Sun, X.; Teissier, S.; Sauvage, S.; Sanchez-Perez, J.M. Spatio-temporal analysis of factors controlling nitrate dynamics and potential denitrification hot spots and hot moments in groundwater of an alluvial floodplain. Ecol. Eng. 2017, 103, 372–384. [Google Scholar] [CrossRef]
  64. Gomez-Baggethun, E.; Tudor, M.; Doroftei, M.; Covaliov, S.; Nastase, A.; Onara, D.F.; Mierla, M.; Marinov, M.; Doroșencu, A.C.; Lupu, G.; et al. Changes in ecosystem services from wetland loss and restoration: An ecosystem assessment of the Danube Delta (1960–2010). Ecosyst. Serv. 2019, 39, 100965. [Google Scholar] [CrossRef]
  65. Singkran, N.; Anantawong, P.; Intharawichian, N. BOD load analysis and management improvement for the Chao Phraya River Basin, Thailand. Environ. Monit. Assess. 2020, 192, 413. [Google Scholar] [CrossRef] [PubMed]
  66. Ismail, A.H.; Robescu, D. Effects of the point source pollution on the concentration of bod in the Danube River, Romania. UPB Sci. Bull. Ser. D 2017, 79, 173–184. [Google Scholar]
  67. EEA 2018 Water Assessment Based on River Basin Management Plans (RBMPs). Available online: https://www.eea.europa.eu/themes/water/european-waters/water-quality-and-water-assessment/water-assessments (accessed on 25 June 2022).
Figure 1. Sampling points for sediments and surface water quality analysis on Danube.
Water 14 02991 g001
Figure 2. Applied methodology. Note: * in accordance with ISO 5667-6.
Water 14 02991 g002
Figure 3. Sediment samples under electronic microscope: (a) example of Danube sample; (b) example of Cerna sample.
Water 14 02991 g003
Figure 4. EDAX elemental spectroscopy analysis of Nera sediment sample.
Water 14 02991 g004
Figure 5. Urban waste water collection and treatment in Europe, 2017 [56].
Water 14 02991 g005
Figure 6. Urban waste water collection and treatment in Romania and Serbia, 2017 [57].
Water 14 02991 g006
Figure 7. EU surface water bodies: chemical status by country (EU Water Framework Directive—Second River Basin Management Plan) [67]. Note: * column—all states.
Water 14 02991 g007
Table 1. Methods and analytical equipment used for chemical analysis of sediments and surface water samples.
ParametersSample Preservation (pH < 2)Measurement Methods and Equipment
pH
Conductivity
Dissolved oxygen (DO)
noneElectric potential difference, electrolytic probe and galvanic probe
Chemical oxygen demand (COD–CCO-Cr)H2SO4Thermo-reactor, Velp Eco6
Biochemical oxygen demand (BOD–CBO5)
Ammonia (NH4)
Nitrates (NO3)
Nitrites (NO2)
Orto phosphate (P-PO43−)
Sulphates (SO42−)
Chloride (Cl)
H2SO4 (for NH4)UV-VIS photometric method:
Analytik Jena Specord 250Plus,
HANNA HI 83200
Total nitrogen (TN)H3PO4Corrosion-free focus-radiation NDIR detection and furnace technology of combustion, Analytik Jena Multi N/C 3100
Sodium (Na+)
Calcium (Ca2+)
Iron (Fe–total)
Arsenic (As3+)
Lead (Pb)
Zinc (Zn2+)
Cadmium (Cd)
Manganese (Mn-total)
Mercury (Hg)
HNO3Atomic absorption spectrometry in tandem spectrometer equipped with flame, hydride and graphite furnace, Analytik Jena ZEEnit 700 P and inductively coupled plasma optical emission spectroscopy equipped with segmented-array charge-coupled device, ICP-OES Perkin Elmer Optima 8300 [26]
Sediment surface compositionnoneBack scattered electron and energy dispersive spectroscopy and FEI Inspect S equipped with EDAX
Table 2. Results obtained for parameter analysis in samples of Danube, July–September 2020.
ParameterUnitD1D2D5D6D10D11D14D15D17Eco State
pH-6.97.17.17.27.47.27.57.06.7-
ConductivityµS/cm399402411405402403389394404-
DOmgO2/L7.57.27.27.27.26.97.47.06.4IInd
BOD–CBO53.63.33.53.23.53.53.43.33.2IInd
COD–CCO-Cr262225222627202018IInd
Sodiummg/L2.13.42.53.42.82.23.34.12.9Ist
Calcium4.55.86.56.85.84.74.95.83.9Ist
Ammonia0.110.210.180.280.160.140.180.280.33Ist
Nitrates0.770.840.990.920.790.720.720.720.66Ist
Nitrites0.0220.0290.0180.0220.0240.0280.0200.0190.016IInd
Orthophosphate0.310.280.310.180.270.320.220.250.22IIIrd
Sulphates8.39.712.18.710.28.110.28.17.1Ist
Chloride3.58.15.78.15.13.65.27.611.1Ist
Total Nitrogen1.211.321.121.181.161.151.111.150.98Ist
Mercuryµg/L0.0110.0170.0120.0140.0110.0090.0100.0090.015Ist
Arsenic0.090.120.120.140.100.110.090.110.14Ist
Lead0.210.240.280.210.210.220.220.220.31Ist
Zinc21.118.520.118.517.919.119.719.418.1Ist
Cadmium0.0040.0090.0080.0120.0140.0080.0110.0420.088Ist
Manganese0.0110.0210.0140.0160.0110.0110.0160.0110.012Ist
Iron0.7660.8210.6850.8010.8040.7920.8030.9112.193IIIrd
Table 3. AAS analytical errors.
ElementR2
(Calibration Curve)
SD (max.)RSD (max.)
%
Hg0.99950.210.7
As0.99950.160.4
Pb0.99970.220.5
Zn0.99990.090.2
Cd0.99980.180.8
Mn0.99970.110.4
Fe0.99980.210.8
Table 4. Results obtained for parameter analysis in samples of Danube’s tributaries: Nera, Porecka, Berzasca, Pek and Cerna Rivers, July–September 2020.
ParameterUnitNeraPekBerzascaPoreckaCerna
N11N6N1SS10B7B1SS12C6C3C1
pH-7.817.767.947.798.078.118.177.317.387.34
ConductivityµS/cm297301293698290288613377388372
DOmgO2/L11.110.810.45.114.514.54.610.29.95.7
BOD–CBO52.72.92.91.91.41.51.32.23.17.4
COD–CCO-Cr9.49.69.72.95 **5.85.32.78 **6.98.418.1
Sodiummg/L3.03.13.6-2.11.8-3.43.23.6
Calcium49.542.238.5-2.72.8-27.939.141.2
Ammonia0.380.330.380.420.070.060.070.090.110.74
Nitrates0.420.480.531.60.220.081.970.120.220.34
Nitrites0.0300.0320.0410.090.0110.0050.030.0140.0170.028
Orthophosphate0.120.120.160.090.060.020.120.050.060.09
Sulphates11.712.415.61508.43.9904.834.137.2
Chloride0.30.40.4-0.20.2-0.20.30.6
Total nitrogen0.891.011.12-0.780.38-0.510.540.89
Mercuryµg/L0.0140.0160.021-0.0080.006-0.0110.0150.030
Arsenic0.180.210.33<DL ***0.0740.060<DL ***0.0790.0870.088
Lead0.0820.0810.088<DL ***0.0140.012<DL***0.0170.0180.054
Zinc13.213.112.732.781.140.7731.817.510.112.1
Cadmium0.0100.0080.007<DL ***0.0030.003<DL ***0.0060.0060.007
Manganese0.0200.0210.022<DL ***0.0180.014<DL ***0.0320.0550.057
Iron0.8490.8150.8932.3090.0870.0650.4820.3940.4990.462
Notes: Legend: Eco state classification by Directive 2000/60/EC, blue—high quality; green—good quality; yellow—moderate quality; orange—poor quality and red—bad quality; or water quality classes from Ist to Vth. **—method used for chemical oxygen demand is CCO-Mn. ***—DL—detection limit for ICP-OES Perkin Elmer Optima 8300.
Table 5. EDAX APEX results on sediment samples.
ElementDanubeNeraBerzascaCerna
(Error %)Weight %
Na (±10.72) 9.923.75
Mg (±11.16)3.911.824.183.91
Al (±6.65)19.0618.9318.318.42
Si (±5.58)47.753.546.3513.59
K (±6.31)5.583.815.081.39
Ca (±3.01)6.266.435.212.14
Ti (±7.75)2.13--1.12
Fe (±11.08)15.3614.4117.1114.74
Co (±7.14)-1.17--
Publisher’s Note: MDPI stays neutral with regard to jurisdictional claims in published maps and institutional affiliations.

