
Site Investigation and Remediation of Sulfate-Contaminated Groundwater Using Integrated Hydraulic Capture Techniques

1
Department of Hydraulic Engineering, Tongji University, Shanghai 200092, China
2
Key Laboratory of Yangtze River Water Environment, Ministry of Education, Shanghai 200092, China
3
College of Ocean Science and Engineering, Shanghai Maritime University, Shanghai 201306, China
*
Author to whom correspondence should be addressed.
Water 2022, 14(19), 2989; https://doi.org/10.3390/w14192989
Submission received: 8 August 2022
/
Revised: 13 September 2022
/
Accepted: 20 September 2022
/
Published: 23 September 2022
(This article belongs to the Special Issue New Progress of Groundwater Quantity, Quality and Pollution That Applied Groundwater Modeling Techniques)
Abstract
:Inorganic pollution is widespread in groundwater, and sulfate pollution is one of the important types, which has an important impact on the ecological environment and human health. Elevated concentrations of sulfate ion pollutants often come from the sewage discharge of chemical plants. This study takes a sulfate-contaminated site in Dongying City, Shandong Province, China, as the research object. Nine boreholes were arranged along the sewage discharge ditches in the site to collect and analyze soil samples and groundwater samples in layers. The concentration of pollutants and the change with depths were determined; the maximum concentration of sulfate ion was 10,330 mg L−1 in groundwater, and the maximum pollution depth was no more than 8 m. A hydraulic barrier was carried out to cut off the pollution sources. Based on a comprehensive understanding of the hydrogeological conditions and pollution degree of the site, the hydraulic capture technique was used to control the water pumping and injection volume, so that the scope of the pollution plume was gradually reduced. The pumping wells were arranged in the polluted area, and the water injection wells were arranged at the outer edge of the pollution zone. According to the calculation of the single well water inflow and influence radius, 28 pumping wells and 66 water injection wells were needed to be arranged on the site. The treatment process was divided into four stages according to the following steps: water pumping, water injection, stoppage of water injection, stoppage of water pumping, collecting water samples after the water level recovered, and the completion stage of treatment. The above process was repeated twice. Chemical precipitation was employed in the last step. The results of the remediation showed that the sulfate concentrations in 54 percent of the samples decreased significantly to less than 100 mg L−1, and the rest were between 100 and 200 mg L−1 after the treatment process. Two pumping wells with serious pollution were selected as long-term monitoring wells, and two-year continuous monitoring results showed that sulfate concentrations in the monitoring wells ranged from 110 to 220 mg L−1, indicating that integrated groundwater remediation techniques are more effective and more reliable than one single technique.
1. Introduction
Groundwater pollutants, including inorganic compounds, organic compounds, heavy metal ions, and so on, vary greatly in different sites. Of all the contaminants, sulfate usually garners less attention. There have been few attempts to remedy cases of sulfate ion pollution. However, sulfate ions do cause significant water-quality issues in some areas, especially in residential regions. Sulfate ions can originate from various sources, such as the dissolution of soluble sulfate minerals and atmospheric sulfur dioxide deposition [1]. The main source of groundwater contamination is the discharge of untreated wastewater from chemical plants because sulfuric acid is widely used in industrial processes [2]. Surface water containing high concentrations of sulfate ions can infiltrate the groundwater. If the sulfate-contaminated groundwater is not treated, it remains a major human-health and building-safety issue. For example, excessive loading of sulfate in groundwater can cause diarrhea, dehydration, and gastrointestinal disturbances in humans [3]. Moreover, sulfate-contaminated groundwater is also detrimental to concrete foundations [4]. The plinths and piers of a 35-year-old building located in Northern Italy was found to be severely degraded by sulfate, resulting in a significant loss of strength and adhesion of the cement matrix [5].
Initially, groundwater is the most important drinking water resource. Though 70 percent of the population depends on groundwater as a source of drinking water in China, it is estimated that 90 percent of the groundwater has been contaminated by diverse substances [6]. Recently, groundwater and soil contamination has drawn people’s attention in China [7,8,9], and remediation work has been initiated, while the United States developed a Well Head Protection Program (WHPP) in 1986 and has achieved a lot to date [10]. Over the past several decades, a number of in situ remediation technologies have been developed to contain and/or treat groundwater and soil contamination, including the pump-and-treat system, physical barriers, permeable reactive barriers (PRBs), thermal treatment, air sparging, and bioremediation [11]. Each technology has advantages and disadvantages; for example, the common pump-and-treat method is the best and most reliable option for cases with a relatively large mass of contaminants, but its huge cost is a major concern [12]. Some physical barriers cannot actually remove contaminant masses from the groundwater. The bioremediation method has to be accurately adapted to each site [13]. Until now, few methods can be reliably employed as permanent solutions alone. Therefore, there is an urgent need to comprehensively utilize multiple technologies to treat highly contaminated groundwater that is closely related to the safety of buildings and drinking water for millions of people.
Sulfate contamination in groundwater is neither as common as nitrate and heavy metal contamination nor as toxic as arsenic contamination, but sulfates are associated with aesthetic problems and may cause health issues, and it is of great value to treat them. Despite advanced groundwater remediation technologies and numerous successful cases [14,15], large site applications for sulfate remediation are still sparse. Numerous studies have illustrated that using just one technology is not enough to successfully remove all contaminants [16]. Furthermore, other technologies such as chemical or biological treatment would take too long and are not the best options for emergencies with high levels of public concern. As a result, integrated utilization of several in situ remediation techniques is increasingly promising. This study takes a sulfate-contaminated site as the research object. The objective of this study is to demonstrate the integrated applications of several groundwater remediation techniques about a site sulfate remediation case. The integrated remediation methods will be valuable and conductive to other groundwater contaminated sites with similar hydrogeological conditions and contaminants involving landfills, wetlands, or other contaminated sites with sulfate and high-mobility/solubility contaminants.
2. Materials and Methods
2.1. Study Site
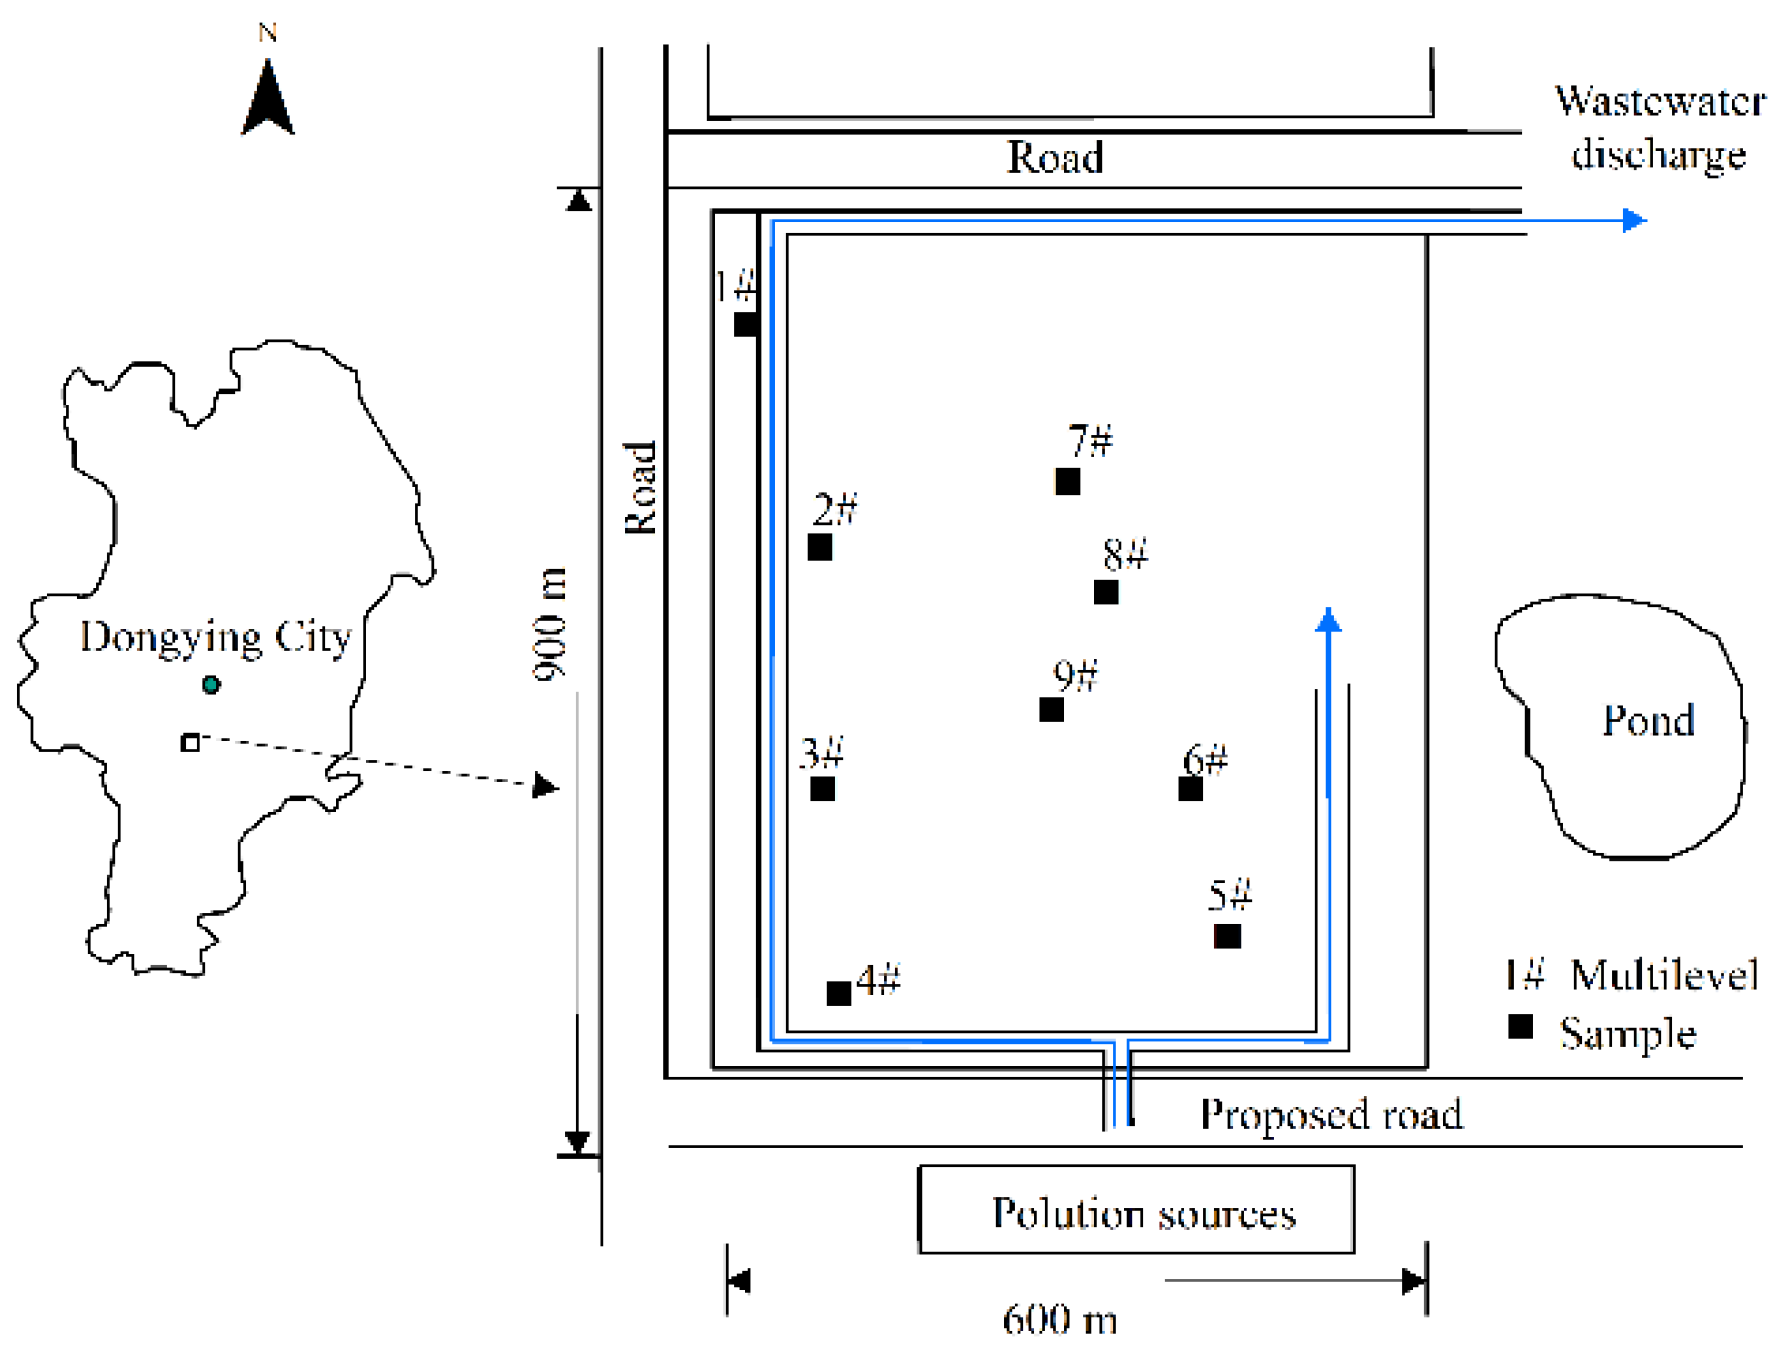
The study area is situated south of Dongying City, Shandong Province, China (Figure 1). It is a part of the alluvial plain of the Yellow River delta and the estuary of the Yellow River. The perennial mean temperature is 12.5 °C; the annual rainfall is 500 mm to 600 mm and mainly occurs in the summer. To the west of the study site is a large area of agricultural land, and to the east is the pond filling area with a large elevation difference. The ground elevation of the study area ranges from 2.78 m to 7.90 m with partial areas of puddles and ditches.
The pollution source is located to the south of the study site. It is a chemical factory producing detergent, which has been abandoned for many years. Untreated wastewater was discharged into ditches in the west and east of the study area. Therefore, the affected area is limited to the site around the trenches (Figure 1). The concentration of sulfate, chloride, and other dissolved components in the wastewater seriously exceeds the standard. In addition, no anti-seepage treatment was carried out at the bottom or either sides of the ditch, and the ditch was later filled and buried. Both situations led to the penetration of pollutants into the soil and aquifers, causing severe groundwater contamination. Site investigations indicated that sulfate is the main contaminant in this site. The pollution plume is mainly distributed in the south and east and west sides of the western ditch. The contaminated soil is off-white due to the physicochemical reactions of the contaminants with the silt, clay soil, and other soil constituents. The soil also gives off a pungent odor and can make people dizzy and sick. The contaminants are detrimental to humans and the environment.
2.2. Concrete Corrosion in the Study Area
When the underground space was developed at the site, it was found that the original concrete pile foundation was corroded, and a more intensive study of the site was required. The pile foundation of buildings in the site was corroded owing to the influence of sulfate interests in soil and groundwater. Concrete corrosion is mainly caused by the elevated sulfate content. The main reactions of sulfate and the interior components of concrete are given by:
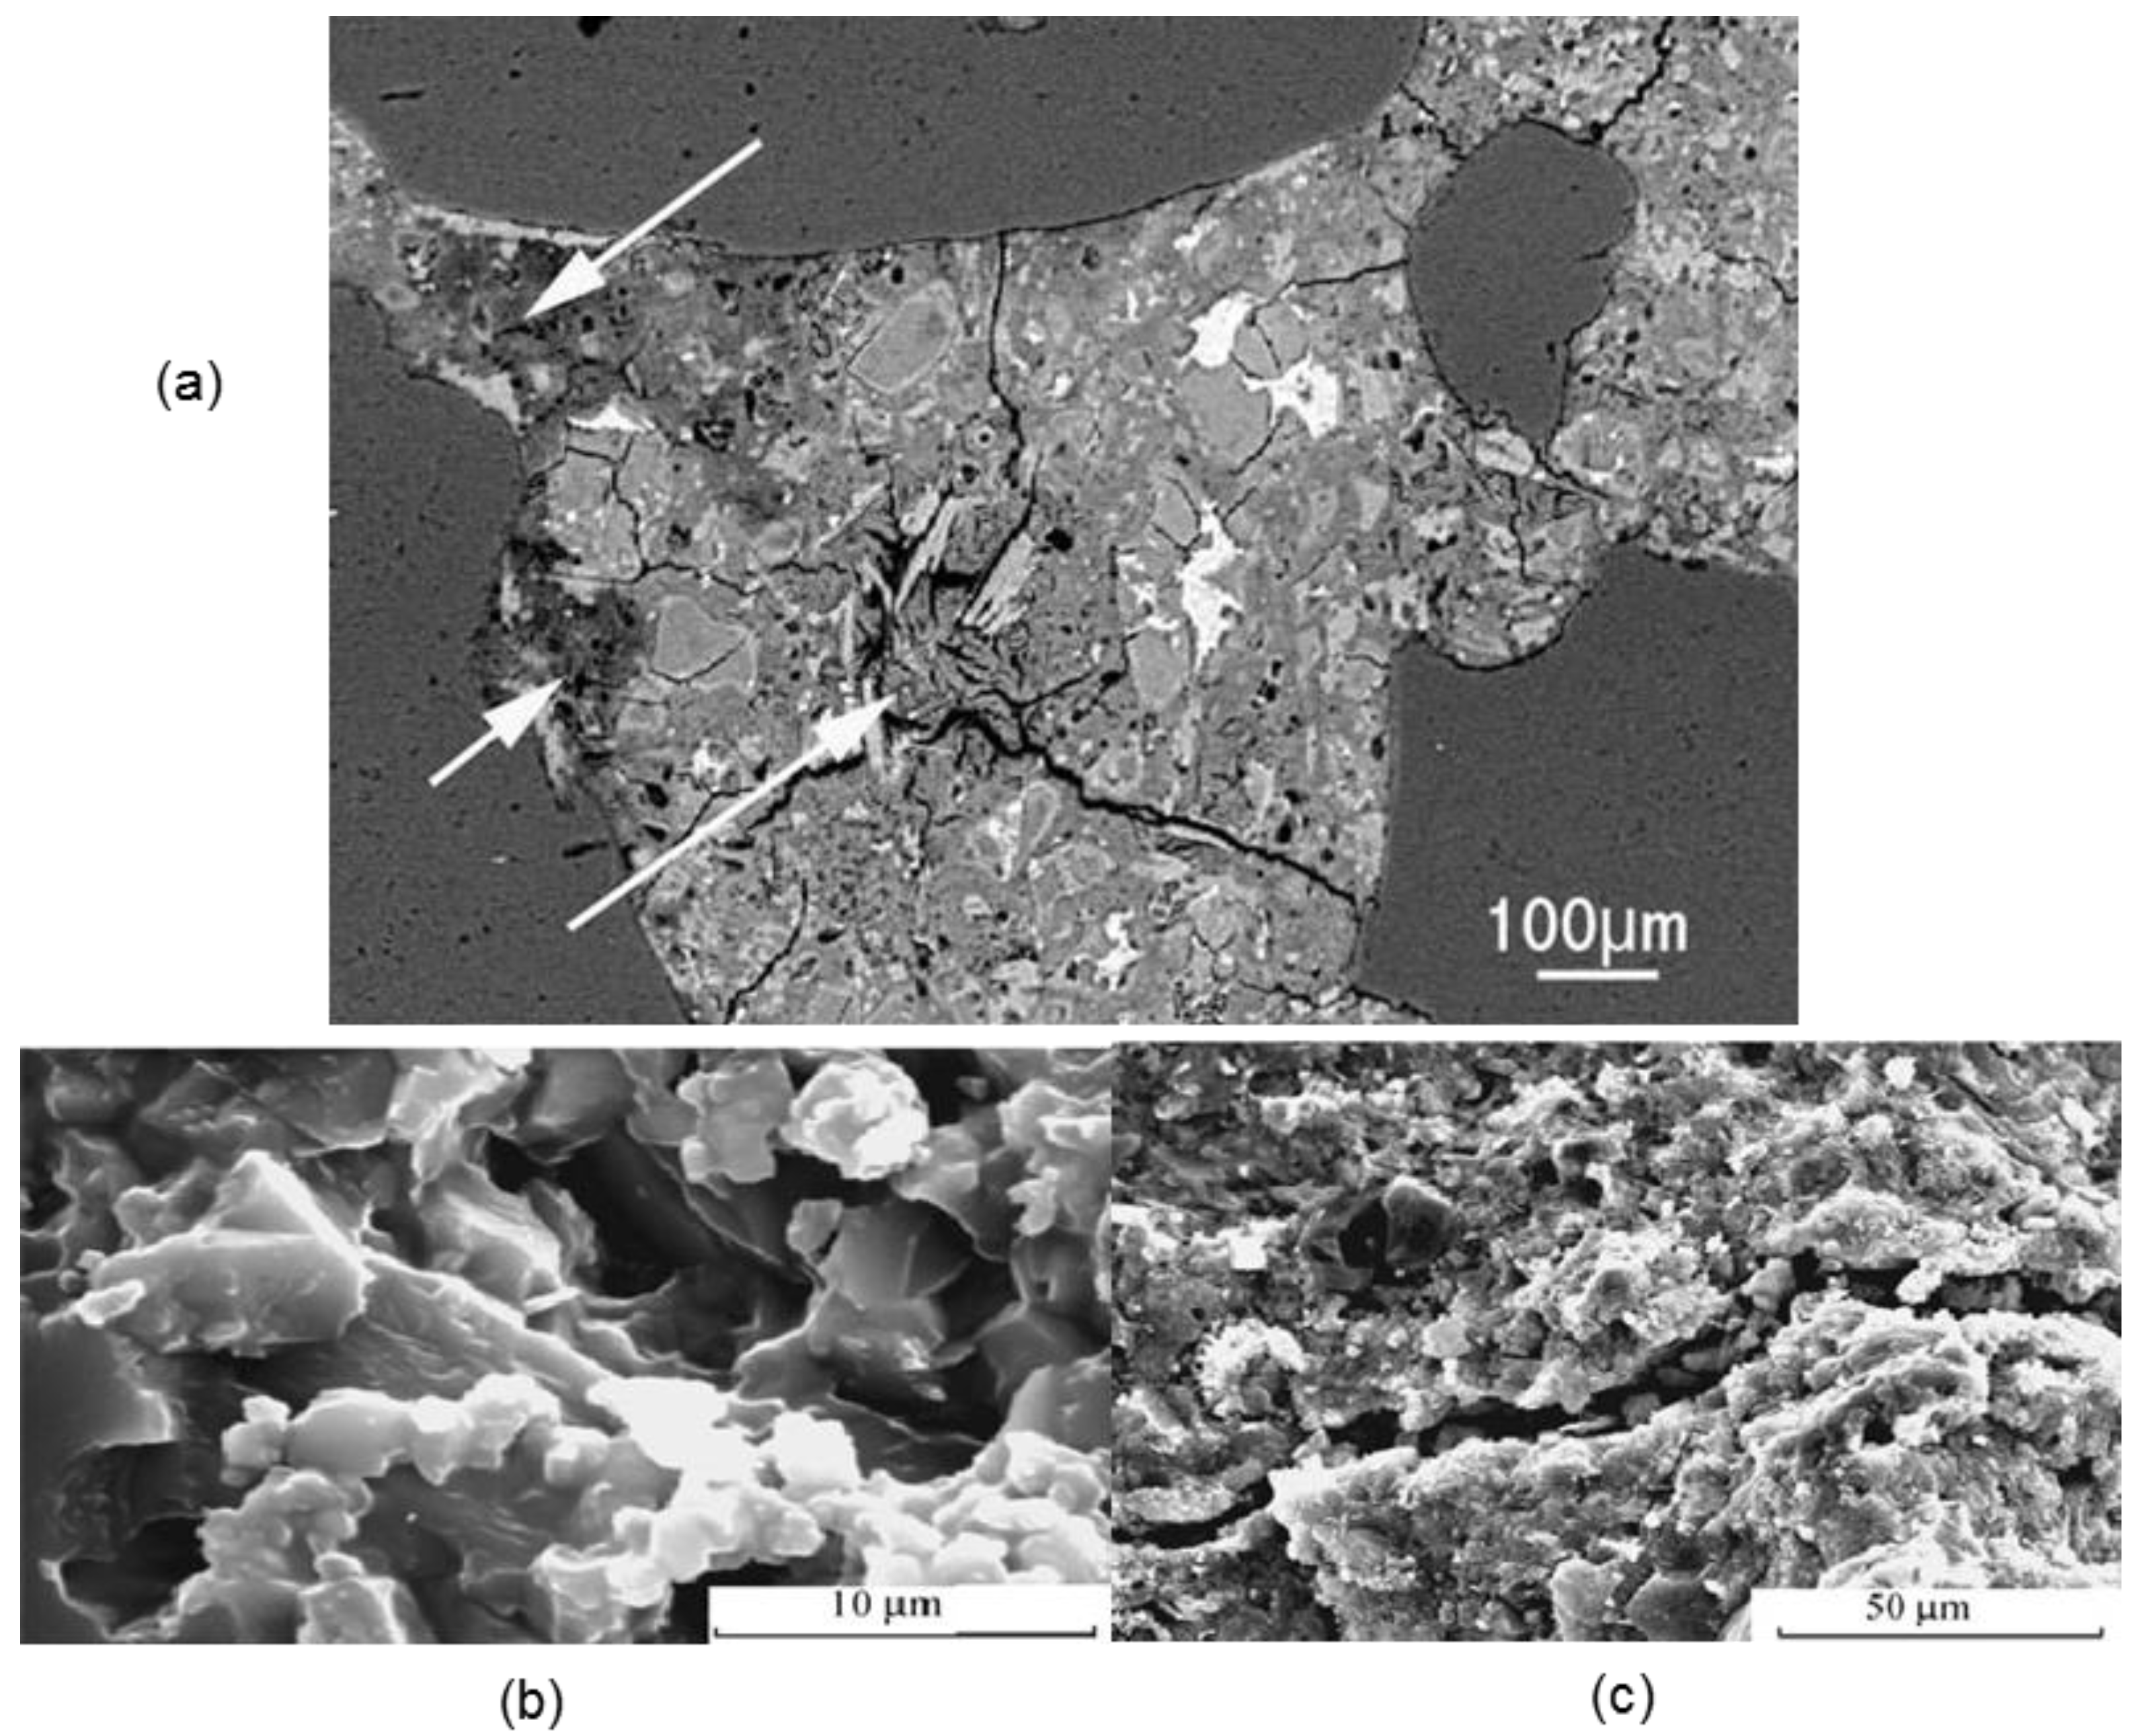
In order to determine the degree of sulfate corrosion of the foundations of buildings in the study site and to reduce corrosion damage, laboratory tests and experimental analyses were necessary to evaluate the corrosion state of the foundations. Some corroded building pile foundation samples were collected in the contaminated site for microscope testing. It was observed that the Portland cement in samples had already been partially replaced by ettringite (arrow), and there were dark regions, which indicated that this part had undergone de-calcification (Figure 2a). Thus, the adhesion of the concrete was weakened. Although the adhesion of the concrete shown in the upper right of Figure 2a remained basically unchanged, corrosion by sulfate will eventually impair its strength. Figure 2b shows that the C–S–H gel of the non-corroded concrete contained a complete and compacted structure, and the Ca(OH)2 crystalline particle was also orderly and intact, whereas the C–S–H gel of the corroded concrete was very loose and with more cracks and even through-cracks (Figure 2c). There was also a large number of gypsum crystals and no Ca(OH)2 crystalline particles in the corroded concrete.
2.3. Sulfate Concentrations in Groundwater
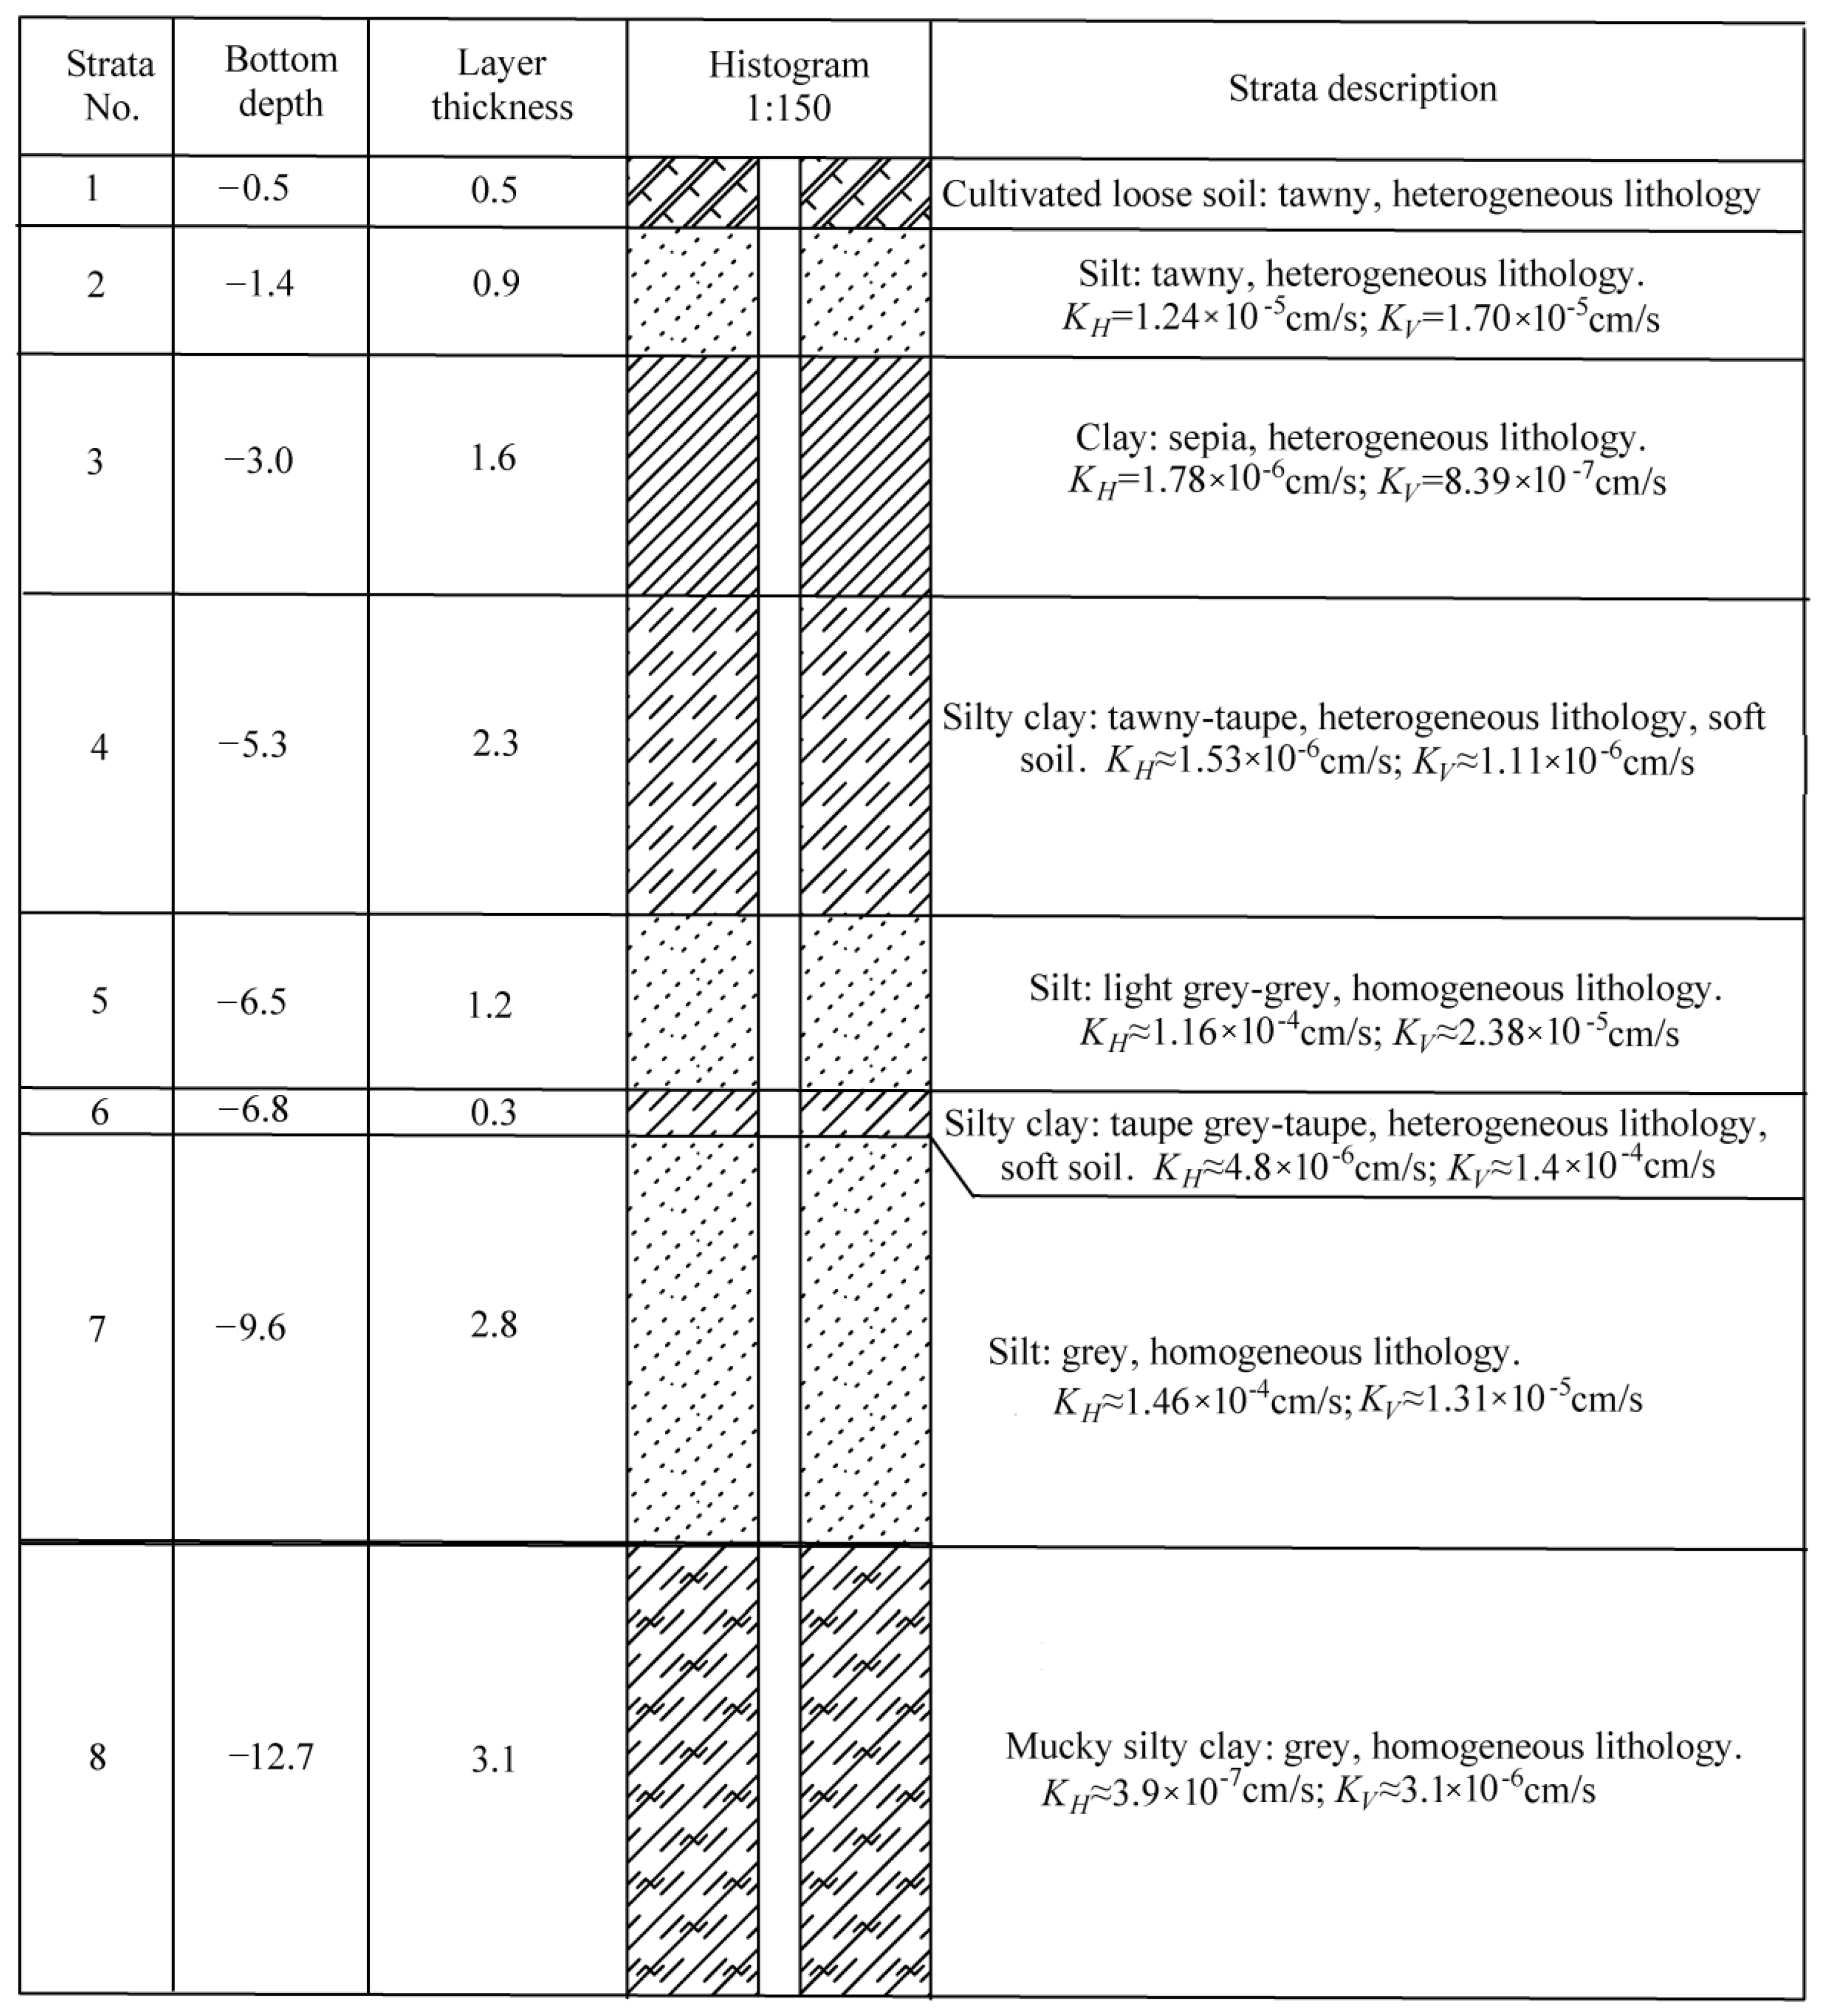
To determine the scope of the groundwater contamination in terms of depth and magnitude in the site, 9 investigation boreholes were drilled (Figure 1). The strata distribution was obtained according to the drilling exploration data, and a histogram of a representative borehole is shown in Figure 3. The permeability of soil layer was obtained through an indoor test. The permeability coefficients in the vertical and horizontal directions were 8.39 × 10⁻⁷–1.40 × 10⁻⁴ cm/s and 3.90 × 10⁻⁷–1.46 × 10⁻⁴, respectively. The groundwater was unconfined with very slow velocity and a small water head difference. The results of site exploration showed that the shallow surface was composed of plain fill and cultivated soil with underlying silty sand, silty clay, and clay at depths from 1.5 m to 12.0 m. The strata in the area were primarily composed of the recently deposited quaternary soil and commonly deposited soil, and the hydrogeological conditions were relatively simple.
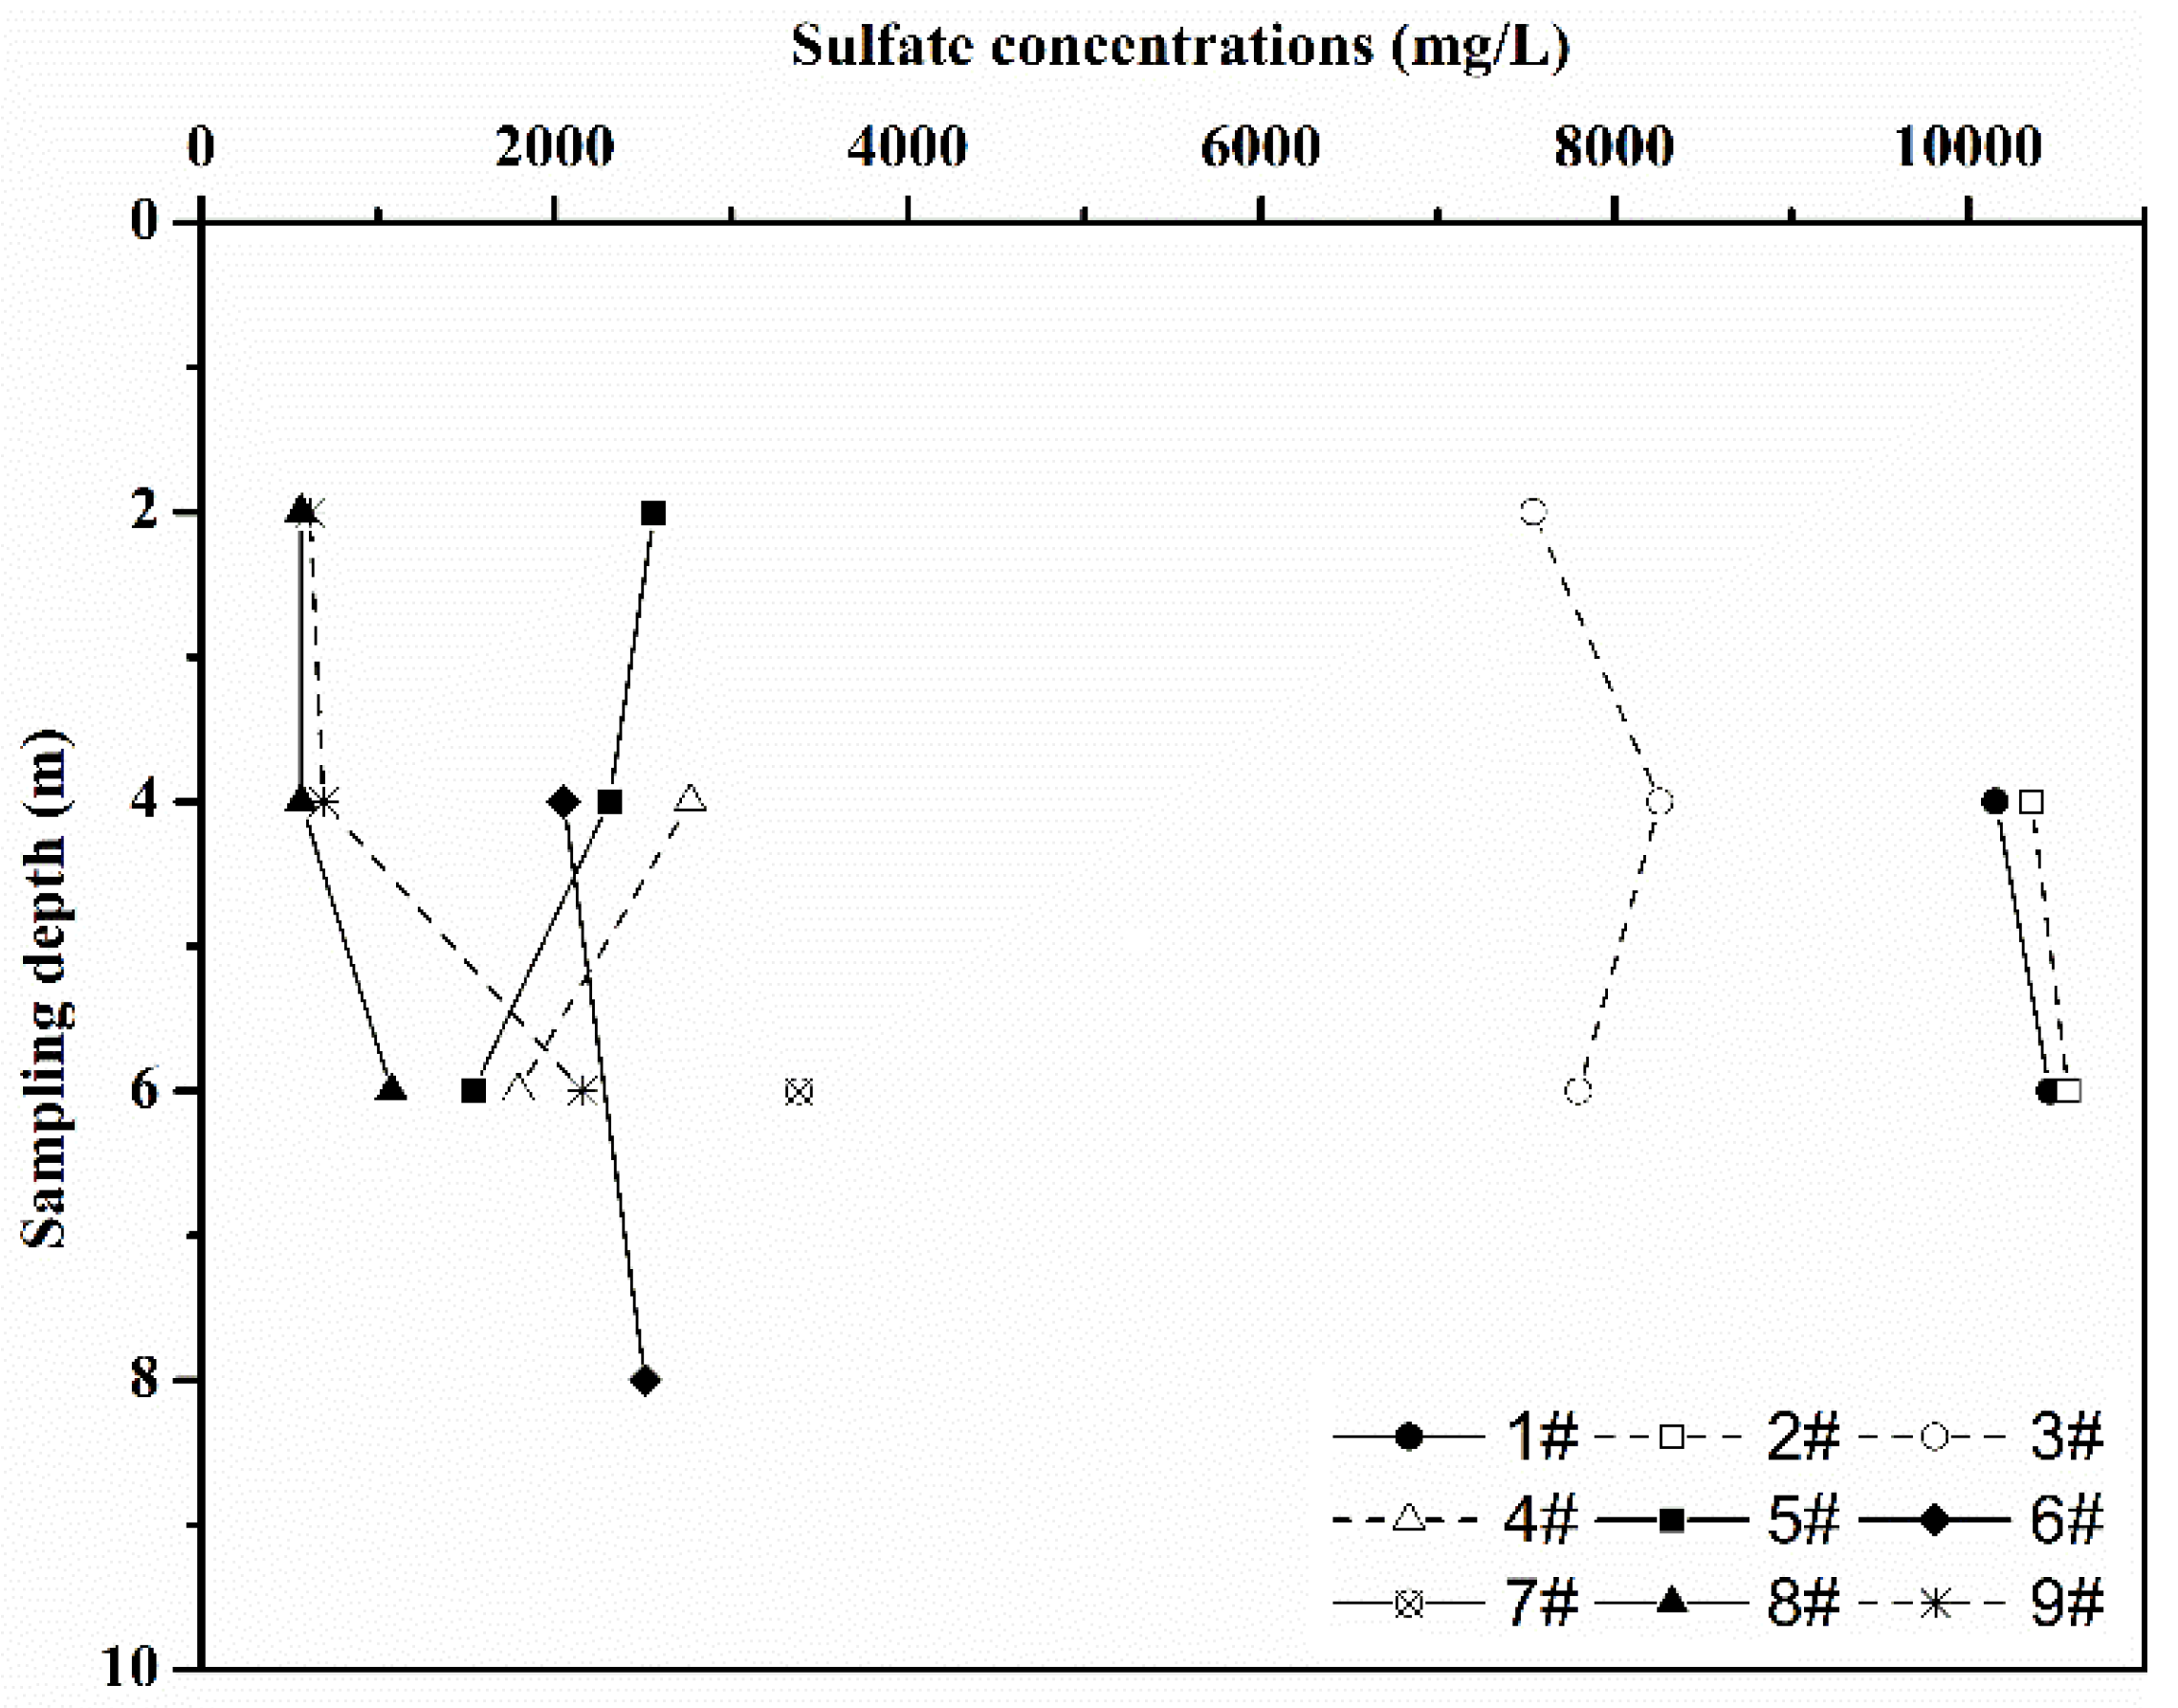
Water samples were collected from different depths ranging from 2 m to 8 m (Figure 4). Notably, boreholes No. 1 to No. 6 were located in the region influenced by contamination, while No. 7 to No. 9 were not. Based on the environmental site assessment standards (Table 1) [17], the polluted water and soil were strongly or moderately corrosive to the reinforced concrete of buildings under the conditions of alternation of wetting and drying (Table 2). Groundwater quality data from the investigation wells indicated that the study site was seriously polluted by sulfates.
The distribution of the sulfate ion concentration indicated that several extreme values appeared near the west drainage ditch, which is in accordance with the discharge of the chemical plant. The wastewater was predominately discharged along the west ditches during the period of detergent production. The ditch turns east at the northwest corner, resulting in sulfate accumulation at this corner. The sulfate concentration of No. 1 well was up to 10,330 mg L−1, far higher than that of its surroundings. Since the northeast corner was not the part of the influence range of the pollution plume, the sulfate concentration in this corner was relatively low. According to the evaluation criteria (Table 1), sulfate corrosion of concrete at this site was strong; therefore, immediate water and soil treatments and remediation are urgently needed.
3. Site Pollution Control and Remediation Technique
3.1. Hydraulic Barrier
The most direct pollution source was located in the south of the site. Although the chemical plant has been closed for many years, the pollution in the southern area was still severe. The pollution source needed to be removed or isolated from the study site. To prevent the chemical plant from polluting the study area through groundwater flow, an L type concrete continuous wall was placed between the south of the study site and the chemical plant. The depth of the hydraulic barrier was 12 m to 14 m, and the bottom was embedded in the clayey aquitard to prevent pollutants from flowing around the bottom of the continuous wall. Additionally, an eastern barrier was set up to hinder pollution between the pond and chemical plant.
3.2. Hydraulic Capture Technique and Chemical Precipitation
The hydraulic capture technique was proposed to design a well field to alter the groundwater flow direction, thereby halting or reversing the spread of a contaminant plume at minimum cost [18,19]. Each pumping well can form a certain pollutant capture area, and many pumping wells arranged in a certain shape can control the polluted area. This technique has been widely used to remediate aquifers contaminated by undesirable chemicals. It is essential to design an effective capture system to collect the polluted groundwater without allowing any of it to escape [20,21]. Tosco et al. used the automatic protection area (APA) model to provide an automatic post-processing encirclement of capture zones [22,23], and finally the goal of eliminating pollution was achieved. Based on a case study in Piedmont, Italy, they proved that APA is a useful tool to seize zone delineation. Chen et al. also used the hydraulic capture zone method to effectively remove the petrochemical contaminants in a karst-fractured aquifer [24].
The geological and hydrogeological conditions of the site are the most important factors for the treatment and restoration of progressive pollution, especially the structure of the stratum and the permeability coefficient of the soil layer. Since the stratum structure of the site is relatively simple and there is no obvious confined aquifer, the hydrogeological conditions of the site can be generalized as a phreatic aquifer with porous media. Therefore, it can be calculated by using the theory of stable flow pumping of complete wells.
In order to determine the optimum number of extraction wells and the pumping water inflow rate at which each well should be pumped, the method described in Fetter’s book [25,26], which was first proposed by Javandel and Tsang [27], was used. They used single well and multi well solutions to derive equations to obtain simple type curve shapes. Equations are also available to compute the maximum extent of the capture zone under the assumption of a confined aquifer with a uniform thickness, B (m). Prior to pumping, there is a uniform regional specific discharge (Darcian velocity), U (m/s); all extraction wells are fully penetrating, and the well discharge rate is Q (m3/s). The equation of the line that divides the area that will be captured by the well from the rest of the flow field is:
where x and y are the x-axis and y-axis of the coordinate system at the center of the well group as the origin. The only parameter in Equation (4) is the ratio Q/BU. All the water within the given type curve will flow to the well. Nevertheless, there is a maximum quantity of water that can be pumped from a single extraction well. If the plume is wider than the capture zone generated by the maximum pumping rate, then multiple extraction wells are required. One concern with multiple extraction wells is that their catch zones must overlap, or groundwater flow can pass between them. If the distance between the extraction wells is less than or equal to Q/πBU, then the capture zones will overlap. The optimum well spacing is therefore Q/πBU. If there are two extraction wells and the distance between them is less than or equal to Q/πBU, then the capture zone is defined as
where d is half the distance between the two extraction wells. If there are three wells, one with an origin is located on the x-axis, and the other two are placed at a distance +d and −d from the origin on the y-axis, respectively. The result of formula derivation shows that the optimum well spacing is 1.26 Q/πBU, and the equation for the capture zone boundary is expressed as
When four wells are considered, the optional well spacing is approximately 1.2Q/πBU.
4. Implementation of Remediation Technology
4.1. Preliminary Design of Pumping and Injection Wells
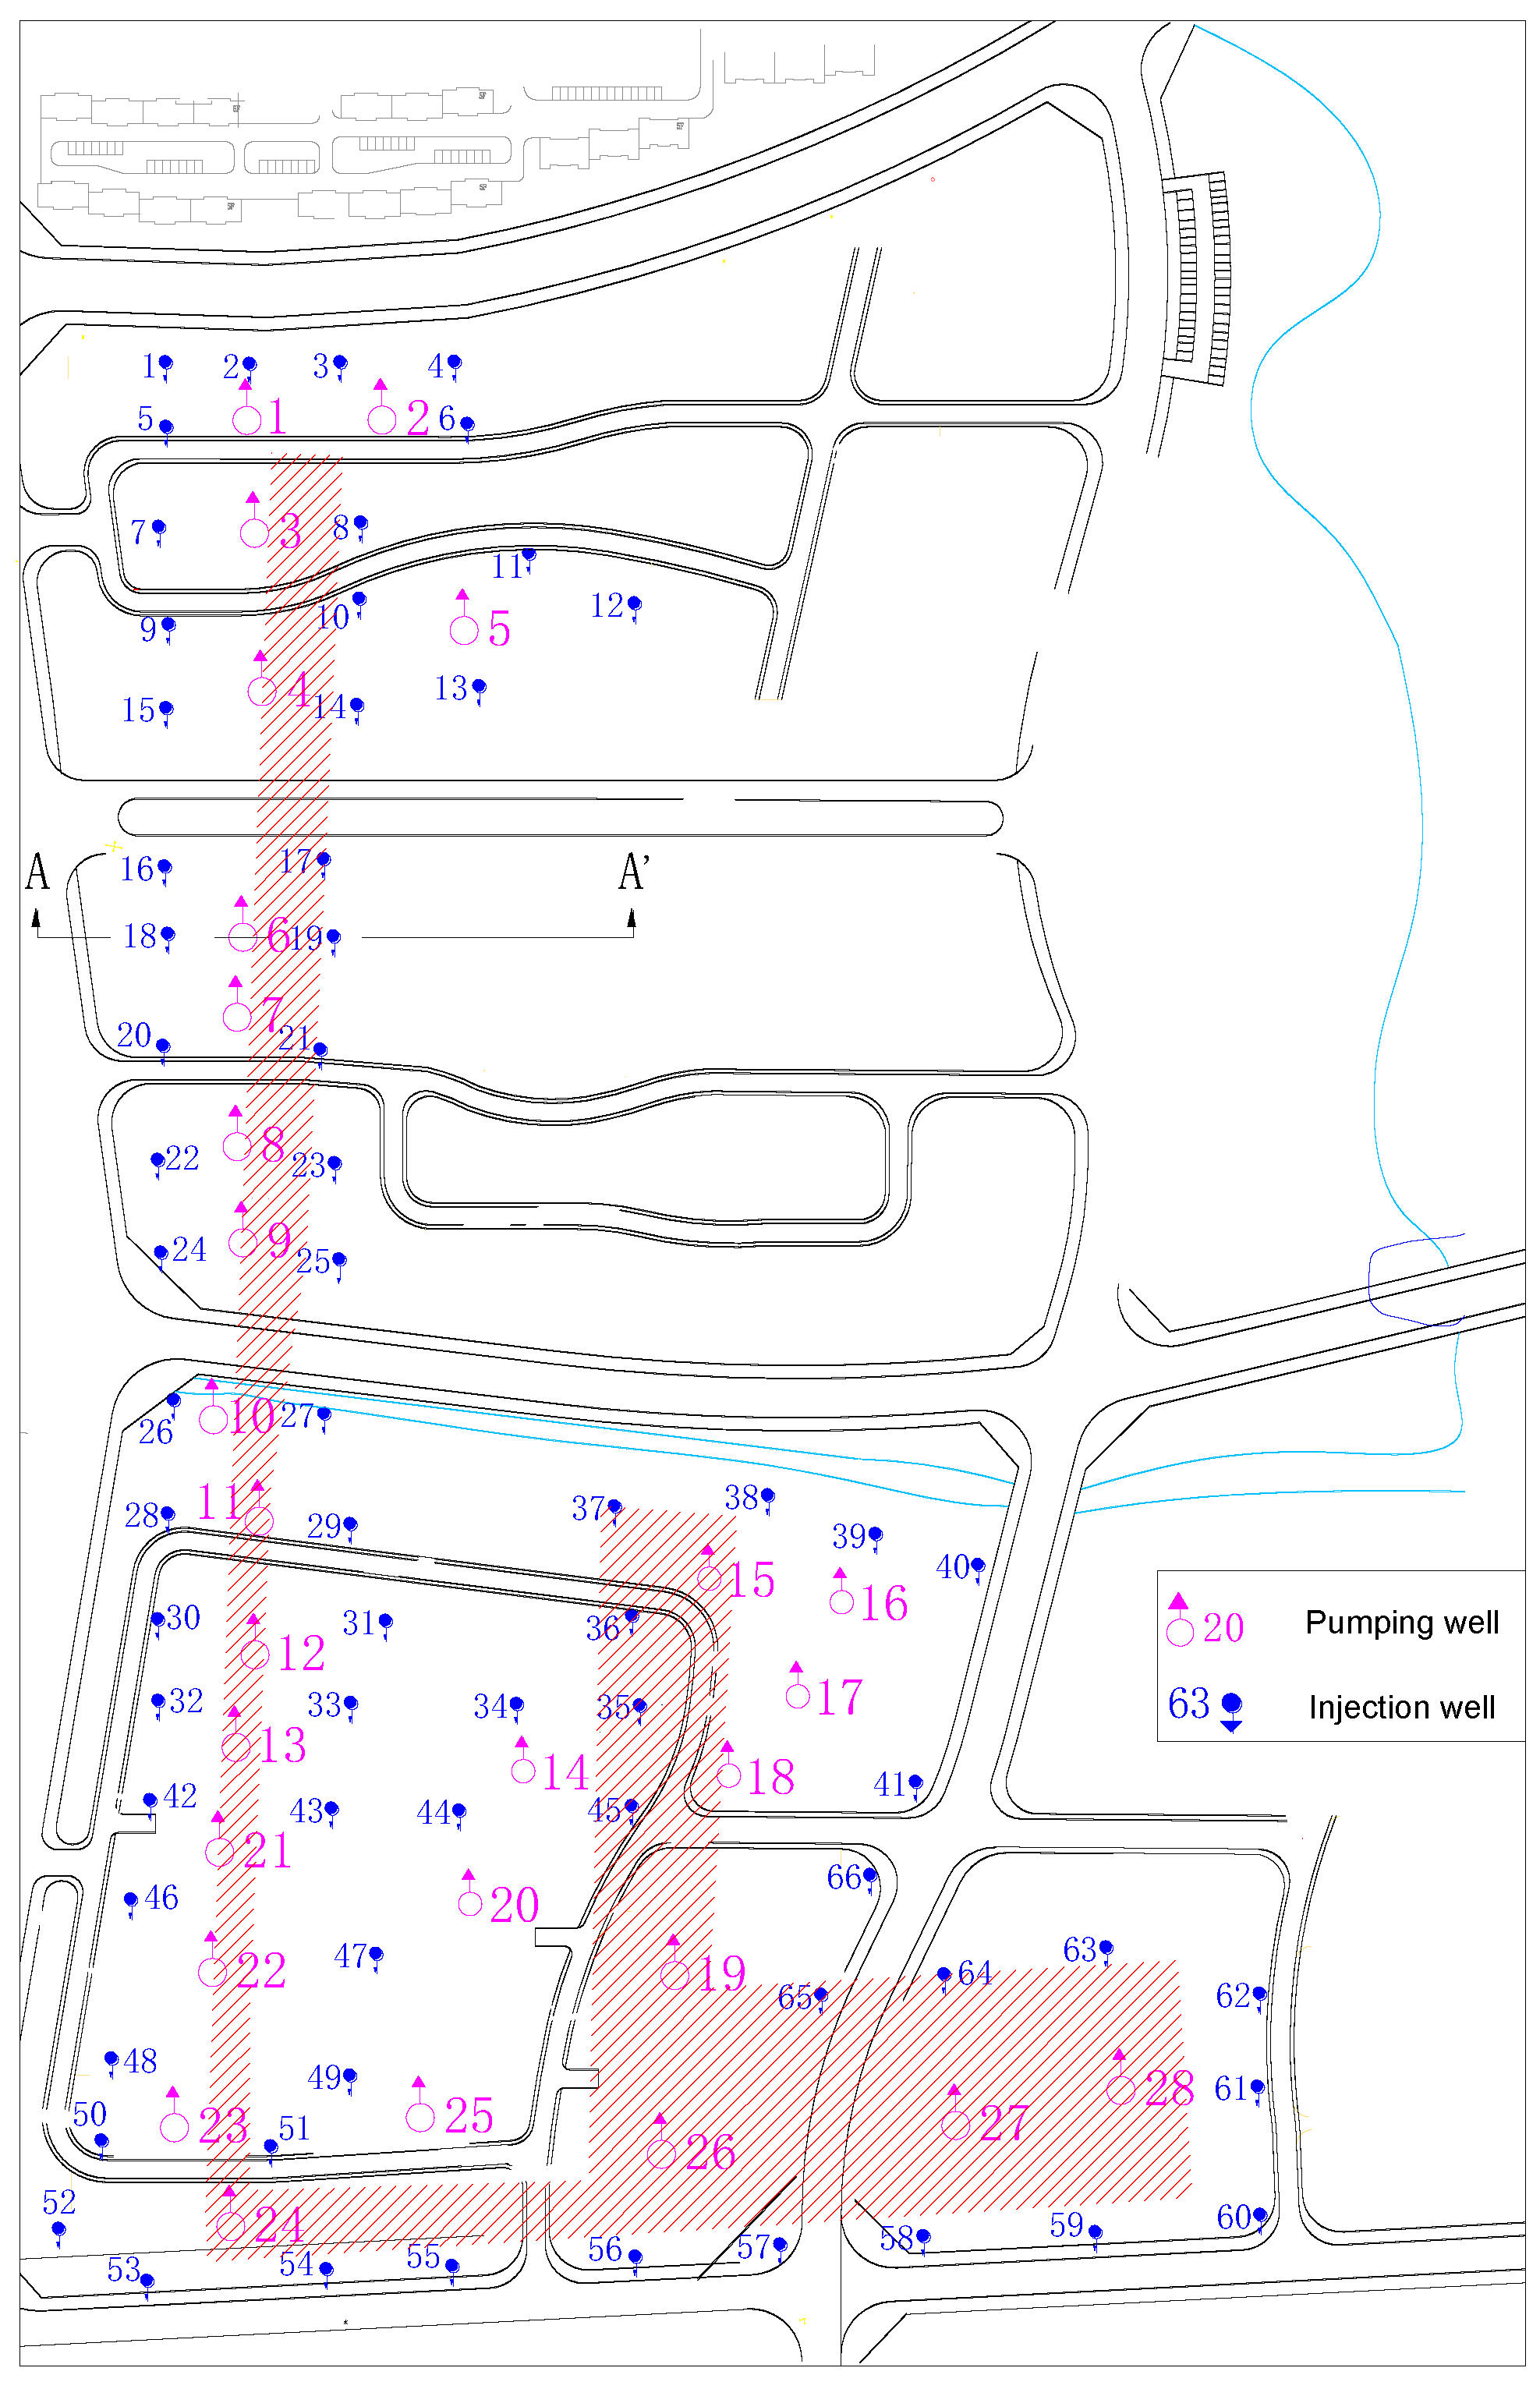
It is widely known that a single well is far from adequate for large area remediation; therefore, group wells were required for the study site. The hydraulic slope between pumping wells, injection wells, and the surrounding flow field will increase during hydraulic capture, thereby improving the water-flow velocity into pumping wells and the efficiency of remediation. The water yield and radius of influence of a single well was calculated using the Dupuit stable well flow mode. Then, the number and distribution of group wells were determined by the site construction conditions. As there are buildings and public facilities in the site, the spacing between pumping wells and water injection wells was adjusted according to the site conditions. Finally, 28 pumping wells and 66 injection wells were used for site contamination remediation. Figure 5 shows the plan layout of pumping and water injection of group wells.
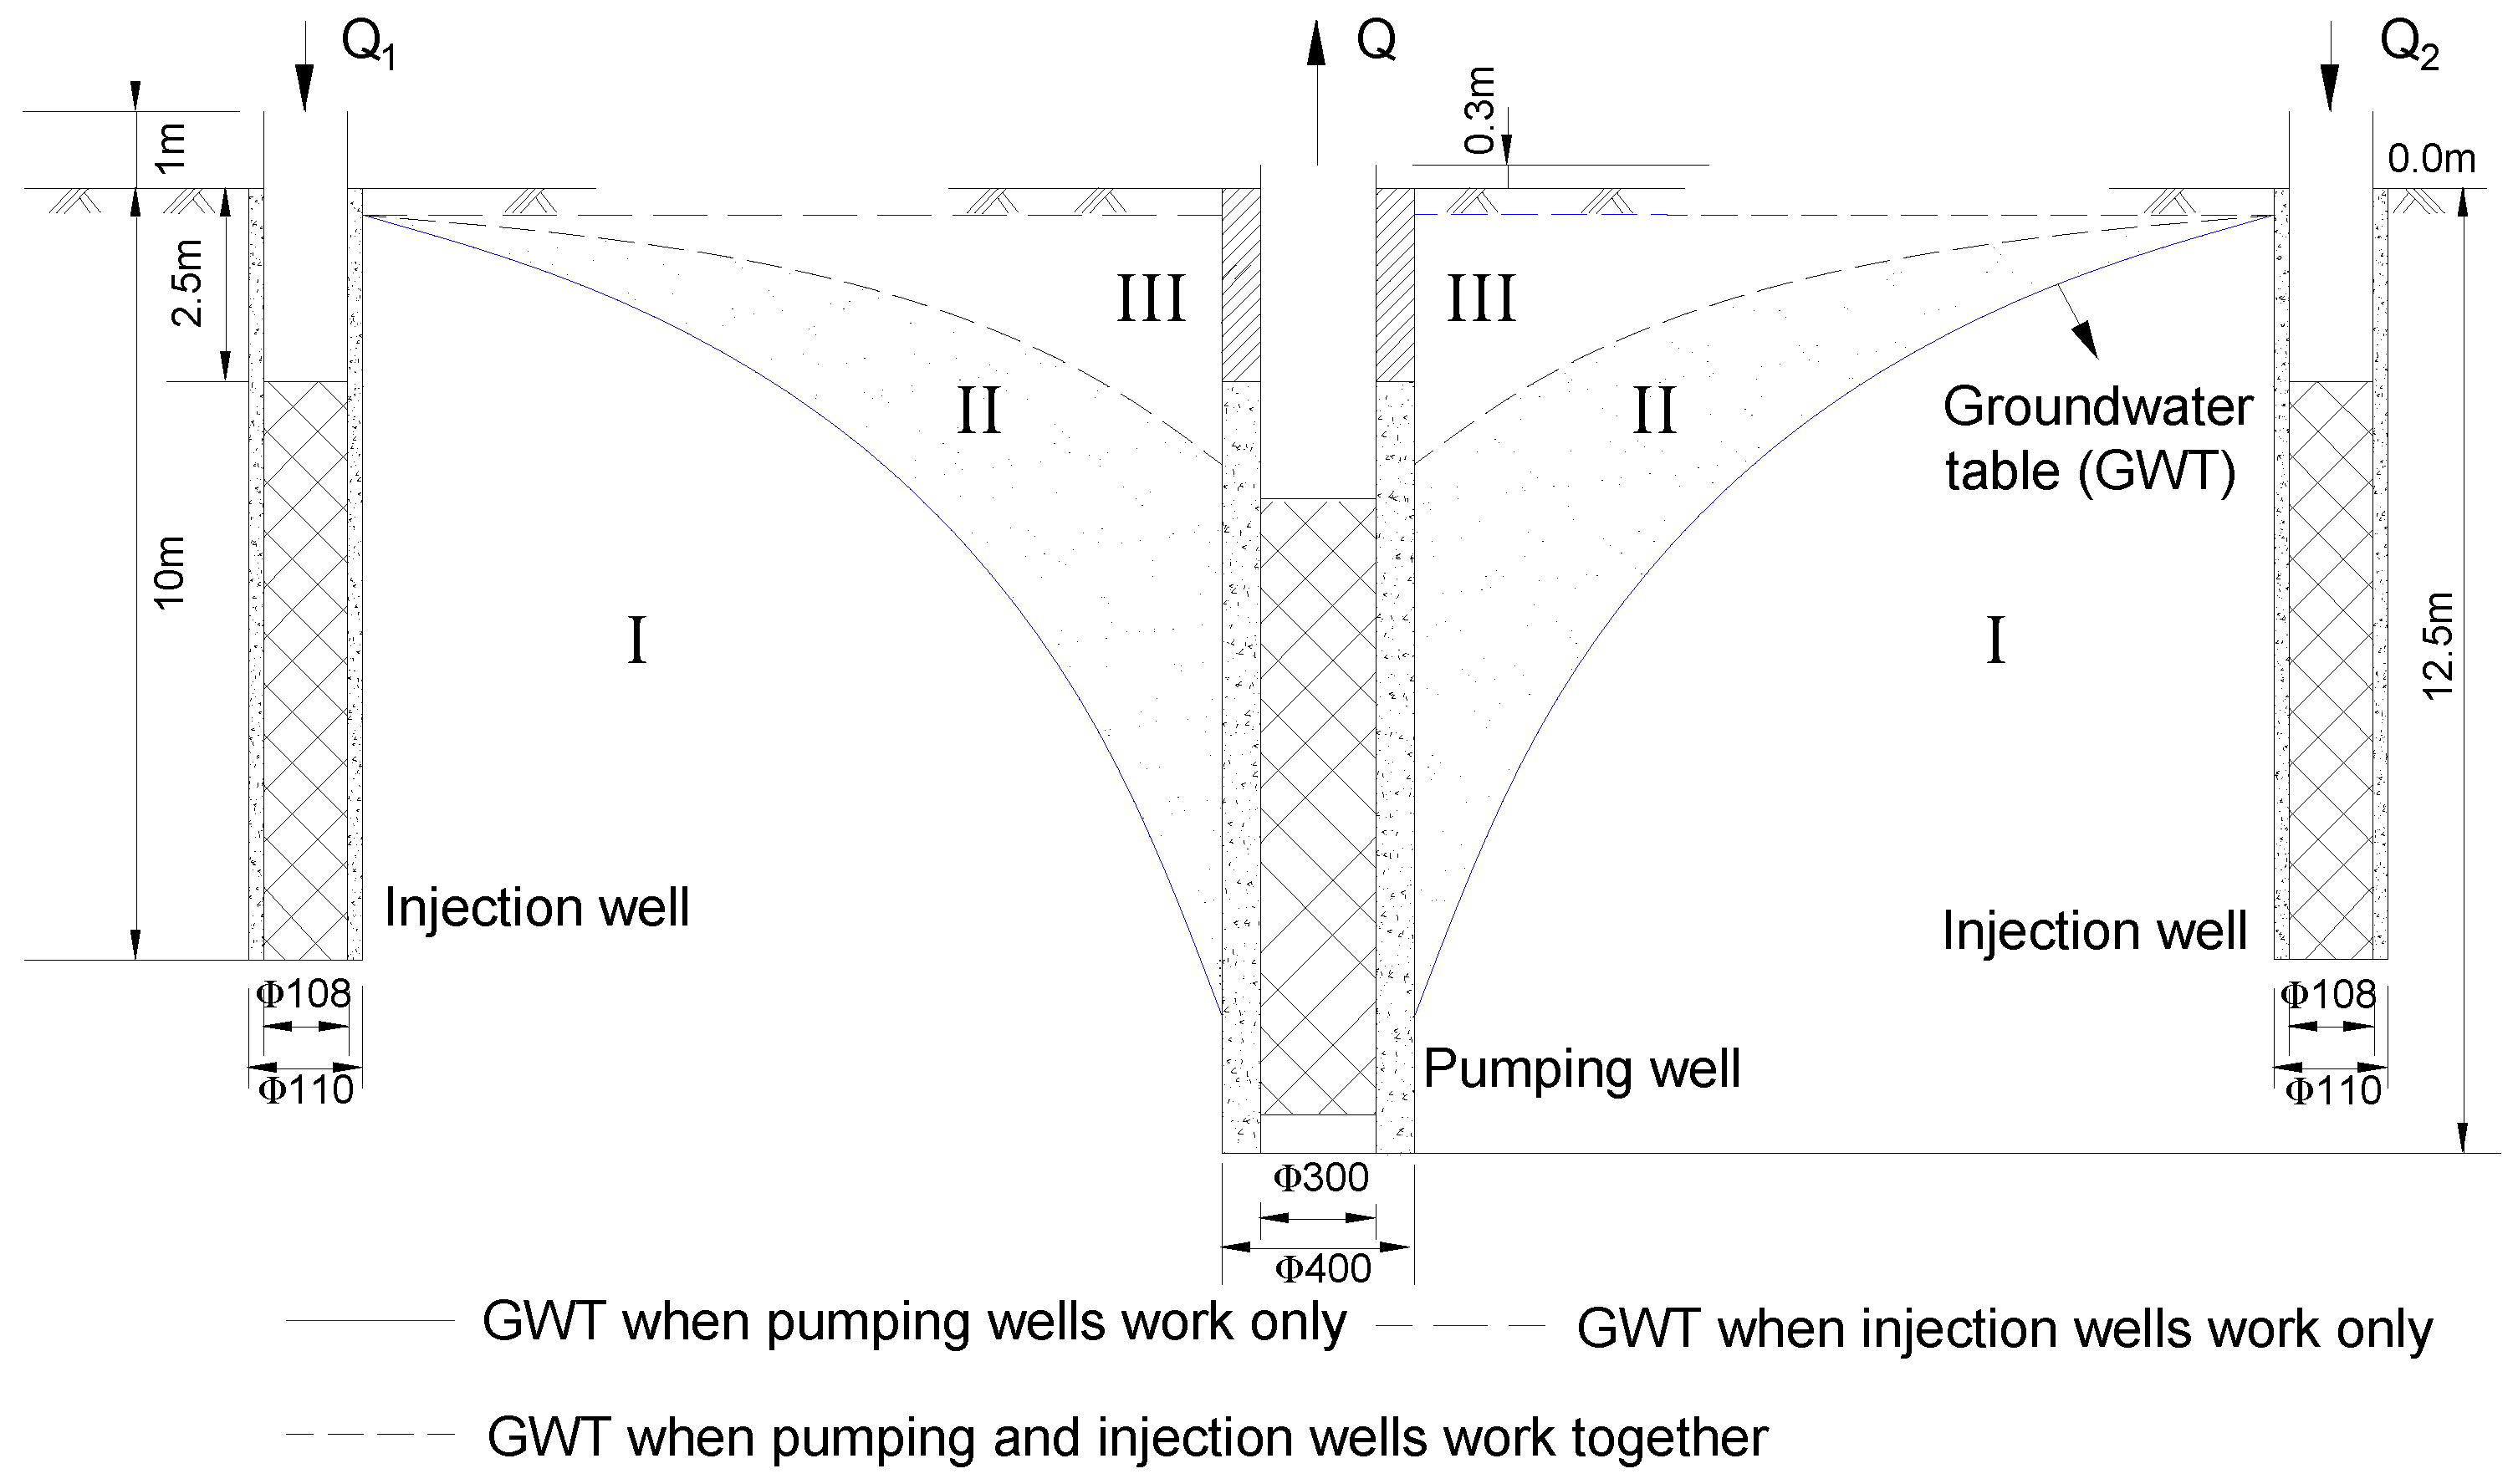
If the pumping well is taken as the center and the water injection well is set up on both sides, the structure diagram is shown in Figure 6. The depth of the pumping well was 12.5 m, and the well diameter was Φ400 mm, while the depth of the water injection well was 10.0 m, and the well diameter was Φ110 mm. The filter length of the pumping well and water injection well was 7.5 m and 10.0 m, respectively. The underground water level was such that the pumping wells worked only, and the pumping well and the water injection well worked at the same time, and the water level recovered when the pumping well stopped working, and the water injection well continued to work.
4.2. Initial Concentration Field Distribution of Sulfate
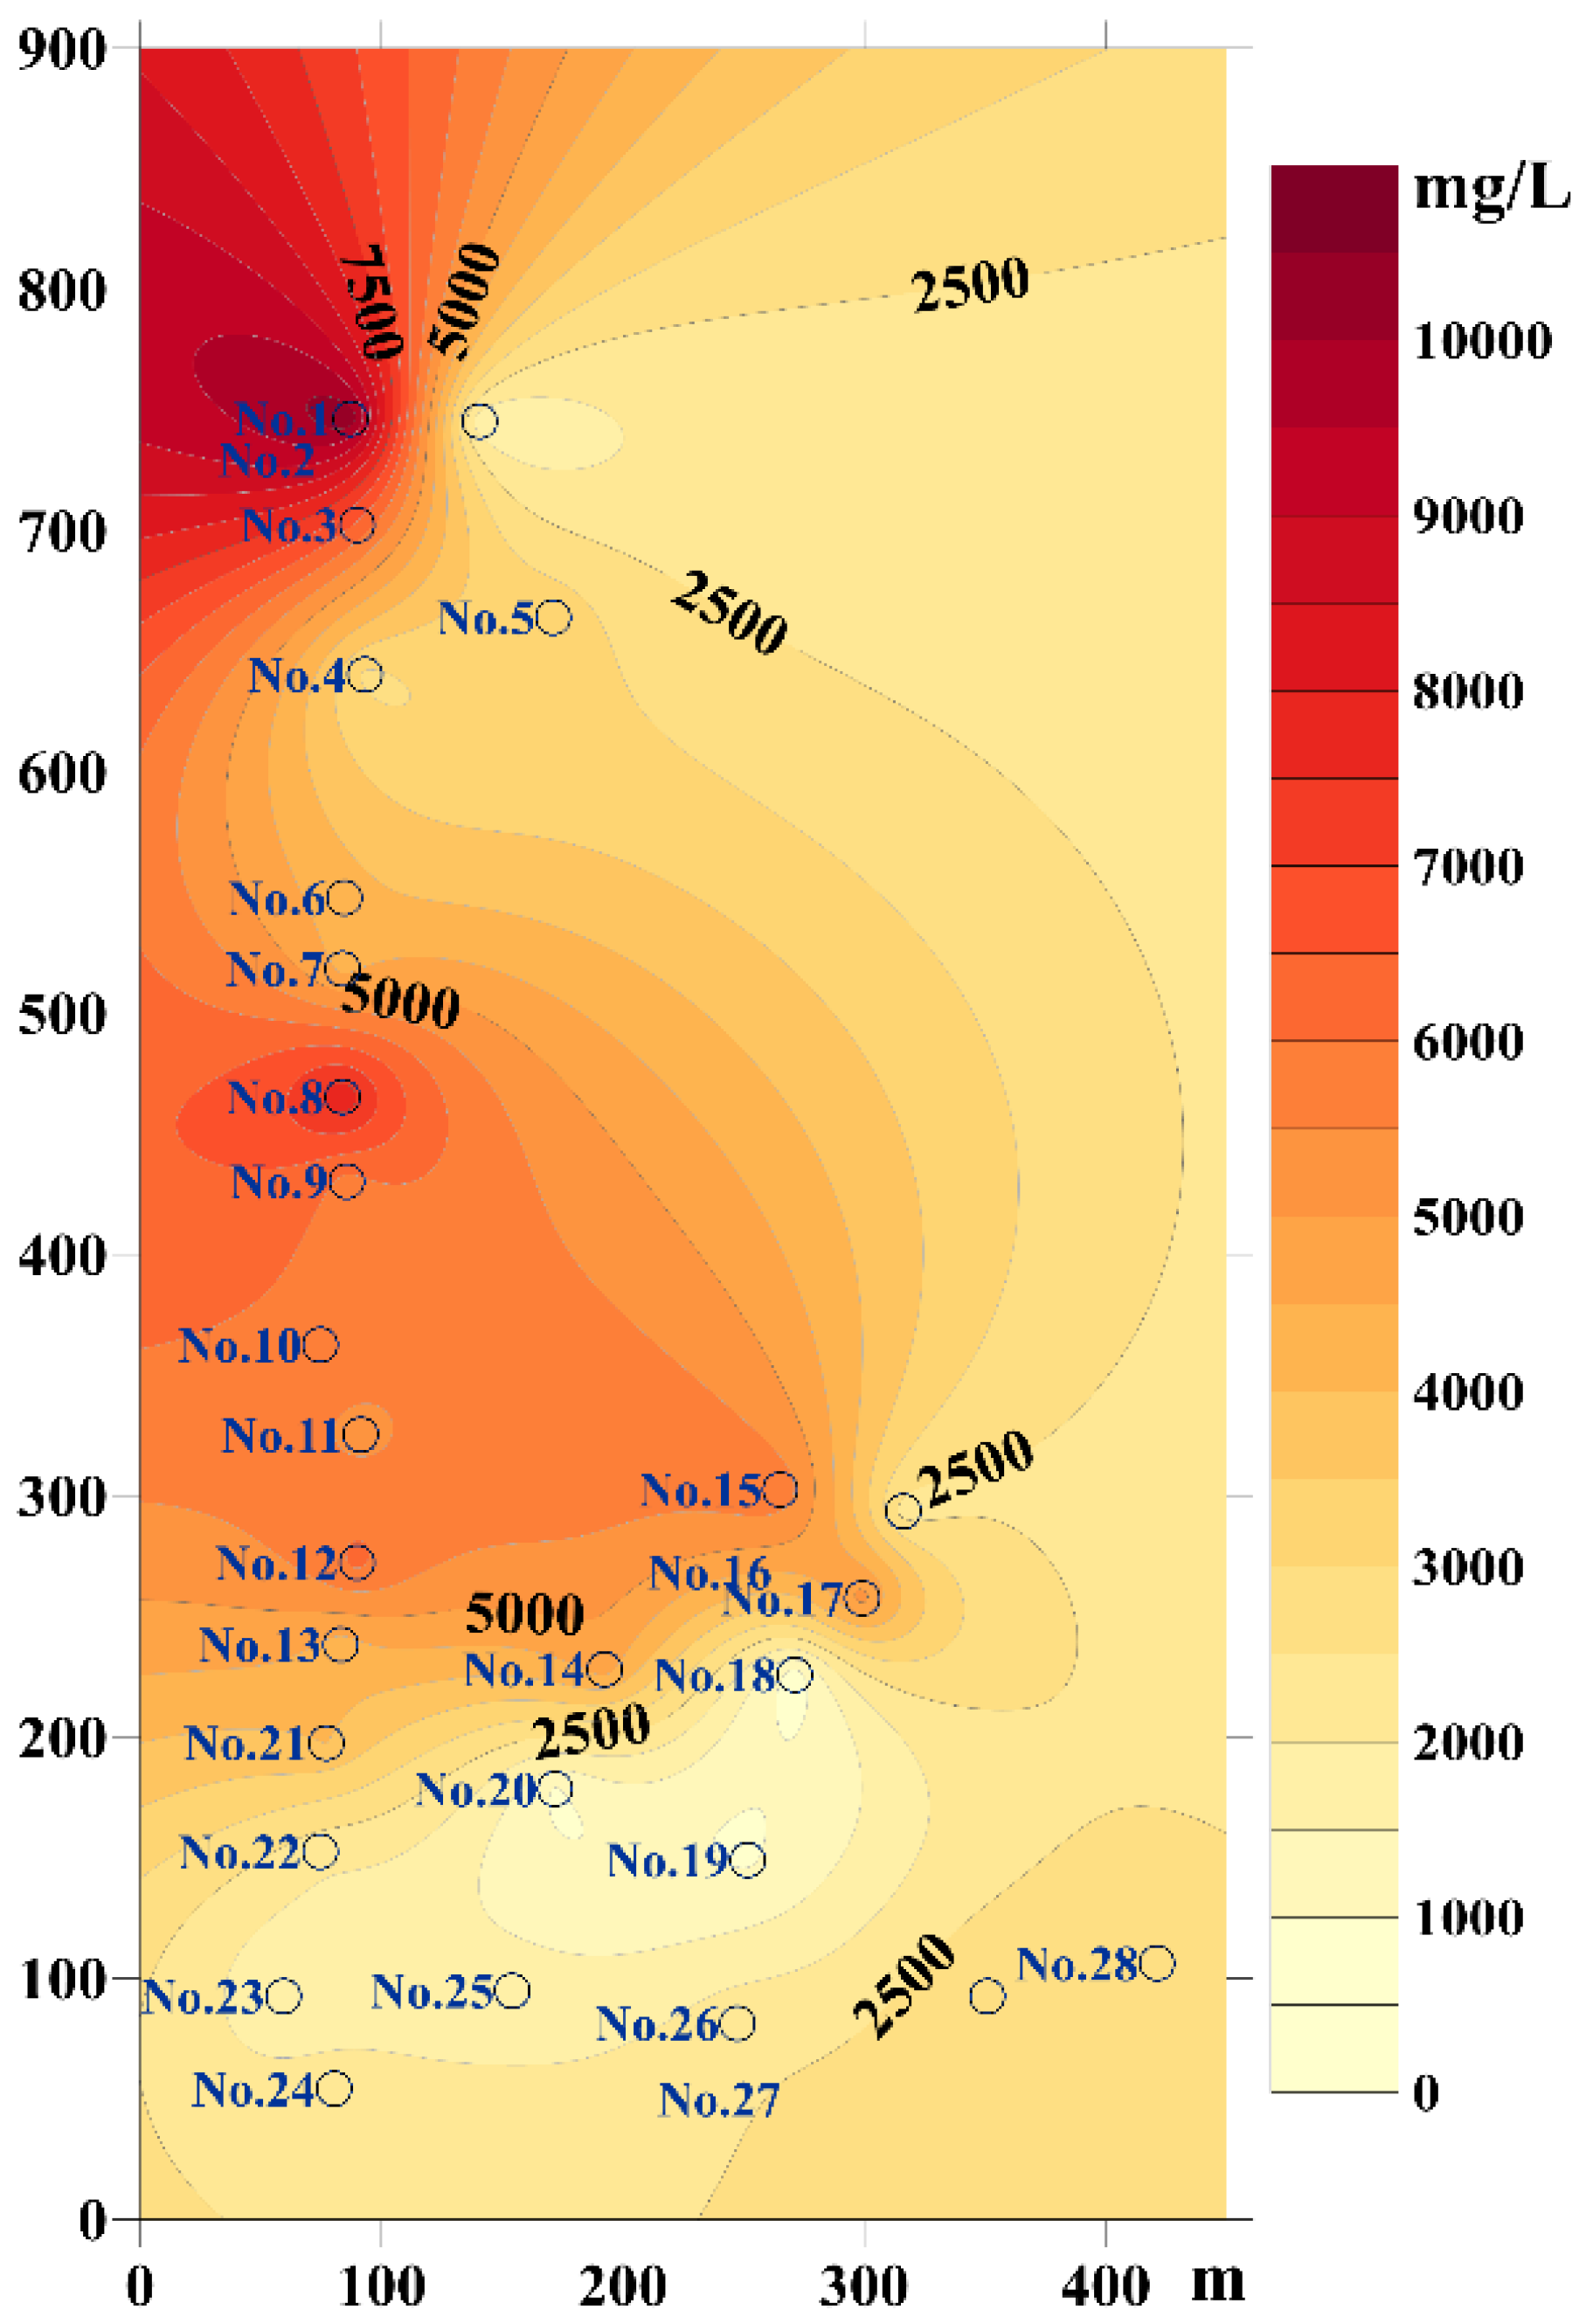
Considering the hydrogeological conditions of the site, and the needs of soil and groundwater remediation, the Dupuit formula was used to calculate the influence radius of single well pumping. According to the pollution scope of the site, 28 pumping wells were preliminarily designed along the ditches to obtain more complete and correct information about the groundwater contamination. The layout of these wells, which are the potential sites for the pumping wells in the remediation stage, through the water quality analysis of groundwater samples collected from 28 boreholes, was designed on the basis of the contamination plume that was predominantly distributed in the west and south side of the site. The Kriging algorithm was employed to acquire a contour map of the approximate sulfate concentrations [28]. The distribution of sulfate concentrations is shown in Figure 7.
4.3. Procedures of Groundwater Treatment
There are a total of 28 pumping wells and 66 injection wells. The treatment process is divided into 4 stages. At the first stage, the following steps are conducted: (1) water pumping; (2) continue pumping and start water injection; (3) stop water injection and continue pumping; (4) stop pumping; (5) collect water samples after the water level recovers and complete the first stage of treatment. The first stage includes 21 days of water pumping, 14 days of tap water injection, 7 days of water level recovery, and 3 days of sampling analysis to test the effect of treatment and remediation, totaling 30 days. The above process is repeated 3 times. Chemical precipitation is employed in the last stage. Water samples are collected for analysis at the end of each working stage.
In the first three stages, the total pumping output is 100,000 t, and the injection volume is 45,000 t. The pumping rate of each pumping well is approximately the same during the entire treatment procedure. Similarly, the injection rate of injection wells should also be identical. All the water extracted from the pumping well is precipitated through two lime water ponds prepared on the ground for double sedimentation, thereby decreasing the sulfate concentration and preventing secondary pollution. During pumping, it is found that No. 25–No. 28 water pollution monitoring results are good, and the operation is stopped in the second and third stages. The proper configuration of pumping and injection wells are able to remove sulfates from large contaminated area and be also time-saving and cost-effective when the pumping and injection wells worked together and when only the pumping wells worked.
In the last stage, lime water is injected into the original pumping well and the water injection well instead of clean water. The injection volume is about 30,000 t. The water injection lasted for 21 days, and the water samples are collected for analysis after the water level was stable for 9 days.
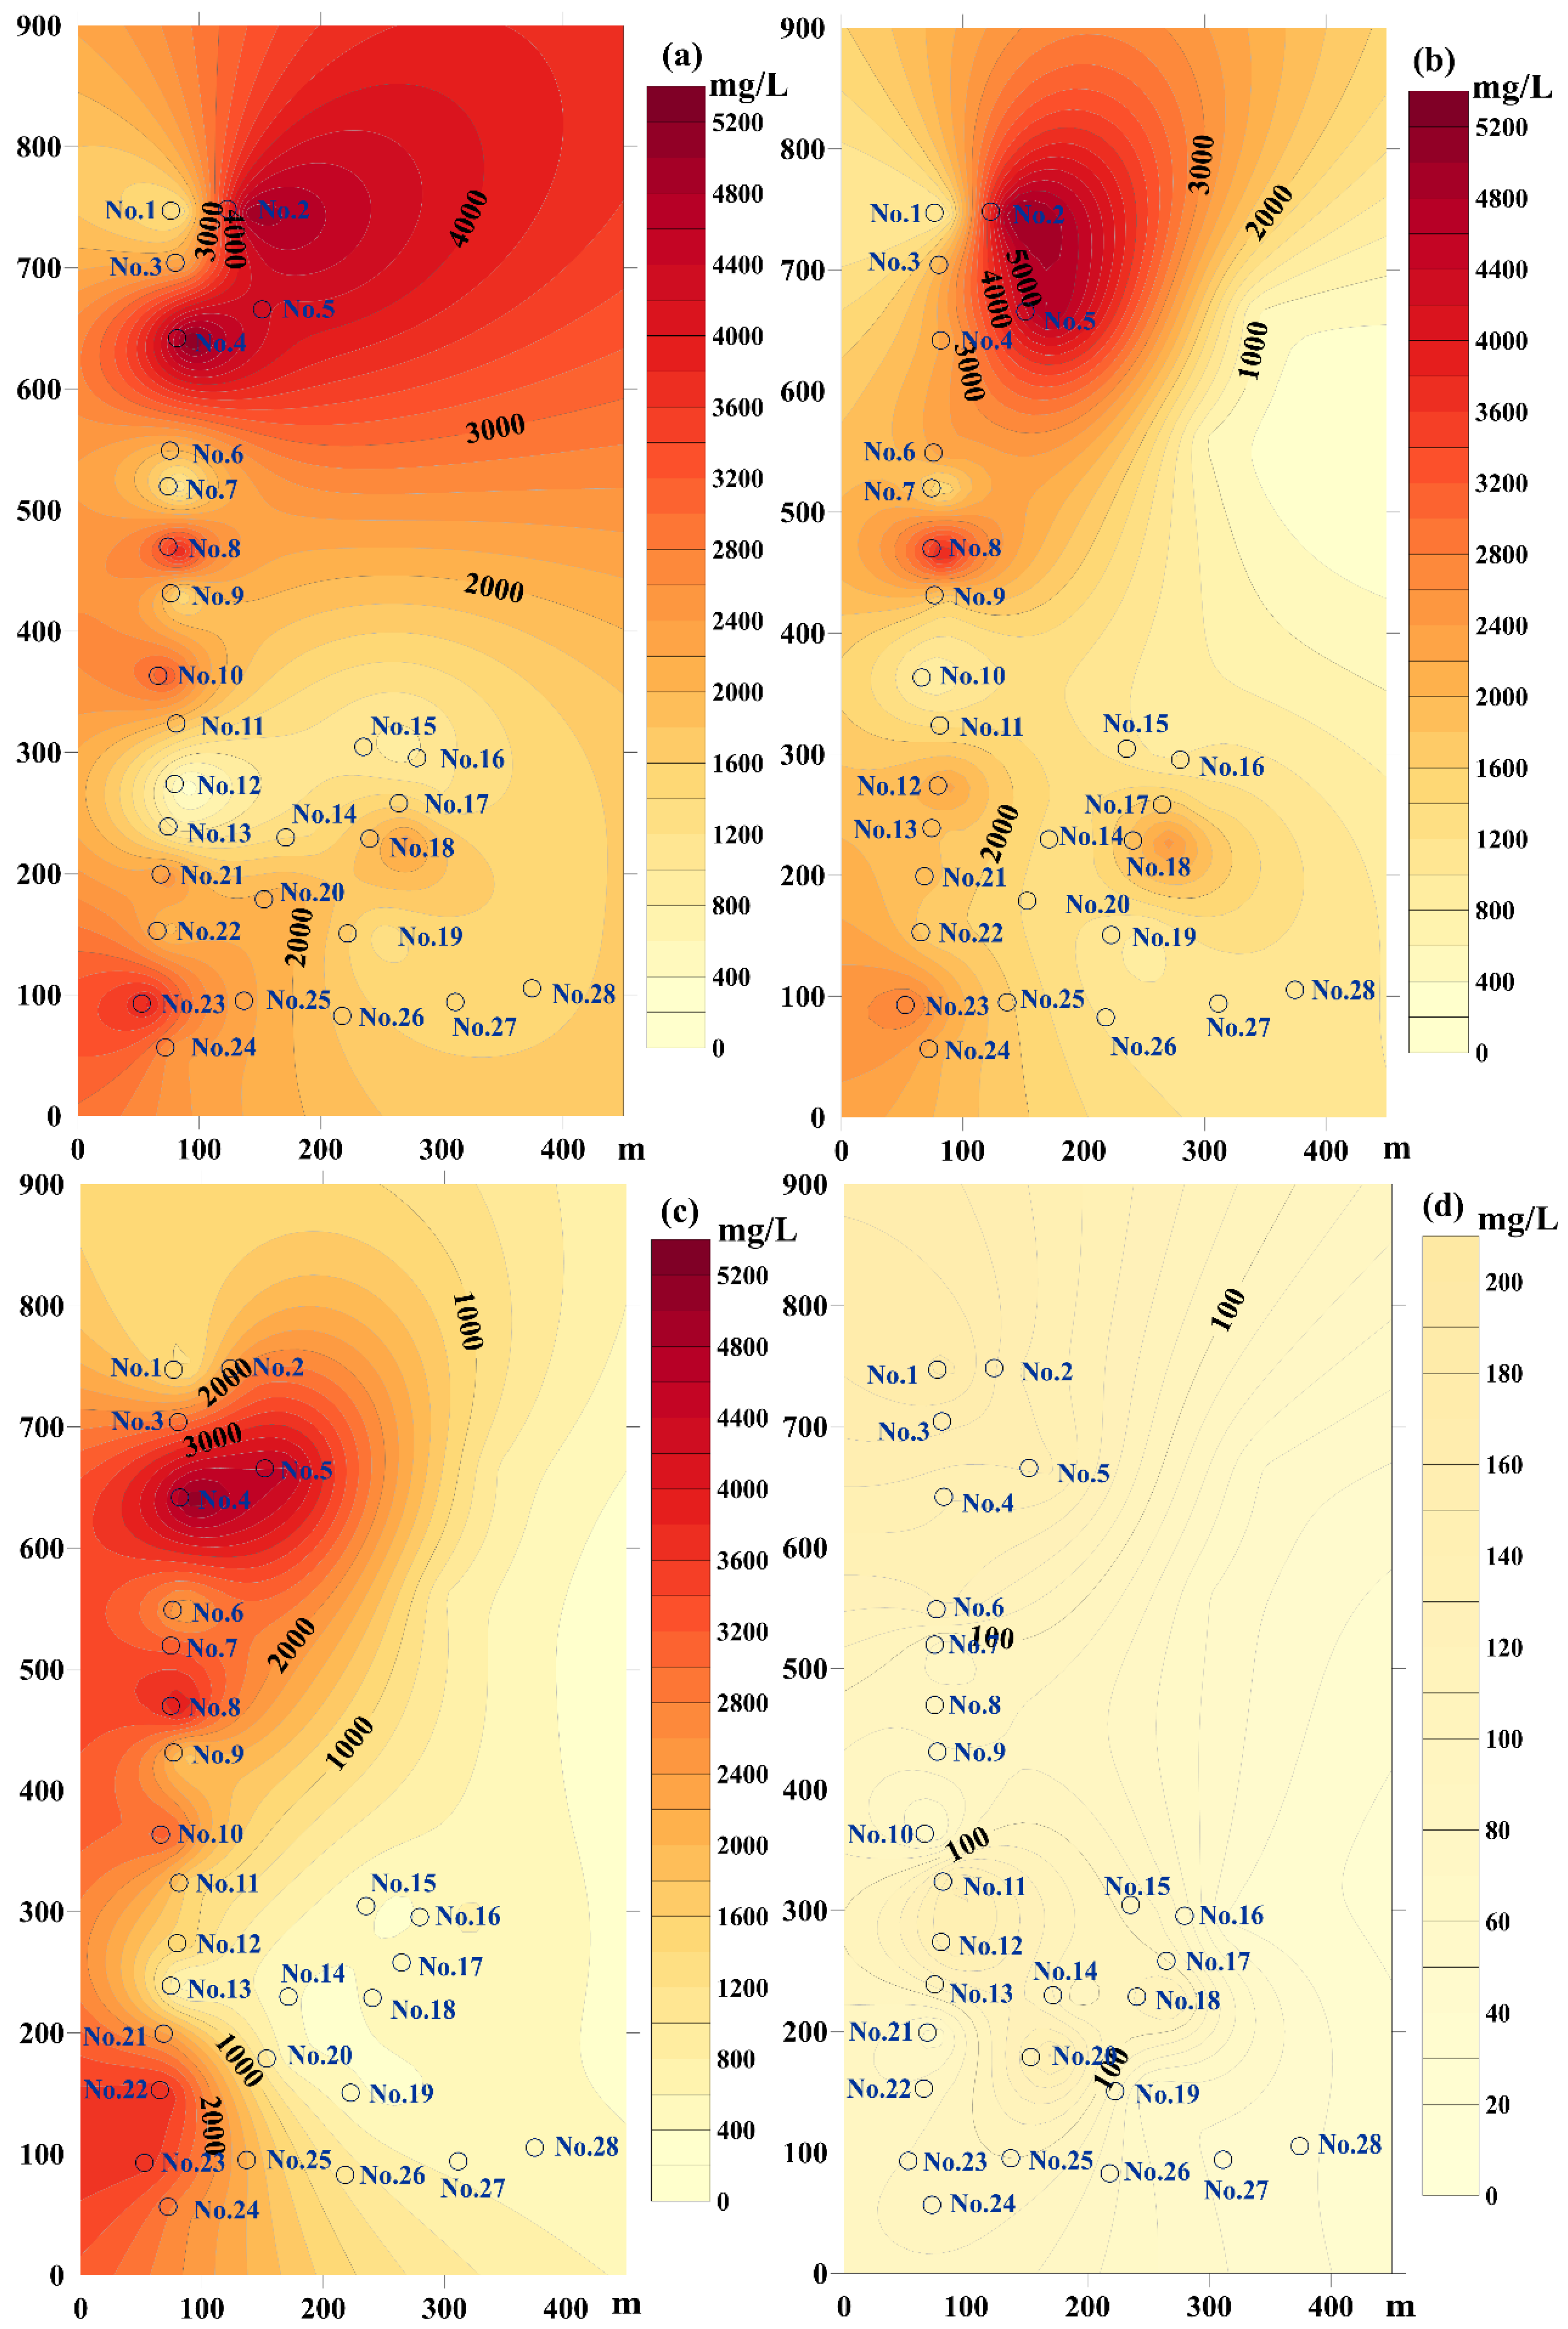
After the treatment and remediation work is completed, all the wells are buried except wells No. 4 and No. 8, which are left as monitoring wells for approximately two years to evaluate the treatment effects. The sulfate concentration contour maps of the four stages are shown in Figure 8, and the trending line is demonstrated in Figure 9.
5. Results and Discussion
5.1. Distribution of Sulfate Concentrations at Depth
The investigation showed that the sulfate infiltrated up to 8 m in depth. It is clear from Figure 3 that the soil in the site is mainly silt clay with small hydraulic conductivity. However, the sulfate infiltration almost reached the impervious layer, indicating that the soil has experienced long-term exposure to sulfate contaminants. Moreover, there are no impervious barriers in the site to halt sulfate transport and the spread of the plume. Transport of the groundwater pollutants near the ditch’s corner are approximately vertical, which complies with the recharge–runoff–discharge law. Therefore, sulfate concentrations in investigation boreholes No. 1, No. 2, and No. 3 at different depths were approximately equal (Figure 4). In boreholes No. 3, No. 4, and No. 5, sulfate concentrations decreased with depth. This is because they are near the west ditches; here, wastewater first infiltrated the shallow surface and made it more contaminated than in the deeper zones. Sulfate concentrations were approximately 500 mg L−1 at shallow depths of investigation in boreholes No. 8 and No. 9 and increased with depth. It is clear that although they were far from the ditches, the sulfate contaminant had already been transported to the middle parts of study area through groundwater flow. It is obvious that the pollution caused by sulfate ions varied greatly in different positions and depths of the site.
5.2. Distribution of Sulfate Concentrations in the Plane
Figure 7 demonstrates that sulfate concentrations around the west ditches were much higher than in other areas; therefore, the west areas are the main areas of pollution. The preliminary investigation showed that sulfate concentrations in boreholes No. 1, No. 2, and No. 3 were significantly higher than in other boreholes. The average and maximum sulfate concentration in boreholes No. 1 and No. 2 were 3845.68 mg L−1 and 10,330 mg L−1, respectively. The average value was nearly 30 times the standard value of V class groundwater, which is absolutely not suitable for drinking [29]. Particularly, sulfate concentrations in boreholes No. 1, No. 2, and No. 3 were more than three times higher than in other boreholes. Owing to the low velocity of the groundwater flow in this area, there is plenty of time for more wastewater to infiltrate the groundwater. Consequently, groundwater in boreholes No. 1, No. 2, and No. 3 was highly corrosive to concrete structures and that in boreholes No. 4 through No. 9 was moderately corrosive.
5.3. Removal Efficiency Analysis
The results of sulfate concentrations measured from samples during the four stages of remediation indicate that the integrated application of a hydraulic barrier, hydraulic capture zones, and chemical immobilization was effective in achieving the less than 300 mg L−1 cleanup goal. The pollution source was isolated from the study area by a hydraulic barrier, thereby stopping further contamination. The hydraulic capture zone removed masses of sulfate from the groundwater, and sulfates that could not be eliminated by pumping wells were precipitated by chemical immobilization.
The contour map of Figure 8 demonstrates that sulfate concentrations were much lower than pre-treatment concentrations. Nevertheless, the areas with the highest contamination were still distributed along the west ditch. The detected results of the second stage showed little difference to that of the first stage, although the range of high concentration areas became smaller. Sulfate concentrations in some areas were higher than previous levels. This is because the location of the pumping well was not the place with the most serious pollution. The pollutants were dredged by pumping, and the concentration of sulfate ions in the groundwater increased instead of decreased. At the same time, there were obvious differences in the pollution degree of pollutants at different depths, maybe because some sulfates that were absorbed by the soil were mobilized by pumping and injection, introducing more mobile sulfates into the groundwater. On the whole, however, sulfate concentrations in most of the wells decreased in the first two stages. The decrease was small, indicating that the hydraulic connection had already come into effect. After the third and fourth stages, sulfate concentrations declined significantly. With the injection of lime water in the fourth stage, sulfate concentrations in those wells, which had not performed an obvious drop in the previous three stages, declined substantially.
The main reason is that sulfate reacts with calcium ions to produce calcium sulfate precipitation, thereby reducing the mobile sulfate concentration. Finally, sulfate concentrations in the fourth stage in the entire study site were all less than 300 mg L−1.
Specifically, sulfate concentrations in 54% of the samples were less than 100 mg L−1, and the rest were between 100–200 mg L−1. After the four stages of treatment, all the wells showed decreases in total sulfate concentration of 80–98% from pre-treatment concentrations. The groundwater quality after remediation satisfied the requirements of Class II groundwater, which can be widely used for various purposes.
Wells No. 4 and No. 8 in the highly polluted areas were left to be long-time monitoring wells, and samples selected here after the fourth stage were utilized to evaluate the treatment effects. Sulfate levels in the samples stayed under 300 mg L−1 and fluctuated between 110 mg L−1 and 220 mg L−1 (Figure 9). Fluctuations in the sulfate concentrations during monitoring are normal and are caused by seasonal variations and groundwater level fluctuations. The expected effectiveness of the integrated application of multiple groundwater remediation methods were completely realized in the study site.
Two similar cases were found in China. Gu et al. (2014) took a landfill site of hazardous waste as a case and used Visual MODFLOW software to establish a groundwater pollutant migration and diffusion model. This modeling lasted 365 days. The results showed that the six pumping and one injection well group system had the best remediation effect when the pumping rate of a single well was 350 m3/d, which could reach the goal of remediation [30]. Li et al. (2019) conducted a 69-day hydraulic capture test in the Tugou section of the Beiyun River Basin in China. The results showed that after 69 days of remediation, the concentration of most groundwater quality indicators showed a downward trend, among which the sulfate concentration decreased by 57.9% [31]. The integrated techniques of a hydraulic barrier, hydraulic capture zones, and coagulant sedimentation were applied to treat the sulfate-contaminated groundwater and soil in our study. After 120 days of remediation, the results proved that the integrated techniques were effective in both plume cutoff and field remediation. Above 80% of the sulfate was removed by this remediation method. Thus, the removal efficiency of integrated hydraulic capture techniques is better than other cases, which is mainly related to the selection of technical parameters.
6. Conclusions
Integrated applications of groundwater remediation techniques are adopted to treat the highly sulfate-contaminated groundwater in this study. The results could be instructive for the utilization of hydraulic capture techniques and applications of these technologies under more challenging circumstances. The following conclusions are obtained:
- (1)
- The study site is closely connected to the safety of the building and the water supply for thousands of local residents. It is heavily contaminated by sulfates from an abandoned chemical plant. The highest concentration of sulfate recorded was 10,330 mg L−1, and the maximum depth of contamination was 8 m. The remediation time is the most significant factor when choosing a remediation method for such an emergency with high levels of public concern.
- (2)
- The integrated application of a hydraulic barrier, hydraulic capture zones, and coagulant sedimentation treated the sulfate-contaminated groundwater and soil effectively. After four stages of remediation, the results demonstrated the integrated techniques to be effective in both plume cutoff and field remediation; 98% of the sulfate masses were captured approximately by this remediation method. Sulfate concentrations in the two monitoring wells were maintained between 200 mg L−1 and 220 mg L−1 and have sustained this level for a total duration of two years. The expected remediation effects have been realized.
- (3)
- It is normal for sulfate concentrations to fluctuate after the treatment because of seasonal variations and groundwater level fluctuations, and concentrations do not exceed 300 mg L−1. More studies are required to optimize remediation efforts. Factors influencing the removal efficiency should be in the scope of future research.
Author Contributions
Conceptualization, N.Z. and S.L.; methodology, N.Z.; software, S.Z. and S.L.; validation, N.Z.; investigation, N.Z.; resources, N.Z.; visualization, Y.C.; supervision, N.Z.; project administration, N.Z.; writing—original draft, N.Z. All authors have read and agreed to the published version of the manuscript.
Funding
This research was funded by the National Science Fund of China (No. 42077176) and the Natural Science Foundation of Shanghai (No. 20ZR1459700).
Institutional Review Board Statement
Not applicable.
Informed Consent Statement
Not applicable.
Data Availability Statement
The data presented in this study are available on request from the corresponding author.
Acknowledgments
The authors sincerely thank the editors and the reviewers for their valuable comments and suggestions, which greatly improved the quality of this article.
Conflicts of Interest
The authors declare no conflict of interest.
References
- Moncaster, S.J.; Bottrell, S.H.; Tellam, J.H.; Lloyd, J.W.; Konhauser, K.O. Migration and attenuation of agrochemical pollutants: Insights from isotopic analysis of groundwater sulphate. J. Contam. Hydrol. 2000, 43, 147–163. [Google Scholar] [CrossRef]
- Kiss, A.A.; Bildea, C.S.; Grievink, J. Dynamic modeling and process optimization of an industrial sulfuric acid plant. Chem. Eng. J. 2010, 158, 241–249. [Google Scholar] [CrossRef]
- Miao, Z.; Carroll, K.C.; Brusseau, M.L. Characterization and quantification of groundwater sulfate sources at a mining site in an arid climate: The monument valley site in Arizona, USA. J. Hydrol. 2013, 504, 207–215. [Google Scholar] [CrossRef] [PubMed]
- Al-Amoudi, O.S.B.; Abduljauwad, S.N.; Maslehuddin, M. Effect of chloride and sulfate contamination in soils on corrosion of steel and concrete. Transp. Res. Rec. 1992, 1345, 67–73. [Google Scholar]
- Tulliani, J.M.; Montanaro, L.; Negro, A.; Collepardi, M. Sulfate attack of concrete building foundations induced by sewage waters. Cem. Concr. Res. 2002, 32, 843–849. [Google Scholar] [CrossRef]
- Qiu, J. China to spend billions cleaning up groundwater. Science 2011, 334, 745. [Google Scholar] [CrossRef]
- Li, D.; Zuo, Q.; Cui, G. Disposal of chemical contaminants into groundwater: Viewing hidden environmental pollution in China. Environ. Earth Sci. 2013, 70, 1933–1935. [Google Scholar] [CrossRef]
- Wu, C.; Luo, Y.; Gui, T.; Yan, S. Characteristics and potential health hazards of organochlorine pesticides in shallow groundwater of two cities in the Yangtze River Delta. CLEAN-Soil Air Water 2014, 42, 923–931. [Google Scholar] [CrossRef]
- Xiao, R.; Bai, J.; Gao, H.; Wang, J.; Huang, L.; Liu, P. Distribution and contamination assessment of heavy metals in water and soils from the college town in the Pearl River Delta, China. CLEAN-Soil Air Water 2012, 40, 1167–1173. [Google Scholar] [CrossRef]
- Barry, F.; Ophori, D.; Hoffman, J.; Canace, R. Groundwater flow and capture zone analysis of the Central Passaic River Basin, New Jersey. Environ. Geol. 2009, 56, 1593–1603. [Google Scholar] [CrossRef]
- Cápiro, N.L.; Pennell, K.D. Source Control and Chemical Remediation of Contaminated Groundwater Sites; Groundwater Management Technical Committee of the Groundwater Council of EWRI Environmental and Water Resources Institute (EWRI) of the American Society of Civil Engineers: Reston, VA, USA, 2011; Volume 475. [Google Scholar]
- Mackay, D.M.; Cherry, J.A. Groundwater contamination: Pump-and-treat remediation. Environ. Sci. Technol. 1989, 23, 630–636. [Google Scholar] [CrossRef]
- Bayer, P.; Finkel, M.; Teutsch, G. Cost-optimal contaminant plume management with a combination of pump-and-treat and physical barrier systems. Groundw. Monit. Remediat. 2005, 25, 96–106. [Google Scholar] [CrossRef]
- Cundy, A.B.; Hopkinson, L.; Whitby, R.L.D. Use of iron-based technologies in contaminated land and groundwater remediation: A review. Sci. Total Environ. 2008, 400, 42–51. [Google Scholar] [CrossRef]
- Mulligan, C.N. Remediation technologies for metal-contaminated soils and groundwater: An evaluation. Eng. Geol. 2001, 60, 193–207. [Google Scholar] [CrossRef]
- Barcelona, M.J. Development and applications of groundwater remediation technologies in the USA. Hydrogeol. J. 2005, 13, 288–294. [Google Scholar] [CrossRef]
- Ministry of Housing and Urban-Rural Development of the People’s Republic of China. Code for Investigation of Geotechnical Engineering (GB 50021-2001); China Construction Industry Press: Beijing, China, 2009. [Google Scholar]
- Fowler, K.R.; Kelley, C.T.; Kees, C.E.; Miller, C.T. A hydraulic capture application for optimal remediation design. Dev. Water Sci. 2004, 55, 1149–1157. [Google Scholar]
- Ayinippully Nalarajan, N.; Govindarajan, S.K.; Nambi, I.M. Aquifer heterogeneity on well capture zone and solute transport: Numerical investigations with spatial moment analysis. Int. J. Environ. Sci. Technol. 2022, 19, 7261–7274. [Google Scholar] [CrossRef]
- Faybishenko, B.A.; Javandel, I.; Witherspoon, P.A. Hydrodynamics of the capture zone of a partially penetrating well in a confined aquifer. Water Resour. Res. 1995, 31, 859–866. [Google Scholar] [CrossRef]
- Hosseini, S.M.; Tosco, T.; Ataie-Ashtiani, B.; Simmons, C.T. Non-pumping reactive wells filled with mixing nano and micro zero-valent iron for nitrate removal from groundwater: Vertical, horizontal, and slanted wells. J. Contam. Hydrol. 2018, 210, 50–64. [Google Scholar] [CrossRef]
- Tiziana, T.; Antonio, D.M.; Rajrea, S. Automatic Delineation of Capture Zones for Pump and Treat Systems: A Case Study in Piedmont, Italy. Groundw. Monit. Remediat. 2010, 30, 46–52. [Google Scholar]
- Nzeribe, B.N.; Li, W.; Crimi, M.; Yao, G.; Divine, C.E.; McDonough, J.; Wang, J. Hydraulic performance of the horizontal reactive media treatment well: Pilot and numerical study. Groundw. Monit. Remediat. 2020, 40, 30–41. [Google Scholar] [CrossRef]
- Chen, Y.; Zhu, X.; Jiang, Y.; Xie, Q. Transformations and hydraulic captures of petrochemical contaminants in a karst-fractured aquifer. Environ. Geol. 2000, 39, 1304–1308. [Google Scholar] [CrossRef]
- Fetter, C.W. Contaminant Hydrogeology, 3rd ed.; Waveland Press, Inc.: Long Grove, IL, USA, 2018. [Google Scholar]
- Javadi, A.A.; Abd-Elhamid, H.F.; Farmani, R. A simulation-optimization model to control seawater intrusion in coastal aquifers using abstraction/recharge wells. Int. J. Numer. Anal. Methods Geomech. 2012, 36, 1757–1779. [Google Scholar] [CrossRef]
- Javandel, I.; Tsang, C.F. Capture-zone type curves: A tool for aquifer cleanup. Groundwater 1986, 24, 616–625. [Google Scholar] [CrossRef]
- Zhang, S.; Qiang, J.; Liu, H.; Lv, H.; Wu, J.; Zhou, J. Hydraulic Capture Optimization and Risk Assessment of Polluted Groundwater Based on Kriging Surrogate Model. Water Air Soil Pollut. 2022, 233, 101. [Google Scholar] [CrossRef]
- Ministry of Environmental Protection of the People’s Republic of China. Quality standard for Groundwater. 2017. Available online: http://c.gb688.cn/bzgk/gb/showGb?type=online&hcno=F745E3023BD5B10B9FB5314E0FFB5523 (accessed on 19 September 2022).
- Gu, X.; Du, P.; Shan, H.M.; Ma, T.; Cheng, S.G. Application of hydraulic capture technique in groundwater pollution restoration. Saf. Environ. Eng. 2014, 21, 52–58. (In Chinese) [Google Scholar]
- Li, B.H.; Hao, Z.Y.; Huang, J.X.; Zhang, J.M. Evaluation of groundwater hydraulic capture effect in Tugou Section of Beiyun River Basin. Water Resour. Prot. 2019, 35, 18–24. (In Chinese) [Google Scholar]
Figure 1.
Location of the study site and the preliminary survey bores.

Figure 2.
Scanning electron micrographs of sulfate-corroded concrete: (a) corroded, 100 μm; (b) non-corroded, 10 μm; and (c) corroded, 50 μm.
Figure 2.
Scanning electron micrographs of sulfate-corroded concrete: (a) corroded, 100 μm; (b) non-corroded, 10 μm; and (c) corroded, 50 μm.

Figure 3.
Schematic diagram of strata distribution in the study site.

Figure 4.
Sulfate concentrations in the 9 investigation boreholes.

Figure 5.
The contamination plume and locations of pumping and injection wells.

Figure 6.
Structure of injection and pumping well, and water level distribution under different working conditions.
Figure 6.
Structure of injection and pumping well, and water level distribution under different working conditions.

Figure 7.
Locations of the 28 pumping wells and the distribution of sulfate concentrations before treatment.
Figure 7.
Locations of the 28 pumping wells and the distribution of sulfate concentrations before treatment.

Figure 8.
Sulfate concentration distributions after treatment for 30 d (a), 60 d (b), 90 d (c), and 120 d (d).
Figure 8.
Sulfate concentration distributions after treatment for 30 d (a), 60 d (b), 90 d (c), and 120 d (d).

Figure 9.
Changes in sulfate concentrations at different treatment and remediation stages.


Table 1.
Evaluation criteria of sulfate corrosion of concrete.
| Indicators of Sulfate Corrosion of Concrete (mg L−1) | Corrosion Intensity |
|---|---|
| <1500 | None |
| 1500–2500 | Weak |
| 2500–5000 | Medium |
| 5000–20,000 | Strong |
Table 2.
Evaluation of sulfate corrosion of concrete in the groundwater.
| Well Number | Sampling Depth | Concentration of (mg L−1) | Corrosion Intensity |
|---|---|---|---|
| 1# | 4 m | 10,157 | Strong |
| 6 m | 10,464 | Strong | |
| 2# | 4 m | 10,362 | Strong |
| 6 m | 10,567 | Strong | |
| 3# | 2 m | 7541 | Strong |
| 4 m | 8259 | Strong | |
| 6 m | 7797 | Strong | |
| 4# | 4 m | 2770 | Medium |
| 6 m | 1795 | Weak | |
| 5# | 2 m | 2565 | Medium |
| 4 m | 2308 | Weak | |
| 6 m | 1539 | Weak | |
| 6# | 4 m | 2052 | Weak |
| 8 m | 2514 | Medium | |
| 7# | 6 m | 3386 | Medium |
| 8# | 2 m | 564 | None |
| 4 m | 564 | None | |
| 6 m | 1077 | None | |
| 9# | 2 m | 616 | None |
| 4 m | 693 | None | |
| 6 m | 2154 | Weak |
Publisher’s Note: MDPI stays neutral with regard to jurisdictional claims in published maps and institutional affiliations. |
© 2022 by the authors. Licensee MDPI, Basel, Switzerland. This article is an open access article distributed under the terms and conditions of the Creative Commons Attribution (CC BY) license (https://creativecommons.org/licenses/by/4.0/).
Share and Cite
MDPI and ACS Style
Zhou, N.; Lu, S.; Cai, Y.; Zhao, S. Site Investigation and Remediation of Sulfate-Contaminated Groundwater Using Integrated Hydraulic Capture Techniques. Water 2022, 14, 2989. https://doi.org/10.3390/w14192989
AMA Style
Zhou N, Lu S, Cai Y, Zhao S. Site Investigation and Remediation of Sulfate-Contaminated Groundwater Using Integrated Hydraulic Capture Techniques. Water. 2022; 14(19):2989. https://doi.org/10.3390/w14192989
Chicago/Turabian StyleZhou, Nianqing, Shuaishuai Lu, Yi Cai, and Shan Zhao. 2022. "Site Investigation and Remediation of Sulfate-Contaminated Groundwater Using Integrated Hydraulic Capture Techniques" Water 14, no. 19: 2989. https://doi.org/10.3390/w14192989
Note that from the first issue of 2016, this journal uses article numbers instead of page numbers. See further details here.