
India’s Contribution to Greenhouse Gas Emission from Freshwater Ecosystems: A Comprehensive Review


1
Department of Environmental Sciences, School of Natural Resource Management, Central University of Jharkhand, Brambe, Ranchi 835205, India
2
School of Hydrology and Water Resources, Nanjing University of Information Science and Technology, Nanjing 210044, China
*
Authors to whom correspondence should be addressed.
Water 2022, 14(19), 2965; https://doi.org/10.3390/w14192965
Submission received: 19 August 2022
/
Revised: 13 September 2022
/
Accepted: 16 September 2022
/
Published: 21 September 2022
(This article belongs to the Special Issue Recent Progress in CO2 Emission from the World’s Rivers)
Abstract
:In the modern era, due to urbanization, industrialization, and anthropogenic activities in the catchment, greenhouse gas (GHG; CO2, CH4, and N2O) emissions from freshwater ecosystems received scientific attention because of global warming and future climate impacts. A developing country such as India contributes a huge share (4% of global) of GHGs from its freshwater ecosystems (e.g., rivers, lakes, reservoirs) to the atmosphere. This is the first comprehensive review dealing with the GHG emissions from Indian freshwater bodies. Literature reveals that the majority of GHG from India is emitted from its inland water, with 19% of CH4 flux and 56% of CO2 flux. A large part of India’s gross domestic product (GDP) is manipulated by its rivers. As a matter of fact, 117.8 Tg CO2 year−1 of CO2 is released from its major riverine waters. The potential of GHG emissions from hydropower reservoirs varies between 11–52.9% (mainly CH4 and CO2) because of spatio-temporal variability in the GHG emissions. A significant contribution was also reported from urban lakes, wetlands, and other inland waters. Being a subtropical country, India is one of the global GHG hotspots, having the highest ratio (GHG: GDP) of 1301.79. However, a large portion of India’s freshwater has not been considered yet, and there is a need to account for precise regional carbon budgets. Therefore, in this review, GHG emissions from India’s freshwater bodies, drivers behind GHG emissions (e.g., pH, mean depth, dissolved oxygen, and nutrients), and long-term climatic risks are thoroughly reviewed. Besides research gaps, future directions and mitigation measures are being suggested to provide useful insight into the carbon dynamics (sink/source) and control of GHG emissions.
1. Introduction
India is the 3rd highest emitter of greenhouse gases (GHGs) among the top ten emitting countries with the highest gross domestic production (GDP) worldwide [1]. Being a developing country, India is still in unprecedented progress toward the growth of its economy, urbanization, and industrialization. The increasing GHGs emission has simultaneously amplified the consequences of global climate change. One of the most deliberate impacts of the increased concentration of GHGs (particularly CO2) is the increase in mean global temperature. During the 20th century, the Earth’s average temperature increased by 0.6 ± 0.12 °C and is expected to increase by 1.5–5.8 °C by the end of the twenty-first century [2]. Perhaps, weather extremities such as cyclones, hurricanes, floods, and drought are more frequent. The sixth report of the IPCC has indicated that anthropogenic impacts are one of the major influences behind the acceleration of climate change and extreme events leading to sea level rise and snowcap melting [3]. Similar is the case of India, where IPCC [4] predicted that in the future, India would experience more weather extremities, such as heat waves, floods, cyclones, drought, etc. Studies have found that carbon dioxide (CO2) is additive, and every ton of it is warming the planet. The IEA [5] reported that CO2 emissions would increase by 1.4%, approximately 30 million tonnes (MT), in India to meet the rising electricity demand in 2021, which was three times greater than in 2019. Adoption of aggressive strategies to lower the present value (~413 ppm) of CO2 in the atmosphere [6] and mitigate climate change is not enough to restrict the planet from getting warm till 2050 [3,4].
India’s GDP increased by 357%, while its contribution to GHG emissions climbed by 180% (between 1990 and 2019) [7,8]. The major sectors for GHG emissions in India are energy manufacturers, agriculture, industrial process, waste, land use changes, and forestry, among others. A large share of anthropogenic emissions in India is contributed by the major GHGs, especially carbon dioxide (CO2), methane (CH4), and nitrous oxide (N2O). Nevertheless, a sector is unidentified as a potential contributor to GHGs in India’s tally.
With 16% of the world’s population, India has 4% of the global freshwater resources [9]. The Asian Development Research Institute (ADRI) has revealed that only 12 major rivers in India cover about 253 million hectares (mha) of the catchment area, whereas the Ganga-Brahmaputra-Meghna systems cover 43% of the mentioned areas [10,11]. Other than rivers, other inland water resources comprise lakes, ponds, reservoirs, beels, oxbow lakes, derelict water, and brackish water, covering about 7 mha of catchment areas [11]. West Bengal, Orissa, Andhra Pradesh, Gujarat, and Karnataka have 50% of these inland waters distributed unevenly among them [12]. A significant portion of India experiences tropical climates which are highly suitable for agriculture. As a result, ~91% of total freshwater withdrawal is utilized for agricultural practices, followed by industries (4%) and municipalities (3%) [13]. Therefore, most water supplies to these sectors are accomplished by surface waters. Consequently, these freshwater ecosystems and their associates release a fair amount of GHGs into the atmosphere. The freshwater ecosystems receive both the organic (e.g., dissolved organic carbon and particulate organic carbon) and inorganic (e.g., dissolved inorganic carbon) forms of carbon and convert one species to another. Some species will be released into the atmosphere, some will be buried in the sediment, and a few will be transferred downstream [14]. The species affect the function of freshwater ecosystems and contribute to subsequent GHGs emissions by providing food sources to the heterotrophic microbes. The major contributors of GHGs such as CO2 and CH4 but N2O are found to be very low instead high nitrogen loading from inland water such as natural lakes, artificial reservoirs, hydropower reservoirs, and wetlands [15,16,17,18]. Natural lakes and reservoirs can offset a significant amount of GHGs sequestered by terrestrial ecosystems [19,20]. On the other hand, India being a developing country, the increasing number of dams and hydropower industries is enough to gradually offset a valuable fraction of carbon sequestered in fossil fuels [16,21]. Knowing the potential of GHGs is very important for anticipating how much and how fast the climate will change in the present and the future. Therefore, there is an urgent need to quantify the emission from different sources and improve understanding of these gases from freshwater bodies to develop mitigation strategies to reduce the adverse impacts of future climate change. Previously studies have only concentrated on North America and Europe. Hence, there is a need to picture the GHG emissions in developing countries such as India and China to correctly quantify the carbon budget [20,22]. Due to limited information resources, the freshwater ecosystems of India involving the inland waters, rivers, wetlands and hydropower sectors, etc., remain unexplored. In this comprehensive review, we try to outline the extensive work on quantification of GHG emissions from the freshwater ecosystems of the Indian subcontinent. The work has been summarized in different sections that include greenhouse gas emissions from freshwater systems, factors affecting GHGs emissions, the role of eutrophication in GHG emissions, analytical techniques to measure GHG emission from freshwater ecosystems (methods of estimation), dynamics of GHG emissions from India’s freshwater ecosystems, impact on climate change and global warming, uncertainty and limitations of GHGs measurements, and strategies and policy considerations for reducing GHGs emissions, etc.
2. Greenhouse Gas Emissions from Freshwater Ecosystems
GHGs released into the atmosphere drive global climate change at a very fast rate. India is the third largest CO2 emitter in the world (Table 1), with a 5.2% increase in the emission rate [23]. In 2018, India contributed ~7% of the world’s total GHG emissions [1]. The country’s freshwater systems are considered important sites for active carbon processing and transporting. The natural lakes, reservoirs, and other surface waters are globally significant emitters of some important GHGs such as CH4, N2O, and CO2. An accurate estimation of fluxes of the GHGs is necessary to understand the global carbon budget [24]. GHG emissions from the world’s top 10 countries with the highest GDPs [1,23,25] are depicted in Table 1.
In general, aerobic and anaerobic organic matter degradation contribute to CO2 and CH4, respectively, in freshwater ecosystems, and N2O is produced via microbial mechanisms of nitrification and denitrification [18,26]. The major pathways [18,27] include (i) the diffusion–emission method at the air-water surface. (ii) Emissions from shallow zones of reservoirs, lakes, and rivers via bubbling, although hydropower reservoirs have two additional pathways of GHG emissions such as downstream emissions (50–100 m) and degassing emissions at the downstream turbines and spillways. Besides, GHG scans are released into the atmosphere through plant-mediated transport [28]. GHGs produced in the sediments release directly to the atmosphere via the stems of the emergent or transpiration stream of plants [29]. All the pathways greatly influence the GHGs emission from freshwater.
2.1. Factors Affecting GHGs Emission
These pathways of GHGs emissions are manipulated by a couple of composite factors that can either accelerate (+) GHG emissions or reduce (−) emissions. Such factors affecting the GHG emissions in freshwater ecosystems include (a) secondary parameters: water parameters (dissolved oxygen (DO), the presence of organic matters (OM) determining the availability of carbon stock, mean depth, age of reservoirs, thermal stratification, nutrients (C, N, P) and its ratios, carbon-nitrogen ratio (C/N), carbon phosphorous ratio (C/P), nitrogen phosphorous ratio (N/P), total nitrogen, total phosphorous, mean depth, etc.) [27,30,31]. (b) Primary parameters: climatic conditions (water temperature, runoff, precipitation, wind speed) [15,18,20]. Factors such as DO, nutrient content, pH, wind speed, mean depth, water temperature, and thermal stratification are highly correlated with GHG emissions. As a result, they help in higher photosynthetic rates and less accumulation of water sediments. These little changes in water parameters do not encourage the activities such as the diffusion-emission rates of CH4 and emission of CO2 by less accumulation of benthic sediments in rivers, lakes, and reservoirs [18,32].
Researchers of different works of life reported that pH has no significant relation with CH4 emissions but has a positive correlation with N2O emissions. The pH in freshwater bodies ranges from 6–8 [33], and methanogens are sensitive to pH and able to produce CH4 in a range of 6–8. Therefore, pH does not significantly affect the production mechanism [34]. The dissolved CO2 levels (pCO2) have increased along with the atmospheric CO2. Carbonic acid is produced from the CO2 released from respiration and lowers the pH in water bodies. It was reported that pCO2 has a negative correlation with pH along with alkalinity, total dissolved solids, and DO [35]. The pH range and their relation to GHGs emissions are presented in Table 2. The relation between pH and N2O emission is a little bit complex. The highest N2O flux via the denitrification process is observed in a pH range of 7–8 [36]. Khoiyangbam and Chingangbam [36] observed a significant seasonal variation in pH range and N2O emission from the freshwater wetland of KeibulLamjao National Park, Manipur. The microbial activities are suppressed at higher pH and resulting in lower N2O emission by inhibiting the nitrification and denitrification process.
In a study by Hao et al. [35], it was found that pCO2 is positively correlated with total nitrogen and total phosphorous, and CH4 emission has a significant correlation with total phosphorous (R = 0.365, p < 0.01). The presence of phosphate ions in water cause eutrophication, which increases the liable organic matter and influence the CH4 emission by methanogenic bacteria. On the other hand, nitrate reduces the CH4 emission from the water as its acts as an electron acceptor and inhibits the methanogenesis processes. The production of N2O in water bodies is mainly influenced by the presence of inorganic components. Nitrate acts as a substrate for the denitrification process and positively affects the N2O emission in waterbodies, and the presence of sulfide slows down the denitrification process by inhibiting the conversion of N2O to N2 [33,38].
Noticeably, GHG emissions from hydropower reservoirs are controlled by DO, pH, age of reservoirs, water retention time, and inherent climatic conditions [40]. The emission of GHGs from hydropower reservoirs is a complex phenomenon and cannot be quantified easily. Therefore, estimating the carbon C budgets from these kinds of ecosystems is not easy. Therefore, the key to quantifying the GHGs emission from these freshwater ecosystems is to understand the spatio-temporal distribution of freshwater ecosystems, inherent conditions, water quality, and climatic conditions cumulatively for accurate and précised estimation.
2.2. Role of Eutrophication in GHG Emissions
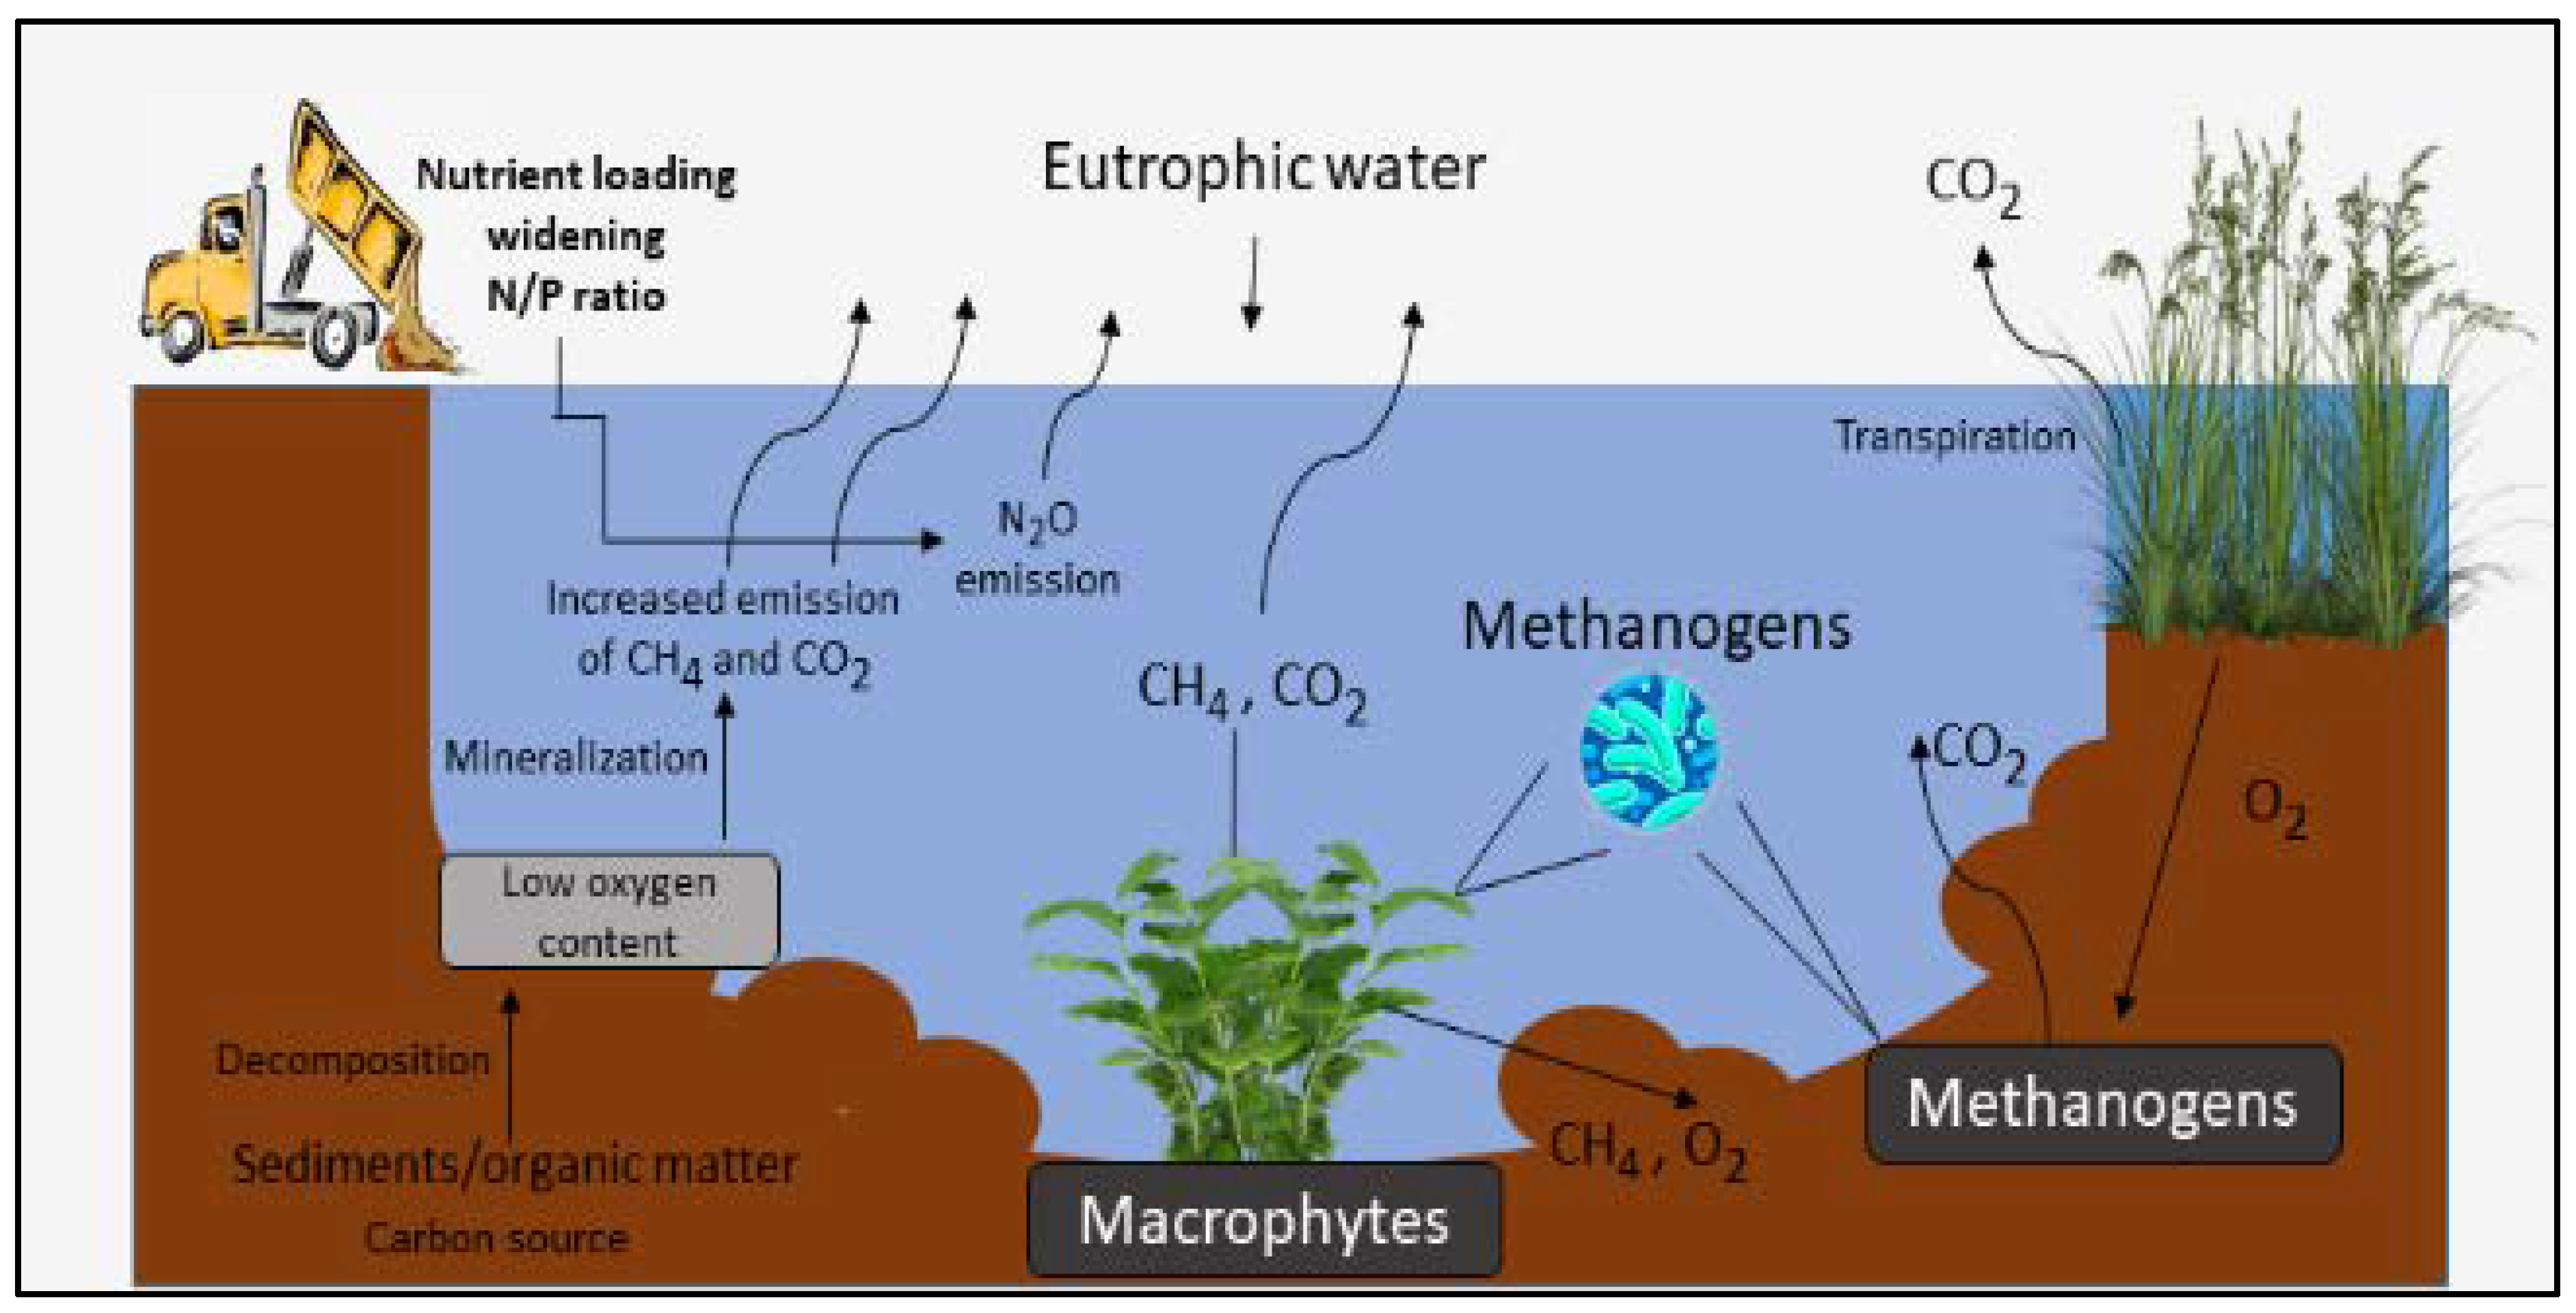
Water bodies such as lakes and ponds get progressively enriched by nutrients, such as nitrogen (N) and phosphorus (P). This process refers to the phenomenon of eutrophication in freshwater. Freshwater eutrophication has both direct and indirect effects on GHG emissions (Figure 1) [41]. The direct effect depends upon abiotic factors or water quality parameters such as DO, OM, and nutrient loading [42,43,44,45]. The indirect effects of eutrophication on GHG emissions are manipulated by the growth of harmful algal blooms and shifting dominant primary producers [41]. Generally, water sediments at the bottom accumulate due to a low level of DO in eutrophic water. Therefore, under anaerobic conditions, CH4 is formed as a product of biomethanation (Figure 1) [45,46]. The formation of CH4 is followed by emission via ebullition pathways [26]. Similarly, CO2 is formed due to carbon mineralization from OM and oxygen (O2) consumption by methanogens [20]. Nevertheless, eutrophic waters sink N2O until there is an external nutrient loading or mixing of agricultural runoff containing N fertilizers [47]. Nutrient loading of agricultural runoff and organic matter accumulation widens the N/P ratio, which reduces the DO concentration and facilitates N2O production and emission through denitrification [41,47]. Thus, the nutrient imbalance between N and P in freshwater accelerates the production and emission of N2O. A study in China showed that the main influencing factors behind pN2O from the Xilin river basin were its DO (R = 0.429, p < 0.01) and total phosphorous (R = 0.437, p < 0.01) [35]. Recently, Khoiyangbam and Chingangbam [36] observed a significant seasonal variation of DO, but no significant correlations were observed between N2O emission and DO. The indirect effects of eutrophication on GHG emissions are highly dependent on the shifting of dominant primary producers and the blooming of harmful algae [48,49]. Dominant primary producers in oligotrophic waters, such as submerged plants, are often replaced by macrophytes or algae [50]. The shift of primary producers enhances the production and emission of CH4, which is one of the most important GHGs responsible for global warming. Eventually, emissions of CH4 are executed by macrophytes in three steps [41] (i) They are enhanced by macrophytes; this first process involves reducing biomethanation and is executed by methanotrophic bacteria delivering oxygen to sediments. (ii) The oxidation of CH4 on the surface of macrophytes is performed by methanotrophic bacteria. (iii) There is the transportation of CH4 into the atmosphere by the emergent plants through diffusion.
The presence of harmful algal blooms in freshwater turns out to be detrimental to other aquatic life. Consequently, other aquatic life depending on oxygen gets suffocated and perishes slowly. Algal blooms are generally responsible for accumulating algal biomass, which works as an enzyme to increase CH4 and N2O emissions [51,52]. Despite the apparent increase in CH4 and N2O emissions, little evidence supports the manipulation of the world’s C budget due to algal blooms in eutrophic waters.
3. Methodology for the Current Review and Estimation of Freshwater GHGs
This study is based on the release of significant GHGs emitted by India’s vast freshwater ecosystems, as prevalent in different research articles and surveys. Information is gathered from trustworthy articles, government, non-government organizations, and websites of international organizations. The study assembles and presents information and data that represents proper accountability of GHG emissions from the freshwater ecosystem of India.
The estimation of GHG emissions from freshwater ecosystems is in its initial stage. Present studies are more of a statistical analysis of the prevalent data available in governmental reports, international websites, or other scientific literature. However, some of the works done in India involve headspace sampling followed by gas-chromatographic (GC) analysis and evaluation of GHG in flux chambers [30,53,54]. Apart from these, some of the known and trusted analytical methods are listed below (Table 3).
Analytical Techniques to Measure GHG Emissions from Freshwater Ecosystems
The evolution of modern technologies has made the instruments for GHG measurement from aquatic ecosystems much more advanced. Still, no method is perfect from all perspectives. Generally, the measurement of GHG emissions from freshwater ecosystems depends on three factors: water and temperature, the mode of transport of dissolved gases, and wind speed. The existing literature has found some differences between the methods (Table 3) in the form of advantages and disadvantages. During a study, Duchemin et al. [55] found that the static chamber method has higher accuracy and potential in estimating total CO2 and CH4 emission fluxes than the thin boundary layer method. Factors such as wind speed manipulating the measurement of GHG emission fluxes can induce errors in the result of the thin boundary layer (TBL) on calm wind days [55,56]. However, TBL is quick, which supports sampling more sites each day [56]. Floating chambers, when coupled with detectors such as non-dispersive infra-red (NDIR) or Fourier transform infrared spectroscopy (FTIR), have the capability of real-time estimation of CO2, CH4, and N2O in a quick succession of 10–15 min per site [56]. These combinations even indicate the problems occurring while taking estimations due to the contamination of the chamber and tubing. Nevertheless, these combinations are costly and take weeks to get repaired if they break down. A fruitful and precise combination found till now is the floating chamber with ex situ laboratory analysis. This combination is impactful for remote areas with no installation of the laboratory. The combination of gas chromatography-mass spectroscopy (GC-MS) with floating chambers as a setup of ex situ laboratory analysis is found to be precise in the estimation of GHGs in cost-effective ways [56]. However, there are gaps in these methods, and no instrument/methods are still perfect for estimating the exact GHG emission from freshwater ecosystems to date.
4. Dynamics of GHG Emissions from India’s Freshwater Ecosystems
The most prevalent and significant GHGs released from India’s freshwater ecosystem are CH4 and CO2. However, N2O is also released from lakes, ponds, streams, and rivers only when there are human interventions such as nutrient addition and excessive usage of N fertilizers. Unlike past studies, scientists have found different freshwater ecosystems in India to be potential sources of CH4, CO2, N2O, and other GHG emissions.
Inland waters (IW) are subjected to the country’s sovereignty. They comprise canals, bays, streams, lakes, rivers, reservoirs, and inlets situated near a nation’s shores. India has an extensive network of IW stretching 14,500 km [57]. Rivers cover about 5200 km of these totals IW, and about 4000 km include canals. According to the Inland Waterways Authority of India (IWAI) Act 1985, the IWs are also known as national waterways as they are essential for transportation [58]. Among these diverse IW, the main recognizable systems [59] include (i) the Ganga-Bhagiarathi-Hoogly river stretch (UP, Bihar, Jharkhand, West Bengal); (ii) the Cauvery–Kollidam river (Tamil Nadu); (iii) the Kollam-Kozhikode stretch (Kerala); and (iv) the Kakinada to Puducherry (Buckingham canal) (Andra Pradesh, Tamil Nadu, and Puducherry). Several studies have experimented with these IW to estimate the emission of GHGs and determine their effect on the total C budget. The majority of the assessment has been performed in the southern part of India, comprising Tamil Nadu, Kerala and Andra Pradesh, etc. [53,60]. The main GHGs measured are CH4 and CO2, along with water parameters such as pH, electrical conductivity, DO, biochemical oxygen demand (BOD), and water temperature [53]. Flux chambers generally execute the flux measurement of GHGs to capture emissions via ebullition/bubbling and diffusion pathways [60]. Such research was performed on 45 inland watercourses in southern India. This study was later represented for the whole of India’s IW flux of CH4 and CO2 [53]. Panneer Selvam et al. [53] revealed that about 19% of CH4 flux and 56% of CO2 flux is released from their selected sites in the southern provinces of India (Table 4). Based on their observation, they estimated that the whole of India’s IW has the potential to release 2.1 Tg CH4 year−1 and 22.0 Tg CO2 year−1 [53]. Table 4 also portrays the accountability of the N2O and CH4 emissions from a similar study executed on the Cauvery delta zone [61]. Although these studies give a fair idea of GHG emissions from selected areas of India, they lack the conviction to represent the whole country. Therefore, to estimate GHG emissions of the whole country, there is still a need for long-term research on the other IW of India, covering the eastern and northern parts.
4.1. GHGs Emission from Urban Lakes
The major factors controlling the release of GHGs from the aquatic systems are the number of OM and oxygen content [67]. As mentioned previously, the presence of a large amount of OM and low oxygen content in freshwater encourages the methanogens and macrophytes to release CH4 and CO2 (Figure 1) via bio-methanation [44]. India’s rapid and unplanned urbanization in the name of development has magnified the release of GHGs from urban lakes (UL). With the increasing population, there has been a rise in the frequency of wastewater discharge in UL and other water bodies [68]. As a consequence, UL has become highly plausible with poor water quality. These conditions are perfect for biomethanation, and as a result, GHG emission rates have become high in the UL of India. A study was performed in the “city of lakes”, i.e., Bengaluru has a network of >200 reservoirs [54]. The main lakes that were assessed were the Jakkur and Bellandur lakes. It was found that CH4 and CO2 emissions from Bellandur Lake were about three folds higher than the emission from Jakkur Lake (Table 4) [54]. However, more wastewater is discharged in these lakes than in any other city. Still, observing a lower value at Jakkur Lake compared to Bellandur Lake was an indication of the sustainable management of water resources through secondary treatment [54,60]. Simultaneously, this study lacks estimation of the N2O release as we know that wastewater contains excess N as a nutrient from domestic, industrial, and agricultural sources [46]. Therefore, there are possibilities of N2O release from these lakes and other lakes of India where wastewater is getting mixed. This study does not represent the whole country due to the lack of data from other states. Still, it gives an idea about the current situation of lakes polluted due to urbanization and industrialization.
4.2. GHGs Emission from Major Rivers
India is an agriculture-centric country where the river basins serve as a critical hydrological unit. The total catchment area of India’s major and medium rivers covers over 20,000 sq. km [69]. These river basins are also important in controlling the climatic conditions of India. They are integral to the inland waters: the Ganga-Bramhaputra-Hoogly river systems and the Cauvery-Kollidam river system. Based on the source, the river basins of India are categorized into two major river systems: (i) the Himalayan river systems (Indus-Ganga-Yamuna-Brahmaputra) and (ii) the Peninsular river systems (Mahanadi-Godavari-Krishna-Cauvery) [70]. The quantification of GHG release from India’s freshwater ecosystems is still in its earlier stages, where many scientists do not find the river systems to be highly impactful for the global C budget. Nevertheless, as the country is developing, the rivers of India are getting highly polluted. The water flow of rivers is becoming stagnant and sluggish due to excessive discharge of industrial, agricultural, and municipal wastes. A study of 22 basins (on a monthly and quarterly basis) in India revealed that parameters such as BOD, coliforms, and heavy metals were high in content, whereas O2 content was lower than recommended [71]. The most significant parameters of river water manipulating GHG emissions are BOD and DO. All the rivers constituting 22 basins of India showed a relatively higher BOD > 3.0 mg L−1 [72,73]. The values were observed in 37 stations of Uttar Pradesh, Rajasthan, Delhi, Madhya Pradesh, Tamil Nadu, Bihar, Jharkhand, West Bengal, and many more. The Central Pollution Control Board (CPCB) [72] has recommended that the DO of Indian rivers should be at least 5.0 mg/L, but the scenario is the opposite when it comes to reality. The least DO record was about 0.1 mg/L in the Yamuna downstream, whereas the highest was 4 mg/L in the Tuni, Gini, and Brahmaputra rivers, which was still below the recommendation [74,75]. With such conditions, these rivers are expected to be vulnerable to eutrophication. The occurrence of eutrophication in rivers would release a higher percentage of CH4 than CO2 due to anaerobic conditions (a condition that helps in methanogenesis). However, it has been found that having such a low DO level in the Yamuna river, the reservoir (Okhla) present on its floodplain emits about 171.96 mg m−2 d−1 CH4 [64]. Nevertheless, studies showed that the tropical rivers of India emitted a higher amount of CO2 as compared to CH4 emissions in a day (Table 4) [19,53]. Such higher emission of CO2 than CH4 indicates that tropical rivers are less prone to eutrophication due to the prevalence of high water temperature and current, promoting aerobic decomposition of carbon minerals. Similar estimations were done for other riverine waters (56,000 km2), where most Indian rivers had a high flux of CO2 (Table 4) with an average emission rate of 117.8 Tg CO2 year−1 [19,60]. The data provided by the current studies still lack the qualification to represent total GHG emissions from Indian rivers. A large number of catchment areas are still unexplored and are believed to have an impact on India’s net contribution to GHG emissions from rivers.
4.3. GHGs Emission from Hydropower Reservoirs and Projects
The impoundment of hydropower has great potential to fulfill the energy demand at local, regional, and national levels and reduce GHG emissions compared to fossil fuels. Since the 1990s, hydropower reservoirs have been found to release significant GHGs emissions, thereby impacting future climate change [66,76]. Inundating vegetation with water during impoundment of reservoirs can alter biogeochemical cycling and destruction of natural carbon sink. Simultaneously, the degradation of OM in reservoirs by microbes aggravates the generation of GHGs such as CO2 and CH4 (mainly in the water-sediment interface). The CWC report [77] showed that India, based on tropical/subtropical climates, consists of 4877 dams and 312 unconstructed dams, of which 79% of the hydropower is produced by the Himalayan region [78,79]. Provinces such as Uttar Pradesh, Bihar, Karnataka, Uttarakhand, Sikkim, Jammu & Kashmir, Andhra Pradesh, and Gujrat, among others, consist of major hydropower plants in India [79,80]. Kumar et al. [79] stated that GHG studies in the context of under-constructed hydropower reservoirs had not been reported yet, so there was an urgent need to estimate the potential of GHG emissions from these reservoirs so that regional and/or global carbon budgeting could be assessed in a precise way. There are very few studies conducted especially in the Uttaranchal state of India, where the carbon stock and GHG were estimated in the constructed (Tehri and Koteshwar) and under-constructed (Kotli Bhel-1) reservoir and its forest catchment [31,39,66]. The state of Uttaranchal is a mixture of three climatic forests such as tropical (up to 1000 masl), subtropical (1000–1800 masl), and temperate (1800–3600 masl) [81]. The results (Table 4) showed that the gross emission of CH4 and CO2 was higher for the Koteshwar reservoir as compared to Tehri [66]. Similar estimations were run for small hydropower projects (capacity up to 15000Kw) around the whole country. The projects covered under the quantification were mainly canal-based and dam-toe-based. The lowest emission (%) from canal-based and dam-toe-based projects was 21.16 and 11.78%, respectively, whereas the highest percentage recorded was 49.38 and 52.9% [82]. It is evident that, similar to any other freshwater bodies; the hydropower reservoirs are N sinks since the release of CH4 narrows the N/P ratio. As a result, there is little chance for N2O to escape. Simultaneously, it is also reported that high production of CH4 can initiate denitrification, where the breakdown of NH4 and NH3− into N is an immediate phenomenon [83].
4.4. GHGs Emission from Wetlands
Wetlands are referred to as “Kidneys of Earth” due to their immense capability of absorbing pollutants. These pollutants are often concentrated with nutrients such as nitrogen, phosphorus, and carbon. The increasing anthropogenic activities have loaded nutrient wastewater that gets discharged into wetlands via surface runoff. Consequently, an increase in nutrient levels can lead wetlands towards eutrophication. The low O2 content and high accumulation of sediments in a wetland can exuberate GHG emissions at a higher rate. Eventually, wetlands are natural sources that generally release GHGs in small amounts, but the pollution and excessive nutrient loading can accelerate the natural release to a greater extent. The presence of enough nutrients will also encourage the growth of plants, which will further help in the production and flux of CH4 by providing substrate to methanogens in the form of root exudates and litter.
Wetlands releasing GHGs, mainly CH4, from the entirety of India are difficult to quantify, although segments of studies are prevalent for our knowledge. [62] estimated seasonal CH4 emission from 10 different wetlands (comprising lakes, rivers and ponds, and jhil, among others) of Northern India (Lucknow), having an annual range of water level of 0.3–6.0 m. Among the selected sites, the Gomti River was the highest emitter of CH4, whereas the Hussainabad tank emitted the least amount of CH4 (Table 4). A similar type of study was done in the coastal wetlands of India, which included major freshwater ecosystems, namely the Pichavaram mangrove, Adyar Estuary, Adyar River, Ennore Creek Lagoon, Bay of Bengal, and Buckingham Canal. These freshwater ecosystems were accustomed to mudflats with and without vegetation, beach, shoal, coral reef, mangroves, marsh vegetation, flood-prone areas, paleo mudflats, salt-affected areas, and strand plains. Assessing both natural and anthropogenic influence, the emission of CH4 ranged from 0.98 to 6.73 g year−1 and from 1.09 to 22.87 g year−1, respectively. Therefore, a large area of Indian freshwater ecosystems in wetlands was assessed during the last decades. Nevertheless, these studies are still inadequate to represent all the wetlands of India. In addition, the quantification of CO2, N2O, and other gases is still missing. Therefore, scientists need to explore India’s remaining areas following standard protocols to fill the gap.
5. Impact on Climate Change and Global Warming
The Earth’s climate system covers the atmosphere, lithosphere (land), hydrosphere (marine and freshwater), and cryosphere (snow and ice) [84]. The dynamic nature of weather components such as temperature, precipitation, air humidity, and wind speed from a long time observation (over 100 years) describes a particular area’s climate. Apart from these factors, the greenhouse effect is highly influential on the Earth’s climate system. The variable gases such as water vapor, CO2, CH4, and N2O are some of the prime GHGs that control the Earth’s average temperature (15 °C) [85]. The GHGs trap the longer waves released back from the Earth’s surface after getting heated by the sun, thus keeping the Earth’s atmosphere warm. The natural greenhouse effect is a crucial phenomenon that helps all life forms to sustain themselves. With societal and industrial developments, the demand for natural resources has gone up. As a result, such priorities have deteriorated the surrounding environment, and human civilization has entered into a new geological epoch called the “Anthropocene” [86]. Anthropogenic activities have interfered with the natural Earth’s system processes by overexploiting natural resources and polluting natural ecosystems.
A major global warming cum climate change issue that India faces is the scarcity of water, despite having substantial water resources. About 42% of areas [87], including Ladakh (J&K), Bundelkh and (U.P.), Purulia (W.B.), Marwar-Mewar (Rajasthan), and many more [88] experience water stress. Simultaneously, increased primary productivity is expected to increase in India’s inland waters due to the enhanced thermal regime [89]. When coupled with anthropogenic pollutants and climate change, the chances of eutrophication are anticipated due to decreased DO levels and enhanced nutrient levels [90]. With changes in rainfall pattern and increasing temperature, phenomena such as wetland accretion, aquatic weed proliferation, and loss of wetland connectivity to rivers are observed to aggravate and promote suitable conditions for GHG emissions under climate change scenarios [91,92]. Given the probability of increased biological oxygen demand (BOD), the inland waters of India will develop conditions such as anaerobic and anoxic, where GHGs will release, and the fish communities will experience the deleterious effects of global warming and climate change indirectly [90]. Studies have revealed that climate change has already begun to affect the hydrologic flow regime involving the timing of flows of different magnitudes on a global stage [90,93,94]. The major issues of climate change and global warming on India’s freshwater ecosystem focus on decreased DO, increased BOD, decreased flow regimes, decreasing water levels, and changes in trophic level, among others. When working hand in hand, all these factors become viably responsible for GHG emissions.
6. Uncertainty and Limitations of GHG Measurements
Almost all the associates of a freshwater ecosystem release GHG into the atmosphere. The introduction of reservoirs and changing watershed patterns can act as both sink and source [95]. Rivers, lakes, freshwater reservoirs, and wetlands are natural sources of GHG [96]. Despite that, many scientists have different opinions. Although some believe reservoirs are the main culprit behind GHG emissions, some do not count rivers as impacting the global carbon budget [21,97,98]. In support of that, a recent study by Drake et al. [99] reported that C emission from major riverine water worldwide was as low as 0.95 Pg year−1. Contradicting such statistics, [100] claimed that carbon emissions from global riverine waters have a non-negligible carbon flux on the global carbon budget. The lack of consensus in the scientific community has augmented several limitations that come in the way of proper quantification of GHG emissions from Indian freshwater ecosystems. They include [95] (i) the lack of data for comparison as standard protocols and techniques were not followed during estimation. (ii) Divergence in results as there exists no agreed procedure(s) to estimate net emissions from different water bodies. (iii) Data available in the existing literature only covers young, newly built reservoirs that are sometimes site-specific [53]. Conversion of terrestrial lands into dams and reservoirs also contributes to GHG emissions as the freshwater ecosystems created help in the degradation of OM [79]. Increasing inundation of OM leads to the uncertainty of GHG emissions from reservoirs. Lack of information regarding the spatio-temporal variability of OM degradation mechanism, the role of the carbon cycle, and the storage of nutrients in reservoirs and other freshwater ecosystems are the main challenges in quantifying GHG emissions from freshwater ecosystems [79]. Apart from these, the increasing rate of pollution on a regional and local scale of a tropical/subtropical country such as India has made it difficult to measure the dynamics of GHG emissions from its freshwaters as it gets manipulated by the variability in nutrients and OM contents enhancing microbial activities. Several studies have reported that the national observations lack CH4 ebullition. Consequently, there remains uncertainty in GHG emissions as large quantities of areal fluxes are heterogeneous [18,20]. Degassing in hypomanic waters with high content of dissolved gases poses a challenge in measuring the generation of CO2 and CH4 [20,79,101]. Therefore, they do not represent the gross emission of the whole country. Therefore, to develop a robust methodology for properly assessing GHG, we need to sharpen our understanding of the wider perspective by following proper protocols.
7. Strategies and Policy Considerations for Reducing GHG Emissions
The first and foremost thing required to reduce GHG emissions from freshwater ecosystems of India is to adopt sustainable development goal 6 (SDG 6) for water resource management. With the incorporation of SDG 6 (clean water and sanitation), water governance should be the highest priority of the Indian government, policymakers, and common people [102]. Each target of SDG 6 has its importance for reducing GHG emissions directly or indirectly from the freshwater ecosystem. The targets [103] are; 6.1. Access to safe and affordable drinking water for all; 6.2. Access to adequate and equitable sanitation and hygiene for all ending open defecation; 6.3. Improve water quality by reducing water pollution, increasing wastewater treatment, and recycling of water; 6.4. Improve water use efficiencies and ensure freshwater supplies; 6.5. Implement integrated water resources management; 6.6. Protect and restore water-related ecosystems. It is clear that achieving targets 6.2., 6.3., 6.4., and 6.6. will directly help in reducing GHG emissions from freshwater ecosystems. These targets encourage wastewater treatments and reclamation of the freshwater ecosystem and its biodiversity. As a result, Indian freshwater will again be high in oxygen content with less BOD and organic matter with little encouragement towards eutrophication.
India is a developing country where poverty overshadows its economy, sometimes. A country with high poverty is often challenged by a lack of sanitation, malnourishment, food insecurity, life expectancy, and safe drinking water availability. Studies in different parts of the world have found a positive correlation between life expectancy and the availability of safe drinking water [104,105,106,107,108]. Similarly, indicators such as life expectancy, better life quality, mortality rate, and nutrition level of India’s general population are expected to be vulnerable under such conditions of unhygienic water use, consumption of water from eutrophic water bodies, and unavailability of safe drinking water. A comparison study between indicators of SDG 6 and SDG 3 (Good health and wellbeing) done by Biswas et al. [109] showed that the increase in consumption of safe drinking water and decrease in open defecation had reduced the mortality rate of India’s neonates and children under the age group of 5 by 3% and 4%, respectively, over the last seventeen years. Parameters regarding water quality, availability, and sanitation combine several indicators that have a direct connection with GHG emissions, life expectancy, and other climatic-socioeconomic aspects of India. Such parameters should be tracked regularly through the water sustainability index [109]. The primary tracking of such indicators will further help in directing our motives towards achieving goals such as SDG 6 and SDG 3. Therefore, adopting such strategies under the obligation of government policies can work as a win-win strategy to eradicate GHG emissions from India’s freshwater bodies and provide clean water to the common people.
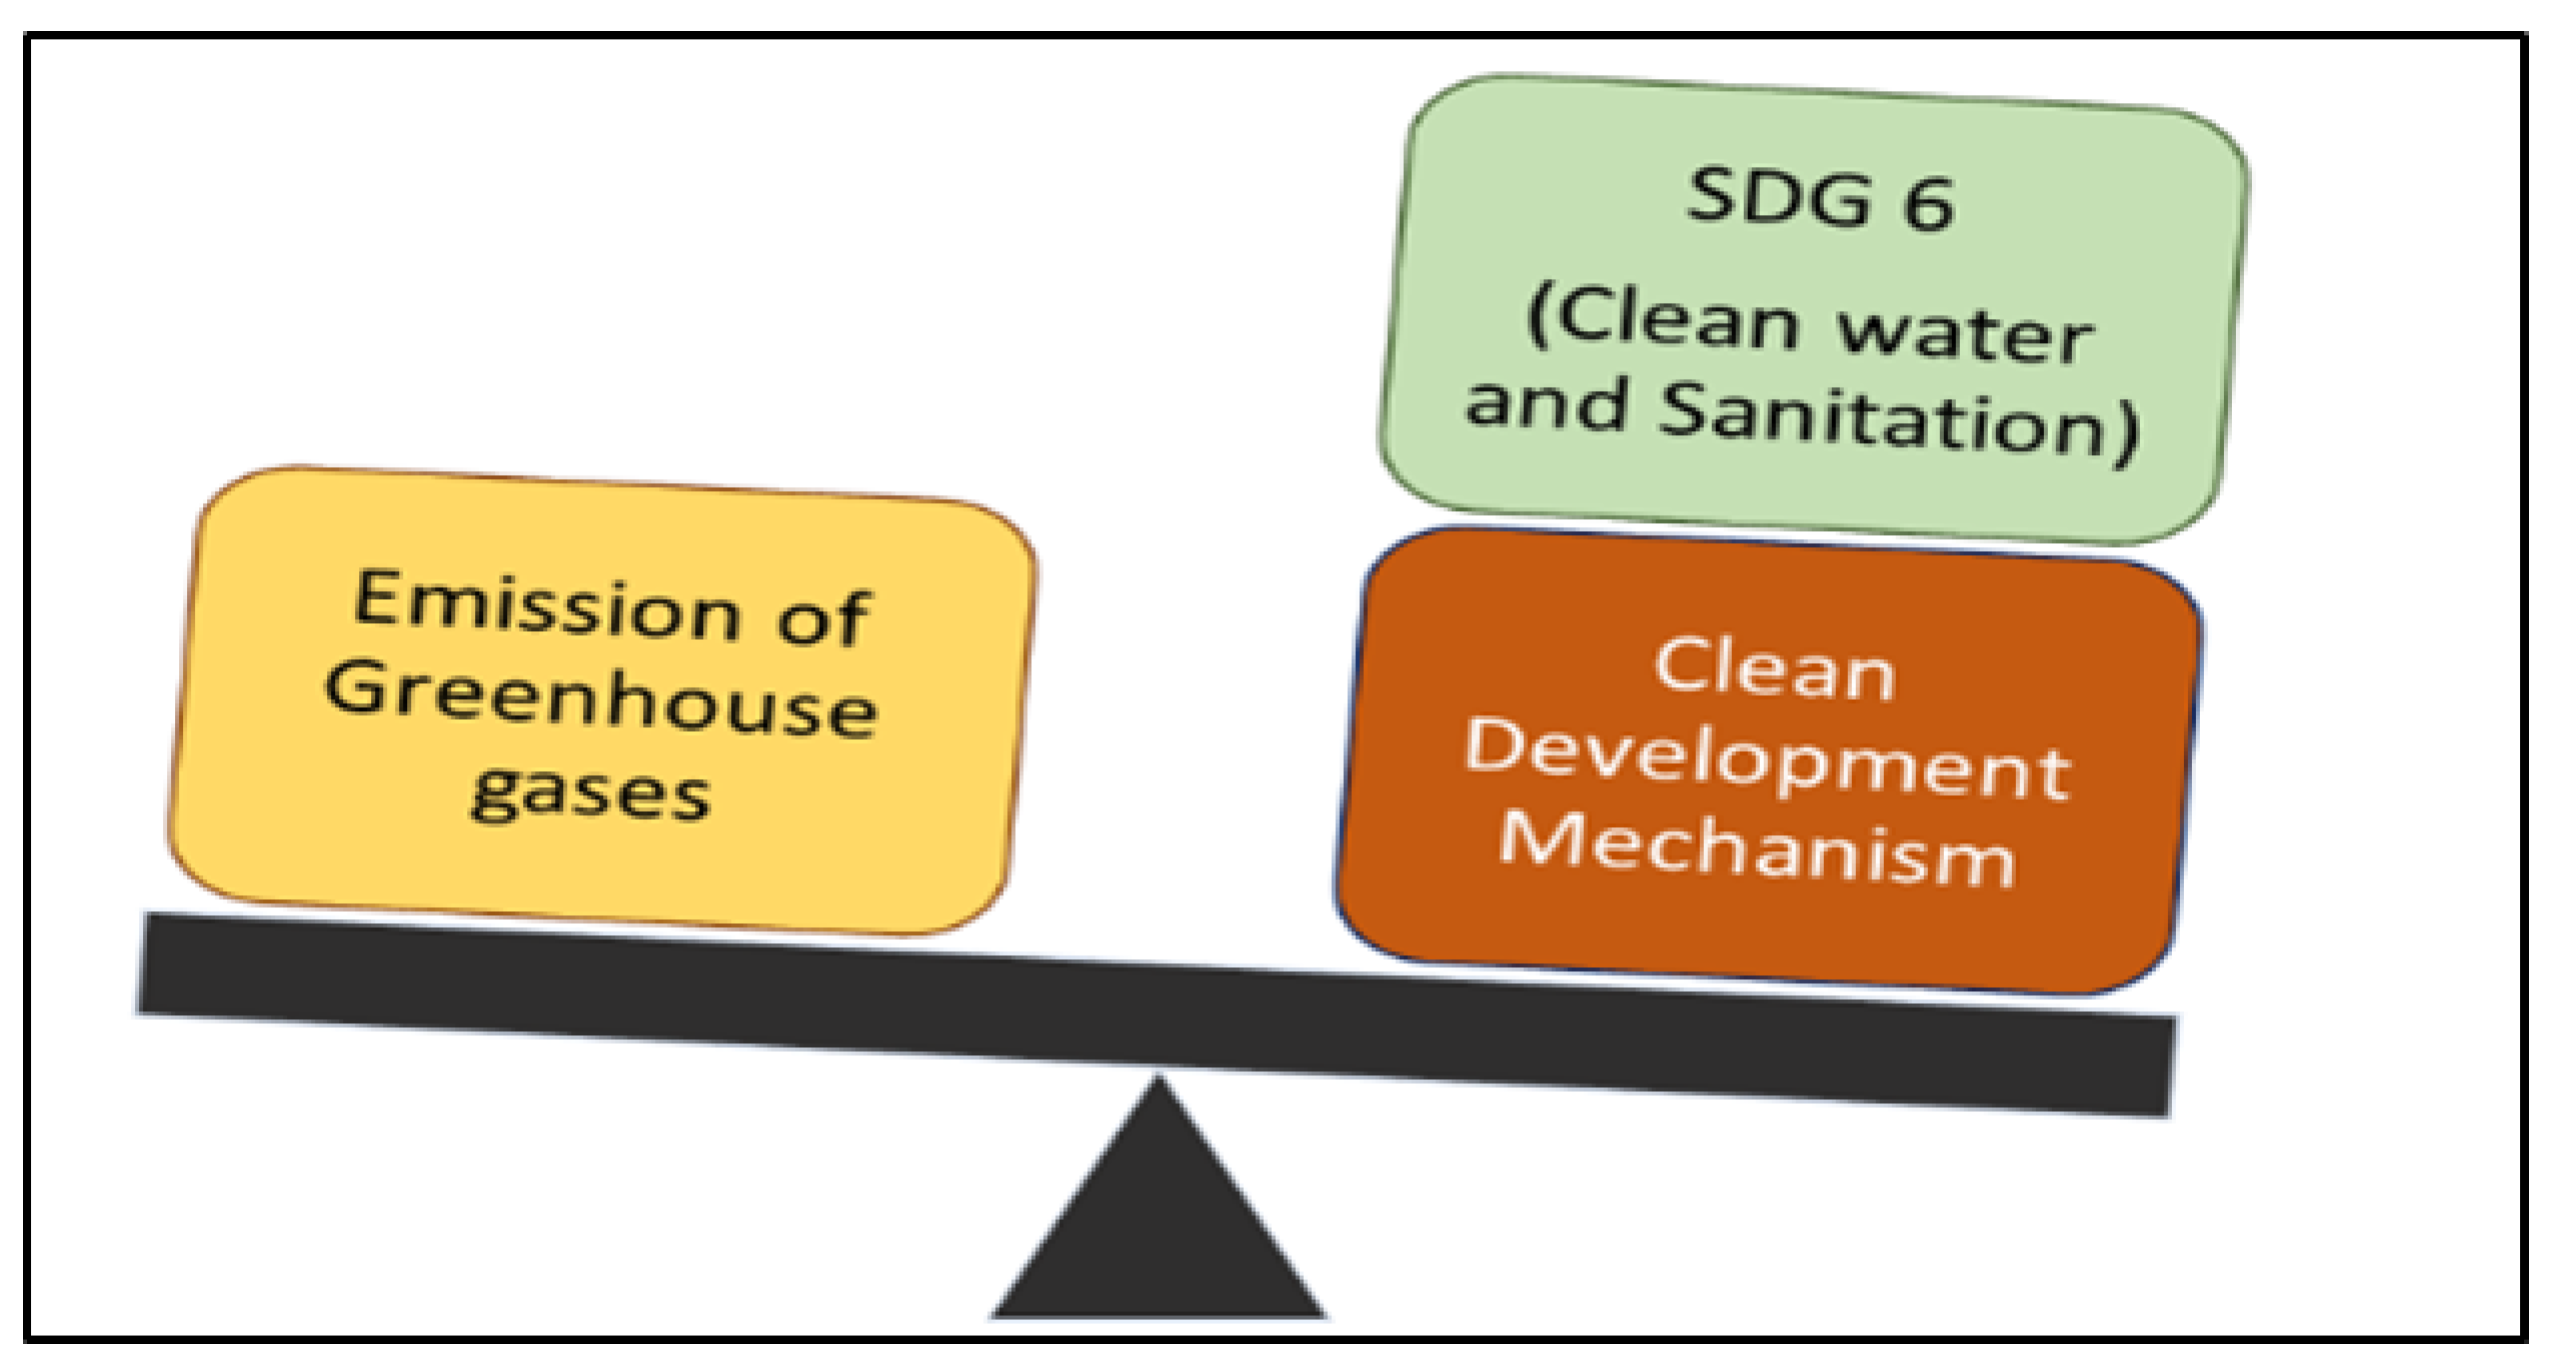
During the 1990s, the UNFCCC was established to restrict anthropogenic activities to protect the Earth’s climate change while stabilizing the atmospheric concentrations of GHGs [110]. During that period, the clean development mechanism (CDM) was built into the Kyoto protocol promoting market-based mechanisms to reduce GHG emissions [111]. The main ideas behind the establishment of CDM [112] were (i) to include non-Annex I countries in active work towards achieving the overall aims of the UNFCCC; (ii) to assist developing countries in achieving sustainable development; and (iii) to help Annex I countries to achieve their commitments. Since studies have found tropical reservoirs involving freshwater, mainly the hydropower reservoirs, to be a significant source of GHG emissions in the atmosphere, the CDM has implemented some restrictions to minimize GHG emissions (Table 5). Thus, it is quite viable to interpret that implementation of SDG 6 and abiding by the limits of the CDM can help in the reduction of GHG gases from Indian freshwater ecosystems (Figure 2).
8. Conclusions and Future Recommendations
The present paper carried out GHG emissions from India’s freshwater ecosystems based on available literature and data. Although the wetlands, lakes, rivers, and ponds are eminent sinks of CO2, they also contribute to the global C budget. Pollution of water by the introduction of municipal wastewater and surface runoff from agricultural fields are the major pillars of GHG emissions from India’s freshwater bodies. Terrestrial landforms getting transformed into dams and reservoirs for the production of more electricity are also major contributors of GHG to the atmosphere from its freshwater. Contamination rates of freshwater ecosystems have been high in recent times, as one of the main concerns of India is poverty. Unsafe disposal of wastewater, unhygienic practices, and open defecation are a few of the major reasons behind the freshwater ecosystems getting destroyed as well as polluted. These factors are the key drivers behind the humongous release of atmospheric GHGs, which is still unexplored. Emissions are also affected by the decreasing DO level, increasing organic and nutrient (C/N, N/P, C/P ratio), age of reservoirs, and climatic conditions that include wind speed and temperatures. Quantifying the amount of CO2, CH4, and N2O from India’s freshwater bodies provides knowledge on climate change trends and factors affecting freshwater GHGs production and emissions. This review helps us understand the contributing factors and develop suitable mitigation options to reduce the production of GHGs and future climate change. Based on the current review, we found some research needs for better quantification of GHG emissions from India’s freshwater ecosystems:
- (1)
- Although the rivers of India are an integral part of India’s socio-economic and environmental management, they are natural emitters of different GHGs. Therefore, seasonal GHG emission estimations from origin to estuaries are the first and foremost requirements.
- (2)
- The prevalent works of literature lack the estimation of N2O and other GHGs emissions. As India is a developing country, nutrient loading and metal accumulations are general phenomena during urbanization. Hence, the estimation of N2O will help in precise GHG measurement and quantification
- (3)
- Variability in seasonal and climatic functions will be a worthy inclusion for quantifying GHG emissions from the Indian freshwater ecosystems.
- (4)
- Monitoring GHG emissions before and after the impoundment of dams and reservoirs and other terrestrial landforms will help to understand the net GHG estimations and future support in strategic mitigation strategies.
- (5)
- Estimation of degassing from hypolimnetic waters to identify its actual contribution to GHG emissions is highly suggested, as this pathway contributes a huge share to gross GHG emissions in the case of hydropower reservoirs.
- (6)
- Sequestration of GHGs should be the highest priority while planning for mitigation strategies.
- (7)
- There is a need to formulate sustainable indices for water resource management and GHG emissions so that the trend can be set up to keep the water clean and limit the excess release of GHG from the freshwater ecosystems of India.
The emission of GHGs from freshwater ecosystems is likely to influence the regional, national and global carbon budgets. The issue of freshwater emissions requires covering all the sources using a well-established climate policy representing the UNFCC for mitigation. The formulation of a proper sustainable policy and implementation of SDG 6 can help in the reduction of GHGs from Indian freshwater ecosystems. Policies such as reducing emissions at the regional level from all sectors, including agriculture, forestry, afforestation in the vicinity of the catchment area, supporting the developing countries, and intensifying the international cooperation to improve and increase the techniques for measurement of GHGs, need to be implemented. For implementation, a proper connection across the science-policy interface with transparency and scientific integrity is required at all levels.
Author Contributions
Conceptualization, B.M., and A.K.; methodology, formal analysis, B.M., K.B., and N.B.; investigation, A.K.; resources, A.K.; data curation, B.M., and K.B.; writing—original draft preparation, B.M., K.B., and N.B.; writing—review and editing, B.M., K.B., A.K. and N.B.; funding acquisition, A.K. All authors have read and agreed to the published version of the manuscript.
Funding
This research received no external funding.
Data Availability Statement
Not applicable.
Acknowledgments
We are thankful to the reviewers for their constructive comments to improve the quality of the article.
Conflicts of Interest
The authors declare no conflict of interest.
References
- World Bank. Total Greenhouse Gas Emissions (kt of CO2 Equivalent); World Bank: Washington, DC, USA, 2021; Available online: http://data.worldbank.org/indicator (accessed on 23 October 2021).
- IPCC. Climate Change 2007: Synthesis Report; Contribution of Working Groups I, II and III to the Fourth Assessment Report of the Intergovernmental Panel on Climate Change; Core Writing Team, Pachauri, R.K., Reisinger, A., Eds.; IPCC: Geneva, Switzerland, 2007; p. 104. [Google Scholar]
- Ming, A.; Rowell, I.; Lewin, S.; Rouse, R.; Aubry, T.; Boland, E. Key messages from the IPCC AR6 climate science report. Camb. Open Engag. 2021; preprint. [Google Scholar] [CrossRef]
- IPCC. Climate Change 2021: The Physical Science Basis. Contribution of Working Group I to the Sixth Assessment Report of the Intergovernmental Panel on Climate Change. Masson-Delmotte, V., Zhai, P., Pirani, A., Connors, S.L., Péan, C., Berger, S., Caud, N., Chen, Y., Goldfarb, L., Gomis, M.I., et al., Eds.; In Press. Available online: https://www.ipcc.ch/report/ar6/wg1/downloads/report/IPCC_AR6_WGI_SPM_final.pdf (accessed on 24 October 2021).
- IEA. World Energy Outlook 2019. Available online: https://www.iea.org/reports/world-energy-outlook-2019 (accessed on 24 October 2021).
- NOAA. State of the Climate: Global Climate Report for September 2021; published online October 2021, retrieved on November 16, 2021. Available online: https://www.ncdc.noaa.gov/sotc/global/202109 (accessed on 24 October 2021).
- Rana, A.; Thakkar, M. The Greening Imperative: How Indian States Are Promoting Sustainable Industry. ORF Occas. Pap. 2021, 316. Available online: https://www.orfonline.org/research/how-indian-states-are-promoting-sustainable-industry/ (accessed on 24 October 2021).
- World Bank. Total Greenhouse Gas Emissions (kt of CO2 Equivalent)—India; World Bank: Washington, DC, USA, 2022; Available online: https://data.worldbank.org/indicator/EN.ATM.GHGT.KT.CE?locations=IN (accessed on 18 August 2022).
- India-Wris Wiki. Start. In India Wris Wiki; 2021. Available online: http://indiawris.gov.in/wiki/doku.php?id=start&rev=1629789147 (accessed on 16 November 2021).
- Kumar, R.; Singh, R.D.; Sharma, K.D. Water resources of India. Curr. Sci. 2005, 89, 794–811. Available online: http://www.jstor.org/stable/24111024 (accessed on 24 October 2021).
- ADRI. Water Resources of India. 2021. Available online: https://www.adriindia.org/adri/india_water_facts (accessed on 16 November 2021).
- Dhawan, V. Water and Agriculture in India. Background Paper for the South Asia Expert Panel during the Global Forum for Food and Agriculture, 28. 2017. Available online: http://www.yourarticlelibrary.com/essay/essay-on-water-scarcity-in-india-1113-words/20871/ (accessed on 17 November 2021).
- World Bank. World Development Indicators; World Bank: Washington, DC, USA, 2021; Available online: http://data.worldbank.org/source/world-development-indicators (accessed on 23 October 2021).
- Prairie, Y.T.; Alm, J.; Beaulieu, J.; Barros, N.; Battin, T.; Cole, J.; del Giorgio, P.; DelSontro, T.; Guérin, F.; Harby, A.; et al. Greenhouse Gas Emissions fromFreshwater Reservoirs: What Does the At-mosphere See? Ecosystem 2017, 21, 1058–1071. [Google Scholar] [CrossRef]
- Barros, N.; Cole, J.J.; Tranvik, L.J.; Prairie, Y.T.; Bastviken, D.; Huszar, V.L.M.; Del Giorgio, P.; Roland, F. Carbon emission from hydroelectric reservoirs linked to reservoir age and latitude. Nat. Geosci. 2011, 4, 593–596. [Google Scholar] [CrossRef]
- Raymond, P.A.; Hartmann, J.; Lauerwald, R.; Sobek, S.; McDonald, C.; Hoover, M.; Butman, D.; Striegl, R.; Mayorga, E.; Humborg, C.; et al. Global carbon dioxide emissions from inland waters. Nature 2013, 503, 355–359. [Google Scholar] [CrossRef]
- Deemer, B.R.; Harrison, J.A.; Li, S.; Beaulieu, J.J.; DelSontro, T.; Barros, N.; Bezerra-Neto, J.F.; Powers, S.M.; dos Santos, M.A.; Vonk, J.A. Greenhouse Gas Emissions from Reservoir Water Surfaces: A New Global Synthesis. BioScience 2016, 66, 949–964. [Google Scholar] [CrossRef]
- Kumar, A.; Yang, T.; Sharma, M.P. Greenhouse gas measurement from Chinese freshwater bodies: A review. J. Clean. Prod. 2019, 233, 368–378. [Google Scholar] [CrossRef]
- Bastviken, D.; Tranvik, L.J.; Downing, J.A.; Crill, P.M.; Enrich-Prast, A. Freshwater methane emissions offset the continental carbon sink. Science 2011, 331, 50. [Google Scholar] [CrossRef]
- Li, S.; Bush, R.T.; Santos, I.R.; Zhang, Q.; Song, K.; Mao, R.; Wen, Z.; Lu, X.X. Large greenhouse gases emissions from China’s lakes and reservoirs. Water Res. 2018, 147, 13–24. [Google Scholar] [CrossRef]
- dos Santos, M.A.; Rosa, L.P.; Sikar, B.; Sikar, E.; dos Santos, E.O. Gross greenhouse gas fluxes from hydro-power reservoir compared to thermo-power plants. Energy Policy 2006, 34, 481–488. [Google Scholar] [CrossRef]
- Yang, H.; Xie, P.; Ni, L.; Flower, R.J. Underestimation of CH4 Emission from Freshwater Lakes in China. Environ. Sci. Technol. 2011, 45, 4203–4204. [Google Scholar] [CrossRef]
- Karstensen, J.; Roy, J.; Pal, B.D.; Peters, G.; Andrew, R. Key Drivers of Greenhouse Gas Emission. Econ. Political Wkly. 2020, 55, 15. [Google Scholar]
- DelSontro, T.; Beaulieu, J.J.; Downing, J.A. Greenhouse gas emissions from lakes and impoundments: Upscaling in the face of global change. Limnol. Oceanogr. Lett. 2018, 3, 64–75. [Google Scholar] [CrossRef] [PubMed]
- ResearchFDI. The Top 20 Largest Economies in the World by GDP|ResearchFDI. 2021. Available online: https://researchfdi.com/world-gdp-largest-economy/ (accessed on 25 November 2021).
- Gupta, K.; Kumar, R.; Baruah, K.K.; Hazarika, S.; Karmakar, S.; Bordoloi, N. Greenhouse gas emission from rice fields: A review from Indian context. Environ. Sci. Pollut. Res. 2021, 28, 30551–30572. [Google Scholar] [CrossRef] [PubMed]
- Abril, G.; Guerin, F.; Richard, S.; Delmas, R.; Galy-Lacaux, C.; Gosse, P.; Tremblay, A.; Varfalvy, L.; Dos Santos, M.A.; Matvienko, B. Carbon dioxide and methane emissions and the carbon budget of a 10-year old tropical reservoir (Petit Saut, French Guiana). Glob. Biogeochem. Cycles. 2005, 19. [Google Scholar] [CrossRef]
- Bordoloi, N.; Baruah, K.K.; Devi, J. Nitrous Oxide (N2O) Estimation from Tropical Rice Paddy Under the Inluence of Growth-Regulating Compounds. Int. J. Environ. Res. 2020, 14, 289–301. [Google Scholar] [CrossRef]
- Tranvik, L.J.; Downing, J.A.; Cotner, J.B.; Loiselle, S.A.; Striegl, R.G.; Ballatore, T.J.; Dillon, P.; Finlay, K.; Fortino, K.; Knoll, L.B.; et al. Lakes and reservoirs as reg-ulators of carbon cycling and climate. Limnosphere Oceanogr. 2009, 54, 2298–2314. [Google Scholar] [CrossRef]
- Kumar, A.; Sharma, M.P. Assessment of Risk of GHG emissions from Tehri Hydropower Reservoir. Hum. Ecol. Risk Assess. Int. J. 2016, 22, 71–85. [Google Scholar] [CrossRef]
- Kumar, A.; Sharma, M.P. Estimation of green house gas emissions from Koteshwar hydropower reservoir, India. Environ. Monit. Assess. 2017, 189, 240. [Google Scholar] [CrossRef]
- Kumar, A.; Sharma, M.P. Review of methodology for estimation of labile organic carbon in reservoirs and lakes for GHG emission. J. Mater. Environ. Sci. 2014, 5, 653–660. [Google Scholar]
- Malyan, S.K.; Singh, O.; Kumar, A.; Anand, G.; Singh, R.; Singh, S.; Yu, Z.; Kumar, J.; Fagodiya, R.K.; Kumar, A. Greenhouse Gases Trade-Off from Ponds: An Overview of Emission Process and Their Driving Factors. Water 2022, 14, 970. [Google Scholar] [CrossRef]
- Yang, S.S.; Chen, I.C.; Liu, C.P.; Liu, L.Y.; Chang, C.H. Carbon dioxide and methane emissions from Tanswei River in NorthernTaiwan. Atmos. Pollut. Res. 2015, 6, 52–61. [Google Scholar] [CrossRef]
- Hao, X.; Yu, R.; Zhang, Z.; Qi, Z.; Lu, X.; Liu, T.; Gao, R. Greenhouse gas emissions from the water–air interface of a grasslandriver: A case study of the Xilin River. Sci. Rep. 2021, 11, 2659. [Google Scholar] [CrossRef] [PubMed]
- Khoiyangbam, R.S.; Chingangbam, S.S. Assessing seasonal variation of diffusive nitrous oxide emission from freshwater wetland in KeibulLamjao National Park, Manipur Northeast India. Atmos. Environ. X 2022, 13, 100147. [Google Scholar]
- Stadmark, J.; Leonardson, L. Emissions of greenhouse gases from ponds constructed for nitrogen removal. Ecol. Eng. 2005, 25, 542–551. [Google Scholar] [CrossRef]
- Audet, J.; Carstensen, M.V.; Hoffmann, C.C.; Lavaux, L.; Thiemer, K.; Davidson, T.A. Greenhouse gas emissions from urban ponds in Denmark. Inland Waters 2020, 10, 373–385. [Google Scholar] [CrossRef]
- Kumar, A.; Sharma, M.P. A modeling approach to assess the greenhouse gas risk in Koteshwar hydropower reservoir, India. Hum. Ecol. Risk Assess. Int. J. 2016, 22, 1651–1664. [Google Scholar] [CrossRef]
- Guérin, F.; Abril, G.; Richard, S.; Burban, B.; Reynouard, C.; Seyler, P.; Delmas, R. Methane and carbon dioxide emissions from tropical reservoirs: Significance of downstream rivers. Geophys. Res. Lett. 2006, 33. [Google Scholar] [CrossRef]
- Li, Y.; Shang, J.; Zhang, C.; Zhang, W.; Niu, L.; Wang, L.; Zhang, H. The role of freshwater eutrophication in greenhouse gas emissions: A review. Sci. Total Environ. 2021, 768, 144582. [Google Scholar] [CrossRef]
- Casper, P.; Maberly, S.C.; Hall, G.H.; Finlay, B.J. Fluxes of methane and carbon dioxide from a small productive lake to the atmosphere. Biogeochemistry 2000, 49, 1–19. [Google Scholar] [CrossRef]
- Bastviken, D.; Cole, J.J.; Pace, M.L.; Van de-Bogert, M.C. Fates of methane from different lake habitats: Connecting whole-lake budgets and CH4 emissions. J. Geophys. Res. Biogeosci. 2008, 113, 2024. [Google Scholar] [CrossRef]
- Huttunen, J.T.; Alm, J.; Liikanen, A.; Juutinen, S.; Larmola, T.; Hammar, T.; Silvola, J.; Martikainen, P.J. Fluxes of methane, carbon dioxide and nitrous oxide in boreal lakes and potential anthropogenic effects on the aquatic greenhouse gas emissions. Chemosphere 2003, 52, 609–621. [Google Scholar] [CrossRef]
- West, W.E.; Creamer, K.P.; Jones, S.E. Productivity and depth regulate lake contributions to atmospheric methane. Limnol. Oceanogr. 2015, 61, S51–S61. [Google Scholar] [CrossRef]
- Liikanen, A.; Murtoniemi, T.; Tanskanen, H.; Väisänen, T.; Martikainen, P.J. Effects of temperature and oxygenavailability on greenhouse gas and nutrient dynamics in sediment of a eutrophic mid-boreal lake. Biogeochemistry 2002, 59, 269–286. [Google Scholar] [CrossRef]
- Soued, C.; del Giorgio, P.; Maranger, R. Nitrous oxide sinks and emissions in boreal aquatic networks in Québec. Nat. Geosci. 2015, 9, 116–120. [Google Scholar] [CrossRef]
- Sorrell, B.K.; Downes, M.T.; Stanger, C.L. Methanotrophic bacteria and their activity on submerged aquatic macrophytes. Aquat. Bot. 2001, 72, 107–119. [Google Scholar] [CrossRef]
- Ai, H.; Qiu, Y.; He, Q.; He, Y.; Yang, C.; Kang, L.; Luo, H.; Li, W.; Mao, Y.; Hu, M.; et al. Turn the potential greenhouse gases into biomass in harmful algal blooms waters: A microcosm study. Sci. Total Environ. 2019, 655, 520–528. [Google Scholar] [CrossRef]
- Hilton, J.; O’Hare, M.; Bowes, M.J.; Jones, J.I. How green is my river? A new paradigm of eutrophication in rivers. Sci. Total Environ. 2006, 365, 66–83. [Google Scholar] [CrossRef]
- Yan, X.; Xu, X.; Wang, M.; Wang, G.; Wu, S.; Li, Z.; Sun, H.; Shi, A.; Yang, Y. Climate warming and cyanobacteria blooms: Looks at their relationships from a new perspective. Water Res. 2017, 125, 449–457. [Google Scholar] [CrossRef]
- Yan, X.; Xu, X.; Ji, M.; Zhang, Z.; Wang, M.; Wu, S.; Wang, G.; Zhang, C.; Liu, H. Cyanobacteria blooms: A neglected facilitator of CH4 production in eutrophic lakes. Sci. Total Environ. 2018, 651, 466–474. [Google Scholar] [CrossRef]
- Selvam, B.P.; Natchimuthu, S.; Arunachalam, L.; Bastviken, D. Methane and carbon dioxide emissions from inland waters in India—Implications for large scale greenhouse gas balances. Glob. Chang. Biol. 2014, 20, 3397–3407. [Google Scholar] [CrossRef]
- Pickard, A.; White, S.; Bhattacharyya, S.; Carvalho, L.; Dobel, A.; Drewer, J.; Jamwal, P.; Helfter, C. Greenhouse gas budgets of severely polluted urban lakes in India. Sci. Total Environ. 2021, 798, 149019. [Google Scholar] [CrossRef] [PubMed]
- Duchemin, E.; Lucotte, M.; Canuel, R. Comparison of Static Chamber and Thin Boundary Layer Equation Methods for Measuring Greenhouse Gas Emissions from Large Water Bodies. Environ. Sci. Technol. 1998, 33, 350–357. [Google Scholar] [CrossRef]
- Lambert, M.; Fréchette, J.-L. Analytical Techniques for Measuring Fluxes of CO2 and CH4 from Hydroelectric Reservoirs and Natural Water Bodies. In Greenhouse Gas Emissions—Fluxes and Processes; Springer: Berlin/Heidelberg, Germany, 2005; pp. 37–60. [Google Scholar] [CrossRef]
- Sriraman, S. Long Term Perspectives on Inland Water Transport in India. RITES J. 2010, 12, 18.1–18.14. Available online: http://indiaenvironmentportal.org.in/files/InlandWaterTransport.pdf (accessed on 26 November 2021).
- Dharmadhikary, S.; Verma, A. Circumventing Environmental Regulations Ganga National Waterway. Econ. Political Wkly. 2019, 54, 13. [Google Scholar]
- Rangaraj, N.; Raghuram, G. Viability of Inland Water Transport in India; Asian Development Bank: Mandaluyong, Philippines, 2007. [Google Scholar]
- Li, S.; Bush, R.T. Revision of methane and carbon dioxide emissions from inland waters in India. Glob. Chang. Biol. 2015, 21, 6–8. [Google Scholar] [CrossRef]
- Krithika, K.; Purvaja, R.; Ramesh, R. Fluxes of methane and nitrous oxide from an Indian mangrove. Curr. Sci. 2008, 94, 218–224. [Google Scholar]
- Singh, S.; Kulshreshtha, K.; Agnihotri, S. Seasonal dynamics of methane emission from wetlands. Chemosphere-Glob. Chang. Sci. 2000, 2, 39–46. [Google Scholar] [CrossRef]
- Biswas, H.; Mukhopadhyay, S.K.; Sen, S.; Jana, T.K. Spatial and Temporal Patterns of Methane Dynamics in the Tropical Mangrove-Dominated Estuary, NE Coast of Bay of Bengal, India. J. Mar. Syst. 2007, 68, 55–64. [Google Scholar] [CrossRef]
- Bansal, S.; Chakraborty, M.; Katyal, D.; Garg, J.K. Methane flux from a subtropical reservoir located in the floodplains of river Yamuna, India. Appl. Ecol. Environ. Res. 2015, 13, 597–613. Available online: http://npl.csircentral.net/id/eprint/1903 (accessed on 18 August 2022).
- Kawade, S.; Kumar, A.; Sharma, M.P. Carbon Dioxide Emission from a Reservoir in India. Int. J. Lakes Rivers 2018, 11, 29–46. [Google Scholar]
- Kumar, A.; Sharma, M.P.; Yang, T. Estimation of carbon stock for greenhouse gas emissions from hydropower reservoirs. Stoch. Environ. Res. Risk Assess. 2018, 32, 3183–3193. [Google Scholar] [CrossRef]
- Bastviken, D.; Cole, J.; Pace, M.; Tranvik, L. Methane emissions from lakes: Dependence of lake characteristics, two regional assessments, and a global estimate. Glob. Biogeochem. Cycles 2004, 18, 1–12. [Google Scholar] [CrossRef]
- Maavara, T.; Lauerwald, R.; Laruelle, G.G.; Akbarzadeh, Z.; Bouskill, N.J.; Van Cappellen, P.; Regnier, P. Nitrous oxide emissions from inland waters: Are IPCC estimates too high? Glob. Chang. Biol. 2018, 25, 473–488. [Google Scholar] [CrossRef] [PubMed]
- India-Wris Wiki. River_basins. In India Wris Wiki; 2021. Available online: http://indiawris.gov.in/wiki/doku.php?id=river_basins&rev=1629789147 (accessed on 16 November 2021).
- MapsofIndia. River Map of India, India River System, Himalayan Rivers, Peninsular Rivers. 2021. Available online: https://www.mapsofindia.com/maps/india/india-river-map.htm (accessed on 25 November 2021).
- Hussain, J.; Husain, I. Water quality hot spots in Indian rivers. IAHS Publ. 2013, 361, 150–157. [Google Scholar]
- CPCB. Status of Water Quality in India. 2010. Available online: www.cpcb.nic.in/WQSTATUS_REPORT2010.pdf (accessed on 25 November 2021).
- CWC (Central Water Commisssion). Report on Water Quality Hot Spots in Rivers of India. 2011. Available online: www.indiawaterportal.org/node/21152 (accessed on 25 November 2021).
- Mandal, P.; Upadhyay, R.; Hasan, A. Seasonal and spatial variation of Yamuna River water quality in Delhi, India. Environ. Monit. Assess. 2009, 170, 661–670. [Google Scholar] [CrossRef]
- Suthar, S.; Sharma, J.; Chabukdhara, M.; Nema, A.K. Water quality assessment of river Hindon at Ghaziabad, India: Impact of industrial and urban wastewater. Environ. Monit. Assess. 2009, 165, 103–112. [Google Scholar] [CrossRef]
- Kelly, C.A.; Rudd, J.W.M.; Louis, V.L.S.; Moore, T. Turning attention to reservoir surfaces, a neglected area in greenhouse studies. Eos Trans. Am. Geophys. Union 1994, 75, 332–333. [Google Scholar] [CrossRef]
- CWC (Central Water Commission). National Register of Large Dams. 2016. Available online: http://www.cwc.nic.in/main/downloads/New%20NRLD.pdf (accessed on 25 November 2021).
- Agarwal, S.S.; Kansal, M.L. Issues of hydropower development in Uttarakhand region of Indian Himalaya. Water Energy Int. 2017, 59, 52–64. Available online: http://repository.iitr.ac.in/handle/123456789/15087 (accessed on 25 November 2021).
- Kumar, A.; Yu, Z.-G.; Klemeš, J.J.; Bokhari, A. A state-of-the-art review of greenhouse gas emissions from Indian hydropower reservoirs. J. Clean. Prod. 2021, 320, 128806. [Google Scholar] [CrossRef]
- Purvaja, R.; Ramesh, R. Natural and Anthropogenic Methane Emission from Coastal Wetlands of South India. Environ. Manag. 2001, 27, 547–557. [Google Scholar] [CrossRef]
- Sharma, C.M.; Gairola, S.; Baduni, N.P.; Ghildiyal, S.K.; Suyal, S. Variation in carbon stocks on different slope aspects in seven major forest types of temperate region of Garhwal Himalaya, India. J. Biosci. 2011, 36, 701–708. [Google Scholar] [CrossRef] [PubMed]
- Varun; Prakash, R.; Bhat, I.K. Life Cycle Energy and GHG Analysis of Hydroelectric Power Development in India. Int. J. Green Energy 2010, 7, 361–375. [Google Scholar] [CrossRef]
- Naqvi, S.W.A.; Lam, P.; Narvenkar, G.; Sarkar, A.; Naik, H.; Pratihary, A.; Shenoy, D.M.; Gauns, M.; Kurian, S.; Damare, S.; et al. Methane stimulates massive nitrogen loss from freshwater reservoirs in India. Nat. Commun. 2018, 9, 1265. [Google Scholar] [CrossRef] [PubMed]
- Mikhaylov, A.; Moiseev, N.; Aleshin, K.; Burkhardt, T. Global climate change and greenhouse effect. Entrep. Sustain. Issues 2020, 7, 2897–2913. [Google Scholar] [CrossRef]
- Hansen, J.; Nazarenko, L.; Ruedy, R.; Sato, M.; Willis, J.; Del Genio, A.; Koch, D.; Lacis, A.; Lo, K.; Menon, S.; et al. Climate Change: Earth’s energy imbalance: Confirmation and implications. Science 2005, 308, 1431–1435. [Google Scholar] [CrossRef]
- Crutzen, P.J. The “Anthropocene”. In Earth System Science in the Anthropocene; Springer: Heidelberg, Germany, 2006; pp. 13–18. [Google Scholar] [CrossRef]
- McMichael, A.J. Insights from past millennia into climatic impacts on human health and survival. Proc. Natl. Acad. Sci. USA 2012, 109, 4730–4737. [Google Scholar] [CrossRef]
- Hindustan Times. Distribution of Drought Prone Areas|Latest News India—Hindustan Times. 2021. Available online: https://www.hindustantimes.com/india/distribution-of-drought-prone-areas/story-4ZqTVl8QcKSGAk6c2ih8XJ.html (accessed on 26 November 2021).
- Das, I.; Hazra, S.; Das, S.; Giri, S.; Maity, S.; Ghosh, S. Present Status of the Sustainable Fishing Limits for Hilsa Shad in the northern Bay of Bengal, India. Proc. Natl. Acad. Sci. India Sect. B Boil. Sci. 2019, 89, 525–532. [Google Scholar] [CrossRef]
- Ficke, A.D.; Myrick, C.A.; Hansen, L.J. Potential impacts of global climate change on freshwater fisheries. Rev. Fish Biol. Fish. 2007, 17, 581–613. [Google Scholar] [CrossRef]
- Das, B.K.; Sarkar, U.K.; Roy, K. Global Climate Change and Inland Open Water Fisheries in India: Impact and Adaptations. In Climate Change and Agriculture in India: Impact and Adaptation; Springer: Cham, Switzerland, 2018; pp. 79–95. [Google Scholar] [CrossRef]
- Sarkar, U.K.; Roy, K.; Karnatak, G.; Nandy, S.K. Adaptive climate change resilient indigenous fisheries strategies in the floodplain wetlands of West Bengal, India. J. Water Clim. Chang. 2018, 9, 449–462. [Google Scholar] [CrossRef]
- Mauget, S.A. Multidecadal Regime Shifts in U.S. Streamflow, Precipitation, and Temperature at the End of the Twentieth Century. J. Clim. 2003, 16, 3905–3916. [Google Scholar] [CrossRef]
- Ye, B.; Yang, D.; Kane, D.L. Changes in Lena River streamflow hydrology: Human impacts versus natural variations. Water Resour. Res. 2003, 39. [Google Scholar] [CrossRef]
- Goldenfum, J.A. Challenges and solutions for assessing the impact of freshwater reservoirs on natural GHG emissions. Ecohydrol. Hydrobiol. 2012, 12, 115–122. [Google Scholar] [CrossRef]
- Fearnside, P.M.; Pueyo, S. Greenhouse-gas emissions from tropical dams. Nat. Clim. Chang. 2012, 2, 382–384. [Google Scholar] [CrossRef]
- Rosa, L.P.; Schaeffer, R. Greenhouse Gas Emissions from Hydroelectric Reservoirs. Ambio 1994, 23, 164–165. Available online: http://inis.iaea.org/Search/search.aspx?orig_q=RN:25047158 (accessed on 26 November 2021).
- Chanudet, V.; Descloux, S.; Harby, A.; Sundt, H.; Hansen, B.H.; Brakstad, O.; Serça, D.; Guerin, F. Gross CO2 and CH4 emissions from the Nam Ngum and Nam Leuk sub-tropical reservoirs in Lao PDR. Sci. Total Environ. 2011, 409, 5382–5391. [Google Scholar] [CrossRef] [PubMed]
- Drake, T.W.; Raymond, P.A.; Spencer, R.G.M. Terrestrial carbon inputs to inland waters: A current synthesis of estimates and uncertainty. Limnol. Oceanogr. Lett. 2017, 3, 132–142. [Google Scholar] [CrossRef]
- Pilla, R.M.; Griffiths, N.A.; Gu, L.; Kao, S.; McManamay, R.; Ricciuto, D.M.; Shi, X. Anthropogenically driven climate and landscape change effects on inland water carbon dynamics: What have we learned and where are we going? Glob. Chang. Biol. 2022, 28, 5601–5629. [Google Scholar] [CrossRef]
- Li, S.; Zhang, Q.; Bush, R.T.; Sullivan, L.A. Methane and CO2 emissions from China’s hydroelectric reservoirs: A new quantitative synthesis. Environ. Sci. Pollut. Res. 2015, 22, 5325–5339. [Google Scholar] [CrossRef]
- Org, S.U. Transforming our world: The 2030 Agenda for Sustainable Development. 2016. Available online: https://stg-wedocs.unep.org/bitstream/handle/20.500.11822/11125/unepswiosm1inf7sdg.pdf?sequence=1 (accessed on 28 November 2021).
- Lee, B.X.; Kjaerulf, F.; Turner, S.; Cohen, L.; Donnelly, P.D.; Muggah, R.; Davis, R.; Realini, A.; Kieselbach, B.; MacGregor, L.S.; et al. Transforming Our World: Implementing the 2030 Agenda Through Sustainable Development Goal Indicators. J. Public Health Policy 2016, 37, 13–31. [Google Scholar] [CrossRef]
- Gulis, G.; Kross, B.C. Drinking water, mortality, and life expectancy: An assessment of the east-west mortality gap in Europe. Cent. Eur. J. Public Health 1999, 7, 191–196. [Google Scholar]
- Gulis, G. Life expectancy as an indicator of environmental health. Eur. J. Epidemiol. 2000, 16, 161–165. [Google Scholar] [CrossRef] [PubMed]
- Cervantes, P.A.M.; López, N.R.; Rambaud, S.C. A Causal Analysis of Life Expectancy at Birth. Evidence from Spain. Int. J. Environ. Res. Public Health 2019, 16, 2367. [Google Scholar] [CrossRef] [PubMed]
- Cervantes, P.A.M.; López, N.R.; Rambaud, S.C. Life Expectancy at Birth in Europe: An Econometric Approach Based on Random Forests Methodology. Sustainability 2020, 12, 413. [Google Scholar] [CrossRef]
- Angelakis, A.N.; Vuorinen, H.S.; Nikolaidis, C.; Juuti, P.S.; Katko, T.S.; Juuti, R.P.; Zhang, J.; Samonis, G. Water quality and life expectancy: Parallel courses in time. Water 2021, 13, 752. [Google Scholar] [CrossRef]
- Biswas, J.K.; Mondal, B.; Priyadarshini, P.; Abhilash, P.C.; Biswas, S.; Bhatnagar, A. Formulation of Water Sustainability Index for India as a performance gauge for realizing the United Nations Sustainable Development Goal 6. Ambio 2022, 51, 1569–1587. [Google Scholar] [CrossRef]
- Gomez-Echeverri, L. The changing geopolitics of climate change finance. Clim. Policy 2013, 13, 632–648. [Google Scholar] [CrossRef]
- Dechezleprêtre, A.; Glachant, M.; Ménière, Y. The Clean Development Mechanism and the international diffusion of technologies: An empirical study. Energy Policy 2008, 36, 1273–1283. [Google Scholar] [CrossRef] [Green Version]
- Makinen, K.; Khan, S. Policy considerations for greenhouse gas emissions from freshwater reservoirs. Water Altern. 2010, 3, 91–105. [Google Scholar]
Figure 1.
Impact of eutrophication on GHG emissions (Modified figure, source: [41]).
Figure 1.
Impact of eutrophication on GHG emissions (Modified figure, source: [41]).

Figure 2.
Strategies to reduce emissions of GHGs from Indian freshwater ecosystems.


Table 1.
Country-wise total greenhouse emissions and gross domestic production.
| Country | Total GHG Emissions (Kt of CO2 Equivalent) | Gross Domestic Production (GDP) (Billions of $) | Ratios (GHG: GDP) |
|---|---|---|---|
| China | 12,355,240 | 15,222.16 | 811.66 |
| United States of America | 6,023,620 | 20,807.27 | 289.50 |
| India | 3,374,990 | 2592.58 | 1301.79 |
| Japan | 1,186,770 | 4910.58 | 241.68 |
| Germany | 806,090 | 3780.55 | 213.22 |
| Canada | 724,930 | 1600.26 | 453.01 |
| South Korea | 718,880 | 1586.79 | 453.04 |
| United Kingdom | 452,080 | 2638.30 | 171.35 |
| France | 423,350 | 2551.45 | 165.93 |
| Italy | 399,600 | 1848.22 | 216.21 |
Table 2.
Some important factors and their relationship with GHGs from water bodies.
| Factors | Range | Relation with CH4 | Relation with CO2 | Relation with N2O | References | Citations (WOS and/or SCOPUS) |
|---|---|---|---|---|---|---|
| pH | 6.95 and 8.34 | Non-significant | Non-significant | - | [34] | 20 |
| 6.90–9.10 | Significantly negative | Significantly negative | Significantly negative | [35] | 8 | |
| 6.54 to 7.92 | - | - | Significant positive | [36] | 1 | |
| DO | 2.23–16.69 mg L−1 | Significantly negative | Significantly negative | Significantly positive | [35] | 8 |
| 2.80–8.65 mg L−1 | - | - | Non-significant | [36] | 1 | |
| Total nitrogen | 1.81–57.70 mg L−1 | - | Significantly positive | Significantly positive | [35] | 8 |
| 0.24–2.01 mg L−1 | - | - | Significantly positive | [36] | 1 | |
| Total phosphorous | 0.00–2.52 mg L−1 | Significantly positive | Significantly positive | Significantly positive | [35] | 8 |
| 2.17–7.10 mg L−1 | - | - | Significantly positive | [36] | 1 | |
| Nitrate | 8–16 mg L−1 | Non-significant | Significantly positive | Significantly positive | [37] | 124 |
| 0.05–1.72 mg L−1 | - | - | Significantly positive | [36] | 1 | |
| Sulfate | 13.2 to 25 mg L−1 | Significantly negative | - | Significantly positive | [38] | 5 |
| Age of the reservoirs | Less than 10 years | Significantly positive | Significantly positive | Not reported | [30,39] | 21, 19 |
| Mean depth | 5–23 m (shallow) | Significantly positive | Significantly negative (for shallow) but significantly negative (for higher depth) | Not reported | [30,33,39] | 21, 19, 4 |
Table 3.
Analytical methods/equations for measuring GHG emissions from waterbodies.
| Analytical Methods/Equations | Reference | Citations (WOS and/or SCOPUS) |
|---|---|---|
| 1. Floating Chambers- Slope = slope from the graph of concentration versus time in ppm/mn F1 = conversion factor from ppm to µg-m−3 (1798.45 for CO2 and 655.47 for CH4) F2 = conversion factor from minutes to days (1440) volume = volume of air trapped in the chamber (m3) surface = surface of the floating chamber over the water (m2) F3 = conversion factor from µg to mg (1000) flux = mg•m−2•d−1 | [55] | 149 |
| 2. Thin boundary layer method: [gas]sat = concentration of gas the water would have at equilibrium with the overlying atmosphere. Kh = Henry’s constant for the gas at a given temperature and salinity Pgas = partial pressure of the gas in the surface water Pgas × Kh = measured the concentration of dissolved gases at the water-air interface | [55,56] | 149, 97 |
| 3. Static Chamber method is the slope of the gas concentration curve (g m−3 min−1), is the volume of the chamber (m3), A is the cross-sectional area of the chamber m2. | [56] | 97 |
Table 4.
Accountability of GHGs emissions and fluxes from Indian freshwater ecosystems.
| Region/ City | Category of Water | CH4 Flux | CO2 Flux | CH4 Emission | CO2 Emission | N2O Emission | References | Citations (WOS and/or SCOPUS) |
|---|---|---|---|---|---|---|---|---|
| Wetlands of Northern India (Lucknow) | Gomti river | __ | __ | 67.72 mg m−2 h−1 | __ | __ | [62] | 44 |
| Hussainabad tank | __ | __ | 1.53 mg m−2 h−1 | __ | __ | [62] | 121 | |
| Sundarban mangrove ecosystem (West Bengal) | Estuaries | __ | __ | 1.97 and 134.6 μmol m−2 d−1 | __ | __ | [63] | 134 |
| Cauvery delta Zone | Inland water | __ | __ | 18.99–37.53 mg m−2 d−1 | __ | 0.41–0.80 mg m−2 d−1 | [61] | 99 |
| Southern India | 45 Inland water | 0.009–52.1 mmol m−2 day−1 | 28.2–262.4 mmol m−2 day−1 | __ | __ | __ | [53] | 107 |
| Majority of India | Tropical rivers | __ | __ | 0.9 mmol m−2 d−1 (avg.) | 843.33 mmol m−2 d−1 (avg.) | __ | [19,53] | 1278; 107 |
| Riverine water (56,000 km2) | __ | 53–494 mmol m−2 day−1 | __ | 117.8 Tg year−1 (avg.) | __ | [19,60] | 1278; 22 | |
| Delhi-Utttar Pradesh Border, National Capital Region (NCR) | Okhla (reservoir) | __ | __ | 171.96 mgm−2d−1 | __ | __ | [64] | 20 |
| Uttaranchal | Tehri dam (reservoir) | __ | __ | __ | 0.30 ± 0.15 Gg CO2 km−2year−1 | __ | [65] | 3 |
| Tehri dam (reservoir) | __ | __ | 23.11 mg m−2 d−1 | 425.93 mg m−2 d−1 | __ | [66] | 44 | |
| Koteshwar (reservoir) | __ | __ | 28.57 mg m−2 d−1 | 923.6 mg m−2 d−1 | __ | [66] | 44 | |
| Bengaluru (network of >200 reservoirs) | Bellandur Lake | __ | __ | 3413 ± 578 ton year−1 | 5711 ± 844 ton year Wetlands of Northern India (Lucknow) | __ | [54] | 4 |
| Jakkur Lake | __ | __ | 0.33 ± 0.06 ton year−1 | 24 ± 10 ton year−1 | __ | [54] | 4 | |
| Freshwater wetland (Manipur) | Wetland of KeibulLamjao National Park | __ | __ | __ | __ | 0.10 ± 0.04 μgm−2 day−1 | [36] | 1 |
Table 5.
Restrictions on hydropower projects under the CDM [112].
Table 5.
Restrictions on hydropower projects under the CDM [112].
| Power Density of Hydroelectric Reservoir (Installed Generation Capacity Divided by Flooded Surface Area), W/m2) | Eligibility to Use Approved Methodologies under CDM Rules |
|---|---|
| <4 | Excluded from using currently approved methodologies |
| 4–10 | Allowed to use approved methodologies, but project emissions must be included at 90 gCO2-eq/kWh |
| >10 | Allowed the use of approved methodologies and project emissions can be neglected |
Publisher’s Note: MDPI stays neutral with regard to jurisdictional claims in published maps and institutional affiliations. |
© 2022 by the authors. Licensee MDPI, Basel, Switzerland. This article is an open access article distributed under the terms and conditions of the Creative Commons Attribution (CC BY) license (https://creativecommons.org/licenses/by/4.0/).
Share and Cite
MDPI and ACS Style
Mondal, B.; Bauddh, K.; Kumar, A.; Bordoloi, N. India’s Contribution to Greenhouse Gas Emission from Freshwater Ecosystems: A Comprehensive Review. Water 2022, 14, 2965. https://doi.org/10.3390/w14192965
AMA Style
Mondal B, Bauddh K, Kumar A, Bordoloi N. India’s Contribution to Greenhouse Gas Emission from Freshwater Ecosystems: A Comprehensive Review. Water. 2022; 14(19):2965. https://doi.org/10.3390/w14192965
Chicago/Turabian StyleMondal, Bipradeep, Kuldeep Bauddh, Amit Kumar, and Nirmali Bordoloi. 2022. "India’s Contribution to Greenhouse Gas Emission from Freshwater Ecosystems: A Comprehensive Review" Water 14, no. 19: 2965. https://doi.org/10.3390/w14192965
Note that from the first issue of 2016, this journal uses article numbers instead of page numbers. See further details here.