
Is Investment Contributing to Competitiveness in Nautical Tourism in the Atlantic Area?


1
Centre of Applied Research in Management and Economics, Polytechnic Institute of Leiria, 2411-901 Leiria, Portugal
2
Faculty of Applied Sciences, WSB University, 41-300 Dabrowa Górnicza, Poland
3
College of Business and Economics, University of Johannesburg, Auckland Park, P.O. Box 524, Johannesburg 2006, South Africa
4
CITUR—Madeira—Centre for Tourism Research, Development and Innovation, 9000-082 Funchal-Madeira, Portugal
*
Author to whom correspondence should be addressed.
Water 2022, 14(19), 2964; https://doi.org/10.3390/w14192964
Submission received: 13 August 2022
/
Revised: 12 September 2022
/
Accepted: 19 September 2022
/
Published: 21 September 2022
(This article belongs to the Section Oceans and Coastal Zones)
Abstract
:The blue economy contributes significantly to the creation of the Atlantic Area’s identity. In addition, the search for outdoor experiences after the COVID-19 lockdown suspensions has renewed the popularity of nautical tourism in this area and in the world. Despite the negative effects of the economic crisis on tourism, evidence suggests that some tourist destinations in the Atlantic area are resilient. Thus, whereas some branches of the blue economy face considerable challenges to increasing competitiveness, others offer opportunities for economic growth and employment. In this context, investment is necessary to lay the foundations for the sustainable development of nautical tourism. However, regarding the role of investment in productivity and competitiveness in the context of crisis, there is no consensus among academics. Thus, we investigate whether the investment contributed to competitiveness in nautical tourism in the Atlantic Area in 2016–2020. We collected data from ORBIS for 29 nautical-tourism companies and performed a quantitative and qualitative narrative analysis of competitiveness indicators, enabling comparisons pre and during crisis. The results highlight the multiplicity of ways in which crisis impacts nautical-tourism firms. The research fills a gap in the literature by investigating the dynamic capabilities of nautical-tourism SMEs in periods of recession, with a special focus on restructuring and competitiveness strategies. Some recommendations are outlined to promote the efficiency of resources and stimulate the competitiveness of companies to allow the regional development of nautical tourism in the territory of the Atlantic area.
1. Introduction
Nautical tourism is the largest of all blue-economy sectors, and is a source of employment, investment, and income for many countries [1]. In 2016, recreational nautical activities created around 234,000 jobs in the EU and generated an annual revenue of EUR 28 billion [2] and have contributed significantly to the creation of the Atlantic Area’s identity. In addition, these activities provide opportunities for the development of the tourism sector, due to their ease of adaptation to other tourist packages, the lack of seasonality, the promotion of services, and the incentives to diversify the qualification of coastal infrastructure [3]. Currently, the nautical sector is very dynamic in promoting related activities, such as the construction of pleasure craft, services, and coastal urban development [4]. This stems, for example, from the fact that recreational navigation is growing and requires sufficient infrastructure [5]. However, countries with relatively similar GDP per capita (Spain, France, United Kingdom) show different nautical development (number of inhabitants/pleasure craft).
Nautical tourism can refer to two types of tourism: recreational and sports activities and cruise tourism. Whereas the first is motivated by aquatic activities, the second is closely related to the ship itself [6]. Recreational nautical tourism has grown the most in popularity, and although cruise tourism has been pointed out as contributing to over tourism, recreational nautical tourism has the advantage of being able to be practiced on waterways far from the coast, an area where there is typically a higher concentration of tourists. In this vein, more projects or programs focused on nautical tourism are welcome because they require different solutions and management models compared to mass tourism [7].
Thus, the present study will focus on recreational nautical tourism, which is a source of quality travel experiences for tourists [8], and the promotion of these activities, which can bring benefits to economies. A study developed by the United Nations Conference on the impacts of COVID-19 on the blue economy projected a growth in preferences for outdoor experiences and contact with nature and water [1]. As a result, the expansion of the boat-rental market worldwide is estimated to grow at 5% per year until 2025 [9]. However, as tourism is closely linked to international trade, the current economic and financial crisis is having profound negative effects on the sector. Despite this, the literature shows that, for example, in Portugal, the most popular tourist destinations, such as islands, are resilient. Thus, in the Atlantic Area, although some branches of the blue economy face considerable challenges to increasing competitiveness, others offer opportunities for economic growth and employment [10]. As nautical tourism is a promising segment to boost economic development, it is necessary to assess the conditions of competitiveness of companies operating in this segment to assess their ability to compete in global markets.
In the tourism industry, where a minimum start-up capital is required and most companies are SMEs, the endowment (and cost) of capital has an impact on their competitiveness [11,12], since companies should invest in equipment that incorporates new technologies in product design and production methods in order to face international competition for tourist destinations [13]. Because every year tourists have the chance to compare facilities, attractions, and service standards of various destinations [14], competition between nautical tourist destinations requires the capacity to acquire competitive advantages [15]. However, since it involves a wide variety of stakeholders, the competitiveness of tourist destinations is difficult to manage [16]. Thus, it is important that the government and entrepreneurs identify tourism-competitiveness factors to manage strategies and create value for tourists. However, there is no consensus among academics regarding the role of investment for productivity and competitiveness in crisis contexts. Whereas some authors recognize physical capital as the most important factor for the productivity and, therefore, the competitiveness of companies [17,18], others argue that it is not [11,12,13,14,15,16,17,18,19]. Counter-cyclical policies are regarded as a key component of national responses to economic crises [20]. In this context, European regional policy focuses on the role of public investment as an important instrument of counter-cyclical reaction to the crisis. By contrast, private investment has been reduced almost everywhere, indicating a pro-cyclical response to economic downturns. This topic is particularly relevant in the current context of the economic crisis insofar as, in this scenario, previous studies have shown that the best policy is to divest to improve business performance [12]. On the other hand, nautical tourism comprises a vast and growing number of maritime activities [21], hindering consensus in the academic community on the definition and scope of nautical tourism [22] and causing a scarcity of information and statistics on the sector, and, as such, of studies focused on this sector. Thus, we investigate whether the investment contributed to competitiveness in nautical tourism in 2016–2020 in the Atlantic Area with the aim of identifying managerial, governmental, and academic opportunities to develop the sector and be able to reap the benefits of tourism for the economies. Specifically, and considering the nautical-tourism companies in the Atlantic Area in 2016–2020, our first research question is the following:
Q1. Should private investment have a pro- or anti-cyclical behavior?
On the other hand, the empirical literature provides evidence that small nautical-tourism companies have a good financial performance and economic sustainability [23] and that the main source of competitive advantage for small companies is cost, provided by simple and flexible organizational structures [12]. However, if competitive advantages depend on the ownership of capital investments [24,25], this suggests that larger companies perform better thanks to greater availability of resources [26,27]. Therefore, firm size is another factor that influences the performance of the nautical segment. Thus, our second research question is:
Q2. What is the sign of the relationship between firm size and competitive performance?
For this purpose, we collected data from ORBIS for 29 companies operating in (NACE rev. 2 code 7734) “Rental and Leasing of Water Transport Equipment” for the five countries of the Atlantic Area. The Atlantic Area comprises the coastal regions of Portugal, Spain, France, the United Kingdom, and Ireland, as well as the islands of Madeira and Azores (Portugal) and the Canary Islands (Spain). A quantitative and qualitative narrative analysis is based on a dataset with competitiveness indicators. We carry out a descriptive narrative analysis of investment behavior and competitiveness by firm size, country, and year and calculate the correlation between investment and three competitiveness indicators. The analysis for 2016–2020 will allow comparisons pre and during crisis.
This article aims to contribute to the resilient discourse, identifying the resilience of companies in the Atlantic Area and examining the cyclicality of investment policy in contexts of economic crisis. In this context, resilience represents both the ability to respond to a shock and the performance of a company after the occurrence of a shock [28]. This contributes to understanding the heterogeneous impact of the global recession on individual European countries. The article also aims to make recommendations for the promotion of resource efficiency and to stimulate the competitiveness of companies to allow the regional development of nautical tourism in the territory of the Atlantic Area. Results highlight the multiplicity of ways in which crisis impacts nautical-tourism firms. The research fills a gap in the literature by investigating the dynamic capabilities of nautical-tourism SMEs in periods of recession, with a special focus on restructuring and competitiveness strategies.
In what follows, Section 2 reviews the literature on the impact of investment on firm competitiveness, Section 3 makes a brief description of the supply and demand of nautical tourism in the Atlantic Area, Section 4 describes the data and methodology, Section 5 and Section 6 present and discuss the results, and Section 7 presents the conclusions and implications.
2. Literature Review
This paper addresses topics such as blue economy and sustainability regarding nautical tourism with a focus on the period during the COVID-19 pandemic. These topics have been addressed by other studies [29,30,31,32,33]
Regarding our first question—Q1. Should private investment have a pro- or anti-cyclical behavior?—we wanted to investigate the sign of the relationship between investment and competitiveness, particularly in contexts of economic crisis. According to Porter [34], capital is related to the competitiveness of a tourist destination. The capital and primary infrastructure of a region are the main influences in determining the success of a tourist destination [10], promoting competitiveness and helping to improve human capital [35]. Activities in the tourism industry provide an interregional and international flow of capital [36].
However, there is no consensus on the relative importance of physical capital in corporate competitiveness. Whereas some authors recognize physical capital as the most important factor for productivity and, therefore, the competitiveness of companies [17,18], others argue that it is not [11,19]. Advocates of capital as the main factor of competitiveness argue that it is difficult for companies with lower investments to compete in a highly competitive market such as tourism, because they may not have the resources to innovate and invest in new technologies [37,38]. Physical capital is needed to invest in infrastructure (transport, water, sanitation, communication networks) and facilities.
The literature has found a positive relationship between resources [24,39] and infrastructure and support services [25] on the competitiveness of tourist destinations. For example, one study [26] included finance and venture capital as destination-management factors that impact competitiveness. In addition, two other studies on Finland and Chile [27,28], based on interviews with managers and other tourism stakeholders, concluded that factors that affect destination competitiveness include, among others, services and supply (connectivity, infrastructure, security, attractions, tours, hotels, restaurants, etc.), investments in facilities, and willingness to expand the business. Even so, destination competitiveness is multilevel; that is, different stages of destination development in terms of competitiveness require different levels of investment [40]. For example, destinations in the initial phase of competitiveness will benefit more from investments in infrastructure, training, and qualifications, whereas in more competitive destinations investments in routes and segments are necessary, namely, in the investigation of new segments and in the way of adding value to products and attractions, so that these tourist destinations can maintain or increase their competitiveness. In this second case, tourism management is more relevant, as it requires actions to promote and develop tourist attractions and products to improve the positioning of tourism companies in international markets.
The current economic crisis caused by the COVID-19 pandemic, however, has had a significant impact on the liquidity and solvency of SMEs [41] and has posed management challenges to tourism companies. By reducing sales and increasing costs, economic crises trigger uncertainty among market agents [42]. As a result of the pandemic, companies were forced to reallocate their resources to respond to reduced demand driven by the lockdown [43]. Since major performance deficiencies can lead to resource constraints, companies often use strategic divestment actions to free up resources and as an attempt to build resilience [44,45,46]. The recent trend of divestments has been increasing [47]. These actions are supported by empirical evidence: After the 2008 recession, companies that made divestments had average returns to shareholders 61.5% higher than companies that did not divest [48]. Furthermore, companies that divest during recessions earn higher returns than those that divest in the growing economy [49].
On the other hand, SMEs often have considerable resource constraints [50], and strategies such as obtaining short-term financing from a parent company to meet funding needs are often not accessible to SMEs [51,52].
This brings us to our second research question: Q2. What is the sign of the relationship between firm size and competitiveness?
Research on how SMEs deal with economic crises has intensified since the last financial crisis in 2007–2008 [53]. According to the Agency Theory of Managerial Discretion, financing difficulties caused by economic crises put pressure on companies to carry out the restructuring they had been putting off. However, whereas some studies show that SMEs see the crisis as a threat [54,55,56], others show that some SMEs manage to turn it into opportunities to increase competitiveness [57,58,59]. Thus, some authors report negative impacts on corporate performance of the crisis [60,61,62], whereas others report positive impacts [62,63,64,65]. In this case and in nautical tourism, opportunities may arise, for example, from the shift from diving activities to underwater-support services [66].
3. Nautical Tourism in the Atlantic Area
3.1. Supply
According to one study [67], the weight of the maritime economy in the Atlantic Area changes between 0.8% of GDP in Ireland [68] and 4.2% in the UK [69].
In developed countries, the development of the nautical sector depends on numerous factors: predominantly, the price of vessels, the availability of adequate facilities, income levels, and the legal and fiscal frameworks [70]. It is a sector with large intermediate consumption and high consumption of services. A pleasure boat requires electronic components, polymers, motors, generators, and several related industries. Therefore, multipliers of the recreational-boating sector cause the total employment to be six times the initial direct effect [71].
With a population of 65.5 million, the Atlantic Arc region encompasses 34 Nomenclatures of Territorial Statistical Units (NUTs) II belonging to five European countries—Ireland (Frontier, Midland, Western, Southern, and Eastern), the United Kingdom (Cumbria; Cheshire; Greater Manchester; Lancashire; Merseyside; Gloucestershire, Wiltshire, and North Somerset; Dorset and Somerset; Cornwall and the Isles of Sicily; Devon; West Wales and the Vales; East Wales; Southwest Scotland; the Highlands and Isles, and Northern Ireland), France (Aquitaine, Lower Normandy, Brittany, Upper Normandy, Pays de la Loire, and Poitou-Charentes), Spain (Andalusia, Asturias, Cantabria, Galicia, Basque Country, and Navarra) and Portugal (North, Center, Lisbon, Alentejo, and Algarve). Comparisons between EU maritime clusters are difficult due to different sectoral nomenclatures, heterogeneity, and geographic scales. According to data for the Cluster Maritime Français region [72], three countries (Spain, France, and Portugal) have a more traditional economic structure compared to Ireland and the United Kingdom, with a much more modern organization. However, ports and maritime tourism in Spain are the largest and most productive sectors of the Atlantic economy.
In France, after coastal tourism (the most important in terms of GVA and employment, but not in terms of productivity], maritime equipment, fishing, and seaports are the main activities. For example, in the Brittany region, the supply is concentrated on peaceful holidays with family and friends, supported by an abundance of different boats for hire and a well-organized network of rivers and canals over 600 km in length, which makes the region a recognizable nautical-tourism destination. Although the region does not have outstanding tourist attractions, there is potential for exploring nature, lifestyle, and traditional local customs available to nautical tourists. Mooring on any part of the shore is allowed, if the infrastructure allows it, to authentically experience the adventure.
Portugal has the smallest maritime economy of the group. Coastal tourism, ports, fisheries, and aquaculture products are the most important activities.
The main sectors of the UK’s blue economy are coastal tourism, the navy, marine equipment, and ports. Freight activities and the strengthening of nautical capacity position nautical river tourism at a high level in the tourist activities of Great Britain, whose organization is in charge of the British Waterways.
The Irish maritime economy is small but has the highest productivity in the Atlantic area. In this context, maritime transport, tourism, the naval industry, and high-tech marine products stand out as the main economic sectors. In addition, Ireland has a 300-mile-long network of rivers and canals as a tourist attraction. For example, the east coast of Ireland is a region with long-standing maritime traditions that offers the nautical tourist a diverse tourist package comprising the Wicklow Mountains, coastal towns and villages with their Celtic charm, and heritage sites of scientific and archaeological relevance. Thus, Europe is a paradise for nautical tourism—it has 68,000 km of coastline, 4500 marinas with 1.75 million berths, and boat parking for a total of 6.3 million vessels [73]. As part of the European Union’s Blue Growth strategy, the nautical-tourism sector is expected to contribute significantly to the economy and create more jobs [74].
The European pleasure-boat industry is open and competitive, selling around two-thirds of production domestically and exporting the rest to traditional markets such as the United States, Canada, Australia, and New Zealand. Thus, prices for new boats have become more competitive and there is a tendency for second-hand boats to be sold at low prices [75]. However, the problem of financing for the acquisition of vessels necessary for the provision of nautical-tourism services is still important, considering the credit restrictions for small companies. In this context, business networks and government assistance are important for SMEs, as they support the choice of foreign markets and provide information on international business operations [76]. In addition, brand identity is recognized as important for the development of nautical tourism by encouraging companies to respond to export opportunities and improve their market positioning vis-à-vis their competitors [76,77]. Thus, although differentiation is a key factor in the sustainability of nautical tourism, managers face several constraints such as limited budgets, lack of control of weather conditions, and high competition [78].
3.2. Demand
Nautical tourists are regarded as high-value visitors who spend above average [79]. It is estimated that 36 million Europeans participate in nautical activities and possess six million vessels in Europe [80]. Although historically, recreational nautical activity has been associated with the higher social classes, currently we cannot assume such exclusivity [81]. In fact, nautical tourism comprises a growing number of maritime activities [82]. Although studies on the profile of nautical tourists are scarce, the literature has identified, for example, that the group of nautical practitioners in the central region of Portugal is 55.4% male and 44.6% female, in agreement with what most studies reveal in that nautical activities are practiced mostly by men [83]. The main age groups are 36–55-year-olds followed by 19–25-year-olds. Most of the nautical tourists are residents of Portugal, with the rest of the nationalities comprising Brazilian, French, English, Australian, Spanish, Cape Verdean, Russian, and Irish. Most have higher education, are employed, and have a monthly net income of EUR 1000–1500. Most respondents preferred to practice this type of activity in rivers, followed by the sea, dams, and lakes.
In relation to Spain, Promotur’s statistics in the Canary Islands indicate that the profile of the nautical tourist is characterized by an average age of 30–45 years, high purchasing power, usually traveling with the family (66%), and having an average stay of about 10 days. Some of the main tourist origin markets are Austria, Switzerland, Russia, Poland, the Netherlands, and Germany. In 2011–2014, the nautical tourist had an average age of 38 years, was male, and had an average stay of 9.6 days [84]. Almost half of the respondents (48%) were employees in high and medium positions and 27.9% were employers, with an average level of annual personal income of EUR 24,000–36,000, which suggests tourists with high purchasing power. As far as nationality is concerned, the majority were German, English, and Spanish. During the COVID-19 pandemic, requests for private yachts greatly increased because it was considered a safe way to enjoy vacation [85]. At same time, meeting the growing demand for more comfort in marinas and on-board sailboats has required large investments [86].
4. Materials and Methods
4.1. Hypotheses
Given that the literature recommends divestment as the best management practice during a crisis to free up resources and build resilience, we formulated the following hypothesis:
Hypothesis 1 (H1).
In the context of crisis caused by the pandemic, investment should not contribute to the competitiveness of nautical-tourism companies. In other words, in the context of crisis, private-investment policy should be pro-cyclical.
SMEs often experience credit constraints, whereas larger companies typically possess more financial resources. In addition, although the literature indicates that the consumption of goods and services in nautical tourism is no longer elitist and has become democratic, the profile of the nautical tourist found in the literature suggests a segment of customers with large purchasing power, which, ceteris paribus, potentiates larger turnover and profits for larger firms. Bearing this in mind, our hypothesis is as follows:
Hypothesis 2 (H2).
The size of the company is directly related to competitiveness in the context of economic crisis.
4.2. Data Collection and Sample
We collected data from ORBIS. The search criteria were as follows: private companies active in the Atlantic Area operating in NACE rev. 2 code 7734 (Rental and leasing of water transport equipment). This search delivered 4763 companies. We restricted the search to companies with at least 10 employees to exclude micro-companies. The reason for this exclusion is related to the focus of our investigation on the competitiveness of nautical-tourism companies. Competitiveness also depends on innovation. According to the literature, companies with fewer than 10 employees are usually labeled as marginal businesses without innovative capacity [87], and thus studies that investigate the impact of innovation efforts on competitiveness exclude micro-firms. This is due to the existence of potential aspects regarding R&D projects that affect micro-enterprises more strongly than larger companies. First, in R&D investment, initial sunk costs carry greater risks, and micro-firms, being likely to be first-time innovators, may be more risk averse. Second, there are information asymmetries between micro-firms and external lenders, leading to credit constraints [88] and preventing innovation activities. The search that excluded micro-firms returned 52 results. After the cleaning procedure of firms with missing values, we were left with 29 firms, which represents 56% of the sample. The objective was to investigate the dynamic capabilities of nautical-tourism SMEs in periods of recession with a special focus on restructuring and competitiveness strategies. With this in mind, we sought to identify the resilience of companies in the Atlantic Area and examine the cyclicality of investment policy in contexts of economic crisis. The ultimate objectives are to contribute to the understanding of the heterogeneous impact of the global recession on individual European countries and to make recommendations for promoting resource efficiency and stimulating the competitiveness of companies to enable the regional development of nautical tourism in the Atlantic Area territory. To this end, we carried out a descriptive narrative analysis of investment behavior and competitiveness by company size, country, and years and calculated the correlation between investment and the three competitiveness indicators. The analysis for 2016–2020 allowed for comparison pre and during crisis.
4.3. Competitiveness Indicators
Market share is the percentage that a given company has gained over competitors in a given period. The greater this share, the more competitive the company is. This indicator helps managers to grow in the market. Losing market share requires strategic adjustments. However, having a very high market share can also imply a greater risk of facing more aggressive competition. Consequently, companies must seek a lower-than-desired market share to avoid being attacked by competitors. The formula is:
Market share = sales/total market sales
If it is low, it is a sign that customers prefer the companies’ rivals. Based on the results presented by this indicator, it is possible to investigate the causes of low turnover, such as pricing policy and service quality.
Productivity: Companies that manage to produce a lot with as few resources as possible and without compromising the final quality tend to stand out in the market. We used labor productivity as measured by:
Work Productivity = Turnover/Number of Workers
Retaining talent: As we did not have qualitative data, we used:
Employment growth rate = N.Employeesn − N.Employeesn−1/N.Employeesn−1
5. Results
The analysis of standard deviations (Table 1) indicates that, in relation to competitiveness indicators, productivity presented a large variation, whereas talent retention and market share did not vary as much between companies and countries. Investment, on the other hand, varied widely among the companies on the panel. On average, there was also a large dispersion of the sample values, both for productivity and for investment.
From Table 2 we can see that Spain had the most companies (55%), followed by the UK (28%). Portugal and Ireland had a share of 7%, and French companies represented only 3% of the sample. Using the criterion of the number of employees to establish firm size, we can see that the nautical-tourism companies in the Atlantic Area were all small. The single French company had the most employees (25), followed by Spanish companies (20) and British and Irish companies (19). Portuguese companies had an average of 17 employees, the smallest companies in the sample.
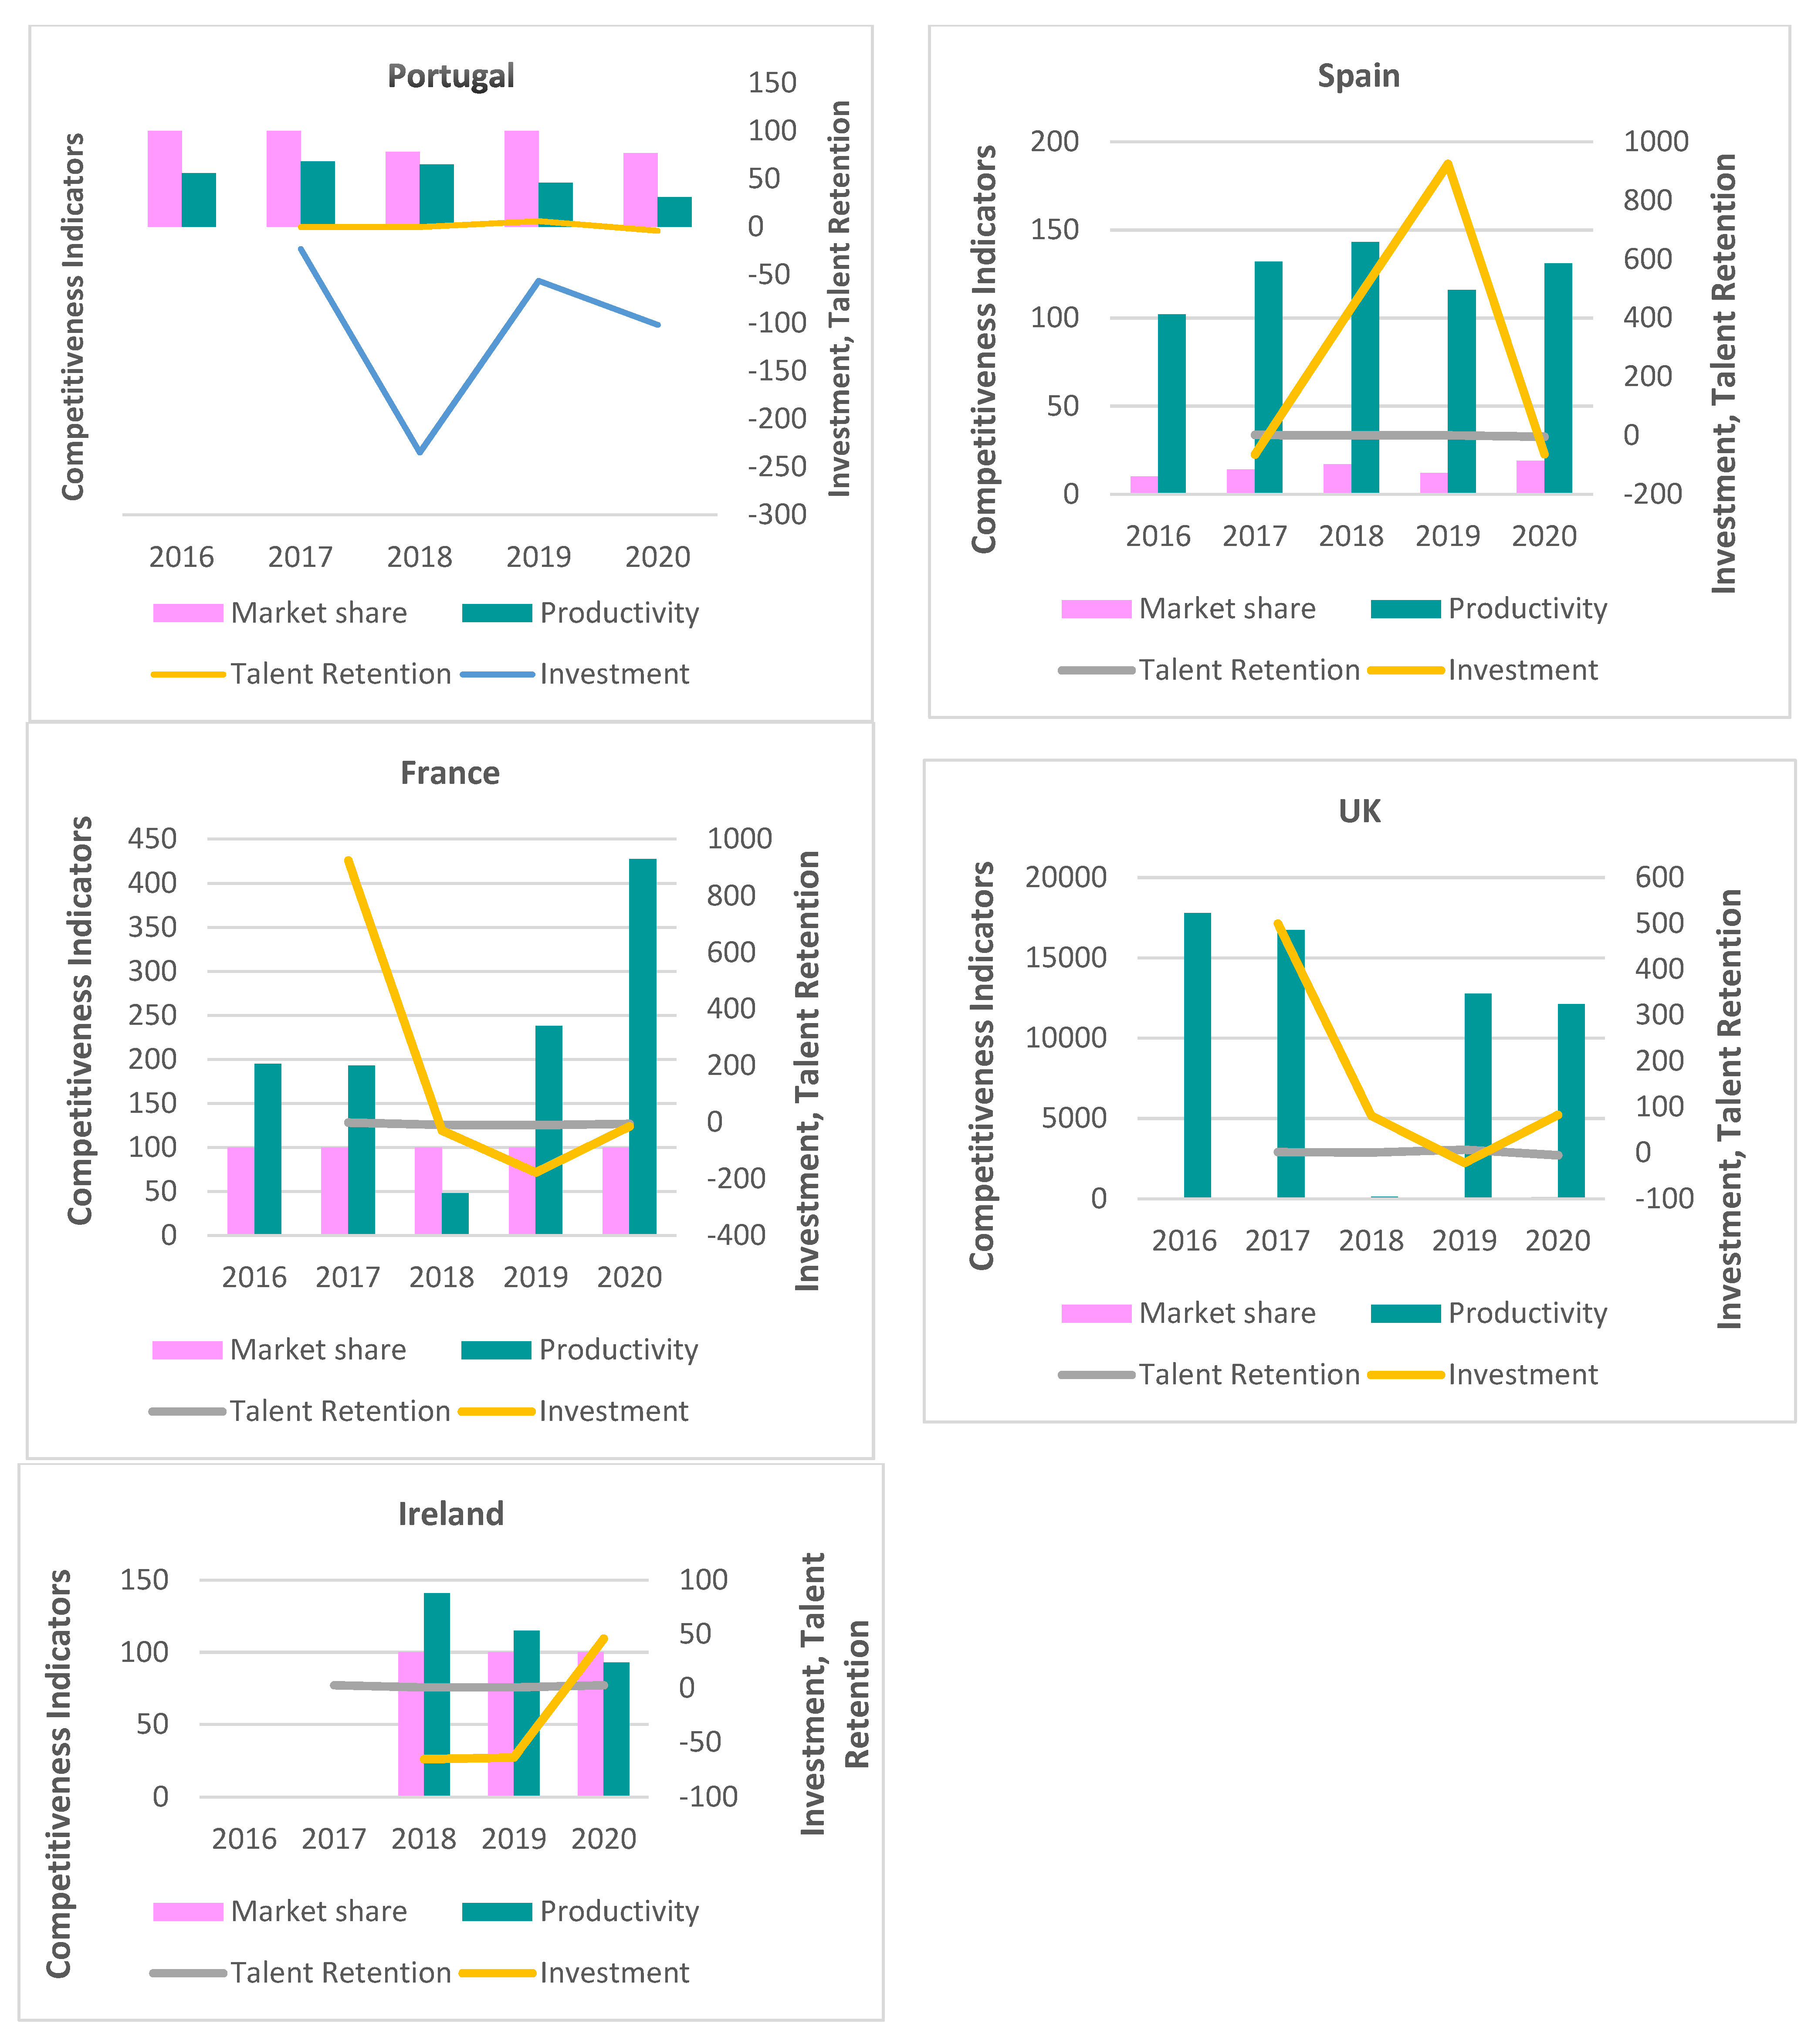
From the analysis of Table 2, we can see that the UK firms had the highest turnover, and the Portuguese companies had the lowest. The highest turnovers was then found among French, Spanish, and Irish firms, respectively. In terms of capital, the French company, being the largest, also had the highest net capital, followed by the Spanish, English, Irish, and finally the Portuguese companies. The average levels of capital were very similar in the countries of the Atlantic Area. In relation to the average investment, the Spanish companies were the ones that invested the most on average, followed by the French and English companies. Irish and Portuguese companies, on average, disinvested during the studied period. Figure 1 shows the evolution of investment and the three competitiveness indicators over time and across countries.
Competitiveness indicators showed an uneven evolution in Portugal in 2018 and 2020 regarding the average market share. Regarding productivity, after an increase in 2017, it constantly declined since then. However, in terms of talent retention, in 2019 there was a positive evolution, but it decreased and became negative in 2020 because of the pandemic and the subsequent layoffs. As for investment, the period was marked by successive divestments, with 2018 and 2020 being the years in which these divestments were highest. This evolution seems to indicate that the nautical-tourism companies suffered the effects of the crisis in terms of competitiveness.
Regarding Spain, the average market share increased until 2018, having decreased in 2019 and increased again in 2020. Productivity also increased until 2018, having decreased in 2019 and increased again in 2020. The talent retention declined during the studied period. There were divestments in 2017 and 2020, and in 2018–2019 there was investment. This evolution seems to indicate a positive relationship between investment and competitiveness in terms of productivity and market share, but only in 2018 in Spain. In addition, Spanish nautical-tourism companies do not seem to have suffered as much from the effects of the pandemic as Portuguese companies.
In relation to France, the average market share remained at 100%, as we had only one company in the sample. Productivity dropped until 2018 and started to increase from then on, whereas talent retention constantly decreased until 2019, and in 2020 the fall was not so sharp. There was an increasing trend of divestments from 2018 onwards. However, in 2020, these were not so sharp, which appears to indicate a positive relationship between investment and talent retention in France. Results from France suggest that, as the company was already having problems in terms of competitiveness, when the pandemic emerged its effects were not felt as strongly as in other companies, and the French company was able to increase labor productivity in 2020.
In the UK, the market share was around 50% in the first two years, having dropped to 1% in 2018 only to return to 50% in 2019 and in 2020 to 99%, which represents a substantial increase. In terms of productivity, it dropped significantly until 2018, increased in 2019, and decreased slightly in 2020. As for talent retention, it decreased in 2018, increased in 2019, and decreased again in 2020, being negative, suggesting layoffs due to falling demand during the pandemic. In terms of investment, it decreased in 2018 and in 2019, the year in which there was divestment, and in 2020 the investment recovered. These results suggest that in the UK investment and market share were positively related, except in 2019.
Finally, for Ireland, market share remained at 100% from 2018 to 2020, productivity constantly dropped, and talent retention fell in 2018–2019, but during the pandemic it recovered to 2017 levels. These results seem to indicate that in Ireland companies did not suffer as much from the effects of the pandemic, with a positive relationship between investment and talent retention. The correlation matrix (Table 3) shows positive (weak) and significant correlations between investment and competitiveness indicators (in medians).
The analysis of correlations by country and year was statistically insignificant, except for a weak and significant positive correlation between productivity and market share for Spain (0.2554, p < 0.05), but was strong for the United Kingdom (0.8166, p < 0.05). This suggests that companies in Spain and especially the UK with higher market share re more productive because they can rationalize costs through economies of scale.
Regarding the correlation analysis by years, only in 2020 was there a strong positive correlation between investment and productivity (0.5568, p < 0.05) and talent retention (0.5073, p < 0.05). This suggests that, in the Atlantic Area, during the pandemic, investment may have brought productivity benefits and allowed the retention of talent, thus contributing to the competitiveness of nautical-tourism companies, which is contrary to our H1.
Table 4 summarizes the evolution of investment and the three competitiveness indicators per country in 2020. We compared the evolution of investment and competitiveness to verify whether H1 holds.
In short, and according to Table 4, there seems to be a direct relationship between investment and competitiveness in the Atlantic Area during the crisis, except in the UK. Bearing in mind that, on average, UK companies had a much higher average turnover than companies from other countries and that they were among those that invested the most. On average, the loss of competitiveness in 2020 seems to be related to layoffs and loss of productivity. Taking this result into account, our research suggests that private investment policy should be counter-cyclical to counteract the effects of the crisis on competitiveness. Therefore, H1 does not hold.
Regarding H2, considering that the French firm was, on average, the largest in the Atlantic Area and that Portuguese companies were the smallest, it appears that the size of the companies was related to competitiveness. In this way, our Hypothesis H2 is validated. However, considering the small size of the sample, the results need to be corroborated by a study with a larger sample and through regression analysis.
6. Discussion
Nautical tourism has become a very popular tourist niche, but COVID-19 has hit the travel and tourism sector hard [89]. Facing a crisis, the European boating industry has quickly taken steps to find new markets beyond the traditional ones (Europe, North America, Australia/New Zealand) and invested in new models and new technological measures to promote innovative products, reduce production costs, and defend its position as a world leader [90].
For companies in the recreational nautical sector, unlike companies in other sectors, their proximity to raw materials and infrastructure, the opportunity to explore an existing need, and proximity to other companies in the same business or related activities are crucial factors. In this context, the location in the immediate vicinity of marinas and piers is crucial. In Europe, due to the intrinsic relationship between the pleasure-boating sector and economic development, the economic crisis led to a significant contraction in the demand for pleasure craft. As a result, companies had to cut their costs, including the budgets allocated to training, innovation, and design activities. Likewise, companies have reduced the prices of their services, infrastructure, and equipment. On the other hand, COVID-19 has resulted in growth in tourists’ preferences for “coastal areas in search of contact with nature, outdoors, and water” [1]. As nautical tourism has the capacity to attract and retain segments of tourists with greater purchasing power, the increase in demand for nautical activities may induce high potential for profitability in the sector [91].
Normative economic theory predicts countercyclical policy reactions to the business cycle as a catalyst for recovery [20]. However, empirical research provides evidence that policies at the national and regional levels are pro-cyclical to the business cycle [92]. The results of this study point to a direct relationship between investment and competitiveness in the Atlantic Area in the context of crisis. In other words, it calls for anti-cyclical private-investment policies, like the one prescribed for public investment. This contradicts our H1 hypothesis.
In 2020, during the pandemic, investment seems to have contributed to increasing productivity and avoiding layoffs, thus contributing to the competitiveness of nautical-tourism companies. These results for nautical tourism in the Atlantic Area corroborate the results of [57,58,59]. In short, it appears that in situations of decreased demand in nautical tourism, the solution to increasing competitiveness is to invest in the business to attract tourists and diversify the offer, taking advantage of opportunities. Still, different stages of destination development in terms of competitiveness require different levels of investment. Whereas destinations in early stages of competitiveness benefit more from investments in infrastructure, training, and qualification, more competitive destinations require investments to promote and develop tourist attractions and products to improve the positioning of tourism companies in international markets. Because tourism management is more relevant in this case, it appears that the relationship between investment and competitiveness does not depend on the number of resources invested, but on their strategic orientation. Furthermore, regions with high levels of competitiveness attract investors and citizens [93]. However, the share of investment and capital available in the tourism industry can inhibit the positive socio-economic effects of tourism development at the regional level [94]. For example, investing in capital-intensive services to increase competitiveness can reduce job opportunities [95,96]. Business competitiveness based on investment can have an adverse effect, generating unemployment and compromising the social sustainability of tourism companies in favor of economic sustainability. However, competition can be an obsession that can cause careless investments and lead to protectionism and poor public policies [97]. Thus, governments must approach the issue of competitiveness with care, safeguarding aspects of social sustainability under penalty of creating significant imbalances in the economy.
The literature suggests that investments provide competitive advantages for nautical tourism companies [24,25] and therefore that larger companies are more competitive thanks to a greater availability of resources [26,27]. The results of our study support this assumption.
Limitations. Although the tourism-development challenges of various destinations are focused on the nautical sector, there are not enough data, studies, or information available [98]. Therefore, the present study lacks a more in-depth characterization of the sector and the corresponding demand. The work carried out in this study shows how difficult it is to characterize nautical tourism in the Atlantic Area, given the diversity of situations encountered and the still-poor knowledge of nautical-tourism supply and demand. To produce statistics, it is necessary to define the scope of the tourist sector and its delimitation in the country. For example, it is difficult to distinguish between international tourists, residents, and domestic tourists, and to distinguish tourism from leisure activities. Moreover, detailed statistical data on variables that may exert an impact on the interactions between investment and competitiveness are lacking. In addition, this study comprises only a short term (five years), making it difficult to draw conclusions on the relationships between variables. On the other hand, the development of effective relationships with consumers; the search for innovation, competitive prices, products, services, and highly qualified staff; and marketing campaigns affect firms’ competitiveness [99]. However, there is no evidence in the literature on how marketing and internationalization plans and customer satisfaction surveys impact the competitiveness of nautical-tourism companies in the Atlantic Area. Even so, it is expected that the proper structuring of tourist services and differentiation strategies can increase the demand and competitiveness of nautical-tourism companies [100].
7. Conclusions
Tourism activities can have positive impacts on tourist destinations, such as income, capital, and employment, which leads governments and managers around the world to compete to attract tourism. Previous literature shows that small nautical-tourism companies in the northern region of Portugal have good financial performance and economic sustainability. However, investment is needed to lay the foundations for sustainable-tourism development and to train the workforce. Still, although some authors recognize physical capital as the most important factor for productivity and, therefore, for competitiveness, others argue that it is not. This is a fundamental question in the pandemic context, since drops in demand cause the loss of competitiveness if actions are not taken to revert this impact.
The results of the present study suggest that private-investment policy should be counter-cyclical to counteract the effects of crisis on competitiveness. Thus, H1 does not hold. On the other hand, hypothesis H2 is validated, as the results point to a direct relationship between firm size and competitiveness. However, given the small size of the sample, these conclusions should be considered with caution.
Policy implications. These results are useful for company managers to show that in times of crisis it is advisable to invest to improve competitiveness. On the other hand, the results show that large companies can navigate better in troubled waters in the context of crisis. This is important for the nautical tourism industry because it has emerged as a key sector for the sustainability of many coastal and island destinations. In addition, nautical tourism makes it possible to mitigate the issue of over tourism by allowing the excess of tourists to be redirected from the most congested areas to other areas in the interior of the countries, thus contributing to the regional development of the most underdeveloped regions. In fact, nautical activities have great potential for the socioeconomic development of tourism due to their multiplying effect on the economy. The generation of employment, the ease of adapting to other tourist packages, the lack of seasonality, the impetus they give to the qualification and diversification of coastal infrastructures, and their technological innovation are just some of the attributes of the sector. This has been recognized by the European Commission and its action plans with the aim of generating blue-economy growth, fostering employment, and stimulating the growth of coastal areas, driving the revitalization of nautical tourism and the emerging maritime activities (ocean energy, marine biotechnology, exploration of deep-sea natural resources). However, the complex nature of the nautical-tourism supply makes it difficult for policymakers to understand the difficulties facing the industry and to coordinate the various elements of the tourism product. As a result, public-management decisions on resource allocation have been guided by strategic considerations in response to various tourism lobbies. Although there is consensus on the goals to be achieved at the regional level, little research has been carried out on the appropriate policy mix to achieve these goals, let alone a benchmarking analysis. The present study is a step forward in providing some insights into such difficulties and the sign of the relationship between private investment and the competitiveness of companies in the context of crisis.
Future research may include micro-firms since, due to their nature (e.g., seasonality), tourism activities are operated by a significant number of family (micro) firms. In addition, key aspects of differentiation (competitive prices, highly qualified staff, etc.) likely to lead to competitive advantages should be investigated in relation to business competitiveness to allow a more comprehensive understanding of the relationship between investment and competitiveness of nautical tourism in the Atlantic Area.
Author Contributions
Conceptualization, E.S.; methodology, E.S. and R.A.C.; validation, E.S. and R.A.C.; formal analysis, E.S.; investigation, E.S., R.A.C. and D.M.; resources, E.S., R.A.C. and D.M.; writing—original draft preparation, E.S.; writing—review and editing, E.S. and R.A.C.; supervision, E.S.; project administration, E.S.; funding acquisition, E.S., R.A.C. and D.M. All authors have read and agreed to the published version of the manuscript.
Funding
This research was financed by the program of the Minister of Science and Higher Education titled “Regional Initiative of Excellence” in 2019–2022, project number 018/RID/2018/19, the amount of funding PLN 10 788 423.16, and the National Funds of the FCT—Portuguese Foundation for Science and Technology within the project UIDB/04928/2020 and under the Scientific Employment Stimulus—Institutional Call CEECINST/00051/2018.
Data Availability Statement
Restrictions apply to the availability of data. Data was retrieved from ORBIS, at https://orbiseurope.bvdinfo.com (accessed on 30 April 2022).
Conflicts of Interest
The authors declare no conflict of interest.
References
- UNCTAD—United Nations Conference on Trade and Development (2020) COVID-19 and Tourism Assessing the Economic Consequences. Available online: https://unctad.org/system/files/official-document/ditcinf2020d3_en.pdf (accessed on 1 August 2022).
- European Commission. Commission Staff Working Document on Nautical Tourism. Report COM SWD (2017) 126 Final, Brussels (Belgium). 2017. Available online: http://ec.europa.eu/maritimeaffairs/documentation/studies_en (accessed on 30 April 2022).
- González, L.; Yen, E.; González, L.; Carmelo, J.; Ledesma, D.L. Highlights of consumption and satisfaction in nautical tourism. A comparative study of visitors to the Canary Islands and Morocco. Gestión Ambiente 2015, 18, 129–145. [Google Scholar]
- Pérez Labajos, C.Á.; Blanco Rojo, B.; Sánchez Ruiz, L.; Madariaga Domínguez, E.; Díaz Ruiz de Navamuel, E.; Torre Olmo, M.B.; López Gutiérrez, C.; Sanfilippo Azofra, S. The leisure nautical sector in the Atlantic area. J. Marit. Res. JMR 2014, 11, 87–97. [Google Scholar]
- Xiao, H.; Smith, S.L. The making of tourism research: Insights from a social sciences journal. Ann. Tour. Res. 2006, 33, 490–507. [Google Scholar] [CrossRef]
- Cavalheiro, M.B.; Luz, A.B.T.; Mayer, V.F. Turismo Náutico em Niterói: Levantamento Documental. 2021. Available online: http://turismonautico.uff.br/2021/05/07/relatorio-do-levantamento-documental-sobre-esportes-nauticos-em-niteroi-e-sobre-iniciativas-de-turismo-nautico-no-brasil/ (accessed on 30 April 2022).
- European Parliament. European tourism: Recent Developments and Future Challenges. 2019. Available online: https://www.europarl.europa.eu/RegData/etudes/STUD/2019/629200/IPOL_STU(2019)629200_EN.pdf (accessed on 30 April 2022).
- Caparrós-Martínez, J.L.; Martínez-Vázquez, R.M.; de Pablo Valenciano, J. Analysis and global research trends on nautical tourism and green coastal infrastructures: The case of coral reefs and seagrass meadows. Environ. Sci. Eur. 2022, 34, 33. [Google Scholar] [CrossRef]
- Report Linker. The Global Boat Rental Market Is Expected to Grow from USD 17,620.57 Million in 2019 to USD 23,160.11 Million by the End of 2025 at a Compound Annual Growth Rate (CAGR) of 4.66% Market. 2020. Available online: https://www.globenewswire.com/news-release/2020/07/03/2057347/0/en/TheGlobal-Boat-Rental-Market-is-expected-to-grow-from-USD-17-620-57-Million-in-2019-to-USD-23-160-11-Million-by-the-end-of-2025-at-a-Compound-Annual-Growth-RateCAGR-of-4-66.htm (accessed on 30 April 2022).
- Rizzi, P.; Graziano, P. Regional perspective on global trends in tourism. Symphonya 2017, 3, 11–26. [Google Scholar] [CrossRef]
- Zhu, Z.; Zhu, Z.; Xu, P.; Xue, D. Exploring the impact of government subsidy and R&D investment on financial competitiveness of China’s new energy listed firms: An empirical study. Energy Rep. 2019, 5, 919–925. [Google Scholar]
- Santos, E.; Castanho, R.A. The Impact of Size on the Performance of Transnational Corporations Operating in the Textile Industry in Portugal during the COVID-19 Pandemic. Sustainability 2022, 14, 717. [Google Scholar] [CrossRef]
- Hanafiah, M.H.; Hemdi, M.A.; Ahmad, I. Reflections on tourism destination competitiveness (TDC) determinants. Adv. Sci. Lett. 2015, 21, 1571–1574. [Google Scholar] [CrossRef]
- Kozak, M.; Rimmington, M. Measuring tourist destination competitiveness: Conceptual considerations and empirical findings. Int. J. Hosp. Manag. 1999, 18, 273–283. [Google Scholar] [CrossRef]
- Bornhorst, T.; Ritchie, J.B.; Sheehan, L. Determinants of tourism success for DMOs & destinations: An empirical examination of stakeholders’ perspectives. Tour. Manag. 2010, 31, 572–589. [Google Scholar]
- Ayikoru, M. Destination competitiveness challenges: A Ugandan perspective. Tour. Manag. 2015, 50, 142–158. [Google Scholar] [CrossRef]
- Poh, L.T.; Kilicman, A.; Ibrahim, S.N.I. On intellectual capital and financial performances of banks in Malaysia. Cogent Econ. Financ. 2018, 6, 1453574. [Google Scholar] [CrossRef]
- Xu, J.; Liu, F. The impact of intellectual capital on firm performance: A modified and extended VAIC model. J. Compet. 2020, 12, 161. [Google Scholar] [CrossRef]
- Ahangar, R.G. The relationship between intellectual capital and financial performance: An empirical investigation in an Iranian company. Afr. J. Bus. Manag. 2011, 5, 88–95. [Google Scholar]
- Francis, N.; Jackson, L.; Owyang, M. Counter-Cyclical Policy and the Speed of Recovery after Recessions; Federal Reserve Bank of Saint Louis: Saint Louis, MO, USA, 2017. [Google Scholar]
- Martínez-Vázquez, R.M.; de Pablo Valenciano, J.; Milán-García, J. Impact Analysis of Marinas on Nautical Tourism in Andalusia. J. Mar. Sci. Eng. 2022, 10, 780. [Google Scholar] [CrossRef]
- Moreno, M.J.; Otamendi, F.J. Fostering Nautical Tourism in the Balearic Islands. Sustainability 2017, 9, 2215. [Google Scholar] [CrossRef]
- Santos, E.; Correia, A.; Veloso, C.M.; Silva, G. An Economic and Financial Analysis of Tourism Firms Operating in Outdoor Tourism. Econ. Soc. Dev Book Proc. 2019, 11, 268–281. [Google Scholar]
- Fernández, J.A.S.; Azevedo, P.S.; Martín, J.M.M.; Martín, J.A.R. Determinants of tourism destination competitiveness in the countries most visited by international tourists: Proposal of a synthetic index. Tour. Manag. Perspect. 2020, 33, 100582. [Google Scholar] [CrossRef]
- Stojanović, B.; Vučić, V.; Kostić, Z. Competitiveness of Infrastructure in Tourism in the Southeast Europe. Knowl. Int. J. 2019, 35, 181–187. [Google Scholar]
- Ritchie, J.R.B.; Crouch, G.I. The Competitive Destination: A Sustainable Tourism Perspective; CABI: Oxford, UK, 2003. [Google Scholar] [CrossRef]
- Komppula, R. The role of individual entrepreneurs in the development of competitiveness for a rural tourism destination—A case study. Tour. Manag. 2014, 40, 361–371. [Google Scholar] [CrossRef]
- Aqueveque, C.; Bianchi, C. Tourism destination competitiveness of Chile: A stakeholder perspective. Tour. Plan. Dev. 2017, 14, 447–466. [Google Scholar] [CrossRef]
- Lóránt, D.; Zoltán, B. A possible use of indicators for sustainable development in tourism. ANATOLIA Int. J. Tour. Hosp. Res. 2007, 18, 349–355. [Google Scholar]
- Zoltán, B.; Lóránt, D. Environmentalism and sustainable development from the point of view of tourism. Tourismos 2007, 2, 141–152. [Google Scholar]
- Kabil, M.; Priatmoko, S.; Magda, R.; Dávid, L.D. Blue Economy and Coastal Tourism: A Comprehensive Visualization Bibliometric Analysis. Sustainability 2021, 13, 3650. [Google Scholar] [CrossRef]
- Moaaz, K.; Ahmed, A.E.; Katalin, C.; Dénes, D.L. Tourism centres efficiency as spatial unites for applying blue economy approach: A case study of the Southern Red Sea region, Egypt. PLoS ONE 2022, 17, e0268047. [Google Scholar]
- Setiawan, P.; Billal, H.; Wuri, R.; Budi, W.S.; Dénes, D.L. Webinar among Indonesian academics during COVID-19, embracing the audiences. PLoS ONE 2022, 17, e0265257. [Google Scholar]
- Porter, M.E.; Sölvell, Ö. The role of geography in the process of innovation and the sustainable competitive advantage of firms. In The Dynamic Firm: The Role of Technology, Strategy, Organization, and Regions; Oxford University Press: Oxford, UK, 1998; pp. 440–457. [Google Scholar]
- Brida, J.G.; Cortes-Jimenez, I.; Pulina, M. Has the tourism-led growth hypothesis been validated? A literature review. Curr. Issues Tour. 2016, 19, 394–430. [Google Scholar] [CrossRef]
- Smith, S.L. Tourism Analysis: A Handbook, 2nd ed.; Routledge: London, UK, 2014. [Google Scholar]
- Bodlaj, M.; Čater, B. The impact of environmental turbulence on the perceived importance of innovation and innovativeness in SMEs. J. Small Bus. Manag. 2019, 57, 417–435. [Google Scholar] [CrossRef]
- Santos, E.; Khan, S. Determinant Factors of Pecuniary Externalities. Int. J. Bus. Manag. 2018, 6, 180–198. [Google Scholar]
- Reisinger, Y.; Michael, N.; Hayes, J.P. Destination competitiveness from a tourist perspective: A case of the United Arab Emirates. Int. J. Tour. Res. 2019, 21, 259–279. [Google Scholar] [CrossRef]
- Okupe, A.; Ward, T.; Adeola, O. Enhancing hospitality and tourism industry competitiveness in Sub-Saharan Africa. In Africa’s Competitiveness in the Global Economy; AIB Sub-Saharan Africa (SSA) Series; Palgrave Macmillan: Cham, Switzerland, 2018. [Google Scholar] [CrossRef]
- Cowling, M.; Brown, R.; Rocha, A. Did you save some cash for a rainy COVID-19 day? The crisis and SMEs. Int. Small Bus. J. 2020, 38, 593–604. [Google Scholar] [CrossRef]
- Sharma, M.; Luthra, S.; Joshi, S.; Kumar, A. Developing a framework for enhancing survivability of sustainable supply chains during and post-COVID-19 pandemic. Int. J. Logist. Res. Appl. 2020, 25, 433–453. [Google Scholar] [CrossRef]
- Sigala, M. Tourism and COVID-19: Impacts and implications for advancing and resetting industry and research. J. Bus. Res. 2020, 117, 312–321. [Google Scholar] [CrossRef]
- Hoskisson, R.E.; Harrison, J.S. Keep the conversation going: Theory and method in strategic management. In Strategic Management: State of the Field and Its Future; Oxford University Pressin Press: Oxford, UK, 2021; p. 19. [Google Scholar]
- Imhanzenobe, J. Achieving competitive advantage and financial sustainability through acquisition and restructuring strategies. J. Account. Tax. 2021, 13, 217–225. [Google Scholar]
- Brown, T. Divestment Decisions: Their Determinants, Implications, and Legitimations. Ph.D. Thesis, Universität Erfurt, Erfurt, Germany, 2021. [Google Scholar]
- Nyiwul, L. COVID-19 regulatory responses and FDI in the United States: Trends and implications for capital flows. Transnatl. Corp. Rev. 2021, 13, 156–173. [Google Scholar] [CrossRef]
- Kooli, C.; Lock Son, M. Impact of COVID-19 on Mergers, Acquisitions & Corporate Restructurings. Businesses 2021, 1, 102–114. [Google Scholar]
- Lee, V.Y. Corporate Asset Restructuring through Mergers and Acquisitions and Divestitures. Ph.D. Thesis, University of Reading, Reading, UK, 2021. [Google Scholar]
- Nguyen, V.K.; Natoli, R.; Divisekera, S. Innovation and productivity in tourism small and medium enterprises: A longitudinal study. Tour. Manag. Perspect. 2021, 38, 100804. [Google Scholar] [CrossRef]
- Weaven, S.; Quach, S.; Thaichon, P.; Frazer, L.; Billot, K.; Grace, D. Surviving an economic downturn: Dynamic capabilities of SMEs. J. Bus. Res. 2021, 128, 109–123. [Google Scholar] [CrossRef]
- Klein, V.B.; Todesco, J.L. COVID-19 crisis and SMEs responses: The role of digital transformation. Knowl. Process Manag. 2021, 28, 117–133. [Google Scholar] [CrossRef]
- Miocevic, D. Don’t get too emotional: How regulatory focus can condition the influence of top managers’ negative emotions on SME responses to economic crisis. Int. Small Bus. J. 2022, 40, 130–149. [Google Scholar] [CrossRef]
- Clauss, T.; Breier, M.; Kraus, S.; Durst, S.; Mahto, R.V. Temporary business model innovation—SMEs’ innovation response to the COVID-19 crisis. RD Manag. 2022, 52, 294–312. [Google Scholar] [CrossRef]
- Saniuk, S.; Grabowska, S.; Gajdzik, B. The State of SME Enterprises in the Face of the Crisis Caused by the Covid-19 Epidemic. In Cyber-Physical Systems; CRC Press: Boca Raton, FL, USA, 2022; pp. 42–52. [Google Scholar]
- Campagnolo, D.; Gianecchini, M.; Gubitta, P.; Leonelli, S.; Tognazzo, A. SMEs facing crisis: Ideal response or equifinal reactions? In Business under Crisis Volume I: Palgrave Studies in Cross-Disciplinary Business Research, in Association with EuroMed Academy of Business; Palgrave Macmillan: Cham, Switzerland, 2022; p. 63. [Google Scholar]
- Schepers, J.; Vandekerkhof, P.; Dillen, Y. The Impact of the COVID-19 Crisis on Growth-Oriented SMEs: Building Entrepreneurial Resilience. Sustainability 2021, 13, 9296. [Google Scholar] [CrossRef]
- Zighan, S.; Ruel, S. SMEs’ resilience from continuous improvement lenses. J. Entrep. Emerg. Econ. 2021; ahead-of-print. [Google Scholar] [CrossRef]
- Zighan, S.; Abualqumboz, M.; Dwaikat, N.; Alkalha, Z. The role of entrepreneurial orientation in developing SMEs resilience capabilities throughout COVID-19. Int. J. Entrep. Innov. 2021, 14657503211046849. [Google Scholar] [CrossRef]
- Khatib, S.F.; Nour, A.N.I. The impact of corporate governance on firm performance during the COVID-19 pandemic: Evidence from Malaysia. J. Asian Financ. Econ. Bus. 2021, 8, 0943–0952. [Google Scholar]
- Almashhadani, M.; Almashhadani, A.A. Corporation Performance and Corporate Governance System: An argument. Int. J. Bus. Manag. Invent. 2022, 11, 13–18. [Google Scholar]
- Hu, S.; Zhang, Y. COVID-19 pandemic and firm performance: Cross-country evidence. Int. Rev. Econ. Financ. 2021, 74, 365–372. [Google Scholar] [CrossRef]
- Kowalewski, O. Corporate governance and corporate performance: Financial crisis (2008). Manag. Res. Rev. 2016, 39, 1494–1515. [Google Scholar] [CrossRef]
- Grözinger, A.C.; Wolff, S.; Ruf, P.J.; Moog, P. The power of shared positivity: Organizational psychological capital and firm performance during exogenous crises. Small Bus. Econ. 2022, 58, 689–716. [Google Scholar] [CrossRef]
- Miocevic, D. Investigating strategic responses of SMEs during COVID-19 pandemic: A cognitive appraisal perspective. BRQ Bus. Res. Q. 2021, 23409444211005779. [Google Scholar] [CrossRef]
- Huang, G.; Zhong, S.; Wong, I.A.; Lin, Z. Evolutionary selection for travel agencies under COVID-19 adversity through the lens of life history theory. J. Travel Tour. Mark. 2021, 38, 917–934. [Google Scholar] [CrossRef]
- Surís-Regueiro, J.C.; Santiago, J.L.; González-Martínez, X.M.; Garza-Gil, M.D. Estimating economic impacts linked to Marine Spatial Planning with input-output techniques. Application to three case studies. Mar. Policy 2021, 129, 104541. [Google Scholar] [CrossRef]
- Morrissey, K.; O’Donoghue, C. The role of the marine sector in the Irish national economy: An input–output analysis. Mar. Policy 2013, 37, 230–238. [Google Scholar] [CrossRef]
- Pugh, D.T.; Bridge, E.; Edwards, R.; Hogarth, P.; Westbrook, G.; Woodworth, P.L.; McCarthy, G.D. Mean sea level and tidal change in Ireland since 1842: A case study of Cork. Ocean. Sci. 2021, 17, 1623–1637. [Google Scholar] [CrossRef]
- Medda, F.; Trujillo, L. Short-sea shipping: An analysis of its determinants. Marit. Policy Manag. 2010, 37, 285–303. [Google Scholar] [CrossRef]
- CEET—Centro de Estudios Economicos Tomillo; MSI y Camara de Comercio de Malloca. Impacto Economico de la n Autica de Recreo en España y Propuestas para su Crecimiento, MYBA, ANEN, AEGY y AENB. Madrid. 2012. [Google Scholar]
- Ferreira, A.M.; Soares, C.G.; Salvador, R. Features of the maritime clusters of the Atlantic Arc. In Proceedings of the Maritime Technology and Engineering-Proceedings of MARTECH 2014: 2nd International Conference on Maritime Technology and Engineering, Lisbon, Portugal, 15–17 October 2014; Volume 1, pp. 141–147. [Google Scholar]
- Christensen, C.P.; Shen, Y.; Kokkranikal, J.; Morrison, A.M. Understanding British and Danish sailing tourism markets: An analysis based on Kano’s Evaluation Matrix. Tour. Recreat. Res. 2021; in press. [Google Scholar] [CrossRef]
- Alempijević, A.; Kovačić, M. Nautical Tourism and Small Shipbuilding as Significant part of Blue Economy Development. Pomor. Zb. 2019, 57, 97–110. [Google Scholar] [CrossRef]
- Van Putten, I.E.; Quillérou, E.; Guyader, O. How constrained? Entry into the French Atlantic fishery through second-hand vessel purchase. Ocean. Coast. Manag. 2012, 69, 50–57. [Google Scholar] [CrossRef]
- Deschryvere, M.; Mikkola, M.; Conn, S. On the structural barriers to public innovation support for SMEs and the opportunity COVID-19 can offer to overcome these barriers. J. Innov. Manag. 2020, 8, 16–25. [Google Scholar] [CrossRef]
- Santos, E.; Lisboa, I.; Crespo, C.; Moreira, J.; Eugenio, T. Evaluating Economic Sustainability of Nautical Tourism through Brand Equity and Corporate Performance. In Transcending Borders in Tourism through Innovation and Cultural Heritage; Springer: Cham, Switzerland, 2022; pp. 105–118. [Google Scholar]
- Gössling, S.; Hall, C.M.; Scott, D. Coastal and ocean tourism. In Handbook on Marine Environment Protection; Springer: Cham, Switzerland, 2018; pp. 773–790. [Google Scholar]
- Alcover, A.; Alemany, M.; Jacob, M.; Payeras, M.; García, A.; Martínez-Ribes, L. The economic impact of yacht charter tourism on the Balearic economy. Tour. Econ. 2011, 17, 625–638. [Google Scholar] [CrossRef]
- Ivanić, K.; Hadžić, A.P.; Mohović, Đ. Nautical tourism: Generator of Croatian economy development. Pomorstvo 2018, 32, 59–66. [Google Scholar] [CrossRef]
- Chapapría, V.E. El planeamiento de infraestructuras para el turismo náutico. Cuad. Tur. 2000, 6, 29–44. [Google Scholar]
- Li, L.; Wu, B.; Patwary, A.K. How marine tourism promote financial development in sustainable economy: New evidence from South Asia and implications to future tourism students. Environ. Sci. Pollut. Res. 2022, 29, 1155–1172. [Google Scholar] [CrossRef] [PubMed]
- Duarte, I.N.D.S. As Motivações do Turista para a Prática de Turismo Náutico na Região Centro de Portugal. Ph.D. Thesis, Instituto Politécnico de Viseu, Viseu, Portugal, 2017. Available online: https://repositorio.ipv.pt/bitstream/10400.19/4734/1/As%20motiva%C3%A7%C3%B5es%20do%20turista%20para%20a%20pr%C3%A1tica%20de%20Turismo%20Na%C3%BAtico%20na%20Regi%C3%A3o%20Centro%20de%20Portugal.pdf (accessed on 30 April 2022).
- Santana-Talavera, A.; Díaz Rodríguez, P.; Rodríguez Darias, A.J. Questioning Tourist Typologies: The Case of Fuerteventura Biosphere Reserve. New Tourism in the 21st Century. Culture, the City, Nature and Spirituality; Cambridge Scholars Publising: Newcastle, UK, 2014; pp. 74–105. [Google Scholar]
- Froelich, P. Private Yacht Vacations Are on the Rise—And They May Not Be as Expensive as You Think. 2020. Available online: https://www.travelandleisure.com/travel-news/coronavirus-privateyacht (accessed on 30 April 2022).
- Sevinç, F.; Güzel, T. Sustainable Yacht Tourism Practices. Manag. Mark. J. 2017, 15, 61–76. [Google Scholar]
- Baumann, J.; Kritikos, A.S. The link between R&D, innovation and productivity: Are micro firms different? Res. Policy 2016, 45, 1263–1274. [Google Scholar]
- Jin, X.; Ke, Y.; Chen, X. Credit pricing for financing of small and micro enterprises under government credit enhancement: Leverage effect or credit constraint effect. J. Bus. Res. 2022, 138, 185–192. [Google Scholar] [CrossRef]
- Sharma, A.; Arora, S. The Effect of COVID-19 Pandemic on Tourism and Hospitality Industry—A Review. COVID-19 and the Tourism Industry, 1st ed.; Sustainability, Resilience and New Directions; Sharma, A., Hassan, A., Mohanty, P., Eds.; Routledge: London, UK, 2022; pp. 58–69. ISBN 9781003207467. [Google Scholar]
- Van Tatenhove, J.P. COVID-19 and European maritime futures: Different pathways to deal with the pandemic. Marit. Stud. 2021, 20, 63–74. [Google Scholar] [CrossRef]
- Kyvelou, S.S.I.; Ierapetritis, D.G. Fostering spatial efficiency in the marine space, in a socially sustainable way: Lessons learnt from a soft multi-use assessment in the Mediterranean. Front. Mar. Sci. 2021, 8, 613721. [Google Scholar] [CrossRef]
- Blanco, F.; Sachdeva, N. The Cyclicality of IFC Investments; Policy Research Working Paper; No. 9746; World Bank: Washington, DC, USA, 2021. [Google Scholar]
- Rodionov, D.G.; Konnikov, E.A.; Nasrutdinov, M.N. A Transformation of the Approach to Evaluating a Region’s Investment Attractiveness as a Consequence of the COVID-19 Pandemic. Economies 2021, 9, 59. [Google Scholar] [CrossRef]
- Andrades, L.; Dimanche, F. Destination competitiveness in Russia: Tourism professionals’ skills and competences. Int. J. Contemp. Hosp. Manag. 2019, 31, 910–930. [Google Scholar] [CrossRef]
- Maráková, V.; Medveďová, M. Applicaton of Innovations in Tourism Destinations. In Forum Scientiae Oeconomia; WSB University: Poznań, Poland, 2016; Volume 4, pp. 33–43. [Google Scholar]
- Havierniková, K.; Lemańska-Majdzik, A.; Mura, L. Advantages and disadvantages of the participation of SMEs in tourism clusters. J. Environ. Manag. Tour. 2017, 8, 1205–1215. [Google Scholar]
- Krugman, P. Competitiveness: A dangerous obsession. Foreign Aff. 1994, 73, 28. [Google Scholar] [CrossRef]
- Kovačić, M.; Horvat, M. Environment Pollution in Croatia as a Consequence of Nautical Ports Development. Pomor. Zb. 2021, 61, 9–20. [Google Scholar] [CrossRef]
- Lewandowska, A. Interactions between investments in innovation and SME competitiveness in the peripheral regions. J. Int. Stud. 2021, 14, 285–307. [Google Scholar] [CrossRef]
- Lopes, E.R.; Simões, J.; Simões, J.T.; Rosa, M.; Silva, J.; Santos, J.; Rego, C. Sustainable Management of Cultural and Nautical Tourism: Cultural and Tourist Enhancement Narrative (S). J. Tour. Herit. Res. 2022, 5, 203–216. [Google Scholar]
Figure 1.
Competitiveness indicators (average) between countries, 2016–2020.


Table 1.
Basic statistics, 2016–2020. N = 145.
| Variable | Mean | Std. Debt | Min | Max |
|---|---|---|---|---|
| product | 1825.96 | 7044.65 | 13.33 | 35,460.09 |
| inv | 210.83 | 971.48 | −2664 | 5075 |
| empl | 0.64 | 5.48 | −23 | 14 |
| mshare | 39.58 | 39.86 | 0.13 | 100 |
| medsh | 36.71 | 33.97 | 0.96 | 100 |
| medprod | 3464.49 | 6300.15 | 30.76 | 17,784.76 |
| medempl | 0.17 | 3.28 | −10 | 7 |
| medinv | 72.90 | 138.84 | −235 | 924 |
Notes. Calculations on Stata 17.0. Prod is labor productivity; inv is investment; employment rate is proxy for talent retention; mshare is the market share; medsh, medprod, and medempl are the means of market share, productivity, and talent retention by country and year, respectively.
Table 2.
Characteristics (averages) of companies by country, 2016–2020.
| Country | No. Firms | No. Employees | Turnover | Capital1 | Investment |
|---|---|---|---|---|---|
| Portugal | 2 | 17 | 861 | 17 | −104 |
| Spain | 16 | 20 | 2812 | 20 | 296 |
| France | 1 | 25 | 4702 | 25 | 176 |
| R. United | 8 | 19 | 319,791 | 19 | 172 |
| Ireland | 2 | 19 | 2177 | 18 | −20 |
Notes. Net capital calculated as the difference between tangible assets and depreciation. Values of turnover, capital, and investment are in Th. USD. Source: own calculations in Stata 17.0.
Table 3.
Correlation matrix.
| medsh | medprod | medempl | medinv | |
|---|---|---|---|---|
| medsh | 1.0000 | |||
| medprod | 0.3723 * | 1.0000 | ||
| (0.0000) | ||||
| medempl | 0.1801 * | 0.2043 * | 1.0000 | |
| (0.0552) | (0.0292) | |||
| medinv | 0.3049 * | 0.0723 * | 0.1213 * | 1.0000 |
| (0.0010) | (0.4446) | (0.1985) |
Notes. Statistical significance at the 5% level is denoted with *. Calculations on Stata 17.0, medsh, medprod, medempl, and medinv are the medians of market share, productivity, talent retention, and investment by country and year, respectively. p-values are between parentheses.
Table 4.
Evolution of investment and competitiveness in the Atlantic Area in 2020.
| Country | Investment | Market Share | Productivity | Talent Retention | Competitiveness | Relationship |
|---|---|---|---|---|---|---|
| Portugal | − | − | − | − | − | + |
| Spain | − | − | − | − | − | + |
| France | + | − | + | + | + | + |
| United Kingdom | + | + | − | − | − | − |
| Ireland | + | = | + | + | + | + |
Notes. + and − denote increases and decreases in 2020 relative to the previous year, respectively. The sign = stands for constant evolution. The column of competitiveness shows the sign of the 3 indicators, whereas Relationship denotes the sign of the relationship between investment and competitiveness. Source: own calculations in Stata 17.0.
Publisher’s Note: MDPI stays neutral with regard to jurisdictional claims in published maps and institutional affiliations. |
© 2022 by the authors. Licensee MDPI, Basel, Switzerland. This article is an open access article distributed under the terms and conditions of the Creative Commons Attribution (CC BY) license (https://creativecommons.org/licenses/by/4.0/).
Share and Cite
MDPI and ACS Style
Santos, E.; Castanho, R.A.; Meyer, D. Is Investment Contributing to Competitiveness in Nautical Tourism in the Atlantic Area? Water 2022, 14, 2964. https://doi.org/10.3390/w14192964
AMA Style
Santos E, Castanho RA, Meyer D. Is Investment Contributing to Competitiveness in Nautical Tourism in the Atlantic Area? Water. 2022; 14(19):2964. https://doi.org/10.3390/w14192964
Chicago/Turabian StyleSantos, Eleonora, Rui Alexandre Castanho, and Daniel Meyer. 2022. "Is Investment Contributing to Competitiveness in Nautical Tourism in the Atlantic Area?" Water 14, no. 19: 2964. https://doi.org/10.3390/w14192964
Note that from the first issue of 2016, this journal uses article numbers instead of page numbers. See further details here.