
Nutrient Dynamics and Ecosystem Metabolism of Megacity Rivers: Influence of Elevated Nutrient Concentrations in Beijing’s Waterways

Department of Geography, King’s College London, 40 Bush House (Northeast Wing), Aldwych, London WC2B 4BG, UK
*
Author to whom correspondence should be addressed.
Water 2022, 14(19), 2963; https://doi.org/10.3390/w14192963
Submission received: 5 September 2022
/
Revised: 15 September 2022
/
Accepted: 18 September 2022
/
Published: 21 September 2022
(This article belongs to the Section Water Quality and Contamination)
Abstract
:This study evaluated nutrient flux (nitrate (NO3−), ammonium (NH4+), phosphate (PO43−), and dissolved organic carbon (DOC) at the sediment-water interface and river ecosystem metabolism (REM) to investigate how these ecological functions vary in Beijing’s urban waterways. Three tributaries of the River Beiyun were selected. Water quality varied across the study sites as each receives a mixture of wastewater treatment plant (WWTP) effluents and tributary inflows. A chamber technique was applied where water-specific nutrient concentrations were measured at two exposure times (3 and 10 min). Under the actions of physical and biological processes, NO3− and NH4+ flux was primarily controlled by equilibrium concentration and the N-cycle. However, bioabsorption appeared to regulate DOC flux. Specifically, NO3− flux ranged from −0.31 to +0.30 mg/(m2·s), NH4+ was −0.01 to +0.05 mg/(m2·s), PO43− was −0.01 to +0.01 mg/(m2·s), DOC was −0.04 to +0.13 mg/(m2·s). We applied the nighttime slope regression to estimate gross primary production (GPP) and ecosystem respiration (ER). Except in summer, net ecosystem production (GPP+ER) less than 0 indicated heterotrophic study reaches. Structural equation modelling revealed that nutrient dynamics and water temperature were the primary factors driving REM. Our study provides the needed systems-based understanding of vital ecological processes to improve in-stream management.
1. Introduction
Available nitrogen (N) and phosphorus (P) are important nutrients supporting aquatic life activities [1,2]. It is well known that excessive N and P cause eutrophication and subsequent water quality problems, such as hypoxia, which is a threat faced by urban rivers in most parts of the world [3,4,5]. Therefore, understanding the dynamics of N and P is an important component of aquatic conservation and ecology research [6,7,8]. In urban rivers, N and P are regarded as major pollution stressors and reach urban waterways via multiple sources [9,10,11]. For example, vehicle exhaust and atmospheric deposition [12,13], urban impervious surface [14,15], and wastewater treatment plant (WWTP) effluents [16,17] all can contribute to elevated N or P in urban rivers. The impairment of water quality and ecological function caused by excessive nutrients in urban rivers is the core concept of the Urban Stream Syndrome (USS) which provides a framework for evaluating responses to urbanization [4,18,19,20,21].
Dissolved organic carbon (DOC) is also an important indicator of river water quality [22]. Excessive DOC is a major source of organic pollution [23], while also being involved in important ecological processes, for example, it provides electrons for biogeochemical processes (e.g., denitrification) and serves as an energy source and respiratory substrate for many aquatic organisms [24,25]. The sources of DOC in urban rivers include both natural and anthropogenic processes. These can include riparian soil erosion, organic matter discharged by human activities, WWTP effluents, and biological residues produced as a result of photosynthetic processes of aquatic vegetation [26,27,28].
As an important part of river ecosystems, river sediments play a key role in nutrient dynamics and water quality and can serve as both a source and sink of nutrients [16,29,30]. The uptake and/or regeneration of nutrients by sediments depend on a variety of influencing factors, making river ecological protection more challenging. Nitrate (NO3−) and ammonium (NH4+) are the main forms of nitrogen in sediments [31,32], and their fluxes are primarily controlled by equilibrium concentration at the sediment-water interface and nitrogen form transformation within the N-cycle [29,33,34], including nitrification, denitrification, dissimilatory nitrate reduction to ammonium (DNRA), mineralization and anammox. These processes are mainly performed by microorganisms such as nitrifying bacteria and denitrifying bacteria, which are affected by a range of factors including water temperature, dissolved oxygen (DO) and associated microbial activity [35,36]. Phosphate (PO43−) is another macronutrient required by aquatic organisms [37]. PO43− flux is related to the adsorption of sediment minerals, for example, iron insoluble compounds can adsorb a large amount of PO43− under oxidation conditions [38,39,40,41], resulting in the uptake flux of PO43−. In the river restoration practice, alum is often added to water to promote PO43− adsorption [42,43,44,45]. Additionally, it has been demonstrated that sediment particle size plays an important role in PO43− flux, such as PO43− release caused by resuspension of fine sediment particles [46,47,48,49,50]. Dissolved organic carbon (DOC) can be an important carbon source in rivers to support biological activities which can regulate fluxes. Furthermore, some studies have found that anions in DOC and PO43− compete for adsorption sites, which can affect the rates of both fluxes [51,52].
Nutrient supply affects aquatic bioactivity, which in turn affects gross primary production (GPP) and ecosystem respiration (ER). They are important processes of river ecosystem metabolism (REM) and regulate nutrient and energy flow [53,54]. The difference between GPP and ER indicates the overall carbon budget in river ecosystems, it is therefore referred to as net ecosystem production (NEP) [55]. Use of NEP can be used to determine autotrophic or heterotrophic conditions (e.g., [56,57,58]). A wide range of environmental factors affects both GPP and ER, primarily including light availability [55,59,60,61], water temperature [62,63,64], aquatic species composition [25,65,66] and nutrient supply, notably stressors associated with the USS [35,67]. Overall, considering complex interactions among hydrology, climate, chemistry, and biology, REM has direct implications for water quality and is an excellent functional indicator of ecological response to environmental change [66,68,69,70]. Measurement of REM, therefore, helps to understand the responses of urban river ecosystems to a range of disturbances [53,54,57].
Urban rivers are unfortunately characterized by nutrient enrichment, and there are many studies on elevated concentrations in urban rivers (e.g., [71,72,73]). There are, however, relatively few studies that have integrated ecological processes that incorporate nutrient fluxes and their involvement in river metabolism [66,74]. Further, as a megacity, Beijing’s waterways have experienced multiple nutrient sources and increased nutrient concentrations, resulting in significant changes in river ecological processes [75,76]. In our study, three urban tributaries of the River Beiyun, Beijing, China, provide us with natural conditions with elevated nutrient concentrations to examine river ecological processes. We aim to answer the following questions: (1) How do nutrient dynamics at the sediment-water interface (e.g., concentrations and fluxes of NO3−, NH4+, PO43− and DOC) and metabolic processes vary between rivers and between sites on the same river? (2) What are the seasonal characteristics of nutrient dynamics and metabolic processes? (3) Are there relationships among nutrient dynamics and river metabolism? (4) What are the potential drivers of these ecological processes?
2. Materials and Methods
2.1. Study Area
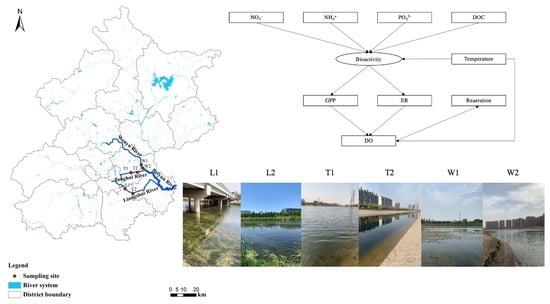
The River Beiyun is an important river in North China with 56% urban land cover, supporting 72% of Beijing’s population [77]. The air temperatures range from −5–26 °C throughout the year and the mean annual precipitation is 440 mm [78]. Three urbanized tributaries were selected in this study (River Liangshui, River Tonghui and River Wenyu) which are WWTP discharge channels for Beijing ([77]; Figure 1). The effluent standard is based on the “Pollutant Discharge Standards for Urban Wastewater Treatment Plants in China (DB11/890-2012)”, including TN at 15 mg/L, TP at 0.3 mg/L, ammonium (NH4-N) at 1.5 mg/L, biological oxygen demand (BOD) at 6 mg/L, chemical oxygen demand (COD) at 30 mg/L and solids suspended (SS) at 5 mg/L (http://sthjj.beijing.gov.cn, accessed on 29 June 2012). Two study sites were selected on each river, and and their locations were determined by sampling accessibility. These sites were named according to the initials of the river name (i.e., L1, L2, T1, T2, W1, W2), where 1 and 2 represent upstream and downstream sites (relative location towards to the River Beiyun) respectively.
The River Liangshui is 68 km long with a catchment area of 605.7 km2 [79]. The distance between the two sites L1 and L2 was 10 km, of which L1 is located at the effluent outlet from the Xiaohongmen WWTP, which serves 2,415,000 people with a mean daily wastewater treatment of 616,000 m3 (https://www.dowater.com, accessed on 24 September 2014). The water depth at L1 is 0.2–0.4 m and the channel width is 15 m. The water depth at L2 is 0.3–0.6 m and the channel width is 30 m.
The River Tonghui is 20 km long with a catchment area of 258.26 km2 [80]. The distance between the two sampling sites T1 and T2 is 6 km, of which T1 is located in an urban reservoir formed by the effluent from the Gaobeidian WWTP, which serves 2,400,000 people with a mean daily wastewater treatment of 1,000,000 m3 (https://www.dowater.com, accessed on 7 June 2008) and is used for industrial and agricultural irrigation water. The water depth at T1 is 0.2–0.3 m and the channel width is 100 m. The water depth at T2 is 0.4–0.7 m and the channel width is 10 m. As a reservoir, T1 is bottomed with cement attaching a large amount of aquatic vegetation, a small amount of sediment and smaller phytoplankton; abundant larger phytoplankton is observed in the channel at T2.
The River Wenyu is 48 km long with a catchment area of 4300 km2 [81]. The two sites W1 and W2 with a distance of 2 km are located in the downstream area of the River Wenyu, of which W2 is only 1.5 km away from the main river—River Beiyun. Such a close distance from the main river causes the water quality of this reach to have a direct impact on the water environment of the River Beiyun. The River Ba, a tributary of the River Wenyu, flows into the river between the two sites, containing TN at 2 mg/L, TP at 0.4 mg/L, NH4-N at 2 mg/L, BOD at 10 mg/L, COD at 40 mg/L [82], resulting in the difference of water quality between the two sites. The water depth at W1 is 0.3–0.6 m and the channel width is 200 m. The water depth at W2 is 0.4–0.8 m and the channel width is 150 m. Higher water depths were often observed in the rainy season (i.e., summer).
2.2. Sample Collection
River and sediment samples were collected seasonally from September 2020 to August 2021 (autumn from September to October; winter from November to February; spring from March to May; summer from June to August) only at times of stable discharge. In total, 8 sampling events occurred in each season (Table S1). Water pH, water temperature and DO concentration were measured on-site using a multiparameter probe (Hanna HI98194 multiparameter meter). Water samples were taken within 15 cm below the water surface at each site, and a composite 500 mL sample was collected for laboratory testing. The sampling locations for sediments were the same as those for water samples. Ten patches per 10 cm2 of the riverbed were randomly selected and a total of 200 mL of sediments (top 2 cm) were collected with a stainless-steel scoop. Water and sediment samples were stored cool separately during transport to the laboratory.
2.3. Concentration Measurement of NO3−, NH4+, PO43−, DOC
NO3− and NH4+ concentrations were measured in the field by portable concentration measuring probes (Vernier Go Direct, Beaverton, OR, USA). The PO43− concentration was measured by ion chromatography (IC, Dionex Aquion, Thermo Fisher Scientific, Waltham, MA, USA). The DOC concentration was measured by a total organic carbon (TOC) analyzer (TOC-L, SHIMADZU, Kyoto, Japan). A series of concentration gradient standards were prepared to periodically calibrate the instrument. Water samples were passed through 0.45 μm membrane filters before IC and TOC measurements.
2.4. Flux Measurement of NO3−, NH4+, PO43−, DOC
Flux experiments were run in September and November 2020 and March and June 2021 (Table S2). In the laboratory, to simulate the sediment-water interface, 20 mL of wet surface sediment and 150 mL of overlying water were mixed into a 500 mL chamber, which was scaled up by the nitrate flux experiment by [29]. At 2.5 min after mixing, the particle settlement was visualized. Experiments were run for 3 min and 10 min after mixing to measure the concentrations of NO3−, NH4+, PO43−, and DOC to represent the process related to both physical disturbance and biological action [29]. We consider that water extraction at t = 3 min would centrally represent physical disturbances, while the experiment where water was extracted at t = 10 min represented a mix of processes. All experiments were run with 3 replicates. A DO logger (PME MiniDot oxygen logger) was also used to continuously measure the DO concentration in the overlying water during two exposures (0–3 min, 3–10 min).
Nutrient fluxes were derived from Equation (1):
where C1 and C2 refer to the nutrient concentration at times t1 and t2, respectively; V is the volume of the overlying water (L); A is the surface area of the sediment surface (m2); t2 − t1 is the time (s) between the subsequent (t2) and previous (t1) water extraction. Fluxes are expressed as mg/(m2·s). A positive flux indicates movement from sediments to the overlying water and a negative flux indicates movement from the overlying water to the sediment.
During the summer flux experiment, we conducted an additional experiment to further verify the contribution of microbial action to the flux. During the 0–3 min exposure, experimental 3 replicates were run where we added 1 mL of 1 mg/L of zinc chloride with lethal effect on microorganisms [83]. Subsequently, flux was compared to experiments without zinc chloride (Table S3).
2.5. Equilibrium Flux of NO3−, NH4+, PO43−, DOC
The following nutrient standard solutions were configured: NO3− standard solution with concentration gradient of 10–50 mg/L with sodium nitrate; NH4+ standard solution with concentration gradient of 0.5–2.0 mg/L with ammonium chloride; PO43− standard solution with concentration gradient of 0.5–3.0 mg/L with monopotassium phosphate; DOC standard solution with concentration gradient of 5–20 mg/L with potassium biphthalate (Table S4). In each 500 mL chamber, 20 mL of wet surface sediment was weighed before adding to the chamber, and then 150 mL of standard solution with the above concentration gradient was added. Nutrient concentrations of the overlying solution were measured at t = 3 min. The amount of nutrients released/absorbed by sediments was derived from Equation (2):
where Q is the amount of nutrient released/adsorbed by sediment per unit weight (mg/g); V is the volume of overlying standard solution; W is the weight of wet surface sediment. A positive Q represents the amount of nutrients absorbed by sediment; a negative Q represents the amount of nutrients released from sediment to the overlying standard solution.
Taking the concentration C0 of the standard solution as the independent variable and Q as the dependent variable, the linear equation Q−C was established for each nutrient (Table S4). When Q = 0, it indicates that the uptake and regeneration flux of nutrients reach equilibrium, and the corresponding nutrient concentration is the equilibrium concentration at the sediment-water interface.
2.6. Sediment Analysis
We collected an additional 150 mL of sediment samples at each sampling site, and loss on ignition [84] was used to quantify sediment organic matter content (OM%). Crucibles were placed in a 120 °C drying oven for 48 h, then their net weights were weighed (m0). The sediments from each site were divided into 3 equal replicates, spread evenly in a tin foil tray, and dried with crucibles for 48 h. After drying and cooling to room temperature, samples were sieved into coarse sediment and fine sediment using a 2 mm pore size sieve. The coarse and fine sediments were respectively placed in dried crucibles, and the total weight (m1) of each was measured. m0 was subtracted from m1 to obtain the sediment dry weight (m2). The crucibles containing the sediment were placed in an oven at 550 °C and burned for 2 h, then placed in a desiccator and cooled to room temperature at which point the weight of each (m3) was measured (Table S5).
The sediment organic content was derived from Equation (3):
where m1 is the total weight before burning in the oven; m2 is sediment dry weight; m3 is the total weight after burning in the oven. The grain size of the above fine sediment was measured across all sites using Malvern Mastersizer 2000 Granulometer, which was repeated three times for each site. Samples were classified as either sand (0.063–2 mm), silt (0.004–0.063 mm), or clay (<0.004 mm) [85].
2.7. Measurement of DO and Water Temperature
Under the condition of stable river discharge, lab-calibrated MiniDOT loggers were used to continuously monitor DO concentrations and water temperature across all study sites in September and November 2020 and March and June 2021. DO loggers were placed on the riverbed and measured for 24 h at each site (Table S6). The data collection frequency was set to measure once every 5 min.
2.8. GPP, ER and Reaeration Estimates
We used the open-water, single-station method during stale flows for our REM estimates [55,66,86]. Specifically, the night-time slope modelling (NSM) was applied for GPP, ER and reaeration estimates ([87], Table S7), which is based on the principle of no GPP during nighttime to simplify the oxygen mass balance equation (Equations (4) and (5)) to establish the linear regression between DO change rate and ER. The slope of Equation (4) is the reaeration coefficient k, and the intercept is ER. The nighttime period was selected from the time of sunset to the time when the difference between DO saturation concentration and DO concentration (DO deficit) reached the maximum.
where CDO is DO concentration (mg/L); CDOs is DO saturated concentration (mg/L); k is reaeration coefficient (d−1); k(CDOs-CDO) is reaeration rate (mg·L−1·d−1).
CDOs was derived from Equation (6):
where T is mean water temperature (K).
The ER obtained by Equation (5) requires temperature correction (Equation (7)), which is related to Arrhenius activation energy Ea, (i.e., energy required for respiration of aquatic organisms, [88]). The calculated ER was used to obtain GPP in Equation (4).
where θR = 0.077, the correction coefficient; Ea is Arrhenius activation energy (eV).
The temperature-corrected ER was derived from Equation (8):
The temperature-corrected GPP was derived from Equation (9):
where θP = 1.066, the correction coefficient.
The temperature corrected reaeration rate was derived from Equation (10):
where θa = 1.024, the correction coefficient.
2.9. Metabolism Data Standardization
The following equations were applied to convert the values of GPP and ER into the absorption rate or release rate of CO2 [57]:
where PQ is the photosynthetic quotient (the number of moles of O2 released per mole of CO2 incorporated) = 1.2; RQ is the respiratory quotient (the number of moles of CO2 released per mole of O2 consumed) = 0.85; the term ‘12/32’ is the ratio of the atomic mass of C to the molecular mass of O2.
2.10. Structural Equation Modelling
We established pathways for structural equation modelling (SEM) [89] to investigate the effect of environmental and water quality related factors on the REM (Figure 2). Arrows point to the affected factors, boxes represent variables measured in the experiment, and ovals represent latent variables that were not measured. The evaluation indexes of model fitting are provided in Table S8b. The SEM was performed in SPSS 21.0 AMOS.
2.11. Data Analysis
For the study of nutrient dynamics, we sought to evaluate nutrient concentrations and flux differences both among our study sites and between the time exposure experiments. To accomplish this, we used a two-way analysis of variance for each measured water chemistry variable and parameter-specific flux estimates. Regarding the study of river metabolism, we used one-way analysis of variance for each estimated metabolic variable to evaluate the temporospatial differences of REM across study rivers. For the analysis of significant differences between non-normally distributed data, we used non-parametric tests (i.e., Games-Howell). For normally distributed data, a paired t-test was used. Additionally, to explore overall relationships among water chemistry, flux values and metabolic estimates, we examined correlations (i.e., Spearman for non-normally distributed data; Pearson for distributed data) across these parameters. All statistics were performed in SPSS 26.0.
3. Results
3.1. Nutrient Dynamics in Urban River Ecosystems
3.1.1. Water Quality of Study Rivers
Nitrate: During the study period, there were significant differences in NO3− concentrations among the three rivers (F = 12.737, p < 0.001) and a negative correlation between NO3− and NH4+ concentrations was observed (r2 = −0.557, p < 0.001). Specifically, the concentrations at relative downstream sites were significantly higher than at upstream sites across rivers (p < 0.001, Figure 3a). The maximum and minimum mean NO3− concentrations appeared at the sites T2 and W1, respectively. Among these rivers, the NO3− concentration in winter was moderately higher than in autumn (p = 0.310) and then decreased continuously in spring (p < 0.001) and summer (p < 0.001). Overall values ranged from 13.8 to 51.9 mg/L (Figure 3b).
Ammonium: During the study period, there were significant differences in NH4+ concentrations among the three rivers (F = 4.760, p = 0.010). The maximum and minimum mean NH4+ concentrations appeared at the sites L1 and W1, respectively. However, no significant difference in the concentration between the two sites of each river was observed (Figure 3a). A positive correlation between NH4+ concentrations and water temperatures was observed (r2 = 0.707, p < 0.001, Table 1), resulting in the lowest concentration in winter and the highest concentration in summer, with a range of 0.3–3.4 mg/L (Figure 3b). There were significant differences in the NH4+ concentration (p < 0.001) and water temperature (p < 0.001) between seasons.
Phosphate: During the study period, there were significant differences in the PO43− concentrations among the three rivers with a range of 0.2–1.5 mg/L (F = 32.916, p < 0.001), and significant differences between the two sites of each river (River Liangshui: p = 0.001; River Tonghui: p = 0.027; River Wenyu: p = 0.038, Figure 3a). The maximum and minimum mean PO43− concentrations appeared at W2 and T1 sites, respectively. A negative correlation between PO43− and DO concentrations were found (r2 = −0.321, p < 0.001), resulting in the highest concentration in winter with the lowest DO. However, the lowest PO43− concentrations were recorded in spring (Figure 3b). There were significant differences in the PO43− concentrations (p < 0.001 from autumn to winter; p < 0.001 from winter to spring; p = 0.023 from spring to summer) and the DO concentrations (p < 0.001 from autumn to winter; p = 0.001 from winter to spring; p < 0.001 from spring to summer) between seasons.
Dissolved organic carbon: During the study period, there was no difference in the DOC concentration among the three rivers with a range of 4.3–16.7 mg/L, and no significant difference in the concertation between the two sites of each river was observed (Figure 3a). The maximum and minimum mean DOC concentrations appeared at L1 and W1, respectively. Among these rivers, the DOC concentration in winter was significantly higher than in autumn (p = 0.014), and then decreased significantly in spring (p < 0.001) but slightly in summer (Figure 3b). Across all sites, DOC was positively correlated with NO3− (r2 = 0.669, p < 0.001) and PO43− (r2 = 0.518, p < 0.001) concentrations and negatively correlated with NH4+ concentrations (r2 = −0.757, p < 0.001).
3.1.2. Sediment Analysis
Sediments used for the flux experiments varied both among sites. Generally, fine sediments (particle size < 2 mm) contained more organic matter than coarse sediments (particle size > 2 mm). Sediments of all sites were mainly composed of silt, with the highest proportion of fine sediment at L2 except in summer, when the highest proportion of fine sediment appeared at W2 (Table S9). Organic matter (OM%) of sediments at all sites was the highest in summer. OM% at T1 and T2 was the lowest in autumn, while at other sites minimum values were observed in winter.
3.1.3. Nutrient Fluxes at the Sediment-Water Interface
Nitrate and ammonium: Across all sites, NO3− fluxes in both exposure periods ranged from −0.31 to +0.30 mg/(m2·s) and NH4+ ranged from −0.01 to +0.05 mg/(m2·s) (Figure 4). There were no significant variations in the NO3− flux between the three rivers, but there were significant differences in flux between the sites on the River Wenyu (p = 0.002). Significant seasonal variations were observed in the River Wenyu (F = 4.129, p = 0.032) but again not for other rivers. No significant spatial differences in the NH4+ flux between the three rivers or between sites on each river were found. NH4+ flux generally presented as regeneration, but no significant seasonal variations were observed among the study rivers. Both NO3− and NH4+ flux rates were slower in the 3–10 min exposure compared with the 0–3 min exposure.
Phosphate: PO43− fluxes in both exposure periods ranged from −0.01 to +0.01 mg/(m2·s) (Figure 5). For the River Liangshui, L2 showed the maximum regeneration flux in autumn and L1 showed the maximum uptake flux in winter, but no overall significant seasonal variations were recorded. The two sites on the River Tonghui only presented regeneration fluxes in the 0–3 min exposure in autumn. Similarly, seasonal variations did not vary significantly. The two sites on the River Wenyu presented uptake fluxes in the 0–3 min exposure in all seasons, but again no significant seasonal variations were observed. Spatially, no significant differences among rivers or between sites on each river were observed.
Dissolved organic carbon: DOC fluxes in both exposure periods ranged from −0.04 to +0.13 mg/(m2·s) (Figure 5). In the 0–3 min exposure, DOC at the sites on the River Liangshui and the River Tonghui was released from sediments except for L1 in autumn. In the 3–10 min exposure, DOC at the sites on the River Wenyu showed uptake flux except for W1 in autumn. The maximum uptake and regeneration fluxes occurred at W2 in winter and at T1 in summer, respectively. There were no overall significant variations in the DOC flux across the three rivers or between the sites on each river. Further, no significant seasonal variations were observed in each river.
DO flux: In both exposures, DO was consumed across all sites with the consumption flux ranging from 0.01 to 0.05 mg/(m2·s) (Figure S1). The DO consumption flux was positively correlated with regeneration fluxes of NH4+ (p < 0.001) and DOC (p < 0.001), but no correlation was observed with NO3− or PO43− flux; only the initial PO43− concentration was positively correlated with PO43− regeneration flux (p = 0.002), indicating that in the overlying water DO and initial nutrient concentrations did not independently affect nutrient fluxes.
When the water-specific nutrient concentration increased/decreased seasonally, an increase in the equilibrium concentration strongly indicated an increase in the sediment-specific nutrient concentration, while a decrease in the equilibrium concentration indicated a decrease in the sediment-specific nutrient concentration (Table S10). When the water-specific nutrient concentration was higher than the sediment-specific concentration, the nutrient showed uptake flux, otherwise, a regeneration flux was observed.
In the summer flux experiment, only a few sites with decreased nutrient fluxes and DO consumption fluxes were observed in the experimental group containing 1 mg/L zinc chloride (Figure S2). There was no significant difference between the experimental group and the control group, indicating that the main factor affecting nutrient flux in the 0–3 min exposure was physical disturbance. This result supports the contention regarding the roles of physical process and biological process during our two experimental exposure periods, respectively.
3.2. Metabolic Patterns of Urban River Ecosystems
3.2.1. DO Profiles among Study Sites
The minimum and maximum mean DO concentrations occurred at all sites in winter and summer, respectively (Figure S3). Significant seasonal differences in DO were observed among the study sites (p < 0.001) except T1, where there was no significant difference between autumn and winter (Table 1). Regarding diurnal DO, the maximum DO concentration occurred between 1 and 5 pm during the four seasons and decreased gradually at night. The DO concentration increased again when the maximum DO deficit was reached. The maximum DO deficit appeared earliest in winter, followed by spring and autumn, and latest in summer.
3.2.2. GPP, ER and NEP Estimates
The minimum mean GPP appeared in winter and decreased from noon; the maximum mean GPP appeared in summer and peaked between 1 and 3 pm (Figure 6). The mean GPP in autumn was higher than in spring except for T2, while the maximum GPP at T2 in autumn was higher than spring values. Compared with autumn, GPP at L2 and T2 decreased significantly in winter (L2: p = 0.011; T2: p = 0.028) then increased significantly in spring (L2: p = 0.048; T2: p = 0.020); GPP at W2 increased significantly from spring to summer (p = 0.044). However, no significant differences were observed in GPP for all rivers spatially.
ER among the three rivers was the lowest in winter and the highest in autumn except for W1, where the highest ER was observed in summer (Figure 7). Significant seasonal variations at all sites were recorded from autumn to spring (p < 0.001, except p = 0.006 for W2 from winter to spring); in summer, ER at L1, T2 and W1 still increased significantly (p < 0.001). Different from GPP, significant differences in ER were observed between the two sites of each river (p < 0.001, except River Tonghui and River Wenyu in spring). Further, significant spatial differences in ER were also observed across the three rivers except River Liangshui and River Tonghui in winter (p = 0.002 between River Tonghui and River Wenyu in summer; p < 0.001 among the three rivers in other seasons). There was a positive correlation between GPP and ER across the three rivers during the study period (r2 = 0.462, p < 0.001).
In each season, NEP decreased to the lowest value within one hour after sunset and then gradually increased (Figure 8). The maximum mean NEP across all sites appeared in summer and reached the peak between 10 am–2 pm. The minimum NEP at L1 was observed in spring, while the minimum values of other sites appeared in autumn when diurnal NEP peaked between 10 am–12 pm. The summertime positive mean NEP indicated that these river ecosystems were overall sinks of atmospheric CO2. For these periods mean absorption rates ranged from 1.6 to 12.7 gCO2/(m3·d). At other times, the mean NEP values were negative indicating these sites were sources of CO2 with the mean release rate ranging from 2.2 to 16.0 gCO2/(m3·d). The springtime NEP in the River Tonghui was significantly different from the River Liangshui (p = 0.006) and the River Wenyu (p < 0.001). Also, there was a significant difference between the two sites of the River Liangshui in spring (p = 0.005).
3.2.3. Reaeration and Activation Energy Estimates
In each season, the maximum reaeration rate across all sites appeared within one hour before sunrise and gradually decreased with DO accumulation in the GPP process during the daytime (Figure S4). The seasonal reaeration rates were the lowest in summer among all sites, especially for T2, the negative values indicated river DO saturation. Except L1, the highest reaeration rates were observed in winter. For L1, the lowest NEP in spring contributed to the highest reaeration rate in this season.
Significant seasonal variations in the reaeration rate were observed in all rivers between each season (p = 0.031 for L1 from autumn to winter; p = 0.006 for T1 from spring to summer; p = 0.001 for T2 from autumn to winter; p < 0.001 for other sites in other seasons). In winter and spring, there were significant spatial differences among each river (p < 0.001, except p = 0.007 between River Liangshui and River Wenyu in winter), with the highest mean rate appearing at W2 in winter and L1 in spring, which were 7.8 mgO2/(L·d) and 13.1 mgO2/(L·d), respectively. Across all rivers, significant differences were also observed between each site in summer (p < 0.001).
Among all sites, the activation energy (Ea) required for ecosystem respiration was in the range of 0.54–0.58 eV during the study period. The minimum and maximum mean Ea of each river were recorded in winter and summer respectively and significant temporal differences were observed for all sites and among all seasons (p < 0.001). In terms of the spatial distribution of Ea, similar to ER, significant differences were observed among the three rivers in autumn, spring and summer (p = 0.019 between River Tonghui and River Wenyu in summer; p < 0.001 between other rivers in the three seasons). However, the significant difference in Ea at the two sites on each river was not always observed, especially for the River Wenyu, there was no significant difference in all seasons.
3.2.4. SEM Pathway Analysis
Structural equation model (SEM) revealed the selected effects of environmental and water quality related factors on river ecosystem metabolism. Increased concentrations of NH4+ and PO43− significantly affected bioactivity then increased GPP and ER (Figure 9). Unsurprisingly, water temperature was significantly related to bioactivity which was positively correlated with GPP (r2 = 0.89, p < 0.001) and ER (r2 = 0.58, p = 0.003). Elevated water temperature which reduces the solubility of oxygen was observed as a negative correlation with DO (r2 = −0.90, p = 0.020). ER was negatively correlated with DO concentrations, however, there was not a significant correlation between GPP and DO, suggesting that ER played a key role in consuming DO. Seasonal significant variations of DO determined the reaeration process, resulting in significant seasonal differences in the reaeration rates across all sites being recorded.
4. Discussion
4.1. Nutrient Dynamics across the Sediment-Water Interface
Our results indicated that discharged WWTP effluents and tributaries rich in nutrients resulted in elevated nutrient concentrations and reduced DO concentrations at several sampling sites (i.e., L1, T1, W2; Figure 3). We found that the sediments at T1 and L1 were the largest source and sink of NH4+ in summer, respectively. Further, sites L1 and W2 were the largest source and sink of PO43− in autumn, respectively (Figure 4 and Figure 5). Specifically, we found that the rate and direction of nutrient flux at the sediment-water interface were affected by nutrient equilibrium concentration, DO conditions in the overlying water and likely patch-scale microbial activity in the sediment.
The concentration changes across the sediment-water interface are influenced by a combination of physical processes and biogeochemical processes. In summer when we suspect there would be the highest microbial activity, no significant differences were observed in the 0–3 min exposure for either nutrient fluxes or DO consumption between the control group and the experimental group with ZnCl2. These observations support that in the first exposure period, physical disturbances caused by water movement and sedimentation were the main factors affecting nutrient fluxes. For the subsequent experimental period (i.e., 3–10 min exposure), microbial processes were the likely influencing factors but further studies are needed to quantify these factors.
Generally, the role of sediments as NO3− producers/consumers was accompanied by the role as NH4+ consumers/producers (Figure 4), which was related to nitrogen transformations (e.g., nitrification and dissimilatory nitrate reduction to ammonium (DNRA)). The transformations across the sediment-water interface were attributed to the seasonal variations of NO3− and NH4+ concentrations, water temperature and DO [90,91]. For PO43−, insoluble or soluble matter in the sediment affected by DO and water pH interacted with minerals and associated adsorption sites. Therefore variation in the adsorption capacity of sediments was likely responsible for observed differences [38,40] (Figure 5). DOC dynamics related to its roles as a biological energy source and respiration substrate were likely affected by major processes related to water column ecosystem metabolism and the overall content of organic matter in sediments [24,25] (Figure 5; Table S9).
4.1.1. Mechanisms Driving NO3− and NH4+ Concentrations and Fluxes
Among the study rivers, NO3− concentrations were highest in winter and the lowest in summer (Figure 3b). On the contrary, NH4+ concentrations were highest in summer and lowest in winter. After water and sediment samples were mixed, disturbances across the sediment-water interface for the 0–3 min exposure caused NO3− and NH4+ to migrate along the concentration gradients. In winter, the lowest NO3− equilibrium concentration (26.4 mg/L) and the highest water concentration (43.3 mg/L) were found at site L2 and resulted in the maximum NO3− uptake flux rate (0.31 mg/(m2·s)) observed in the 0–3 min exposure (Figure 4). For site L1 (i.e., highest NO3− equilibrium concentration among all sites in winter (45.5 mg/L) but lower water concentration than L2), we observed NO3− regeneration. For NH4+ in winter, the water concentration at L2 was lower than at L1, while the equilibrium concentration at L2 was the highest among all sites (3.9 mg/L). This likely indicated higher sediment NH4+ concentrations here which resulted in a greater concentration gradient and an overall higher regeneration rate (0.04 mg/(m2·s); Figure 4).
In summer the equilibrium NO3− concentration at L1 dropped to the lowest in the four seasons (20.9 mg/L) and was lower than the mean water concentration (26.2 mg/L). These conditions indicated lower sediment concentrations than in the overlying water and contributed to NO3− uptake in the 0–3 min exposure. The NO3− concentration change at L2 was similar to that at L1, hence the flux still presented uptake in this exposure. The likely decreased concentration gradient also led to a decreased flux rate from 0.09 mg/(m2·s) in spring to 0.05 mg/(m2·s) in summer. For NH4+ in summer, water concentrations at L1 were lower than at L2, while the equilibrium concentration at L1 was higher. This suggests that higher sediment NH4+ concentrations at L1 resulted in a greater concentration gradient of NH4+ and this was observed as regeneration (0.04 mg/(m2·s)). For spring and autumn, as well as other study rivers, seasonal variations in the water concentrations and equilibrium concentrations of NO3− and NH4+ caused flux transformation to vary between uptake and regeneration (Figure 4). However, the highest water concentration or equilibrium concentration did not correspond to the maximum flux rates.
In terms of biological processes (i.e., 3–10 min exposure), the movement of water transferred NO3− into the sediment and likely made it bioavailable to microbes associated with sediment surfaces. The DO consumption during both exposures (Figure S1) favored the occurrence of the dissimilatory nitrate reduction to ammonium (DNRA), so that NO3− was transformed into NH4+ and returned to the overlying water along these concentration gradients [92]. This was consistent with both NO3− uptake and NH4+ regeneration fluxes shown at some sites (e.g., L1 and L2 in winter; T1 and T2 in summer; Figure 4). However, when the overlying water could not provide sufficient NO3− DNRA were likely inhibited resulting in decreased NH4+ regeneration fluxes and overall sediment-associated uptake.
Seasonal variations of NO3− and NH4+ fluxes were determined by a combination of physical and biological factors. There was no significant seasonal difference in the NO3− equilibrium concentration among the three rivers which resulted in a lack of seasonal difference in the NO3− flux in the 0–3 min exposure. On the contrary, significant seasonal differences in the NH4+ equilibrium concentration (F = 30.272, p < 0.001) led to the observed seasonal difference in NH4+ flux (F = 34.857, p < 0.001). For the 3–10 min exposure, seasonal differences in water temperature and DO (p < 0.001) affected NH4+ fluxes. We assume this was due to microbial activity affecting the N-cycle and in turn, these seasonal differences affected bioactivity (F = 17.276, p < 0.001). Regarding NO3−, significant seasonal differences in flux associated with bioactivity were also observed (F = 8.723, p = 0.031). We suspect this significant variation reflects NH4+ flux participating in overall DNRA reactions.
Concentrations of NO3− and NH4+ were significantly different among the study rivers (F = 12.737, p < 0.001; F = 4.760, p = 0.010, respectively). The NH4+ concentrations at the sites affected by the wastewater effluents (i.e., L1, T1) and the site affected by the tributary inflow (i.e., W2) were higher than at another site on each river. On the one hand, the effluents with elevated water temperature and organic matter promoted the mineralization of organic nitrogen by microbes likely promoting higher NH4+ concentrations [92]. On the other hand, high concentrations of NH4+ (>2 mg/L) of the River Ba flowing into the River Wenyu yielded higher NH4+ concentrations at W2. For NO3−, concentrations were negatively correlated with NH4+ concentrations (r2 = −0.557, p < 0.001) and NO3− at L1 and T1 were lower than at L2 and T2, respectively. [93] pointed out that NO3− tend to increase downstream with increasing river discharge due to reduced water residence time which could explain our observations. Mean NO3− concentrations across all rivers were lowest in summer. We suspect that this observation is linked to NO3− uptake supporting biological activity in summer (e.g., phytoplankton). This idea is further supported by the fact that the highest mean NO3− concentrations were observed in winter. Mean NO3− concentration in autumn was higher than in spring, and the increased seasonal precipitation in North China is a likely factor because of the role of surface runoff as a non-point source of pollution [14]. Although increased precipitation and runoff can also dilute NO3− concentrations, pollution associated with surface runoff can be significantly stronger than dilution [94]. However, this needs further investigation for the study basins.
4.1.2. Mechanisms Driving Po43− Concentrations and Fluxes
In our study, higher PO43− concentrations at L1 and T1 were attributable to WWTP effluents, while the higher concentration at W2 was related to the tributary inflow (Figure 3). However, contributions from PO43− released from sediments were less which was reflected in uptake flux and low regeneration rates (Figure 5). In addition to the PO43− flux determined by the equilibrium concentration, abundant biofilms at T1 and W2 likely reduced the interaction between PO43− and sediment adsorption sites, thereby reducing regeneration from sediments [52,95].
We observed that PO43− concentrations were negatively correlated with DO (r2 = −0.321, p < 0.001). This finding was associated with the highest mean PO43− concentration in winter when the lowest mean DO concentration occurred (Figure 3b). Also, the reduced PO43− absorption by weaker bioactivity in winter contributed to increased PO43− concentrations [10,46,96]. DO conditions affect electron receptors in sediments and under reducing conditions the formation of soluble substances (e.g., Fe(OH)2) reduces the adsorption sites resulting in increased water-specific PO43− concentrations [39,41]. However, the highest mean DO concentration in autumn did not lead to the lowest PO43− concentration and this could be due to increased seasonal precipitation carrying PO43− from urban impervious surfaces into rivers [97].
There was a positive correlation between PO43− and water pH in the River Tonghui (r2 = 0.257, p = 0.040). These study reaches were alkaline (pH = 7.5–8.9), causing OH− and PO43− to compete for adsorption sites on the sediment surface and exchange with PO43−, consequently elevating PO43− concentration in the water [98]. However, for the other two study rivers, positive correlations were not observed as sediment particle size seemed to also affect the P-dynamics. For example, both the sediments at L2 and W2 contained a high proportion of fine particles (Table S9) which were easy to resuspend and could cause PO43− to re-enter the overlying water [99].
In the 0–3 min exposure, PO43− concentrations in water across the study sites were both higher/lower than the equilibrium concentration resulting in both uptake/regeneration fluxes. In the 3–10 min exposure, decreased DO facilitated releases of PO43− from sediments and regeneration fluxes or decreased uptake fluxes were observed. Significant seasonal variations in DO and PO43− concentrations in water were recorded, but again there were no significant seasonal differences in the PO43− flux, which may be attributed to the small PO43− flux rate found at lower concentrations when compared with results from the other nutrients.
4.1.3. Mechanisms Driving DOC Concentrations and Fluxes
DOC concentrations increased across all sites in autumn (Figure 3b) and were likely linked to urban impervious surfaces and stormwater runoff [100]. Additionally, tree leaves and other terrestrial organic matter are other DOC sources [28]. However, the highest mean concentration of DOC was found in winter when decreased bioactivity reduced biological uptake [24,25].
The DOC equilibrium concentration determined the DOC flux in the 0–3 min exposure. The content of organic matter in sediments varied little with seasons (Table S9) but there were significant differences in the DOC equilibrium concentration between winter and spring across the three rivers (p = 0.003). These differences were related to the significant difference in DOC flux between these two seasons in both exposure times (p = 0.045). DOC uptake fluxes or decreased regeneration fluxes were observed at all sites in the 3–10 min exposure and this was likely because microorganisms increased the saturation index of biogenic carbonate minerals through their metabolic activities [101,102]. The fine sediments across all sites were mainly composed of silt (Table S9). These sediments have a high surface area available for microbial adhesion and colonization resulting in high microbial biomass and diversity [93]. Therefore, we suggest that all sites may have similar microbial biomass and diversity and this may account for the similar DOC flux among all sites. More detailed studies to confirm these processes are needed.
4.1.4. Flux Predicted by Nutrient Concentrations and Water Quality
We used forward selection stepwise multiple regression to evaluate if measured flux rates could be predicted from ambient river water quality (Table 2). Only NH4+ concentration explained NO3− flux differences suggesting that nitrification plays a strong role within the N-cycle which is similar to results from other rivers with high nutrient concentrations (e.g., [17,103]). For NH4+ flux, only water temperature explained overall differences, pointing towards microbial activity associated with assimilative nitrogen uptake as the driving factor [104]. For PO43− flux, PO43− and DO concentrations explained overall differences. This suggests that DO conditions affected electron receptors in sediments, thereby affecting the PO43− adsorption sites. However, this negative relationship suggests that increased concentrations in river water may saturate uptake [39,41]. Finally, DOC flux was explained by DOC concentration. The negative beta coefficient again suggests that increased DOC leads to regeneration rather than uptake of DOC, demonstrated in the shift of DOC flux from uptake to regeneration. Evaluating each of these models provides an indication of the relative importance of physical and biological processes which drive the dynamics of nutrients at the sediment-water interface in urban rivers.
4.2. Metabolic Patterns of Urban River Ecosystems
River ecosystem metabolism (REM) is well recognized as a holistic measure of ecological function given its integration of complex biological and physical interactions, which integrates gross primary production (GPP) and ecosystem respiration (ER) [54,67]. Pollution stressors (e.g., excessive nutrients) and water temperature drive variations in REM patterns [105]. Urban rivers often receive WWTP effluents and tributary inflows which can alter nutrient concentrations and modify temperature regimes of receiving water bodies, thus affecting REM [18,63,68]. Our SEM modelling revealed that NH4+ and PO43− were key nutrients stimulating aquatic bioactivity, thus affecting GPP and ER, and ER significantly consumed DO. In our study, GPP was similar at each site, but ER was significantly higher at the sites affected by the WWTP effluents or the tributary inflow. In summer, the mean NEP at each site was greater than 0, indicating that each study reach was autotrophic and overall carbon sinks with a mean absorption rate ranging from 1.6 to 12.7 gCO2/(m3·d). However, in other seasons negative NEP values indicating a heterotrophic state of these river reaches and overall sources of CO2 with a mean release rate of 2.2–16.0 gCO2/(m3·d) across study sites. This work highlights the major environmental factors driving REM and allows for a holistic understanding of the variation of these processes which suggest options for in-stream management.
4.2.1. DO Profiles across Study Sites
The continuous monitoring of diurnal DO concentrations provided rich information on DO conditions such as the mean and range of DO, especially low DO, which is a useful indicator of habitat suitability for aquatic organisms [106,107,108]. We found that the magnitude of diurnal DO in summer and autumn was higher than in spring and winter due to high rates of photosynthesis and organic matter respiration (Table 1). These conditions can cause physiological stress in aquatic organisms [106].
Regarding spatial distributions of DO, the mean DO concentration at L1, T1 and W2 affected by the WWTP effluents or the tributary inflow was lower than at another site of the river, and the DOC concentration at these affected sites was higher, indicating that organic matter decomposition and respiration contributed to DO consumption (Figure 3; e.g., the maximum DO deficit at L1 in the four seasons).
4.2.2. Factors Driving GPP and ER
In this study, the WWTP effluents and the tributary inflow were used as natural experiments to investigate the effects of elevated nutrient concentrations and water temperature on urban river metabolism. We found similar GPP across our study sites but higher ER in the effluent/tributary-affected reaches (Table 1). [109] proposed criteria to assess the functioning impact on river ecosystems according to GPP and ER values (Table 3). Based on this, the ecological function of the WWTP effluent reservoir where T1 is located was mildly to severely impaired; the ecological function at other sites changed from no functional effect in summer or autumn to severe impairment in winter. Although GPP and ER were measured at specific locations, they can represent the metabolic patterns of the studied reaches and can be used to assess ecological functions, because of the natural movement and mixing of water in a river [109]. Overall, this suggests that both the WWTP effluents and the tributary rich in nutrients have negative impacts on river ecological function and health for urbanized catchments.
Our SEM model revealed that NH4+ and PO43− were key nutrients stimulating aquatic bioactivity (Figure 9), which was directly associated with the promotion of growth and reproduction of aquatic organisms (e.g., macrophytes) and increased both GPP and ER [1,2]. For example, the mean GPP and ER at L1 with effluent outfall were higher than at L2 in the four seasons (Table 1). [74] referred to the increase in GPP and ER in heterotrophic rivers as the “subsidy” effect of WWTP effluents. As a result of this, a positive correlation between GPP and ER was found (r2 = 0.262, p < 0.001), which has also been widely reported by many studies (e.g., [110,111,112]). However, fine particulate organic matter (FPOM) and DOC associated with WWTP effluents or tributary inflows can be an important energy input for supporting in-situ ER [74,113]. Additionally, GPP is directly controlled by light availability [66,114]. Therefore, the increase for ER and GPP in reaches with elevated nutrients is not always consistent [55], which explains the inconsistency between the increased significance of GPP and ER across the study sites. Furthermore, the change of light availability led to the diurnal and seasonal variations of GPP as we observed that the mean GPP was the highest in summer across all sites with the peak between 1–3 pm, followed by autumn and spring and was the lowest in winter with the peak at noon (Figure 6).
Regarding the River Wenyu, GPP at W2 with higher nutrient concentrations was not always higher than at W1 (i.e., in autumn and spring) because in addition to nutrient supply, water temperature, turbidity and light availability also likely led to GPP differences [55,115]. We suspect that this is especially the case for light availability as the water at W2 was deeper than at W1. This difference in depth resulted in more attenuation of light at the riverbed depth at W2 [116]. These conditions reduced photosynthesis at the riverbed and caused lower observed DO concentrations. There was a similar situation in the River Tonghui, where at T1 (e.g., a site where a pool is formed by the WWTP effluent) GPP was not always higher than at T2 (i.e., in spring and summer). A potential explanation for this observation is related to algal senescence at T1 [117].
ER was positively correlated with water temperature (r2 = 0.567, p < 0.001) due to temperature-related enzyme activity involved in respiration [63,64]. The SEM model demonstrated that bioactivity was significantly affected by water temperature. As a result, due to the relatively warm WWTP effluents, ER at L1 and T1 was significantly higher than at L2 and T2, respectively (p < 0.001). Also, the lowest mean ER was observed in winter when the water temperature was the lowest. The highest mean ER occurred in autumn (Figure 7), and we suggest that this was associated with higher DOC concentrations providing additional energy sources serving as respiratory substrates [24,25]. Of course, ER cannot increase indefinitely with increasing temperature due to factors like substrate limitation and/or protein degradation [25,118]. As a result, with the continuous DO consumption by ER and the potentially limited carbon supply due to the metabolism of carbon compounds, the maximum DO deficit was reached before sunrise and the initiation of photosynthesis [87]. In some systems, this can produce anoxic or hypoxic periods [119], but this was not the case during our study.
Regarding activation energy (Ea) associated with ER, the Ea at each site changed significantly in each season (Table 1). Higher Ea suggests that ER is more sensitive to temperatures and more vulnerable to climate change [120]. Ref. [118] pointed out that catabolic processes are more sensitive to changes in temperature than anabolic processes, and thus, warming should have stronger effects on ER than GPP, suggesting that global warming can reduce stream NEP [121].
The balance of GPP and ER plays an important role in carbon cycling in urban river ecosystems [122]. As we found, high nutrient concentrations significantly increased ER which has implications for CO2 emissions. Our study reaches released CO2 at a rate of 2.2–16.0 g/(m3·d) during the study period except for summer, when each reach was autotrophic as overall sinks of atmospheric CO2 with a mean absorption rate ranging from 1.6 to 12.7 g/(m3·d). Strategies to reduce nutrient concentrations in urban rivers via improved river water quality are paramount for reducing overall ER and thereby lowering the associated atmospheric CO2 emissions.
4.2.3. Factors Driving Reaeration
At night the lack of oxygen produced by photosynthesis in rivers significantly promoted reaeration, additionally lower water temperatures at night increased the solubility of oxygen [60]. As a result, diurnal reaeration rates were always positive at night and sometimes negative in the daytime (Figure S4) representing input and output of oxygen to the river, respectively. In summer, the highest water temperature and GPP supported high DO concentrations resulting in negative mean reaeration rates at all sites. In other seasons, reaeration supplemented oxygen into the water (Figure 9). Between each season, a significant difference in the reaeration rate at each site was observed which was also attributable to significant seasonal variation in ER. Our SEM model indicated that ER played a decisive role in the DO consumption, causing the significant seasonal difference of DO at each site (Table 1) and thereby enhancing the reaeration rate. For future river restoration, increasing oxygen by promoting reaeration, perhaps via turbulent mixing associated with geomorphic alteration is a viable option [123].
4.3. Research Limitations
The flux chamber experiment is a simple, cheap and easy method and allows us to separate the factors affecting nutrient fluxes into physical and biological processes. However, as chamber experiments, our work cannot capture in situ hydraulic conditions. Although we collected water at different depths, there was still a lack of water advection and hyporheic flow in the chambers, which clearly could alter observed fluxes versus the actual in-stream fluxes. Nevertheless, spatial and seasonal variation of nutrient fluxes across our study still experimentally demonstrated nutrient source and sink dynamics at the sediment-water interface. These data are useful for providing support in considering how to approach environmental protection against sediment degradation.
For river metabolism study, the use of reliable, measuring diurnal and seasonal patterns of river metabolism based on DO change rate from low-cost and reliable data loggers allowed for the estimation of GPP, ER and reaeration rates. This method is an overall estimation of ecosystem metabolism in the study reach; however, it cannot indicate the proportion of GPP and ER in different communities (e.g., phytoplankton and photosynthetic bacteria), which needs further research. Additionally, greater spatial coverage of measurements would help to elucidate reach-specific conditions including overall ecosystem metabolism.
5. Conclusions
This research evaluated urban river ecosystem function by studying flux dynamics of nutrients and river metabolic patterns. Three urban tributaries of the River Beiyun in Beijing each characterized by WWTP effluents and tributary inflows provided conditions with elevated nutrient concentrations to examine river ecological response in terms of nutrient and energy flow. While conditions were significantly different across the study sites, we did find that nutrient concentrations modified biogeochemical flux. We also found that nutrient fluxes were driven by physical processes (i.e., 0–3 min exposure experiments). Due to physical disturbance, nutrients moved along concentration gradients at the sediment-water interface. However, as nutrients were brought into contact with sediment particles, they were absorbed and utilized by microorganisms which speed biogeochemical reactions. Additionally, NO3− and NH4+ fluxes were seasonally affected by water temperature, DO and presumed bioactivity. We suggest that, especially in summer, this leads to an increased risk of eutrophication. PO43− flux was primarily related to the availability of suitable adsorption sites on the sediment surface which related to DO, water pH and organic matter content. Particle size and texture related to sediment resuspension contributed to PO43− regeneration and perhaps overall bioactivity (i.e., observed as variations in DOC flux). Regarding PO43− and DOC, elevated concentrations lead to regeneration and increase risks of river eutrophication.
Among these nutrients, we suggest that increased NH4+ and PO43− significantly stimulated bioactivity promoting GPP and ER which was demonstrated by positive correlations in our study. Our SEM model revealed that ER was related to significant seasonal variations of reaeration rate and DO consumption. Among these rivers, the highest mean GPP was recorded in summer, but the highest mean ER occurred in autumn which is likely linked to increased DOC acting as a carbon source for the heterotrophic processes. Overall higher GPP than ER in summer (NEP > 0) provides evidence to show that the studied river ecosystems were autotrophic; however, in the other seasons, sites were heterotrophic (NEP < 0) and became sources of CO2.
Supplementary Materials
The following supporting information can be downloaded at: https://www.mdpi.com/article/10.3390/w14192963/s1, Figure S1: DO consumption flux during both exposures in nutrient flux experiments; Figure S2: Nutrient and DO consumption fluxes during the 0–3 min exposure in the summer study (June–August 2021); Figure S3: Diurnal variation of DO concentrations in the four seasons across study sites; Figure S4: Diurnal variations of reaeration rate in the four seasons across study sites; Table S1: Water quality parameter for each sampling site; Table S2: Flux of nutrients at sediment-water interface; Table S3: 0–3 min exposure flux measurement with zinc chloride for summer study; Table S4: Equilibrium flux of nutrients at sediment-water interface; Table S5: Sediment organic matter content measurement; Table S6: DO measurement results and metabolic variables; Table S7: Nighttime slope equation for metabolism study; Table S8a: SEM estimations; Table S8b: SEM fitting indexes; Table S9: Sediment condition summary; Table S10: The concentration of nutrients with the equilibrium flux at the sediment-water interface (mg/L).
Author Contributions
M.Z.: Conceptualization (equal); writing—original draft; writing—review and editing (equal), formal analysis; data curation. M.A.C.: Conceptualization (equal); formal analysis (supporting); supervision (equal); writing—review and editing (supporting); R.A.F.: Supervision (equal); writing—review and editing (supporting). All authors have read and agreed to the published version of the manuscript.
Funding
This research received no external funding.
Data Availability Statement
The data presented in this study are available in Supplementary Materials.
Acknowledgments
We thank the laboratory of water and sediment science, School of Environmental Science and Engineering, Peking University for providing experimental equipment for this research. This research was partly funded by the Department of Geography, King’s College London.
Conflicts of Interest
The authors declare no conflict of interest.
References
- Capps, K.A.; Bentsen, C.N.; Ramírez, A. Poverty, urbanization, and environmental degradation: Urban streams in the developing world. Freshw. Sci. 2016, 35, 429–435. [Google Scholar] [CrossRef]
- Jarvie, H.P.; Smith, D.R.; Norton, L.R.; Edwards, F.K.; Bowes, M.J.; King, S.M.; Scarlett, P.; Davies, S.; Dils, R.M.; Bachiller-Jareno, N. Phosphorus and nitrogen limitation and impairment of headwater streams relative to rivers in Great Britain: A national perspective on eutrophication. Sci. Total Environ. 2018, 621, 849–862. [Google Scholar] [CrossRef] [PubMed]
- Woodward, G.; Gessner, M.O.; Giller, P.S.; Gulis, V.; Hladyz, S.; Lecerf, A.; Malmqvist, B.; McKie, B.G.; Tiegs, S.D.; Cariss, H.; et al. Continental-scale effects of nutrient pollution on stream ecosystem functioning. Science 2012, 336, 1438–1440. [Google Scholar] [CrossRef] [PubMed]
- Booth, D.B.; Roy, A.H.; Smith, B.; Capps, K.A. Global perspectives on the urban stream syndrome. Freshw. Sci. 2016, 35, 412–420. [Google Scholar] [CrossRef]
- Liu, H.Q.; Kong, T.; Qiu, L.; Xu, R.; Li, F.; Kolton, M.; Lin, H.; Zhang, L.; Lin, L.; Chen, J.; et al. Solar-driven, self-sustainable electrolysis for treating eutrophic river water: Intensified nutrient removal and reshaped microbial communities. Sci. Total Environ. 2021, 764, 144293. [Google Scholar] [CrossRef]
- Garzon-Garcia, A.; Burton, J.; Franklin, H.M.; Moody, P.W.; De Hayr, R.W.; Burford, M.A. Indicators of phytoplankton response to particulate nutrient bioavailability in fresh and marine waters of the Great Barrier Reef. Sci. Total Environ. 2018, 636, 1416–1427. [Google Scholar] [CrossRef]
- Smith, A.J.; Duffy, B.; Onion, A.; Heitzman, D.; Lojpersberger, J.; Mosher, E.; Novak, M. Long-term trends in biological indicators and water quality in rivers and streams of New York State (1972–2012). River Res. Appl. 2018, 34, 442–450. [Google Scholar] [CrossRef]
- Lu, Q.; Xu, Y.; Xu, K.; Xia, W.; Liu, J.; Liu, Y. Experiments of water quality monitoring and sediment pollution release in Shamao River. Earth Environ. Sci. 2021, 668, 12039. [Google Scholar] [CrossRef]
- Smucker, N.J.; Detenbeck, N.E. Meta-Analysis of lost ecosystem attributes in urban streams and the effectiveness of out-of-channel management practices. Restor. Ecol. 2014, 22, 741–748. [Google Scholar] [CrossRef]
- Liu, X.C.; Beusen, A.H.; Van Beek, L.P.; Mogollón, J.M.; Ran, X.; Bouwman, A.F. Exploring spatiotemporal changes of the Yangtze River (Changjiang) nitrogen and phosphorus sources, retention and export to the East China Sea and Yellow Sea. Water Res. 2018, 142, 246–255. [Google Scholar] [CrossRef]
- Shen, D.; Huang, S.; Zhang, Y.; Zhou, Y. The source apportionment of N and P pollution in the surface waters of lowland urban area based on EEM-PARAFAC and PCA-APCS-MLR. Environ. Res. 2021, 197, 111022. [Google Scholar] [CrossRef] [PubMed]
- Pennino, M.J.; Kaushal, S.S.; Murthy, S.N.; Blomquist, J.D.; Cornwell, J.C.; Harris, L.A. Sources and transformations of anthropogenic nitrogen along an urban river–estuarine continuum. Biogeosciences 2016, 13, 6211–6228. [Google Scholar] [CrossRef]
- Chen, X.; Jiang, L.; Huang, X.; Cai, Z. Identifying nitrogen source and transport characteristics of the urban estuaries and gate-controlled rivers in northern Taihu Lake, China. Ecol. Indic. 2021, 130, 108035. [Google Scholar] [CrossRef]
- Bell, C.D.; Tague, C.L.; McMillan, S.K. Modeling runoff and nitrogen loads from a watershed at different levels of impervious surface coverage and connectivity to storm water control measures. Water Resour. Res. 2019, 55, 2690–2707. [Google Scholar] [CrossRef]
- Li, J.; Yu, S.; Qin, S. Removal capacities and environmental constrains of denitrification and Anammox processes in eutrophic riverine sediments. Water Air Soil Pollut. 2020, 231, 274. [Google Scholar] [CrossRef]
- Preisner, M. Surface water pollution by untreated municipal wastewater discharge due to a sewer failure. Environ. Process. 2020, 7, 767–780. [Google Scholar] [CrossRef]
- Zhang, M.; Chadwick, A.M. Nutrient dynamics at the sediment-water interface: Influence of wastewater effluents. Environ. Process. 2021, 8, 1337–1357. [Google Scholar] [CrossRef]
- Meyer, J.L.; Paul, M.J.; Taulbee, W.K. Stream ecosystem function in urbanizing landscapes. J. N. Am. Benthol. Soc. 2005, 24, 602–612. [Google Scholar] [CrossRef]
- Walsh, C.J.; Roy, A.H.; Feminella, J.W.; Cottingham, P.D.; Groffman, P.M.; Morgan, R.P. The urban stream syndrome: Current knowledge and the search for a cure. J. N. Am. Benthol. Soc. 2005, 24, 706–723. [Google Scholar] [CrossRef]
- Chadwick, M.A.; Dobberfuhl, D.R.; Benke, A.C.; Huryn, A.D.; Suberkropp, K.; Thiele, J.E. Urbanization affects stream ecosystem function by altering hydrology, chemistry, and biotic richness. Ecol. Appl. 2006, 16, 1796–1807. [Google Scholar] [CrossRef]
- Pereda, O.; Solagaistua, L.; Atristain, M.; de Guzmán, I.; Larrañaga, A.; von Schiller, D.; Elosegi, A. Impact of wastewater effluent pollution on stream functioning: A whole-ecosystem manipulation experiment. Environ. Pollut. 2020, 258, 113719. [Google Scholar] [CrossRef]
- Gu, C.; Waldron, S.; Bass, A.M. Carbon dioxide, methane, and dissolved carbon dynamics in an urbanized river system. Hydrol. Process. 2021, 35, 14360. [Google Scholar] [CrossRef]
- Assaad, A.; Pontvianne, S.; Pons, M.N. Assessment of organic pollution of an industrial river by synchronous fluorescence and UV–vis spectroscopy: The Fensch River (NE France). Environ. Monit. Assess. 2017, 189, 229. [Google Scholar] [CrossRef] [PubMed]
- Mineau, M.M.; Wollheim, W.M.; Buffam, I.; Findlay, S.E.G.; Hall, R.O.; Hotchkiss, E.R.; Koenig, L.E.; McDowell, W.H.; Parr, T.B. Dissolved organic carbon uptake in streams: A review and assessment of reach-scale measurements. J. Geophys. Res. Biogeosci. 2016, 121, 2019–2029. [Google Scholar] [CrossRef]
- Manning, D.P.; Rosemond, A.D.; Gulis, V.; Benstead, J.P.; Kominoski, J.S. Nutrients and temperature additively increase stream microbial respiration. Glob. Change Biol. 2018, 24, 233–247. [Google Scholar] [CrossRef] [PubMed]
- Wallace, T.A.; Ganf, G.G.; Brookes, J.D. A comparison of phosphorus and DOC leachates from different types of leaf litter in an urban environment. Freshw. Biol. 2008, 53, 1902–1913. [Google Scholar] [CrossRef]
- Worrall, F.; Howden, N.J.; Burt, T.P.; Bartlett, R. Declines in the dissolved organic carbon (DOC) concentration and flux from the UK. J. Hydrol. 2018, 556, 775–789. [Google Scholar] [CrossRef]
- Wen, Z.; Song, K.; Liu, G.; Lyu, L.; Shang, Y.; Fang, C.; Du, J. Characterizing DOC sources in China’s Haihe River basin using spectroscopy and stable carbon isotopes. Environ. Pollut. 2020, 258, 113684. [Google Scholar] [CrossRef]
- Lavelle, A.M.; Bury, N.R.; O’Shea, F.T.; Chadwick, M.A. Influence of urban river restoration on nitrogen dynamics at the sediment-water interface. PLoS ONE 2019, 14, e0212690. [Google Scholar] [CrossRef]
- Smith, L.; Watzin, M.C.; Druschel, G. Relating sediment phosphorus mobility to seasonal and diel redox fluctuations at the sediment–water interface in a eutrophic freshwater lake. Limnol. Oceanogr. 2011, 56, 2251–2264. [Google Scholar] [CrossRef]
- James, W.F. Nitrogen retention in a floodplain backwater of the upper Mississippi River (USA). Aquat. Sci. 2010, 72, 61–69. [Google Scholar] [CrossRef]
- Lin, X.; Li, X.; Gao, D.; Liu, M.; Cheng, L. Ammonium production and removal in the sediments of Shanghai river networks: Spatiotemporal variations, controlling factors, and environmental implications. J. Geophys. Res. Biogeosci. 2017, 122, 2461–2478. [Google Scholar] [CrossRef]
- Simon, K.S.; Chadwick, M.A.; Huryn, A.D.; Valett, H.M. Stream ecosystem response to chronic deposition of N and acid at the Bear Brook Watershed, Maine. Environ. Monit. Assess. 2010, 171, 83–92. [Google Scholar] [CrossRef] [PubMed]
- Chen, J.J.; Lu, S.Y.; Liao, Z.Y.; Ai, S.C.; Huang, M.S. Effect of mechanical aeration on nitrogen and microbial activity in sediment-water interface from urban lake. In Proceedings of the 2012 Asian Pacific Conference on Energy, Environment and Sustainable Development (APEESD 2012), Kuala Lumpur, Malaysia, 12–13 November 2012; pp. 770–775. [Google Scholar]
- Mulholland, P.J.; Helton, A.M.; Poole, G.; Hall, R.O.; Hamilton, S.K.; Peterson, B.J.; Tank, J.L.; Ashkenas, L.R.; Cooper, L.; Dahm, C.N.; et al. Stream denitrification across biomes and its response to anthropogenic nitrate loading. Nature 2008, 452, 202–205. [Google Scholar] [CrossRef] [PubMed]
- Meghdadi, A. Characterizing the capacity of hyporheic sediments to attenuate groundwater nitrate loads by adsorption. Water Res. 2018, 140, 364–376. [Google Scholar] [CrossRef]
- Song, K.; Winters, C.; Xenopoulos, M.A.; Marsalek, J.; Frost, P.C. Phosphorus cycling in urban aquatic ecosystems: Connecting biological processes and water chemistry to sediment P fractions in urban stormwater management ponds. Biogeochemistry 2017, 132, 203–212. [Google Scholar] [CrossRef]
- Bedore, P.D.; David, M.B.; Stucki, J.W. Mechanisms of phosphorus control in urban streams receiving sewage effluent. Water Air Soil Pollut. 2008, 191, 217–229. [Google Scholar] [CrossRef]
- Zhao, B.; Zhang, Y.; Dou, X.; Yuan, H.; Yang, M. Granular ferric hydroxide adsorbent for phosphate removal: Demonstration preparation and field study. Water Sci. Technol. 2015, 72, 2179–2186. [Google Scholar] [CrossRef]
- Wu, P.; Yin, A.; Fan, M.; Wu, J.; Yang, X.; Zhang, H.; Gao, C. Phosphorus dynamics influenced by anthropogenic calcium in an urban stream flowing along an increasing urbanization gradient. Landsc. Urban Plan. 2018, 177, 1–9. [Google Scholar] [CrossRef]
- Martí, V.; Jubany, I.; Ribas, D.; Benito, J.A.; Ferrer, B. Improvement of phosphate adsorption kinetics onto ferric hydroxide by size reduction. Water 2021, 13, 1558. [Google Scholar] [CrossRef]
- Reitzel, K.; Hansen, J.; Andersen, F.Ø.; Hansen, K.S.; Jensen, H.S. Lake restoration by dosing aluminum relative to mobile phosphorus in the sediment. Environ. Sci. Technol. 2005, 39, 4134–4140. [Google Scholar] [CrossRef] [PubMed]
- Li, Q.M.; Zhang, W.; Wang, X.X.; Zhou, Y.Y.; Yang, H.; Ji, G.L. Phosphorus in interstitial water induced by redox potential in sediment of Dianchi Lake, China. Pedosphere 2007, 17, 739–746. [Google Scholar] [CrossRef]
- Li, D.P.; Huang, Y.; Fan, X.C.; Yuan, Y. Contributions of phosphorus on sedimentary phosphorus bioavailability under sediment resuspension conditions. Chem. Eng. J. 2011, 168, 1049–1054. [Google Scholar]
- Zhang, Z.; Wang, Z.; Wang, Y.; Chen, X.; Wang, H.; Xu, X.; Lin, X.Y.; Czapar, G.F. Properties of phosphorus retention in sediments under different hydrological regimes: A laboratory-scale simulation study. J. Hydrol. 2011, 404, 109–116. [Google Scholar] [CrossRef]
- Li, X.; Zhou, Y.; Liu, G.; Lei, H.; Zhu, D. Mechanisms of the photochemical release of phosphate from resuspended sediments under solar irradiation. Sci. Total Environ. 2017, 595, 779–786. [Google Scholar] [CrossRef]
- Wang, J.; Xu, J.; Xia, J.; Wu, F.; Zhang, Y. A kinetic study of concurrent arsenic adsorption and phosphorus release during sediment resuspension. Chem. Geol. 2018, 495, 67–75. [Google Scholar] [CrossRef]
- Li, X.; Guo, M.; Duan, X.; Zhao, J.; Hua, Y.; Zhou, Y.; Liu, G.; Dionysiou, D.D. Distribution of organic phosphorus species in sediment profiles of shallow lakes and its effect on photo-release of phosphate during sediment resuspension. Environ. Int. 2019, 130, 104916. [Google Scholar] [CrossRef]
- Guo, M.; Li, X.; Song, C.; Liu, G.; Zhou, Y. Photo-induced phosphate release during sediment resuspension in shallow lakes: A potential positive feedback mechanism of eutrophication. Environ. Pollut. 2020, 258, 113679. [Google Scholar] [CrossRef]
- Wu, M.; Yang, F.; Yao, Q.; Bouwman, L.; Wang, P. Storm-induced sediment resuspension in the Changjiang River Estuary leads to alleviation of phosphorus limitation. Mar. Pollut. Bull. 2020, 160, 111628. [Google Scholar] [CrossRef]
- Wang, S.; Yi, W.; Yang, S.; Jin, X.; Wang, G.; Wu, F. Effects of light fraction organic matter removal on phosphate adsorption by lake sediments. Appl. Geochem. 2011, 26, 286–292. [Google Scholar] [CrossRef]
- Xie, F.; Dai, Z.; Zhu, Y.; Li, G.; Li, H.; He, Z.; Geng, S.; Wu, F. Adsorption of phosphate by sediments in a eutrophic lake: Isotherms, kinetics, thermodynamics and the influence of dissolved organic matter. Colloids Surf. A Physicochem. Eng. Asp. 2019, 562, 16–25. [Google Scholar] [CrossRef]
- Rodríguez-Castillo, T.; Estévez, E.; González-Ferreras, A.M.; Barquín, J. Estimating ecosystem metabolism to entire river networks. Ecosystems 2019, 22, 892–911. [Google Scholar] [CrossRef]
- Jankowski, K.J.; Mejia, F.H.; Blaszczak, J.R.; Holtgrieve, G.W. Aquatic ecosystem metabolism as a tool in environmental management. Wiley Interdiscip. Rev. Water 2021, 8, e1521. [Google Scholar] [CrossRef]
- Bernhardt, E.S.; Heffernan, J.B.; Grimm, N.B.; Stanley, E.H.; Harvey, J.W.; Arroita, M.; Appling, A.P.; Cohen, M.J.; McDowell, W.H.; Hall, R.O.; et al. The metabolic regimes of flowing waters. Limnol. Oceanogr. 2018, 63 (Suppl. 1), S99–S118. [Google Scholar] [CrossRef]
- Grace, M.; Imberger, S. Stream metabolism: Performing & interpreting measurements. In Murray Darling Basin Commission and New South Wales Department of Environment and Climate Change; Water Studies Centre Monash University: Melbourne, Australia, 2006; Volume 204, pp. 1–204. [Google Scholar]
- Tank, J.L.; Rosi-Marshall, E.J.; Griffiths, N.A.; Entrekin, S.A.; Stephen, M.L. A review of allochthonous organic matter dynamics and metabolism in streams. J. N. Am. Benthol. Soc. 2010, 29, 118–146. [Google Scholar] [CrossRef]
- Escoffier, N.; Bensoussan, N.; Vilmin, L.; Flipo, N.; Rocher, V.; David, A.; Métivier, F.; Groleau, A. Estimating ecosystem metabolism from continuous multi-sensor measurements in the Seine River. Environ. Sci. Pollut. Res. Int. 2018, 25, 23451–23467. [Google Scholar] [CrossRef]
- Roberts, B.J.; Mulholland, P.J.; Hill, W.R. Multiple scales of temporal variability in ecosystem metabolism rates: Results from 2 years of continuous monitoring in a forested headwater stream. Ecosystems 2007, 10, 588–606. [Google Scholar] [CrossRef]
- Heffernan, J.B.; Cohen, M.J. Direct and indirect coupling of primary production and diel nitrate dynamics in a subtropical spring-fed river. Limnol. Oceanogr. 2010, 55, 677–688. [Google Scholar] [CrossRef]
- Lupon, A.; Martí, E.; Sabater, F.; Bernal, S. Green light: Gross primary production influences seasonal stream N export by controlling fine-scale N dynamics. Ecology 2016, 97, 133–144. [Google Scholar] [CrossRef]
- Demars, B.O.; Manson, J.R.; Ólafsson, J.S.; Gíslason, G.M.; Friberg, N. Stream hydraulics and temperature determine the metabolism of geothermal icelandic streams. Knowl. Manag. Aquat. Ecosyst. 2011, 402, 5. [Google Scholar] [CrossRef]
- Beaulieu, J.; Arango, C.; Balz, D.; Shuster, W. Continuous monitoring reveals multiple controls on ecosystem metabolism in a suburban stream. Freshw. Biol. 2013, 58, 918–937. [Google Scholar] [CrossRef]
- Jauhiainen, J.; Kerojoki, O.; Silvennoinen, H.; Limin, S.; Vasander, H. Heterotrophic respiration in drained tropical peat is greatly affected by temperature-a passive ecosystem cooling experiment. Environ. Res. Lett. 2014, 9, 105013. [Google Scholar] [CrossRef]
- Williams, C.J.; Yamashita, Y.; Wilson, H.F.; Jaffé, R.; Xenopoulos, M.A. Unraveling the role of land use and microbial activity in shaping dissolved organic matter characteristics in stream ecosystems. Limnol. Oceanogr. 2010, 55, 1159–1171. [Google Scholar] [CrossRef]
- Ferreira, V.; Elosegi, A.; Tiegs, S.D.; Schiller, D.V.; Young, R. Organic matter decomposition and ecosystem metabolism as tools to assess the functional integrity of streams and rivers—A systematic review. Water 2020, 12, 3523. [Google Scholar] [CrossRef]
- Bernot, M.J.; Sobota, D.J.; Hall, R.O.; Mulholland, P.J.; Ddodds, W.K.; Webster, J.R.; Tank, J.L.; Ashkenas, L.R.; Cooper, L.W.; Dahm, C.N.; et al. Inter-regional comparison of land-use effects on stream metabolism. Freshw. Biol. 2010, 55, 1874–1890. [Google Scholar] [CrossRef]
- Dodds, W.K. Trophic state, eutrophication and nutrient criteria in streams. Trends Ecol. Evol. 2007, 22, 669–676. [Google Scholar] [CrossRef]
- Welti, N.; Striebel, M.; Ulseth, A.; Cross, W.F.; DeVilbiss, S.; Glibert, P.M.; Guo, L.; Hirst, A.G.; Hood, J.; Kominoski, J.S.; et al. Bridging food webs, ecosystem metabolism, and biogeochemistry using ecological stoichiometry theory. Front. Microbiol. 2017, 8, 1298. [Google Scholar] [CrossRef]
- Saunders, W.C.; Bouwes, N.; McHugh, P.; Jordan, C.E. A network model for primary production highlights linkages between salmonid populations and autochthonous resources. Ecosphere 2018, 9, e02131. [Google Scholar] [CrossRef]
- Yang, X.; Huang, S.; Wu, Q.; Zhang, R.; Liu, G. Diversity and vertical distributions of sediment bacteria in an urban river contaminated by nutrients and heavy metals. Front. Environ. Sci. Eng. 2013, 7, 851–859. [Google Scholar] [CrossRef]
- Belmeziti, A.; Cherqui, F.; Tourne, A.; Granger, D.; Werey, C.; Le Gauffre, P.; Chocat, B. Transitioning to sustainable urban water management systems: How to define expected service functions? Civ. Eng. Environ. Syst. 2015, 32, 316–334. [Google Scholar] [CrossRef]
- Wijesiri, B.; Liu, A.; Deilami, K.; He, B.; Hong, N.; Yang, B.; Zhao, X.; Ayoko, G.; Goonetilleke, A. Nutrients and metals interactions between water and sediment phases: An urban river case study. Environ. Pollut. 2019, 251, 354–362. [Google Scholar] [CrossRef] [PubMed]
- Aristi, I.; von Schiller, D.; Arroita, M.; Barceló, D.; Ponsatí, L.; García-Galán, M.; Sabater, S.; Elosegi, A.; Acuña, V. Mixed effects of effluents from a wastewater treatment plant on river ecosystem metabolism: Subsidy or stress? Freshw. Biol. 2015, 60, 1398–1410. [Google Scholar] [CrossRef]
- Hou, P.; Ren, Y.; Zhang, Q.; Ye, Z.; Wang, H.; Fei, L. Temporal and spatial variations of water quality in a trans-urban river in Beijing, China. Fresenius Environ. Bull. 2013, 22, 561–572. [Google Scholar]
- Chen, X.; Zhou, W.; Pickett, S.T.A.; Li, W.; Han, L. Spatial-temporal variations of water quality and its relationship to land use and land cover in Beijing, China. Int. J. Environ. Res. Public Health 2016, 13, 449. [Google Scholar] [CrossRef]
- Liao, P.A. Analysis on water pollution trends and treatment technologies of the Beiyunhe Basin Beijing reach. Water Environ. 2013, 1, 16–19. (In Chinese) [Google Scholar]
- Pan, T.; Qi, J.; Wu, Q.; Wang, G.; Zhang, Y.P. Release law of nitrogen and phosphorus pollutants in sediments of Beiyun River Basin. Environ. Monit. China 2019, 35, 51–58. (In Chinese) [Google Scholar]
- Tian, G.S.; Chen, J. Study on water quality improvement measures and technology of the River Liangshui. Hai River Water Hydraul. 2008, 8, 46–49. (In Chinese) [Google Scholar]
- Bai, W.R. Analysis of water environment problems in the lower section of the River Tonghui. Water Environ. 2010, 1, 41–42. (In Chinese) [Google Scholar]
- Zhou, Z.X.; Xu, C.G.; Li, W.Y.; Yang, L.Q.; Sun, D.; Liu, J.H.; Liu, C. Current situation and problem analysis of water pollution in Changping section of the River Wenyu Basin. Water Environ. 2015, 4, 9–12. (In Chinese) [Google Scholar]
- Zhao, Z.; Liu, Q.; Leng, C.H. Integrated monitoring of heaven and earth of surface water environment in the Bahe River Basin in Chaoyang District of Beijing. China Soil Water Conserv. 2020, 6, 62–64. (In Chinese) [Google Scholar]
- Horie, Y.; Yonekura, K.; Suzuki, A.; Takahashi, C. Zinc chloride influences embryonic development, growth, and Gh/Igf-1 gene expression during the early life stage in zebrafish (Danio rerio). Comp. Biochem. Physiol. Part C Toxicol. Pharmacol. 2020, 230, 108684. [Google Scholar] [CrossRef] [PubMed]
- Heiri, O.; Lotter, A.; Lemcke, G. Loss on ignition as a method for estimating organic and carbonate content in sediments: Reproducibility and comparability of results. J. Paleolimnol. 2001, 25, 101–110. [Google Scholar] [CrossRef]
- Lee, J.Y.; Santamarina, J.C.; Ruppel, C. Parametric study of the physical properties of hydrate-bearing sand, silt, and clay sediments: 1. Electromagnetic properties. J. Geophys. Res. Solid Earth 2010, 115, 11. [Google Scholar] [CrossRef]
- Demars, B.L.; Thompson, J.; Manson, J.R. Stream metabolism and the open diel oxygen method: Principles, practice, and perspectives. Limnol. Oceanogr. Methods 2015, 13, 356–374. [Google Scholar] [CrossRef]
- Hill, N.B.; Riha, S.J.; Walter, M.T. Temperature dependence of daily respiration and reaeration rates during baseflow conditions in a northeastern U.S. stream. J. Hydrol. Reg. Stud. 2018, 19, 250–264. [Google Scholar] [CrossRef]
- Gillooly, J.F.; Brown, J.H.; West, G.B.; Savage, V.M.; Charnov, E.L. Effects of size and temperature on metabolic rate. Science 2001, 293, 2248–2251. [Google Scholar] [CrossRef] [PubMed]
- Fan, Y.; Chen, J.; Shirkey, G.; John, R.; Wu, S.R.; Park, H.; Shao, C. Applications of structural equation modelling (SEM) in ecological studies: An updated review. Ecol. Process. 2016, 5, 19. [Google Scholar] [CrossRef]
- Helton, A.M.; Poole, G.C.; Meyer, J.L.; Wollheim, W.M.; Peterson, B.J.; Mulholland, P.J.; Bernhardt, E.S.; Stanford, J.A.; Arango, C.; Ashkenas, L.R.; et al. Thinking outside the channel: Modeling nitrogen cycling in networked river ecosystems. Front. Ecol. Environ. 2011, 9, 229–238. [Google Scholar] [CrossRef] [Green Version]
- Reisinger, A.J.; Groffman, P.M.; Rosi-Marshall, E.J. Nitrogen-cycling process rates across urban ecosystems. FEMS Microbiol. Ecol. 2016, 92, 198. [Google Scholar] [CrossRef]
- Souza, A.C.; Pease, T.K.; Gardner, W.S. The direct role of enzyme hydrolysis on ammonium regeneration rates in estuarine sediments. Aquat. Microb. Ecol. Int. J. 2011, 65, 159–168. [Google Scholar] [CrossRef]
- Perryman, S.E.; Rees, G.N.; Walsh, C.J.; Grace, M.R. Urban stormwater runoff drives denitrifying community composition through changes in sediment texture and carbon content. Microb. Ecol. 2011, 61, 932–940. [Google Scholar] [CrossRef] [PubMed]
- Monfared, S.A.H.; Darmian, M.D.; Snyder, S.A.; Azizyan, G.; Pirzadeh, B.; Moghaddam, M.A. Water quality planning in rivers: Assimilative capacity and dilution flow. Bull. Environ. Contam. Toxicol. 2017, 99, 531–541. [Google Scholar] [CrossRef] [PubMed]
- Martí, E.; Riera, J.L.; Sabater, F. Effects of Wastewater Treatment Plants on Stream Nutrient Dynamics under Water Scarcity Conditions; Springer: Berlin/Heidelberg, Germany, 2009; pp. 173–195. [Google Scholar]
- Ratmaya, W.; Soudant, D.; Salmon-Monviola, J.; Plus, M.; Cochennec-Laureau, N.; Goubert, E.; Andrieux-Loyer, F.; Barillé, L.; Souchu, P. Reduced phosphorus loads from the Loire and Vilaine rivers were accompanied by increasing eutrophication in the Vilaine Bay (South Brittany, France). Biogeosciences 2019, 16, 1361–1380. [Google Scholar] [CrossRef]
- Pfeifer, L.R.; Bennett, E.M. Environmental and social predictors of phosphorus in urban streams on the Island of Montréal, Québec. Urban Ecosyst. 2011, 14, 485–499. [Google Scholar] [CrossRef]
- Jin, X.; Jiang, X.; Wang, Q.; Liu, D. Seasonal changes of P adsorption/desorption characteristics at the water sediment interface in Meiliang Bay, Taihu Lake, China. Acta Sci. Circumst. 2008, 28, 24–30. [Google Scholar]
- Luo, L.C.; Qin, B.Q.; Zhu, G.W. Calculation of total and resuspendable sediment volume in Lake Taihu. Oceanol. Limnol. Sin. 2004, 35, 491–496. [Google Scholar]
- Hale, R.L.; Turnbull, L.; Earl, S.R.; Childers, D.L.; Grimm, N.B. Stormwater infrastructure controls runoff and dissolved material export from arid urban watersheds. Ecosystems 2015, 18, 62–75. [Google Scholar] [CrossRef]
- Braissant, O.; Decho, A.W.; Dupraz, C.; Glunk, C.; Przekop, K.M.; Visscher, P.T. Exopolymeric substances of sulfate-reducing bacteria: Interactions with calcium at alkaline pH and implication for formation of carbonate minerals. Geobiology 2007, 5, 401–411. [Google Scholar] [CrossRef]
- Santomauro, G.; Baier, J.; Huang, W.; Pezold, S.; Bill, J. Formation of calcium carbonate polymorphs induced by living microalgae. J. Biomater. Nanobiotechnol. 2012, 3, 720–726. [Google Scholar] [CrossRef]
- Merbt, S.N.; Auguet, J.C.; Blesa, A.; Martí, E.; Casamayor, E.O. Wastewater treatment plant effluents change abundance and composition of ammonia-oxidizing microorganisms in Mediterranean urban stream biofilms. Microb. Ecol. 2015, 69, 66–74. [Google Scholar] [CrossRef]
- Bernal, S.; Segarra, A.; Merbt, S.N.; Martí, E. Differences in ammonium oxidizer abundance and N uptake capacity between epilithic and epipsammic biofilms in an urban stream. Freshw. Sci. 2017, 37, 13–22. [Google Scholar] [CrossRef]
- Jaiswal, D.; Pandey, U.; Mishra, V.; Pandey, J. Integrating resilience with functional ecosystem measures: A novel paradigm for management decisions under multiple-stressor interplay in freshwater ecosystems. Glob. Change Biol. 2021, 27, 3699–3717. [Google Scholar] [CrossRef] [PubMed]
- Pollock, M.S.; Clarke, L.M.J.; Dubé, M.G. The effects of hypoxia on fishes: From ecological relevance to physiological effects. Environ. Rev. 2007, 15, 1–14. [Google Scholar] [CrossRef]
- Rode, M.; Wade, A.J.; Cohen, M.J.; Hensley, R.; Bowes, M.; Kirchner, J.W.; Arhonditsis, G.; Jordan, P.; Kronvang, B.; Halliday, S.; et al. Sensors in the stream: The high-frequency wave of the present. Environ. Sci. Technol. 2016, 50, 10297–10307. [Google Scholar] [CrossRef] [PubMed]
- Elosegi, A.; Gessner, M.O.; Young, R.G. River doctors: Learning from medicine to improve ecosystem management. Sci. Total Environ. 2017, 595, 294–302. [Google Scholar] [CrossRef] [PubMed]
- Young, R.G.; Matthaei, C.D.; Townsend, C.R. Organic matter breakdown and ecosystem metabolism: Functional indicators for assessing river ecosystem health. J. N. Am. Benthol. Soc. 2008, 27, 605–625. [Google Scholar] [CrossRef]
- Hall, R.O.; Beaulieu, J.J. Estimating autotrophic respiration in streams using daily metabolism data. Freshw. Sci. 2013, 32, 507–516. [Google Scholar] [CrossRef]
- Yan, J.; Liu, J.; You, X.; Shi, X.; Zhang, L. Simulating the gross primary production and ecosystem respiration of estuarine ecosystem in North China with AQUATOX. Ecol. Model. 2018, 373, 1–12. [Google Scholar] [CrossRef]
- Hung, J.J.; Wang, Y.J.; Tseng, C.M.; Chen, Y.L.L. Controlling mechanisms and cross linkages of ecosystem metabolism and atmospheric CO2 flux in the northern South China Sea. Deep. Sea Res. Part I Oceanogr. Res. Pap. 2020, 157, 103205. [Google Scholar] [CrossRef]
- Gücker, B.; Brauns, M.; Pusch, M.T. Effects of wastewater treatment plant discharge on ecosystem structure and function of lowland streams. J. N. Am. Benthol. Soc. 2006, 25, 313–329. [Google Scholar] [CrossRef]
- Griffiths, N.A.; Tank, J.L.; Royer, T.V.; Roley, S.S.; Rosi-Marshall, E.J.; Whiles, M.R.; Beaulieu, J.J.; Johnson, L.T. Agricultural land use alters the seasonality and magnitude of stream metabolism. Limnol. Oceanogr. 2013, 58, 1513–1529. [Google Scholar] [CrossRef]
- Hall, R.O.; Yackulic, C.B.; Kennedy, T.A.; Yard, M.D.; Rosi-Marshall, E.J.; Voichick, N.; Behn, K.E. Turbidity, light, temperature, and hydropeaking control primary productivity in the Colorado River, Grand Canyon. Limnol. Oceanogr. 2015, 60, 512–526. [Google Scholar] [CrossRef]
- Julian, J.P.; Doyle, M.W.; Powers, S.M.; Stanley, E.H.; Riggsbee, J.A. Optical water quality in rivers. Water Resour. Res. 2008, 44, 10411. [Google Scholar] [CrossRef]
- Izagirre, O.; Agirre, U.; Bermejo, M.; Pozo, J.; Elosegi, A. Environmental controls of whole-stream metabolism identified from continuous monitoring of Basque streams. J. N. Am. Benthol. Soc. 2008, 27, 252–268. [Google Scholar] [CrossRef]
- Demars, B.O.; Manson, J.R.; Ólafsson, J.S.; Gíslason, G.M.; Gudmundsdottir, R.; Woodward, G.; Reiss, J.; Pichler, D.E.; Rasmussen, J.J.; Friberg, N. Temperature and the metabolic balance of streams. Freshw. Biol. 2011, 56, 1106–1121. [Google Scholar] [CrossRef]
- Reid, A.J.; Carlson, A.K.; Creed, I.F.; Eliason, E.J.; Gell, P.A.; Johnson, P.J.; Kidd, K.A.; MacCormack, T.J.; Olden, J.D.; Ormerod, S.J.; et al. Emerging threats and persistent conservation challenges for freshwater biodiversity. Biol. Rev. Camb. Philos. Soc. 2019, 94, 849–873. [Google Scholar] [CrossRef]
- Perkins, D.M.; Yvon-Durocher, G.; Demars, B.O.; Reiss, J.; Pichler, D.E.; Friberg, N.; Trimmer, M.; Woodward, G. Consistent temperature dependence of respiration across ecosystems contrasting in thermal history. Glob. Change Biol. 2012, 18, 1300–1311. [Google Scholar] [CrossRef]
- Song, C.; Dodds, W.K.; Rüegg, J.; Argerich, A.; Baker, C.L.; Bowden, W.B.; Douglas, M.M.; Farrell, K.J.; Flinn, M.B.; Garcia, E.A.; et al. Continental-scale decrease in net primary productivity in streams due to climate warming. Nat. Geosci. 2018, 11, 415–420. [Google Scholar] [CrossRef]
- Kaushal, S.S.; Delaney-Newcomb, K.; Findlay, S.E.G.; Newcomer, T.A.; Duan, S.; Pennino, M.J.; Sivirichi, G.M.; Sides-Raley, A.M.; Walbridge, M.R.; Belt, K.T. Longitudinal patterns in carbon and nitrogen fluxes and stream metabolism along an urban watershed continuum. Biogeochemistry 2014, 121, 23–44. [Google Scholar] [CrossRef]
- Levi, P.; McIntyre, P. Ecosystem responses to channel restoration decline with stream size in urban river networks. Ecol. Appl. 2020, 30, e02107. [Google Scholar] [CrossRef]
Figure 1.
Sampling sites on the River Liangshui, the River Tonghui, the River Wenyu, three urban tributaries of the River Beiyun, Beijing. Site numbers 1 and 2 represent upstream and downstream sites (relative locations of the two sites towards the River Beiyun) respectively.
Figure 1.
Sampling sites on the River Liangshui, the River Tonghui, the River Wenyu, three urban tributaries of the River Beiyun, Beijing. Site numbers 1 and 2 represent upstream and downstream sites (relative locations of the two sites towards the River Beiyun) respectively.

Figure 2.
SEM for river metabolism in the study reaches. Variables linked by arrows have causal relationships. The box represents the observed variable; the oval represents the latent variable.
Figure 2.
SEM for river metabolism in the study reaches. Variables linked by arrows have causal relationships. The box represents the observed variable; the oval represents the latent variable.

Figure 3.
(a) Concentrations of nutrients and DO and water temperature across sampling sites. Each box contains all data points from sampling events during the study period. The concentrations of NO3−, NH4+ and PO43− across the three rivers were significantly different. (b) Concentrations of nutrients and DO and water temperature in four seasons during the study period. Each box contains data points from all sampling sites in the corresponding season. The concentrations of all nutrients changed significantly seasonally.

Figure 4.
NO3− and NH4+ fluxes of sampling events during the study period for each study river. Downwards flux represents uptake/removal of nutrients from overlying water to sediment and upwards flux represents regeneration/release of nutrients from sediment to water. The flux experiment at each site has three replicates, if the results are different, the error line is marked on the bar.

Figure 5.
PO43− and DOC fluxes of sampling events during the study period for each study river. Downwards flux represents uptake/removal of nutrients from overlying water to sediment and upwards flux represents regeneration/release of nutrients from sediment to water. The flux experiment at each site has three replicates, if the results are different, the error line is marked on the bar.

Figure 6.
Diurnal variations of GPP in the four seasons across study sites. GPP dropped from the peak to 0 at night and increased from sunrise. The minimum mean GPP appeared in winter when GPP decreased from noon; The maximum mean GPP appeared in summer when GPP peaked between 1 and 3 pm.
Figure 6.
Diurnal variations of GPP in the four seasons across study sites. GPP dropped from the peak to 0 at night and increased from sunrise. The minimum mean GPP appeared in winter when GPP decreased from noon; The maximum mean GPP appeared in summer when GPP peaked between 1 and 3 pm.

Figure 7.
Diurnal variations of ER in the four seasons across study sites. ER was the lowest in winter and the highest in autumn across study sites except W1. Significant seasonal variations of ER at all sites were recorded from autumn to spring.
Figure 7.
Diurnal variations of ER in the four seasons across study sites. ER was the lowest in winter and the highest in autumn across study sites except W1. Significant seasonal variations of ER at all sites were recorded from autumn to spring.

Figure 8.
Diurnal variations of NEP in the four seasons across study sites. NEP decreased to the lowest value within one hour after sunset and then gradually increased. The maximum mean NEP with positive values appeared in summer among all sites, and the minimum values were observed in autumn except L1.

Figure 9.
Standardized SEM results. The number on the arrow represents the correlation coefficient; thicker arrows indicate significant correlations. The data were obtained from all results of the three rivers during the study period.
Figure 9.
Standardized SEM results. The number on the arrow represents the correlation coefficient; thicker arrows indicate significant correlations. The data were obtained from all results of the three rivers during the study period.


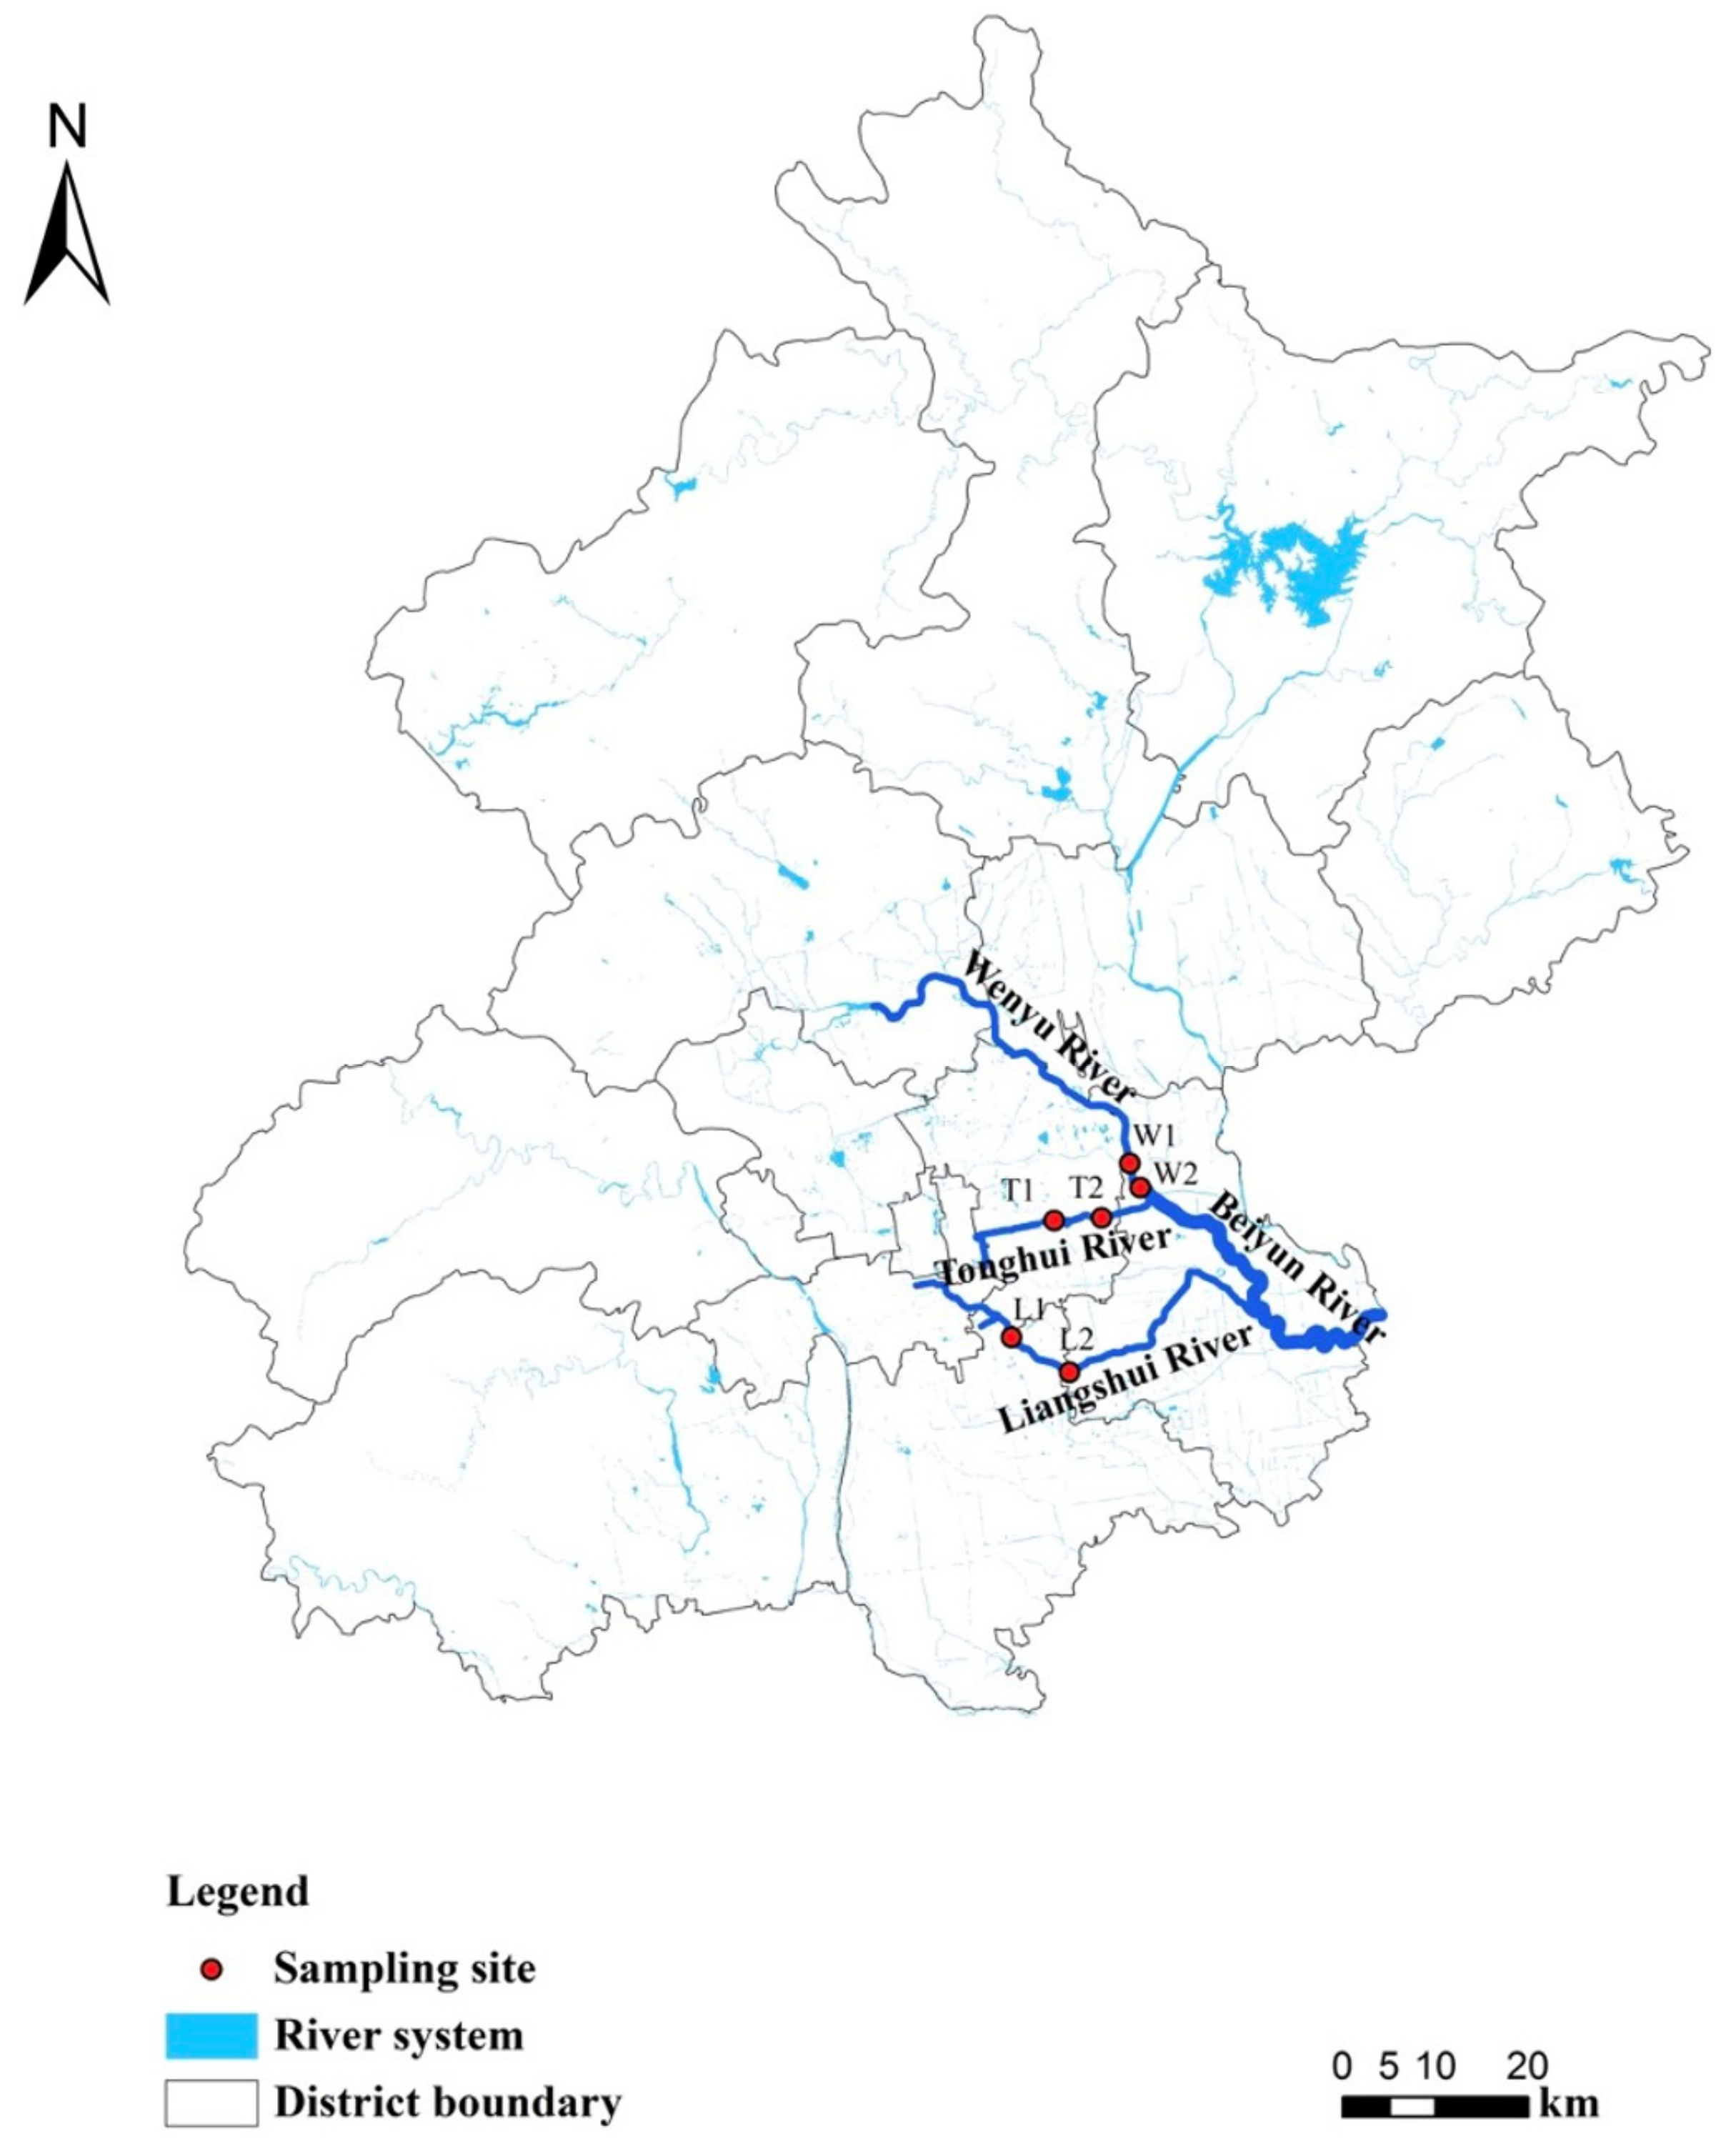
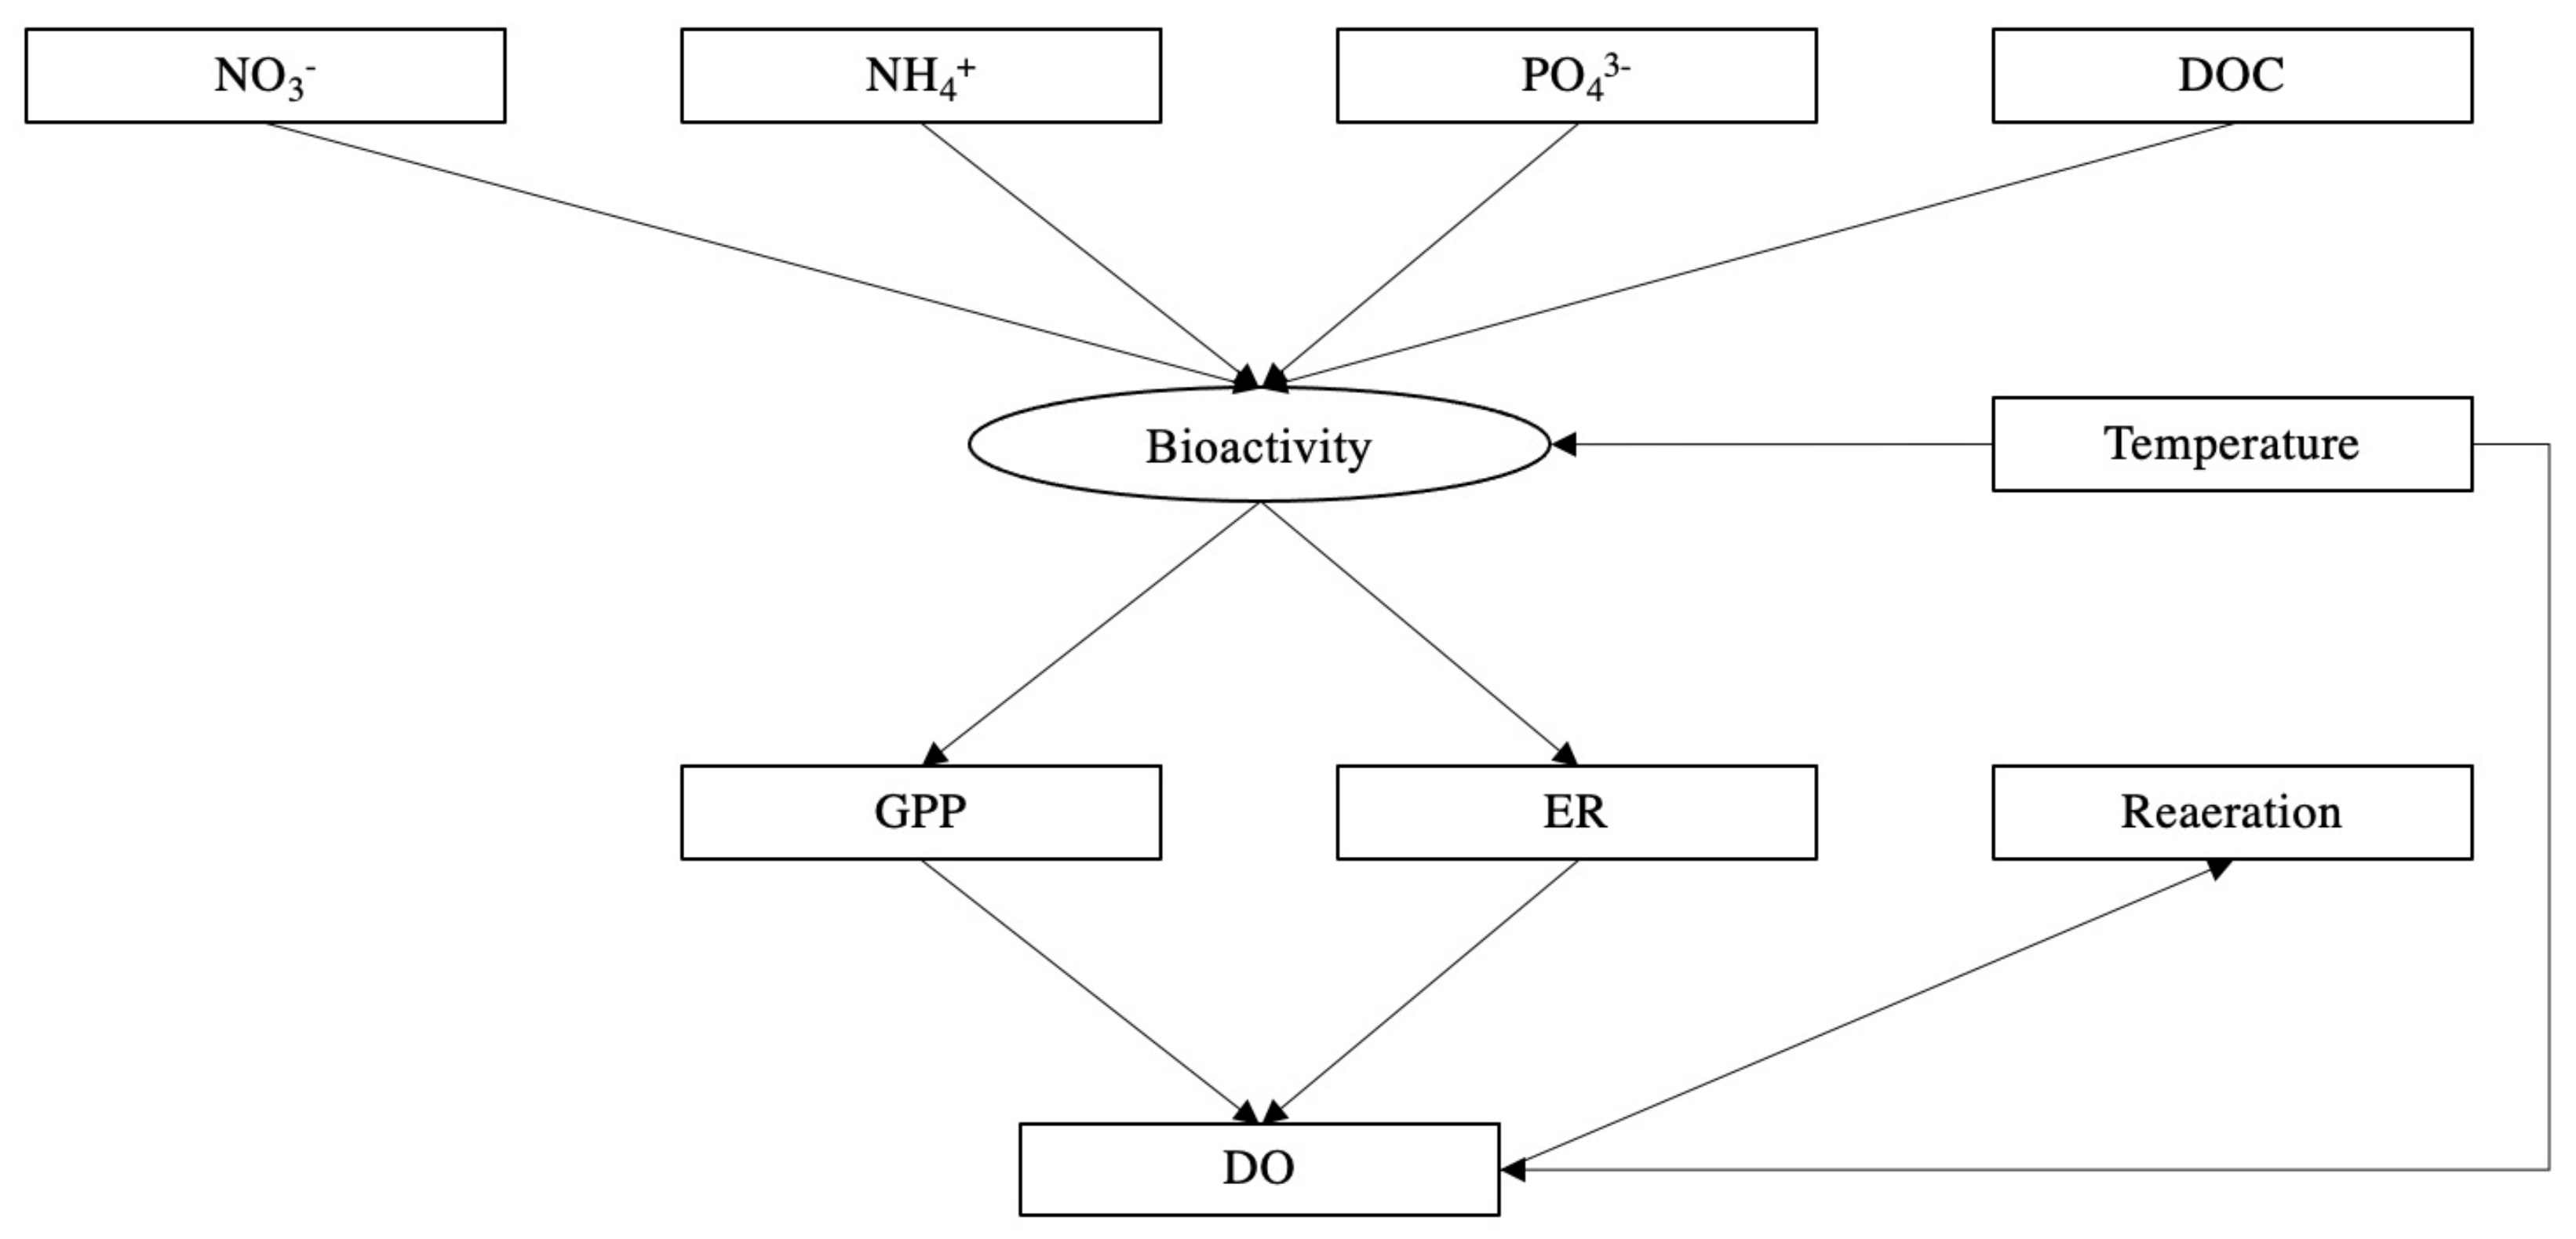
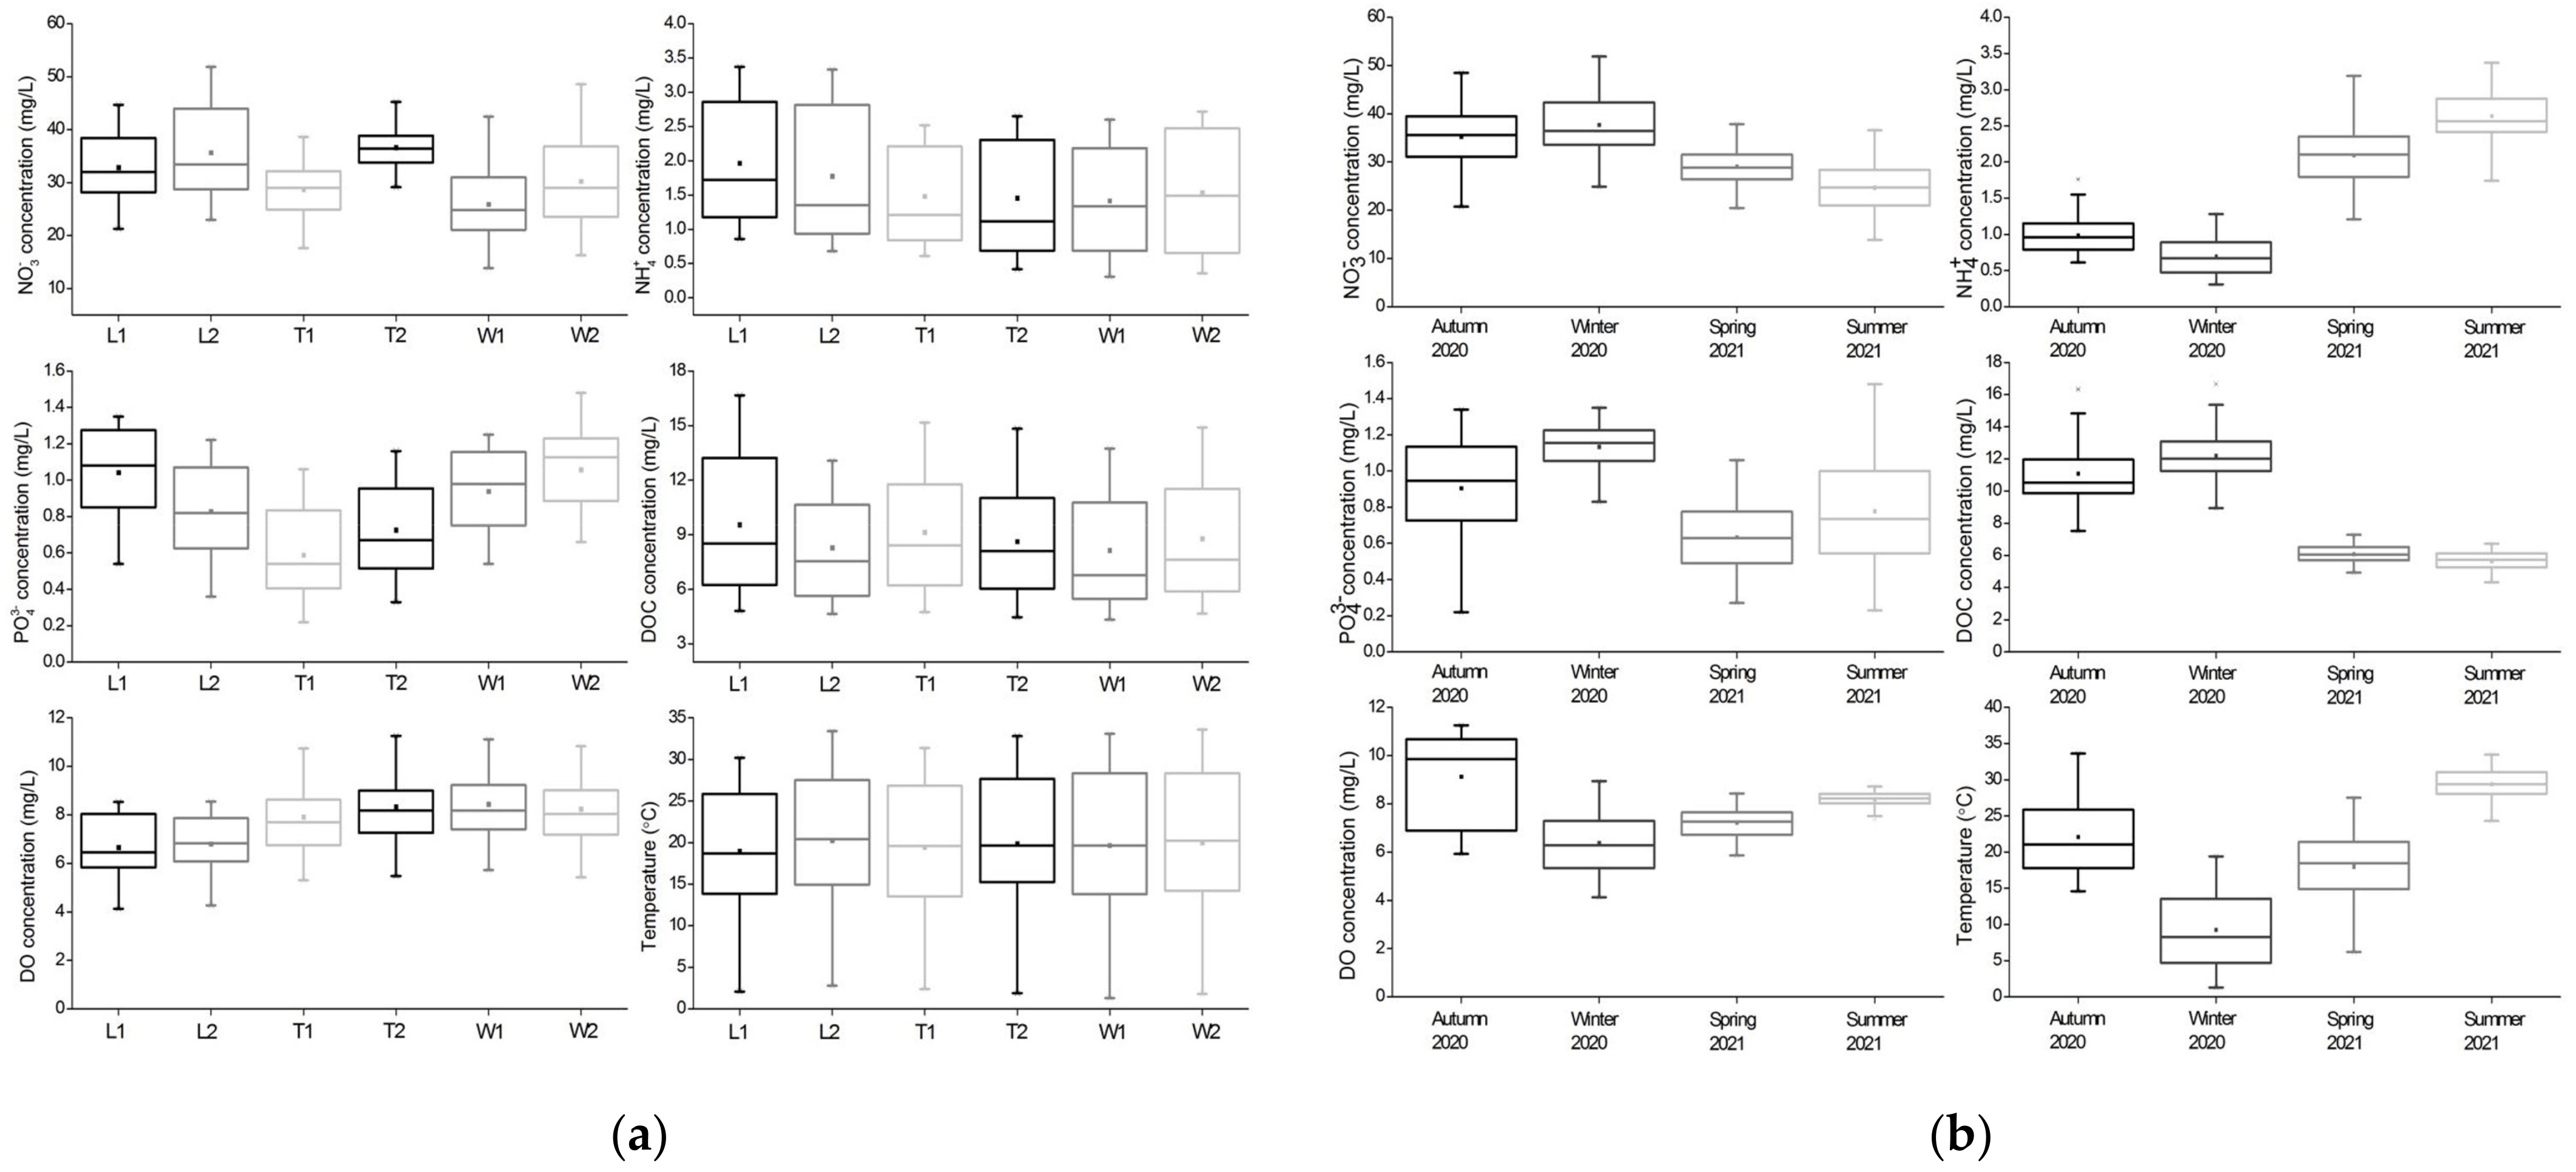
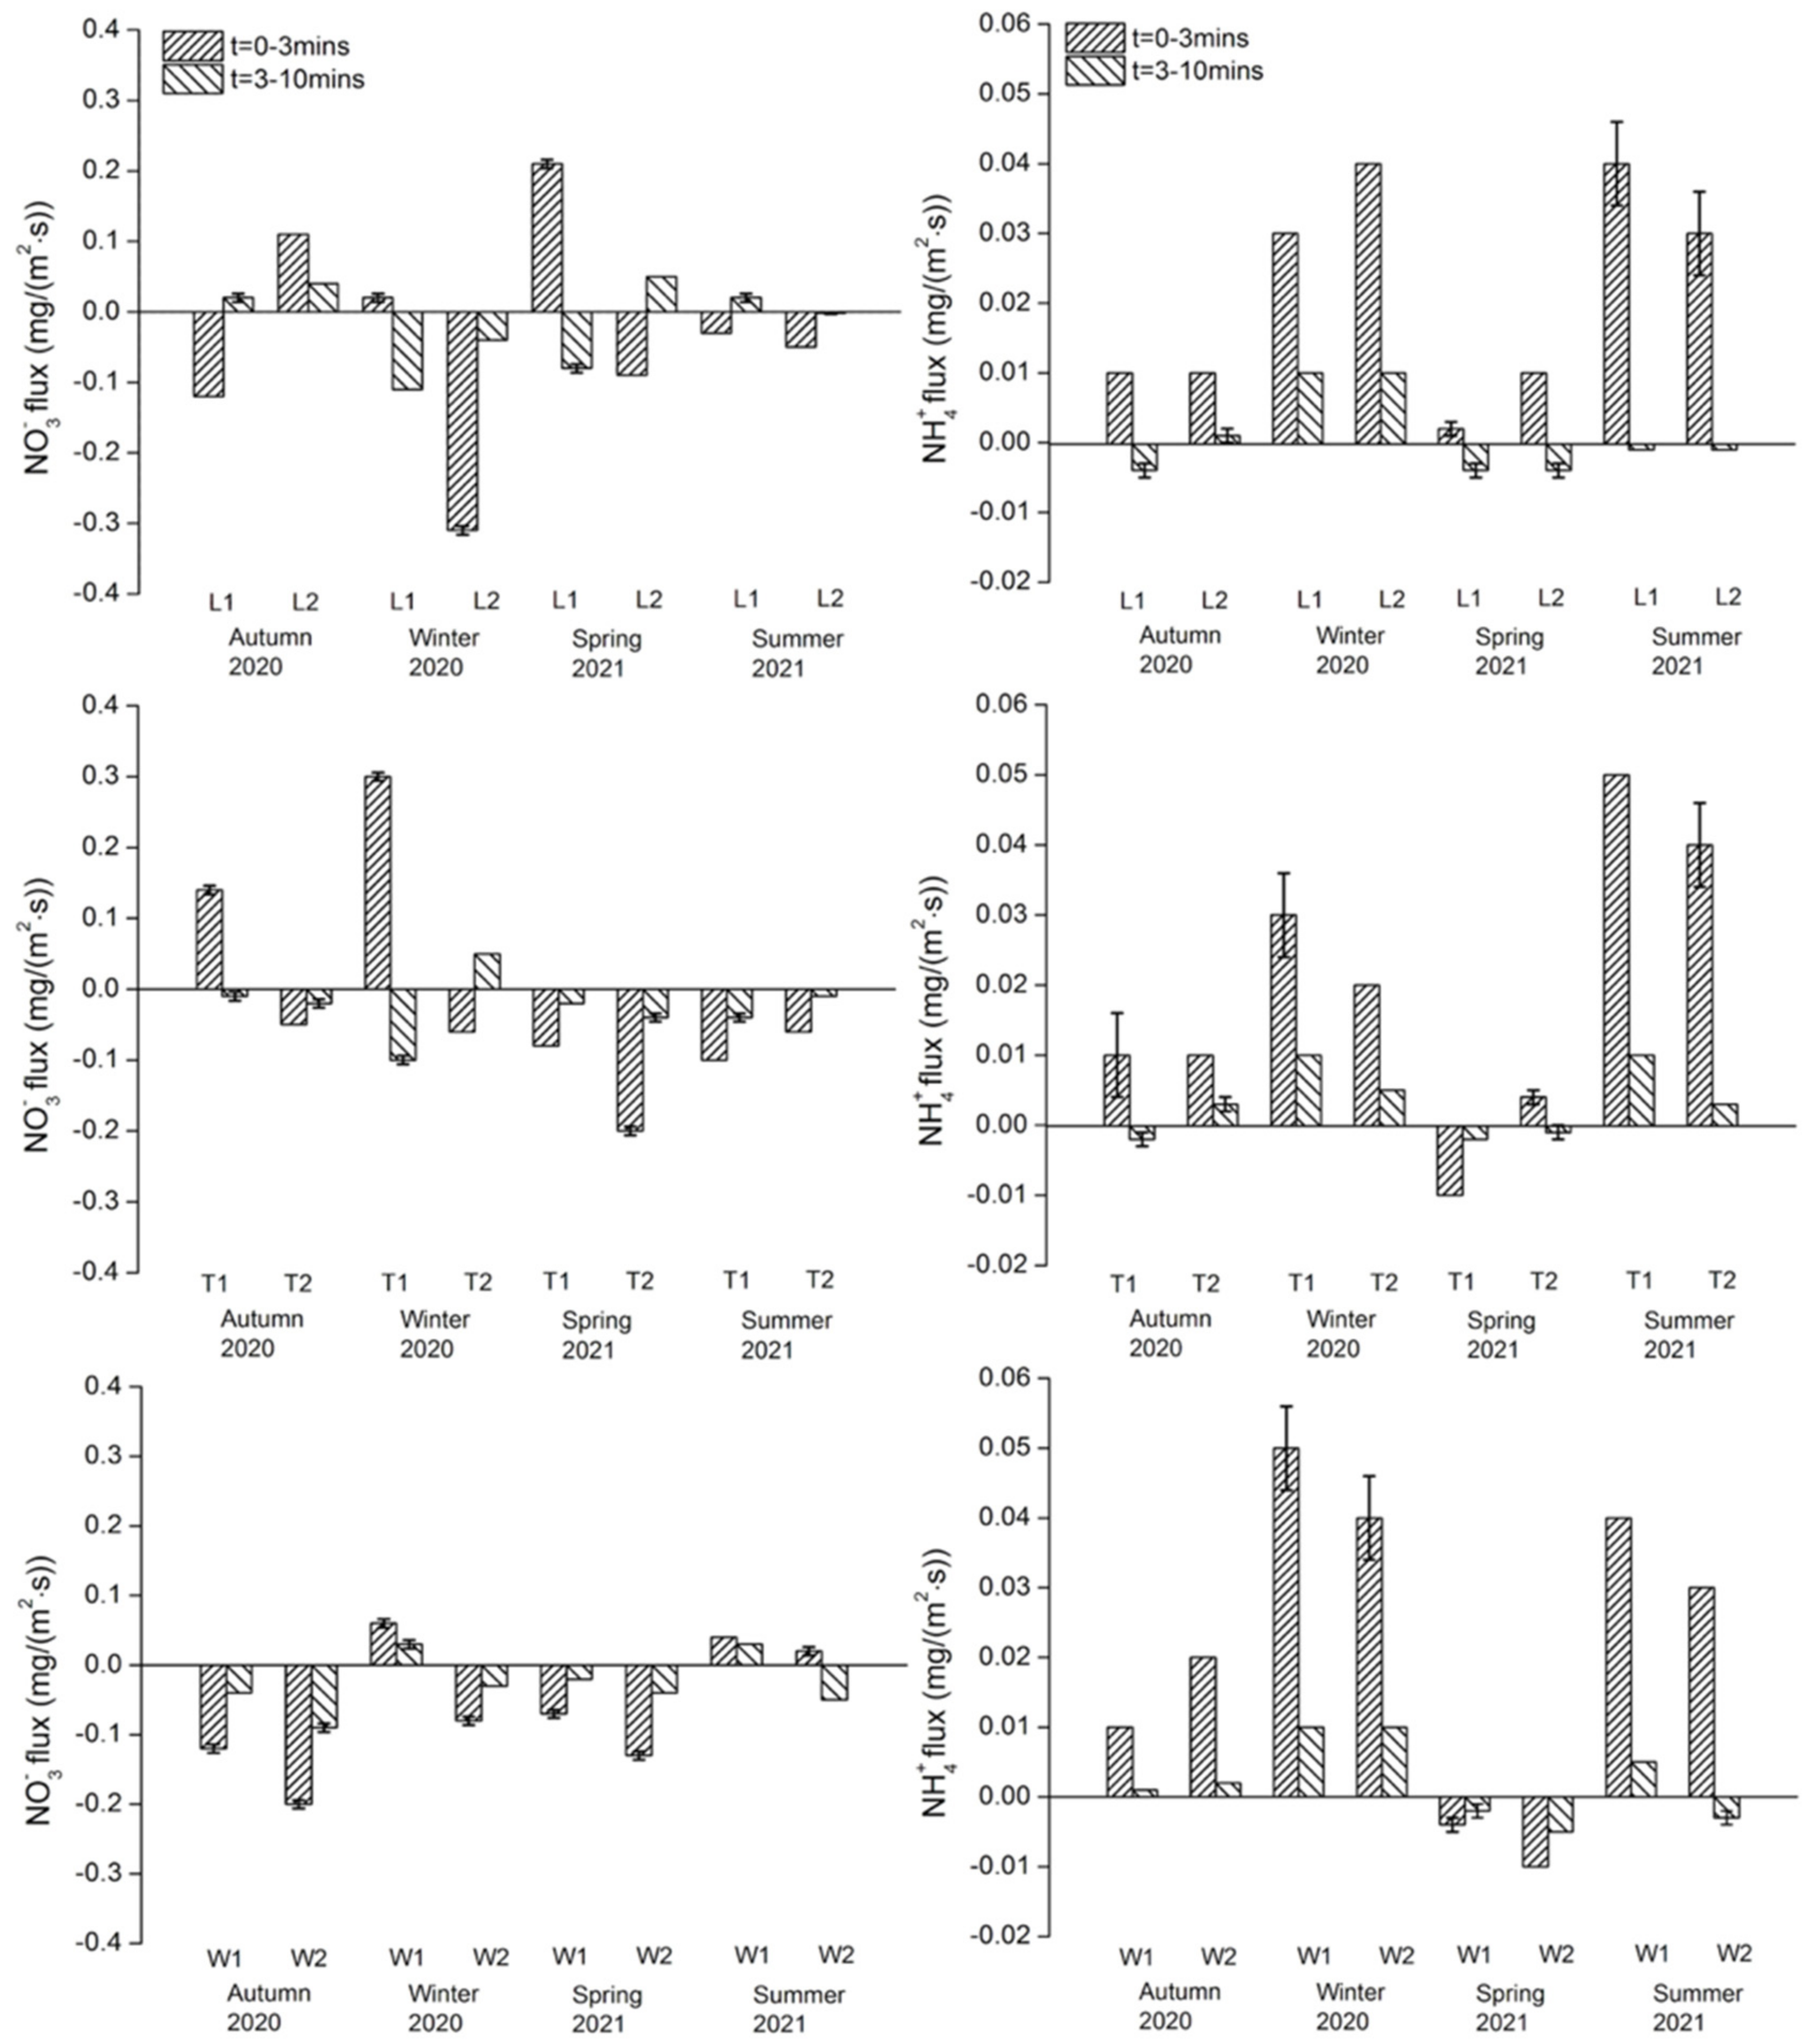
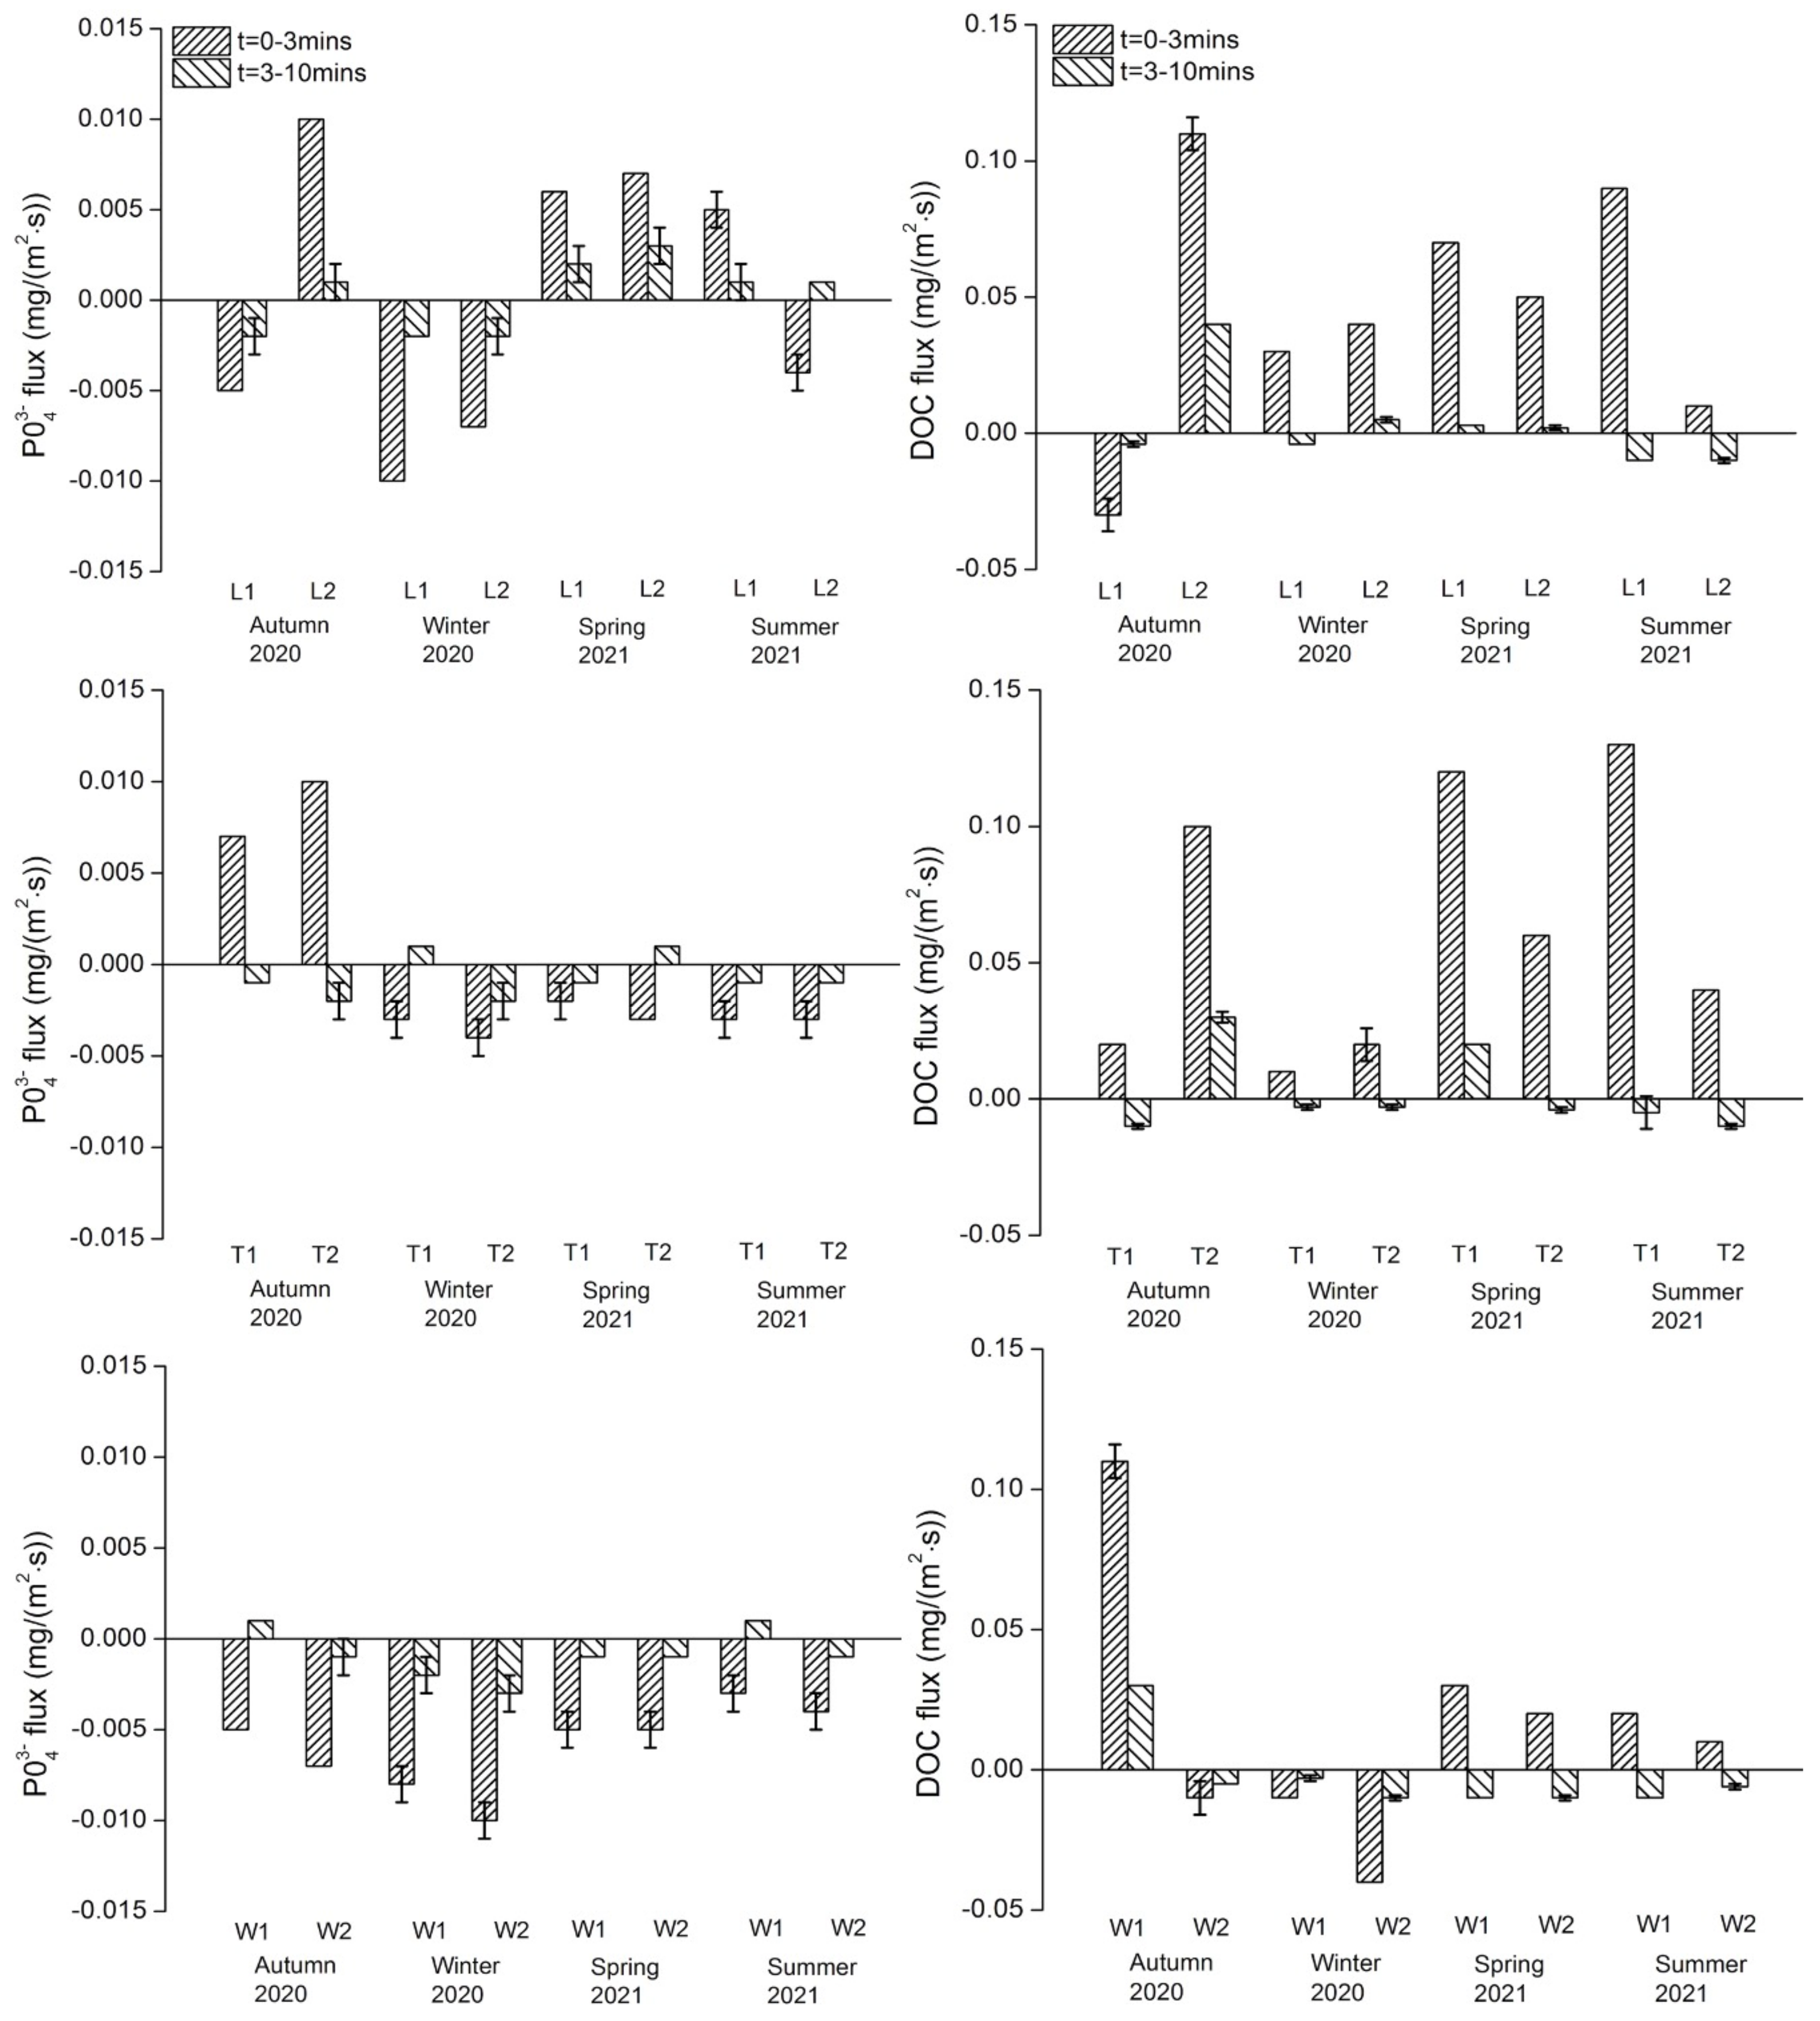
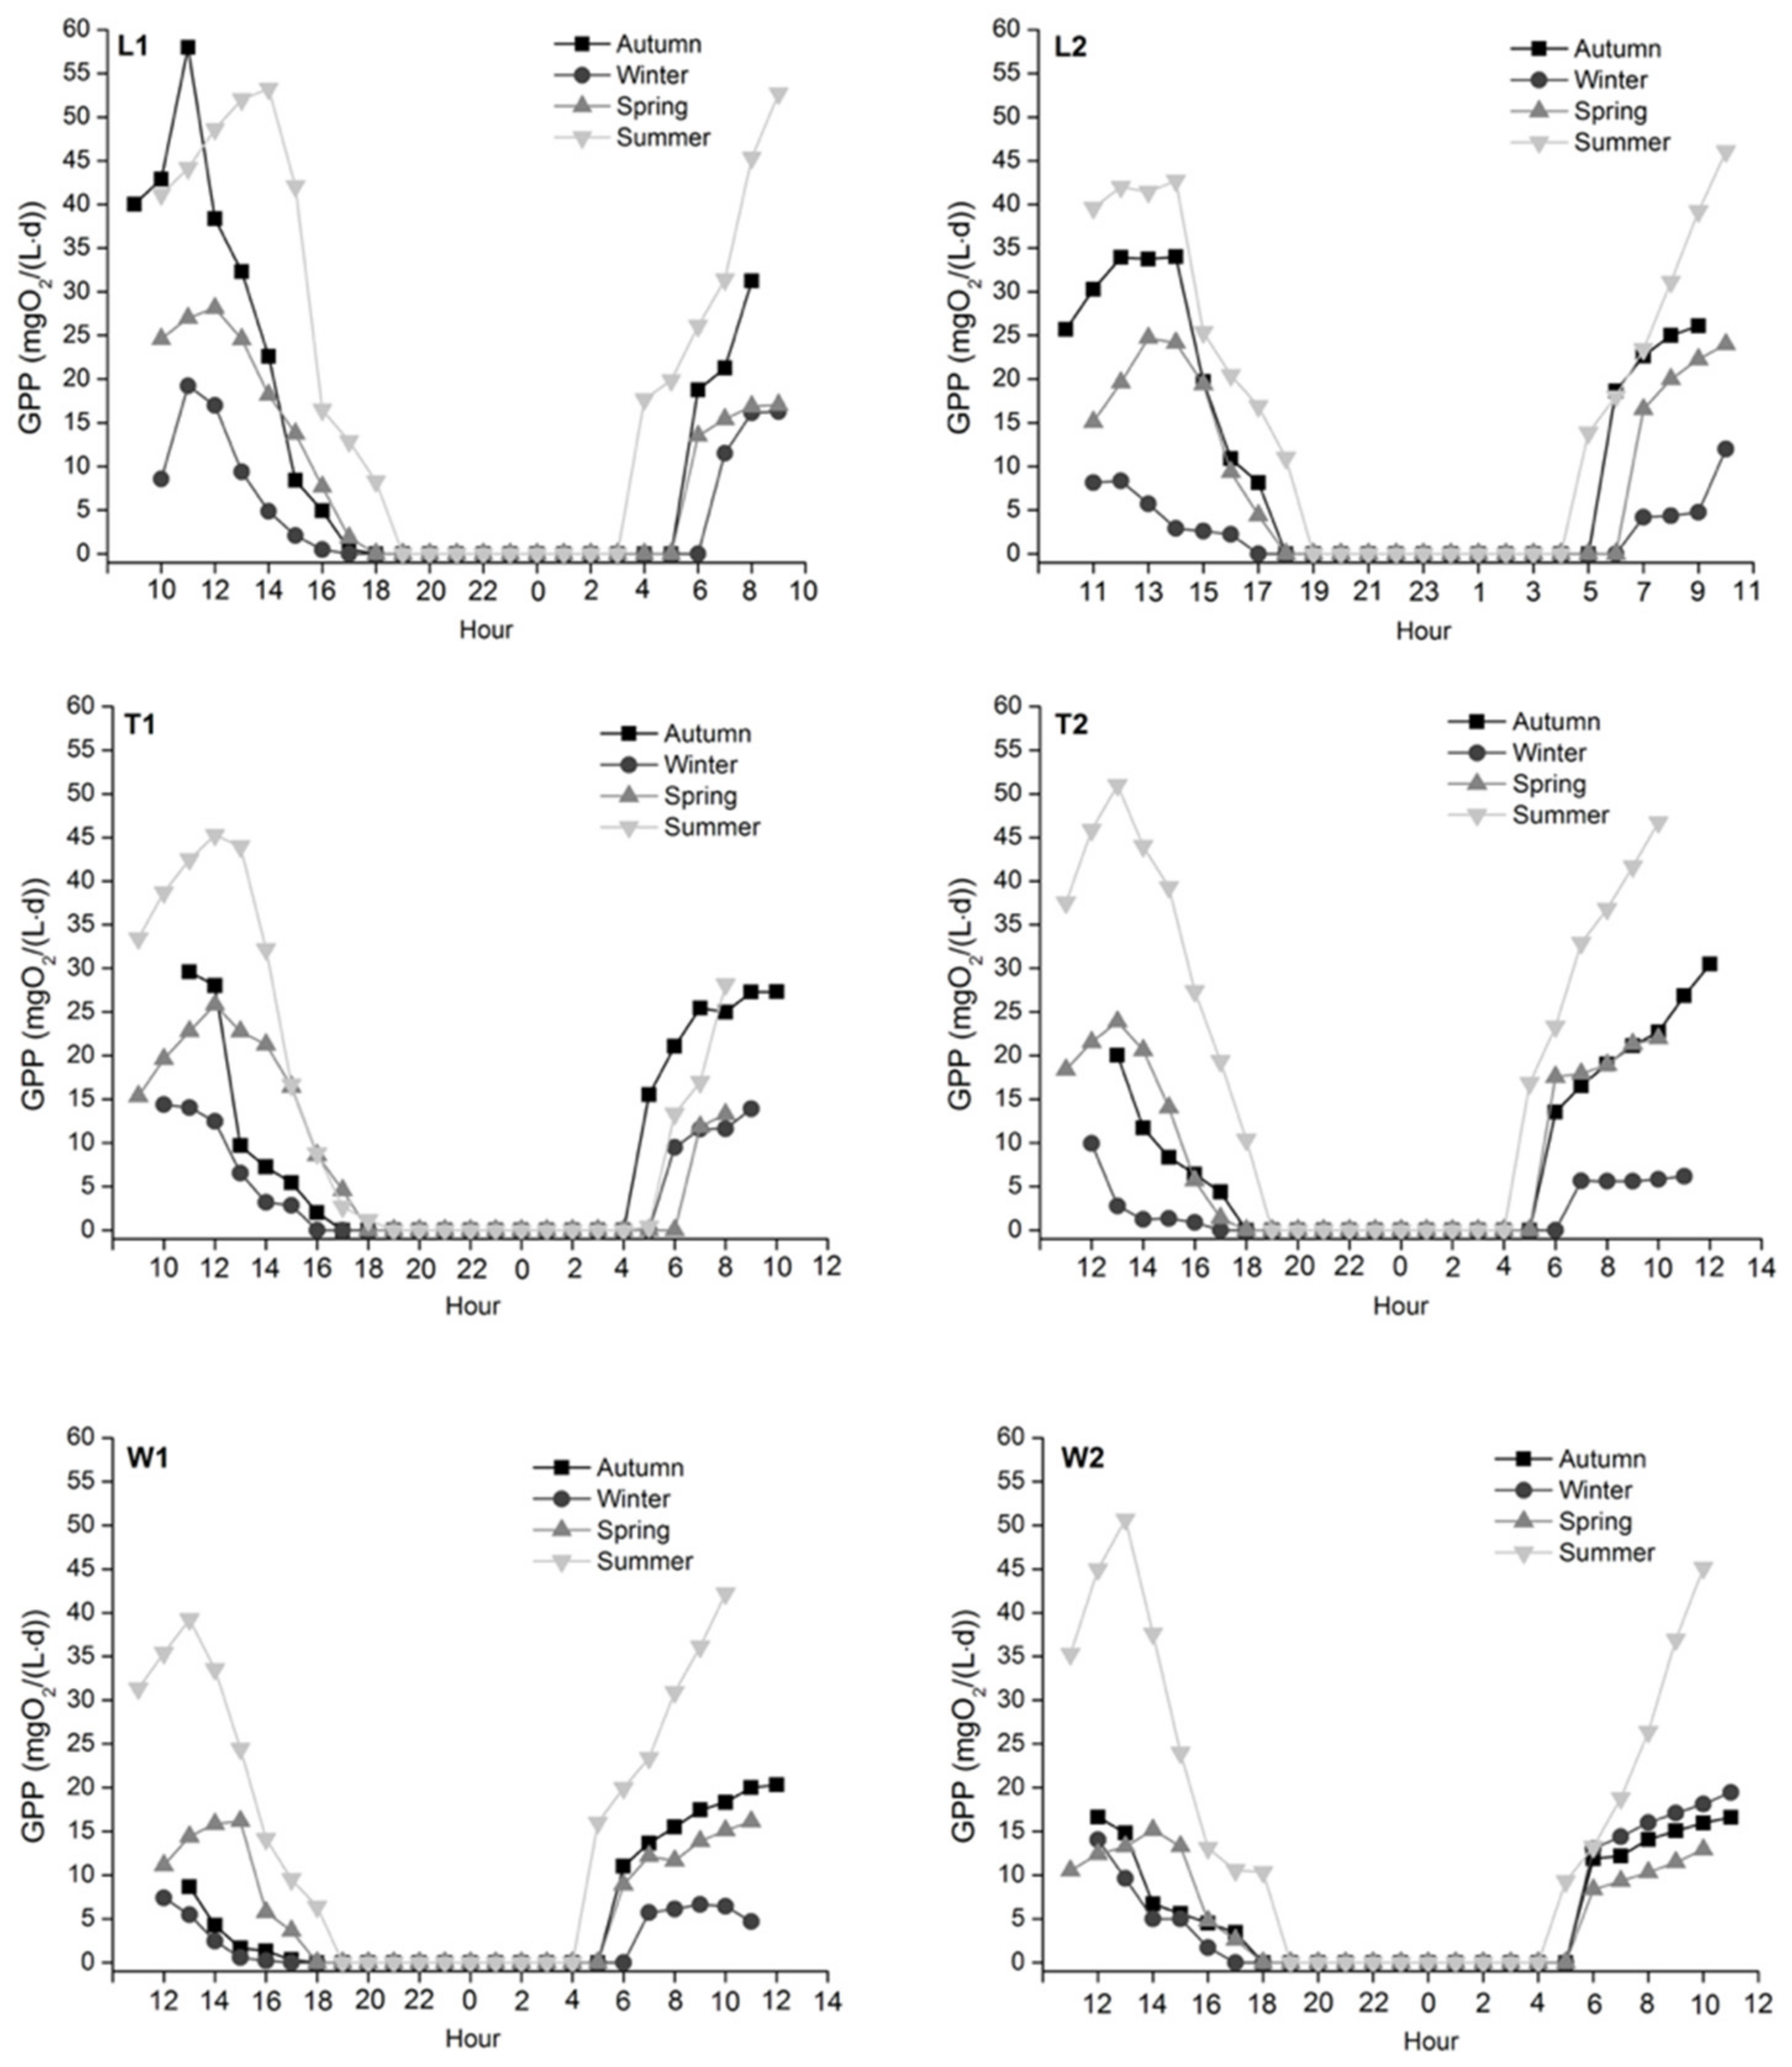
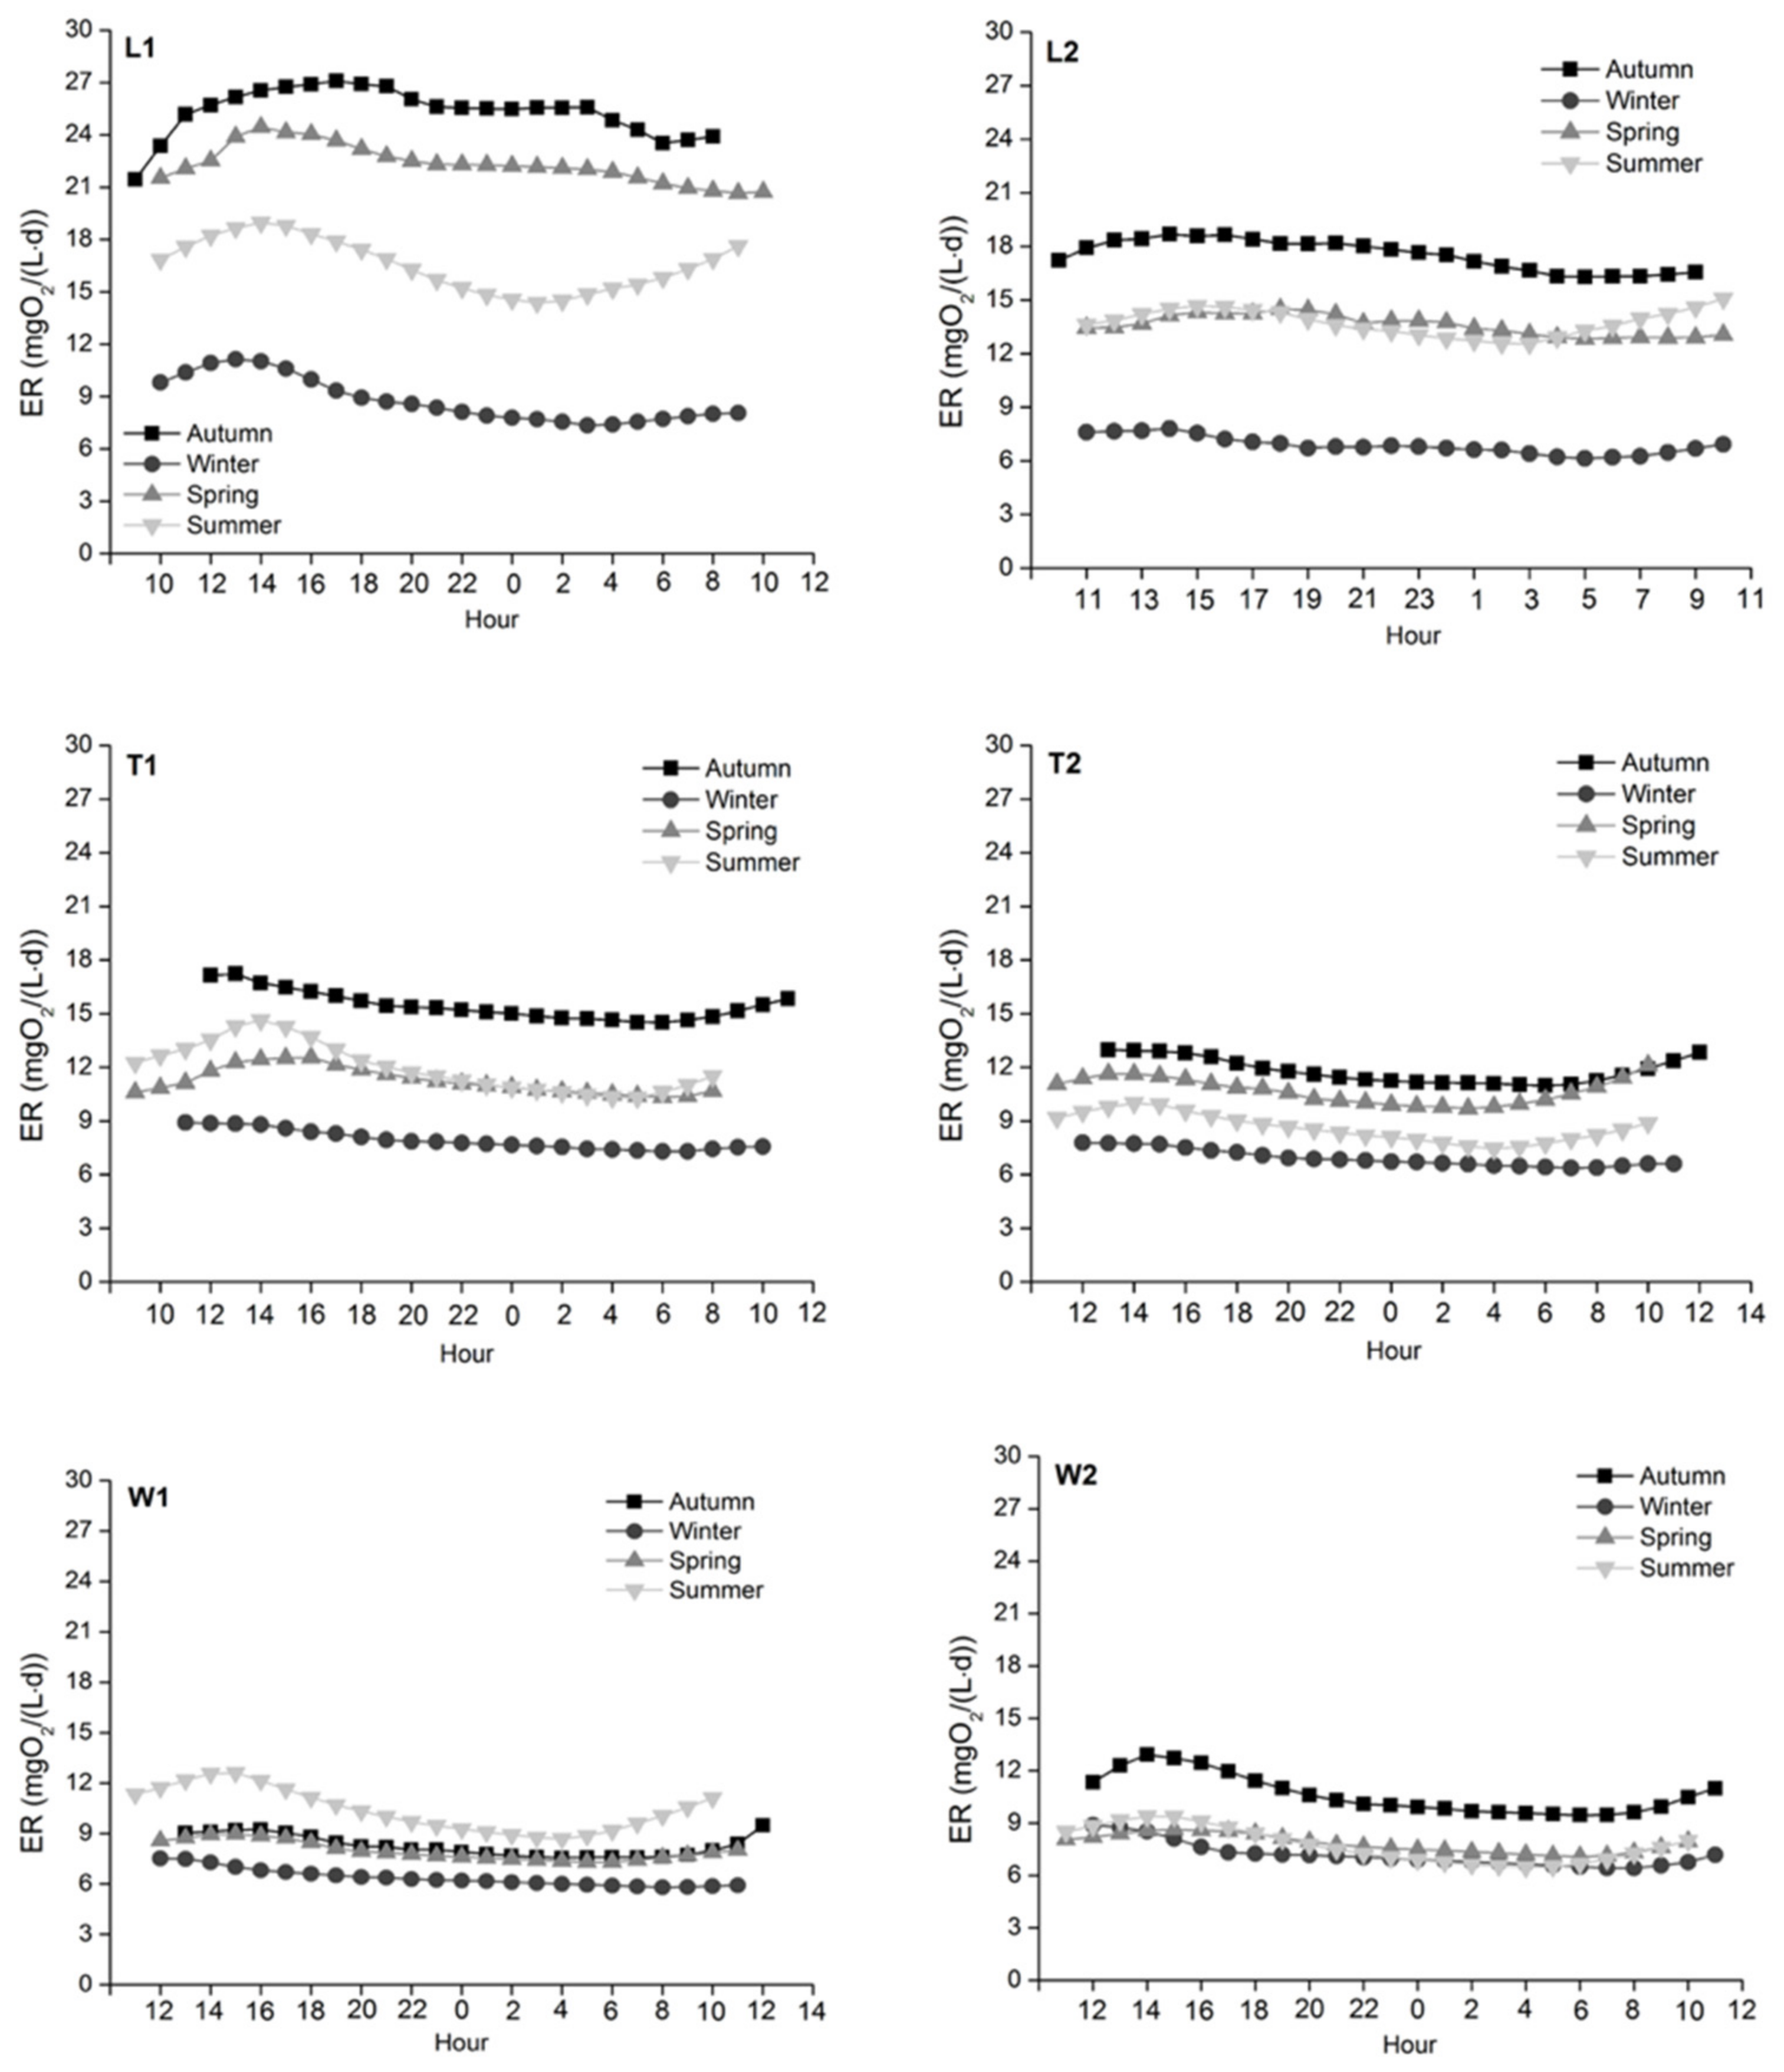
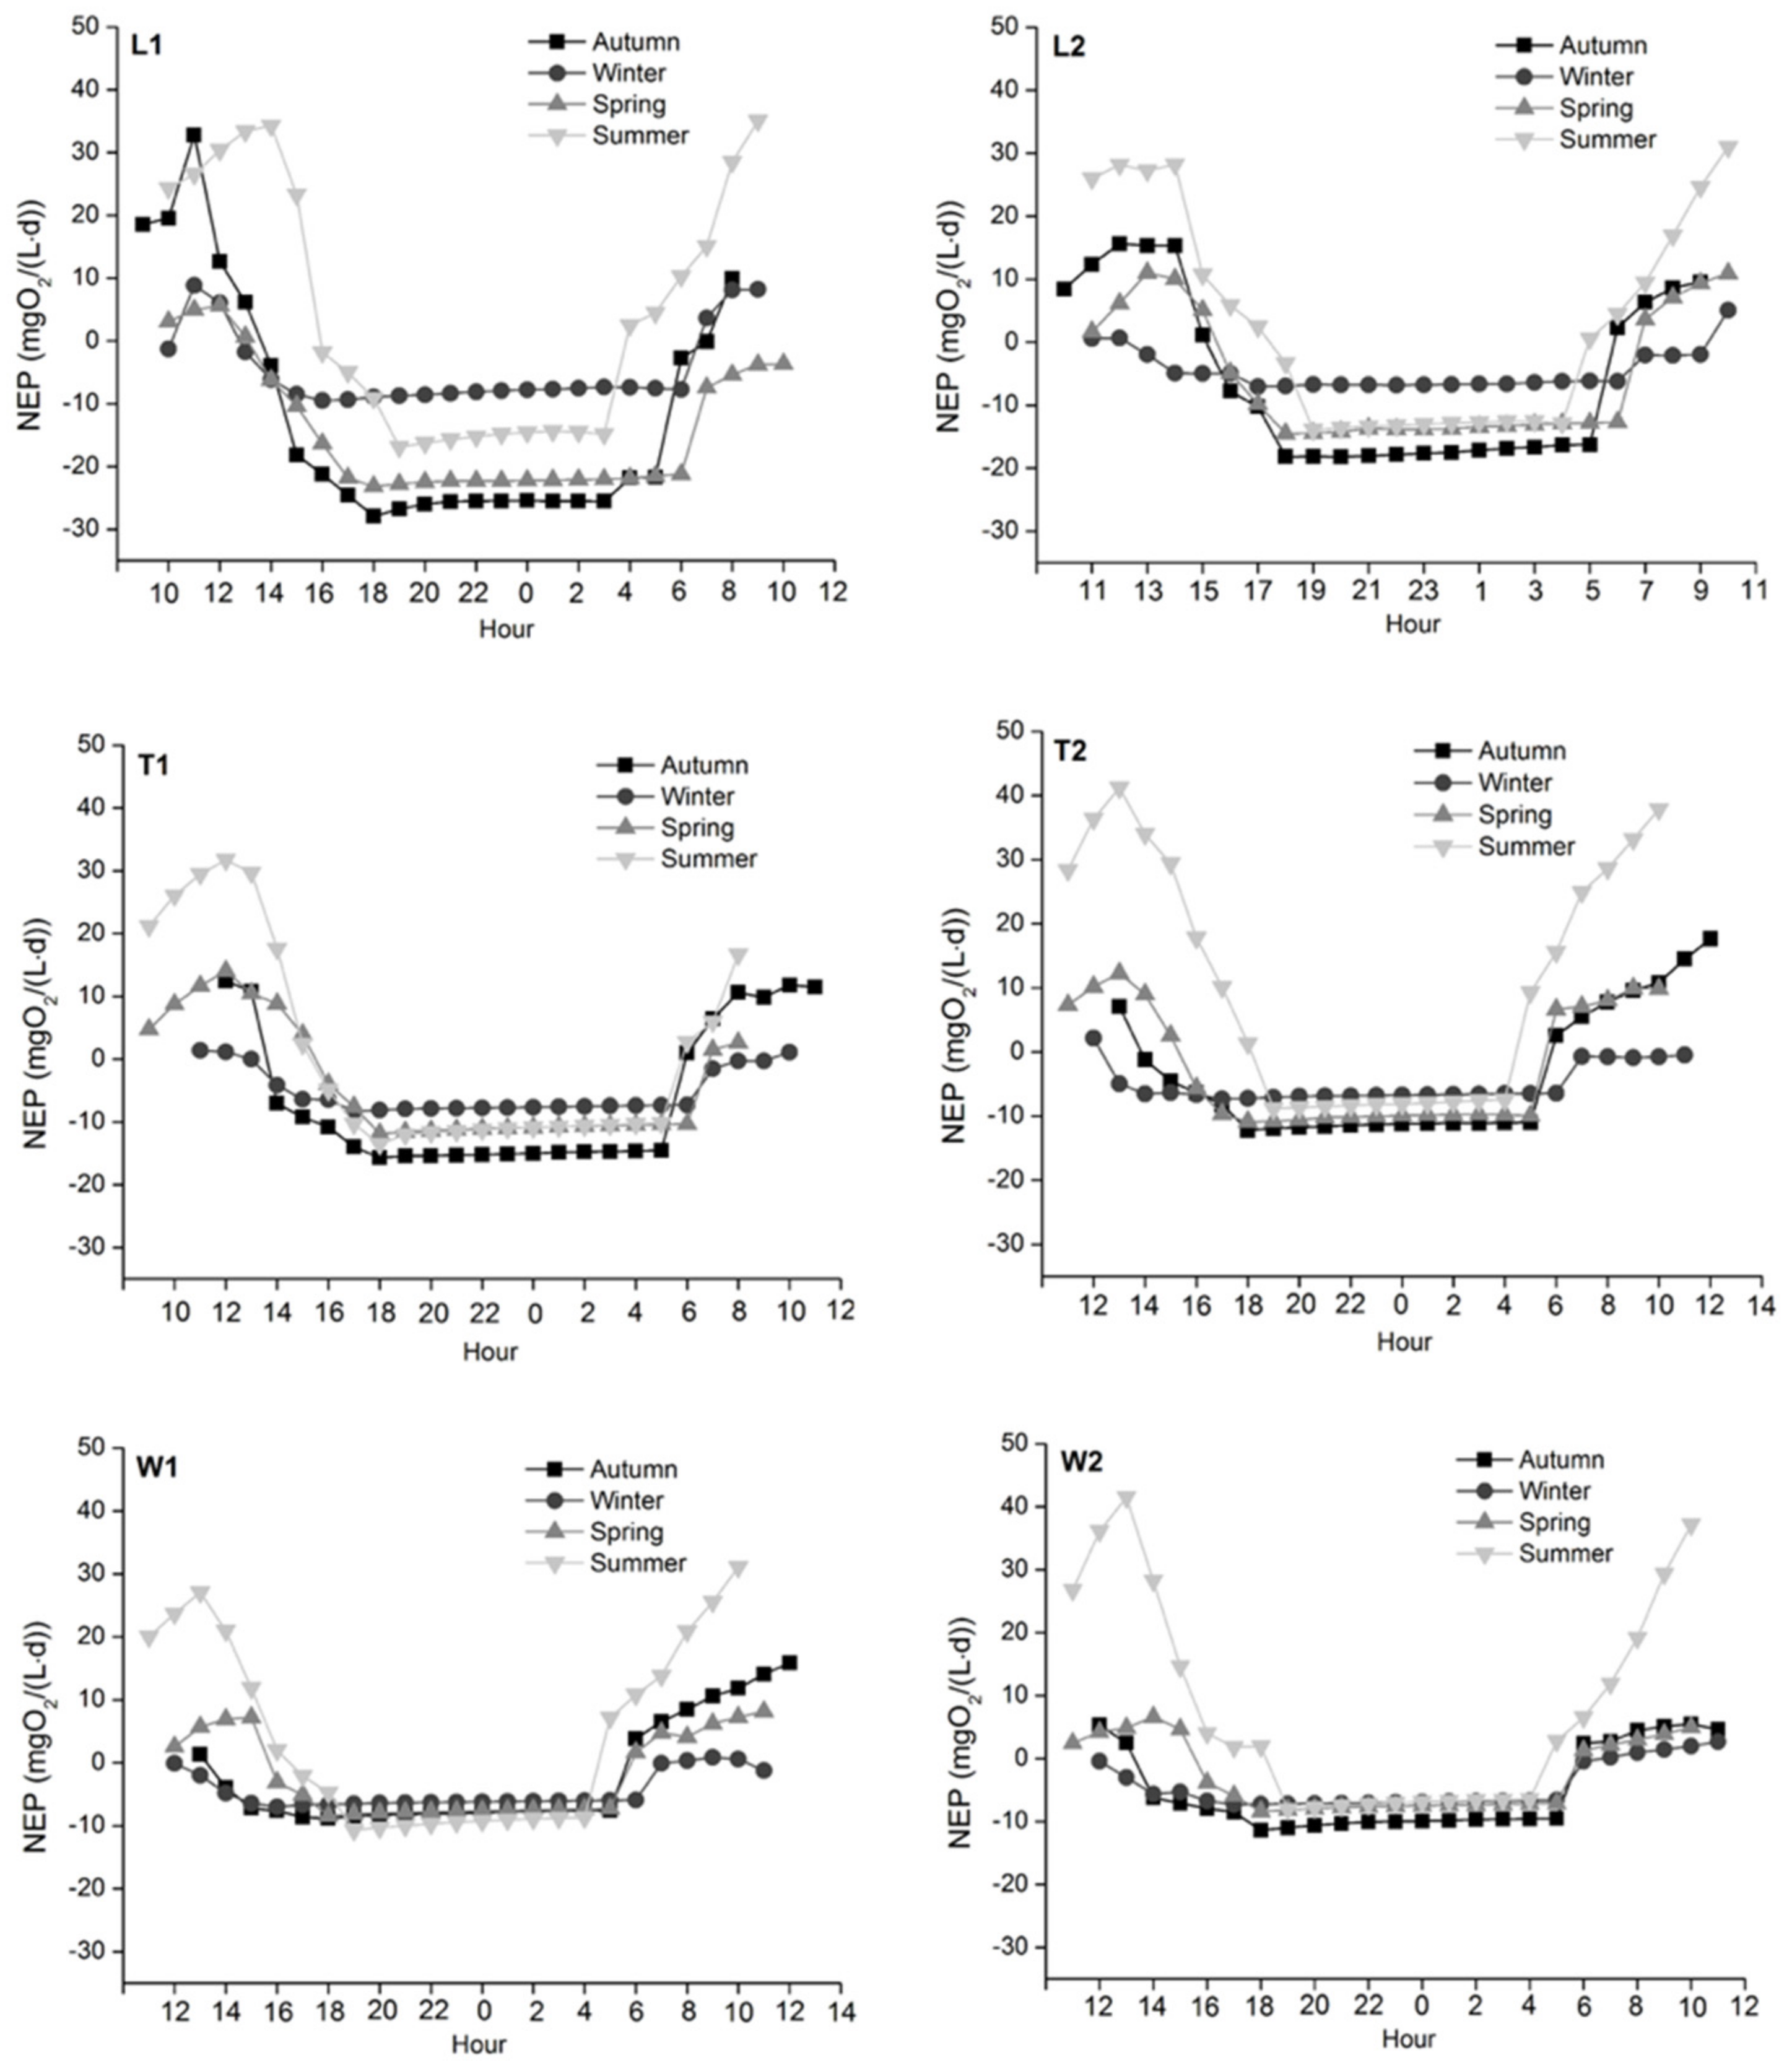
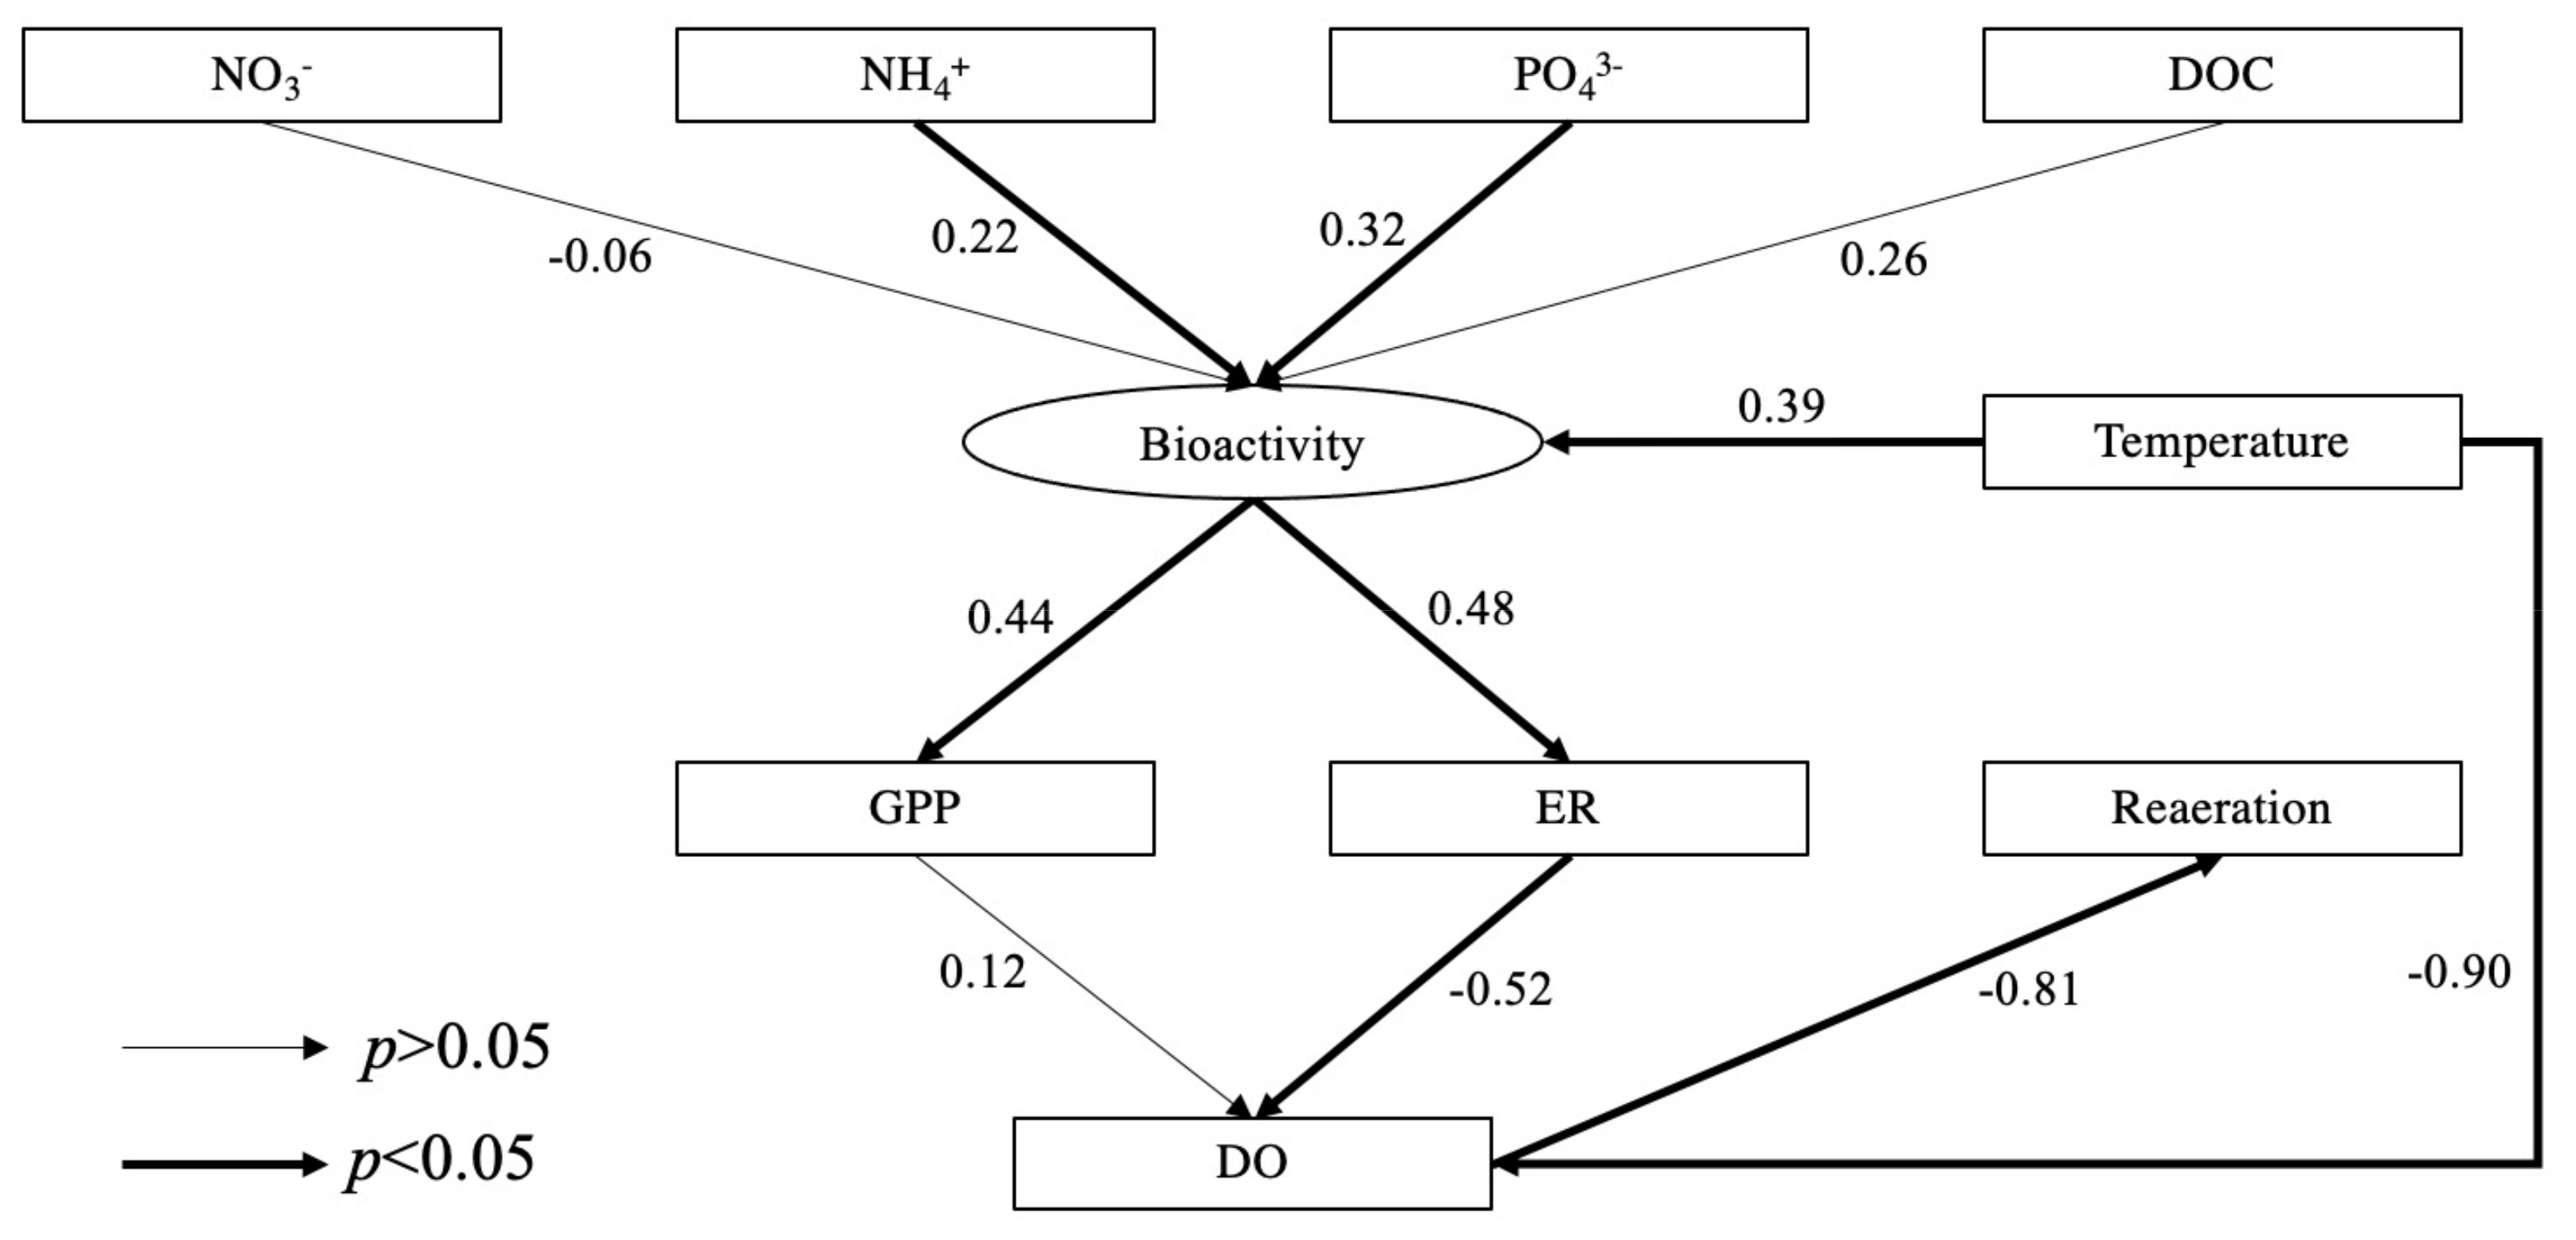
Table 1.
Seasonal variation of DO concentrations and river metabolic variables across study sites.
| Site | Season | DO (mg/L) | Reaeration (mgO2/(L·d)) | GPP (mgO2/(L·d)) | ER (mgO2/(L·d)) | NEP (mgO2/(L·d)) | Activation Energy (eV) |
|---|---|---|---|---|---|---|---|
| L1 | Autumn | 7.0 (4.3–10.0) | 5.3 (−5.3–14.2) | 13.3 (0–57.9) | 24.7 (21.3–27.9) | −11.4 (−27.9–32.8) | 0.57 (0.56–0.57) |
| Winter | 5.7 (3.9–7.9) | 6.2 (3.2–8.8) | 4.4 (0–19.2) | 8.8 (7.4–11.1) | −4.4 (–9.5–8.8) | 0.54 (0.54–0.55) | |
| Spring | 6.7 (5.3–8.7) | 13.1 (2.2–19.7) | 8.3 (0–28.1) | 22.3 (20.7–24.4) | −14.0 (–23.2–5.6) | 0.56 (0.56–0.56) | |
| Summer | 8.0 (4.6–11.4) | −1.3 (−6.5–3.9) | 20.6 (0–53.2) | 16.5 (14.4–19.0) | 4.1 (−16.9–35.1) | 0.58 (0.57–0.58) | |
| L2 | Autumn | 7.8 (4.9–11.1) | 1.5 (−3.2–5.9) | 12.0 (0–33.9) | 17.5 (16.3–18.7) | −5.5 (−18.2–15.6) | 0.57 (0.56–0.57) |
| Winter | 6.2 (5.0–7.6) | 6.8 (4.6–8.7) | 2.3 (0–12.0) | 6.9 (6.1–7.8) | −4.6 (−7.1–5.1) | 0.54 (0.54–0.55) | |
| Spring | 7.2 (5.5–9.0) | 2.2 (−0.7–4.7) | 8.3 (0–24.7) | 13.6 (12.8–14.5) | −5.3 (−14.5–11.0) | 0.57 (0.57–0.58) | |
| Summer | 8.9 (7.3–10.7) | −4.0 (−11.6–2.2) | 17.1 (0–46.0) | 13.7 (12.6–15.1) | 3.4 (−13.9–31.0) | 0.58 (0.57–0.58) | |
| T1 | Autumn | 7.0 (4.1–10.5) | 2.3 (−2.2–5.6) | 9.6 (0–29.6) | 15.5 (14.5–17.2) | −5.8 (−15.7–12.5) | 0.56 (0.56–0.57) |
| Winter | 6.9 (5.5–8.6) | 5.5 (2.5–7.7) | 2.8 (0–10.3) | 7.9 (7.3–8.9) | −5.1 (−8.3–1.4) | 0.55 (0.55–0.55) | |
| Spring | 8.5 (6.9–10.3) | 0.4 (−4.3–4.5) | 7.6 (0–25.8) | 11.2 (10.3–12.6) | −3.6 (–11.9–14.0) | 0.57 (0.56–0.57) | |
| Summer | 9.1 (7.3–11.3) | −3.3 (−10.4–2.0) | 13.4 (0–45.3) | 12.0 (10.3–14.6) | 1.4 (−13.5–31.7) | 0.58 (0.57–0.58) | |
| T2 | Autumn | 8.4 (6.8–10.3) | 1.5 (−4.1–5.6) | 8.4 (0–30.5) | 11.8 (11.0–13.0) | −3.4 (−12.2–17.6) | 0.56 (0.56–0.56) |
| Winter | 6.8 (5.6–8.4) | 4.6 (2.2–6.3) | 1.9 (0–9.9) | 6.9 (6.4–7.8) | −5.0 (−7.3–2.1) | 0.55 (0.55–0.55) | |
| Spring | 8.5 (6.7–10.5) | 0.02 (−1.3–1.3) | 8.5 (0–23.9) | 11.1 (10.7–12.1) | −2.6 (−11.1–12.3) | 0.57 (0.57–0.57) | |
| Summer | 10.3 (8.7–12.1) | −8.6 (−16.3–1.6) | 19.7 (0–51.0) | 8.6 (7.5–10.0) | 11.1 (−8.8–41.2) | 0.57 (0.57–0.58) | |
| W1 | Autumn | 7.8 (6.5–9.7) | 1.5 (−2.1–3.8) | 6.1 (0–25.3) | 8.2 (7.6–9.5) | −2.1 (−8.8–15.8) | 0.56 (0.56–0.57) |
| Winter | 6.1 (4.9–7.5) | 6.9 (4.6–8.7) | 1.9 (0–7.4) | 6.4 (5.8–7.5) | −4.5 (−7.0–0.8) | 0.55 (0.54–0.55) | |
| Spring | 8.0 (6.6–9.6) | 1.7 (−0.4–3.5) | 6.0 (0–16.2) | 8.0 (7.3–9.0) | −1.9 (−8.5–8.1) | 0.56 (0.55–0.56) | |
| Summer | 9.8 (8.2–11.4) | −3.3 (−7.1–0.3) | 15.1 (0–42.2) | 10.4 (8.7–12.6) | 4.7 (−10.7–31.1) | 0.57 (0.57–0.58) | |
| W2 | Autumn | 7.7 (6.2–9.8) | 2.0 (−2.6–5.1) | 5.7 (0–16.6) | 10.6 (9.5–12.9) | −4.9 (−11.4–5.5) | 0.56 (0.56–0.57) |
| Winter | 6.0 (4.8–7.7) | 7.8 (5.2–9.7) | 2.8 (0–9.8) | 7.2 (6.4–8.9) | –4.4 (−7.3–2.7) | 0.54 (0.54–0.55) | |
| Spring | 8.1 (6.9–9.4) | 2.2 (−0.2–4.3) | 5.2 (0–15.2) | 7.8 (7.1–8.6) | −2.6 (−8.4–6.6) | 0.56 (0.55–0.56) | |
| Summer | 9.3 (8.0–11.0) | 5.7 (−14.8–1.4) | 15.7 (0–50.7) | 7.7 (6.5–9.4) | 8.0 (−8.1–41.5) | 0.57 (0.57–0.58) |
Table 2.
Stepwise regression (forward selection) for each nutrient fluxes with nutrient concentrations and water temperature.
Table 2.
Stepwise regression (forward selection) for each nutrient fluxes with nutrient concentrations and water temperature.
| NO3− Concentration | NH4+ Concentration | PO43− Concentration | DOC Concentration | Water Temperature | DO | |
|---|---|---|---|---|---|---|
| NO3− flux F = 4.368 p = 0.042 | 𝛽 = −0.525 R2 = 0.292 P = 0.042 | |||||
| NH4+ flux F = 28.185 p < 0.001 | 𝛽 = 0.612 r2 = 0.612 p < 0.001 | |||||
| PO43− flux F = 6.194 P = 0.016 | 𝛽 = −0.622 r2 = 0.341 p = 0.016 | 𝛽 = −0.662 r2 = 0.453 p = 0.001 | ||||
| DOC flux F = 12.158 p = 0.001 | 𝛽 = −0.277 r2 = 0.113 p = 0.043 |
Note: Data involved in the regression analysis contains both exposure periods. The final model summary statistics are reported for each flux (below label). Individual parameter fit summary statistics for selected models are given in grid cells. The blacked-out grid cells indicate that these parameters were not selected by the final model. 𝛽 is the standardized regression coefficient; r2 is the proportion of variance for a dependent variable that is explained by an independent variable; p is the significance value for each parameter reported.
Table 3.
Mean and seasonal range of GPP and ER (both were multiplied by water depth) across the study sites during the study period. The minimum and maximum GPP appeared in winter and summer, respectively. The minimum and maximum ER appeared in winter and autumn (or summer at W1), respectively. Impacts relate to the degree of impaired ecosystem functioning.
| Site | GPP (Min Mean–Max Mean) (gO2·m−2·d−1) | Impact | ER (Min Mean–Max Mean) (gO2·m−2·d−1) | Impact |
|---|---|---|---|---|
| L1 | 0.9–8.2 | No to severe effect | 1.8–7.4 | Mild to severe effect |
| L2 | 0.7–10.3 | No to severe effect | 2.1–8.8 | Mild to severe effect |
| T1 | 0.6–4.0 | Mild to severe effect | 1.6–4.6 | Severe effect |
| T2 | 0.8–13.8 | No to severe effect | 2.8–7.1 | Mild to severe effect |
| W1 | 0.6–9.1 | No to severe effect | 1.9–6.2 | Mild to severe effect |
| W2 | 1.1–12.5 | No to severe effect | 2.9–7.4 | Mild to severe effect |
Publisher’s Note: MDPI stays neutral with regard to jurisdictional claims in published maps and institutional affiliations. |
© 2022 by the authors. Licensee MDPI, Basel, Switzerland. This article is an open access article distributed under the terms and conditions of the Creative Commons Attribution (CC BY) license (https://creativecommons.org/licenses/by/4.0/).
Share and Cite
MDPI and ACS Style
Zhang, M.; Francis, R.A.; Chadwick, M.A. Nutrient Dynamics and Ecosystem Metabolism of Megacity Rivers: Influence of Elevated Nutrient Concentrations in Beijing’s Waterways. Water 2022, 14, 2963. https://doi.org/10.3390/w14192963
AMA Style
Zhang M, Francis RA, Chadwick MA. Nutrient Dynamics and Ecosystem Metabolism of Megacity Rivers: Influence of Elevated Nutrient Concentrations in Beijing’s Waterways. Water. 2022; 14(19):2963. https://doi.org/10.3390/w14192963
Chicago/Turabian StyleZhang, Meng, Robert A. Francis, and Michael A. Chadwick. 2022. "Nutrient Dynamics and Ecosystem Metabolism of Megacity Rivers: Influence of Elevated Nutrient Concentrations in Beijing’s Waterways" Water 14, no. 19: 2963. https://doi.org/10.3390/w14192963
Note that from the first issue of 2016, this journal uses article numbers instead of page numbers. See further details here.