
Estimation of Greenhouse-Grown Eggplant Evapotranspiration Based on a Crop Coefficient Model

1
Research Centre of Intelligent Equipment, Beijing Academy of Agriculture and Forestry Sciences, Beijing 100097, China
2
Institute of Environment and Sustainable Development in Agriculture, CAAS, Beijing 100081, China
3
Beijing Key Laboratory of Ecological Function Assessment and Regulation Technology of Green Space, Beijing Urban Ecosystem Positioning Observation and Research Station, Beijing Institute of Landscape Architecture, Beijing 100102, China
4
The Institute of Agricultural Information and Economics (IAIE), Hebei Academy of Agriculture and Forestry Sciences, Shijiazhuang 050051, China
*
Author to whom correspondence should be addressed.
Water 2022, 14(19), 2959; https://doi.org/10.3390/w14192959
Submission received: 12 August 2022
/
Revised: 12 September 2022
/
Accepted: 16 September 2022
/
Published: 21 September 2022
(This article belongs to the Special Issue Agricultural Water Saving: Advanced Technologies for Water Resources Efficient Utilization)
Abstract
:Accurate estimation of crop evapotranspiration (ETc) is important to determine crop water requirements in greenhouse agriculture and to improve the irrigation water use efficiency. Here, a 3-year (2017–2019) experiment with spring greenhouse-grown eggplant (Solanum melongena L.) was conducted to investigate variation in the crop coefficient (Kc) measured with a weighing lysimeter, adjust Kc based on the local climate (Kc,Adj), and estimate daily ETc using a crop coefficient model. The 3-years mean local Kc (Kc,Loc) were 0.23 ± 0.03, 0.62 ± 0.06, 1.05 ± 0.03 and 0.87 ± 0.03 at the initial, development, mid-season, and end-season stages, respectively. Significant linear correlation was observed between Kc,Adj and Kc,Loc in the 3 years (R2 = 0.873, 0.901, and 0.897 in 2017–2019, respectively). Compared with the FAO-56 recommended Kc value (Kc,FAO), the mean Kc,Adj and Kc,Loc in the 3 years were by 66.3% and 61.8% lower, respectively. The single crop coefficient model accurately estimated daily ETc for greenhouse-grown eggplant. The coefficient of determination (R2), mean absolute error (MAE), root-mean-squared error (RMSE), and index of agreement between measured ETc and that estimated by the single crop coefficient model were 0.94, 0.35 mm‧d−1, 0.26 mm‧d−1, and 0.98, respectively, for the means in 2018 and 2019. Therefore, the crop coefficient method reliably estimated evapotranspiration with adjustment for the actual environment and can serve as a useful tool to improve water use efficiency.
1. Introduction
Globally, the production of vegetables in greenhouses has developed rapidly in recent years, due to its good economic benefits and being relatively unaffected by changes in the seasons. Eggplant (Solanum melongena L.) is among the most widely planted vegetables worldwide [1]. Global annual eggplant production is currently around 56.3 million tons, of which China alone produces 36.6 million tons [2]. Eggplant fruit contains a variety of alkaloids and high levels of anthocyanins, which are beneficial for human health, for example, in suppressing cancer and lowering blood lipids level, while also having a high level of chlorogenic acid [3,4]. Previous studies reported that a suitable irrigation schedule improves the yield and quality of eggplant fruit [5,6].
Crop evapotranspiration (ETc) plays an important role in formulating a reasonable irrigation scheme and realizing effective water management of crops, and is crucial for the energy and water balance in agricultural ecosystems. Measurement of ETc can be performed directly by experimental observations (e.g., using the eddy covariance method or a weighing lysimeter) or by estimation with a model (e.g., the crop coefficient method or Priestley–Taylor coefficient). The crop coefficient method is regarded as a reliable approach to estimate ETc that multiplies reference evapotranspiration (ET0) by a crop coefficient (Kc), as described in the ‘FAO-56′ document by Allen et al. [7]. ET0 is the rate of evapotranspiration with an assumed reference crop height of 0.12 m, fixed surface resistance of 70 s‧m−1, and albedo of 0.23, and its calculation has been standardized by the FAO-56 [7,8]. Kc represents the integration of the effects of the primary characteristics that distinguish the specific crop from the reference crop [7,8,9]. Recommendations on the lengths of four stages of crop development and corresponding typical Kc values for different crops are presented in FAO-56, and recently Kc has been updated for vegetable crops [10,11]. However, Kc values vary greatly at different stages of crop growth and are affected by crop characteristics, climate, cultivation, and management methods. Therefore, it is necessary to adjust the recommended Kc value based on local data sets when using the crop coefficient model to estimate ETc. Wang et al. [12] reported that a modified crop coefficient model can provide a reliable prediction of daily ETc. The estimated and observed ETc showed a linear regression relationship during four maize growth seasons over four years, with coefficient of determination (R2) values ranging from 0.80 to 0.88 and the root-mean-squared error (RMSE) ranging from 0.45 to 0.68 mm. Compared with the soil water balance method, the estimated ETc at each maize development stage estimated with the crop coefficient method was less than 3.0%, but the error for the entire growth season was only 1.9% [13]. To date, although many studies have discussed and developed crop coefficients for grain crops (e.g., wheat and maize) and fruit tree crops (e.g., grapes and citrus), and some studies have attempted to investigate the daily Kc of greenhouse-grown eggplant based on the water balance method [14], the accuracy of the crop coefficient method for estimating ETc for eggplant requires assessment.
The greenhouse cultivation environment is characterized by high temperature, high relative humidity, and poor air circulation. The method of calculating ET0 in a greenhouse differs in terms of the value of aerodynamic resistance incorporated into the calculation from that in an open-air environment [15], and a Kc value from an open-air environment will result in a large error if applied to a greenhouse environment [16]. It is questionable whether the standard recommended Kc value that was determined experimentally outdoors can be applied directly to estimate the ETc of greenhouse crops. In addition, the change in Kc at each crop development stage and its relationship with climate have not been considered, affecting the accuracy of ETc estimation [10,12]. Therefore, it is important to revise the Kc value at different growth stages for greenhouse-grown eggplant and to study its dynamics. A weighing lysimeter is considered to provide the most accurate and reliable measurement of ETc, and is considered the standard for the calibration of crop coefficients, as indicated in the FAO-56 methodology [17]. However, to the best of our knowledge, there is a lack of studies addressing this wider characterization of Kc for eggplant grown in greenhouses. Thus, the main objectives of the present study were to explore the dynamic variation in Kc of greenhouse-grown eggplant at different crop growth stages based on ETc measurements with a lysimeter from 2017 to 2019, and to assess the performance of the crop coefficient method for estimating ETc, to achieve precise moisture management for greenhouse-grown eggplant.
2. Materials and Methods
2.1. Experimental Site
This study was conducted in the experimental greenhouse of the Beijing Academy of Agriculture and Forestry Sciences, Beijing City (39°94′ N, 116°29′ E) from March to July in 2017, 2018, and 2019. The test greenhouse, built in 2016, was a 33 m-wide, three-span steel frame structure with a plantable span of 35 m from north to south. The experimental site is characterized by a temperate continental climate, with mean annual air temperature and precipitation of 11.1 °C and 500–600 mm, respectively. The soil in the greenhouse was sandy loam soil, the bulk density was 1.40 g‧cm−3, the field capacity was 0.28 m3‧m−3, and the organic matter was 15.9 g‧kg−1.
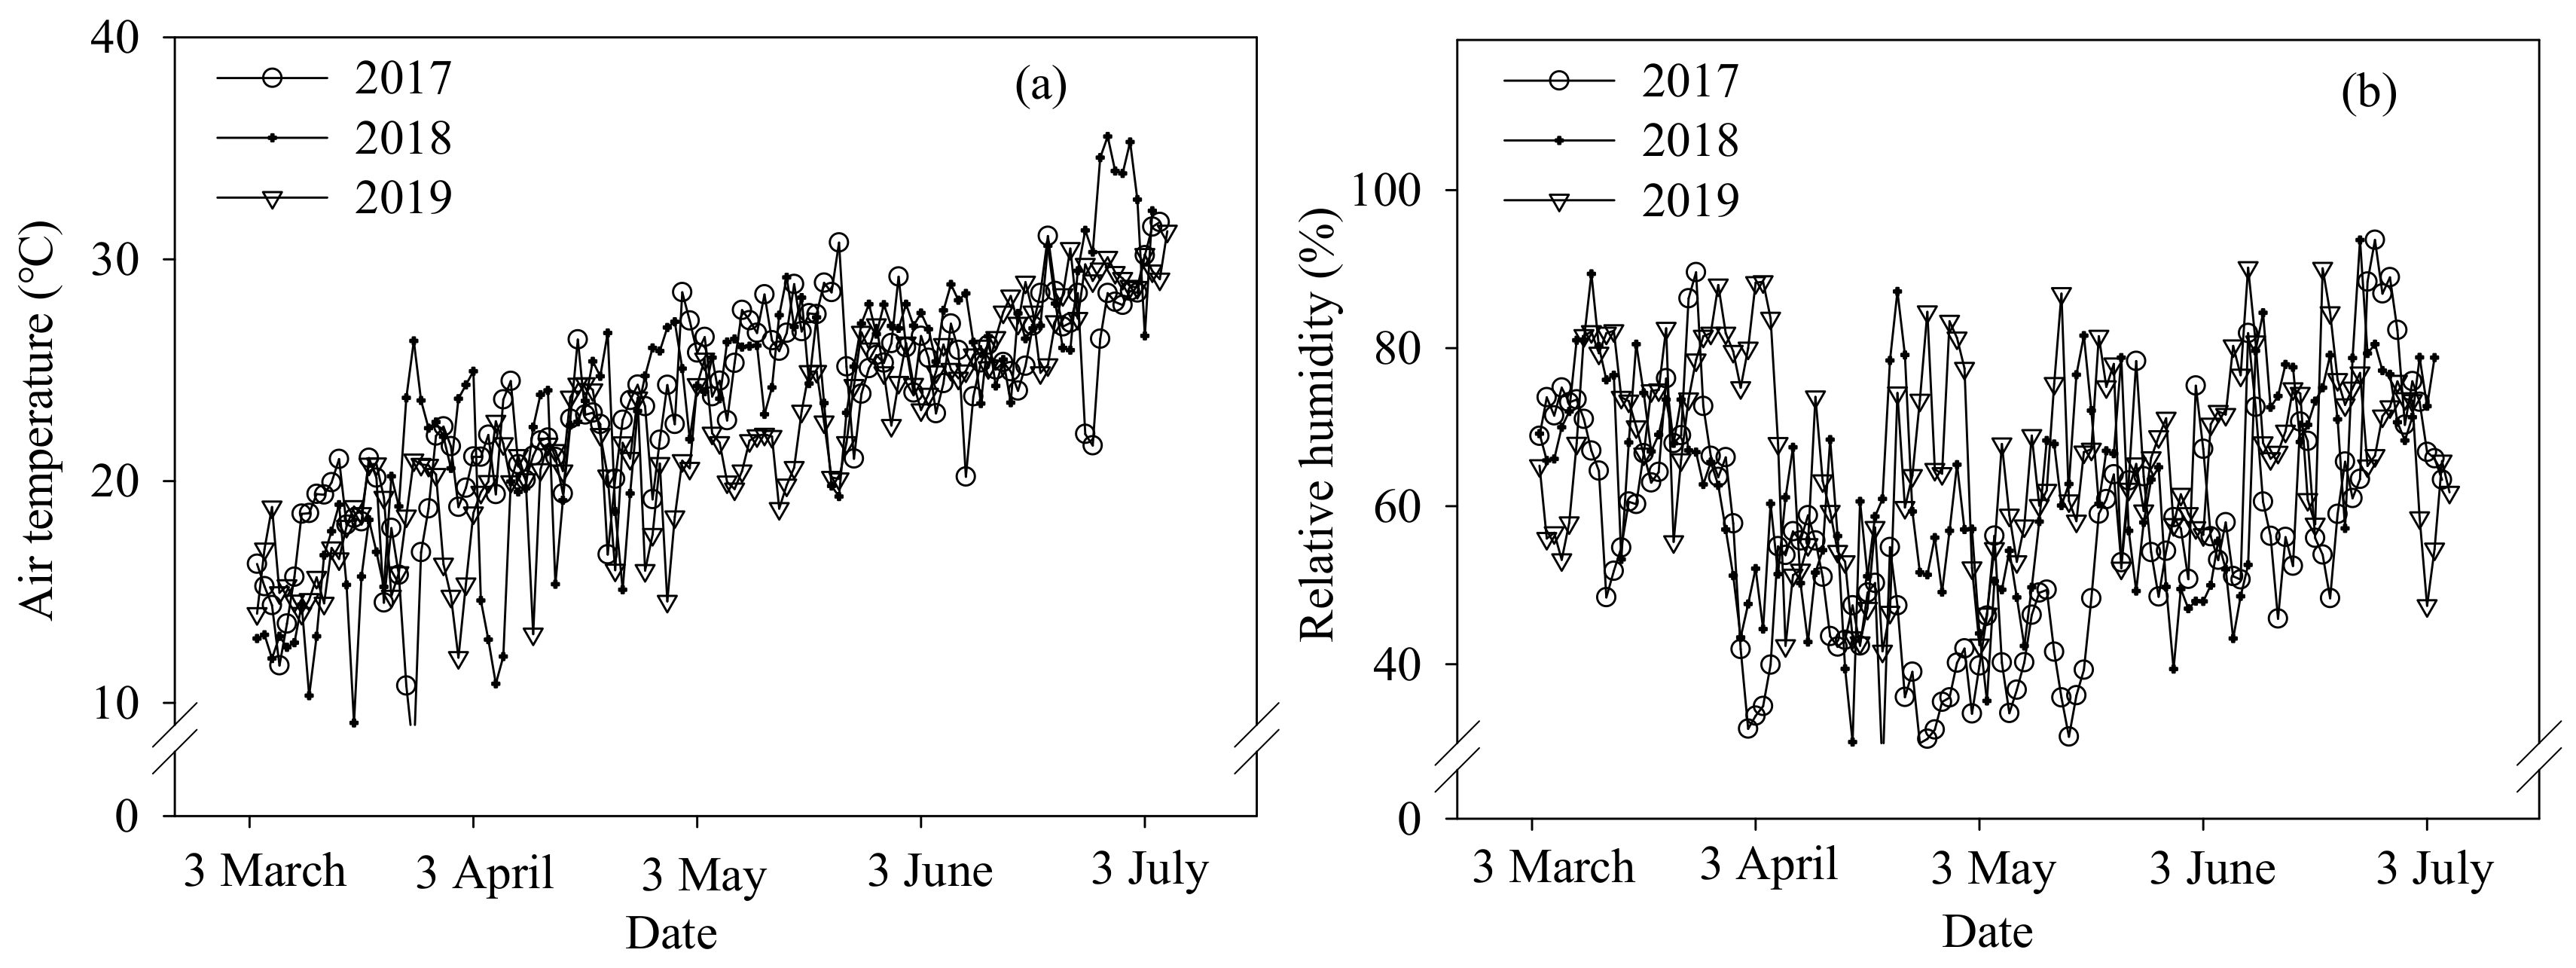
Eggplant “Heibao” was used in the experiment. The seedlings were transplanted at the three-true-leaf stage. The planting beds were prepared 0.8 m apart and were 0.7 m wide at the top. Two rows of eggplants were transplanted into each planting bed. Plants were spaced 0.45 m apart within rows and the rows were 0.5 m apart. Transparent plastic film with a width of 1.2 m was placed on the soil surface of the planting bed to cover two rows. Eggplant seedlings were transplanted on 7 March, 5 March, and 3 March, and harvested on 28 June, 3 July, and 3 July, in 2017, 2018, and 2019, respectively. A drip irrigation system was used for water supply. To ensure adequate soil water content during the eggplant growing season, the cumulative evaporation (Ep) of the plant canopy was measured with an evaporation pan (20 mm in diameter) used for scheduling irrigation in this experiment [18]. The irrigation amount was 0.8 Ep (“0.8” is the evaporation pan coefficient) and the irrigation period was 7–10 days. Nitrogen was applied at a rate of 75 kg N‧ha−1 as water-soluble compound fertilizer (N:P2O5:K2O = 3:1:6), with three applications at 30, 55, and 80 days after planting. The daily air temperature in the greenhouse showed an increasing trend during the eggplant growing period, with mean values of 23.3, 23.4, and 22.1 °C in the 2017, 2018, and 2019 seasons (Figure 1), respectively. There were similar relative humidity (RH) conditions during the study period, with the daily RH varying from 26.2% to 93.7% over the 3 years.
2.2. Measurements
Daily meteorological data, comprising solar radiation, wind speed, minimum and maximum relative humidities, and minimum and maximum temperatures, were recorded at 10 min intervals with an automatic weather station (Model AG1000, Campbell Scientific, Logan, UT, USA).
The daily ETc of eggplant was measured by a weighing lysimeter (Beijing Sinton Technology Co., Ltd., Beijing, China). Given that the planting bed surface was completely covered with plastic film in the experiment, the ETc was mainly due to transpiration [6,19]. The experimental weighing lysimeter was 1 m long, 0.6 m wide, and 0.9 m deep. The system collector was an SDI-12 bus interface and the weighing resolution was 0.01 mm. The weight of the soil column was recorded every 10 min. The ETc was calculated according to the water balance equation [16]:
where Wt-1 and Wt (kg) are the weight of soil and water in the lysimeter box at t − 1 and t; A is the surface area of the lysimeter (m2); ρ is the density of water (g·cm−3); I is the amount of irrigation (mm), and Dv is the drainage volume (mm).
Three eggplants were randomly selected to measure plant height, leaf length, and maximum width at intervals of 7–10 days. Then, the leaf area index (LAI) was determined using an empirical formula [20].
where N is the number of samples; Li is the leaf length (cm); Wi is the maximum leaf width (cm); S is the space between two plants (cm); D is the distance between two rows (cm); and 0.697 is an empirical constant. The eggplant phenological period was observed and recorded during the experiment.
2.3. Crop Coefficient Model
The single crop coefficient model is most commonly used for formulating irrigation schemes of greenhouse-grown vegetable crops [21]. In FAO-56, in the absence of soil water stress, the local Kc is calculated as follows:
where Kc considers the combined impact of soil evaporation and crop transpiration. The actual ETc can also be estimated as:
ET0 was determined by the modified Penman–Monteith equation in the study and was calculated as follows:
where Δ is the slope of the vapor pressure curve (kPa‧°C−1), Rn is the net radiation at the crop surface (MJ‧m−2‧d−1), T is the mean daily air temperatures (°C), G is the soil heat flux density (MJ‧m−2·d−1), es is the saturation vapor pressure (kPa), ea is the actual vapor pressure (kPa), and γ is the psychrometric constant (kPa‧°C−1).
The Kc values from FAO-56 are presented for sub-humid regions (minimum relative humidity of 45%) with moderate wind speed. The Kc curve is commonly described with four linear segments, which are defined by FAO-56 as representing the initial, development, mid-season, and end-season periods [7]. However, Kc is likely to vary with environmental conditions and requires adjustment for local experimental conditions at these crop growth stages.
The single crop coefficient correction method considering the effect of relative humidity and wind speed is used to determine Kc values at the initial stage [22]. The calculation formula used is as follows:
where Kcini is the adjusted Kc in the initial stage (Kc,Adj), Kcb is the basal crop coefficient recommended in FAO-56 (see Section 2.5), U2 is the daily wind speed at a height of 2 m (m‧s−1), RHmin is the daily minimum relative humidity (%), and h is the plant height (m).
The Kc value in the mid-season and end-season stages was adjusted as follows [8]:
where Kcmid and Kcend are the adjusted Kc values in the middle and end stages, respectively.
The value of Kc in the development stage was calculated as follows [7]:
where i is the day number within the growing season, Kci is the Kc on day i, Kcprev is the Kc of the previous stage, Kcnext is the Kc of the next stage, Lprev is the length of the previous stage, and Lstage is the length of the current growth stage.
2.4. Statistical Analysis
The coefficient of determination (R2), root-mean-squared error (RMSE), mean absolute error (MAE), and index of agreement (d) were used to evaluate the performance of the model [23]:
where Pi and Oi are the predicted and observed data, respectively, N is the number of data points, and and are the respective mean values.
2.5. Kcb
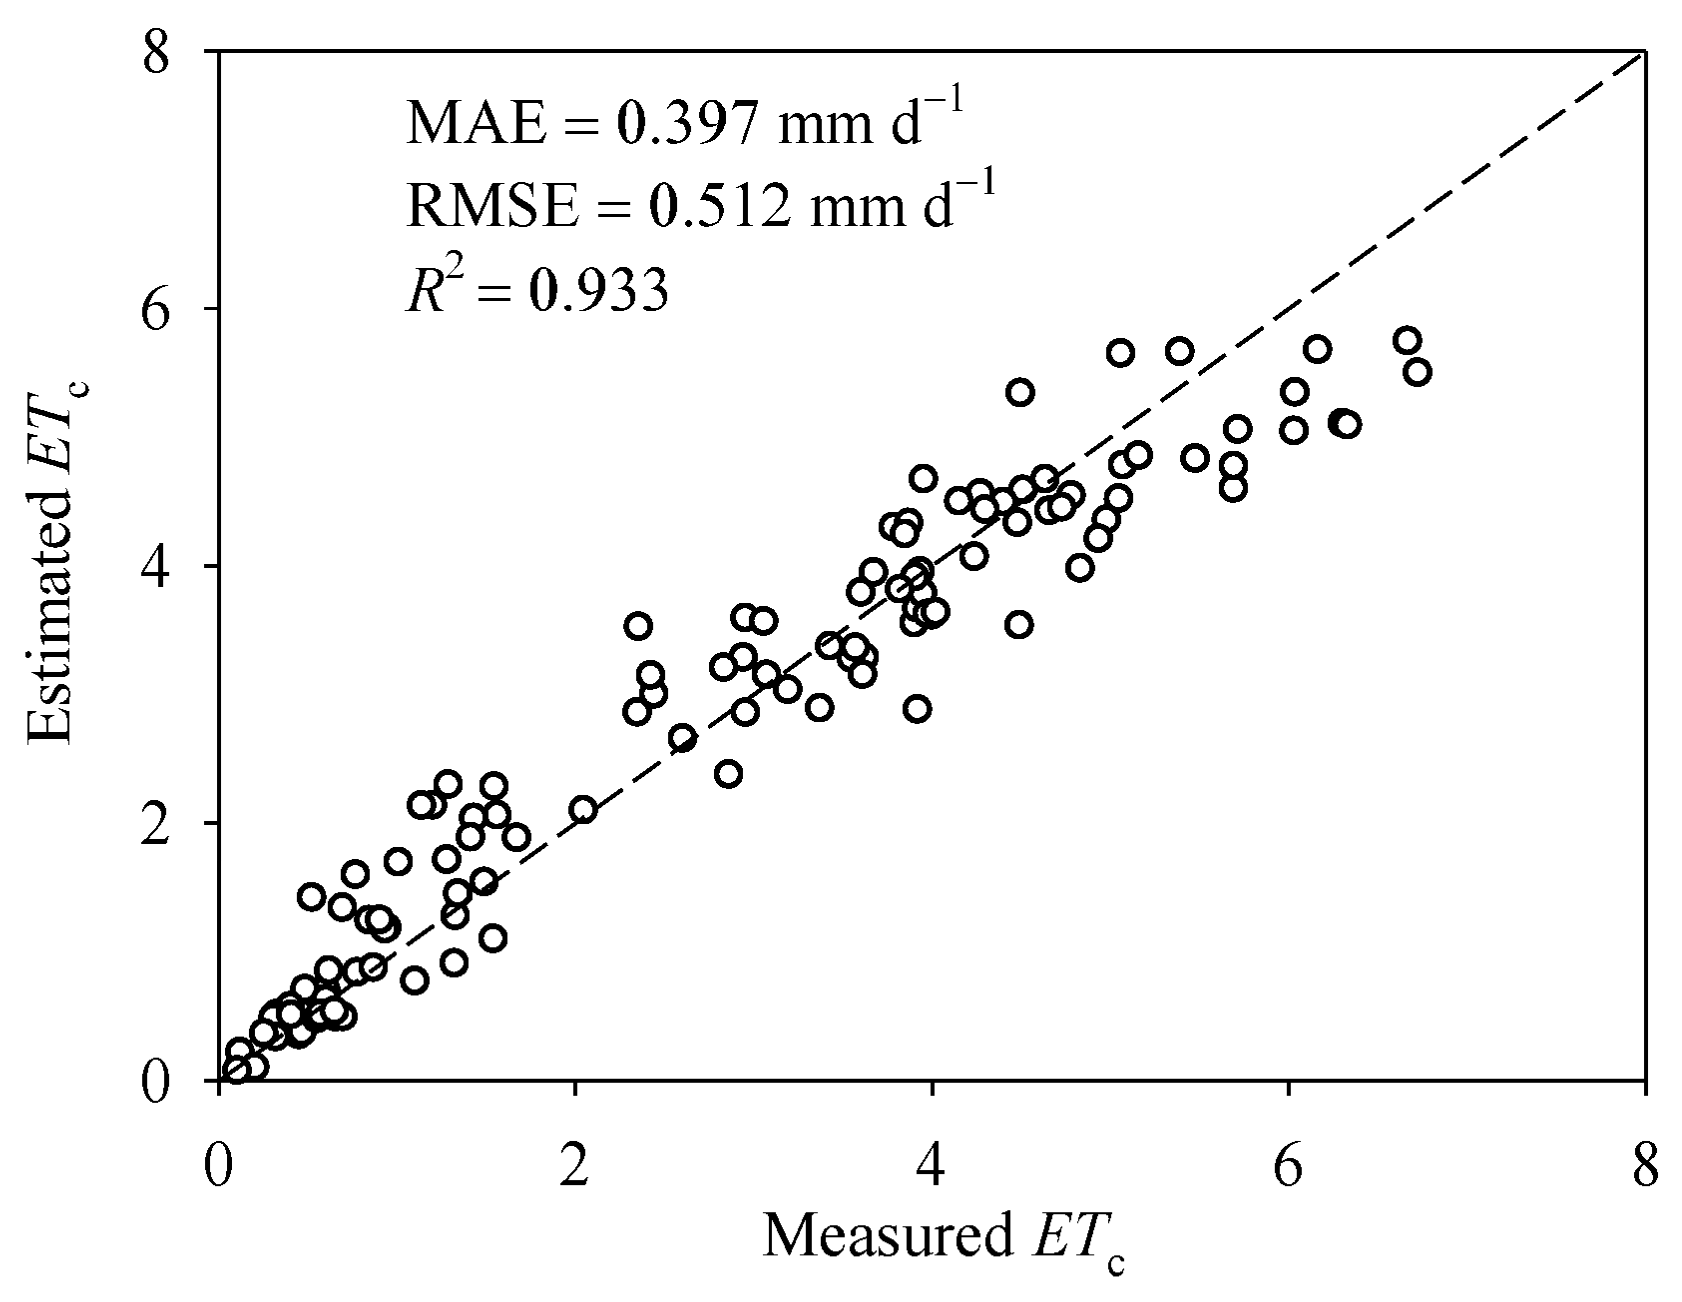
The basal crop coefficient (Kcb) at the crop development stages was calibrated by minimizing the differences between estimated and measured ETc for eggplant in 2017. The initial value of Kcb was set as 0.6, 1.05, and 0.90 at the initial, mid-season, and end-season stages, respectively, based on data from FAO-56 [7]. The corresponding calibrated values of Kcb were 0.21, 1.04, and 0.76. Using the calibrated model parameters, model estimation was performed for Kc and ETc in the other growth seasons. Figure 2 compares the daily ETc measured with the weighing lysimeter and that estimated using the crop coefficient model when Kcb was determined in 2017. The R2 value was 0.933, mean absolute error (MAE) was 0.397 mm‧d−1, and RMSE was 0.512 mm‧d−1.
3. Results
3.1. Growing Stages and Growth Indicators
The lengths of the growth stages for greenhouse-grown eggplant during the study period in the 2017, 2018, and 2019 growth seasons are summarized in Table 1. Generally, plants showed similar growth development periods in the greenhouse environment for the 3 years. The seasonal dynamics of eggplant plant height and LAI during the study period were generally similar among the 3 years. The plant height increased with the progression of the growth period and the maximum height was attained in the end-season stage. The LAI increased from the initial stage until the mid-season stage, when it attained maximum values of 3.10, 3.05, and 3.02 in 2017, 2018, and 2019, respectively, and thereafter gradually declined.
3.2. ET0
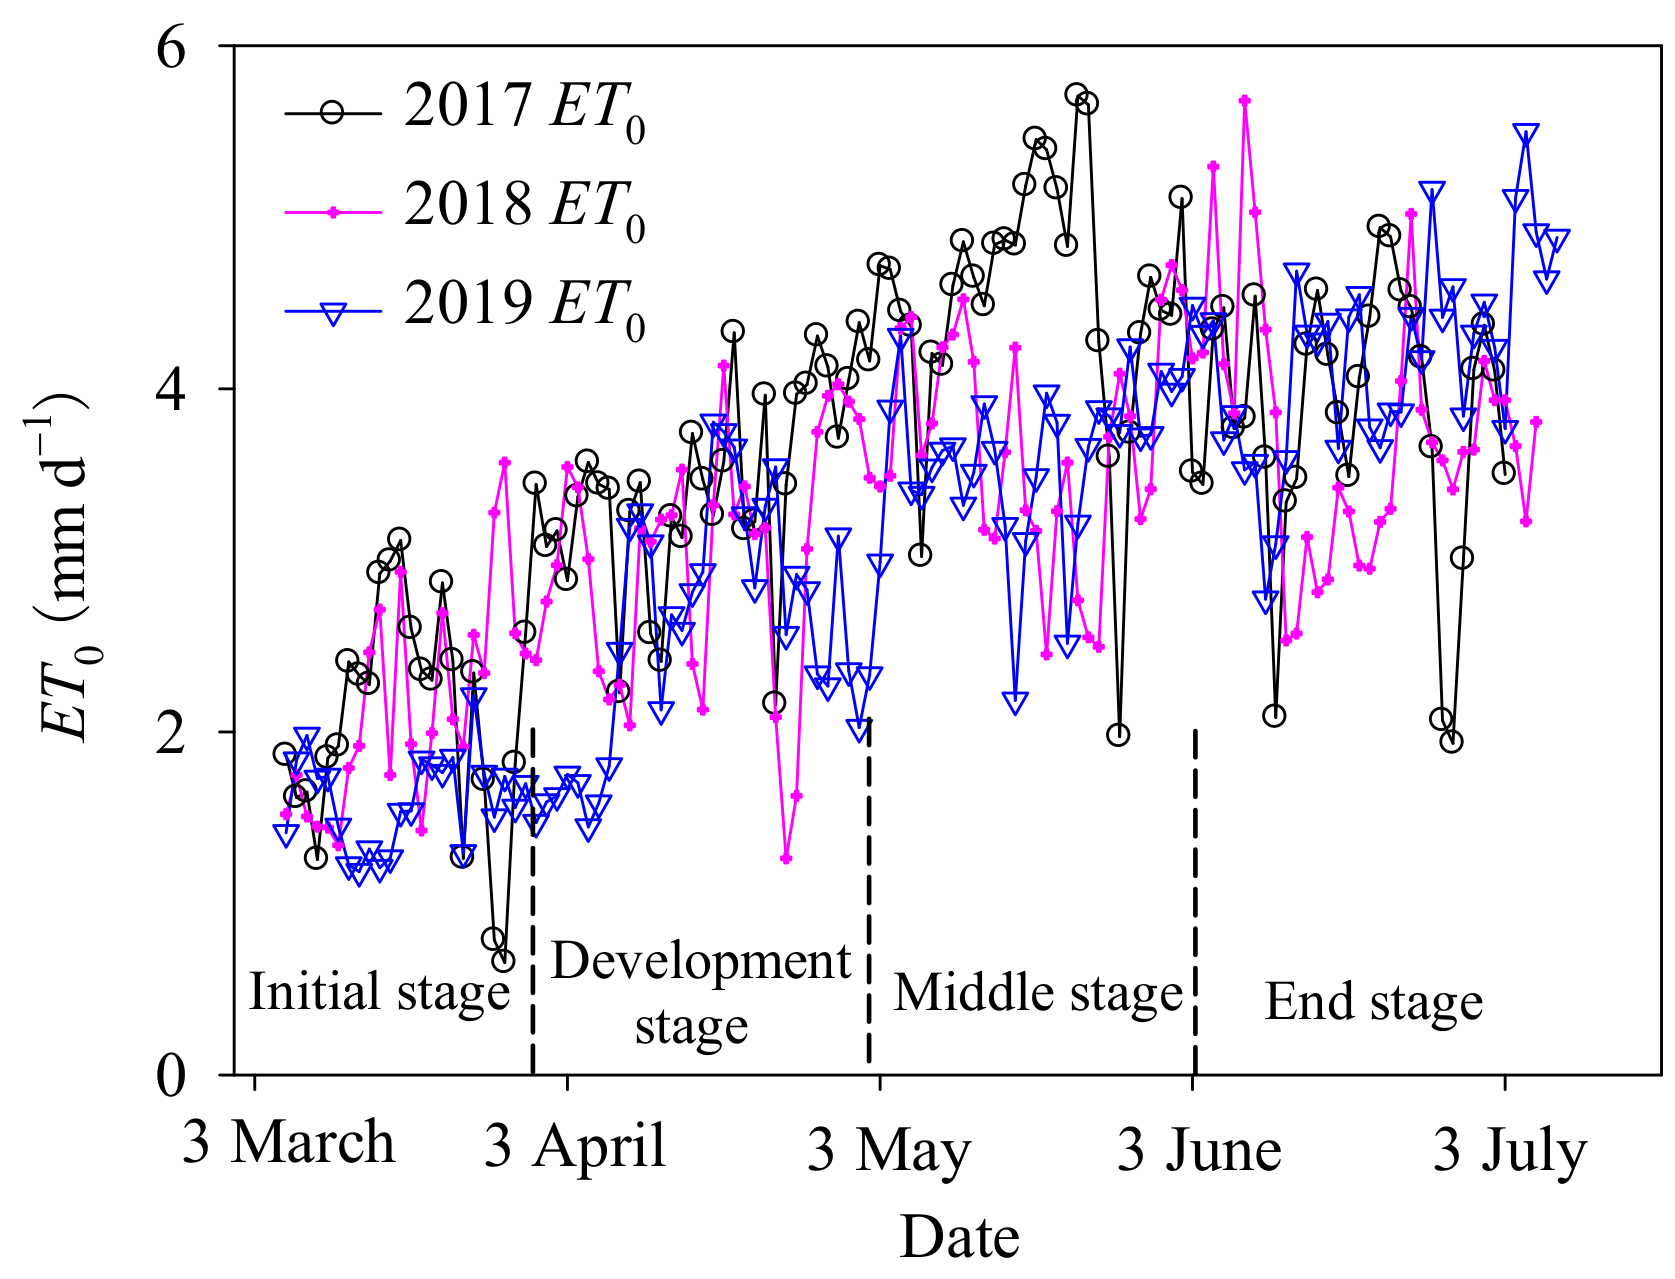
Daily variation in ET0 in the greenhouse during the study periods in 2017, 2018, and 2019 is shown in Figure 3. The amplitude of seasonal fluctuations of ET0 was relatively large in this study. The daily ET0 was generally higher later in the mid-season and late-season stages (i.e., May and June) than early in the growing season (from March to April). Daily ET0 changed from 0.65 to 5.71 mm, 1.26 to 5.68 mm, and 1.18 to 5.50 mm with means of 3.62 mm, 3.21 mm, and 3.11 mm, respectively, during the study period in 2017, 2018, and 2019, respectively. The cumulative ET0 over the entire growing season was 412.9, 388.2, and 382.5 mm in 2017, 2018, and 2019, respectively.
3.3. Variation of Kc for Eggplant
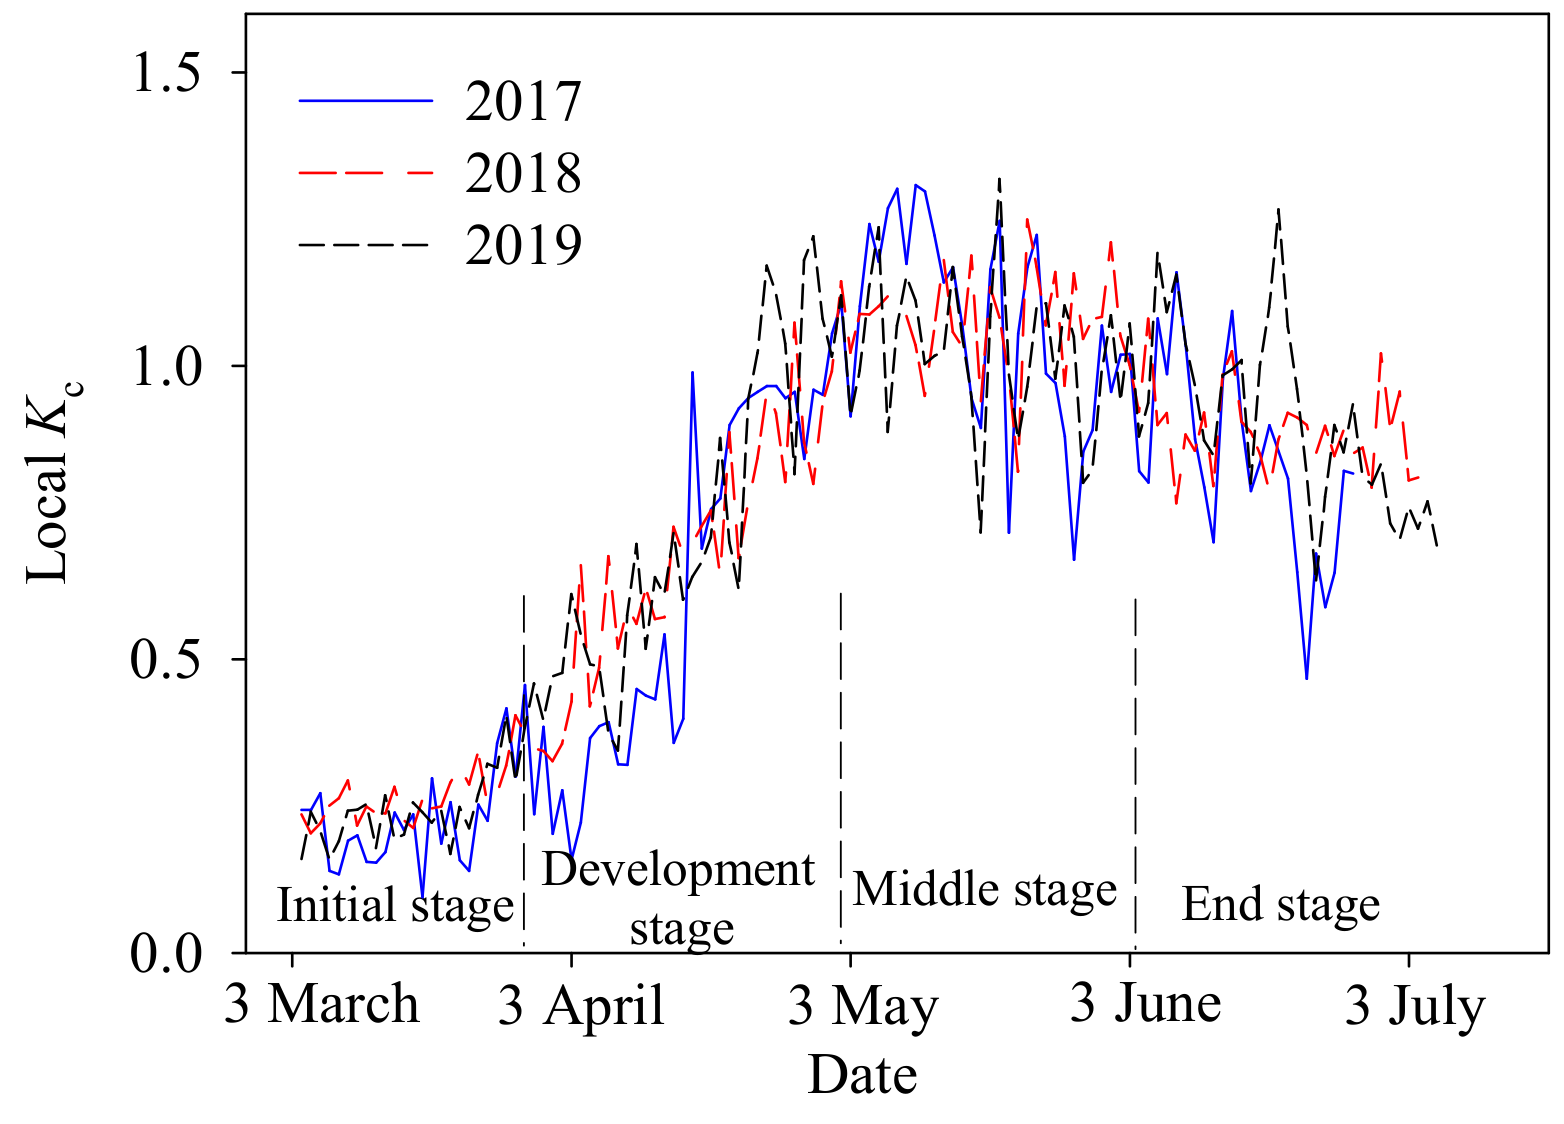
The daily local crop coefficient for greenhouse-grown eggplant was determined from the data measured with the weighing lysimeter in 2017, 2018, and 2019. Figure 4 shows the variation in daily local Kc in the 3 years. The fluctuations of local Kc in the different years were similar. The Kc value was relatively stable during the initial stage and began to increase rapidly during the development stage. The maximum Kc value was attained in the mid-season stage, and thereafter gradually decreased in the end-season stage.
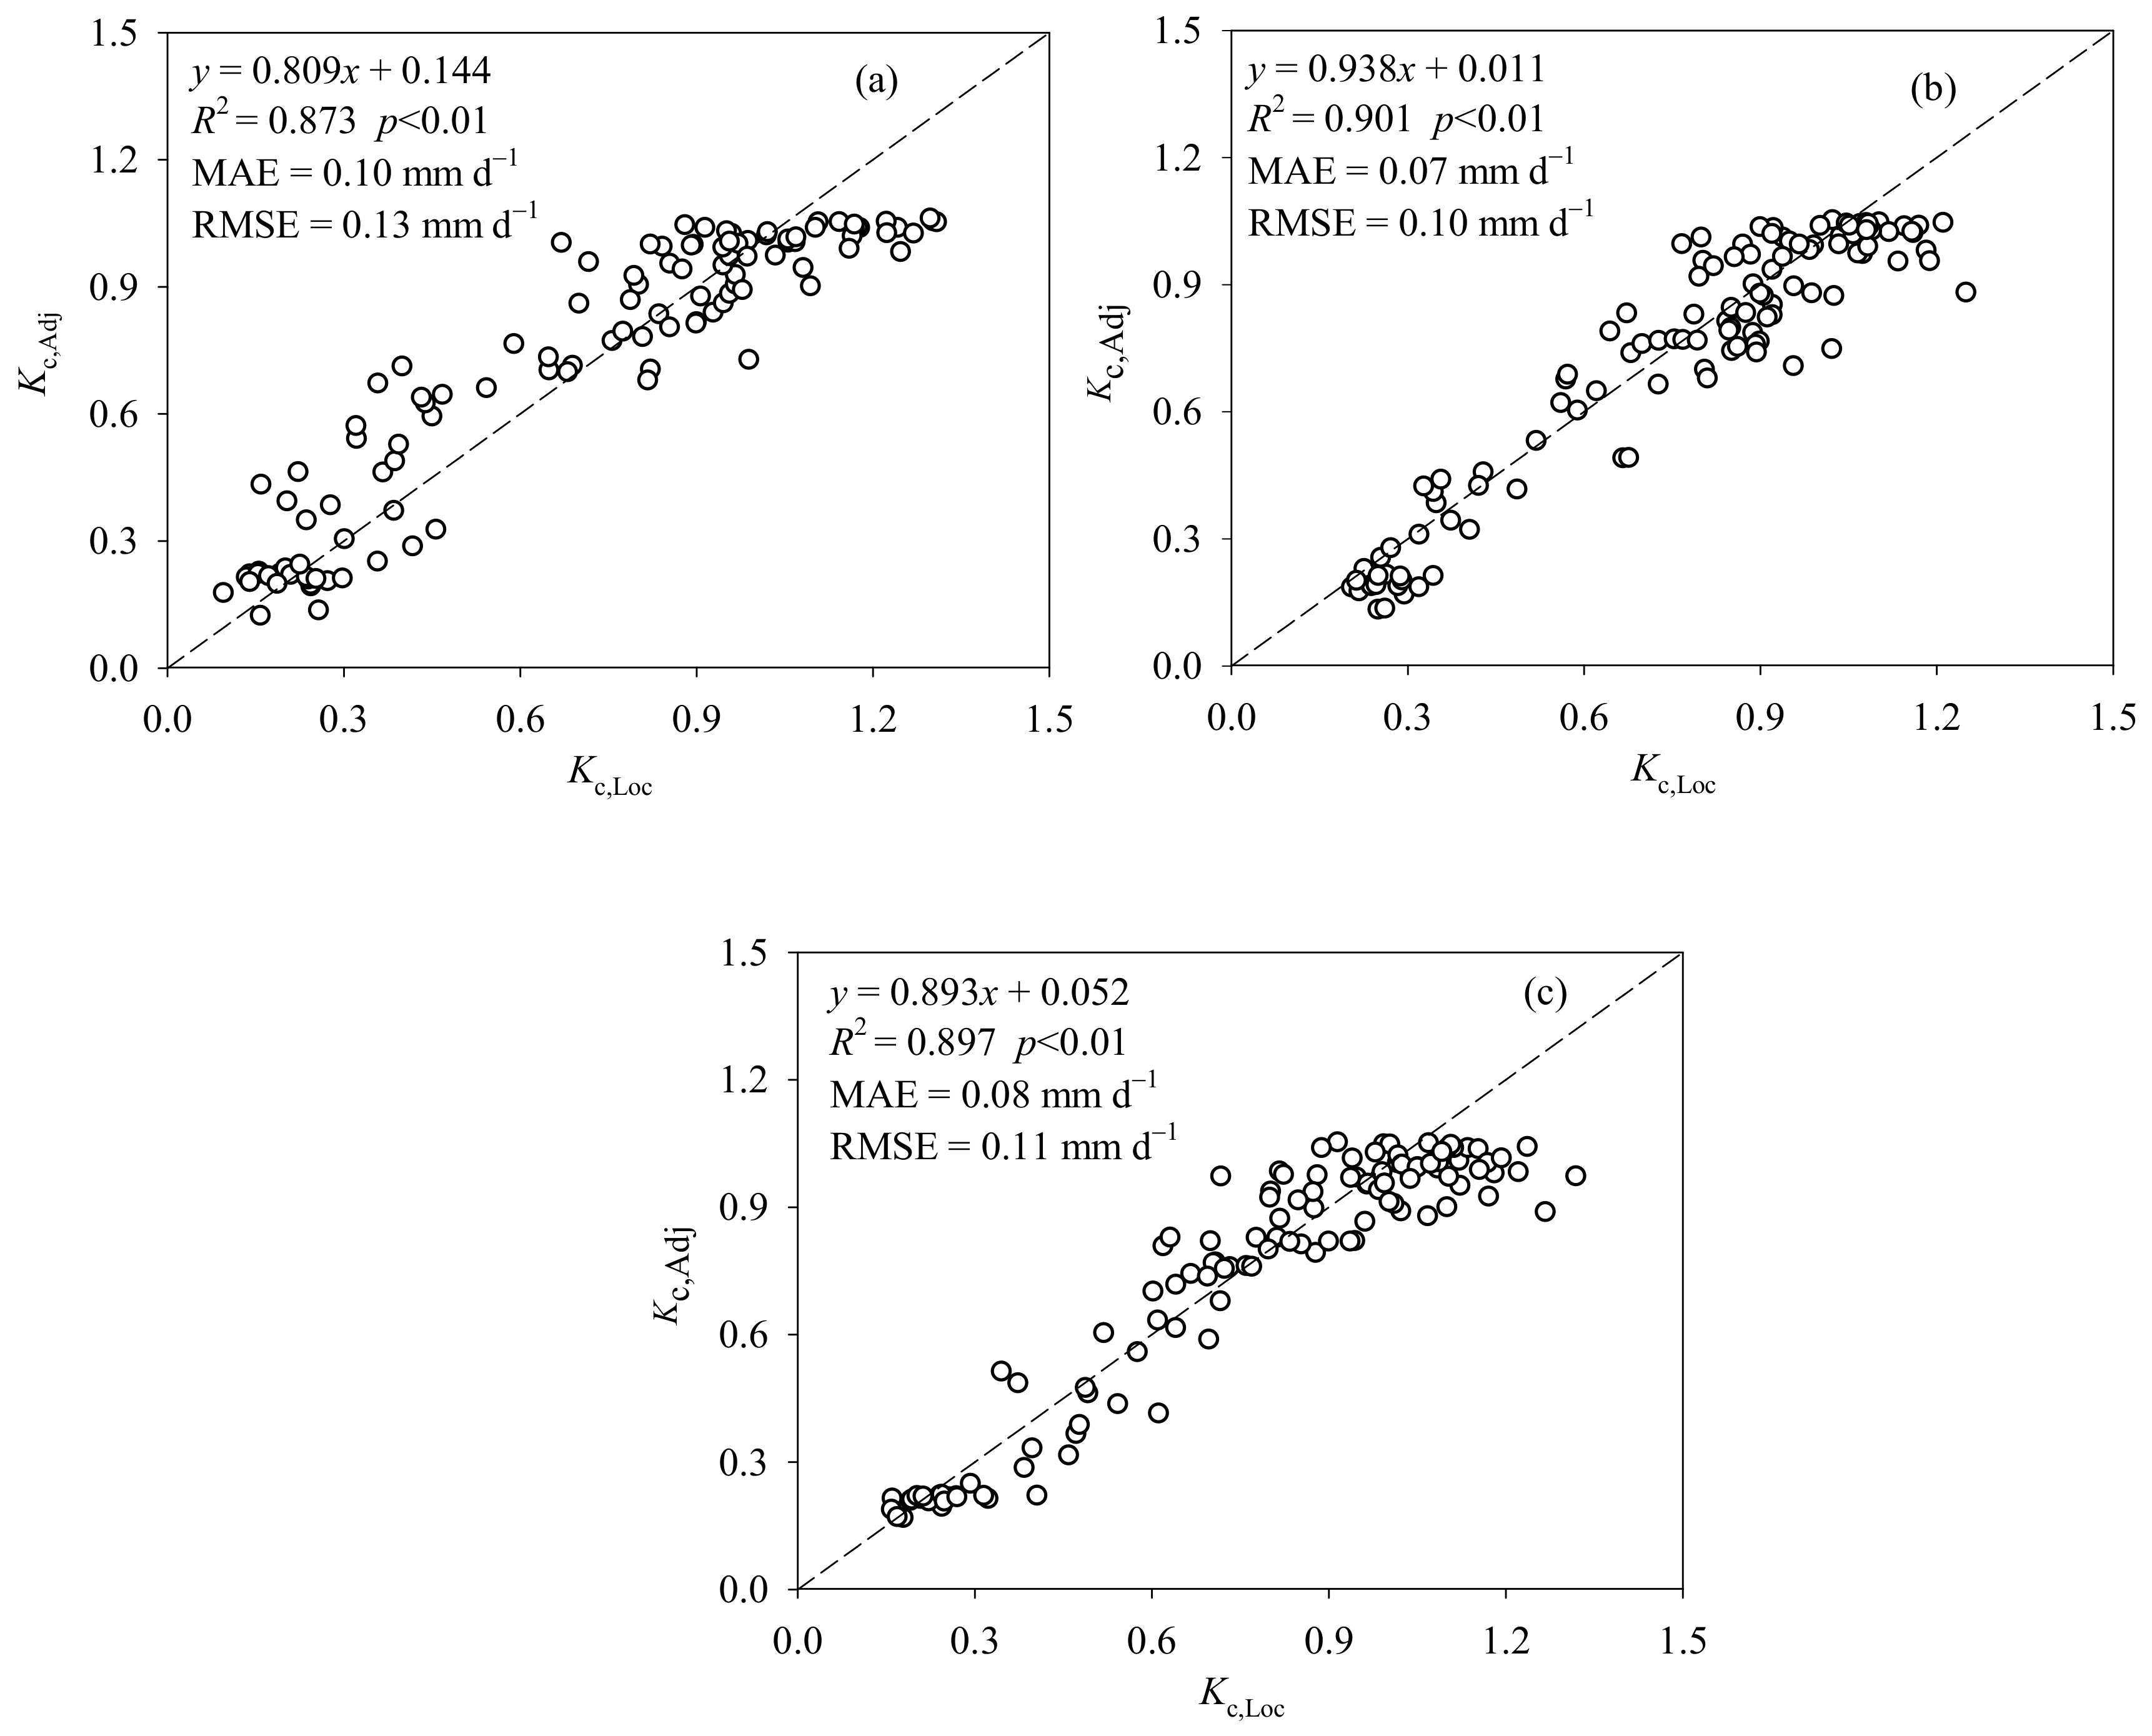
The recommended Kc values from FAO-56 (Kc,FAO), and adjusted (Kc,Adj) and locally developed Kc (Kc,Loc) at the initial, development, mid-season, and end-season stages for eggplant are summarized in Table 2. Good agreement was observed between Kc,Adj and Kc,Loc at the four growth stages in the 3 years. At the initial stage, the means of Kc,Adj and Kc,Loc for the 3 years were 0.20 and 0.23, respectively, which were 66.3% and 61.8% lower than that of Kc,FAO, respectively. In the development, mid-season, and late-season stages, the means over the 3 years for Kc,FAO were 0.64, 1.01, and 0.85 and those for Kc,Loc were 0.62, 1.05, and 0.87, respectively. Figure 5 shows the results of a linear regression analysis between Kc,Loc and Kc,Adj. The data points were close to the 1:1 line for the 2017, 2018, and 2019 seasons, with R2 of 0.873, 0.901, and 0.897 (p < 0.01), respectively.
3.4. Estimation of ETc
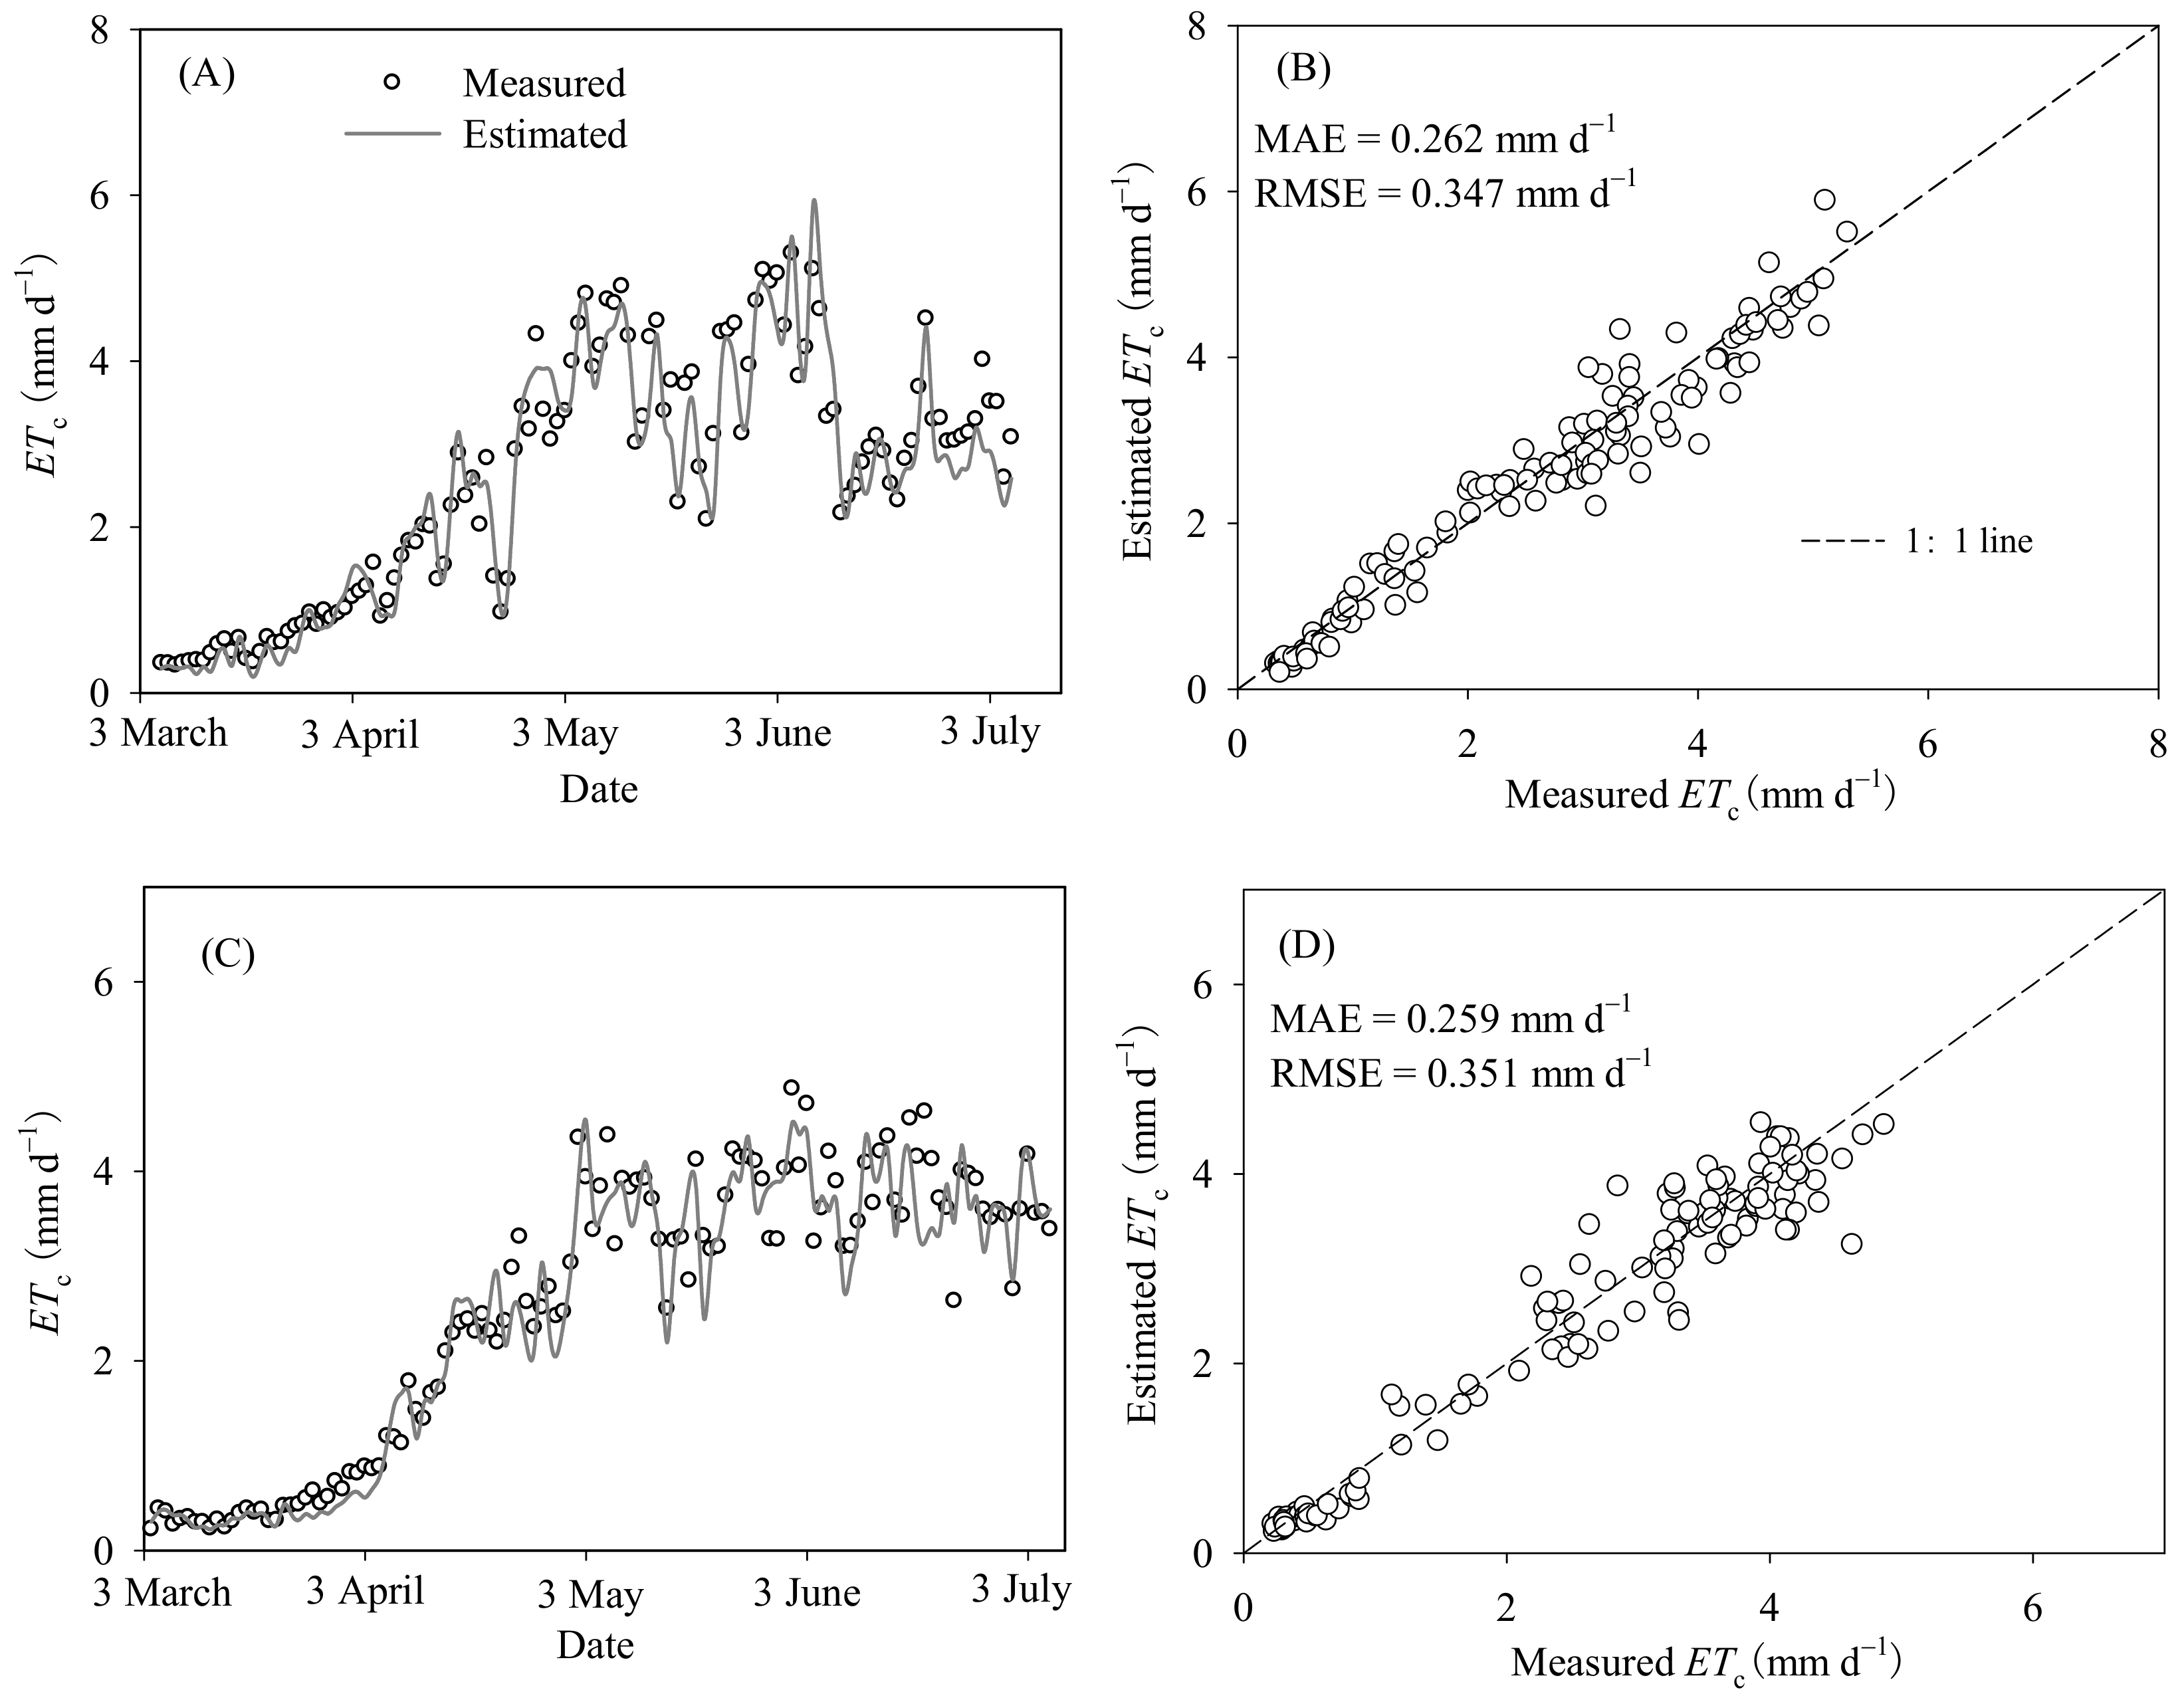
Figure 6A,C shows the comparison of measured daily ETc and that estimated by the proposed single crop coefficient method in 2018 and 2019. The verification of measured and estimated ETc was consistent, which increased from transplanting, peaked during the mid-season stage, and decreased gradually during the end-season stage. The estimated ETc accumulated over the entire growing season was 304.0 mm and 308.9 mm in 2018 and 2019, respectively, and 10.2 mm and 6.58 mm lower than the measured value determined using the lysimeter. The measured ETc values were linearly fitted with the model-calculated values in 2 years. The calculated and measured values of ETc for greenhouse-grown eggplant were concordant, the regression coefficient was close to 1, and the R2 values were 0.947 and 0.943 (p < 0.01) in 2018 and 2019, respectively (Figure 6B,D).
3.5. Statistical Analysis of Estimated and Measured ETc
The results of statistical analysis of the estimated and measured ETc at different developmental stages of greenhouse-grown eggplant are shown in Table 3. The mean daily measured ETc at the different growth stages changed from 0.49 to 4.04 mm‧d−1 in 2018 and from 0.38 to 3.73 mm‧d−1 in 2019. The mean daily estimated ETc was 0.38–3.83 mm‧d−1 and 0.34–3.68 mm‧d−1 in 2018 and 2019, respectively. The minimum values of MAE and RMSE were observed in the initial stage and were 0.06–0.11 mm‧d−1 and 0.09–0.11 mm‧d−1, respectively, in the 2 years. The maximum values of RMSE and MAE were observed in the end-season stage and were 0.43–0.48 mm‧d−1 and 0.32–0.39 mm‧d−1, respectively, in the 2 years. The d of each growth stage was greater than 0.90, and d was highest at the initial stage, followed by the development stage. From the perspective of the entire growth period of eggplant, the crop coefficient model underestimated ETc compared with the measured ETc, and d was greater than 0.98.
4. Discussion
In this study, the maximum and minimum local Kc values were observed in the mid-season stage and the initial stage, respectively. The local Kc showed lower dispersion in the initial stage, with averages of 0.20, 0.25, and 0.24 in 2017, 2018, and 2019, respectively. This finding was attributed to the plastic-film mulching of the planting bed and that the LAI was less than 1 (Table 1). Orgaz et al. [24] reported similar results that the Kc of greenhouse-grown melon was approximately 0.2 during the crop’s initial stage when the LAI value was close to zero. Pereira et al. [11] reported that the average Kc during the initial stage can be represented by a horizontal line because the variation with time is small. The local Kc value increased rapidly with time and peaked in the mid-season stage (Table 2). Previous studies indicated that the variation in Kc at the mid-season stage is mainly due to the increase of LAI [25,26,27]. In the current study, the maximum LAI was also observed in the mid-season stage and the values were all greater than 3.0 in the 3 years. In the end-season stage, Kc gradually decreased. This was because the leaves began to age and senesce at the end of the growing period, which resulted in a lower LAI. Ge et al. [28] showed that eggplant Kc as a whole exhibited a single peak curve change in a greenhouse environment, and ranged from 0.78 to 1.48. Wang et al. [5] reported that, under a suitable irrigation scheme, the Kc ranges for eggplant were 0.21–0.46, 0.62–0.94, and 0.70–0.92 at the seedling stage, flowering stage, and picking stage, respectively. These results indicated that the variation in Kc of greenhouse-grown eggplant under different experimental conditions was consistent, but the Kc values differed considerably among studies. Possible reasons for this are as follows: (1) the ET0 calculation methods differ; (2) the observation methods for ETc differ; (3) the eggplant growing season and planting time differ; and (4) the field management practices differ (e.g., irrigation and fertilization schemes) [26,29].
In the current study, a significant linear relationship between Kc,Adj and Kc,Loc was observed, with R2 values of 0.873, 0.901, and 0.897 in 2017, 2018, and 2019, respectively. These results demonstrated that Kc adjusted based on the local climate showed good agreement with the local value determined using the lysimeter. These results were also in agreement with those of Gong et al. [30], who observed that Kc,Adj and Kc,Loc were 1.09 and 1.13, respectively, in the mid-season stage for tomato. However, in the present study, Kc,Adj and Kc,Loc were always lower than Kc,FAO in the three consecutive years, especially in the initial stage. This may be attributed to the higher relative humidity and lower wind speed in the greenhouse environment, whereas Kc,FAO was suggested based on standard climatic conditions (RHmin of approximately 45% and U2 of approximately 2 m‧s−1). Similar results were reported by Gong et al. [30] and Qiu et al. [31] in studies using tomato and green pepper, respectively. The 3-year average values of Kc,Adj and Kc,Loc at the initial stage were 0.20 and 0.23 (Table 2), respectively, which decreased by 66.3% and 61.8% compared with the Kc,FAO value. In addition, Muniandy et al. [26] showed that the experimental Kc values for sweet pepper and cucumber were lower than the FAO-56-recommended values, and the maximum differences were 18.9% and 23.5%, respectively. These results suggest that the FAO-56-recommended Kc value cannot be directly applied to the greenhouse environment, and it is necessary to adjust the Kc value based on the actual environment. In addition, previous studies have observed that the Kc developed in a particular region is not applicable in other regions owing to the difference in climate [11,26]. Although the Kc,Adj and Kc,Loc values were much lower than the FAO-56-recommended value (Kcb) in the initial stage, a large difference was not observed during the mid-season and end-season stages (Table 2). This could have been due to the effects of the plastic-film mulch. The plastic film almost completely covered the soil wetted by the drip emitters in the present experiment and its most direct effect was to act as a barrier to reduce soil water evaporation. Zhao et al. [32] showed that, compared with the non-mulched treatment, mulching in a field experiment significantly reduced Kc by 55.3% during the initial stage, whereas in the mid-season and end-season stages, Kc was decreased by 5.7% and 9.7%, respectively. Many studies have reported that plastic-film mulching and soil temperature are the main factors that affect Kc during the initial stage [7,32]. During the development, mid-season, and end-season stages, with the increase in crop canopy cover, the effect of film mulching on the energy budget is weakened and Kc is mainly affected by LAI [32]. Film mulching has little effect on evapotranspiration when the LAI is greater than 3.0 because it reduces evaporation and increases transpiration [33].
Compared with ETc estimation based on other models (e.g., two-layer Shuttleworth–Wallace), the crop coefficient model is the simplest and estimates ETc with high accuracy if Kc is adjusted based on the actual environment [22,30,34]. In this study, the crop coefficient model accurately estimated the daily ETc of greenhouse-grown eggplant during each growth period, with a MAE of 0.11–0.39 mm‧d−1 in 2018 and 0.06–0.32 mm‧d−1 in 2019, and RMSE of 0.11–0.48 mm‧d−1 in 2018 and 0.09–0.43 mm‧d−1 in 2019 (Table 3). Yan et al. [35] reported that the RMSE, R2, and model efficiency coefficient of the crop coefficient model for prediction of spring–summer cucumber daily ETc were 0.41 mm‧d−1, 0.95, and 0.93, respectively. These results demonstrated that daily ETc under a greenhouse environment calculated with the crop coefficient model was in agreement with the measured values. Similar results have been validated in other crops under different cultivation conditions, including maize, rice, and grapes [12,25,36]. However, in the present experiment, daily ETc was underestimated by the crop coefficient model, which may have been due to the following factors. (1) A plastic-film mulch covered the experimental plot, but may have caused damage to the roots of the plants during the experimental period, which may have led to the increase in measured evapotranspiration [31]. (2) The crop coefficient model used in this study did not consider the effect of the soil evaporation coefficient, but was unable to completely avoid the occurrence of soil evaporation in practice; this was also an important reason why the adjusted Kc in each growth period was lower than the local Kc (Table 2). (3) The high relative humidity in the greenhouse environment is among the reasons why the daily ETc estimated value was lower than the measured value [30]. Previous research has shown that the ETc of greenhouse-grown tomato estimated by a modified crop coefficient method is 12.2–24.8% lower than the measured values [37]. (4) Although a weighing lysimeter is widely used to measure ETc because of the limited representative area, the ETc measurement value is usually higher than the model estimation value [12]. In this study, seasonal lysimeter-based eggplant ETc values presented similar variations in 2018 and 2019, indicating that eggplant water requirements were consistent among the years. The total ETc determined with the crop coefficient model was 306.5 mm on average in the 2 years (2018 and 2019), which was lower than the measured value, and the R2 value was greater than 0.9, indicating that the crop coefficient method could explain most of the total variation in measured ETc. High values of d (>0.90) showed that the estimated daily ETc was statistically similar to the measured values. Thus, overall, the crop coefficient method provided satisfactory results for estimating ETc at each growth stage of greenhouse-grown eggplant, and offers an effective method for accurately determining the dynamic water demands of greenhouse-grown eggplant.
5. Conclusions
In this study, the variation in Kc for spring greenhouse-grown eggplant at different crop development stages was investigated and the performance of a crop coefficient model for estimating ETc was assessed. The local Kc (Kc,Loc) of greenhouse-grown eggplant showed the same seasonal changes and ranges of 0.20–0.25, 0.57–0.69, 1.02–1.07, and 0.84–0.90 for the initial, development, mid-season, and end-season stages, respectively, in the three consecutive years. Kc,Adj, adjusted based on the actual environment, showed good agreement (R2 > 0.87) with Kc,Loc measured using the lysimeter. However, the Kc,Adj and Kc,Loc values were consistently lower than Kc,FAO in the 3 years, with substantial differences of 66.3% and 61.8% observed in the initial stage. The crop coefficient model accurately estimated the daily ETc of greenhouse-grown eggplant during each growth period, with MAE of 0.11–0.39 mm‧d−1 and 0.06–0.32 mm‧d−1, and RMSE of 0.11–0.48 mm‧d−1 and 0.09–0.43 mm‧d−1, for the 2018 and 2019 growing seasons, respectively.
Author Contributions
Y.L. and J.W. designed the experiment and wrote the paper; W.G. conceived the idea for this study; Y.L. and M.D. reviewed and edited the paper; Y.Y. carried out the experimental work; S.L. provided their experience with Y.Y. All authors have read and agreed to the published version of the manuscript.
Funding
This research was funded by S&T Program of Hebei (NO. 21326904D, 21327005D).
Institutional Review Board Statement
Not applicable.
Informed Consent Statement
Not applicable.
Data Availability Statement
Not applicable.
Acknowledgments
We thank Fei Chen for her assistance in greenhouse management. We thank Robert McKenzie, from Liwen Bianji (Edanz) for editing the English text of a draft of this manuscript.
Conflicts of Interest
The authors declare no competing interests.
References
- Ai, P.; Jin, K.; Alengebawy, A.; Mahdy, E.; Meng, L.; Chen, M.D.; Ran, Y. Effect of application of different biogas fertilizer on eggplant production: Analysis of fertilizer value and risk assessment. J. Environ. Technol. Innov. 2020, 19, 101019. [Google Scholar] [CrossRef]
- FAOSTAT. Food and Agriculture Organization of the United Nations (FAO). Available online: http://www.fao.org/faostat/en/#data/QCL (accessed on 1 September 2022).
- Alam, I.; Salimullah, M. Genetic engineering of eggplant (Solanum melongena L.): Progress, controversy and potential. Horticulturae 2021, 7, 78. [Google Scholar] [CrossRef]
- Acciarri, N.; Restaino, F.; Vitelli, G.; Perrone, D.; Zottini, M.; Pandolfini, T.; Spena, A.; Rotino, G. Genetically modied parthenocarpic eggplants: Improved fruit productivity under both greenhouse and open field cultivation. BMC Biotechnol. 2002, 2, 4. [Google Scholar] [CrossRef]
- Wang, H.L.; Li, J.X.; Fan, F.C.; Han, X.Z.; Liu, S.Y.; Li, Z.H.; Jia, J.M.; Wang, K.J.; Zhang, Z.; Jia, S.N. Evapotranspiration model and crop coefficient of greenhouse eggplant in North China. Chin. J. Eco-Agric. 2018, 26, 1819–1827. [Google Scholar]
- Wang, Z.; Li, Y.K.; Guo, W.Z.; Han, X. Effect of different irrigation amount on transpiration rate and water use efficiency of autumn eggplant in greenhouse. China Rural. Water Hydrol. 2019, 7, 6–10. [Google Scholar]
- Allen, R.G.; Pereira, L.S.; Raes, D.; Smith, M. Crop Evapotranspiration—Guidelines for Computing Crop Water Requirements; FAO Irrigation and Drainage Paper 56; Food and Agriculture Organization: Rome, Italy, 1998. [Google Scholar]
- Allen, R.G.; Pruitt, W.O.; Wright, J.L.; Howell, T.A.; Ventura, F.; Snyder, R.; Itenfisu, D.; Steduto, P.; Berengena, J.; Yrisarry, J.B.; et al. A recommendation on standardized surface resistance for hourly calculation of reference ET0 by the FAO56 Penman-Monteith method. Agric. Water Manag. 2006, 81, 1–22. [Google Scholar] [CrossRef]
- Paredes, P.; Martins, D.S.; Pereira, L.S.; Cadima, J.; Pires, C. Accuracy of daily estimation of grass reference evapotranspiration using ERA-Interim reanalysis products with assessment of alternative bias correction schemes. Agric. Water Manag. 2018, 210, 340–353. [Google Scholar] [CrossRef]
- Pereira, L.S.; Paredes, P.; Jovanovic, N. Soil water balance models for determining crop water and irrigation requirements and irrigation scheduling focusing on the FAO56 method and the dual Kc approach. Agric. Water Manag. 2020, 241, 106357. [Google Scholar] [CrossRef]
- Pereira, L.S.; Paredes, P.; López-Urre, R.; Hunsaker, D.J.; Mota, M.; Mohammadi, S.Z. Standard single and basal crop coefficients for vegetable crops, an update of FAO56 crop water requirements approach. Agric. Water Manag. 2021, 243, 106196. [Google Scholar] [CrossRef]
- Wang, Y.F.; Cai, H.J.; Yu, L.Y.; Peng, X.B.; Xu, J.T.; Wang, X.W. Evapotranspiration partitioning and crop coefficient of maize in dry semi-humid climate regime. Agric. Water Manag. 2020, 236, 106164. [Google Scholar] [CrossRef]
- Wu, J.B.; Ma, Y.F.; Zhang, H.X.; Cao, X.S. Estimation of maize evapotranspiration in semi-arid based on modified crop coefficient model. J. Water Resour. Archit. Eng. 2020, 18, 25–29. [Google Scholar]
- Wang, S.S.; Li, B.; Gong, X.W. Research on validity examination of simulated results of eggplant water requirements with drip irrigation under mulch in sunlight greenhouse. Water 2018, 10, 130. [Google Scholar] [CrossRef]
- Qiu, R.J.; Song, J.J.; Du, T.S.; Kang, S.Z.; Tong, L.; Chen, R.Q.; Wu, L.S. Response of evapotranspiration and yield to planting density of solar greenhouse grown tomato in northwest China. Agric. Water Manage. 2013, 130, 44–51. [Google Scholar] [CrossRef]
- Li, Y.K.; Guo, W.Z.; Han, X.; Wang, L.C.; Lin, S.; Zhao, Q.; Chen, H. Evaluation of methods for estimating greenhouse eggplant daily evapotranspiration based on the values of weighing lysimeter measurements. J. Chin. Agrometeorol. 2020, 41, 129–137. [Google Scholar]
- Allen, R.G.; Pereira, L.S.; Howell, T.A.; Jensen, M.E. Evapotranspiration in formation reporting: II. Recommended documentation. Agric. Water Manag. 2011, 98, 921–929. [Google Scholar] [CrossRef]
- Tao, H.R. Effects of Different Water Irrigation Levels on Nitrogen Concentration of Soil Solution and Nitrogen Leaching in Greenhouse Cucumber. Master’s Thesis, Shanxi Agricultural University, Shanxi, China, 2018. [Google Scholar]
- Shan, G.; Sun, Y.; Cheng, Q.; Wang, Z.; Zhou, H.; Wang, L.; Xue, X.; Chen, B.; Jones, S.B.; Schulze Lammers, P.; et al. Monitoring tomato root zone water content variation and partitioning evapotranspiration with a novel horizontally-oriented mobile dielectric sensor. Agric. For. Meteorol. 2016, 228–229, 85–94. [Google Scholar] [CrossRef]
- Guo, H.; Li, S.E.; Kang, S.Z.; Du, T.S.; Tong, L.; Ding, R.S. Annual ecosystem respiration of maize was primarily driven by crop growth and soil water conditions. Agric. Ecosyst. Environ. 2019, 272, 254–265. [Google Scholar] [CrossRef]
- Incrocci, L.; Thompson, R.B.; Fernandez-fernande, M.D.; Pascale, S.D.; Pardossi, A.; Stanghellini, C.; Rouphael, Y.; Gallardo, M. Irrigation management of European greenhouse vegetable crops. Agric. Water Manag. 2020, 242, 106393. [Google Scholar] [CrossRef]
- Li, B.; Jing, Z.R.; Wei, X.G.; Sun, J.; Fu, S.N.; Ge, D. Spatial and temporal distribution characteristics of spring maize coefficients in northeast China. Trans. Chin. Soc. Agric. Mach. 2020, 51, 279–290. [Google Scholar]
- Willmott, C.J.; Matsuura, K. Advantages of the Mean Absolute Error (MAE) over the Root Mean Square Error (RMSE) in Assessing Average Model Performance. Clim. Res. 2005, 30, 79–82. [Google Scholar] [CrossRef]
- Orgaz, F.; Fernández, M.D.; Bonachela, S.; Gallardo, M.; Fereres, E. Evapotranspiration of horticultural crops in an unheated plastic greenhouse. Agric. Water Manag. 2005, 72, 81–96. [Google Scholar] [CrossRef]
- Zhao, P.; Kang, S.Z.; Li, S.E.; Ding, R.S.; Tong, L.; Du, T.S. Seasonal variations in vineyard ET partitioning and dual crop coefficients correlate with canopy development and surface soil moisture. Agric. Water Manag. 2018, 197, 19–33. [Google Scholar] [CrossRef]
- Muniandy, J.M.; Yusop, Z.; Askari, M. Evaluation of reference evapotranspiration models and determination of crop coefficient for Momordica charantia and Capsicum annuum. Agric. Water Manag. 2016, 169, 77–89. [Google Scholar] [CrossRef]
- Santosh, D.T.; Tiwari, K.N. Estimation of water requirement of Banana crop under drip irrigation with and without plastic mulch using dual crop coefficient approach. IOP Conf. Ser. Earth Environ. Sci. 2019, 344, 012024. [Google Scholar] [CrossRef]
- Ge, J.K.; Li, H.H.; Peng, C.W.; Tian, F.G.; Chen, Y.L. Research on crop coefficient of eggplant with drip irrigation under mulch in Sunlight Greenhouse. J. Irrig. Drain. 2015, 34, 59–62. [Google Scholar]
- Peres, J.G.; Marcussi, L.; Souza, C.; Brugnaro, C. Use of weighing lysimeters to determine crop coefficients for melon (Cucumis melo L.) to be cultivated in plastic greenhouse in the region of Araras-SP. J. Eng. Agric. 2013, 33, 475–487. [Google Scholar]
- Gong, X.W.; Qiu, R.J.; Sun, J.S.; Ge, J.K.; Li, Y.B.; Wang, S.S. Evapotranspiration and crop coefficient of tomato grown in a solar greenhouse under full and deficit irrigation. Agric. Water Manag. 2020, 235, 106154. [Google Scholar] [CrossRef]
- Qiu, R.J.; Du, T.S.; Kang, S.Z.; Chen, R.Q.; Wu, L.S. Assessing the SIMDualKc model for estimating evapotranspiration of hot pepper grown in a solar greenhouse in Northwest China. Agric. Syst. 2015, 138, 1–9. [Google Scholar] [CrossRef]
- Zhao, Y.; Mao, X.M.; Shukla, M.K.; Tian, F.; Hou, M.J.; Zhang, T.; Li, S. How does film mulching modify available energy, evapotranspiration, and crop coefficient during the seed–maize growing season in northwest China. Agric. Water Manag. 2021, 245, 106666. [Google Scholar] [CrossRef]
- Feng, Y.; Hao, W.P.; Gao, L.L.; Li, H.R.; Gong, D.Z.; Cui, N.B. Comparison of maize water consumption at different scales between mulched and non-mulched croplands. Agric. Water Manag. 2019, 216, 315–324. [Google Scholar] [CrossRef]
- Gong, X.W.; Qiu, R.J.; Ge, J.K.; Bo, G.K.; Ping, Y.L.; Xin, Q.S.; Wang, S.S. Evapotranspiration partitioning of greenhouse grown tomato using a modified Priestley–Taylor model. Agric. Water Manag. 2021, 247, 106709. [Google Scholar] [CrossRef]
- Yan, H.F.; Wu, H.M.; Zhang, C.; Acquah, S.J.; Zhao, B.S.; Huang, S. Estimation of greenhouse cucumber evapotranspiration in different seasons based on modified dual crop coefficient model. Trans. Chin. Soc. Agric. Eng. 2018, 34, 117–125. [Google Scholar]
- Tamilarasan, R.; Mailapalli, D.R.; Raghuwanshi, N.S. Estimation of evapotranspiration for paddy under alternate wetting and drying irrigation practice. Irrig. Drain. 2021, 70, 195–206. [Google Scholar]
- Gong, D.Z.; Mei, X.R.; Hao, W.P.; Wang, H.B.; Caylor, K.K. Comparison of ET partitioning and crop coefficients between partial plastic mulched and non–mulched maize fields. Agric. Water Manag. 2017, 181, 23–34. [Google Scholar] [CrossRef]
Figure 1.
Seasonal variation of air temperature (a) and relative humidity (b) during the study period in 3 consecutive years.
Figure 1.
Seasonal variation of air temperature (a) and relative humidity (b) during the study period in 3 consecutive years.

Figure 2.
Comparison of measured and estimated crop evapotranspiration (ETc) for greenhouse-grown eggplant in 2017. The dashed line represents a 1:1 ratio.
Figure 2.
Comparison of measured and estimated crop evapotranspiration (ETc) for greenhouse-grown eggplant in 2017. The dashed line represents a 1:1 ratio.

Figure 3.
Seasonal variation in reference crop evapotranspiration (ET0) for greenhouse-grown eggplant during the crop development stages in 3 consecutive years.
Figure 3.
Seasonal variation in reference crop evapotranspiration (ET0) for greenhouse-grown eggplant during the crop development stages in 3 consecutive years.

Figure 4.
Variation in daily local crop coefficient (Kc) of greenhouse-grown eggplant in the 2017, 2018, and 2019 seasons.
Figure 4.
Variation in daily local crop coefficient (Kc) of greenhouse-grown eggplant in the 2017, 2018, and 2019 seasons.

Figure 5.
Comparison of local crop coefficient developed (Kc,Loc) and adjusted crop coefficient (Kc,Adj) for greenhouse-grown eggplant in the 2017 (a), 2018 (b), and 2019 (c) growing seasons. The dashed line represents a 1:1 ratio.
Figure 5.
Comparison of local crop coefficient developed (Kc,Loc) and adjusted crop coefficient (Kc,Adj) for greenhouse-grown eggplant in the 2017 (a), 2018 (b), and 2019 (c) growing seasons. The dashed line represents a 1:1 ratio.

Figure 6.
Comparison of measured and estimated crop evapotranspiration (ETc) of greenhouse-grown eggplant in the 2018 (A,B), and 2019 (C,D) seasons.
Figure 6.
Comparison of measured and estimated crop evapotranspiration (ETc) of greenhouse-grown eggplant in the 2018 (A,B), and 2019 (C,D) seasons.


Table 1.
Duration of the crop development stages and measured growth indicators of greenhouse-grown eggplant in the 2017–2019 growing seasons.
Table 1.
Duration of the crop development stages and measured growth indicators of greenhouse-grown eggplant in the 2017–2019 growing seasons.
| Measured Indicator | Initial Stage | Development Stage | Middle Stage | End Stage | |
|---|---|---|---|---|---|
| 2017 | Days/d | 20 | 37 | 33 | 24 |
| Plant height/m | 0.11 | 0.34 | 0.79 | 0.94 | |
| LAI* | 0.06 | 0.91 | 3.10 | 2.89 | |
| 2018 | Days/d | 19 | 38 | 36 | 28 |
| Plant height/m | 0.12 | 0.35 | 0.81 | 0.96 | |
| LAI | 0.06 | 0.93 | 3.05 | 2.96 | |
| Days/d | 23 | 34 | 36 | 30 | |
| 2019 | Plant height/m | 0.12 | 0.38 | 0.83 | 0.97 |
| LAI | 0.07 | 0.95 | 3.02 | 2.98 | |
Notes: * Leaf area index.
Table 2.
Locally developed crop coefficient (Kc,Loc) and adjusted crop coefficient (Kc,Adj) for greenhouse-grown eggplant in the 2017–2019 growing seasons.
Table 2.
Locally developed crop coefficient (Kc,Loc) and adjusted crop coefficient (Kc,Adj) for greenhouse-grown eggplant in the 2017–2019 growing seasons.
| Kc | Growth | Season | Average | ||
|---|---|---|---|---|---|
| 2017 | 2018 | 2019 | |||
| Kc,FAO a | Initial | 0.60 | 0.60 | 0.60 | 0.60 |
| Development | / | / | / | / | |
| Middle | 1.05 | 1.05 | 1.05 | 1.05 | |
| End | 0.90 | 0.90 | 0.90 | 0.90 | |
| Kc,Adj b | Initial | 0.20 | 0.19 | 0.21 | 0.20 ± 0.01 |
| Development | 0.64 | 0.63 | 0.66 | 0.64 ± 0.01 | |
| Middle | 1.02 | 1.01 | 1.00 | 1.01 ± 0.01 | |
| End | 0.84 | 0.84 | 0.87 | 0.85 ± 0.02 | |
| Kc,Loc c | Initial | 0.20 | 0.25 | 0.24 | 0.23 ± 0.03 |
| Development | 0.57 | 0.61 | 0.69 | 0.62 ± 0.06 | |
| Middle | 1.07 | 1.07 | 1.02 | 1.05 ± 0.03 | |
| End | 0.84 | 0.88 | 0.90 | 0.87 ± 0.03 | |
Notes: a The values were reported in FAO-56 [7]. b The values were adjusted based on a greenhouse environment, as shown in Equations (6)–(8). c Defined as the ratio between observed ETc and ET0 at four distinct growth stages. Values are mean ± SE of each growth stage in 3 years.
Table 3.
Statistical indicators of measured and estimated crop evapotranspiration (ETc) for greenhouse-grown eggplant in 2018 and 2019.
Table 3.
Statistical indicators of measured and estimated crop evapotranspiration (ETc) for greenhouse-grown eggplant in 2018 and 2019.
| Season | Statistical Indicators | Initial | Development | Middle | End | Whole |
|---|---|---|---|---|---|---|
| 2018 | Measured ETc(mm‧d−1) | 0.49 | 1.86 | 4.04 | 3.21 | 2.60 |
| Estimated ETc(mm‧d−1) | 0.38 | 1.94 | 3.83 | 3.07 | 2.51 | |
| MAE(mm‧d−1) | 0.11 | 0.22 | 0.20 | 0.39 | 0.26 | |
| RMSE(mm‧d−1) | 0.11 | 0.29 | 0.31 | 0.48 | 0.35 | |
| d* | 0.99 | 0.98 | 0.98 | 0.93 | 0.98 | |
| 2019 | Measured ETc(mm‧d−1) | 0.38 | 1.79 | 3.72 | 3.73 | 2.57 |
| Estimated ETc(mm‧d−1) | 0.34 | 1.75 | 3.68 | 3.63 | 2.51 | |
| MAE(mm‧d−1) | 0.06 | 0.27 | 0.32 | 0.32 | 0.26 | |
| RMSE(mm‧d−1) | 0.09 | 0.32 | 0.40 | 0.43 | 0.35 | |
| d | 0.99 | 0.98 | 0.97 | 0.96 | 0.98 |
Notes: * Index of agreement.
Publisher’s Note: MDPI stays neutral with regard to jurisdictional claims in published maps and institutional affiliations. |
© 2022 by the authors. Licensee MDPI, Basel, Switzerland. This article is an open access article distributed under the terms and conditions of the Creative Commons Attribution (CC BY) license (https://creativecommons.org/licenses/by/4.0/).
Share and Cite
MDPI and ACS Style
Li, Y.; Guo, W.; Wu, J.; Duan, M.; Yang, Y.; Liu, S. Estimation of Greenhouse-Grown Eggplant Evapotranspiration Based on a Crop Coefficient Model. Water 2022, 14, 2959. https://doi.org/10.3390/w14192959
AMA Style
Li Y, Guo W, Wu J, Duan M, Yang Y, Liu S. Estimation of Greenhouse-Grown Eggplant Evapotranspiration Based on a Crop Coefficient Model. Water. 2022; 14(19):2959. https://doi.org/10.3390/w14192959
Chicago/Turabian StyleLi, Yinkun, Wenzhong Guo, Jiale Wu, Minjie Duan, Yi Yang, and Shengyao Liu. 2022. "Estimation of Greenhouse-Grown Eggplant Evapotranspiration Based on a Crop Coefficient Model" Water 14, no. 19: 2959. https://doi.org/10.3390/w14192959
Note that from the first issue of 2016, this journal uses article numbers instead of page numbers. See further details here.