Article

Effect of Temperature and Acidification on Reinjection of Geothermal Water into Sandstone Geothermal Reservoirs: Laboratory Study

1
The Institute of Hydrogeology and Environmental Geology, Chinese Academy of Geological Sciences, Shijiazhuang 050061, China
2
Technology Innovation Center for Geothermal & Hot Dry Rock Exploration and Development, Ministry of Natural Resources, Shijiazhuang 050061, China
3
Hebei Province Key Laboratory of Sustained Utilization and Development of Water Resources, School of Water Resources and Environment, Hebei GEO University, Shijiazhuang 050031, China
4
Shandong Provincial Lubei Geo-Engineering Exploration Institute, Dezhou 253000, China
*
Author to whom correspondence should be addressed.
Water 2022, 14(19), 2955; https://doi.org/10.3390/w14192955
Submission received: 21 August 2022 / Revised: 18 September 2022 / Accepted: 19 September 2022 / Published: 21 September 2022
(This article belongs to the Special Issue Hydrochemical Characteristics of Geothermal Water)

Abstract

:
Geothermal reinjection is a new method of geothermal development which can maintain regional geothermal reservoir pressure, and it is conducive to the sustainable development and utilization of geothermal heat. However, geothermal reinjection blockage has always been a problem that restricts geothermal development and utilization, causing geothermal reservoirs, especially the attenuation of sandstone geothermal reservoirs. Considering an example of a typical sandstone geothermal reservoir in Binzhou, in this study, in situ geothermal fluids and borehole cores were collected to conduct automatic rotary reactor experiments under different temperature and acidification conditions in laboratory studies. The chemical compositions of geothermal fluids and core samples before and after the experiment were compared. The results show that both temperature and acid have significant effects on the water–rock interaction. The effect of temperature is mainly shown on mineral solubility, while the effect of acidification is shown in the increased dissolution of calcite and feldspar minerals. Compared with high temperature (65 °C) reinjection conditions, the calcite precipitation at a low temperature (45 °C) is largely reduced, but with larger total mineral volume changes, mainly due to the formation of montmorillonite. Therefore, from the laboratory studies, it is recommended to preform reinjection using a low-temperature fluid, without adding acids.

1. Introduction

Geothermal energy is a sustainable and clean energy source that has received extensive attention over the past decade. Reinjection of geothermal water is used to pour geothermal wastewater or groundwater into geothermal reservoirs [1]. Its main purpose is to process geothermal wastewater, improve or restore the heat production capacity of the reservoir, and maintain the geothermal fluid pressure of geothermal fields. Moreover, the reinjection of wastewater after treatment can effectively reduce the thermal and chemical pollution in the soil, surface water, and shallow groundwater caused by geothermal water discharge [2,3,4]. In many countries, reinjection of geothermal wastewater has been proved to be an effective way to maintain geothermal reservoir pressure [1,2,5,6].
However, the suspended matter, sediment, gas, and microorganisms carried in the cooled water of geothermal reinjection leads to the blockage of geothermal reservoirs, which is a problem that restricts the development and utilization of geothermal energy [7,8]. The causes of geothermal water injection blockage are complex, including physical blockage (caused by suspended solid particles), biological blockage (caused by bacteria), chemical blockage, and gas blockage after a change in the geothermal fluid environment [3,6,9,10,11]. Suspended solids, microorganisms, and chemical precipitation in the reinjection of cooled thermal water were the top three causes of reservoir blockage due to decreased permeability [12]. The influence of chemical processes, such as oxidation-reduction and acid-base reactions on carbonate precipitation in geothermal reservoirs, were investigated, and equations were established to predict the scaling tendency [13]. The mineral scaling caused by the reinjection of geothermal water was also studied and simulated in fractured geothermal fields [14]. In addition to particle migration, the influence of chemical blocking was found to be the main blocking factor in the Xianyang well, and the chemical blocking rate accounted for 38.2% of the total [15]. At present, the reinjection of carbonate geothermal reservoirs has reached a relatively satisfactory degree [16]; however, the reinjection of sandstone reservoirs remains an international technical problem. Previous experimental studies have been conducted on the chemical precipitation and scaling rule in the blockage of reinjection water [7,17]. The pore blockage caused by the precipitation of solid particles was the main factor for the weakening of reinjection capacity [11]. Experiments were conducted to study the blocking mechanism of cooled thermal water reinjection in Xi’an and Xianyang, and it was reported that Fe2+ in groundwater formed glue-packed sediments, causing blocking [18]. At present, scholars have made some progress regarding chemical clogging of reinjected water, but most studies tend to provide qualitative conclusions, and there is a lack of systematic research on dissolution and precipitation in water–rock interactions.
In this study, using geothermal water and sandstone samples collected from the Binzhou geothermal field, laboratory studies have been carried out by applying the geochemical element migration method, through the automatic rotary reactor of the geothermal fluid injection and the water in the reservoir rock process, to perform quantitative research. Thus, we provide theoretical references regarding the sandstone geothermal reservoir injection fluid chemical blocking mechanism.

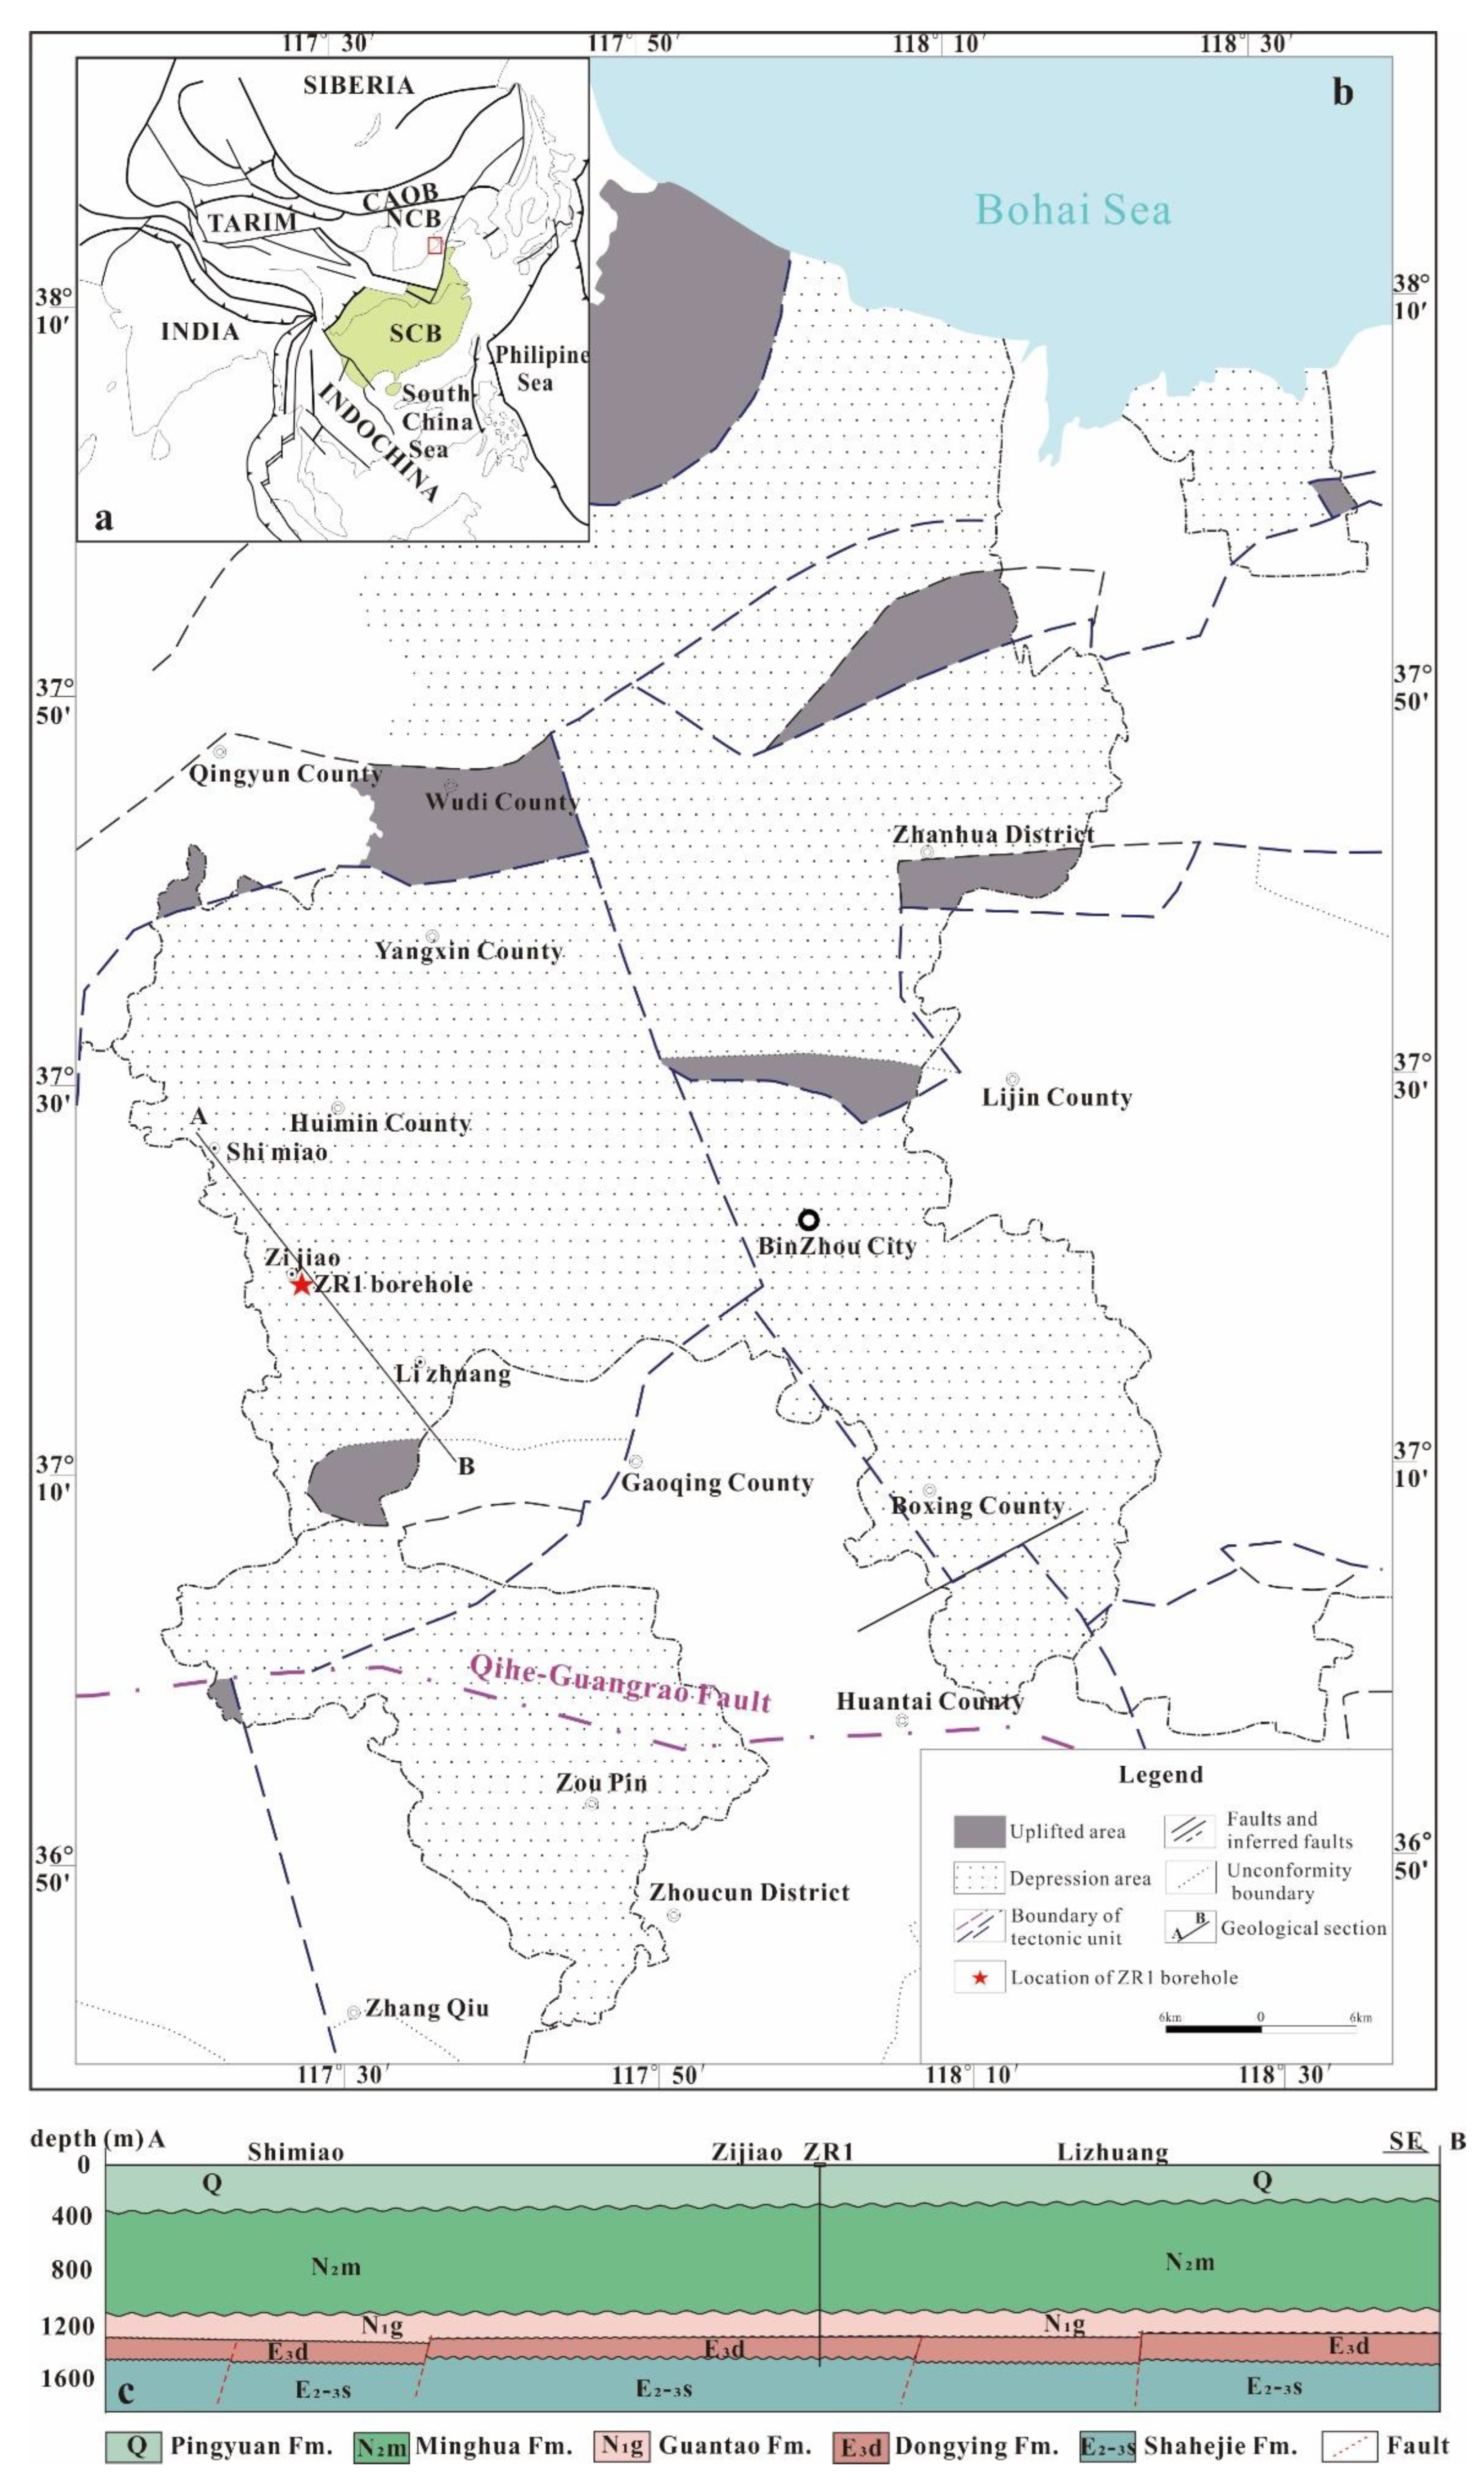
2. Characteristics of Sandstone Geothermal Reservoirs

Binzhou geothermal field is located in the North China Plain, which is a Mesozoic-Cenozoic fault depression basin with Archean and Paleozoic basement. Influenced by differential lifting movements, huge, thick sedimentary layers of Mesozoic and Cenozoic terrestrial clastic rocks were deposited (Figure 1). The main fault in the region is the Qihe-Guangrao Fault, with a NEE strike and NW tendency, and a dip of >60°. The fault is formed before the Mesozoic Era and is still strongly active in the Cenozoic Era.
The geothermal water of the Binzhou geothermal field is mainly accumulated in the pores of the Paleozoic and Neoproterozoic layered sandstone and in the karst pores of Paleozoic limestone. The Neoproterozoic Guantao formation is the main exploited geothermal reservoir, and the Neoproterzoic Minghuazhen formation and the Quaternary layer act as the cover layers (Figure 1). The top interface of the Neoproterozoic Guantao Formation geothermal reservoir is 900–1040 m deep, the bottom interface is 1000–1300 m deep, and the reservoir thickness is 100–300 m. The logging data of local geothermal boreholes show that the temperature of the geothermal water is generally less than 90 °C [19]. The lithology of the Guantao Formation geothermal reservoir is mainly fine sandstone and feldspathic sandstone, and the main mineral composition is quartz, plagioclase, and biotite.
At present, 16 geothermal boreholes have been used for geothermal development and utilization in the Binzhou geothermal field, and the exploited stratum are all from the Neoproterozoic Guantao formation. The depth of geothermal boreholes is 1298~1500 m, the outlet water temperature is 50~53 °C, the yield of a single borehole is 80~100 m3/h, and the actual exploitation volume is 60~80 m3/h [19]. The static water level in the area is at a depth of 46.5–52.0 m, and the dynamic water level is 61–86 m. At a drawdown water level of 20 m, the yield of a single borehole ranges from 60 to 120 m3/h. The main water chemistry type is Na-Cl, and the total dissolved solids of 8–11 g/L [19].

3. Methods

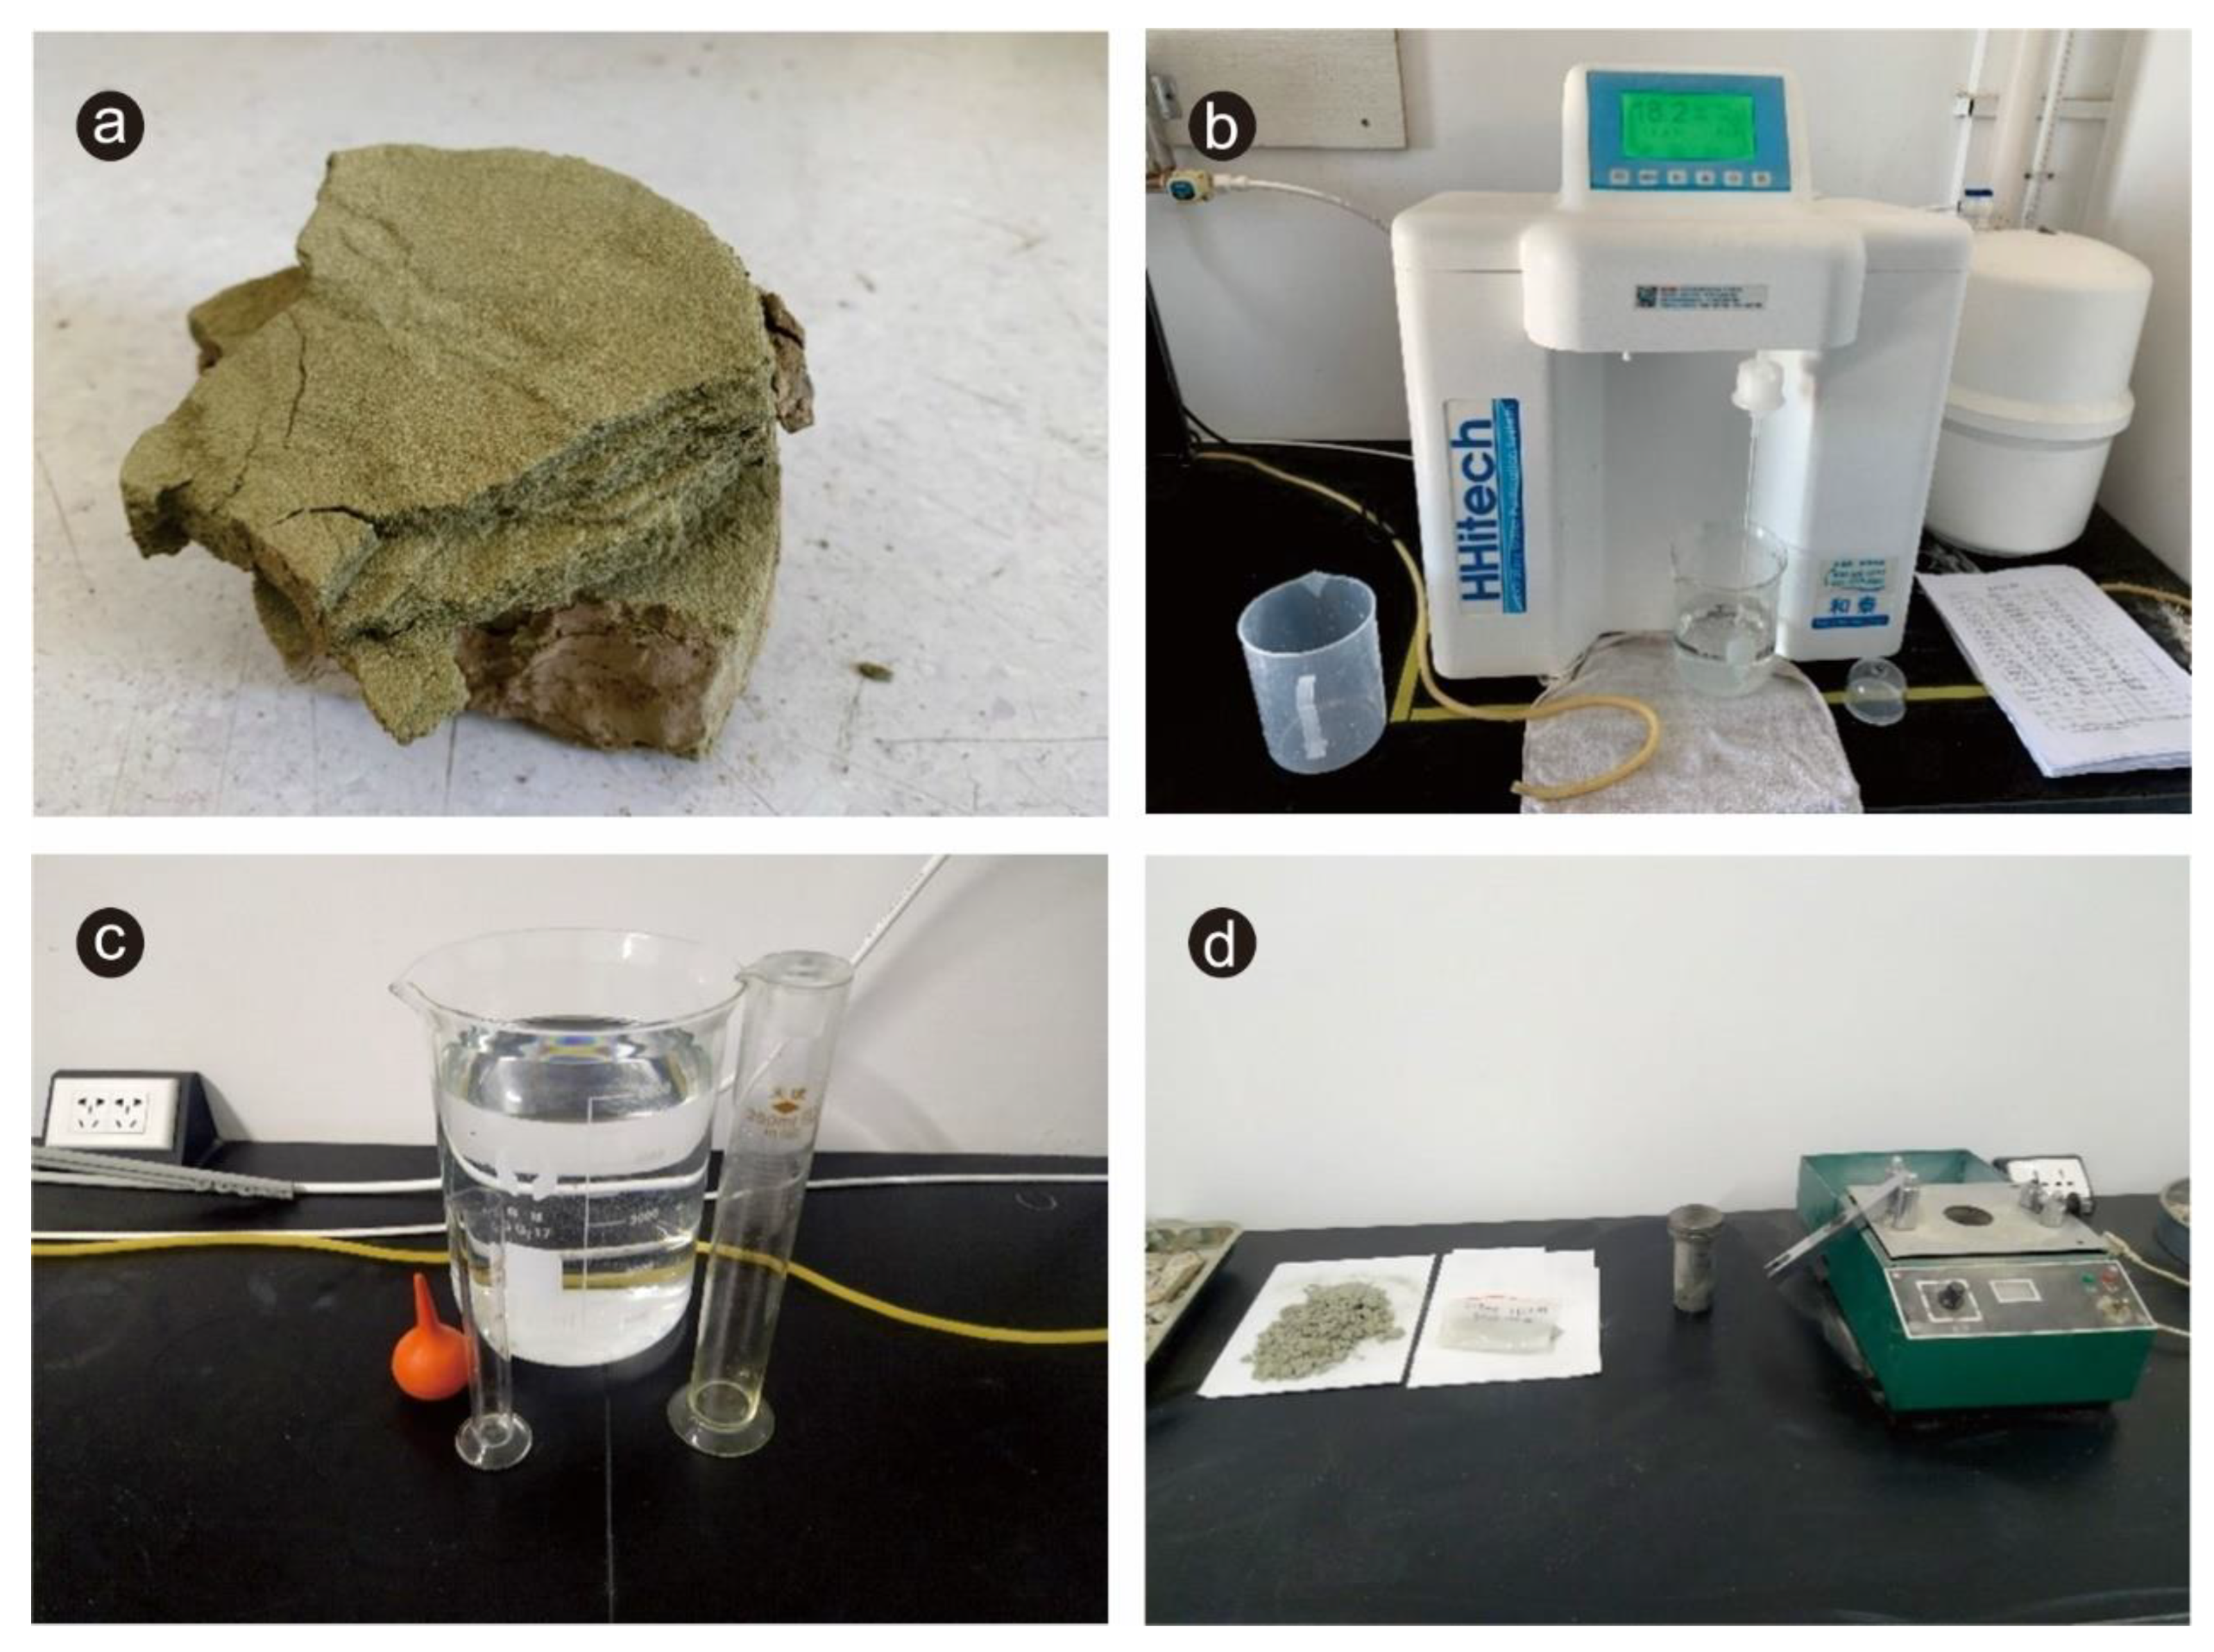
3.1. Sample Preparation

Geothermal water was collected from a geothermal borehole in Binzhou, China, with a total dissolved solids (TDS) of 11 g/L. The geothermal water was heated in an incubator at 55 °C (reservoir temperature revealed by logging data of the borehole [19]), then mixed evenly, and distributed into 40 parts (including 20 parts at 45 °C and 20 parts at 65 °C). Under each temperature condition, 10 parts were placed in the normal group and 10 parts were placed in the acid group, with 2% hydrofluoric acid (HF) added for comparison with the normal group. 300 mL Geothermal water was added to each sample of the normal group. The acid group contained 280 mL geothermal water with 20 mL acid.
The core is weakly consolidated loose rock with bedding layers, and is taken from the sandstone reservoir in the same geothermal borehole in Binzhou as the geothermal water, with a depth of 1153 m. The cores were initially crushed using a grinder, screened using a 50-mesh sieve, washed with distilled water to remove soluble salt, dried, and then screened using a 50-mesh sieve. A total of 30 g of rock powder was weighed using a high-precision balance and distributed to each sample (Figure 2).

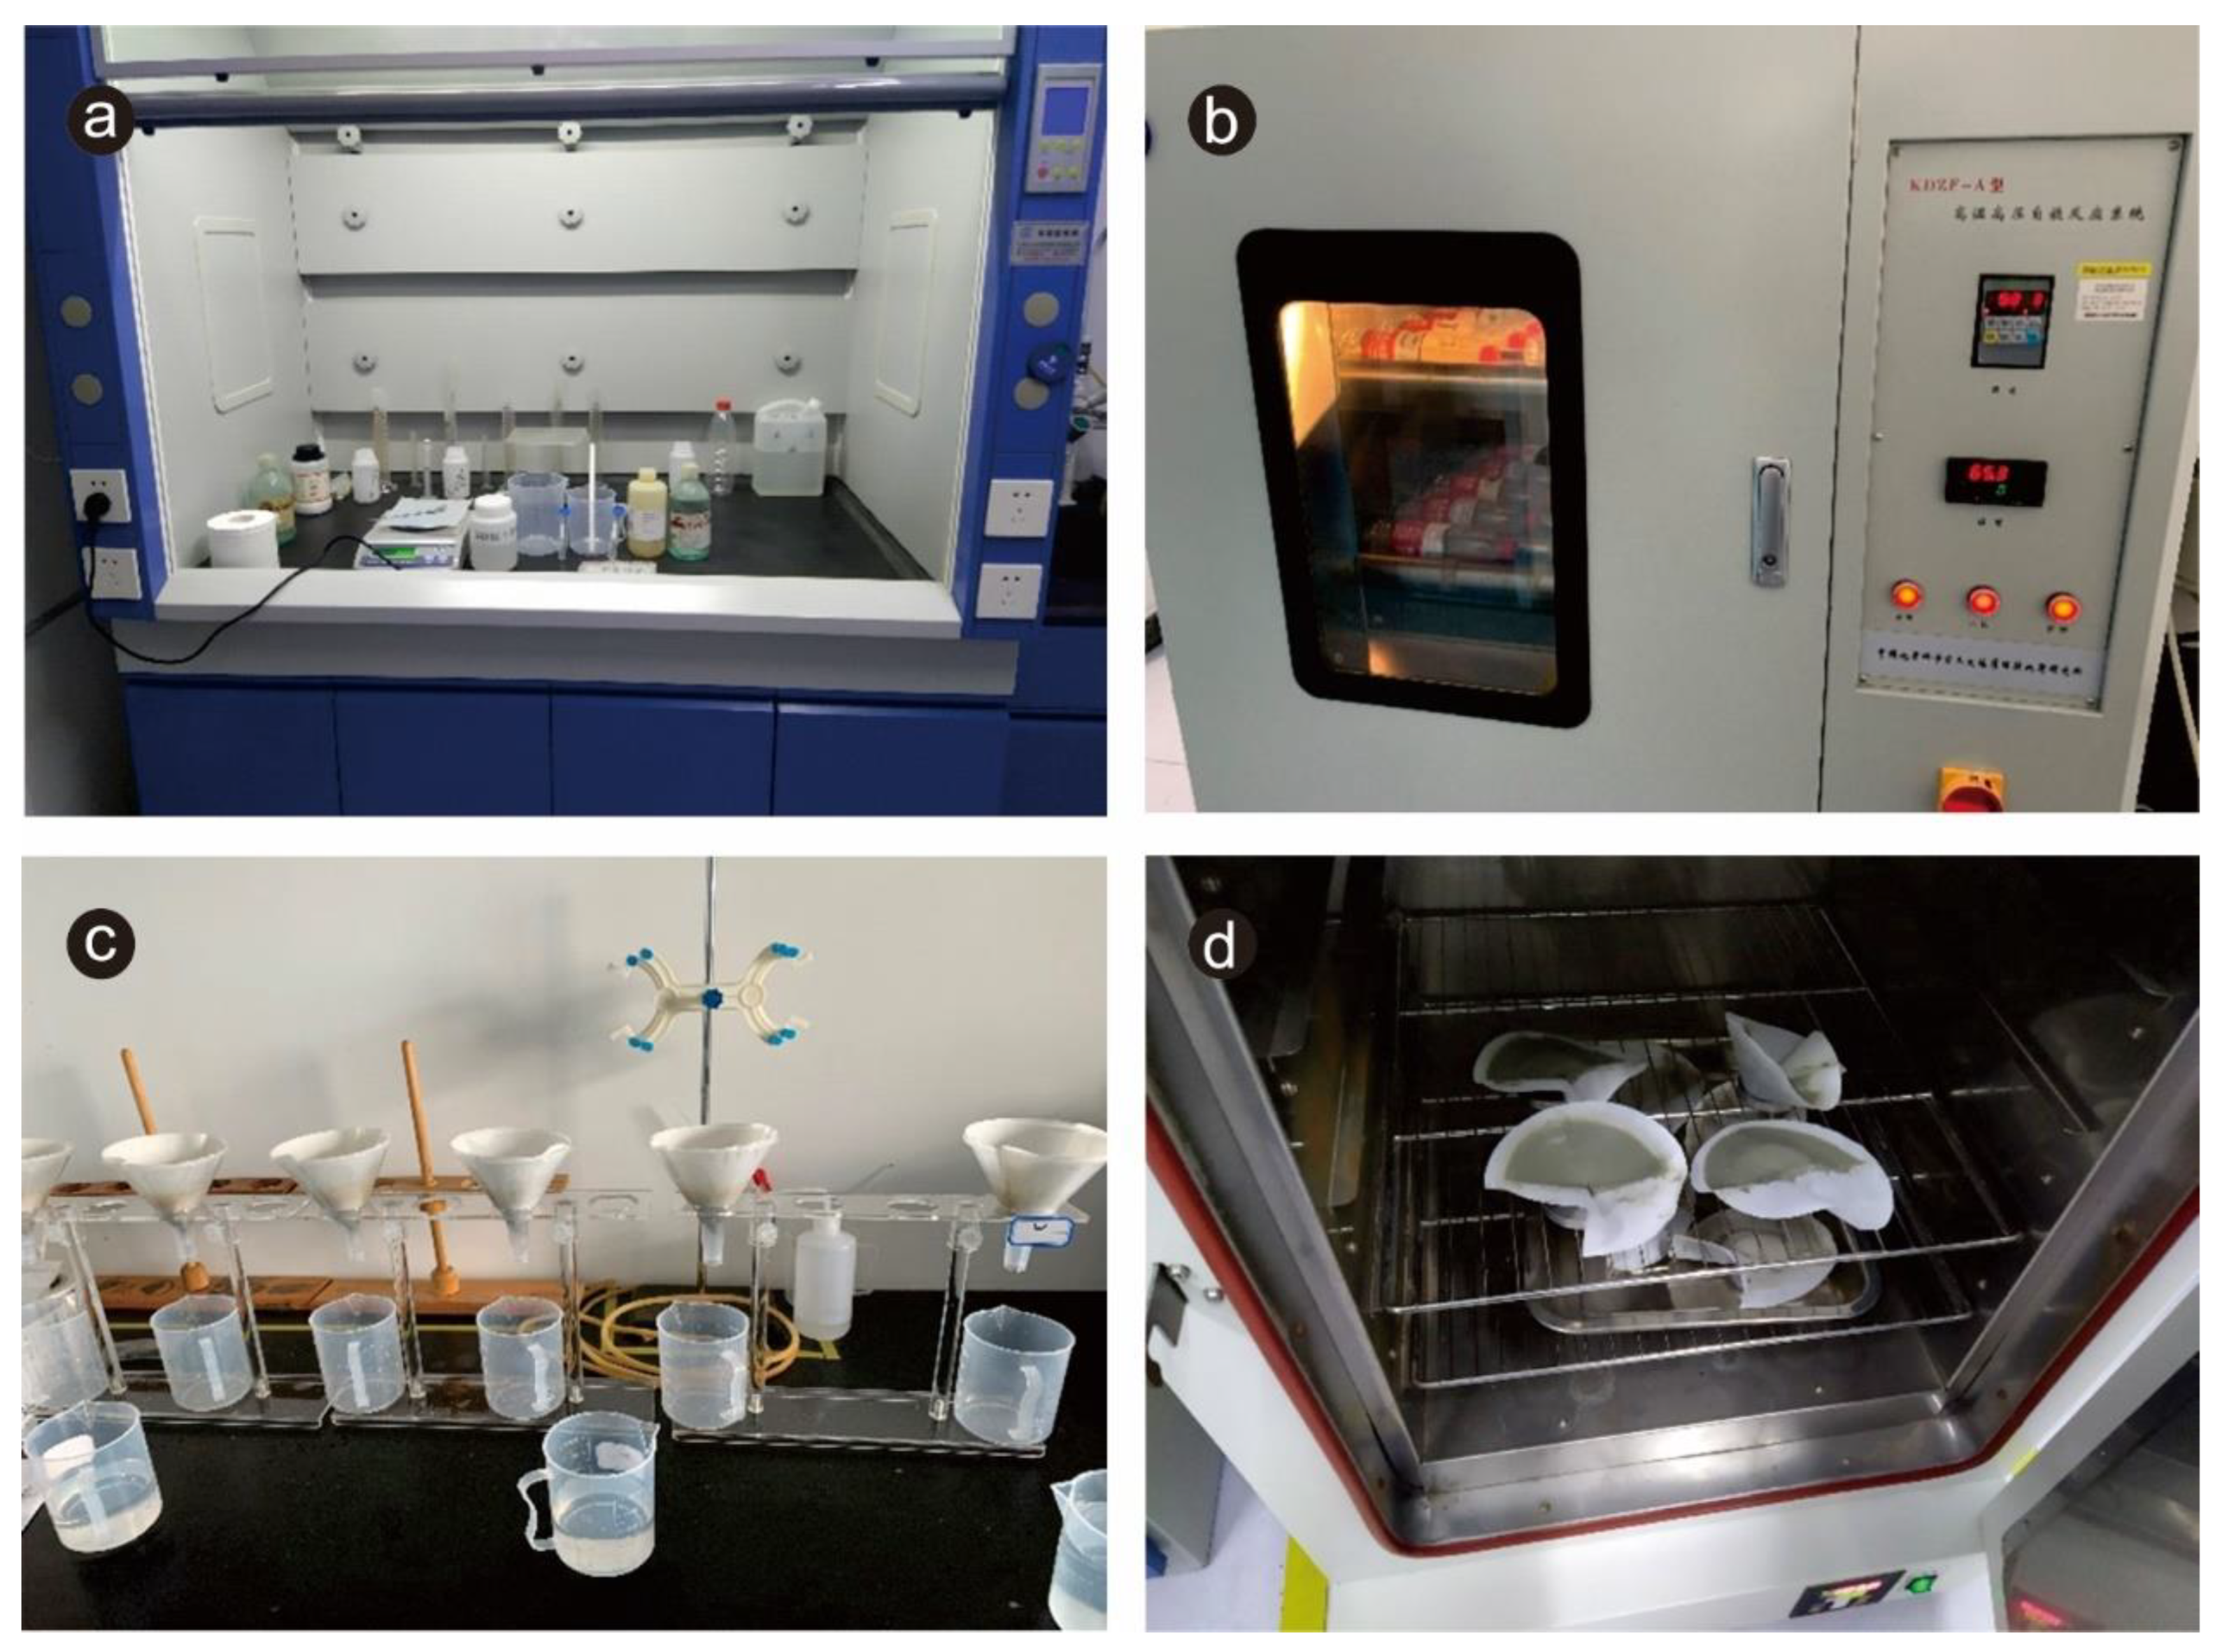
3.2. Experimental Design

The experiment was designed to simulate the water–rock interaction dissolution and precipitation at 65 °C and 45 °C. Experimental samples of the same temperature were put into the automatic rotary reactor system at the same time and taken out at the appropriate time, as designed (Table 1). The effect of the acid addition on the water–rock interaction was compared by placing the acid group and the normal group under different temperature conditions. The detailed design is shown in Table 1.

3.3. Precipitation Quality Analysis

Before placing the samples, the filter paper was weighed using a high-precision balance, and the rock powder was placed on the filter paper for weighing and recording. After adding the rock powder to the geothermal water and placing each sample into the automatic rotary reactor system, the reaction was started at the same time for each sample under the same temperature conditon (Figure 3)”. When the samples reached the expected time, they were removed, filter paper was added for filtration, and the filtered precipitation, along with the filter paper, was placed in a 105 °C incubator for drying. After drying, a high-precision balance was used to weigh and record the precipitation.

3.4. Major Element Analysis of Water and Ground Rock Specimens

The concentrations of major cations of water were detected using an ICP-OES (iCAP 7200 Duo, Thermo Fisher Scientific, Waltham, United States). The anions were determined using ion chromatography (ICS3000, Thermo Fisher Scientific). The mineral composition of the ground rock specimens was determined using X-ray diffraction (XRD), and the test was carried out at the Beidazhihui Microstructure Analysis and Testing Center in Beijing. The whole-rock major element contents of the ground rock specimens were determined by X-ray fluorescence spectroscopy (XRF-1500), as well as the trace element and rare earth element (REE) contents in the ground rock specimens. For elemental contents greater than 1 ppm, the accuracy of the analytical method is better than 5%; otherwise, the accuracy is usually better than 10%. The analytical uncertainty was 10% for elements with an abundance ≤10 ppm and approximately 5% for elements with an abundance ≥10 ppm.

3.5. Calculation of Mineral Volume Changes

The specific mineral volume changes before and after the water–rock interaction is calculated using the following equation:
V i = A i D i
where Δ V i and A i are the individual mineral volume change and mass change, respectively; D i   is the density of the individual mineral.
The total mineral volume change is calculated as follows:
V t o t a l = A i D i = A t a t a l × X i D i
where V t o t a l is the total mineral volume change; A t a t a l is the total mass amount; X i is the percentage change in mass of individual mineral.
In the calculation, the total mass amount was set as 100 g. The percentage change in the mass of minerals can be obtained from XRD measurement results. The density data of the minerals are referred from the National Infrastructure of Mineral, Rock, and Fossil for Science and Technology (http://www.nimrf.net.cn, accessed on 20 August 2022) [20].

4. Results

Through the automatic rotary reactor experiments for acid and normal groups at 65 °C and 45 °C, the change characteristics of the residual precipitation under the reaction conditions of 0–60 h were obtained (Table 2). Compared with the initial precipitation of 30 g, the residual precipitation of each sample after water–rock interaction decreased. The main element contents of the geothermal water (Table 3), core rock (Table 4), and mineral composition of the core rock (Table 5) after 60 h of reaction were obtained at different temperatures.

5. Discussion

5.1. Mineral and Element Migration during Interaction

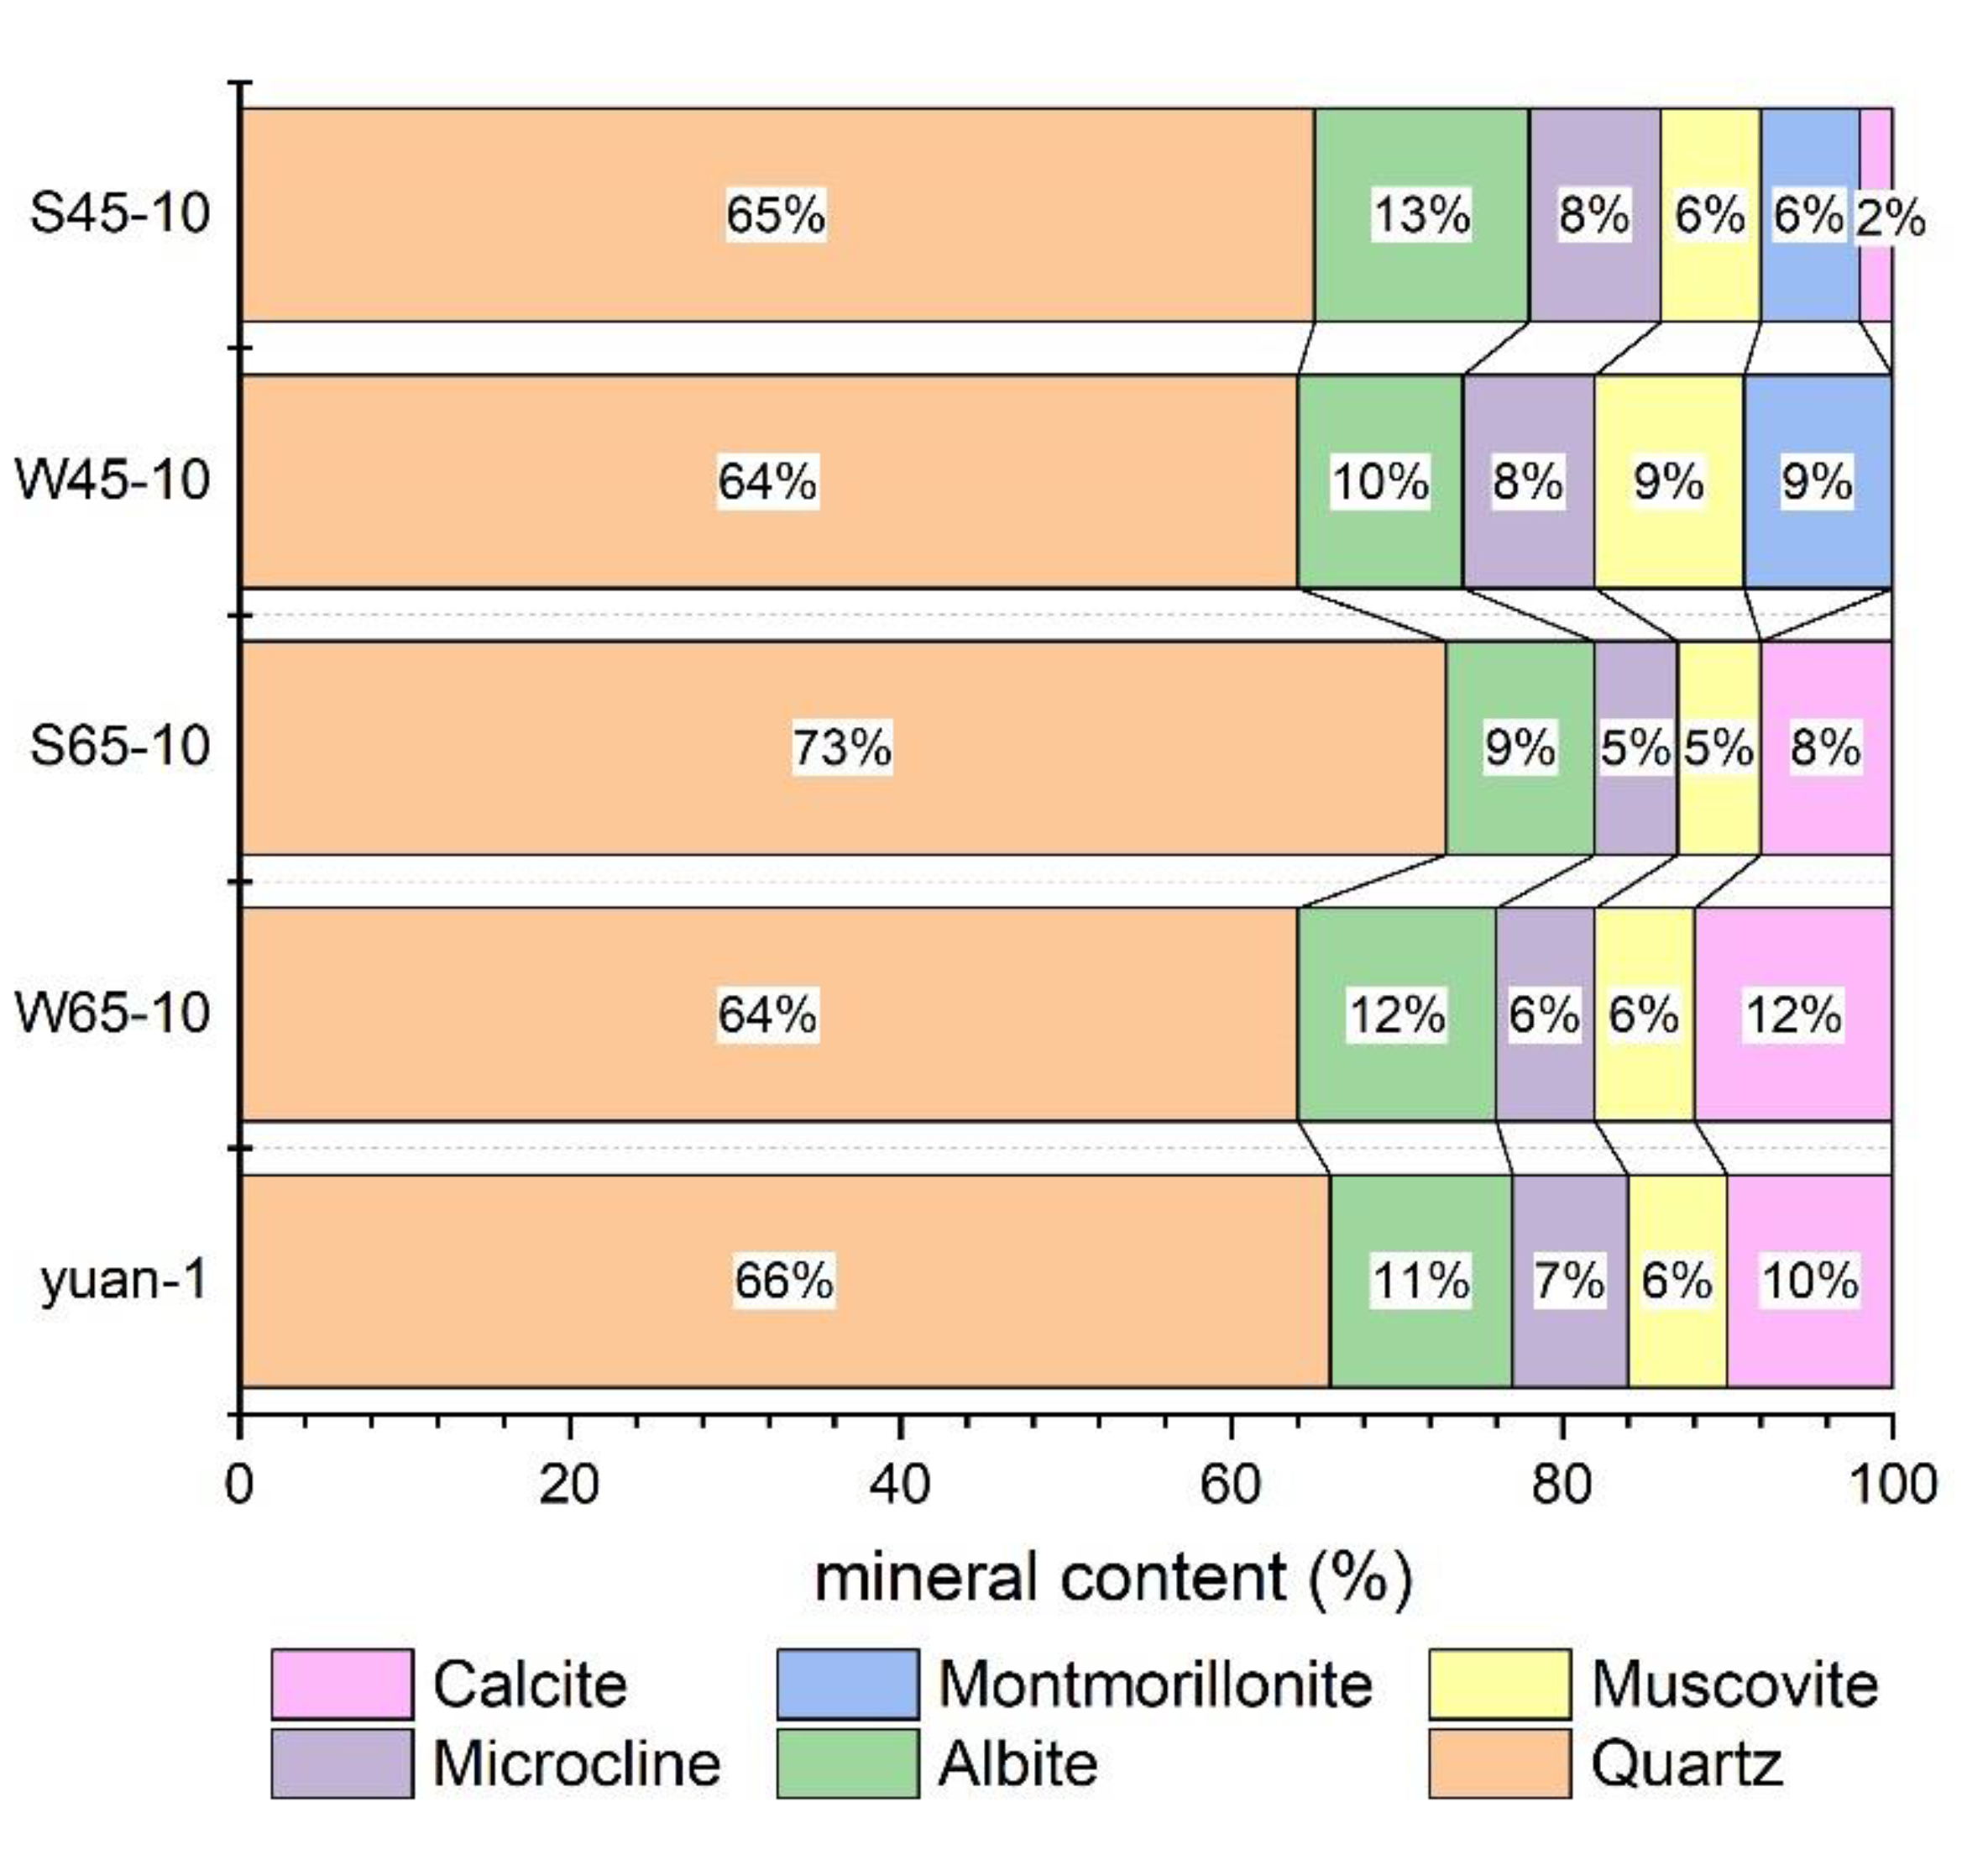
5.1.1. Mineral Composition Comparison

The characteristics of the dissolved and precipitated minerals can be obtained from the mineral composition of the core rock during the water–rock interaction. Compared with the mineral components of the core sample before the experiments (yuan-1), calcite was dissolved in different amounts and montmorillonite was newly formed (Figure 4). Element migration during water–rock interactions can also occur in a short period of time [21]. Muscovite, albite, and microcline have small amounts of dissolution and precipitation, whereas quartz shows varying dissolution and precipitation characteristics under different temperature conditions.
From the temperature conditions, compared with yuan-1, at 45 °C, montmorillonite formed and the calcite dissolved, while at 65 °C, montmorillonite did not form, nor did the calcite dissolve. This shows the differences in mineral dissolution and precipitation due to temperature variables. Calcite did not dissolve at 65 °C, possibly because the solubility of calcite decreases as temperatures increase [22,23], causing the calcite to precipitate. Therefore, despite the presence of hydrofluoric acid in the samples of the acid group, the content of acid-dissolved calcite may be less than that of precipitated calcite due to reduced solubility. The mineral compositions of W65-10 and S65-10 are quite different. W65-10 primarily precipitated calcite, whereas S65-10 dissolved calcite, albite, and muscovite. The formation of montmorillonite at 45 °C is possibly due to the alteration in albite [24]. The speculated chemical reactions are as follows.
Albite/microcline + H 2 O + Ca 2 + + H + + M g 2 + ( K + , N a + ) + S i O 2 + Montmorillonite
CaCO 3 + H 2 O + CO 2 Ca 2+ + HCO 3 + OH
Albite/microcline consumes Ca when generating montmorillonite (1), causing the calcite water solubility equation to proceed to the right side (2) and increasing the dissolution of calcite. This may be the reason for the precipitation of montmorillonite and the dissolution of calcite at 45 °C. Correspondingly, the content of Ca reduced, owing to the decrease in the solubility of calcite at 65 °C (2), causing the reaction to proceed to the left (1), and thus no montmorillonite is formed”. However, the reason why the mineral fractions of albite/microcline did not decrease at 45 °C is not clear.

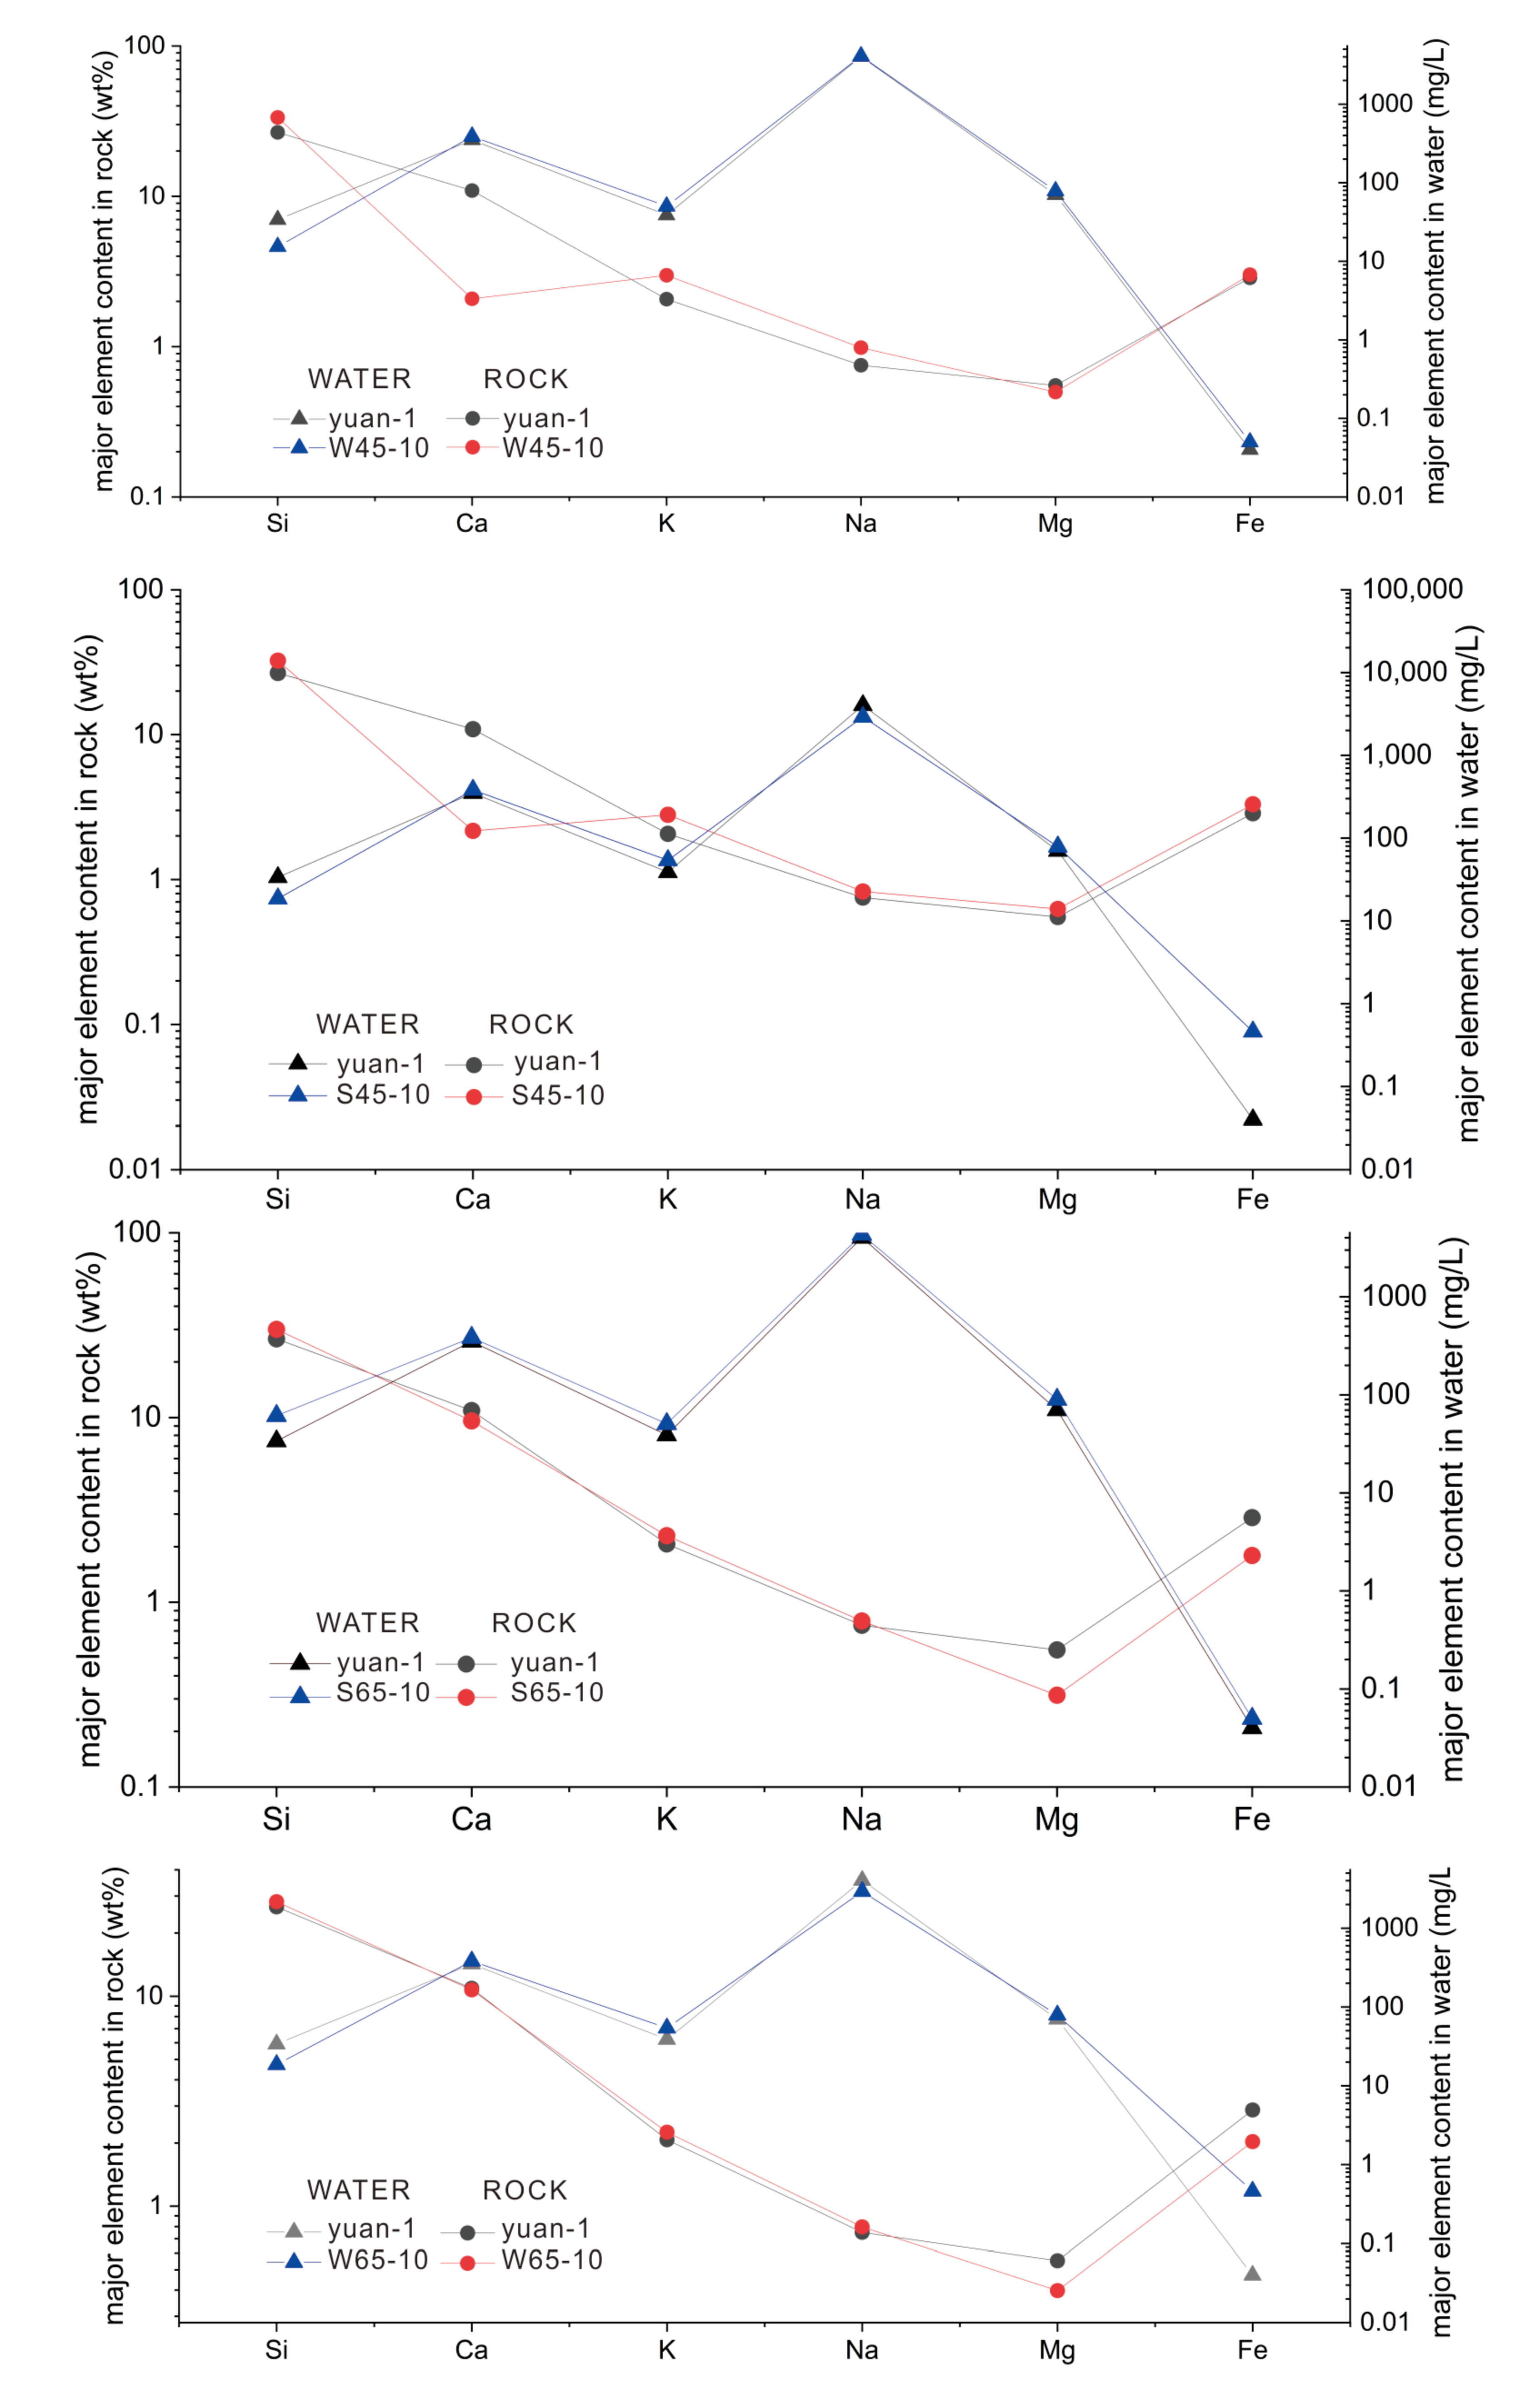
5.1.2. Contents of Major Elements Comparison

At 45 °C, the rock dissolves calcite, albite, microcline, and muscovite to produce montmorillonite, indicating the loss of Ca and gain of Si. As the water–rock interaction occurs in a closed space, the corresponding water acquires Ca and loses Si (Figure 5). The loss of Ca, K, and Na from dissolved calcite, albite, microcline, and muscovite may enter the water or montmorillonite for reprecipitation; therefore, the corresponding changes in ion content in water and rock must be determined. We have compared the typical elements (Si, Ca, K, Na, Mg, Fe) of the W45-10 and S45-10 samples at 45 °C with the original sample (yuan-1). Si precipitates from the water into the rock, which is consistent with the mineral composition analysis. The dissolution of Ca from the rock into the water indicated that the Ca content in the precipitated montmorillonite was less than that of dissolved calcite. Compared with Si and Ca, the other elements did not show obvious migration characteristics. For example, Mg in both W45-10 and S45-10 showed an increase in water content, which indicates the dissolution of Mg from the rock into the water. The migration of Mg is probably because albite, microcline, and muscovite dissolve to provide Mg. However, the Mg content in the rock of S45-10 increased slightly, likely because of the larger loss of additional ion content (such as Ca), resulting in the rocks showing an increase in the percentages, despite the loss of Mg. Similarly, K and Fe showed an increase in their contents in both water and rock.
At 65 °C, the dissolution of quartz and the precipitation of calcite occurred in W65-10, whereas the dissolution of calcite, albite, microcline, and muscovite occurred in S65-10. The Si in the W65-10 sample was precipitated into the rock, while the Si in S65-10 showed an increase in both rock and water (Figure 5), presumably because of the increase in Si in water caused by the dissolution of albite, microcline, and muscovite under acidic conditions and the corresponding increase in quartz content in the mineral composition, caused by the dissolution of other minerals. Furthermore, the greater content loss of ions other than Si may increase the content of Si in the rock, which is supported by the fact that Ca, Mg, and Fe are dissolved from the rock into water. K and Na in S65-10 show an increase in content in both rock and water, where the content increase in water may be due to the dissolution of albite, microcline, and muscovite. The content increase in rock may be the result of the increased dissolution of Ca, which leads to a relatively higher content of K and Na in the rock.

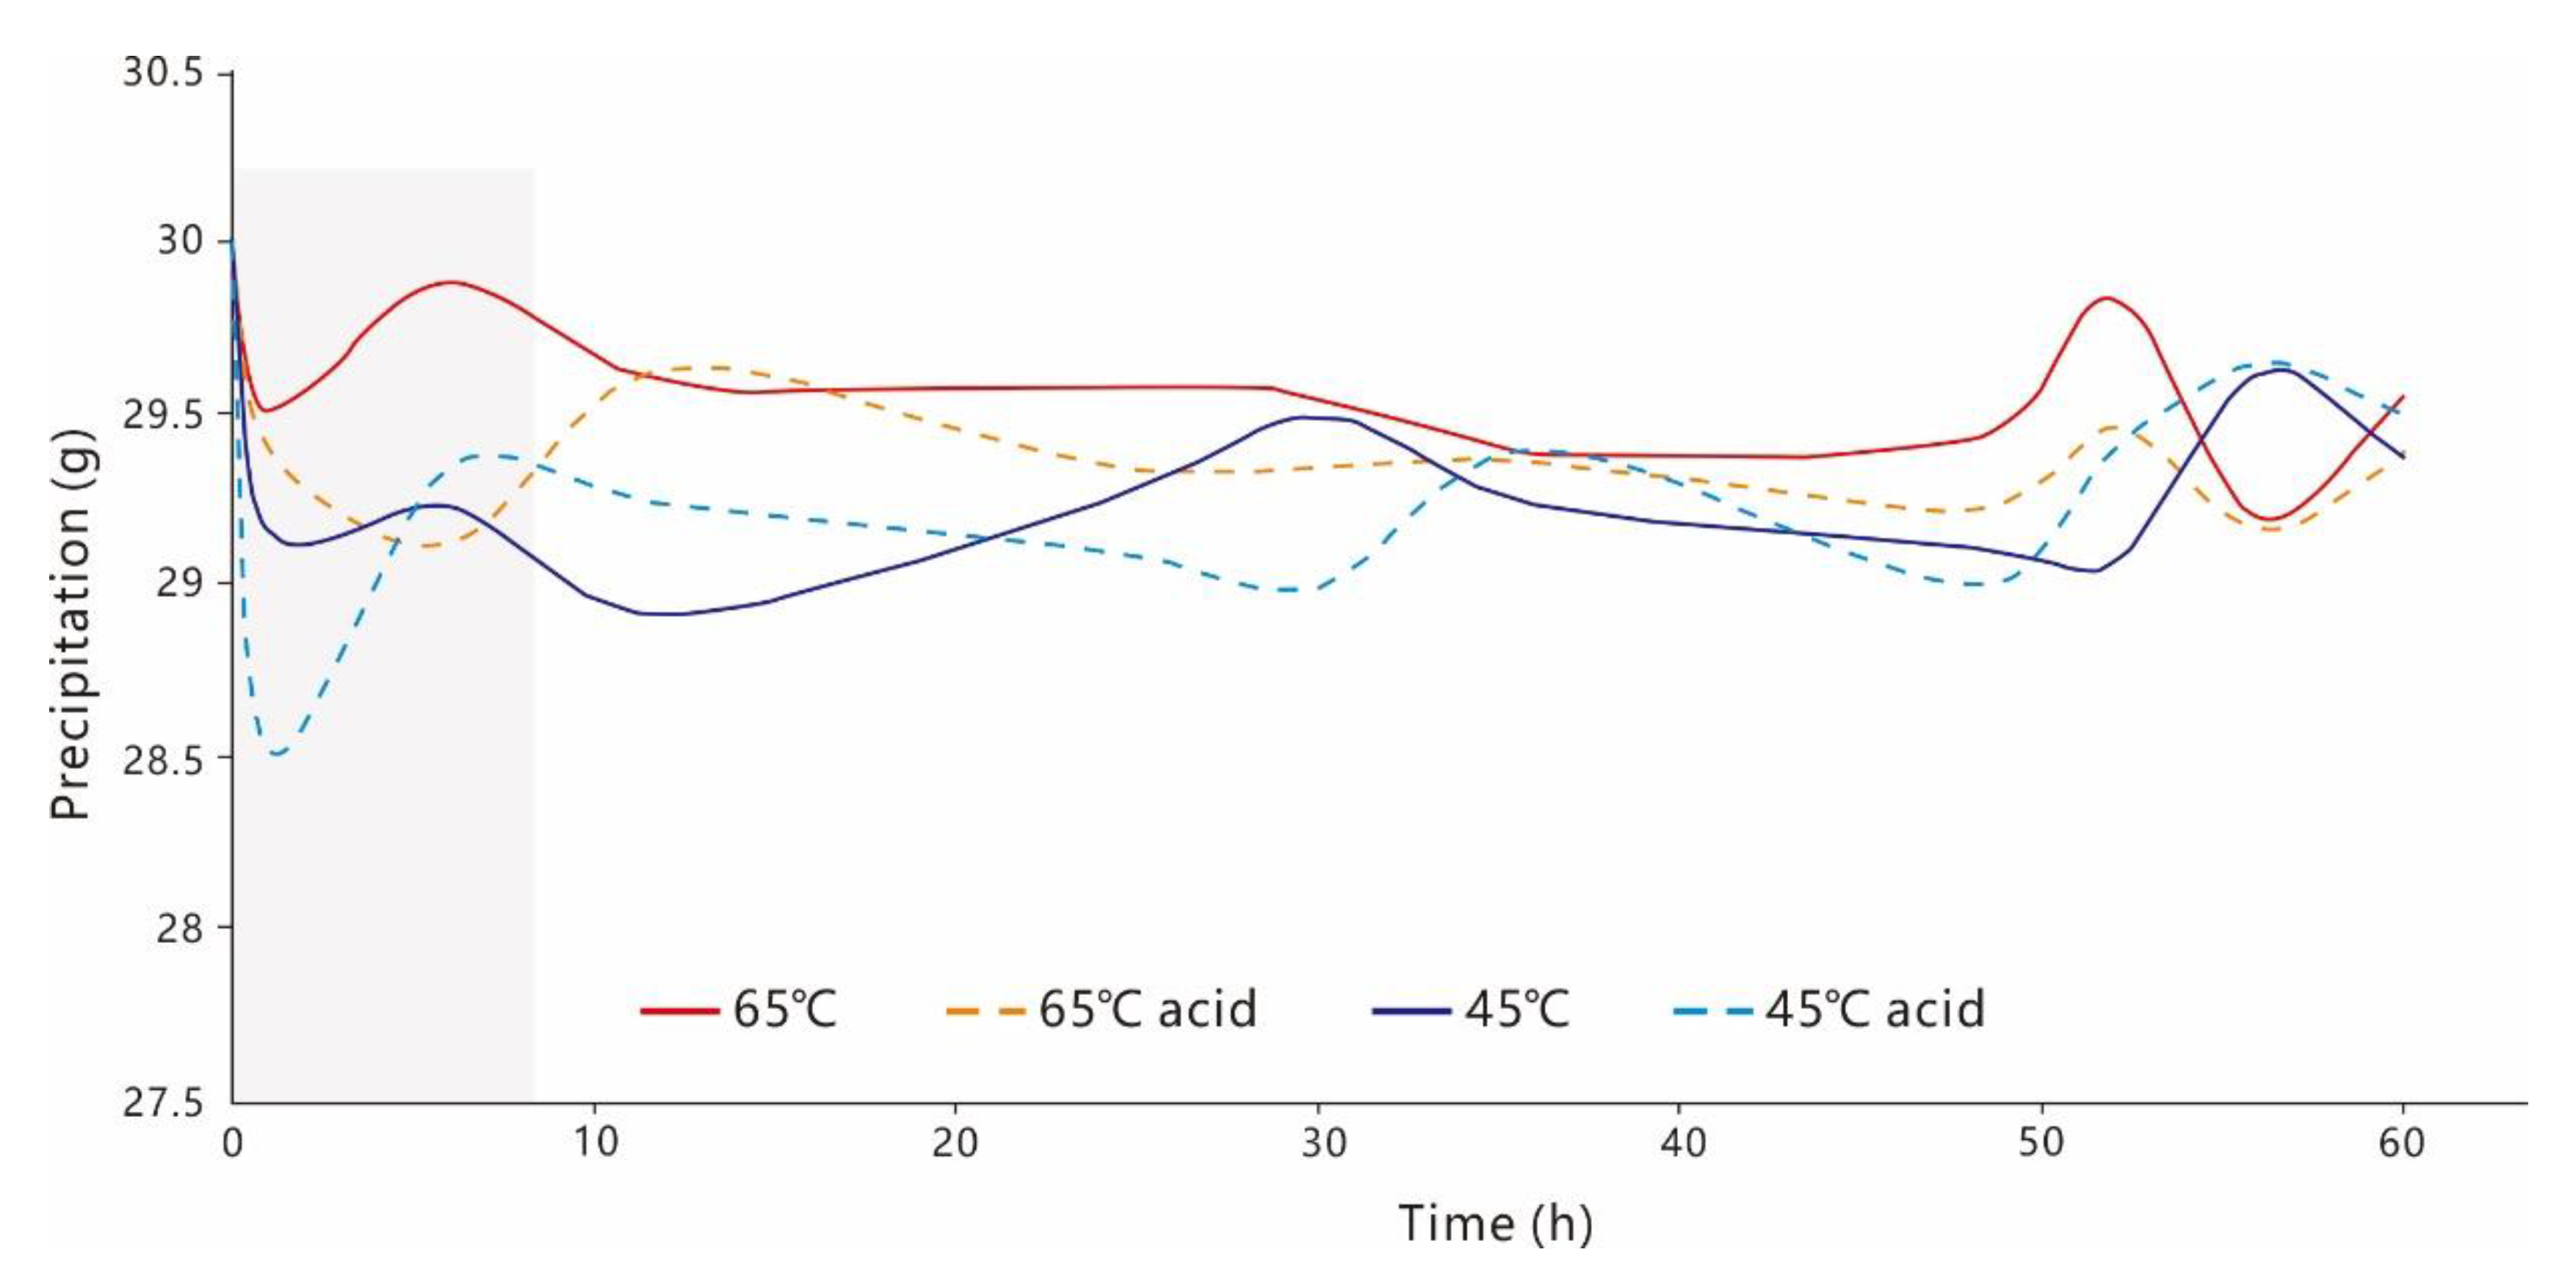
5.2. Characteristics of Precipitation Amount over Time

Minerals are able to dissolve and precipitate in the short experimental times [21,25,26]. The experimental results show that the water–rock interaction under different temperature conditions has different dissolution and precipitation effects (Figure 6), and the residual precipitation under temperature conditions higher than the reservoir temperature is greater than that under temperature conditions lower than the reservoir temperature. A significant decrease in the quality under different temperature conditions at the beginning of the experiments was noted, and the remaining quality under different temperature conditions tended to increase with time.
The acid-adding geothermal water had a more obvious initial dissolution effect, which effectively reduced the precipitation (Figure 6). The dissolution effect was similar after adding acid under different temperature conditions; however, the remaining quality under different temperature conditions tended to increase with time, and the amount of precipitation by the end of the experiments was basically the same among the acid and normal groups.

5.3. The Temperature Effect on Water–Rock Interaction

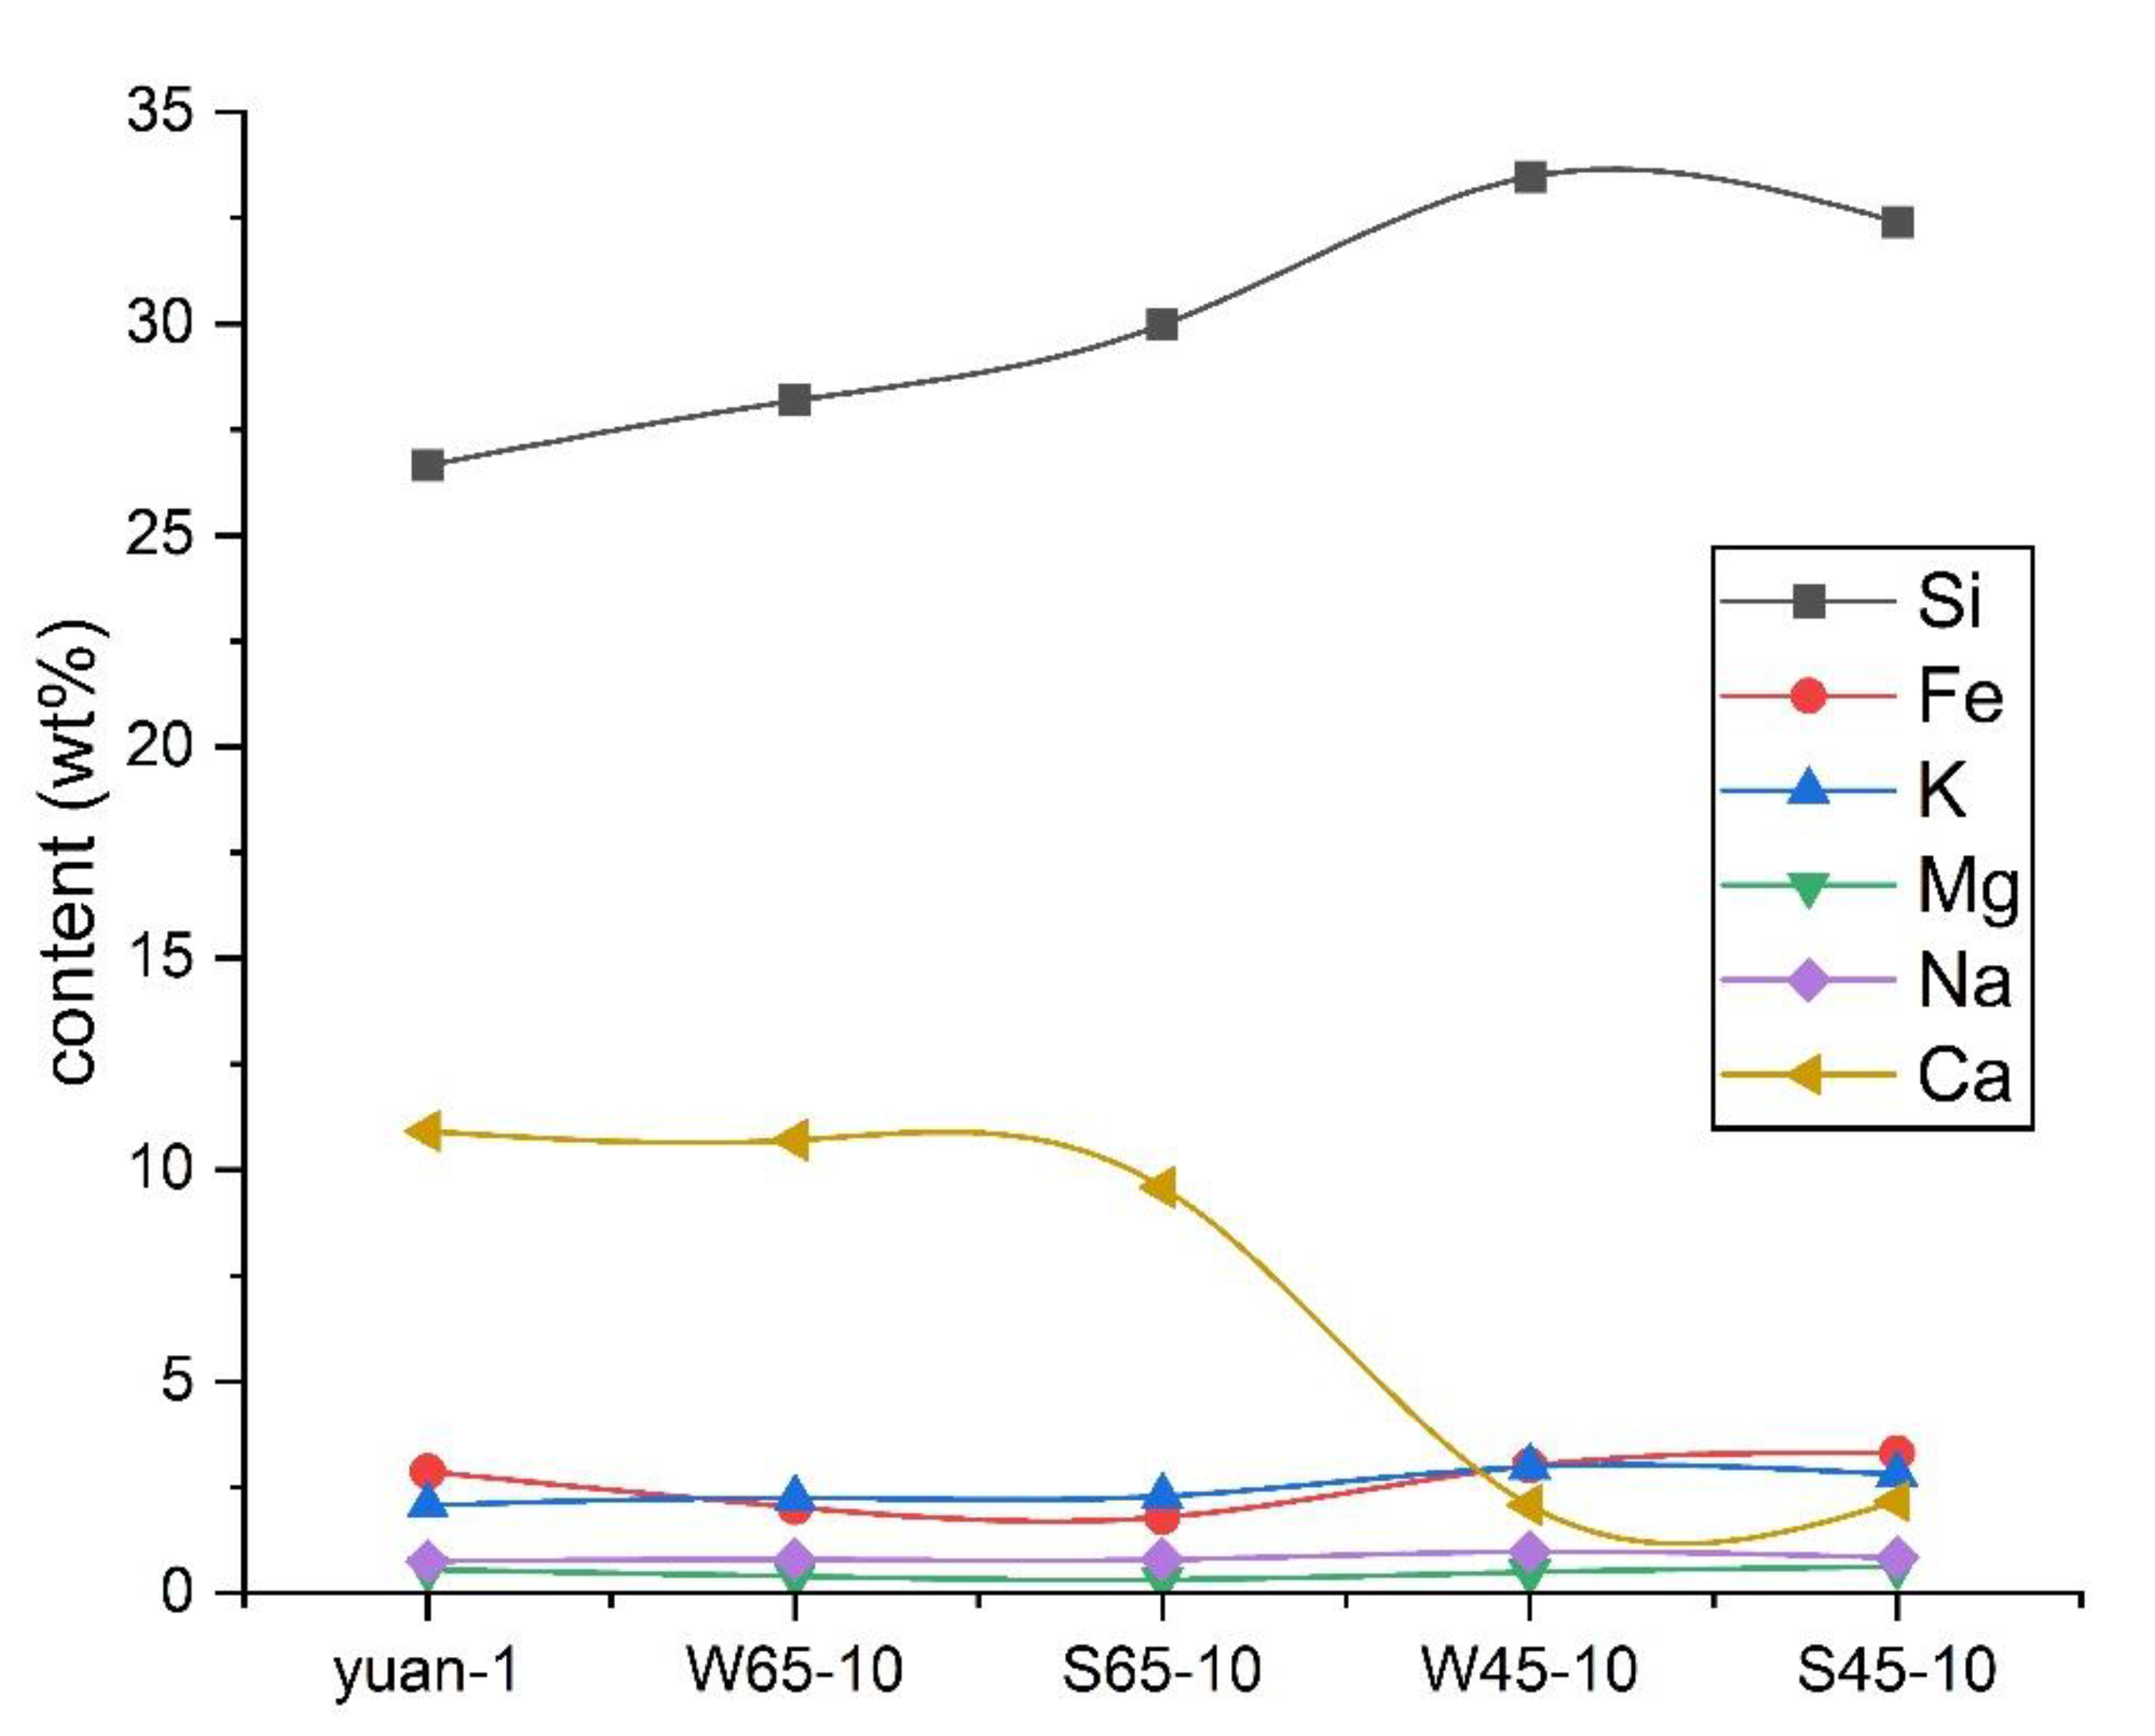
5.3.1. Variation of Composition Content under Different Temperature Conditions

The changes in the composition of geothermal water and rock under different temperature conditions during the water–rock interaction can reflect the migration pattern of the materials (Figure 7). The contents of Mg, Fe, and Ca in the water at 45 °C were generally higher than those at 65 °C, revealing that more elements dissolved from the rock into the water. This situation is consistent with the change in precipitation amount, where precipitation at 45 °C is less than that at 65 °C.
The migration of the elemental composition of the rock shows that there are significant differences in the Si, Ca, and Fe contents at different temperatures (Figure 8). Among them, Ca was reduced from 10.91 wt% to 2.8–2.98 wt% at 45 °C, with a reduction of more than 70%, but only slightly reduced to 9.59–10.71 wt% at 65 °C, with a reduction of about 12%. Si also showed a significantly higher content at 45 °C than at 65 °C, while Fe significantly increased from 2.87 to 3.01–3.31 wt% at 45 °C, but slightly decreased to 1.79–2.03 wt% at 65 °C. Overall, the results show that temperature is controlled by elemental migration.

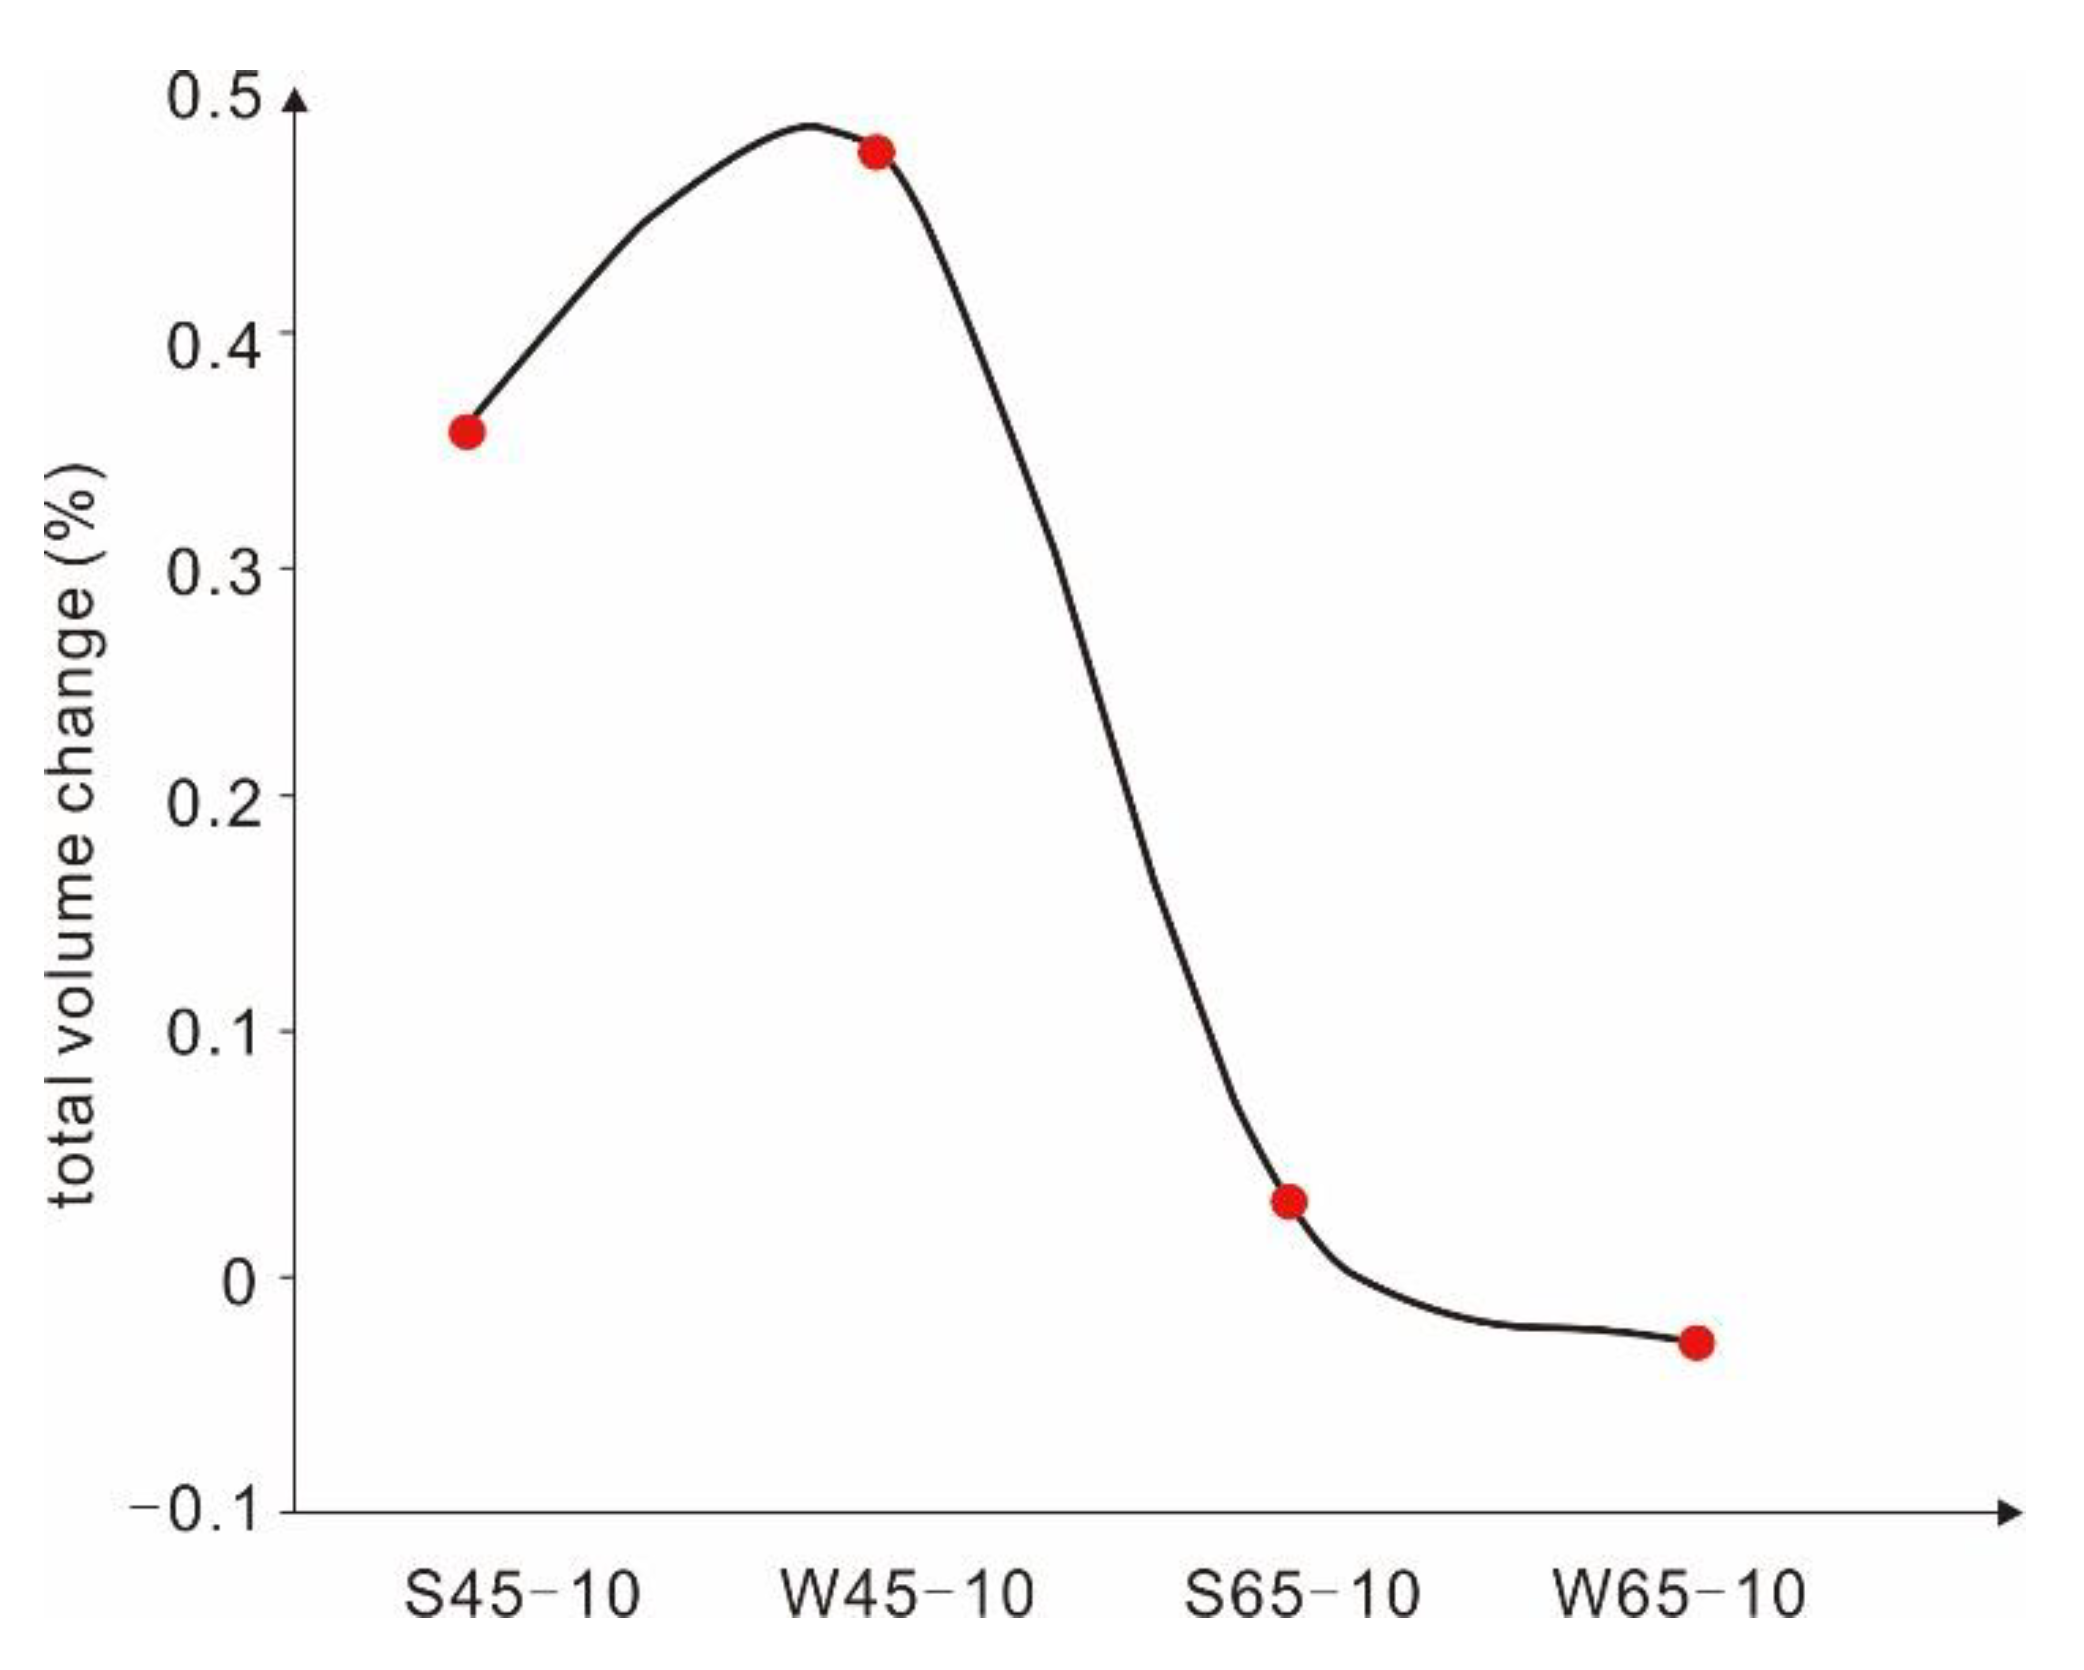
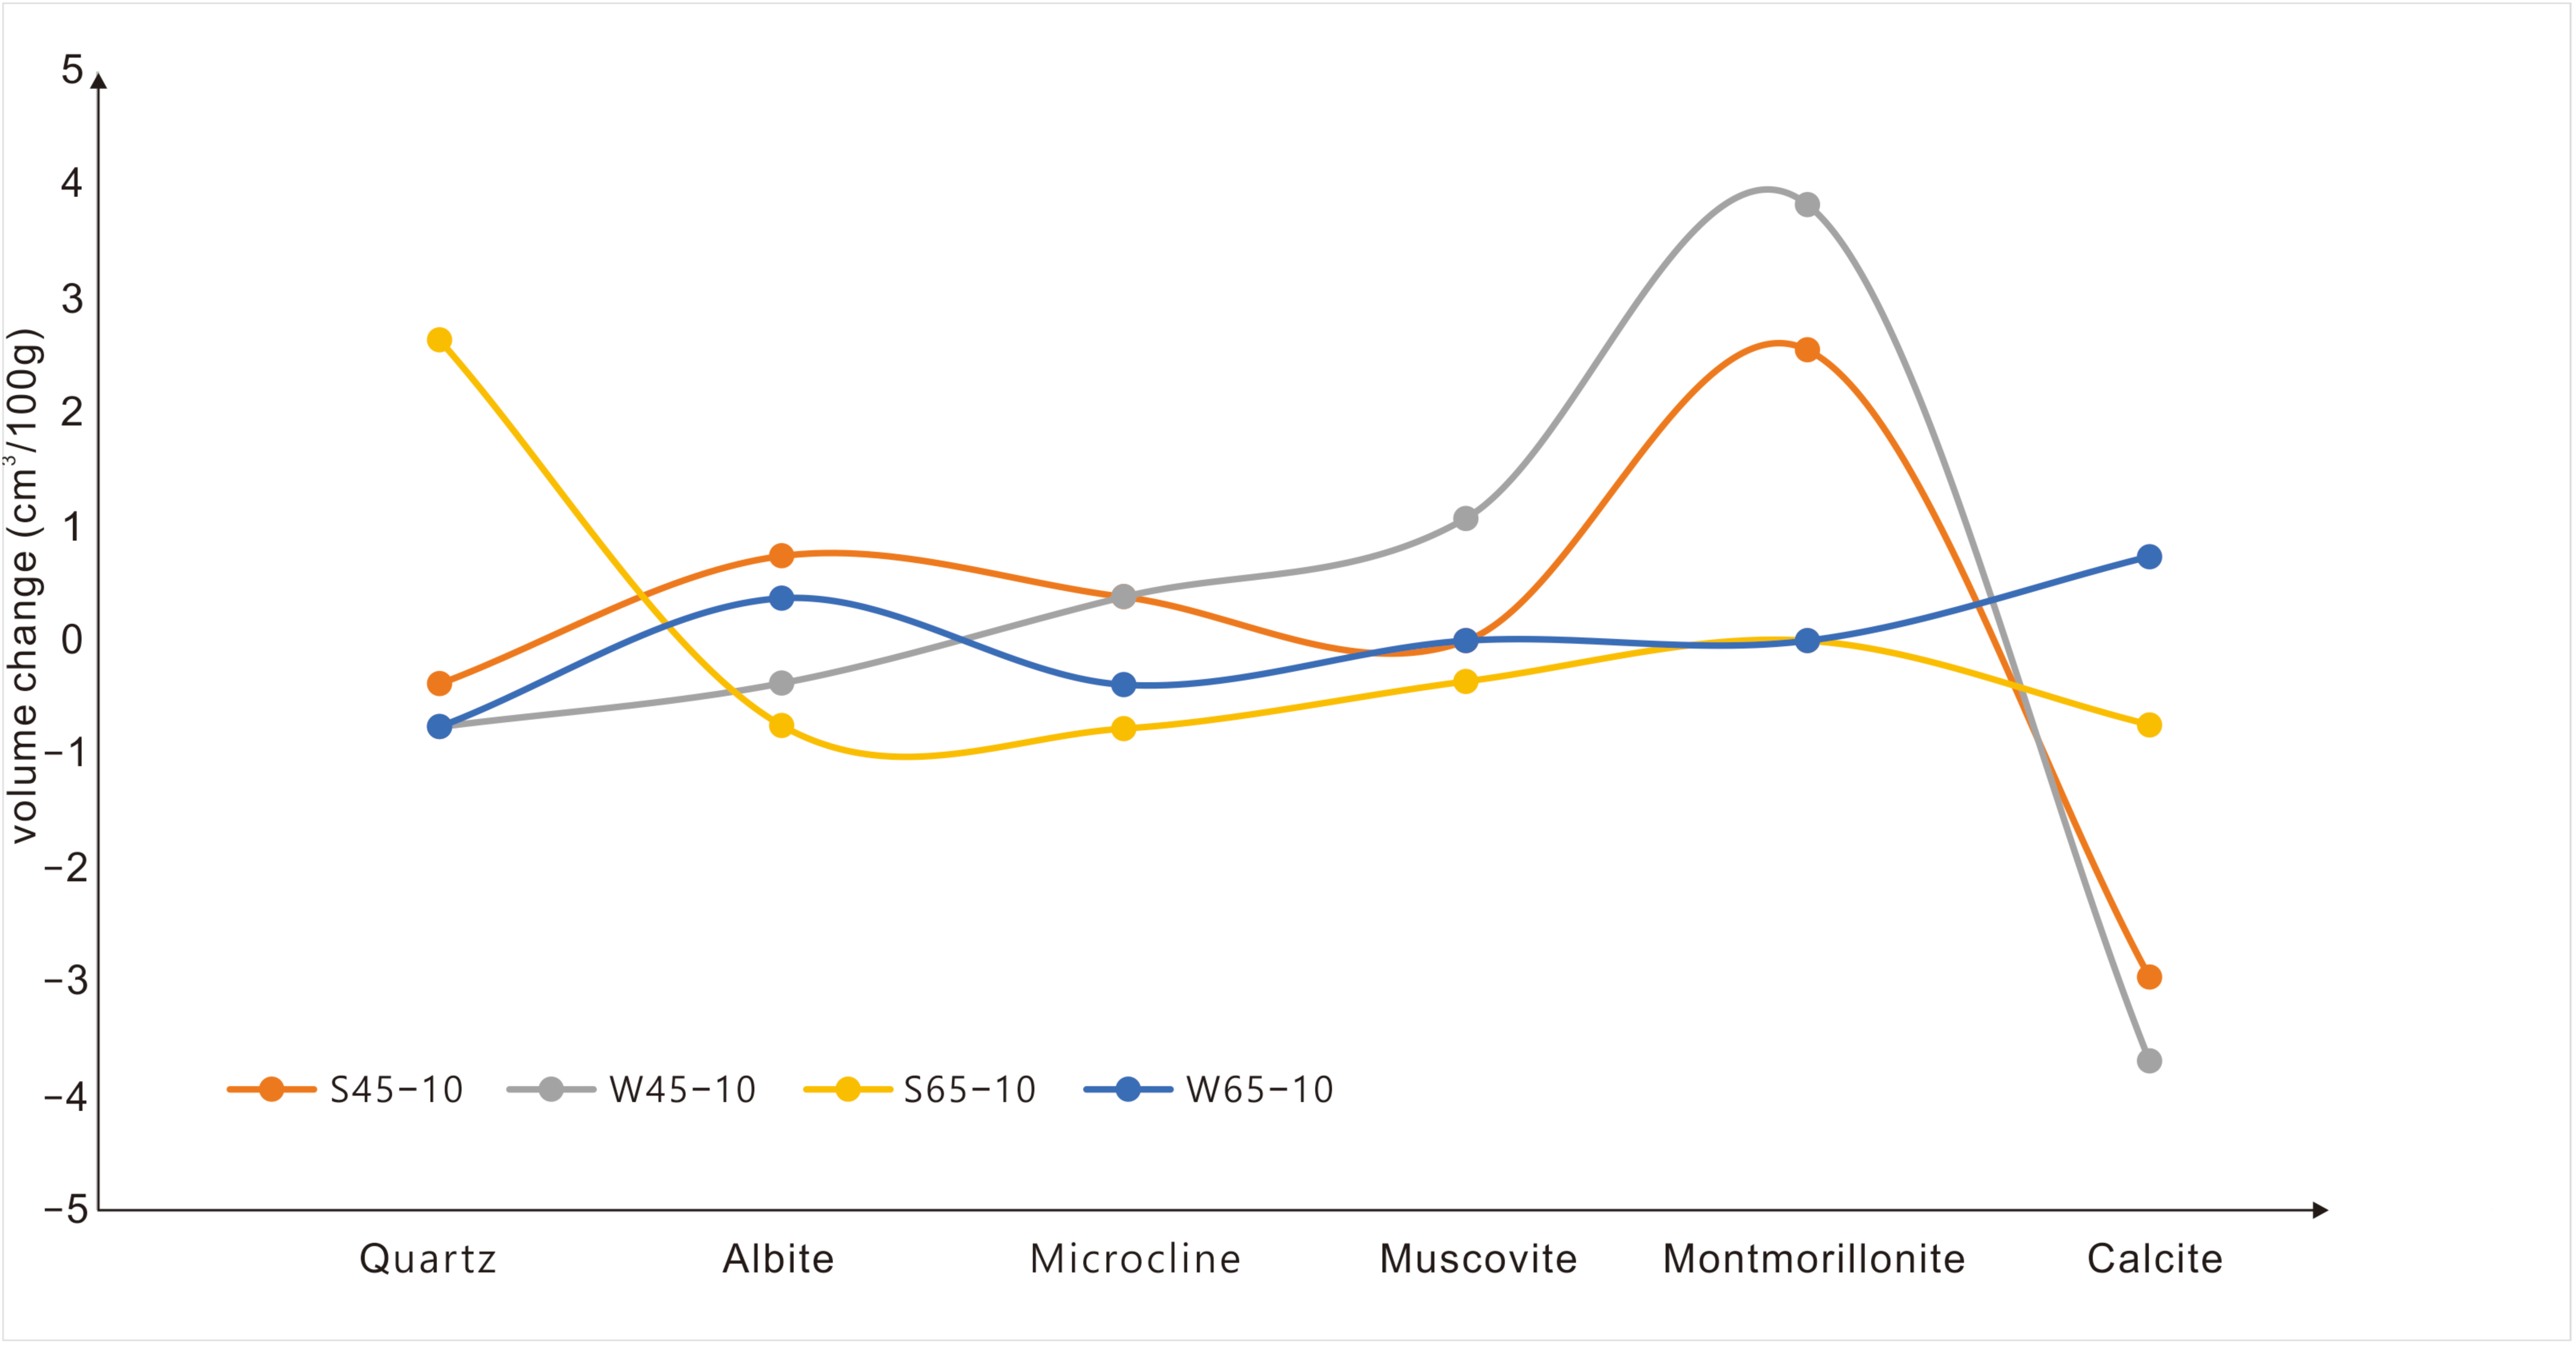
5.3.2. Characteristics of Mineral Composition and Mineral Volume Changes at Different Temperatures

The mineral compositions at 45 °C and 65 °C showed obvious differences (Figure 4). This is demonstrated by the fact that montmorillonite minerals were newly formed, and calcite was almost completely dissolved at 45 °C, regardless of whether acid was added, whereas at 65 °C, not only was montmorillonite not formed, calcite was also not completely dissolved. The role of temperature control was also evidenced by the differences in the response to acid addition under different temperature conditions. At 45 °C, the effect of adding acid is to increase the dissolution of quartz, albite, and calcite, and reduce the precipitation of muscovite and montmorillonite (Figure 4). At 65 °C, the effect of adding acid was to increase the dissolution of calcite and increase the precipitation of quartz. Decreasing the temperature from 65 °C to 45 °C, the precipitation of muscovite and montmorillonite both showed an increasing trend, while calcite showed a decreasing trend.
The variation in total mineral volume under different temperature conditions also varied significantly. Mineral volume increase reached 0.355–0.474% at 45 °C, but only reached −0.031–0.029% at 65 °C, showing that the mineral volume increase is more obvious at lower temperatures (Figure 9, Table S1 in the Supplementary Materials). The increase in total mineral volume also implies a decrease in rock porosity [27]. Based on the different mineral characteristics, varying temperature conditions controlled the volume changes of albite, muscovite, montmorillonite, and calcite. Albite, muscovite, and montmorillonite exhibited a more pronounced mineral volume increase at 45 °C, while calcite showed a remarkable volume decrease (Figure 10). In contrast, the volume changes in quartz and plagioclase were not significantly affected by temperature conditions.

5.4. Effect of Acid on Water–Rock Interaction

The test results showed that the acid has a more significant effect on the dissolution of minerals, accelerating the migration of some elements between water and rock. Moreover, it causes a reversal of the migration pattern of the elements in geothermal water under temperature change conditions (Figure 7).
Without adding acid and decreasing the temperatures from 65 °C to 45 °C, the contents of HCO3 and Ca in geothermal water showed an increasing trend (Figure 7), indicating that calcite dissolved into water, which may be related to the increase in calcite solubility with decreasing temperature. Na and Cl also showed an increasing trend, and correspondingly, the total dissolved solids (TDS) value also showed an increase. With acid addition, the contents of HCO3, Ca, Na, Cl, and TDS in the geothermal water decreased when the temperature decreased from 65 °C to 45 °C, whereas the contents of H4SiO4, H2SiO3, SO4, Mg, and Fe increased, contrary to the condition without the acid addition (Figure 7). In combination with the mineral composition, the dissolution of calcite and albite/microcline of the acid group and the content of Si and Mg in the water increased significantly, probably because the acid accelerated the dissolution of calcite and albite/microcline.
Compared with geothermal water, the elemental content of the rock in the acid group did not show obvious differences from that in the normal group. For the significant increase in Si and Mg content in water, ground rock specimens did not show a major decrease (Figure 5), which may be due to the obvious decrease in Ca, thus concealing the decrease in Si and Mg content. Furthermore, it can be noted that the effect of acid on the water–rock interaction is weaker than that of temperature. For example, the difference between the content of Ca in rocks at the same temperature is less than 1 wt% for the acid group and the normal group (Table 4), but the difference between the content at 45 °C and 65 °C can be more than 7 wt%.

5.5. Implications for Sandstone Reinjection Blockage Reduction

Each geothermal field has a unique geological setting and reservoir characteristic [28,29,30]. It might be complicated to determine the “optimal” water reinjection [31,32], but the study of the effect of temperature and acidification on the water–rock interaction can provide a reference for reinjection of the sandstone geothermal reservoir. In terms of chemical blockage, the effect of reinjection water, with a temperature close to the reservoir temperature, on the geothermal reservoir was affected by temperature, and the effect of water acidification was relatively weak. Previous studies on sandstone geothermal reservoir reinjection concluded that relatively low-temperature water reinjection is theoretically better than high-temperature water reinjection [6,31,33]. The total amount of precipitation increases with increasing temperature [34,35]. According to this study, precipitation above the reservoir temperature was the largest, but with the least change in total mineral volume. The residual precipitation quality at 45 °C was relatively small, but the increase in total mineral volume was larger than that at 65 °C, indicating that the increase in total mineral volume at 45 °C may be due to precipitation deposition filling and blocking part of the pores. Although the quality of precipitation increases at 65 °C, the change in total mineral volume is smaller, and the effect of blockage is probably more limited. Acid stimulation is often used to improve the injectivity of geothermal wells (e.g., [5,31,36]). In this study, the addition of acid at the same temperature caused an increase in total mineral volume. Therefore, to reduce chemical blockage in sandstone reinjection, it is preferable to reinject low-temperature geothermal water without adding acid; however, chemicals or inhibitors can be added to reduce montmorillonite precipitation.

6. Conclusions

We conducted laboratory experiments on the water–rock interaction of reinjected geothermal water in sandstone ground rock specimens at 65 °C and 45 °C in normal and acid groups and obtained the following main conclusions.
The water–rock interaction between sandstone and the reinjection of geothermal water has a relatively large effect on quartz and calcite dissolution and precipitation and a relatively small effect on muscovite, albite, and microcline. The dissolution and precipitation processes of calcite are controlled mainly by two factors: acid dissolution and solubility-related precipitation. Montmorillonite is the principal mineral type generated by the water–rock interaction.
Both temperature and acidification have significant effects on the water–rock interactions. The effect of temperature is demonstrated by its influence on the solubility of minerals, as evidenced by the fact that more Na, Cl, Ca, and HCO3 are dissolved in water at low temperatures (45 °C). The effect of acidification is demonstrated by the increased dissolution of calcite and albite/microcline and the inversion of the migration pattern of elements in the reinjection water under temperature changes.
Reinjection under high temperature (65 °C) conditions generates relatively high precipitation of calcite, but relatively little change in total mineral volume. The reinjection under low temperature (45 °C) conditions substantially reduced calcite precipitation, but the total mineral volume change was relatively large, mainly due to the generation of montmorillonite. Adding acid at the same temperature causes an increase in the total volume of minerals; therefore, to reduce chemical blockage in sandstone reinjection, it is preferable to reinject low-temperature fluids without any acid addition.
Finally, it is worth mentioning that the present studies have been carried out on ground sandstone samples in the laboratory. It is believed that the inferences drawn extend to the real-life situation in a sandstone geothermal reservoir.

Supplementary Materials

The following supporting information can be downloaded at: https://www.mdpi.com/article/10.3390/w14192955/s1. Table S1: Total and individual mineral volume change under different temperature conditions.

Author Contributions

Conceptualization, H.G. and Z.L. (Zhiming Liu); methodology, X.W.; software, Y.Z.; validation, Y.L. and G.Z.; investigation, J.Z. and Z.L (Zhitao Liu). All authors have read and agreed to the published version of the manuscript.

Funding

This research was funded by the National Key Research and Development Program of China (2019YFB1504203), the Natural Science Foundation of Hebei Province of China (D2022403018), and the Projects of the China Geological Survey (DD20221676).

Data Availability Statement

Not applicable.

Acknowledgments

This study was supported by the National Key Research and Development Program of China (2019YFB1504203), the Natural Science Foundation of Hebei Province of China (D2022403018), and the Projects of the China Geological Survey (DD20221676). We are grateful for the comments from editor and anonymous reviewers, which helped improved this manuscript.

Conflicts of Interest

The authors declare no conflict of interest.

References

  1. Stefansson, V. Geothermal reinjection experience. Geothermics 1997, 26, 99–139. [Google Scholar] [CrossRef]
  2. Rybach, L. Geothermal energy: Sustainability. Geothermics 2003, 32, 463–470. [Google Scholar] [CrossRef]
  3. Kaya, E.; Zarrouk, S.J.; O’Sullivan, M.J. Reinjection in geothermal fields: A review of worldwide experience. Renew. Sustain. Energy Rev. 2011, 15, 47–68. [Google Scholar] [CrossRef]
  4. Deng, J.; Lin, W.; Xing, L.; Chen, L. The estimation of geothermal reservoir temperature based on integrated multicomponent geothermometry: A case study in the Jizhong depression, North China Plain. Water 2022, 14, 2489. [Google Scholar] [CrossRef]
  5. Serpen, U.; Aksoy, N.; Ongür, T. Reinjection update of salavatli geothermal Field in Turkey. In Proceedings of the World Geothermal Congress, Melbourne, Australia, 19–25 April 2015. [Google Scholar]
  6. Kamila, Z.; Kaya, E.; Zarrouk, S.J. Reinjection in geothermal fields: An updated worldwide review 2020. Geothermics 2021, 89, 101970. [Google Scholar] [CrossRef]
  7. Bi, E.P. Geochemical modelling of the mixing of geothermal water and reinjection water: A case study of Laugaland low-temperature geothermal field in Iceland. Earth Sci. J. China Univ. Geosci. 1998, 23, 631–634, (In Chinese with English Abstract). [Google Scholar]
  8. Chen, J.; Xu, T.; Jiang, Z.; Feng, B.; Liang, X. Reducing formation damage by artificially controlling the fluid-rock chemical interaction in a double-well geothermal heat production system. Renew. Energy 2020, 149, 455–467. [Google Scholar] [CrossRef]
  9. Gao, B.Z.; Zeng, M.X. Causes and prevention measures of clogging in the reinjection well of a geothermal double-well system. Hydrogeol. Eng. Geol. 2007, 34, 75–80, (In Chinese with English Abstract). [Google Scholar]
  10. Lin, L.; Wang, L.C.; Zhao, S.M.; Wang, Y.P.; Hu, Y. A discussion of the factors affecting geothermal reinjection in the geothermal reservoir of porous type in Tianjin. Hydrogeol. Eng. Geol. 2008, 35, 125–128, (In Chinese with English Abstract). [Google Scholar]
  11. Liu, X.L.; Zhu, J.L. A study of clogging in geothermal reinjection wells in the Neogene sandstone aquifer. Hydrogeol. Eng. Geol. 2009, 5, 138–141, (In Chinese with English Abstract). [Google Scholar]
  12. Bouwer, H. Artificial recharge of groundwater: Hydrogeology and engineering. Hydrogeol. J. 2002, 10, 121–142. [Google Scholar] [CrossRef]
  13. Oddo, J.E.; Tomson, M.B. Simplified Calculation of CACO3 Saturation at High Temperatures and Pressures in Brine Solutions. J. Pet. Technol. 1982, 34, 1583–1590. [Google Scholar] [CrossRef]
  14. Xu, T.; Pruess, K. Numerical Simulation of Infectivity Effects of Mineral Scaling and Clay Swelling in a Fractured Geothermal Reservoir; Report LBNL-55113; Lawrence Berkeley National Lab: Berkeley, CA, USA, 2004.
  15. Xu, G.F.; Ma, Z.Y.; Zhou, X.; Xi, L.P.; Sun, C.X. Study on the mechanism of chemical clog for the recharging of geopressured themmal water—taking the recharging well No.1 in Xianyang as the example. Geotechical Investig. Sruveying 2013, 6, 40–49, (In Chinese with English Abstract). [Google Scholar]
  16. Li, Y.M.; Pang, Z.H.; Yang, F.T. CO2-EATER Model on Guantao Formation of Beitang Sag. Sci. Technol. Rev. 2013, 31, 15–20, (In Chinese with English Abstract). [Google Scholar]
  17. Zheng, X.L.; Guo, J.Q. Studies of mixing and its application in geothermal systems. J. Xi’an Coll. Geol. 1996, 18, 53–57, (In Chinese with English Abstract). [Google Scholar]
  18. Zheng, L.; Ma, Z.Y.; Zheng, H.J.; He, D.; Li, Y. Comparison of clogging mechanism of pore-type heat storage tail water recharge in Xi’an and Xianyang. Water Resour. Prot. 2015, 31, 6, (In Chinese with English Abstract). [Google Scholar]
  19. Shandong Provincial Territorial Spatial Ecological Restoration Center. Report on the Project of Geothermal Tailwater Reinjection to Sandstone Geothermal Reservoir, Shandong Provincial Territorial Spatial Ecological Restoration Center: Huimin County, Binzhou, China, 2022; Unpublished Work(Manuscript in preparation).
  20. The National Infrastructure of Mineral, Rock and Fossil for Science and Technology. Available online: http://www.nimrf.net.cn (accessed on 14 August 2022).
  21. Orywall, P.; Drüppel, K.; Kuhn, D.; Kohl, T.; Zimmermann, M.C.; Eiche, E. Flow-through experiments on the interaction of sandstone with Ba-rich fluids at geothermal conditions. Geotherm. Energy 2017, 5, 20. [Google Scholar] [CrossRef]
  22. Yan, Z.W.; Liu, H.L.; Zhang, Z.W. Influences of temperature and PCO2 on the solubility of calcite and dolomite. Carsologica Sin. 2009, 28, 7–10. [Google Scholar]
  23. Alkhatib, M.; Qutob, M.; Alkhatib, S.E.; Eisenhauer, A. Influence of precipitation rate and temperature on the partitioning of magnesium and strontium in calcite overgrowths. Chem. Geol. 2022, 599, 120841. [Google Scholar] [CrossRef]
  24. Wigand, M.O.; Carey, J.W.; Schütt, H.; Spangenberg, E.; Erzinger, J. Geochemical effects of CO2 sequestration in sandstones under simulated in situ conditions of deep saline aquifers. Appl. Geochem. 2008, 23, 2735–2745. [Google Scholar] [CrossRef]
  25. Gunnarsson, I.; Arnόrsson, S. Amorphous silica solubility and the thermodynamic properties of H4SiO4 in the range of 0° to 350 °C at Psat. Geochim. Cosmochim. Acta 2000, 64, 2295–2307. [Google Scholar] [CrossRef]
  26. Berner, R.A. The solubility of calcite and aragonite in seawater at atmospheric pressure and 34.5% salinity. Am. J. Sci. 1976, 276, 713–730. [Google Scholar] [CrossRef]
  27. Zhang, L.; Soong, Y.; Dilmore, R.M.; Lopano, C.L. Numerical simulation of porosity and permeability evolution of Mount Simon sandstone under geological carbon sequestration conditions. Chem. Geol. 2015, 403, 1–12. [Google Scholar] [CrossRef]
  28. Yang, L.; Xu, T.; Yang, B.; Tian, H.; Lei, H. Effects of mineral composition and heterogeneity on the reservoir quality evolution with CO2 intrusion. Geochemistry 2014, 15, 605–618. [Google Scholar]
  29. Wang, G.L.; Lin, W.J. Main hydro-geothermal systems and their genetic models in China. Acta Geol. Sin. 2020, 94, 1923–1937, (In Chinese with English Abstract). [Google Scholar]
  30. Lin, W.J.; Wang, G.L.; Gan, H.N.; Zhang, S.S.; Zhao, Z.; Yue, G.F.; Long, X.T. Heat source model for Enhanced Geothermal Systems (EGS) under different geological conditions in China. Gondwana Res. 2022, in press. [CrossRef]
  31. Diaz, A.R.; Kaya, E.; Zarrouk, S.J. Reinjection in geothermal fields—A worldwide review update. Renew. Sustain. Energy Rev. 2016, 53, 105–162. [Google Scholar] [CrossRef]
  32. Chen, Z.Y. Modeling water-rock interaction of geothermal reinjection in the Tanggu low-temperature field, Tianjin. Earth Sci. J. China Univ. Geosci. 1998, 23, 513–518, (In Chinese with English Abstract). [Google Scholar]
  33. He, M.; Zhang, L.; Yuan, Y.M.; Zhang, J.Y.; Gao, Y.H. Study on the Relationship between Re-injection Volume and Temperature of Sandstone Geothermal Reservoir in Nanzhan Area of Dongying City. Shandong Land Resour. 2018, 34, 44–48, (In Chinese with English Abstract). [Google Scholar]
  34. Ma, Z.Y.; Hou, C.; Xi, L.P.; Yun, P.Q.; Yan, H.; Sun, C.X. Reinjection clogging mechanism of used geothermal water in a super-deep-porous reservoir. Hydrogeol. Eng. Geol. 2013, 40, 133–139, (In Chinese with English Abstract). [Google Scholar]
  35. Long, X.T.; Xie, H.P.; Deng, X.P.; Wen, X.Y.; Ou, J.; Ou, R.W.; Wang, J.; Liu, F. Geological and Geochemical Characteristics of the Geothermal Resources in Rucheng, China. Lithosphere 2021, 2021, 1357568. [Google Scholar] [CrossRef]
  36. Lawson, R.; Gresham, T.; Richardson, I.; Siega, F.; Addison, S.; Zealand, N. Long run polymerization experiments at the kawerau geothermal limited power plant. In Proceedings of the 38th New Zealand Geothermal Workshop, Auckland, New Zealand, 23–25 November 2016. [Google Scholar]
Figure 1. Conceptual geological map of Binzhou, China. (a) Tectonic location of the Binzhou geothermal field [20]; (b) geological map of Binzhou geothermal field. The red star donates the location of the ZR1 borehole used in this study; (c) geological section of Shimiao-Lizhuang. The location of the section can be found in (b). Abbreviations: CAOB—Central Asian Orogenic Belt; NCB—North China Block; SCB—South China Block; Fm.—Formation.
Water 14 02955 g001
Figure 2. Water and rock sample preparation. (a) Weakly consolidated sandstone core with nearly horizontal layer formation; (b) preparation of distilled water with resistivity value of 18.2 MΩ·cm; (c) preparation of 2% hydrofluoric acid; (d) sandstone cores ground and screened with a 50-mesh sieve.
Water 14 02955 g002
Figure 3. Experimental design and procedures. (a) The fume cupboard treatment of acid-added samples; (b) samples in the automatic rotary reactor system; (c) sample precipitation filtration; (d) precipitation placed in incubator for drying.
Water 14 02955 g003
Figure 4. Mineral compositions of samples at different temperature conditions.
Water 14 02955 g004
Figure 5. Major element comparison of water and rock. The change in content of Si in water is denoted as H4SiO4, and in rock, is denoted as Si.
Water 14 02955 g005
Figure 6. Residual precipitation amounts under different conditions over time. The gray square shadow represents the initial state of dissolution and precipitation under different conditions.
Water 14 02955 g006
Figure 7. Comparison of elemental composition in geothermal water under different temperature conditions.
Water 14 02955 g007
Figure 8. Comparison of major element content in ground rock specimens under different temperature conditions.
Water 14 02955 g008
Figure 9. Characteristics of total mineral volume change under different temperature conditions.
Water 14 02955 g009
Figure 10. Characteristics of volume change of individual minerals under different temperature conditions.
Water 14 02955 g010
Table 1. Water–rock interaction experimental design.
Sample IDGeothermal Water + Acid (mL)Core Rock (g)Temperature (°C)Time (h)
W65-130030651
W65-230030656
W65-3300306512
W65-4300306524
W65-5300306530
W65-6300306536
W65-7300306548
W65-8300306552
W65-9300306556
W65-10300306560
S65-1280 + 2030651
S65-2280 + 2030656
S65-3280 + 20306512
S65-4280 + 20306524
S65-5280 + 20306530
S65-6280 + 20306536
S65-7280 + 20306548
S65-8280 + 20306552
S65-9280 + 20306556
S65-10280 + 20306560
W45-130030451
W45-230030456
W45-3300304512
W45-4300304524
W45-5300304530
W45-6300304536
W45-7300304548
W45-8300304552
W45-9300304556
W45-10300304560
S45-1280 + 2030451
S45-2280 + 2030456
S45-3280 + 20304512
S45-4280 + 20304524
S45-5280 + 20304530
S45-6280 + 20304536
S45-7280 + 20304548
S45-8280 + 20304552
S45-9280 + 20304556
S45-10280 + 20304560
Table 2. Residual precipitation varies with time.
Time (h)Residual Precipitation Amount (g)
W65S65W45S45
0-30-30-30-30
1W65-129.51S65-129.4W45-129.15S45-128.52
6W65-229.88S65-229.12W45-229.22S45-229.34
12W65-329.59S65-329.63W45-328.91S45-329.23
24W65-429.57S65-429.35W45-429.24S45-429.1
30W65-529.55S65-529.34W45-529.49S45-528.99
36W65-629.38S65-629.36W45-629.23S45-629.39
48W65-729.42S65-729.22W45-729.11S45-729
52W65-829.83S65-829.45W45-829.06S45-829.4
56W65-929.19S65-929.16W45-929.62S45-929.64
60W65-1029.55S65-1029.38W45-1029.37S45-1029.49
Table 3. Contents of major elements in geothermal water before and after water–rock interaction (in mg/L, except for pH, which is in standard pH units).
Yuan-1 (Water)W65-10S65-10W45-10S45-10
pH7.737.597.157.34.3
TDS90209310937096108890
HCO31391023861270
H4SiO433.818.661.315.3197
H₂SiO₃32.918.461.115195
SO427202390192023102390
Cl42104340455045104210
Ca351382384390328
K38.854.150.750.149
Na40302920432041003930
Mg70.178.989.678.5145
Fe0.040.460.050.0520.2
Table 4. Contents of major elements in core rock before and after water–rock interaction (in wt%).
Yuan-1 (Rock)W65-10S65-10W45-10S45-10
Si26.6528.1929.9833.4732.41
Ca10.9110.719.592.082.17
K2.072.252.292.982.8
Na0.7510.7970.7910.9840.828
Mg0.5520.3980.3140.4990.627
Fe2.872.031.793.013.31
Table 5. Mineral composition in core rock before and after water–rock interaction (in %).
Yuan-1 (Rock)W65-10S65-10W45-10S45-10
Quartz0.660.640.730.640.65
Albite0.110.120.090.10.13
Microcline0.070.060.050.080.08
Muscovite0.060.060.050.090.06
Montmorillonite0000.090.06
Calcite0.10.120.0800.02
Publisher’s Note: MDPI stays neutral with regard to jurisdictional claims in published maps and institutional affiliations.

