Article

Pretreatment Hydrolysis Acidification/Two-Stage AO Combination Process to Treat High-Concentration Resin Production Wastewater

1
Ningxia Baichuan New Materials Co., Ltd., Yinchuan 751400, China
2
Ningxia Baichuan Technology Co., Ltd., Yinchuan 751400, China
3
Nanjing Water Purification Environmental Research Institute Co., Ltd., Nanjing 211100, China
4
College of Urban Construction, Nanjing Tech University, Nanjing 211816, China
*
Author to whom correspondence should be addressed.
Water 2022, 14(19), 2949; https://doi.org/10.3390/w14192949
Submission received: 9 July 2022 / Revised: 14 September 2022 / Accepted: 15 September 2022 / Published: 20 September 2022
(This article belongs to the Special Issue Water-Sludge-Nexus)

Abstract

:
The rapid development of the resin industry has led to a large amount of high-concentration resin production wastewater, which has created serious water pollution problems while limiting the development of related enterprises. In this study, a combined pretreatment hydrolysis acidification/two-stage anaerobic oxic (AO) process for high-concentration resin production wastewater was constructed, and the effect of operation time on the treatment efficiency of the hydrolysis acidification and the two-stage AO unit was investigated using chemical oxygen demand (COD), total nitrogen (TN), and NH3-H (ammonia nitrogen) as indicators. The effect of operation time on the treatment efficiency of the hydrolysis acidification and the two-stage AO unit was investigated. Results showed that the pretreatment of “alkaline digestion + ozone oxidation” could effectively remove volatile phenols and phenolic organic pollutants from the wastewater. The average removal rates of COD, TN, and NH3-H (ammonia nitrogen) of resin production were 91.96%, 85.35%, and 85.67%, respectively. The average concentrations of final biochemical effluent were 404.7, 21.4, and 11.4 mg/L, respectively.

1. Introduction

In the process of rapid economic development, the industrial sector has made great contributions to the national economy, but at the same time, industrial energy consumption has caused a serious crisis for the environment, with industrial wastewater being one of the main sources of water pollution [1]. Most industrial wastewater contains toxic and harmful substances that directly threaten the water environment and human health, and so industrial wastewater has been the focus of monitoring and treatment [2]. Resin wastewater is a typical high-concentration organic chemical wastewater [3]. In recent years, as a result of energy reforms and constant acceleration of the low-carbon economy, the demand has grown for composite materials, including polyester resin, having a simple production process and reactants, chemical corrosion resistance, and desirable mechanical and electric properties. These materials have been widely used in automobile, petrochemical, textile, shipbuilding, equipment manufacturing, and electronic information industries, among others [4]. The rapid development of the resin industry has resulted in the production of a large amount of high-concentration organic wastewater. Environmental problems in the production process of resin, especially the pollution of high-concentration organic wastewater, have become one of the constraints to the sustainable development of the resin industry in China [5]. In terms of conventional water quality indexes, polyester resin production wastewater has a high COD concentration and poor biodegradability [6]. This wastewater contains a large number of aromatics, phenols, epoxy alkanes, and various intermediates that are difficult to degrade. Aromatic, phenolic, and epoxy alkanes are the main biodegradation-limiting pollutants in the wastewater, and they have a strong toxicity and inhibition effect on microorganisms. Therefore, the treatment of this kind of wastewater is urgent [7].
To date, various methods have been used to study the treatment of resin wastewater at home and abroad, and a series of research results have been achieved. The main treatment methods are physical and chemical, biological, and the combination of physicochemical and biological treatments [8]. The commonly used physical and chemical treatment methods of high-concentration resin production wastewater include the condensation procedure, adsorption, extraction, micro-electrolysis, Fenton oxidation, catalytic ozonation, coagulation precipitation, and other advanced oxidation methods [9]. Among these, catalytic ozonation technology is a new type of water treatment technology aimed at enhancing the oxidation performance of ozone and improving the utilization efficiency of ozone. There are two main reaction pathways for ozone in water: one is direct oxidation of ozone; the other is free radical oxidation through the formation of hydroxyl radicals, that is, advanced oxidation. Physical and chemical treatment can effectively remove COD and some organic pollutants in polyester wastewater and improve the biodegradability of the wastewater [10]. However, physical and chemical methods generally have problems such as high energy consumption and operation cost and difficulty in achieving a standard treatment, and they can easily cause secondary pollution [11]. Biological treatment methods can be divided into anaerobic biological treatment, aerobic biological treatment, and the combined anaerobic/aerobic treatment process [12]. The method of biological treatment of organic sewage using aerobic fungi in the presence of oxygen is called biological integration treatment. Biological oxidation treatment includes the activated sludge method, trickling filter method, aeration method, and intermittent sand filtration method. The first stage of biological oxidation is the decomposition of carbides into carbon dioxide and water, and the formation of nitrogen into hydrogen. At the same time, flocs are produced due to the action of microorganisms. The second stage is the oxidation of ammonia and some or even all of the flocs to nitrates and carbonates. Biological treatment can be used to efficiently treat wastewater from resin production [13]. However, the wastewater from high-concentration resin production contains a large number of phenolic toxic organic compounds and oil esters, which lead to problems of poor anti-impact ability and unstable operation of the traditional biological treatment process in practical engineering application [14]. In addition, resin wastewater contains a large number of toxic substances that have a great inhibitory effect on microbial life [15]. It is also difficult to use biological treatment directly, making it necessary to carry out some physical and chemical treatment before biological treatment [16].
The treatment of resin production wastewater by a single physical or biological treatment method often has problems. Therefore, based on the research of physical and biological treatment methods, the mainstream trend of resin wastewater treatment technology research has been to develop a combined treatment process by organically combining the advantages of both methods [17]. Compared with the single treatment method, the physicochemical–biochemical combination treatment method has more obvious advantages. Early physical and chemical treatment can remove part of the organic matter in polyester resin wastewater, reduce the COD of the wastewater, reduce the organic load of the subsequent biochemical treatment unit, improve the biodegradability of the wastewater, and ensure the stable operation of the subsequent biochemical unit [18]. Ozone, as a chemical oxidation technology, is often used for pretreatment prior to biological treatment [19]. Ozone oxidation technology treats the highly difficult components in organic wastewater, improves the biodegradability of the wastewater, and ensures the wastewater reaches the level of biochemical treatment [20]. Resin production wastewater has a high concentration, and the use of anaerobic or aerobic technology alone cannot achieve a high-efficiency treatment effect. Thus, the combination of anaerobic and aerobic technology has become the preferred method.
In this study, the resin production wastewater of an enterprise in Henan was taken as the research object, and the high-concentration resin production wastewater was treated by the combined physicochemical–biochemical process. In the early stage, “alkali hydrolysis + ozone oxidation” advanced oxidation technology was used to treat the resin production wastewater, which effectively reduced the content of volatile phenol formaldehyde and other organic pollutants in the resin wastewater. The suitable alkaline hydrolysis agent was selected by comparing the removal effects of NaOH and Ca(OH)2 alkaline hydrolysis reagents on COD, volatile phenol, and formaldehyde in phenolic resin wastewater. In the later stage, the “hydrolysis acidification/two-stage AO” biochemical treatment process was constructed to investigate the removal effect of COD, TN, and NH3-N in resin production wastewater through the hydrolysis acidification/two-stage AO biochemical process. Gas chromatography/mass spectrometry (GC/MS) was used to reveal the biodegradation and transformation behavior of organic pollutants in the resin production wastewater by this biochemical process. The goal was to develop a treatment process for highly concentrated hard-to-degrade resin wastewater that is efficient, stable, and economical.

2. Materials and Methods

2.1. Experimental Materials

Potassium bromide, potassium bromate, concentrated hydrochloric acid, soluble starch, sodium hydroxide, hydroxylamine hydrochloride, potassium dichromate, ferrous ammonium sulfate, silver sulfate, concentrated sulfuric acid, etc., were all analytically pure and purchased from Sinopharm Chemical Reagent Co. The wastewater used in the experiment was taken from the wastewater of a polyester resin production process in Henan. The wastewater has a brown, translucent, and thorny appearance, and its COD concentration is high. The main organic pollutants are volatile phenol and formaldehyde, and the pH value is 4–6. The main water quality indicators are shown in Table 1.

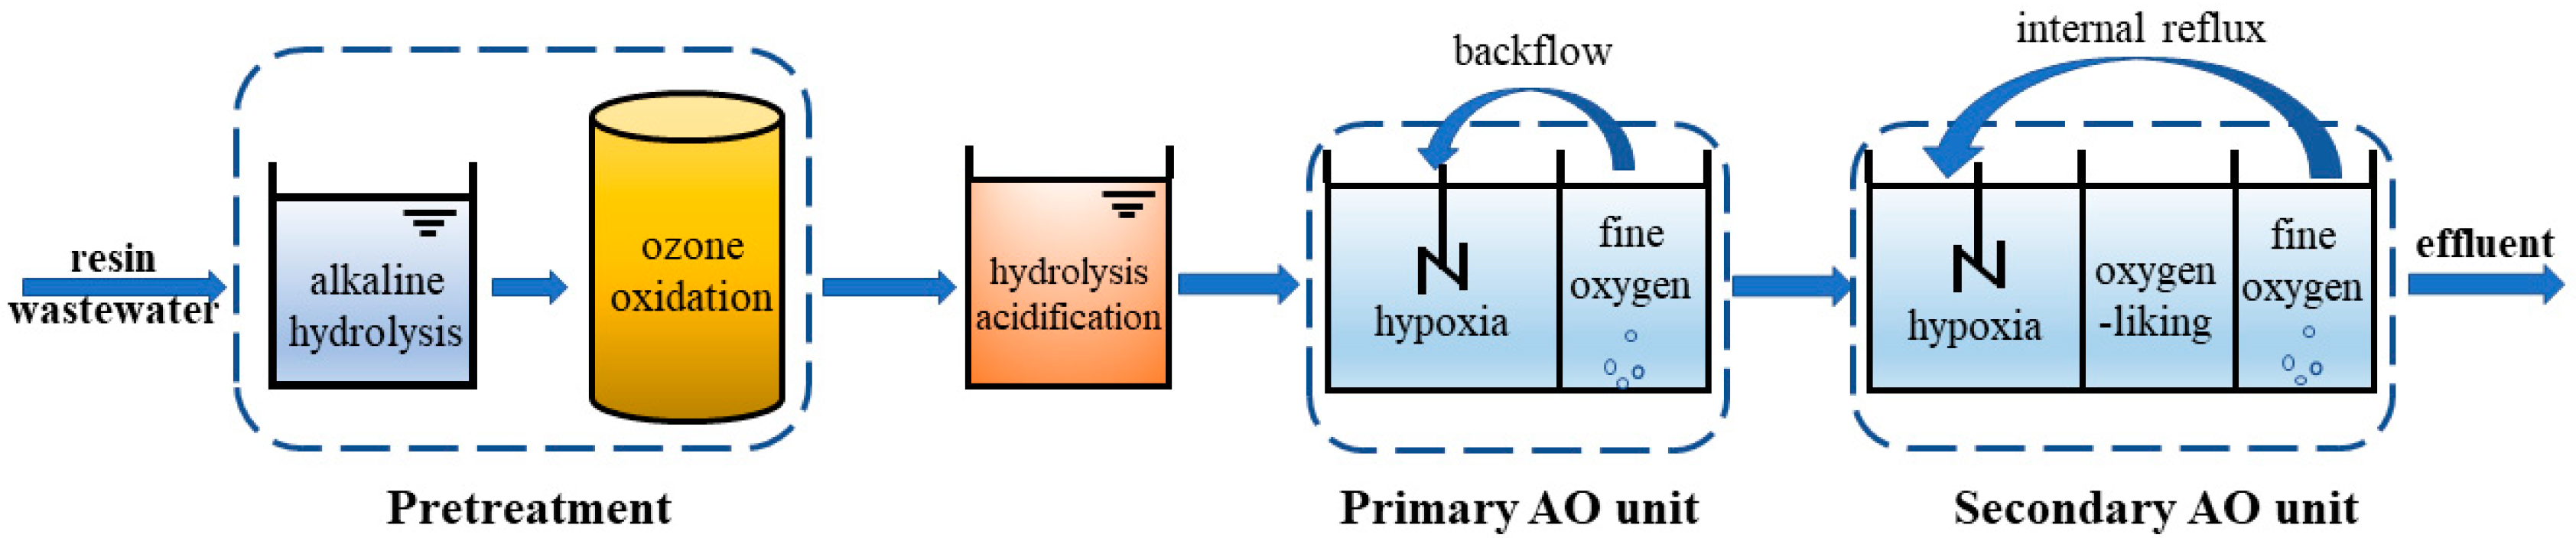
2.2. Experimental Process

In the studied process, on the basis of the research on the physicochemical and biochemical treatment methods, the advantages of the two methods are organically combined, and the combined method is used to treat the polyester resin production wastewater. In view of the water quality characteristics of resin production wastewater, a resin wastewater treatment test device was designed by combining the constructed treatment process and relevant design standards. The device is made mainly of plexiglass, and there are combined fillers in the anaerobic tank and the aerobic tank. The anaerobic tank is equipped with a stirring device, and the bottom of each aerobic tank is equipped with an aeration plate. The effective volume of the hydrolysis acidification tank is 1.2 m3, the effective volume of the two anoxic tanks (A1, A2) is 1.0 m3, the effective volume of the two aerobic tanks (O1, O2) is 0.5 m3, and the effective volume of the anaerobic tank is 0.5 m3. The physicochemical treatment unit builds the “alkali hydrolysis + ozone catalytic oxidation” pretreatment technology. First, alkali hydrolysis of resin wastewater by adding NaOH can effectively remove most of the phenolic organic pollutants in the wastewater. After alkaline hydrolysis, ozone catalytic oxidation technology is used to further remove part of the COD and volatile phenols in the wastewater, which reduces the organic load of the subsequent biochemical treatment unit. Resin wastewater contains cyanide ions. The alkaline hydrolysis method + ozone catalytic oxidation technology in this study can remove 92% of cyanide. The biochemical treatment unit adopts hydrolysis acidification, primary AO, and secondary AO processes in series to efficiently remove COD, TN, and NH3-N in wastewater and stabilize the quality of the subsequent effluent. The specific process flow is shown in Figure 1.

2.3. Water Quality Analysis

COD was measured by a Hach analyzer (COD analyzer, DR1010, Hach Company, Loveland, CO, USA). The UV/visible spectrophotometer (UV-5500PC, Shanghai Yuan Analysis Instrument Co., Ltd., Shanghai, China) was used to measure the in and out UV full band of resin wastewater. The contents of volatile phenols, formaldehyde, TN, and NH3-N, among others, were determined according to relevant national standard methods. The main organic pollutant components in wastewater were analyzed by GC/MS (GCMS-QP2010 Ultra, Shimadzu Instruments, Kyoto, Japan).

3. Results and Discussion

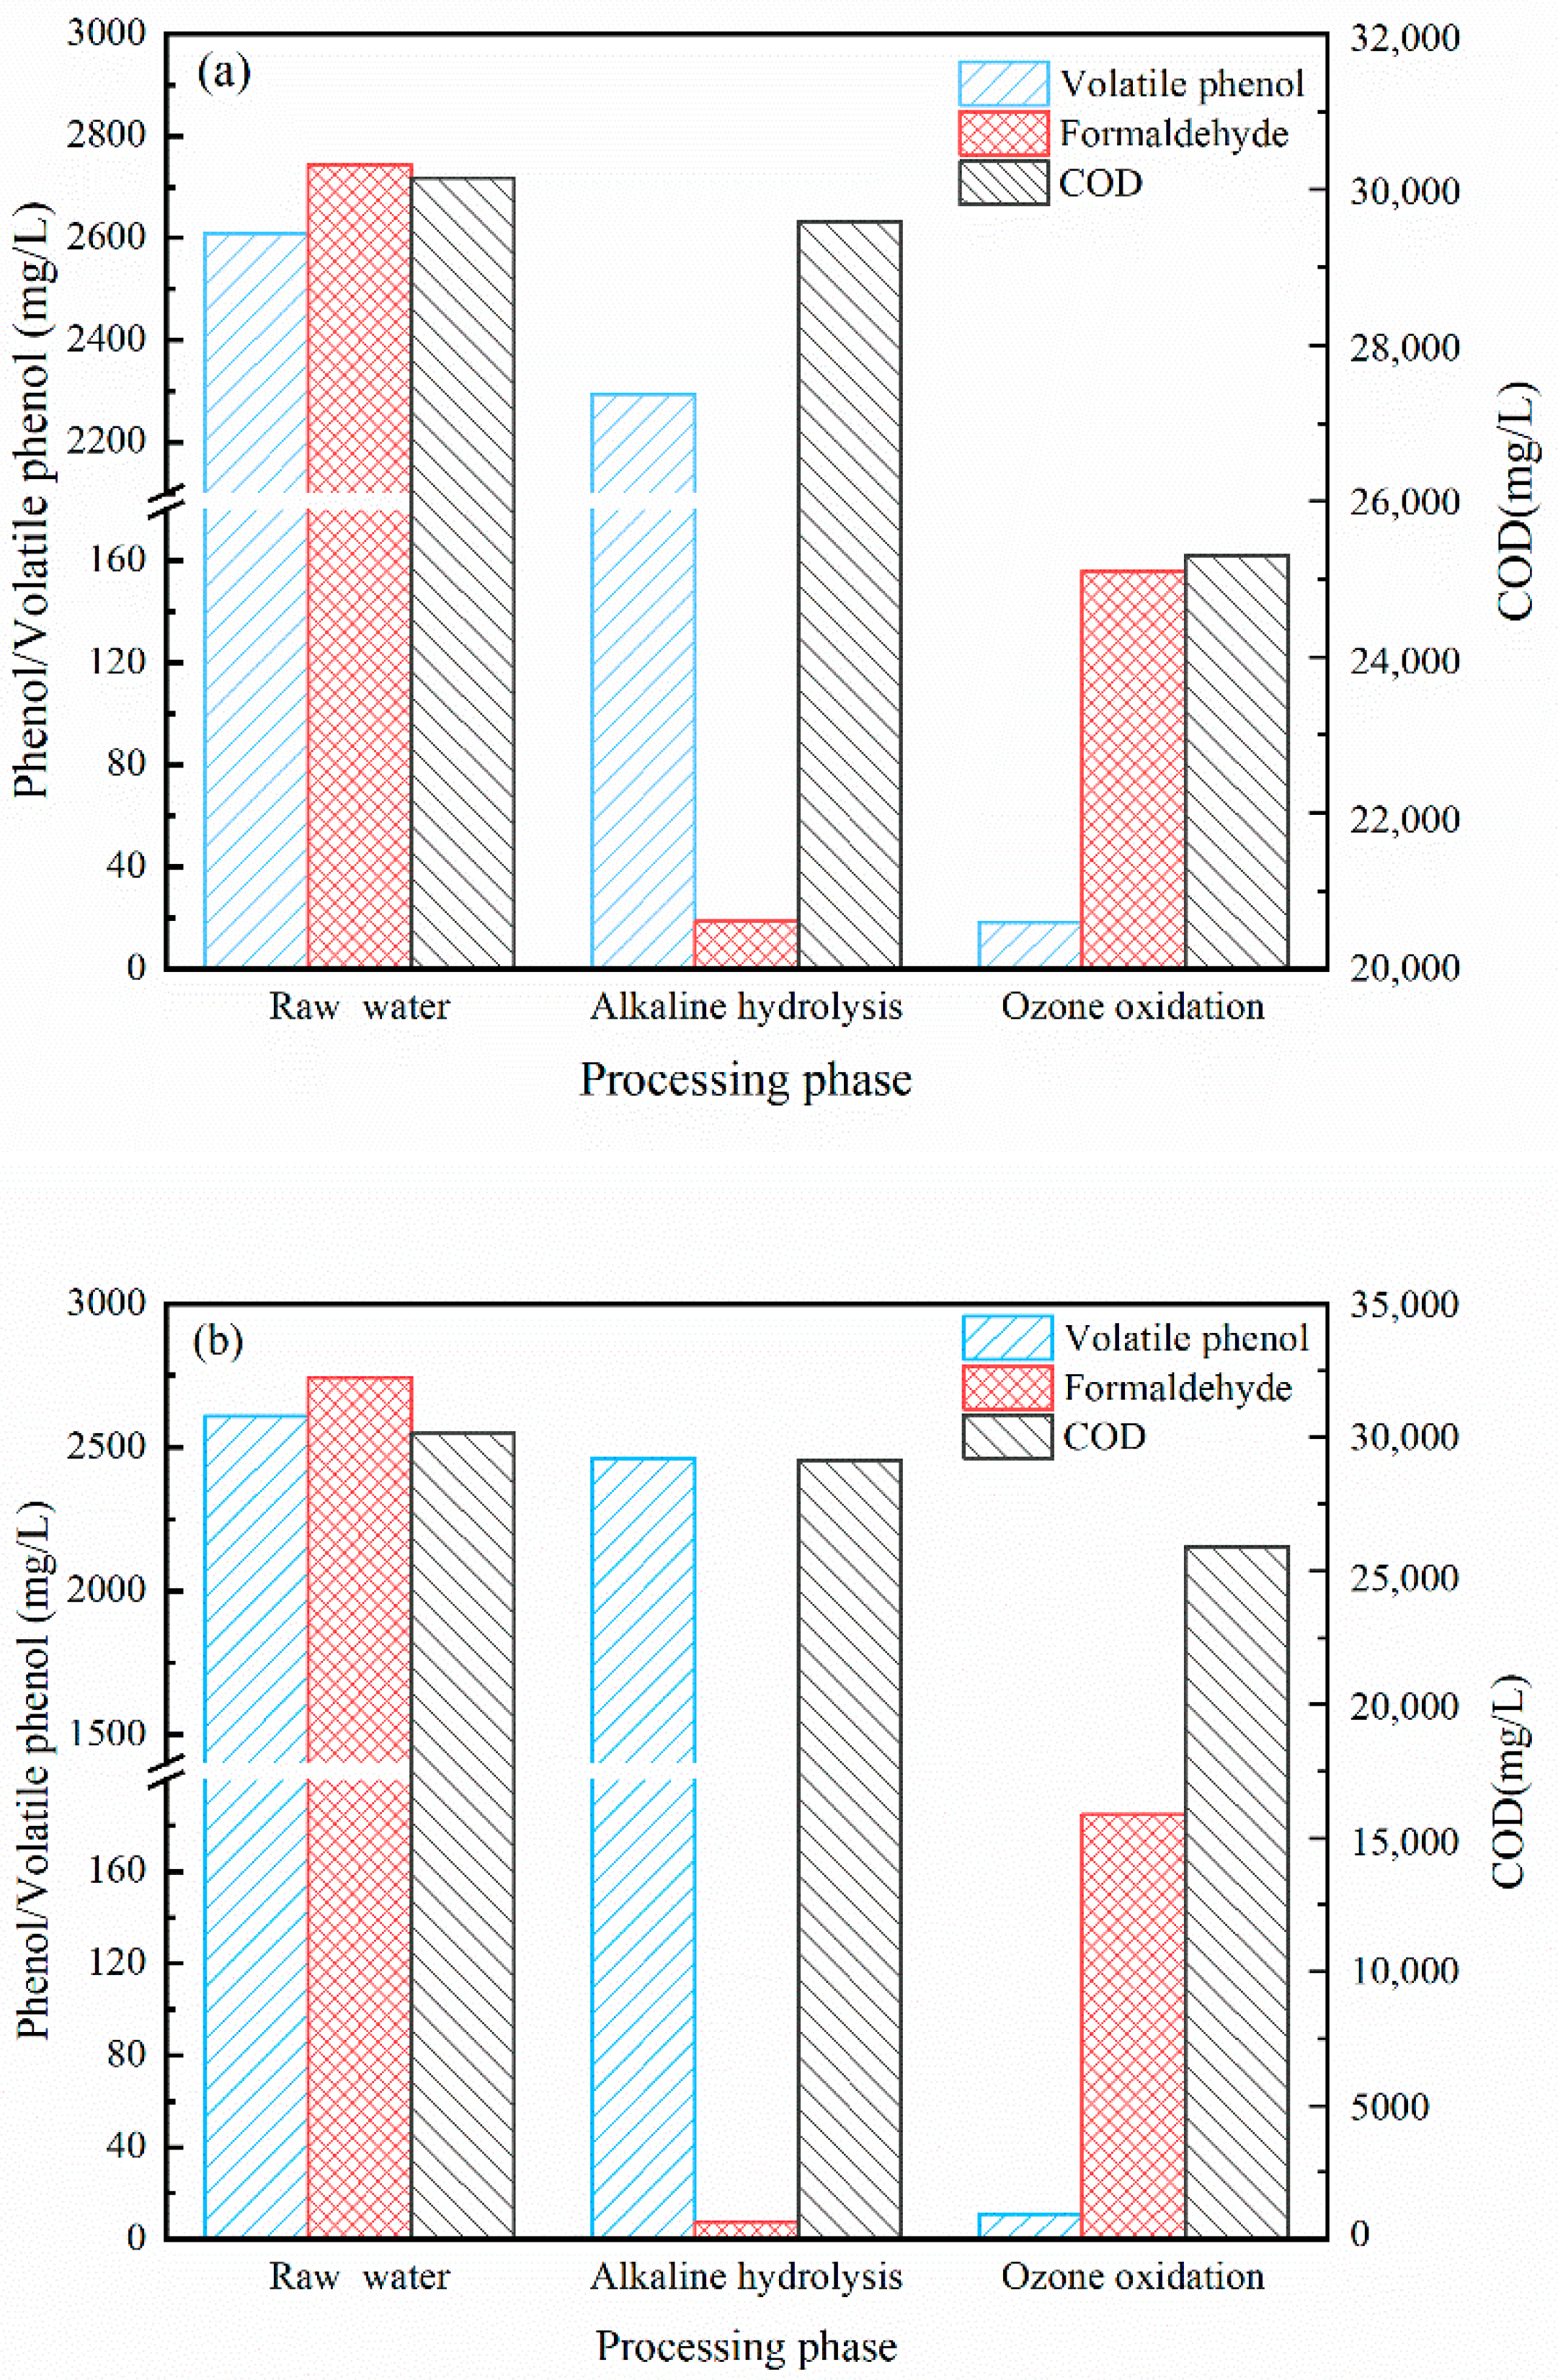
3.1. Effect of Pretreatment on the Removal Effect of Volatile Phenols and Formaldehyde

For the pretreatment, 1500 mg/L of NaOH and Ca(OH)2 were added to raw resin wastewater to compare the removal effects of these two basic reagents on phenolic and other organic pollutants in polyester resin production wastewater. As shown in Figure 2, with the addition of Ca(OH)2 in the process of alkaline hydrolysis, COD concentration gradually decreased from 30,148 to 29,589 mg/L. The concentration of volatile phenols decreased from 2609.2 to 2295 mg/L, and the concentration of formaldehyde decreased from 2743.2 to 18.5 mg/L. After ozone catalytic oxidation, the concentration of COD in wastewater continued to decrease to 25,303 mg/L, the concentration of volatile phenols decreased to 18.3 mg/L, and the concentration of formaldehyde slightly increased to 155.7 mg/L. According to Figure 2b, with the addition of NaOH, COD concentration in resin wastewater decreased from 30,148 to 29,142 mg/L, volatile phenol concentration decreased from 2609.2 to 2463 mg/L, and formaldehyde concentration decreased from 2743.2 to 7.6 mg/L. After ozone catalytic oxidation, the concentration of COD in wastewater continued to decrease to 25,899 mg/L, the concentration of volatile phenols decreased to 10.9 mg/L, and the concentration of formaldehyde increased to 184.6 mg/L.
Figure 2 shows that in the alkali-hydrolysis stage, the two alkali-hydrolysis agents degrade COD, volatile phenols, and formaldehyde to varying degrees. The removal effect of formaldehyde is the best, with a removal rate of 99.2%, which is basically completely removed, while the removal effects of COD and volatile phenols are not obvious [21]. This is because the formaldehyde containing active α-hydrogen atoms in the wastewater under the catalytic action of alkaline reagent underwent nucleophilic addition to obtain β-hydroxyl aldehyde, or further dehydration to obtain α, β-unsaturated aldehydes ketone through the aldol condensation and the formation of new carbon bonds in the molecule to achieve the removal of formaldehyde in the wastewater. The removal effect of NaOH on COD, formaldehyde, and volatile phenols was slightly better than that of Ca(OH)2, so NaOH was selected as the alkaline hydrolysis reagent in the alkaline hydrolysis unit in the pretreatment [22]. The removal rates of volatile phenol and COD were up to 99.0% and 19.6%, respectively. This is because ozone can remove target pollutants by generating hydroxyl radicals, ∙OH, which can open and break the chain of difficult-to-degrade substances, such as volatile phenols in wastewater [23]. After ozone-catalyzed oxidation, the concentration of formaldehyde in the wastewater increased slightly compared with that in the alkali-hydrolysis stage, which may be due to the fact that some of the olefin produced in the alkali-hydrolysis process was formed during the ozone-oxidized process [24]. Although formaldehyde can be removed via reaction with ∙OH, the removal rate is far less than its generation rate, so formaldehyde will accumulate after the ozone-oxidized process.

3.2. Effect of Running Time on Treatment Efficiency of the Hydrolysis Acidification Unit

As shown in Figure 3a, the entire hydrolysis and acidification unit was operated for a total of 77 days. During the entire operation period, the effluent COD was relatively stable and maintained at about 2000 mg/L. The COD removal rate increased with the increase in the influent COD concentration, where the highest COD removal rate was 76.81% and the average COD removal rate was 51.22%. As shown in Figure 3b, the influent TN remained relatively stable during the entire operation period. The average influent concentration of TN was 67.1 mg/L, and the effluent could be reduced to a minimum of 27.2 mg/L. The average removal rate of TN in the system was 29.13%. In the first 58 days, the TN removal rate of the system gradually increased with the increase in operating time in a certain range. The TN removal rate reached its peak on the 58th day and then decreased slowly. As shown in Figure 3c, during the whole operation period, when the average influent concentration of NH3-N was 41.6 mg/L, the average effluent concentration was 35.3 mg/L and the average removal rate of NH3-N was 15.21%. Similarly, the NH3-N removal rate of the system increased gradually with the increase in operation time by a certain magnitude. It reached a peak at day 58 and then began to decrease slowly.
Figure 3a shows that with the increase in running time, the COD removal rate rose steadily and the effluent COD tended to be stable, although the water quality of COD concentration fluctuation was bigger. While the concentration of the reactor can adapt to a larger impact, this experimental hydrolysis acidification unit of mixed water has a strong resistance to impact load capacity and COD removal was not affected. Figure 3b shows that the TN removal rate gradually increased in an unstable trend with the increase in operating time. The TN removal rate reached a peak on the 58th day, and the highest removal rate was 63.48%. After the 58th day, the TN removal rate showed a downward trend. An insufficient carbon source may be the main reason for the decline in denitrification efficiency in the later stage. Figure 3c shows that the NH3-N removal rate fluctuated greatly. In general, the NH3-N removal rate increases with the increase in operating time and starts to decrease gradually when it reaches a certain peak value, which may be due to the increase in hydraulic retention time. The increase in the number of heterotrophic anaerobic microorganisms forms a competitive relationship with the possible existing anammox bacteria, resulting in a decrease in the activity of anammox bacteria and a decrease in the removal effect of ammonia nitrogen [25]. From the 40th to the 77th day, when the influent NH3-N concentration was relatively stable, the effluent NH3-N concentration fluctuated greatly. This outcome is likely be related to the change in temperature, which may affect the growth in anaerobic microorganisms’ activity and result in the instability of NH3-N in the effluent.

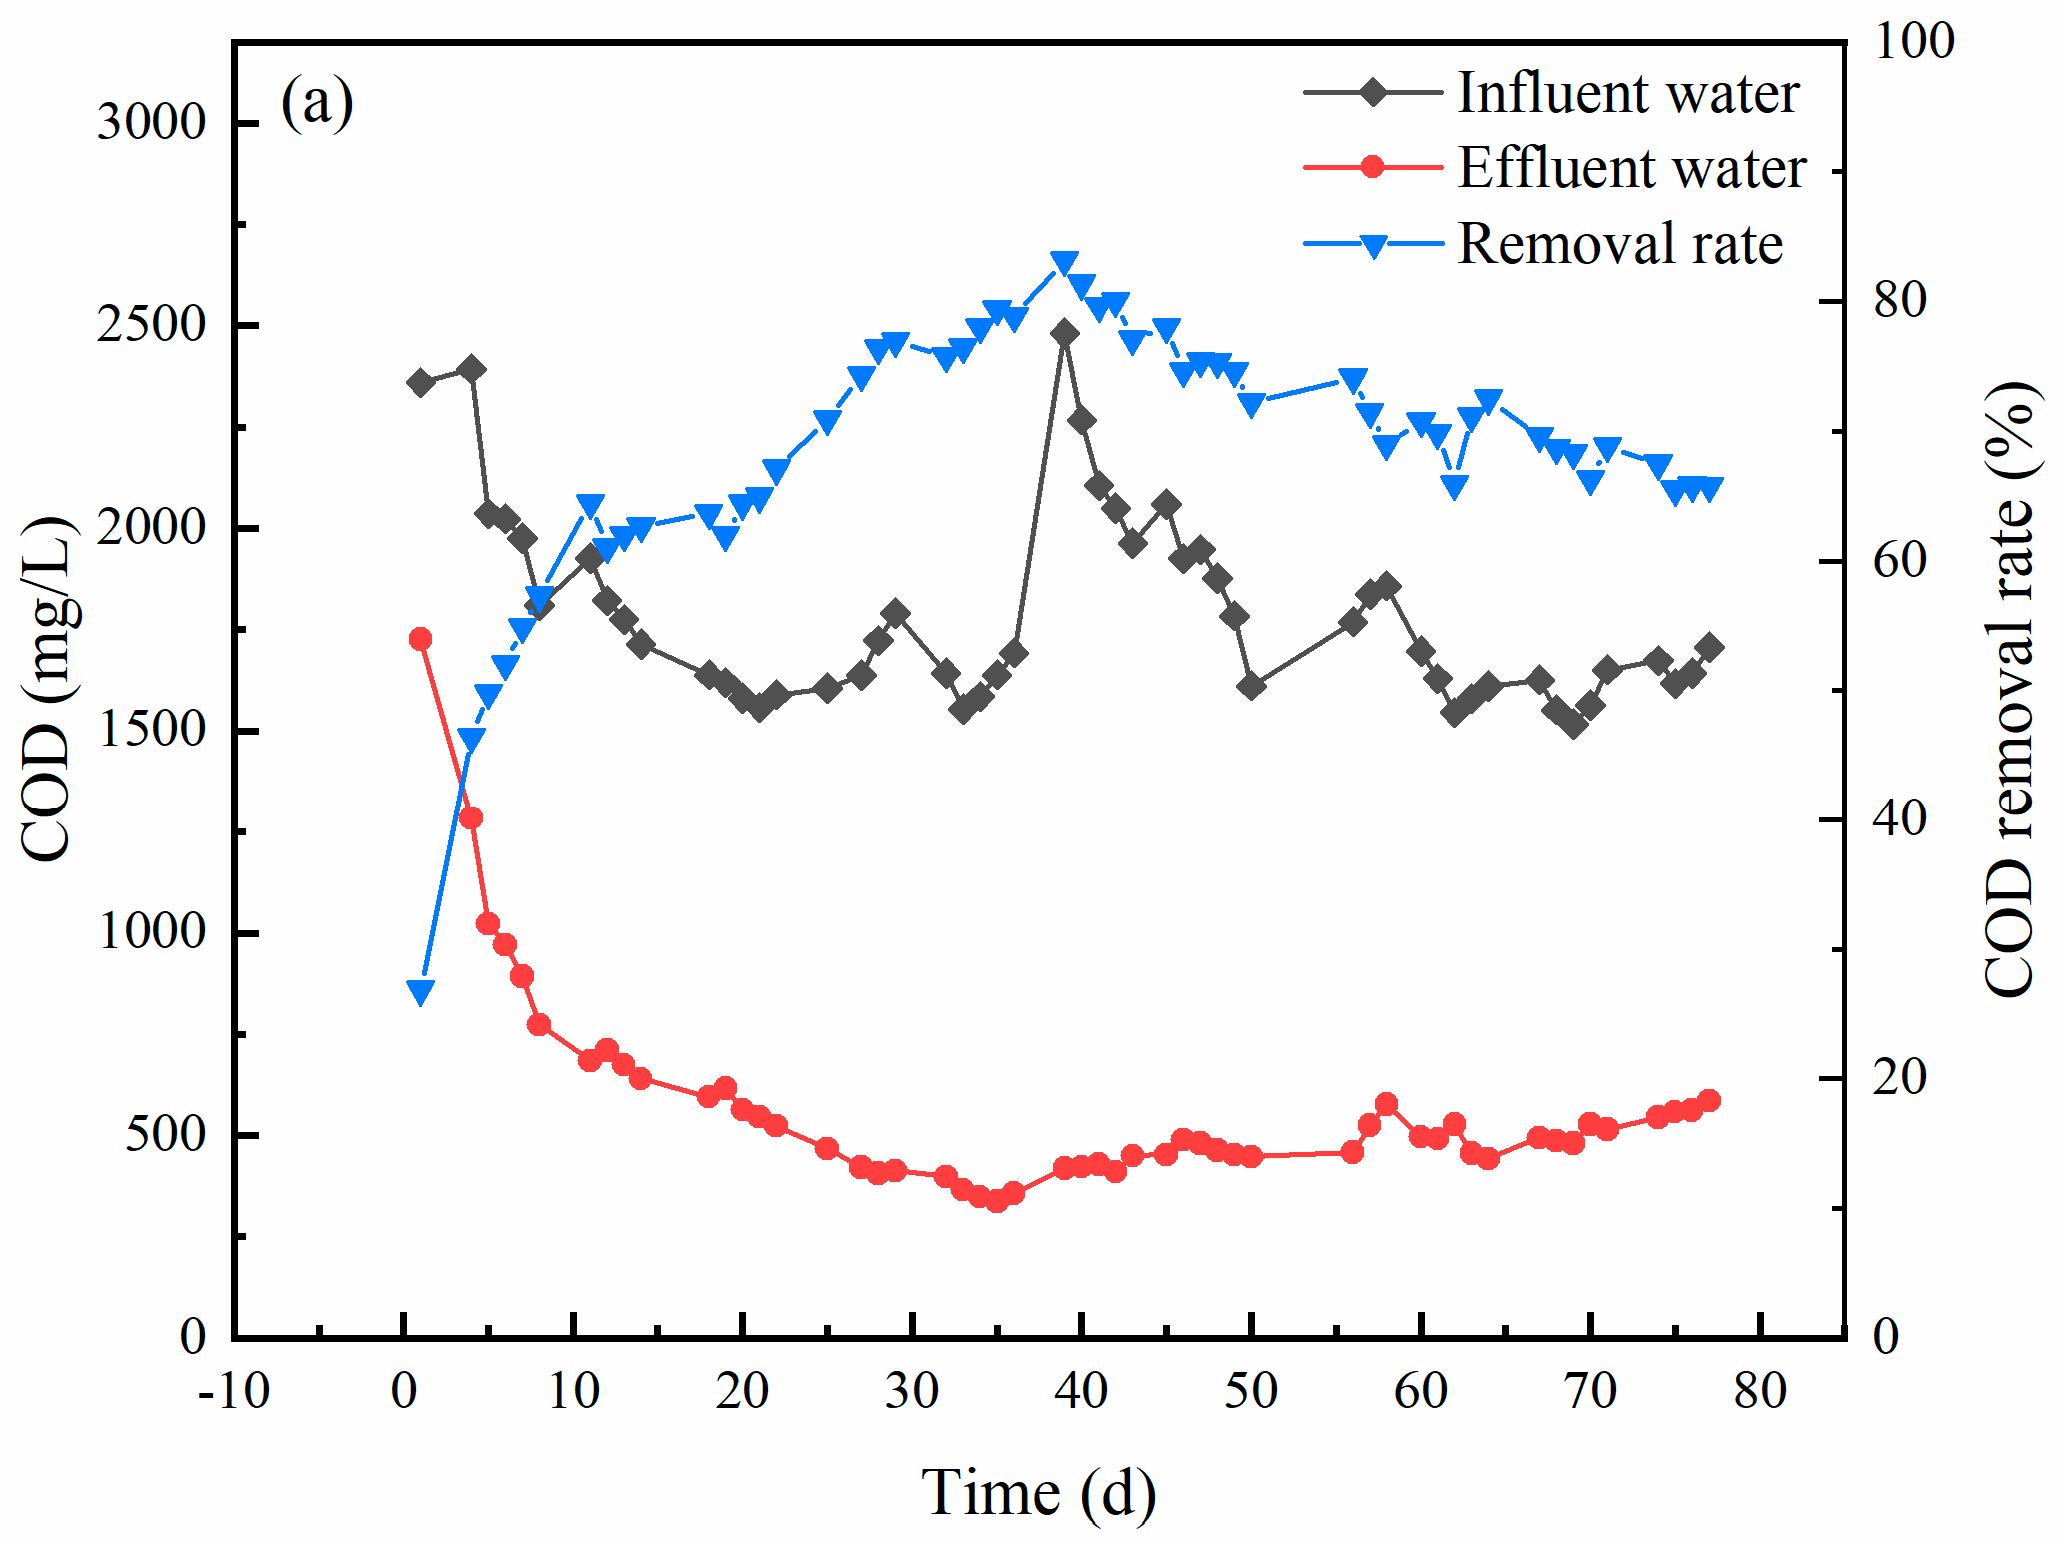
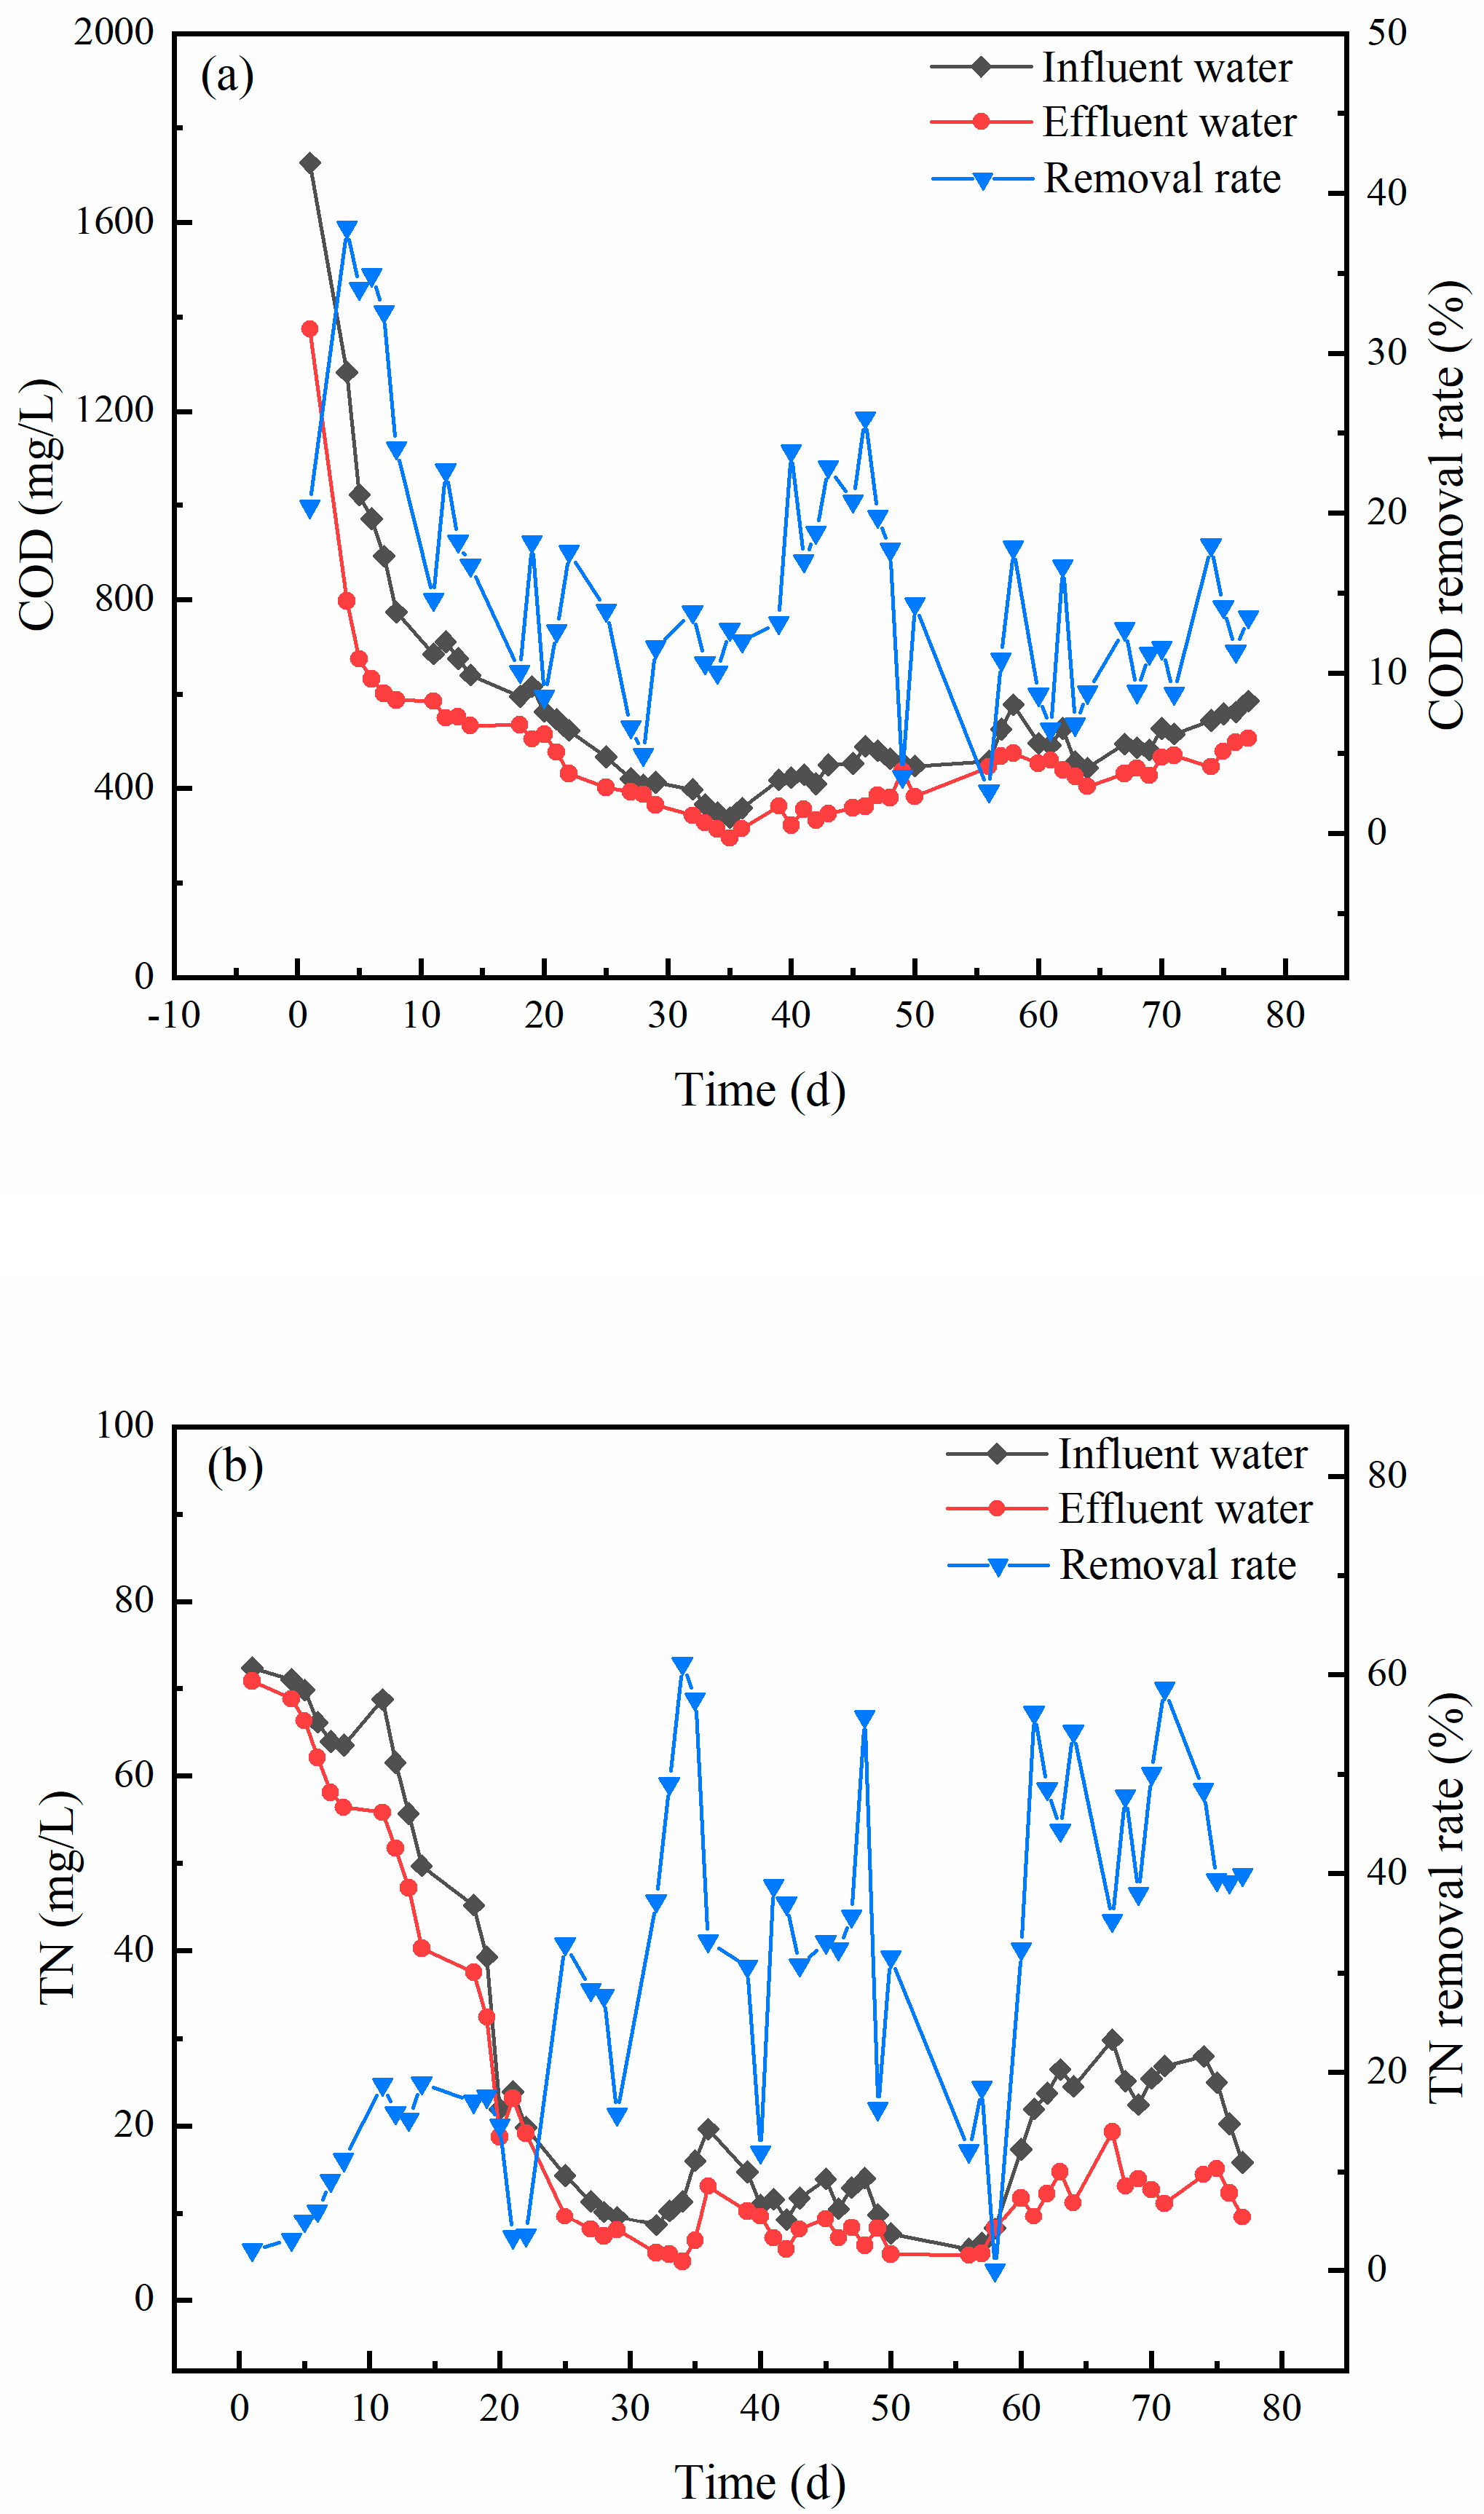
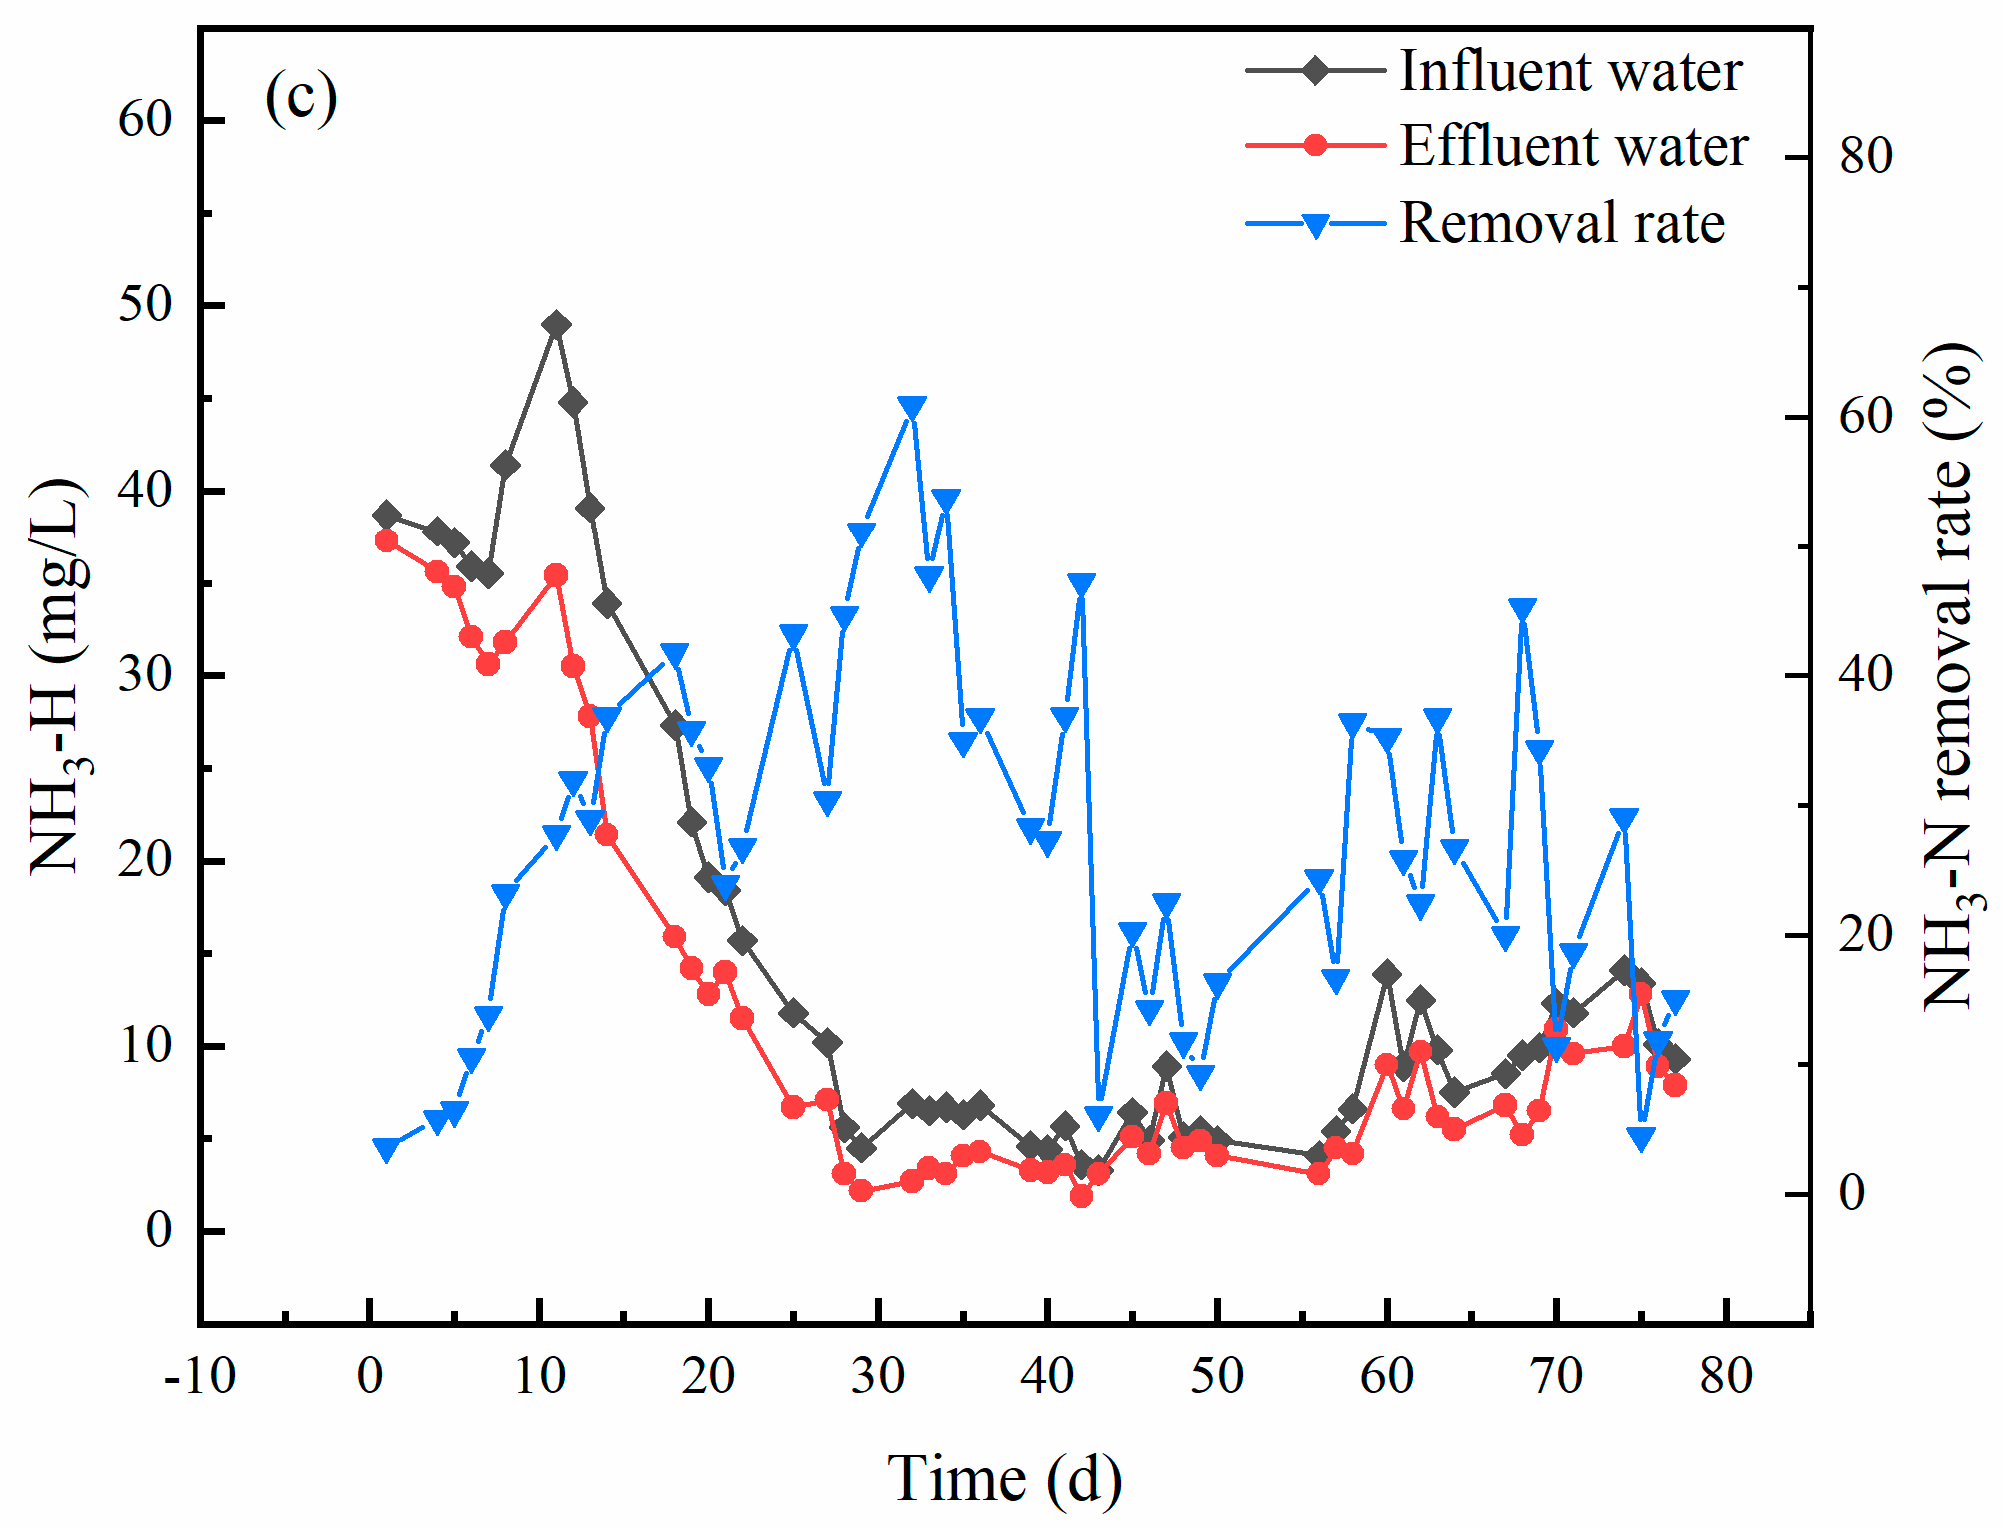
3.3. Effect of Running Time on Treatment Efficiency of Primary AO Unit

As shown in Figure 4a, during the whole operation period, the influent COD was basically maintained at about 2000 mg/L, the effluent COD concentration remained relatively stable after the 10th day, and the average COD removal rate was about 68.62%. The COD removal rate increased initially and then decreased and was the largest on the 39th day, reaching 83.15%. As shown in Figure 4b, the influent TN mass concentration fluctuated in the range of 27.2–74.0 mg/L, and the average TN removal rate was 48.83%. From the 1st to the 30th day, the TN removal rate showed a gradual upward trend and finally reached 72.95%; from the 30th to the 60th day, the TN removal rate was extremely unstable and generally showed an initial decline and then an increase. Days later, with the increase in influent TN concentration, TN removal first decreased and then increased. As shown in Figure 4c, the mass concentration of NH3-N in the influent fluctuated in the range of 19.7–48.8 mg/L, and the average removal rate of NH3-N was 59.83%. With the increase in operating time, the removal rate of NH3-N fluctuated within a certain range and showed a trend of first rising and then decreasing, and finally tending to be stable. On the 29th day, the removal rate of NH3-N was the highest, reaching 90.38%.
Figure 4a shows that the COD mass concentration of the influent water was not stable during the whole operation period. With the slight recovery of temperature, the mass concentration of the influent COD mass gradually became stable after the 60th day. The COD removal rate generally showed a trend of increasing first and then decreasing, which indicated that the microorganisms in the primary A/O unit needed a certain adaptation process to increase the load; this trend may also be related to the change in ambient temperature [26]. Figure 4b shows that, from the 1st to the 30th day, the TN removal rate gradually increased with the increase in operating time, which was the result of nitrification by nitrifying bacteria in the primary AO unit, effectively removing TN from the wastewater. From the 30th to the 77th day, the mass concentration of TN in the influent gradually decreased, and the removal performance of the system to TN was in an unstable state, which may be related to the content of carbon sources in the system [27]. In the case of sufficient carbon sources, the removal of TN was stable. Therefore, it is appropriate to add carbon sources (e.g., methanol) to provide sufficient supply energy for the biological nitrogen and phosphorus removal process and improve the activity of the sludge [28].

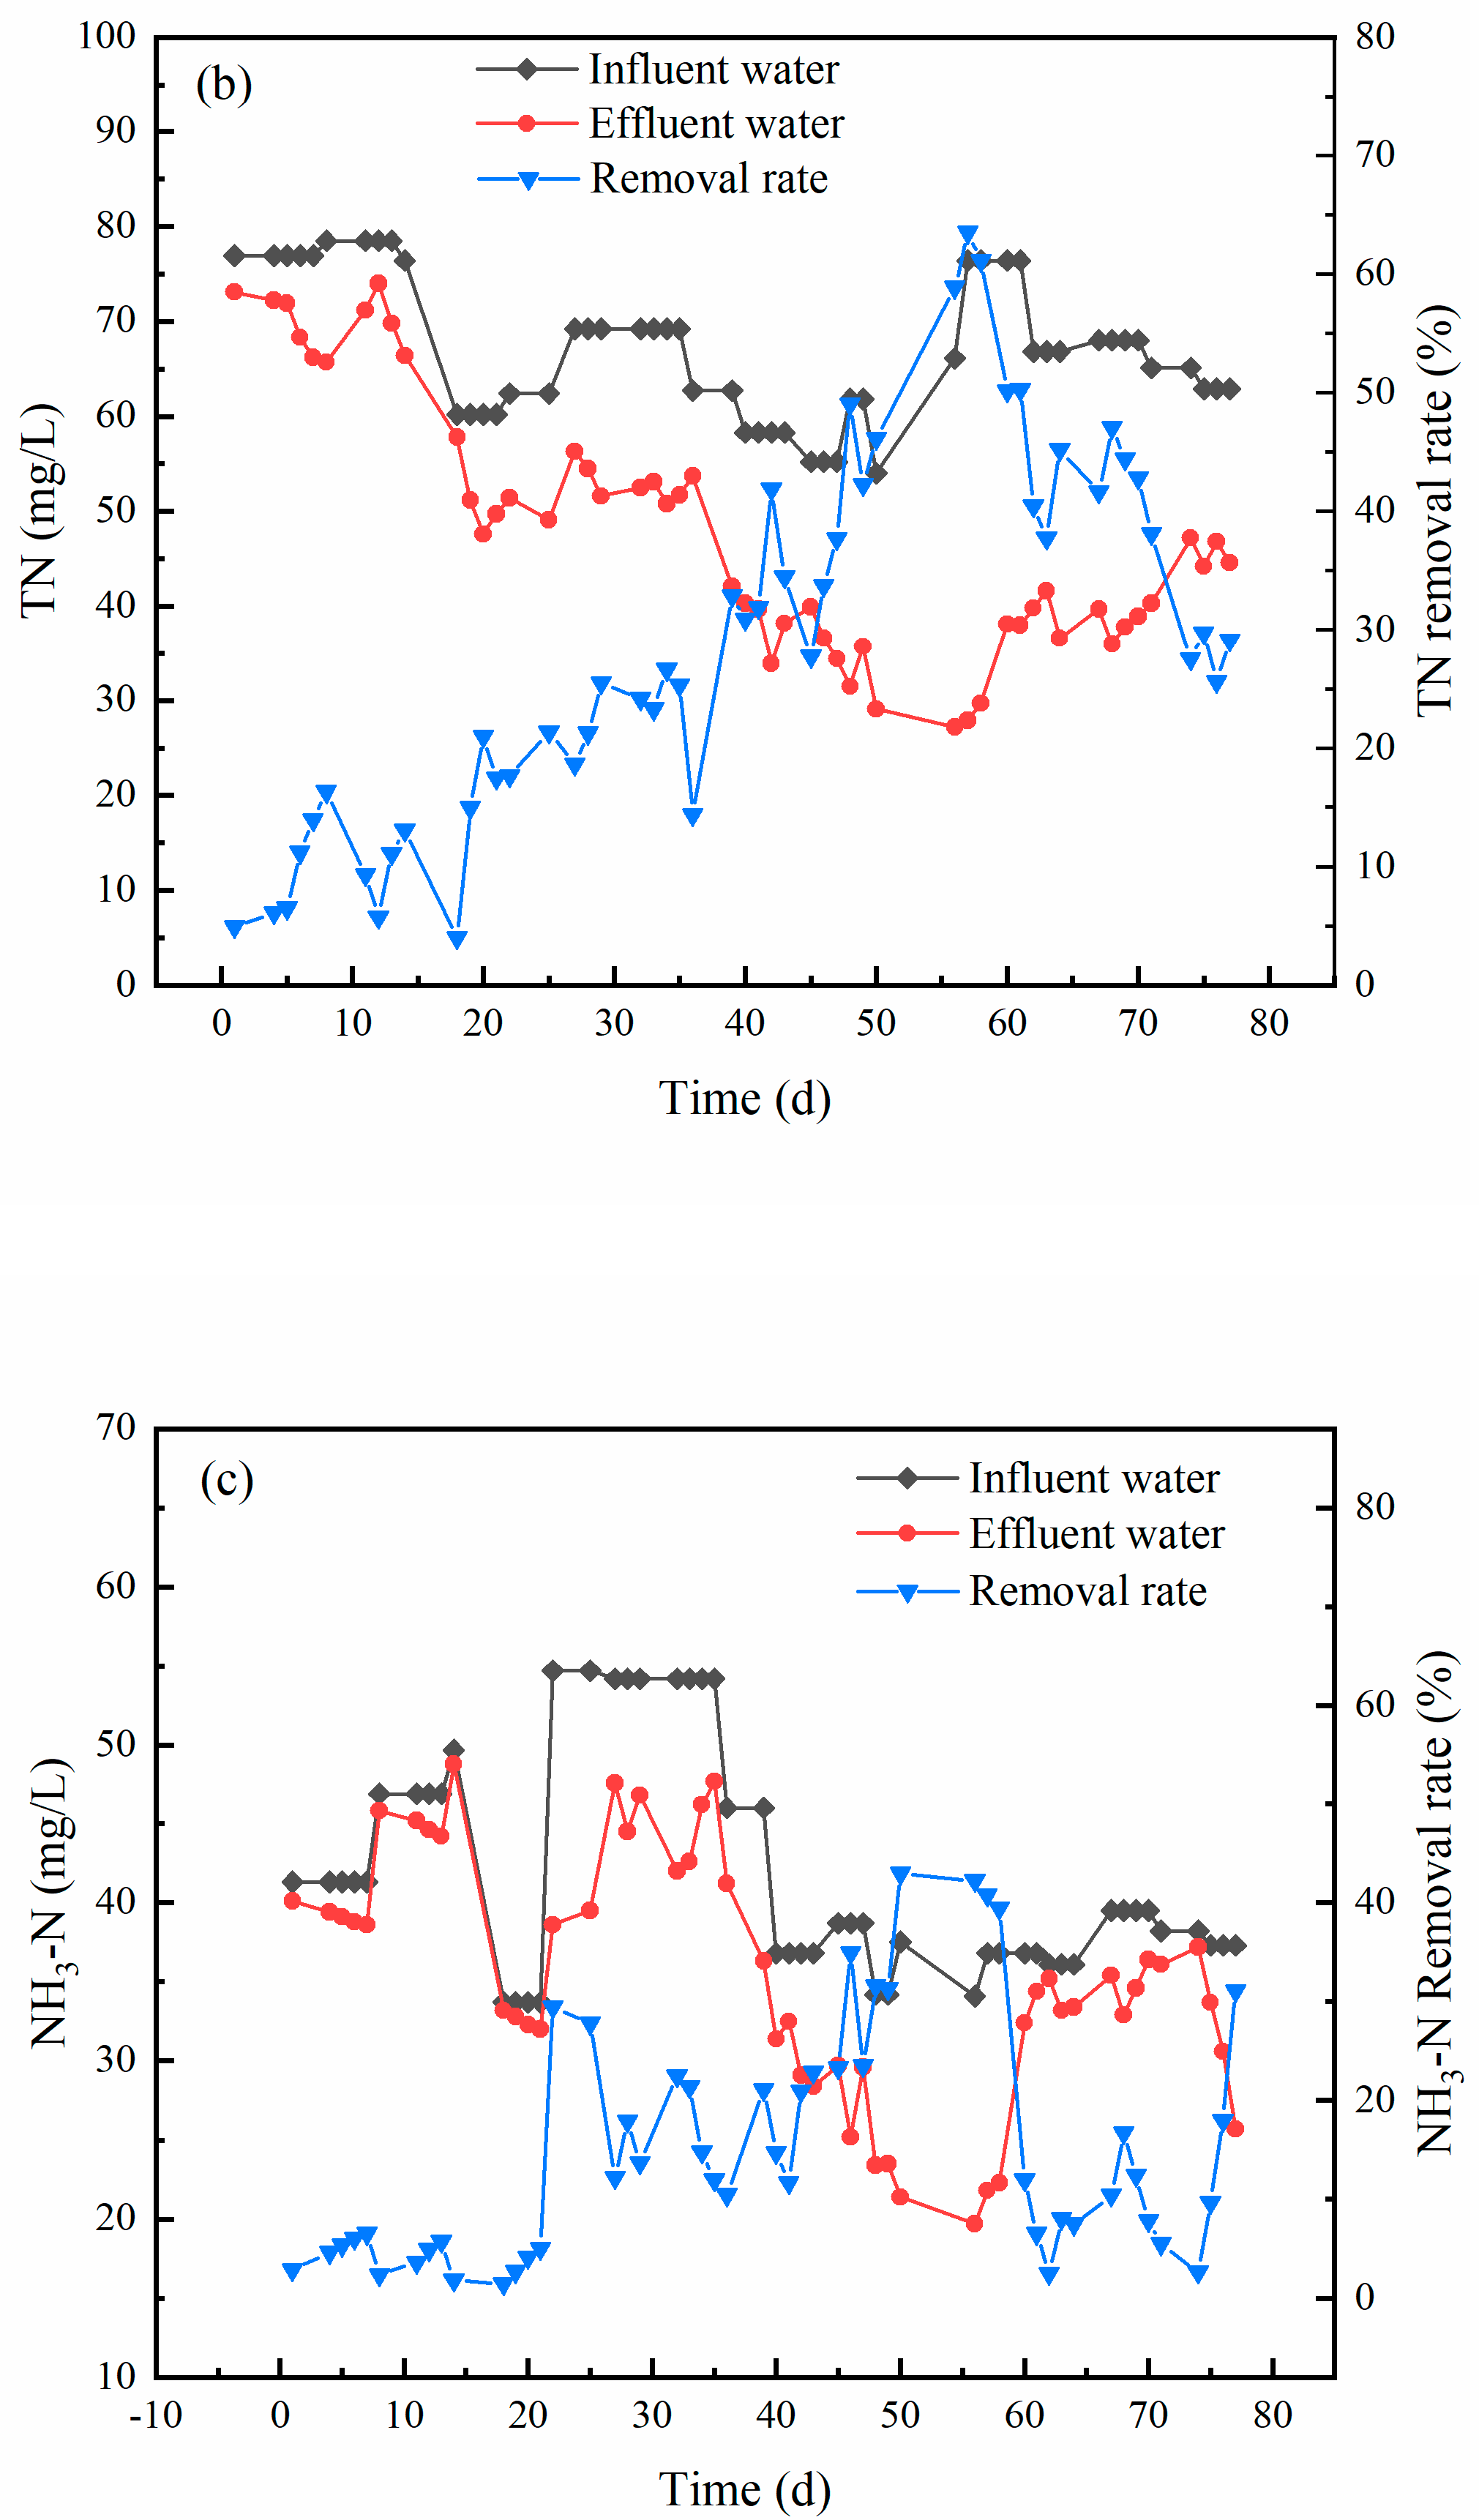
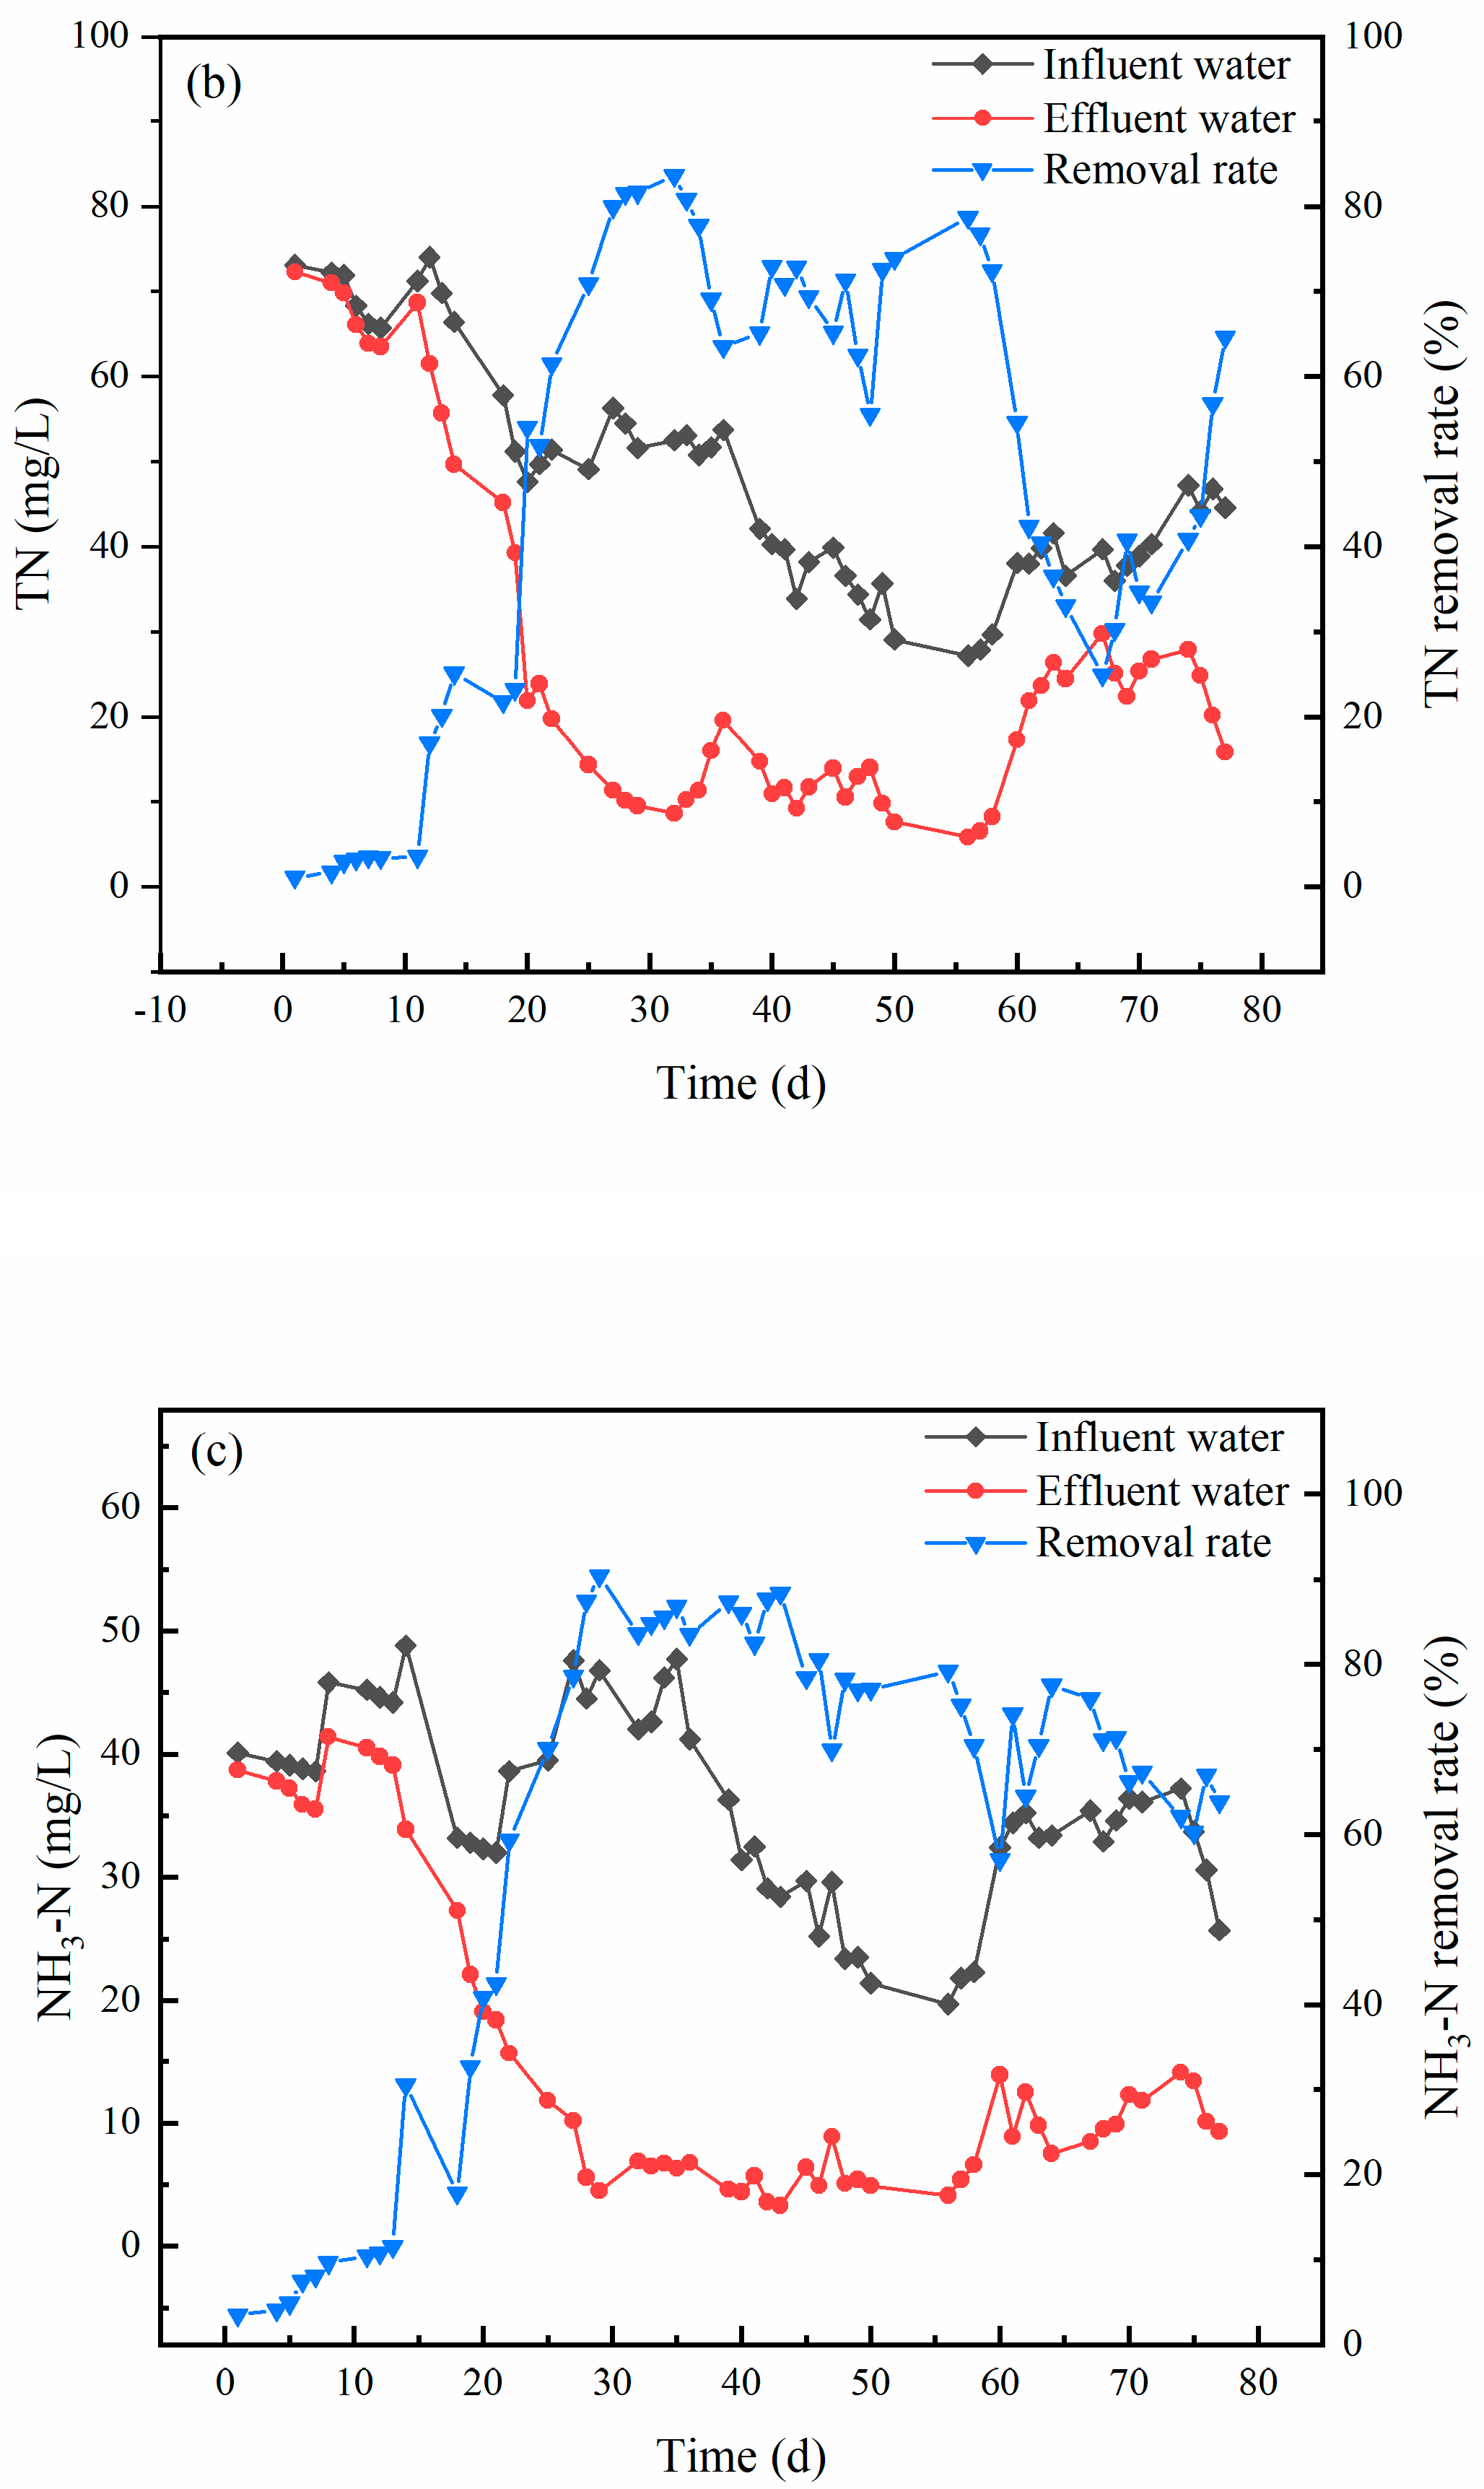
3.4. Effect of Running Time on Treatment Efficiency of the Two-Stage AO Unit

As shown in Figure 5a, the influent COD quality concentration was unstable in the early operation period, and the COD quality concentration was stable between 338 and 585 mg/L in the late operation period. The COD removal rate generally showed a trend of decreasing first and then increasing and then stabilizing, with an average COD removal rate of 15.51% and a maximum COD removal rate of 37.88%. As shown in Figure 5b, the mass concentration of TN in the influent water decreased first and then became stable during the whole operation period. The TN removal rate was not stable, and the fluctuation range jumped. The maximum TN removal rate was 61.06%, and the average removal rate was 29.24%. In general, the TN removal rate showed an upward trend. As shown in Figure 5c, the influent NH3-N concentration is the same as that of TN during operation. In general, the influent NH3-N concentration first decreases and then tends to be stable. The variation range was between 3.3 and 49.0 mg/L. The effluent NH3-N mass concentration was better, and the average effluent concentration of NH3-N was 7.4 mg/L. The NH3-N removal rate fluctuated more obviously after the 30th day, but the overall trend first rising and then stabilizing, and the average NH3-N removal rate was 27.28%.
As shown in Figure 5a, the influent COD concentration decreased from 1374 mg/L at the beginning to 338 mg/L and then became flat. The COD removal rate fluctuated in a certain range during the operation. From the 1st to the 28th day, the COD removal rate dropped from 37.88% to 6.65%. This effect may be due to the poor quality of the resin wastewater that had just entered the secondary AO unit. The activated sludge in the reactor is also extremely unsuitable for the resin wastewater quality, resulting in a decrease in the COD removal rate [29]. This outcome reflects that the resin wastewater may have a toxic inhibitory effect on the microbial activity in the secondary AO unit, and the reactor needs a certain time to adapt to the resin wastewater environment to reach a relatively stable state [30]. Figure 5b shows that from the 1st to the 34th day, the TN removal rate fluctuated and increased, and the highest TN removal rate was 61.06%. After the 34th day, the TN removal rate fluctuated greatly and showed a downward trend as a whole, which may be related to the insufficient carbon source in the reaction unit. In the biological denitrification system, the period of nitrifying bacteria is long and the growth rate is slow. Sufficient sludge age is required to ensure the number of nitrifying bacteria. In addition, the growth in denitrifying bacteria is mainly carried out under anoxic conditions, and there must be a sufficient carbon source to provide energy and promote the smooth progress of denitrification [31]. Therefore, having a sufficient carbon source and sludge age directly affect the nitrification and denitrification processes and have an important impact on TN removal [32]. From Figure 5c, it can be seen that the NH3-N removal rate increased steadily in the early operation period, and the highest NH3-N removal rate was 60.87% at day 32. This removal rate then decreased gradually after day 32, and the lowest removal rate was 4.48%. The decrease in NH3-N removal rate in the secondary AO unit in the late operation may be related to the lack of dissolved oxygen in the water [33].

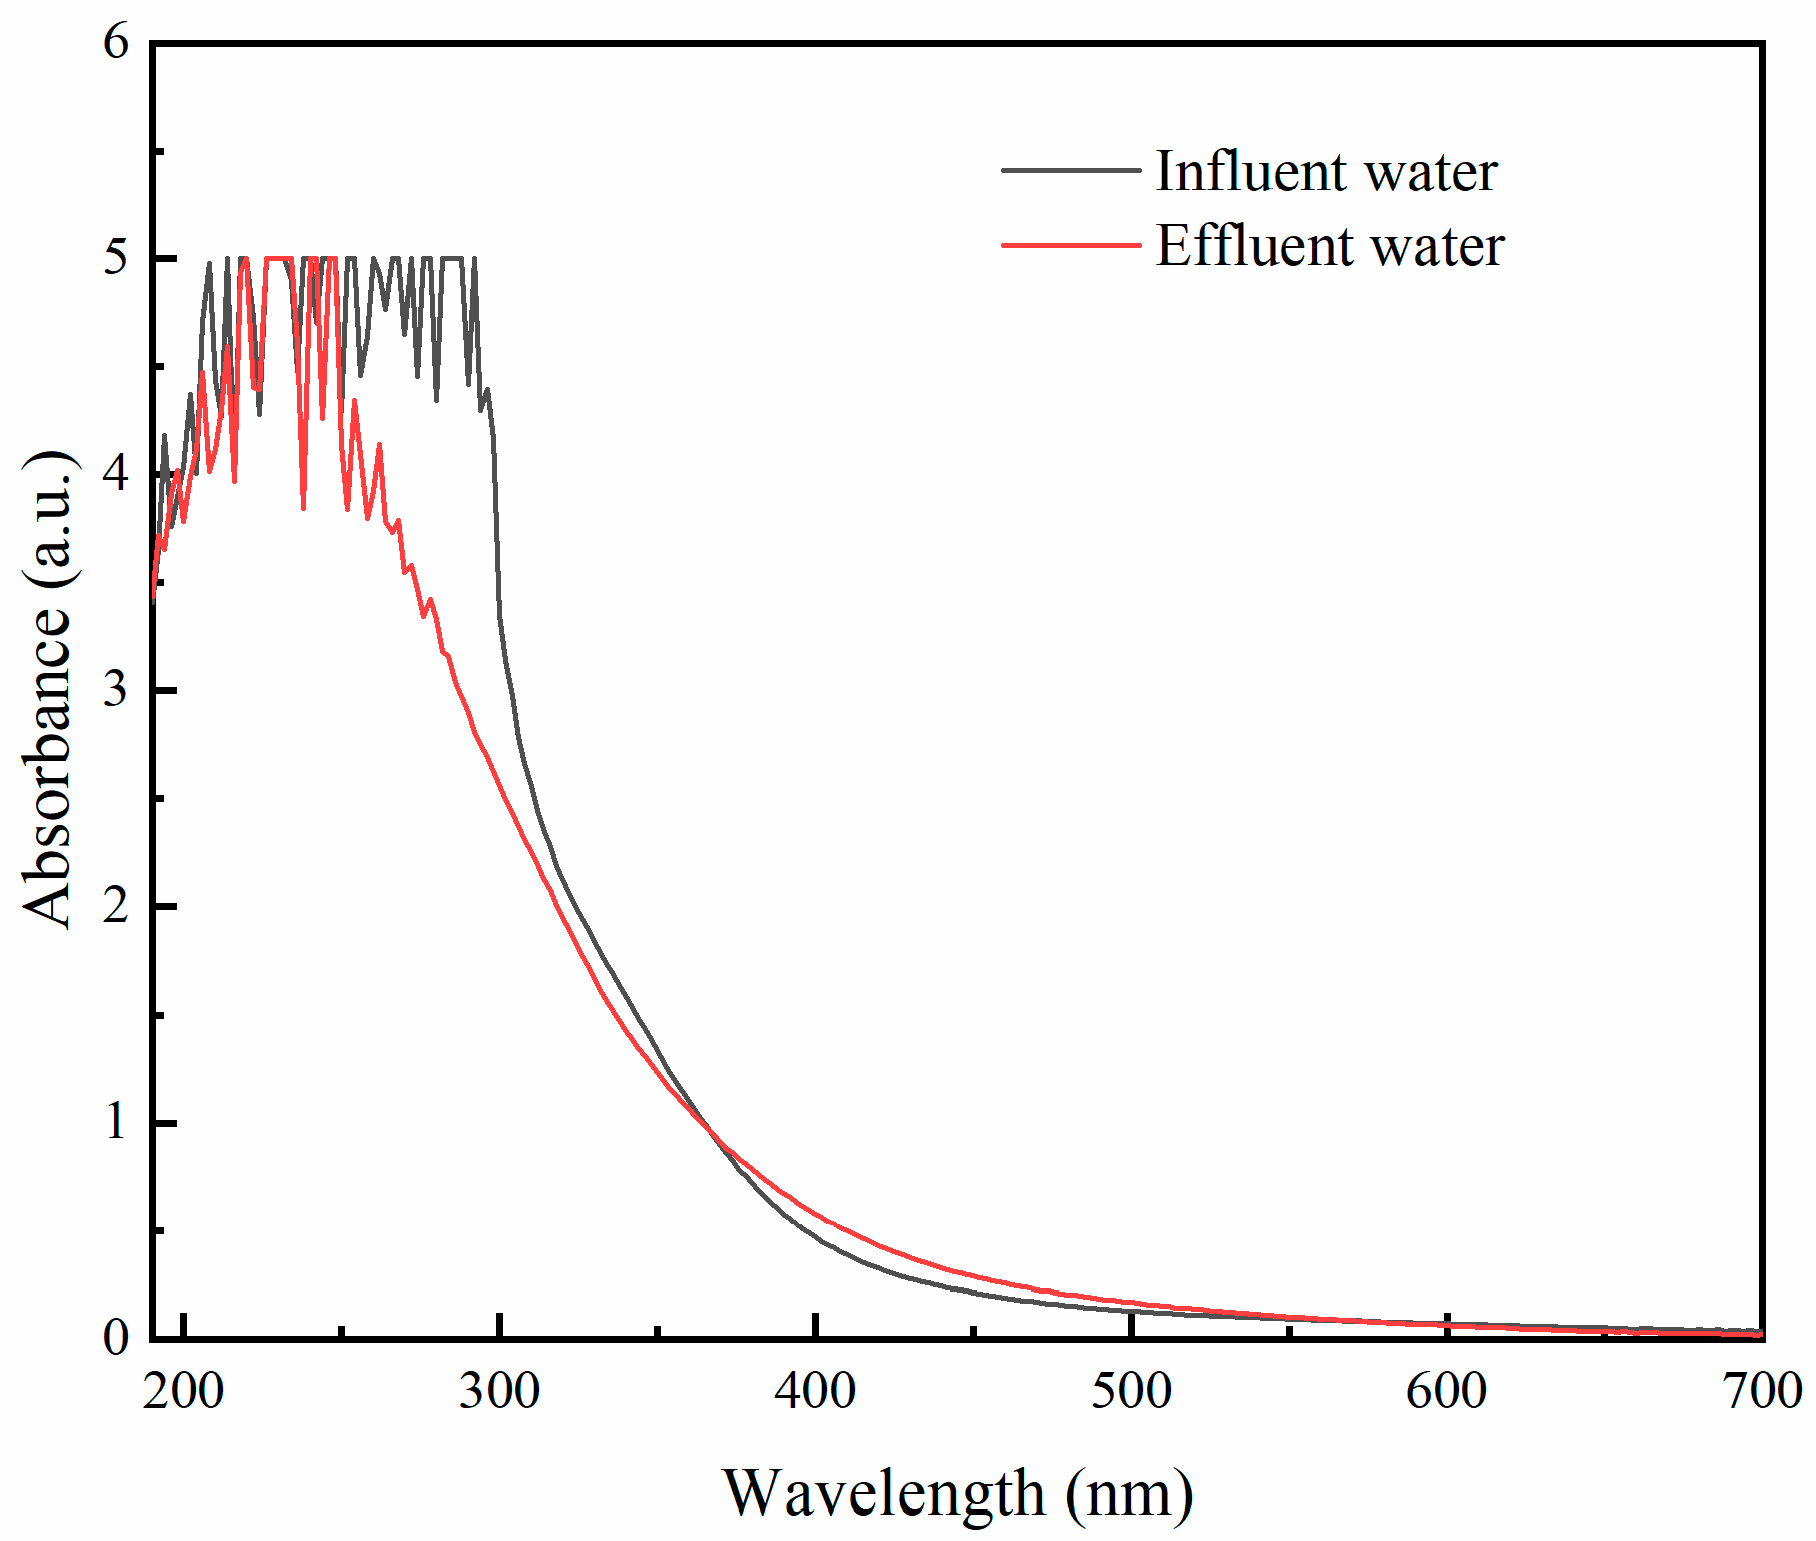
3.5. Exploration of Organic Matter Degradation in the Water Treatment Process

According to the analysis results in Table 2, a total of 60 substances were detected in the wastewater, of which 14 substances with relative content greater than 0.9% could be categorized into eight types of substances. Among them, alkanes accounted for 25.32%, esters for 32.35%, phenols for 4.36%, and aldehydes for 3.87%. There were also many kinds of long-chain and cyclic alkanes and many kinds of acids and ketone organic substances in the wastewater, most of which belong to organic substances that are difficult to biodegrade or having biological toxicity [34]. The GC/MS spectrum analysis results of the water samples were compared with the raw water quality test results in Table 2, which can clearly reflect the degradation and transformation of the main organic pollutants in the resin production wastewater. The results are shown in Table 3.
As shown in the table, there were large changes in the distribution of the number of organics and their relative contents in both raw water and treated effluent water samples. Sixty organic compounds were detected in the raw water, and after the treatment of each unit, there was a significant decrease in their quantity, and the final number of organic compounds in the effluent water was reduced to 30. Further analysis showed that after the treatment of the reaction unit, the relative content of all the organic compounds in the effluent water sample was significantly reduced, except for the relative content of epoxy alkanes, which was significantly increased [35]. Overall, it seems that the aldehydes were completely removed from the resin production wastewater after the combined treatment of “pretreatment/hydrolysis acidification/two-stage AO,” and the relative contents of all kinds of organics, except epoxy alkanes, were significantly reduced. Among the final effluent organic components, epoxy alkanes and esters became the most important components, with relative contents of 67.25% and 11.23%, respectively. Therefore, it can be inferred that the epoxy alkanes and esters are the important factors explaining the difficulty of stabilizing COD in the effluent of the secondary AO unit [36].
As shown in Figure 6, the influent of resin production wastewater and the effluent treated by the combined process have obvious absorption peaks between 190 and 320 nm. The peak of the incoming water is at 268 nm, and the absorbance is 5.0012. After the combined process, the peak of the effluent is at 242 nm, the absorbance is 5.0000, and the peak of the effluent is slightly lower than the peak of the influent.
In the ultraviolet region, unsaturated organic compounds, especially organic compounds with cyclic conjugated systems, have both E and B absorption bands. The E absorption band is the characteristic absorption band of aromatic compounds, and the B absorption band is the fine structure absorption band, which is often used to identify aromatic (including heterocyclic aromatic) compounds [37]. Figure 6 shows that the influent water has strong UV absorption peaks in the range of 190–330 nm, which indicates that the resin production wastewater contains a large amount of monocyclic aromatic compounds (e.g., phenol and aniline) and a small amount of polycyclic aromatic hydrocarbons and heterocyclic compounds. After the combined process treatment, the absorption peak at 250–300 nm was significantly reduced, indicating that most of the aromatic compounds and polycyclic aromatic hydrocarbons in the wastewater had been removed, which was consistent with the previous GC/MS analysis results of the influent and effluent [38].

4. Conclusions

“Alkaline hydrolysis + ozone oxidation” pretreatment technology has a good treatment effect on resin production wastewater. NaOH as an alkaline hydrolyzer is better than Ca(OH)2, and the average removal rate of COD in the pretreatment unit is 19.60%. Ozone oxidation technology treats the components in organic wastewater that are otherwise extremely difficult to treat. This technology also improves the biochemical content, of aromatic and aliphatic alkane pollutants are reduced. The hydrolysis and acidification unit further degrades the small molecules in the wastewater into ammonia nitrogen, reduces the COD of the wastewater, and effectively improves the biodegradability of the resin production wastewater. The COD index of wastewater is positively correlated with its biodegradability and ammonia nitrogen concentration. The average removal rates of single-stage COD and TN are 51.22% and 29.13%, respectively. The first- and second-stage AO series processes in the biochemical treatment unit achieve the stable treatment of high-concentration resin production wastewater. The average removal rates of COD in the first- and second-stage AO units are 68.62% and 15.51%, respectively. Furthermore, the average removal rates of TN are 48.83% and 29.24%, and the average removal rates of NH3-N are 59.83% and 27.28%. The combination process of “pretreatment hydrolysis-acidification-two-stage AO” has a good effect on the treatment of high-concentration resin production wastewater, with the final effluent COD ≤ 500 mg/L, TN ≤ 70 mg/L, and NH3-N ≤ 35 mg/L.

Author Contributions

Conceptualization, S.C., W.J., M.Z., W.J., A.L. and M.W.; methodology, S.C., M.Z., A.L. and M.W.; software, S.C. and M.Z.; validation, Q.W., Y.S., A.L. and M.W.; formal analysis, Q.W., Y.S., A.L. and M.W.; investigation, Q.W., A.L. and M.W.; resources, W.J., A.L. and M.W.; data curation, W.J., Q.W., A.L. and M.W.; writing—original draft preparation, S.C., M.Z., A.L. and M.W.; writing—review and editing, Q.W. and Y.S.; visualization, Q.W., Y.S., A.L. and M.W.; supervision, S.C. and M.Z.; project administration, S.C. and M.Z.; funding acquisition, S.C. and M.Z. All authors have read and agreed to the published version of the manuscript.

Funding

This research was supported by the National Natural Science Foundation of China (No. 51508268), Natural Science Foundation of Jiangsu Province in China (No. BK20201362), and 2018 Six Talent Peaks Project of Jiangsu Province (JNHB-038).

Institutional Review Board Statement

Not applicable.

Informed Consent Statement

Not applicable.

Data Availability Statement

Data is contained within the article.

Conflicts of Interest

The authors declare no conflict of interest.

References

  1. Shi, J.; Xu, C.; Han, Y.; Han, H. Case study on wastewater treatment technology of coal chemical industry in China. Crit. Rev. Environ. Sci. Technol. 2021, 51, 1003–1044. [Google Scholar] [CrossRef]
  2. Li, D.; Liu, J.; Wang, S.; Cheng, J. Study on coal water slurries prepared from coal chemical wastewater and their industrial application. Appl. Energ. 2020, 268, 114976. [Google Scholar] [CrossRef]
  3. Wei, K.; Wang, Z.; Ouyang, C.; Cao, X.; Liang, P.; Huang, X.; Zhang, X. A hybrid fluidized-bed reactor (HFBR) based on arrayed ceramic membranes (ACMs) coupled with powdered activated carbon (PAC) for efficient catalytic ozonation: A comprehensive study on a pilot scale. Water Res. 2020, 173, 115536. [Google Scholar] [CrossRef] [PubMed]
  4. Yang, X.; Wang, B.; Luo, H.; Yan, S.; Dai, J.; Bai, Z. Efficient recovery of phenol from coal tar processing wastewater with tributylphosphane/diethyl carbonate/cyclohexane: Extraction cycle and mechanism study. Chem. Eng. Res. Des. 2020, 157, 104–113. [Google Scholar] [CrossRef]
  5. Gai, H.; Zhang, X.; Chen, S.; Wang, C.; Xiao, M.; Huang, T.; Wang, J.; Song, H. An improved tar–water separation process of low–rank coal conversion wastewater for increasing the tar yield and reducing the oil content in wastewater. Chem. Eng. J. 2020, 383, 123229. [Google Scholar] [CrossRef]
  6. Bertanza, G.; Collivignarelli, C.; Pedrazzani, R. The role of chemical oxidation in combined chemical-physical and biological processes: Experiences of industrial wastewater treatment. Water Sci. Technol. 2001, 44, 109–116. [Google Scholar] [CrossRef]
  7. Zhang, L.; Liu, H.; Wang, Y.; Peng, Y. Compositional characteristics of dissolved organic matter during coal liquefaction wastewater treatment and its environmental implications. Sci. Total Environ. 2020, 704, 135409. [Google Scholar] [CrossRef]
  8. Mehrjouei, M.; Mueller, S.; Moeller, D. A review on photocatalytic ozonation used for the treatment of water and wastewater. Chem. Eng. J. 2015, 263, 209–219. [Google Scholar] [CrossRef]
  9. Wang, J.; Bai, Z. Fe-based catalysts for heterogeneous catalytic ozonation of emerging contaminants in water and wastewater. Chem. Eng. J. 2017, 312, 79–98. [Google Scholar] [CrossRef]
  10. Asghar, A.; Raman, A.A.A.; Daud, W.M.A.W. Advanced oxidation processes for in-situ production of hydrogen peroxide/hydroxyl radical for textile wastewater treatment: A review. J. Clean. Prod. 2015, 87, 826–838. [Google Scholar] [CrossRef] [Green Version]
  11. Mezohegyi, G.; van der Zee, F.P.; Font, J.; Fortuny, A.; Fabregat, A. Towards advanced aqueous dye removal processes: A short review on the versatile role of activated carbon. J. Environ. Manag. 2012, 102, 148–164. [Google Scholar] [CrossRef] [PubMed]
  12. Aparicio, M.A.; Eiroa, M.; Kennes, C.; Veiga, M.C. Combined post-ozonation and biological treatment of recalcitrant wastewater from a resin-producing factory. J. Hazard. Mater. 2007, 143, 285–290. [Google Scholar] [CrossRef] [PubMed]
  13. Gomes, J.; Costa, R.; Quinta-Ferreira, R.M.; Martins, R.C. Application of ozonation for pharmaceuticals and personal care products removal from water. Sci. Total Environ. 2017, 586, 265–283. [Google Scholar] [CrossRef]
  14. Sun, F.Q.; Hu, J.; Zhou, Y.; Mei, R.W.; Wang, C.Z.; He, Y.Y.; Wu, W.X. High efficient alternating anaerobic/aerobic process for polyester resin wastewater treatment: Performance and microbial community structure. Biochem. Eng. J. 2018, 138, 121–130. [Google Scholar] [CrossRef]
  15. Saeed, T.; Miah, M.J.; Khan, T.; Ove, A. Pollutant removal employing tidal flow constructed wetlands: Media and feeding strategies. Chem. Eng. J. 2020, 382, 122874. [Google Scholar] [CrossRef]
  16. Chen, Z.; Li, D.; Wen, Q. Investigation of hydrolysis acidification process during anaerobic treatment of coal gasification wastewater (CGW): Evolution of dissolved organic matter and biotoxicity. Sci. Total Environ. 2020, 723, 137995. [Google Scholar] [CrossRef] [PubMed]
  17. Hassan, M.R.; Fikry, R.M.; Yakout, S.M. Artificial neural network approach modeling for sorption of cobalt from aqueous solution using modified maghemite nanoparticles. J. Environ. Eng. 2020, 146, 4020013. [Google Scholar] [CrossRef]
  18. Elkady, M.; Shokry, H.; Hamad, H. New Activated Carbon from Mine Coal for Adsorption of Dye in Simulated Water or Multiple Heavy Metals in Real Wastewater. Materials 2020, 13, 2498. [Google Scholar] [CrossRef]
  19. Wang, J.; Chen, H. Catalytic ozonation for water and wastewater treatment: Recent advances and perspective. Sci. Total Environ. 2020, 704, 135249. [Google Scholar] [CrossRef]
  20. Wang, B.; Zhang, H.; Wang, F.; Xiong, X.; Tian, K.; Sun, Y.; Yu, T. Application of heterogeneous catalytic ozonation for refractory organics in wastewater. Catalysts 2019, 9, 241. [Google Scholar] [CrossRef] [Green Version]
  21. Malik, S.N.; Ghosh, P.C.; Vaidya, A.N.; Mudliar, S.N. Hybrid ozonation process for industrial wastewater treatment: Principles and applications: A review. J. Water Process Eng. 2020, 35, 101193. [Google Scholar] [CrossRef]
  22. Sun, W.; Ma, G.; Sun, Y.; Liu, Y.; Song, N.; Xu, Y.; Zheng, H. Effective treatment of high phosphorus pharmaceutical wastewater by chemical precipitation. Can. J. Chem. Eng. 2017, 95, 1585–1593. [Google Scholar] [CrossRef]
  23. Cui, Z.; Tian, W.; Fan, C.; Guo, Q. Novel design and dynamic control of coal pyrolysis wastewater treatment process. Sep. Purif. Technol. 2020, 241, 116725. [Google Scholar] [CrossRef]
  24. Sun, W.; Sun, Y.; Zhu, H.; Zheng, H. Catalytic activity and evaluation of Fe-Mn@Bt for ozonizing coal chemical biochemical tail water. Sep. Purif. Technol. 2020, 239, 116524. [Google Scholar] [CrossRef]
  25. Calderon, B.; Smith, F.; Aracil, I.; Fullana, A. Green synthesis of thin shell Carbon-Encapsulated iron nanoparticles via hydrothermal carbonization. ACS Sustain. Chem. Eng. 2018, 6, 7995–8002. [Google Scholar] [CrossRef]
  26. Zheng, K.; Yang, R.; Wu, H.; Wang, G.; Yang, Y.; Li, Y. Application of the Perturbed-Chain SAFT to phase equilibria in the Fischer-Tropsch synthesis. Ind. Eng. Chem. Res. 2019, 58, 8387–8400. [Google Scholar] [CrossRef]
  27. Lu, H.J.; Chandran, K.; Stensel, D. Microbial ecology of denitrification in biological wastewater treatment. Water Res. 2014, 64, 237–254. [Google Scholar] [CrossRef]
  28. Wang, D.; Han, Y.; Han, H.; Li, K.; Xu, C.; Zhuang, H. New insights into enhanced anaerobic degradation of Fischer-Tropsch wastewater with the assistance of magnetite. Bioresour. Technol. 2018, 257, 147–156. [Google Scholar] [CrossRef]
  29. Zeeman, G.; Sanders, W.T.M.; Wang, K.Y.; Lettinga, G. Anaerobic treatment of complex wastewater and waste activated sludge—Application of an upflow anaerobic solid removal (UASR) reactor for the removal and pre-hydrolysis of suspended COD. Water Sci. Technol. 1997, 35, 121–128. [Google Scholar] [CrossRef]
  30. Wang, D.; Han, H.; Han, Y.; Li, K.; Zhu, H. Enhanced treatment of Fischer-Tropsch (F-T) wastewater using the up-flow anaerobic sludge blanket coupled with bioelectrochemical system: Effect of electric field. Bioresour. Technol. 2017, 232, 18–26. [Google Scholar] [CrossRef]
  31. Chen, H.; Lee, J.; Zheng, Y.; Duan, Q. A non-traditional energy transfer process in CWPO heterogeneous reaction for wastewater treatment. Chem. Eng. Res. Des. 2016, 114, 142–147. [Google Scholar] [CrossRef]
  32. Wei, J.; Shi, G.; Wang, N.; An, Q.; Ji, S. Removal of organic compounds from Fischer-Tropsch synthesis wastewater by pervaporation and electrodialysis. Membr. Sci. Technol. 2017, 37, 53–59. [Google Scholar]
  33. Baliban, R.C.; Elia, J.A.; Floudas, C.A.; Xiao, X.; Zhang, Z.; Li, J.; Cao, H.; Ma, J.; Qiao, Y.; Hu, X. Thermochemical conversion of duckweed biomass to gasoline, diesel, and jet fuel: Process synthesis and global optimization. Ind. Eng. Chem. Res. 2013, 52, 11436–11450. [Google Scholar] [CrossRef]
  34. Aljerf, L. High-efficiency extraction of bromocresol purple dye and heavy metals as chromium from industrial effluent by adsorption onto a modified surface of zeolite: Kinetics and equilibrium study. J. Environ. Manag. 2018, 225, 120–132. [Google Scholar] [CrossRef]
  35. Sun, W.; Zhou, S.; Sun, Y.; Xu, Y.; Zheng, H. W-Ag-Ti@γ-Al2O3 particle electrodes for enhanced electrocatalytic pretreatment of coal chemical wastewater. J. Environ. Chem. Eng. 2021, 9, 104681. [Google Scholar] [CrossRef]
  36. Guo, L.; Xiao, Z.; Sun, W.; Xu, H.; Xu, Y.; Zheng, H.; Sun, Y. Fischer–Tropsch synthetic wastewater treatment with Fe/Mn@CH: Catalytic ozonation and process evaluation. Sep. Purif. Technol. 2021, 276, 119274. [Google Scholar] [CrossRef]
  37. Chen, L.; Zhou, S.; Xu, Y.; Sun, Y.; Zheng, H. Effective glyphosate degradation through the combination of ozone/hydrogen peroxide oxidation and coagulation. Desalin. Water Treat. 2020, 204, 377–387. [Google Scholar] [CrossRef]
  38. Sun, W.; Sun, Y.; Shah, K.J.; Chiang, P.; Zheng, H. Electrocatalytic oxidation of tetracycline by Bi-Sn-Sb/γ-Al2O3 three-dimensional particle electrode. J. Hazard. Mater. 2019, 370, 24–32. [Google Scholar] [CrossRef]
Figure 1. Pretreatment hydrolysis acidification/AO combined process flow chart.
Water 14 02949 g001
Figure 2. Effects of synergistic ozone catalytic oxidation with different alkaline hydrolysates on the removal of volatile phenols and formaldehyde: (a) Ca(OH)2 and (b) NaOH.
Water 14 02949 g002
Figure 3. Effect of running time on treatment efficiency of the hydrolysis acidizing unit: (a) COD, (b) TN, and (c) NH3-N.
Water 14 02949 g003aWater 14 02949 g003b
Figure 4. Effect of running time on processing efficiency of the first-level AO unit: (a) COD, (b) TN, and (c) NH3-N.
Water 14 02949 g004aWater 14 02949 g004b
Figure 5. Effect of running time on processing efficiency of the two-stage AO unit: (a) COD, (b) TN, (c) NH3-N.
Water 14 02949 g005aWater 14 02949 g005b
Figure 6. UV spectral analysis of influent and effluent water.
Water 14 02949 g006
Table 1. Main quality indexes of resin wastewater.
ProjectspHCOD
(mg/L)
Volatile Phenol
(mg/L)
Formaldehyde
(mg/L)
Saline Matter
(mg/L)
Numerical value4–630,000–33,0002700–29002600–27003000–6500
Table 2. GC/MS analysis results of resin production wastewater.
CategoryNameChemical Formula
AlkanesDiethylsilaneC4H12Si
1-Methyl-1-silacyclobutaneC4H12Si
PhospholaneC4H9P
AcidsBoronic acid, ethyl-diethyl esterC6H15BO2
1-Butaneboronic acidC4H11BO2
Epoxy alkanes1,3-Dioxolane, 2,4,5-trimethylC6H12O2
1,4-DioxaneC4H8O2
PhenolsPhenolC6H6O
EstersButylisocyanatoacetateC7H11NO3
Methyl nicotinateC7H7NO2
NitrobenzeneParadinitrobenzeneC6H4N2O2
KetonesCyclopentanoneC5H8O
AldehydesPentanal,3-methyl-C6H12O
Table 3. Summary of main organic compound categories (mass percentage) by GC/MS analyses of treated water from each unit.
Type of SubstanceNumber of SpeciesRelative Content/%
Raw WaterEffluent WaterRaw WaterEffluent Water
Alkanes9325.328.74
Epoxy alkanes7716.0767.25
Esters13522.7911.23
Phenols318.361.76
Aldehydes208.040.00
Acids2410.133.64
Ketones634.071.63
Nitrobenzene213.561.89
Others1661.673.86
Publisher’s Note: MDPI stays neutral with regard to jurisdictional claims in published maps and institutional affiliations.

