
Evaluation and Mitigation of Flash Flood Risks in Arid Regions: A Case Study of Wadi Sudr in Egypt
by
 , , and
Elsayed M. Ramadan
1,
Hossny A. Shahin
2,
Hany F. Abd-Elhamid
1,3,
Martina Zelenakova
4,* and
Hazem M. Eldeeb
1 1
Department of Water and Water Structures Engineering, Faculty of Engineering, Zagazig University, Zagazig 44519, Egypt
2
El-Arish High Institute for Engineering and Technology, El-Arish 45511, Egypt
3
Center for Research and Innovation in Construction, Faculty of Civil Engineering, Technical University of Kosice, 042 00 Kosice, Slovakia
4
Environmental Engineering Department, Faculty of Civil Engineering, Technical University of Kosice, 042 00 Kosice, Slovakia
*
Author to whom correspondence should be addressed.
Water 2022, 14(19), 2945; https://doi.org/10.3390/w14192945
Submission received: 4 August 2022
/
Revised: 2 September 2022
/
Accepted: 13 September 2022
/
Published: 20 September 2022
(This article belongs to the Special Issue Water Supply System (WSS) Reliability, Safety and Risk Modelling & Assessment)
Abstract
:Flash floods threaten the lives of people and properties in different regions around the world, especially in arid and semi-arid regions due to infrequent flood events. The current study aims to assess the geomorphological parameters of Wadi Sudr, South Sinai in Egypt to evaluate flash flood risks and provide adequate mitigation methods. This study presents an integrated method that combines geographic information system (GIS) and watershed modeling system (WMS) with HEC-HMS to visualize and assess flood events in the study area. Different morphologic parameters of the watershed were determined, including linear, areal, and relief parameters. GIS was used to analyze the satellite images and determine the characteristics of the valley to get the extension and number of stream orders in the valley, then WMS was used to estimate rainstorms and basin characteristics, as well as estimate the amount of rain that causes flooding. HEC-HMS program was used for hydrological demonstration and precipitation overflow estimation. The morphometric analysis provided a quantitative portrayal of the Wadi Sudr watershed. Wadi Sudr has 4029 streams connected with seventh order of streams spread over an area of 547.45 km2. Based on the results of morphologic and hydraulic parameters of the watershed, two locations of protection dams were suggested. A comparison between the two locations was made to select the best location based on some criteria, including storage capacity, water depth behind the dam, width and shape of the valley, and the area covered by water stored in the reservoir. The comparison between the two locations showed that the first location is more appropriate for dam construction based on the examined criteria. The valley shape in the first location is more regular than in the second. The first location provided higher storage capacity and water depth in front of the dam than the second. The area covered by water and the width of the valley is less than the second. The stability of the dam at the first site could be higher and the cost of construction could cost be less than the second due to these reasons. A comparison was made using the weighted linear combination (WLC) method, which consists of 13 criteria to determine the suitability index (SI) in order to select the best location from the proposed locations. SI proved that the first location is better than the second. The designed dam in the selected site could be cost-efficient to protect the study area from flood risks and harvesting water that can be used in different purposes. This methodology can be applied in different areas for mitigating flash flood risks.
1. Introduction
Flooding is one of the most dangerous phenomena that have many dangerous effects on rural and urban areas. Floods may destroy buildings, threaten the lives of people and living creatures, cut roads, and destroy infrastructures. Evaluation and mitigation of flash floods effects is a crucial issue to protect properties and the lives of people. Egypt’s northern coasts and the Sinai Peninsula are the parts of Egypt that has been affected by flash floods in the last decades. One of the most significant Wadies in Sinai is Wadi Sudr that has a significant tourist city.
A number of studies have been carried out to evaluate flash floods in different Wadies in Sinai including Wadi Sudr. Fathy et al. [1] evaluated different hydrologic models to obtain the best model that simulates runoff hydrograph for Wadi Sudr, Sinai, Egypt. The watershed modeling system (WMS) package was used for the comparison between three different models, including lumped (HEC), semi-distributed (HEC-HMS), and distributed (GSSHA). It was found that there is a great agreement between distributed model outputs and the corresponding streamflow measurements. The integration of hydrological model with numerical weather prediction (NWP) model has been applied for flash flood forecasting. Giannaros et al. [2] used the weather and research forecasting (WRF) mesoscale atmospheric model and the integrated multi-satellite retrievals for global precipitation measurement (GPM-IMERG) algorithm. The hydrologic engineering center hydrologic modeling system (HEC-HMS) was also used for estimating streamflow in the watershed. Yucel [3] investigated the hydrological response of the Ayamama Basin to the precipitation event using the precipitation forcing in the HEC-HMS model to check the capability of estimated precipitation products from nowcasting (radar and HE) and forecasting systems (WRF) against observed precipitation (rain gauge). Lotfy [4] found that the rainfall gauge network is a key driver for hydrologic modeling to evaluate flash flood runoff. Four scenarios for the creation of rain surfaces and their effects on the estimated runoff of Wadi Sudr in the Sinai Peninsula were studied. Dewidar [5] used GIS to determine the morphometric parameters of the Wadi El-Gemal Basin on the Red Sea coast. In addition, Abdel-Latif and Sherief [6] used geographic data frameworks and distant detecting to separate new waste organizations with more subtleties to get ready regular peril guides of channel Sudr and watercourse Wardan, which are almost opposite toward the eastern side of the Gulf of Suez, Egypt.
Another study was conducted for the Ras Sudr area by El-Bihery [7]. The study showed that the Quaternary aquifer is the most prospective in the Ras Sudr area (the delta of Wadi Sudr). MODFLOW code was applied to designing a three-dimensional groundwater flow model. SEAWAT was also applied to simulate variable-density flow and seawater intrusion from the west. El-Behiry et al. [8] prepared a quantitative investigation of geo-morphometric boundaries to outline watershed of the Wadi Ghoweibba Basin in the Ain Sukhna zone, western side of the Gulf of Suez, Egypt. It was found that the quantitative analysis of the computed geomorphometric parameters of the Ghoweibba Valley Basin was used to decipher the flood risk areas and to create an effective scheme to mitigate the risks. El-Sayed and Habib [9] revealed that the Sinai Peninsula falls within an arid belt that crosses northern Africa and southwestern Asia. Several flash floods were recorded in south Sinai, which resulted in significant infrastructural damages, inhabitants’ displacement, and sometimes loss of lives. The study examined the utility of a physically based distributed hydrologic model to simulate rainfall-runoff response in Sinai. Data were collected and compiled from the available rain gauges in the studied catchments. Overland hydraulic properties and soil hydraulic parameters were varied according to combined classifications of soil type and land-use maps. Results showed suitable agreement between GSSHA simulated hydrographs and streamflow measurements.
Some studies have been carried out to evaluate flash floods around the world such as Shaikh and Farjana [10], which utilized GIS to examine the Eru stream Basin, a subwatershed of Mahi waterway, Rajasthan, India. In addition, Soni et al. [11] used GIS in the waste depiction in Rachhar Nala, Anuppur District of Madhya Pradesh. Thakur et al. [12] presented a morphometric examination of the Balawal watershed in Jammu Province of Jammu and Kashmir State to assess the waste boundaries and basin qualities. Abdul Rahaman et al. [13] studied the integration of using GIS in the evaluation of morphological qualities of watersheds with multi-standards dynamic (MCDM) through a fluffy logical chain of importance measure procedures to decide its flash flood prioritization. Javed et al. [14] considered the morphometric and land-use qualities for prioritization of sub-watersheds utilizing far-off detecting and GIS strategies, it was concluded that the sub-watersheds were classified into three categories as high, medium, and low in the order of priority to the conservation and management of natural resources. Moreover, in the last decades despite the improvements in flood mitigation measures and technological advancements, floods continue to endanger human lives, especially when ephemeral streams cross-urban centers (Chatzichristaki et al. [15]; Diakakis et al. [16]). Omran et al. [17] examined the flood hazard map in the Dahab Basin and it was discovered that 34% of the all-out subbasins in the Dahab Basin had a high risk of flooding, and 60% of all subbasins have a medium flood hazard. Negm et al. [18] concluded that the ecological security of neighborhoods from the danger of abrupt flooding requires a fundamental assessment of pinnacle release and postpone time. The created conditions permit the expectation of deferring time with an exactness of 7% for mistakes and pinnacle release with precision under 14% for a blunder, permitting security of Wadi Sudr from the dangers of fast flooding.
Floods are a genuine, grievous occasion that can happen anywhere. Regions inclined to flooding and waterlogging ought to be recognized to foresee spatial circulation. To take care of this issue and advance the appraisal strategies, a random forest-based model was proposed for the investigation as per the hypothesis of the flood system by Wang et al. [19]. Stefanos and Stathis [20] utilized the formation of the investigative chain of importance and GIS cycle to survey flood possibility. Morphometric and hydrographic properties of watersheds were determined. Nektarios and George [21] built up a flood executives plan comprising of two parts: a proper flood boarding procedure and the distinguishing proof of flood hazard regions. The investigated region was partitioned into five subregions with various degrees of flood hazard from extremely low to exceptionally high. Gabr and El Bastawesy [22] analyzed the issue of blaze floods in the watersheds of the oil creation zone in Ras Sudr. Abd-Elhamid et al. [23] used GIS and WMS for evaluating flood risks in the area located at a distance of 7.50 km from El Gouna city along the Red Sea and east of Hurghada–Al Ismaileya road. The results indicated that the site is exposed to high flash flood risk and protection work is required. They suggested using three dams and four channels to protect the area from flood risks. Abd-Elhamid et al. [24] examined the effect of using different digital elevation models (DEM) from different websites on the accuracy of watershed management. Many websites offer DEM, including SRTM, GTOPO30, and ASTER GDEM, however the accuracy of each one varies, and choosing a tiny DEM size also yields accurate information, but the analysis takes a while. To evaluate these models’ correctness and choose the most accurate one for the application, three case studies were examined in Sinai.
Some techniques have been used to mitigate flash flood risks. Orabi et al. [25] identified four unique drainage basins for catchment areas in western central Sinai to consider flash flood risks. The implemented technique discovered that hydrological and morphometric parameters play essential roles in contributing factors to flash floods. The employed method revealed that the hydrologic and morphometric parameters play crucial roles in contributing to flash floods. Flood risk management relies heavily on the integration of hydrologic indices, sediment transport, and topographic wetness indices with morpho-tectonic characteristics to provide sedimentation linked to flash floods. Runoff water harvesting is regarded as a crucial method for solving water scarcity in arid and semi-arid settings, according to Elewa et al. [26]. To use a multiparametric decision spatial model, eight effective RWH characteristics were selected: the overland flow distance, yearly flood volume, drainage density, maximum flow distance, infiltration number, watershed slope, watershed area, and watershed length. The watershed was divided into five categories of RWH potential on the ensuing MPDSM map, ranging from extremely low to very high. Abd-Elhamid et al. [27] identified water scarcity in arid and semi-arid regions as representing a significant obstruction to social and economic development. Integrated hydrological models, including geographic information systems, watershed modeling systems, and groundwater modeling systems, were used. The results showed that the dams could collect about 160.72 million m3 of rainwater that can be stored or recharged into groundwater aquifers. According to Fathy et al. [28], roadways in arid areas are particularly vulnerable to flooding damage. This necessitates a thorough examination of the amount, timing, and direction of the flood so that the appropriate safety precautions may be designed. This can be used to create flood mitigation strategies to safeguard the roadways from flood risks. To reduce the risk of flooding in the area, a protection system of seven channels and two culverts was suggested.
This study aims to evaluate and mitigate flash floods effects in Wadi Sudr, Egypt, as the Wadi Sudr region is exposed to flash flood events that cause disasters and destruction in the region. The methodology of this research depends on integration between remote sensing based on analysis of satellite images to predict stream morphometric parameters for the Wadi and using numerical models such as watershed modeling system software (WMS) to estimate the expected volume of runoff and select the more appropriate locations for flood protection. The study is based on evaluating the number of floods that occurred due to the rainstorm, reaching the best places for harvesting torrential waters, preserving lives and properties, proposing and selecting the best sites for construction of protection dams, and determining the characteristics of the dams according to the study results of the expected flood volumes.
2. Study Area
2.1. Location and Land Use
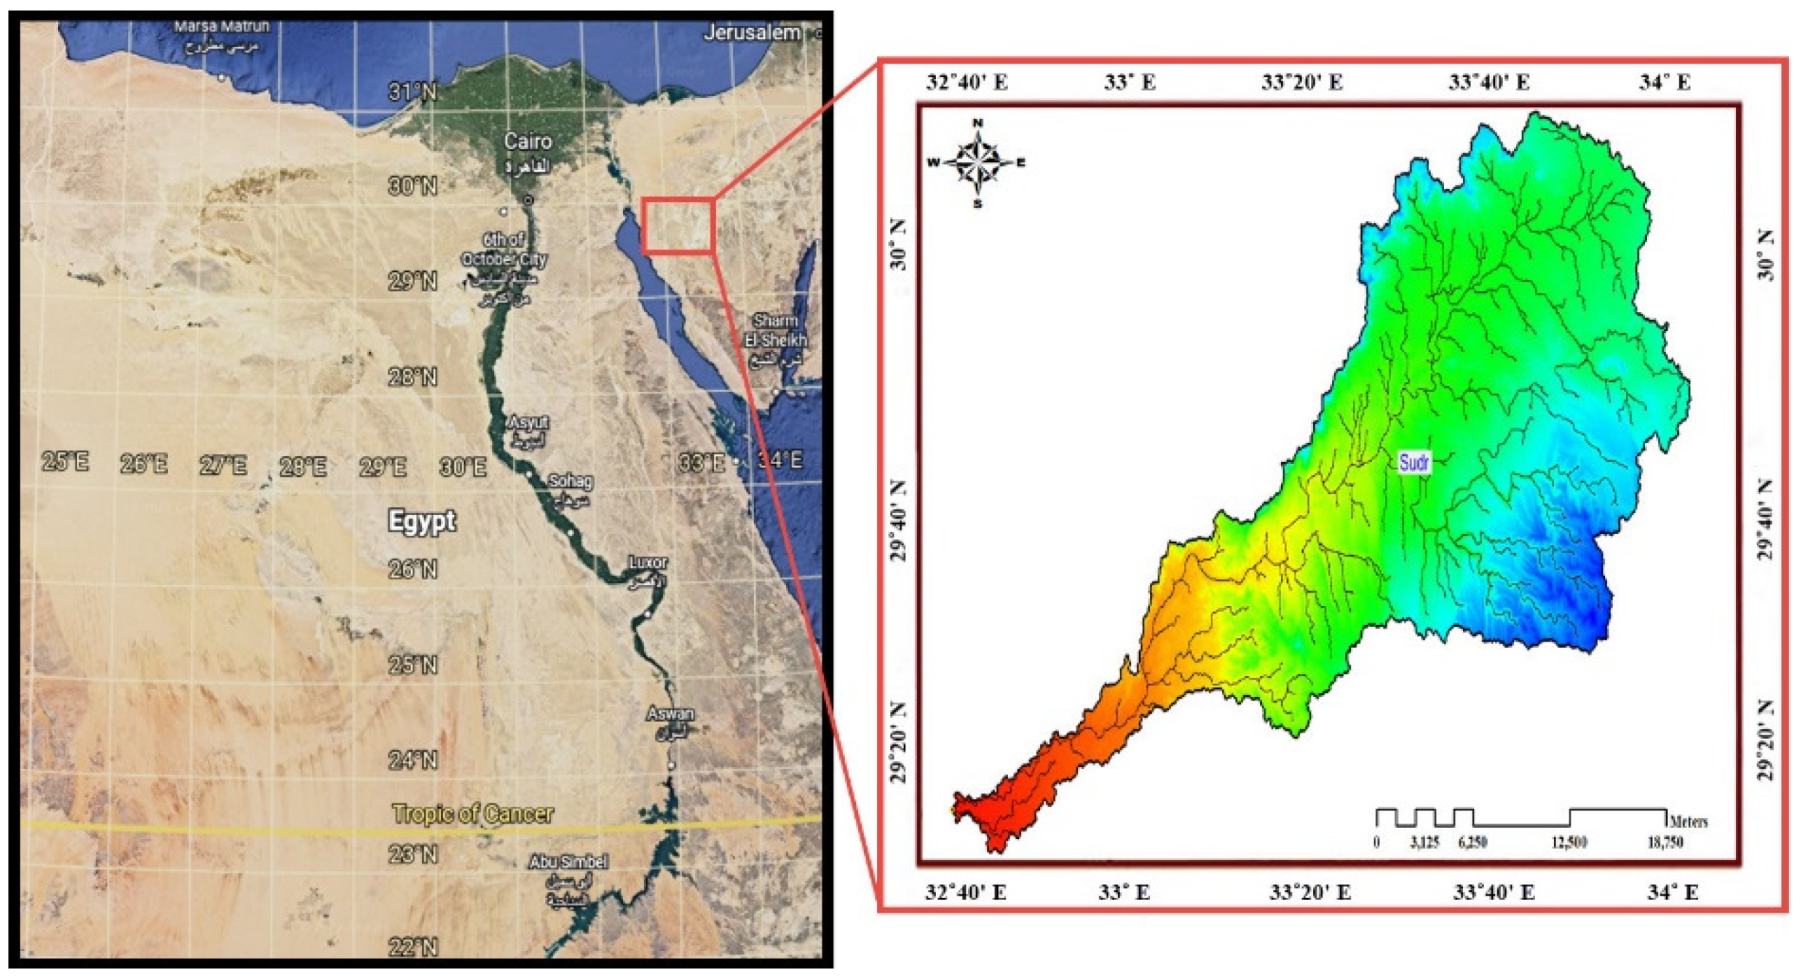
Ras Sudr is an Egyptian city located on the Gulf of Suez on the coast of the Red Sea and belongs to South Sinai Governorate. One of the most significant wadies and waterways in the Sinai Peninsula is Wadi Sudr, which is located in the southwest of the peninsula between Latitude 29°35′ and 29°55′ N and Longitude 32°40′ and 33°20′ E. Wadi Sudr drains water into the Gulf of Suez near the town of Ras Sudr and has a total area of 550 km2. One of the most significant valleys in the Sinai Peninsula is Sudr Valley (Figure 1). Ras Sudr city is one of the major tourist destinations, which is located across from Wadi Sudr. A 95 km-long beach offers swimming and other water sports in Ras Sudr. Sinai Bedouins from Wadi Sudr regions live in the bulk of the town and its surrounding areas. The primary north-south route divides the two residential neighborhoods that makeup Ras Sudr. Workers, who primarily come from Egypt’s Nile Delta and Nile Valley governorates, are housed locally on one side. The other is made up of second homes for vacations and private villa dwellings for professionals, most of whose owners are from the Egyptian capital “Cairo”.
2.2. Climate Conditions
The Sinai Peninsula has a climate that is comparable to other desert areas across the world. It experiences severe aridity, long, hot, and dry summers, and mild winters [6]. During the winter, some sections of Sinai experience brief but significant rainfall, which causes Wadi beds to overflowing and occasionally creates flash floods that inflict damage to roads and occasionally even human lives. In Wadi Sudr, the seasons are lengthy in the summer (April to October) and short in the winter (November to December), with a transitional period from January to March [29]. The evaporation in this region is highly important since, depends on variables including temperature, relative humidity, wind speed, plant cover, and solar radiation. Evaporation values are typically higher than precipitation values. The rate of evaporation varies depending on the specific area [30]. Arid weather is defined as having a relative humidity of less than 50%, semi-arid weather as having a relative humidity between 60% and 70%, and humid weather as having a relative humidity of greater than 70%. Therefore, Wadi Sudr is regarded as a semi-arid area.
2.3. Geological Setting of Wadi Sudr
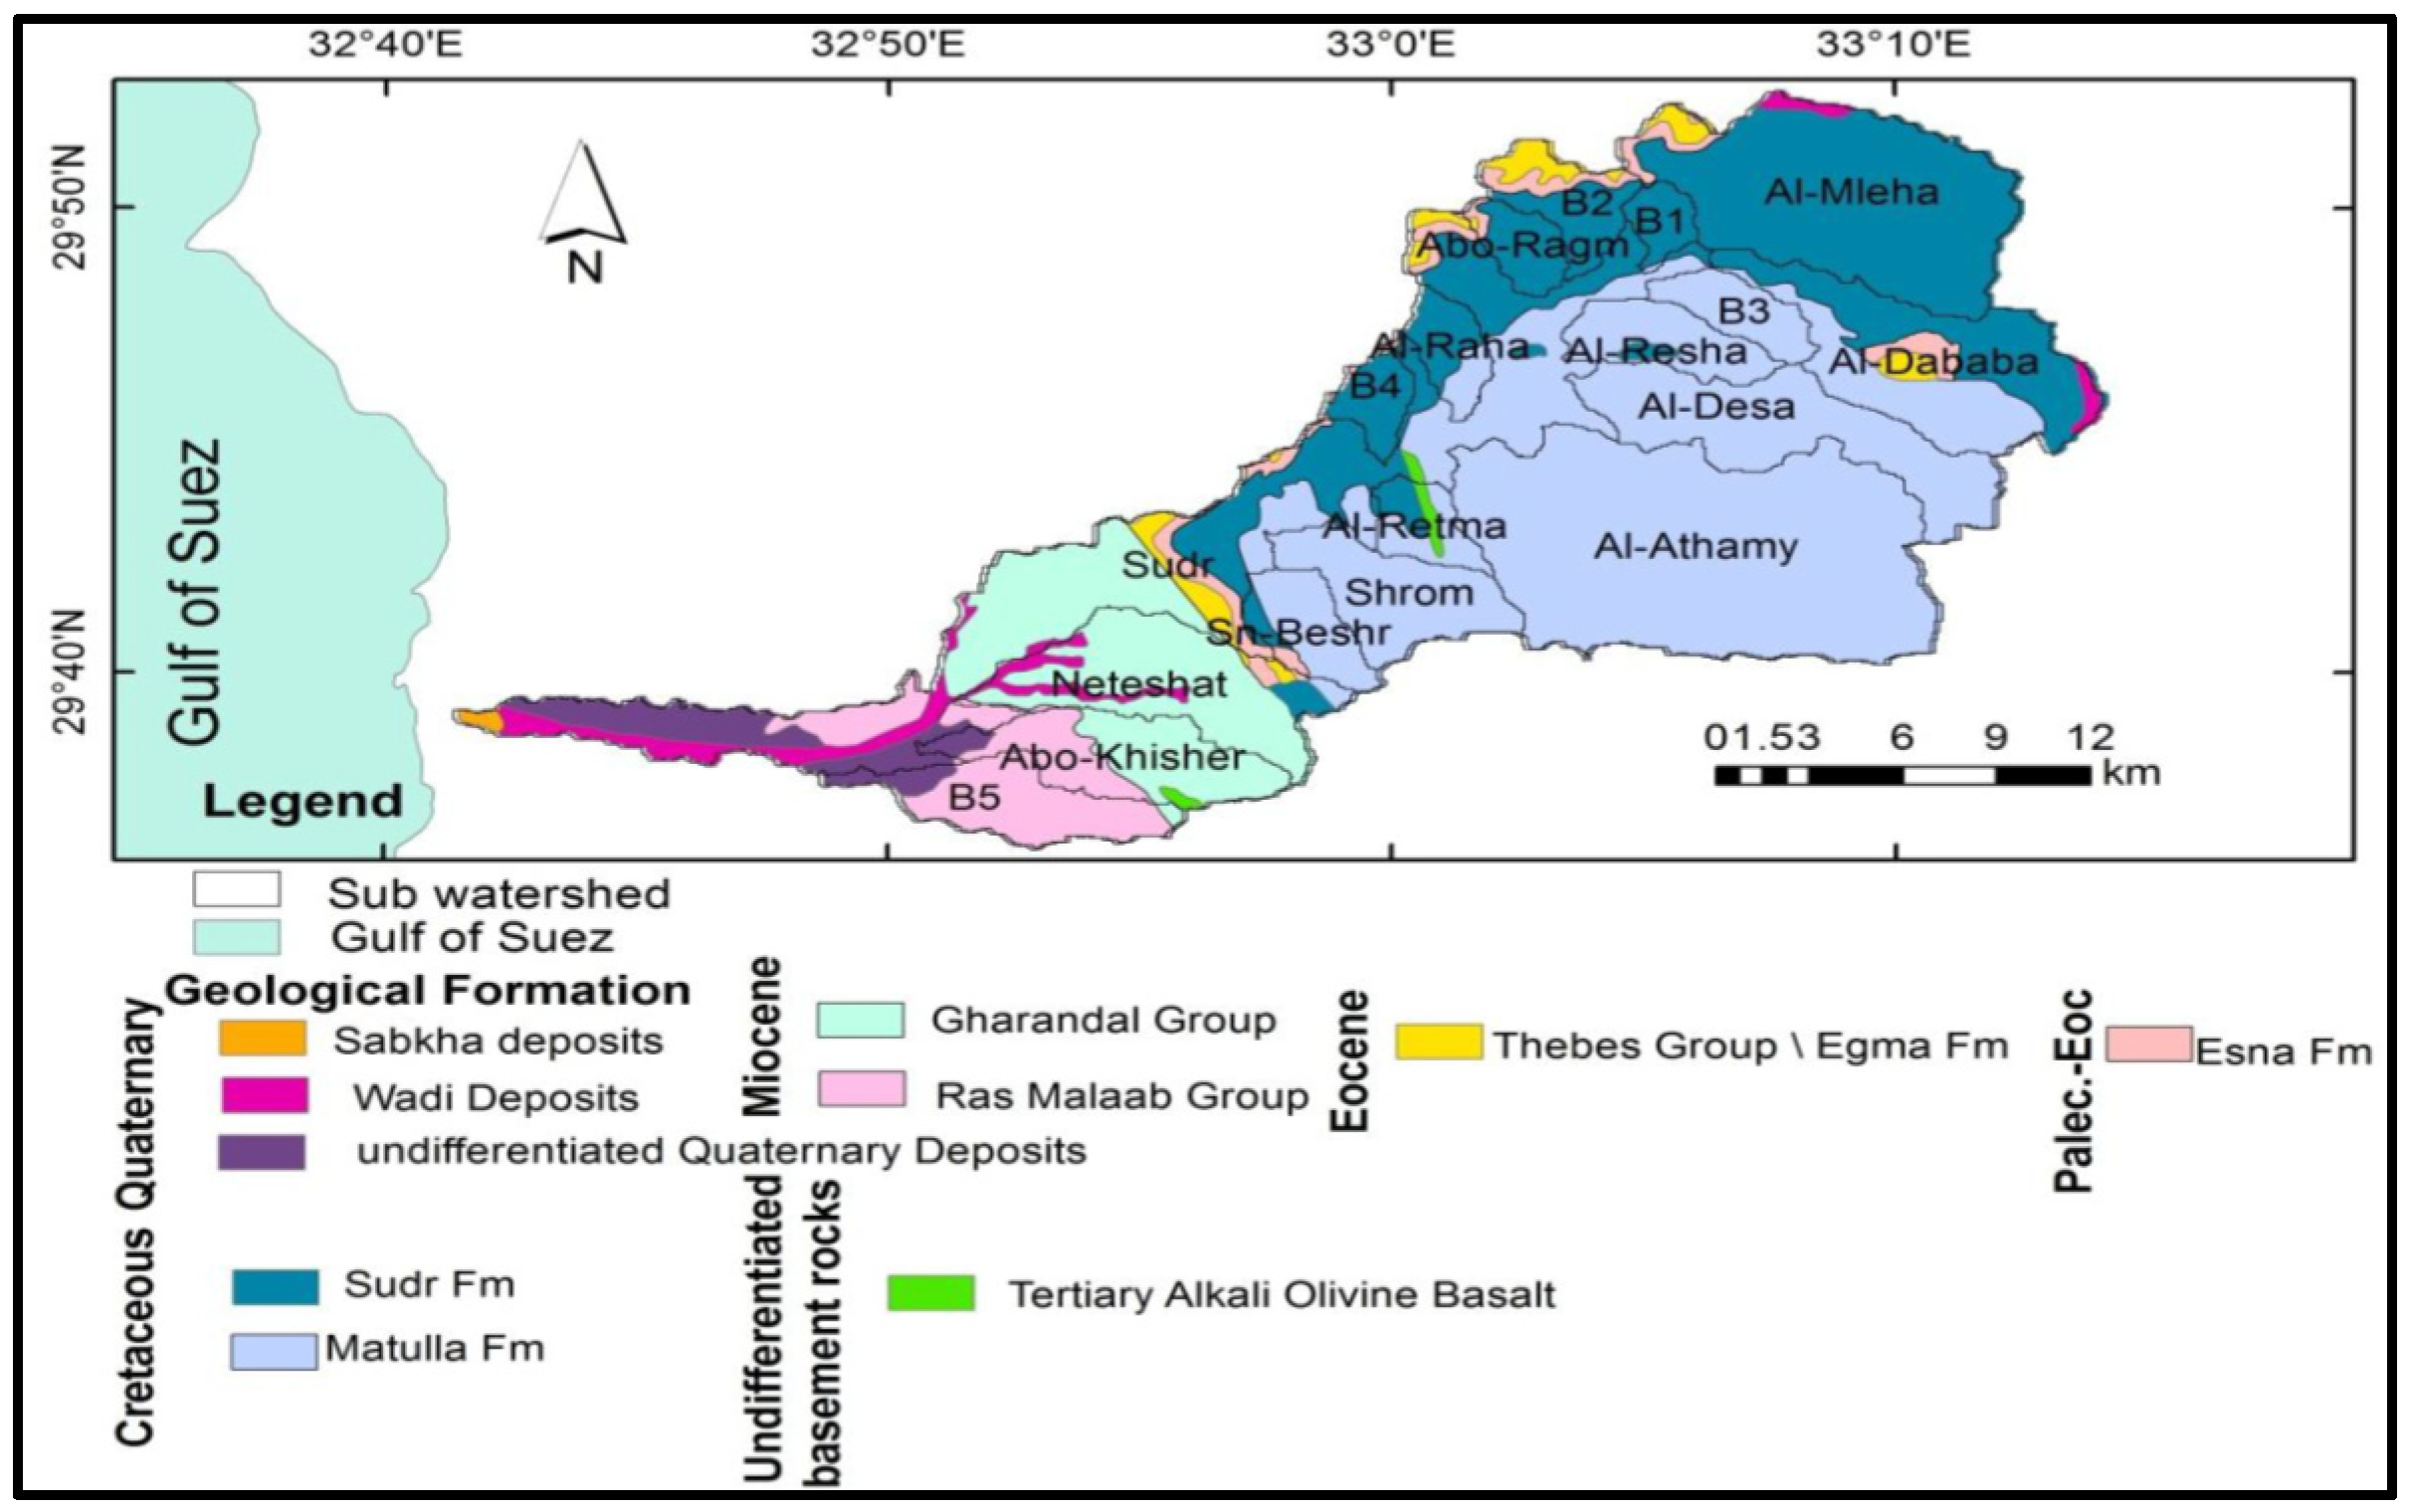
Some scientists have investigated the geology of Sinai and Wadi Sudr. According to previous studies, geological maps of Sinai, and the geological survey, the geological formation of the study area is depicted in Figure 2 and categorized as follows:
- ▪
- Wadi floors include sediments from the Quaternary age. These deposits primarily consist of soft gravel. The origin of these deposits, the slope, the basin size, and the width of the Wadi all affect how they vary from one Wadi to the next.
- ▪
- Salt pan deposits from the Quaternary age have intertwined with the playa. The primary constituents of sabkha sediments are typically carbonates, evapotranspiration, fluviatile, aeolian, and marine detritus, which are occasionally cemented with carbonate or gypsum.
- ▪
- The primary channels of the examined wadies are covered in Pleistocene and Holocene sediments, which constitute Quaternary deposits. Alluvial, Wadi, and Sabkha deposits make up most of these deposits.
- ▪
- Sandy shales with intercalations of phosphatic marl and limestone make up the Cretaceous Matulla Formation.
- ▪
- Chalk and dolomitic limestone are the main components of the Sudr formation, which is of Cretaceous age.
- ▪
- The Gharandal group is represented by the Uyun Musa Formation (Middle-Lower Miocene age), which is composed of green gypsiferous fossiliferous clays intercalated with sandstones and marls, and the Sumar Formation (Lower Miocene age), which is represented by gypsiferous yellowish green shale and gray to white intercalation with a thin.
- ▪
- The Kareem Formation (Middle Miocene age), which consists of clastics with interbedded anhydrite and sporadic limestone, the Belaim Formation (Middle Miocene age), which consists of intercalation of evaporates and marl, and the Hammam Phrayuon Formation (Middle Miocene age), which consists of two main facies, are the representative formations of the Ras Malab group. The first is calcareous facies made up of argillaceous limestone with interbeds of shale and marl, while the second is shaky facies made up of shale, marl, and sandstone. Anhydrite shales and a few trace amounts of sand make up the South Gharib Formation, which is of the Upper Miocene age. Vapors with clastic intercalation make up the Zayt Formation.
- ▪
- Extrusive basaltic rocks (Olivine basalt).
- ▪
- Chalky limestone with flint bands and nodules at the base and thin, succeeding chert bands on top make up the Egma Formation (Eocene age).
- ▪
- Paleocene-era Esna Formation is composed of a grayish-yellow marly limestone band in the center of a dark-green shale matrix. It is layered between the Thebes Formation and the Sudr Formation.
3. Methodology
This study’s main goals are to create a new stream network, demonstrate morphometric analysis of the watershed, choose an appropriate location for a protection dam, and design the necessary dams to reduce the danger of flooding in the study region. To achieve these goals the study has been carried out in two steps: determine morphologic parameters of the watershed and analysis of the study area then design the protection dams. The following sections describe the steps followed to accomplish these goals.
3.1. Morphologic Analysis of the Study Area
The morphological parameters of the investigation zone were investigated utilizing a digital elevation model (DEM) with a resolution of 15 m obtained from SRTM (shuttle radar topography mission data) that was transferred by WMS, which were accordingly refined by geological lines, spot statures, and streams. The top sheet of scale (1:25,000) was sent out to a geographic information system (GIS), climate (Arc GIS 10.5 programming). Guides have been changed over to universal transverse Mercator (UTM) map view and WGS 1984 to be viable with various GIS topical layers. Then a drainage network was sent out to GIS to characterize stream order and determine the length and number of each stream order for all basins.
Morphometric properties for the watershed were determined based on the equations recommended by Horton [31,32] and Strahler [33,34]. Furthermore, Faniran [35], Schumm [36], and Miller [37] were summarized in Table 1. Different morphometric parameters were characterized into three types:
- Linear parameters of the watershed: stream order (Nu), bifurcation ratio (Rb), mean bifurcation ratio (Rbm), stream length (Lu), mean stream length (Lsm), and stream length ratio (RI).
- Areal parameters of the watershed: drainage density (Dd), stream frequency (Fs), texture ratio (Dt), infiltration number (If), length of overland flow (Lg), elongation ratio (Re), circularity ratio (Rc), and form factor ratio (Rf).
- Relief parameters of the watershed: basin relief (H), relative relief (Rhb), relief ratio (Rh), and roughness number (HD).
These parameters were determined using GIS. The different formulas used for the calculation of morphometric properties are shown in Table 1.
Through the upgraded version of WMS, five maps were downloaded that help in accurate analysis of the area and these maps are: (1) world imagery, (2) world topography, (3) STRM worldwide elevation data (3-arc second resolution), (4) global land cover, and (5) harmonized world soil database V 1.1, besides specifying sufficient information about the zone such as the universal transverse Mercator (UTM) map show and WGS 1984. The primary drainage module of WMS 11.0 programming was used to extract the drainage network, followed by its submodules using the topographic parameterization program (TOPAZ) program (AQUAVEO, 2019). To compute stream bearings and stream collections for use in basin elaboration with DEMs, an altered version of this application is distributed with the WMS programming.
The SRTM and land-use data were combined to create the DEM with a 15 m resolution. As a philosophy, we decided on the SCS method, composite curve numbers (CN) for invasion limit, and spillover. The amount of rainfall that falls on the basin has been entered, and estimates of the composite bend (CN) based on the quality of the soil (Soil), land use, and cover have been made. In addition, determine the concentration period, compute the lag period, and determine the slope. Since the Wadi Sudr Basin’s CN value was 94, precise information could be provided regarding the time the stream peaks (time of peak), the amount of water released per second (peak releases), and the total volume of moving water in the basin.
3.2. Selection of the Protection Dam Location and Design of the Dams
This section presents the criteria for selecting the location of the protection dam. The location of the dam was chosen according to some criteria. The most important one is the dam located in the narrowest area in the course of the valley. Moreover, the proposed location provides the largest capacity for the amount of stored water, which reduces the total construction cost of the dam. Furthermore, topographically, the dam location has the natural shoulders to provide adequate dam support. Consequently, two places were chosen that met these conditions. The dam was designed, and the amount of stored water and the storage capacity that accommodates the size of the flood in the area were investigated. Furthermore, a comparison was made between the two proposed places that comply with the site conditions and specifications.
4. Results and Discussion
4.1. Morphologic Parameters of Wadi Sudr
The morphometric analysis was calculated using the suggested methodology for the current study area. The study provided information on the basin’s drainage features and runoff potential. The following sections summarize the findings for the three different watershed parameter groups.
4.1.1. Linear Parameters of the Watershed
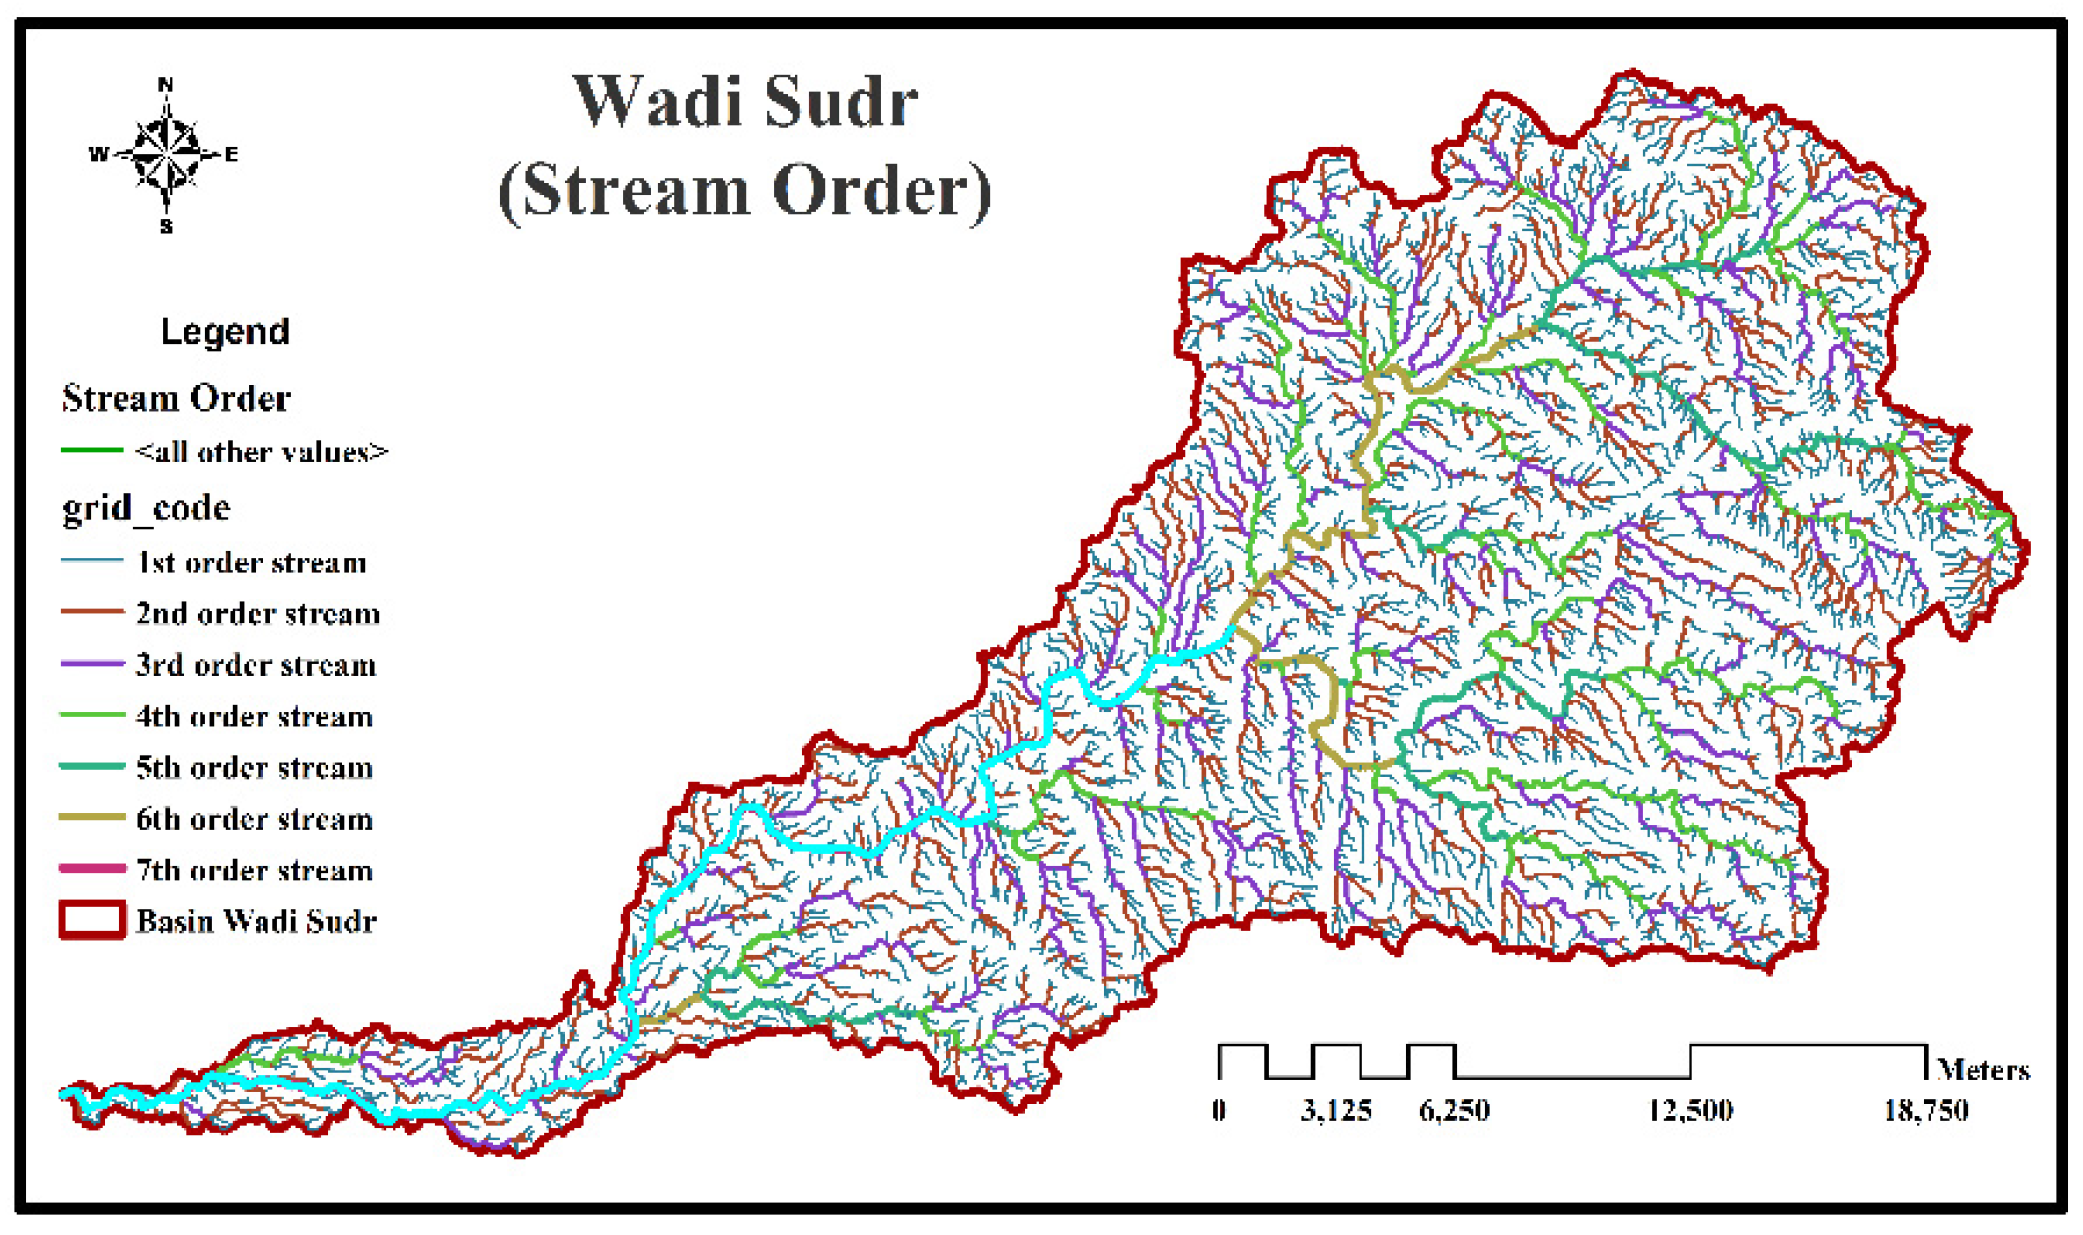
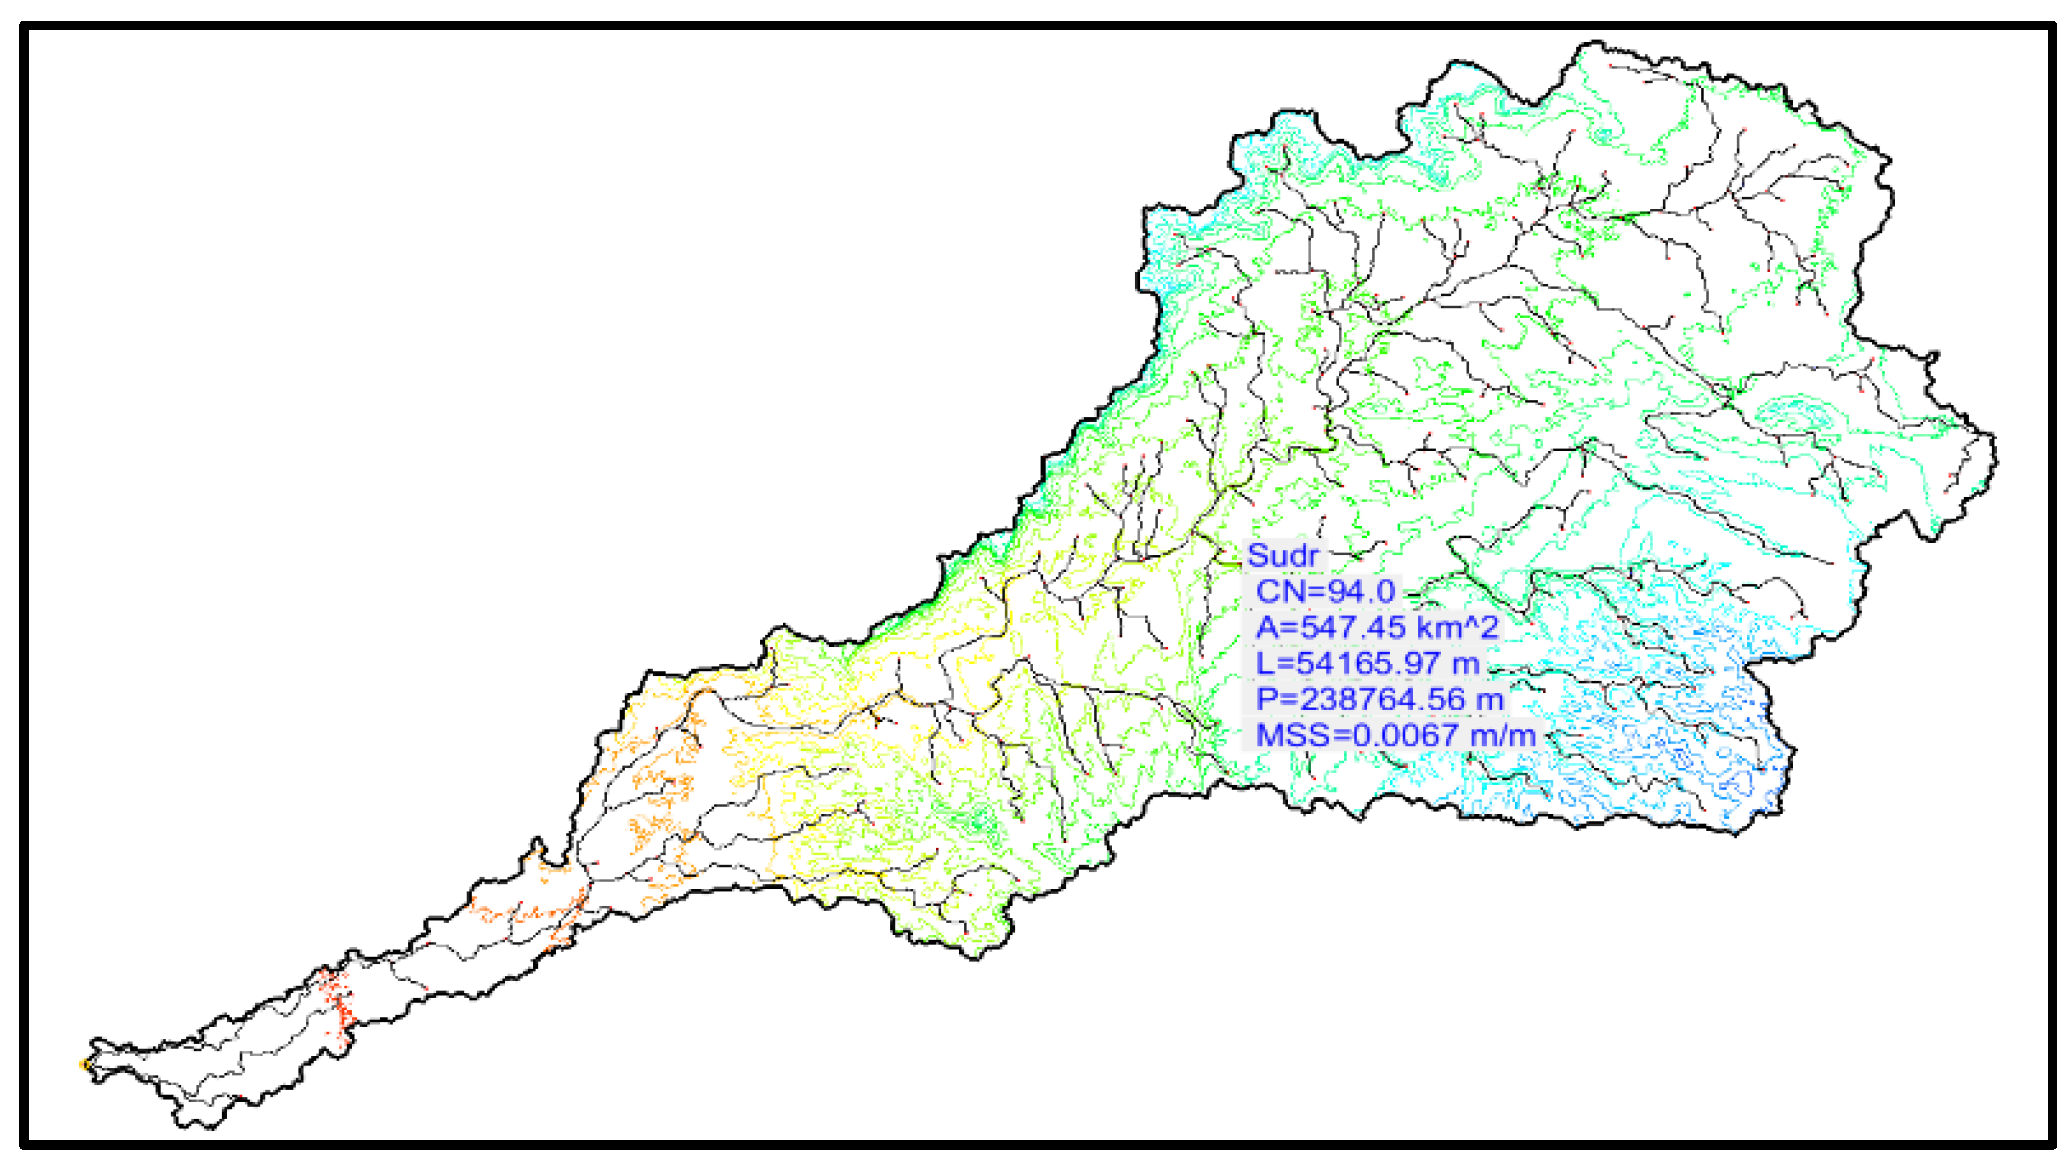
The stream length (Lu), bifurcation ratio (Rb), and stream order (Nu) are the main linear watershed parameters. Figure 3 depicts the watershed’s stream order for the Wadi Sudr Basin. The number of streamlines inside a watershed for a certain class of stream order, or the number of stream parts of various orders, is known as the stream number (Nu) [34]. There are 4029 streams in Wadi Sudr that are related to the seventh order of streams, covering an area of 547.45 km2. A number of streams of 3118, 693, 166, 40, 9, 3, and 1 from the first through seventh orders were observed. As indicated in Table 2, Wadi Sudr contains the seventh-order standard.
According to Horton [32], stream length is the total length of all streams that appear to have the same stream order. The total length of the stream, divided by the number of portions in that order, is the mean stream length. The main Sudr subwatershed’s highest and lowest orders could both be shown to have different mean stream lengths. In the first stream order, the mean length value was 0.327 km, whereas it was 48.778 km in the fifth order. The shift in geological height and the inclination of the area, where it was held in place by cellar rocks, may have caused the deviation. Additionally, it was found that the first, second, third, fourth, fifth, sixth, and seventh stream orders, separately, have normal current lengths in Wadi Sudr of 0.327, 0.748, 1.576, 3.539, 5.488, 9.394, and 48.778, respectively as indicated in Table 2. The stream length ratio was defined by Horton [32] as the ratio of the average stream length of the next lower order (u − 1). to the typical stream length of order (u) According to Table 2, the stream length ratio for Wadi Sudr changed from 0.349 to 1.731.
According to Strahler [34], the bifurcation generally occurs in watersheds where the geologic formations do not bend the waste example, between 2.0 and 5.0. Additionally, basins with low bifurcation ratios are spherically perfect, allowing spillover to pause while framing a dramatic peak of runoff [34]. In Wadi Sudr, the effect of the bifurcation ratio was more than 2. Wadi Sudr Basin’s bifurcation proportion shifted from 3 to 4.5, showing that the geologic features were not bent to fit the waste scenario. According to Table 2, the bifurcation ratio for the first, second, third, fourth, fifth, and sixth stream orders in Wadi Sudr was 4.500, 4.175, 4.150, 4.444, 3.000, and 3.000, respectively. The average bifurcation proportion in Wadi Sudr was 3.324, demonstrating that the trash example was not twisted by the geologic formations.
4.1.2. Areal Parameters of the Watershed
The watershed areal parameters include a number of parameters that are analyzed in this section. Drainage density (Dd) was presented by Horton [32], as the proportion of absolute stream length inside a basin to the basin zone. It gives a thought regarding the physical properties of the basic rocks in the investigation territory. According to Table 3, drainage density for Wadi Sudr is 3.777 km−1 showing delicate inclines, low precipitation, and penetrable, cracked, profoundly jointed bedrock. Smith [35] categorized drainage texture ratio (Dt) and seepage surfaces into five classes, extremely coarse (<2), coarse (2–4), moderate (4–6), fine (6–8), and exceptionally fine (>8). The seepage surface relies on various normal factors. The waste surface for the Wadi Sudr watershed is 16.878. This worth is higher than 8, showing an extremely fine drainage texture. Horton [31] characterized stream frequency (Fs) as the number of streams per unit region. It may be seen from Table 3, where as the estimation of the stream recurrence of Sudr Valley was 7.361 km−2 and the worth was high, which demonstrates that the stream recurrence (Fs) increments with the expansion in seepage thickness (Dd), showing the dangers it might occur here.
Infiltration number (If) was characterized by Faniran [35] as the result of seepage thickness and stream frequency and given a thought regarding the invasion qualities of the watershed. The higher the infiltration number, the lower will be the invasion, and subsequently, the higher will be surface overflow. It was likewise discovered that the invasion number in Wadi Sudr had an estimation of 27.803, as shown in Table 3, as the worth was high, which additionally had the higher estimations of drainage density, showing a high spillover plausibility and low groundwater energizing probability. Length of overland flow (Lg) is the length of water over the ground before it gets gathered into distinct stream channels. Basins of long overland streams actuate high penetration and are generally safe from hazard flooding. The length of an overland stream for Wadi Sudr was 0.132 km. Form factor ratio (Rf) was defined by Horton [31] as the proportion of the region of the basin to the square of the length of the basin. For a roundabout basin, the worth ought to be more prominent than 0.78. Wadi Sudr watershed had a less form factor of 0.132, demonstrating extended shape. The structure factor of Wadi Sudr demonstrates that the basin will have a complement pinnacle of a stream for a longer span.
Elongation Ratio (Re) is a parameter that shows the zones have high invasion limits and low spillover. These qualities can be assembled into three classifications in particular: round (>0.9), oval (0.9 to 0.8), and less stretched (<0.7) [38]. The fundamental Sudr watershed had a lower prolongation ratio of 0.487 showing lengthened shape. Circularity ratio (Rc) estimation, for the most part, changes from 0 (a line) to 1 (circle). The higher the estimation of circularity proportion, the more the round state of the basin and the other way around [10]. The circularity ratio for Wadi Sudr was 0.121, demonstrating an extended shape.
4.1.3. Relief Parameters of the Watershed
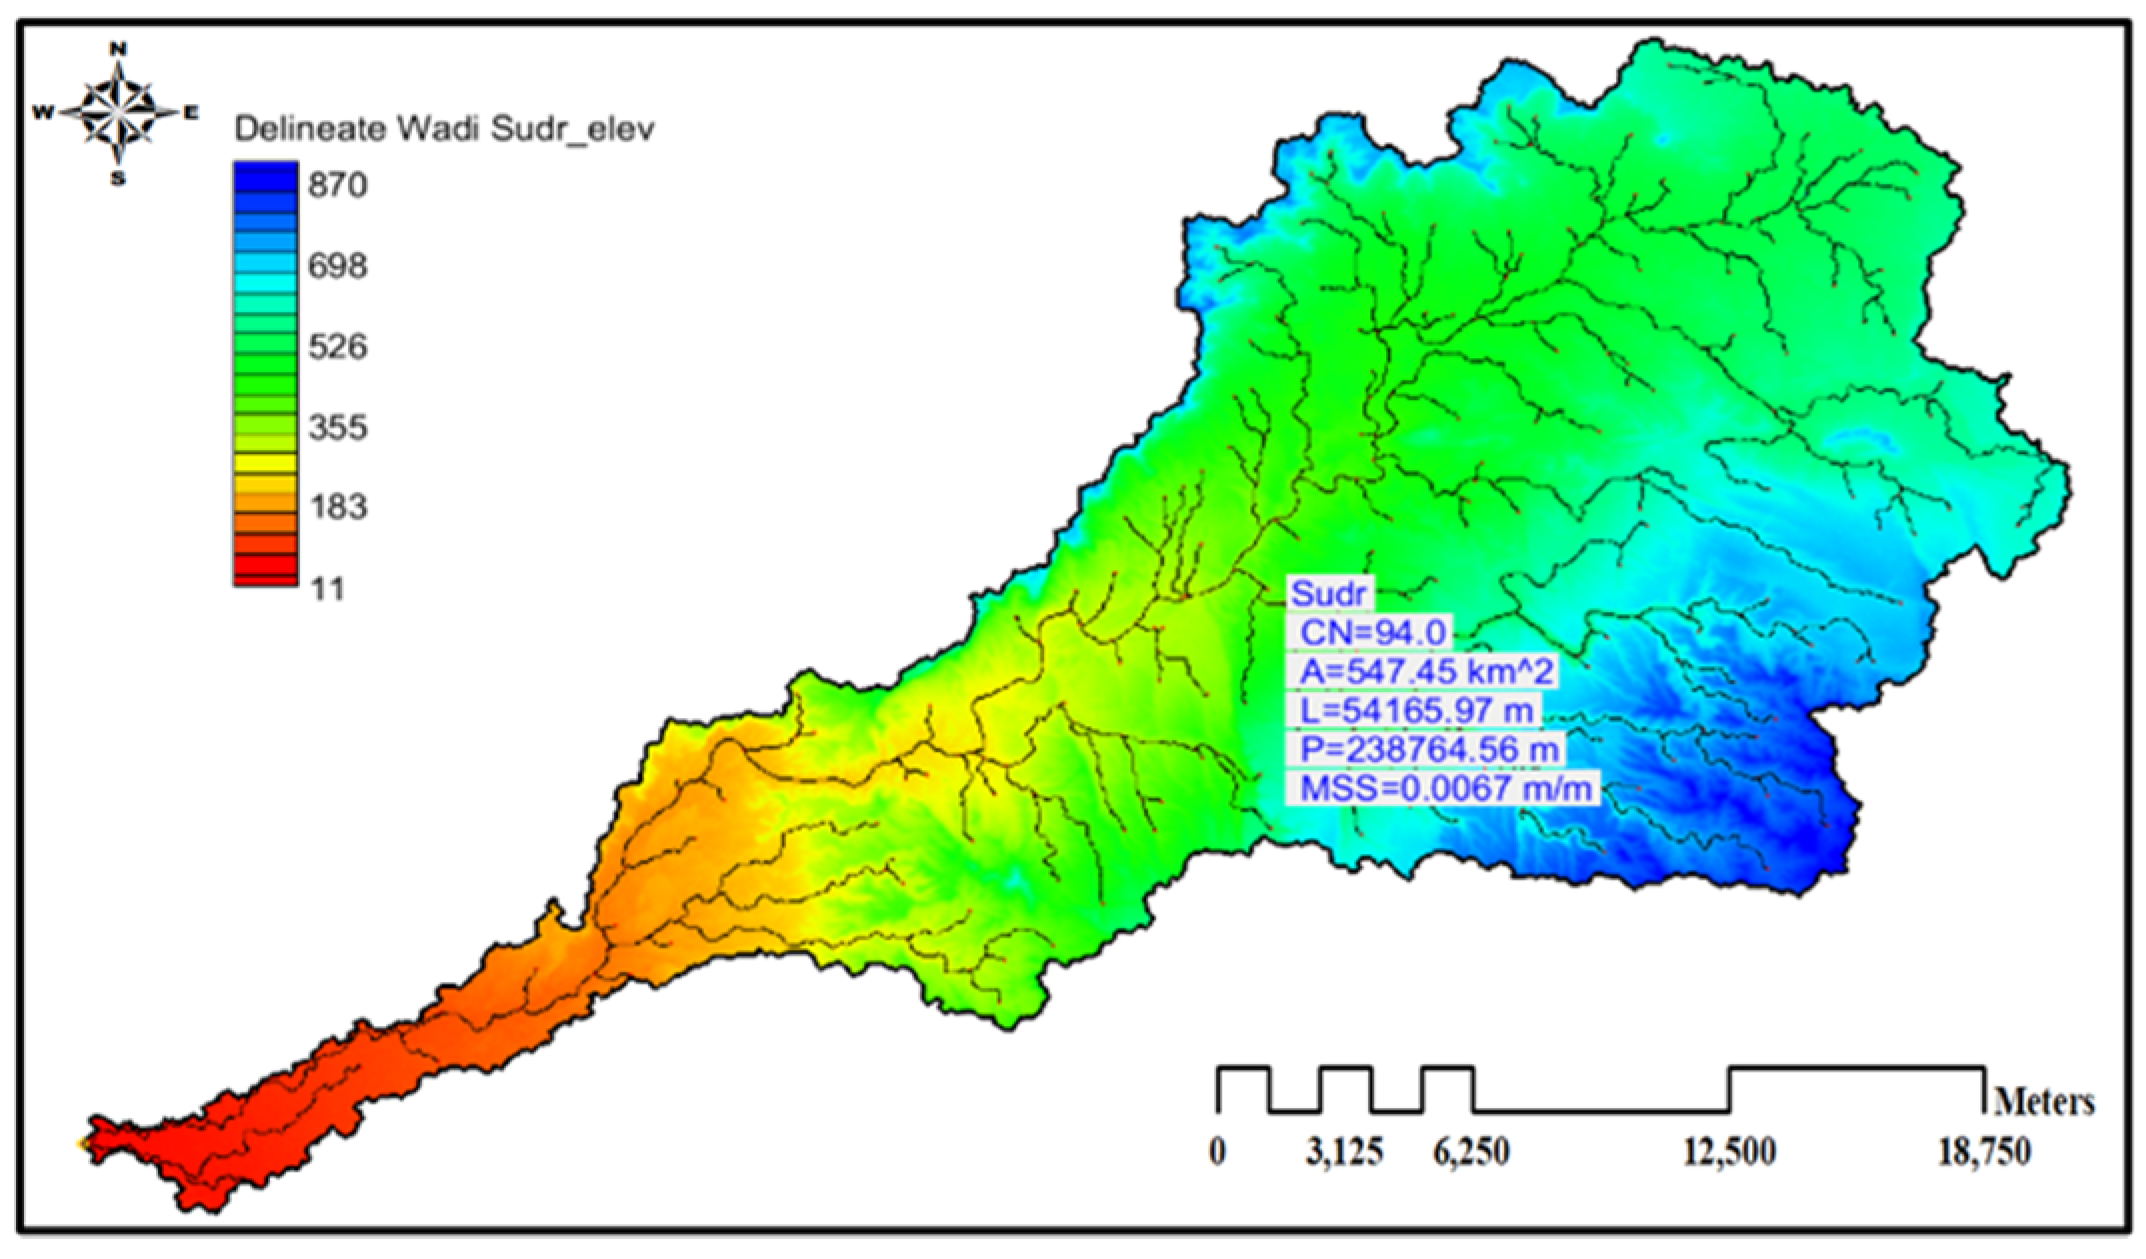
The watershed relief parameters are analyzed in this section. Maximum basin relief (H) is the most extreme vertical separation between the least and the most elevated purposes of the basin [39]. For Wadi Sudr, the most extreme height is 870 m (a.m.s.l) and least rise is 11 m (a.m.s.l). Moreover, the normal basin elevation esteem in the examination territory was 859 m. This worth was acquired from the investigation of rises in the examination region in the watershed modeling system (WMS) program, as shown in Figure 4.
Relative relief (Rhp) was characterized by Schumm [36] as the proportion of most extreme basin alleviation (H) to the edge of the basin. Relative relief for the Sudr watershed was 0.360, as shown in Table 4. Relief ratio (Rh) was characterized by Schumm (1956) as the proportion of all-out help of watershed and level separation along with the longest component of the basin corresponding to the vital drainage line. Likewise, the alleviation proportion for Wadi Sudr is 0.0159. From Table 4, it has been seen that serious extent of the relationship between high help, high stream channel inclines high, waste recurrence, and high stream recurrence showing high releases in brief length. Ruggedness number (HD) was characterized by Strahler [40] as the result of the most extreme watershed alleviation and seepage density. It is found that the roughness number of Wadi Sudr is high, at 3,244,443, because of the high waste density, high estimations of seepage density and greatest basin alleviation show very high estimations of HD.
4.2. The Drainage System Characteristics of Wadi Sudr
Precipitation is the main factor affecting the hydrological model. The work in this study was performed with the value provided by Sonbol et al. [41], which was derived from the storm that occurred in 1991 in the region, and the result of rainfall was 34.5 mm. Based on the type II 24 h precipitation model, which was designed to model the precipitation distribution (accumulated precipitation) within a 24 h WMS over the basin and the accumulated runoff, the general shape of Wadi Sudr was determined as shown in Figure 5.
Basin’s viability can be evaluated through its drainage system morphometric boundaries. Table 5 shows the essential morphometric boundaries considered. The morphometric boundaries showed that the total area of the catchment is 547.45 km2. The entire territory was viewed as a solitary basin with a stretched shape. The normal overland incline suggested the common desert attributes of the study area that quickens overland stream over little separations. The basin rise from the most upstream edge to the source fluctuates from 11 to 870 m. The normal slope of the main channel is 0.0067 m/m.
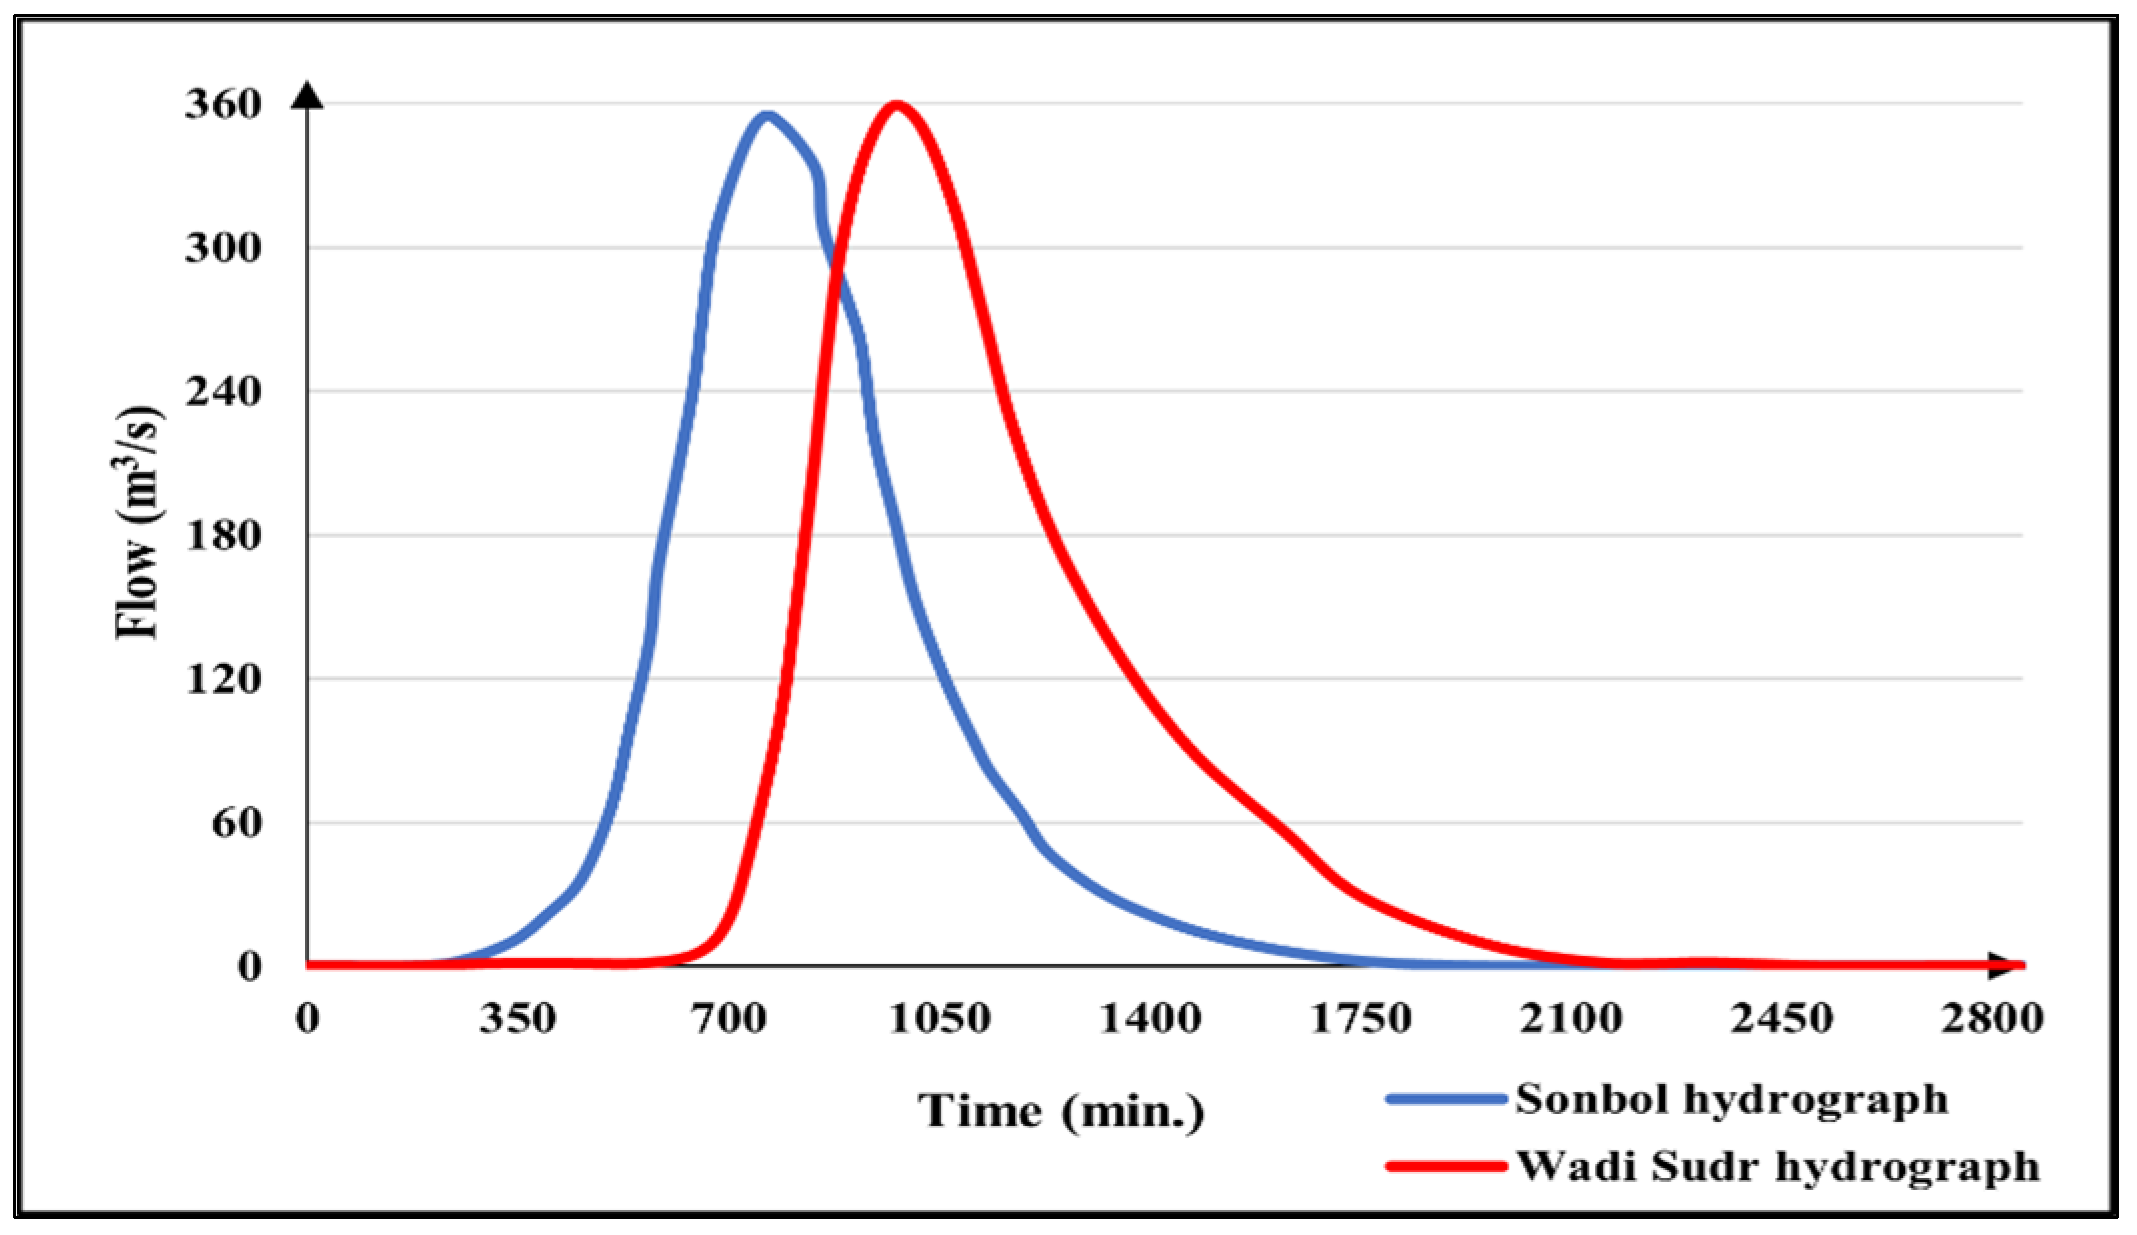
In this study, a simulation of rainfall was carried out with multiple possibilities representing the current reality according to the rainfall value over the area in Wadi Sudr, which is 34.5 mm. The results of the period of hydrograph produced by HEC-1. For the hydrographic output of about 11.267 million m3 with a peak flow of 361.20 m3/s at a peak time of 1020 min, as shown in Figure 6. This hydrograph was calibrated and compared with Sonbol et al. [41], results where the value of the CN was close and the flux difference was about 6.5%, which is an acceptable percentage of acceptance error, as shown in Figure 6.
4.3. Analysis of the Dam Site Based on Morphological Properties of the Watershed
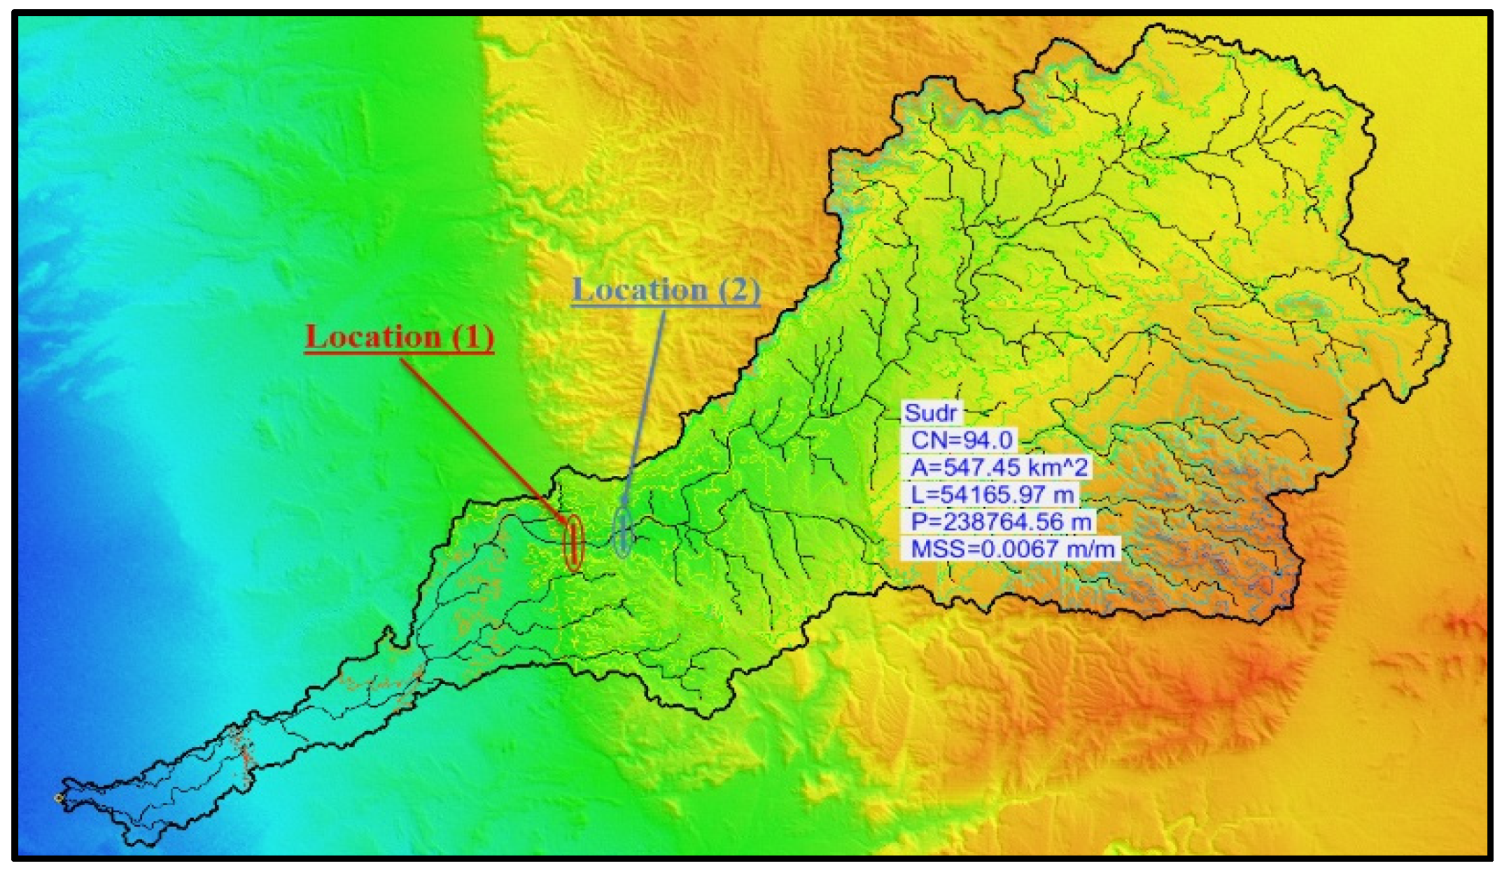
This stage of the study aims to analyze the location of the dams based on some criteria, including the width and the shape of the valley at the dam location, the storage capacity of the dam, the water depth behind the dam, the covered area by the reservoir, and the total construction cost. Based on the morphological analysis of the watershed, two locations were selected for the dam that met these conditions, as shown in Figure 7. Then the dam was designed, and the storage capacity that accommodates the flood in the area was calculated. Furthermore, a comparison was made between the two proposed locations that comply with the site conditions and specifications.
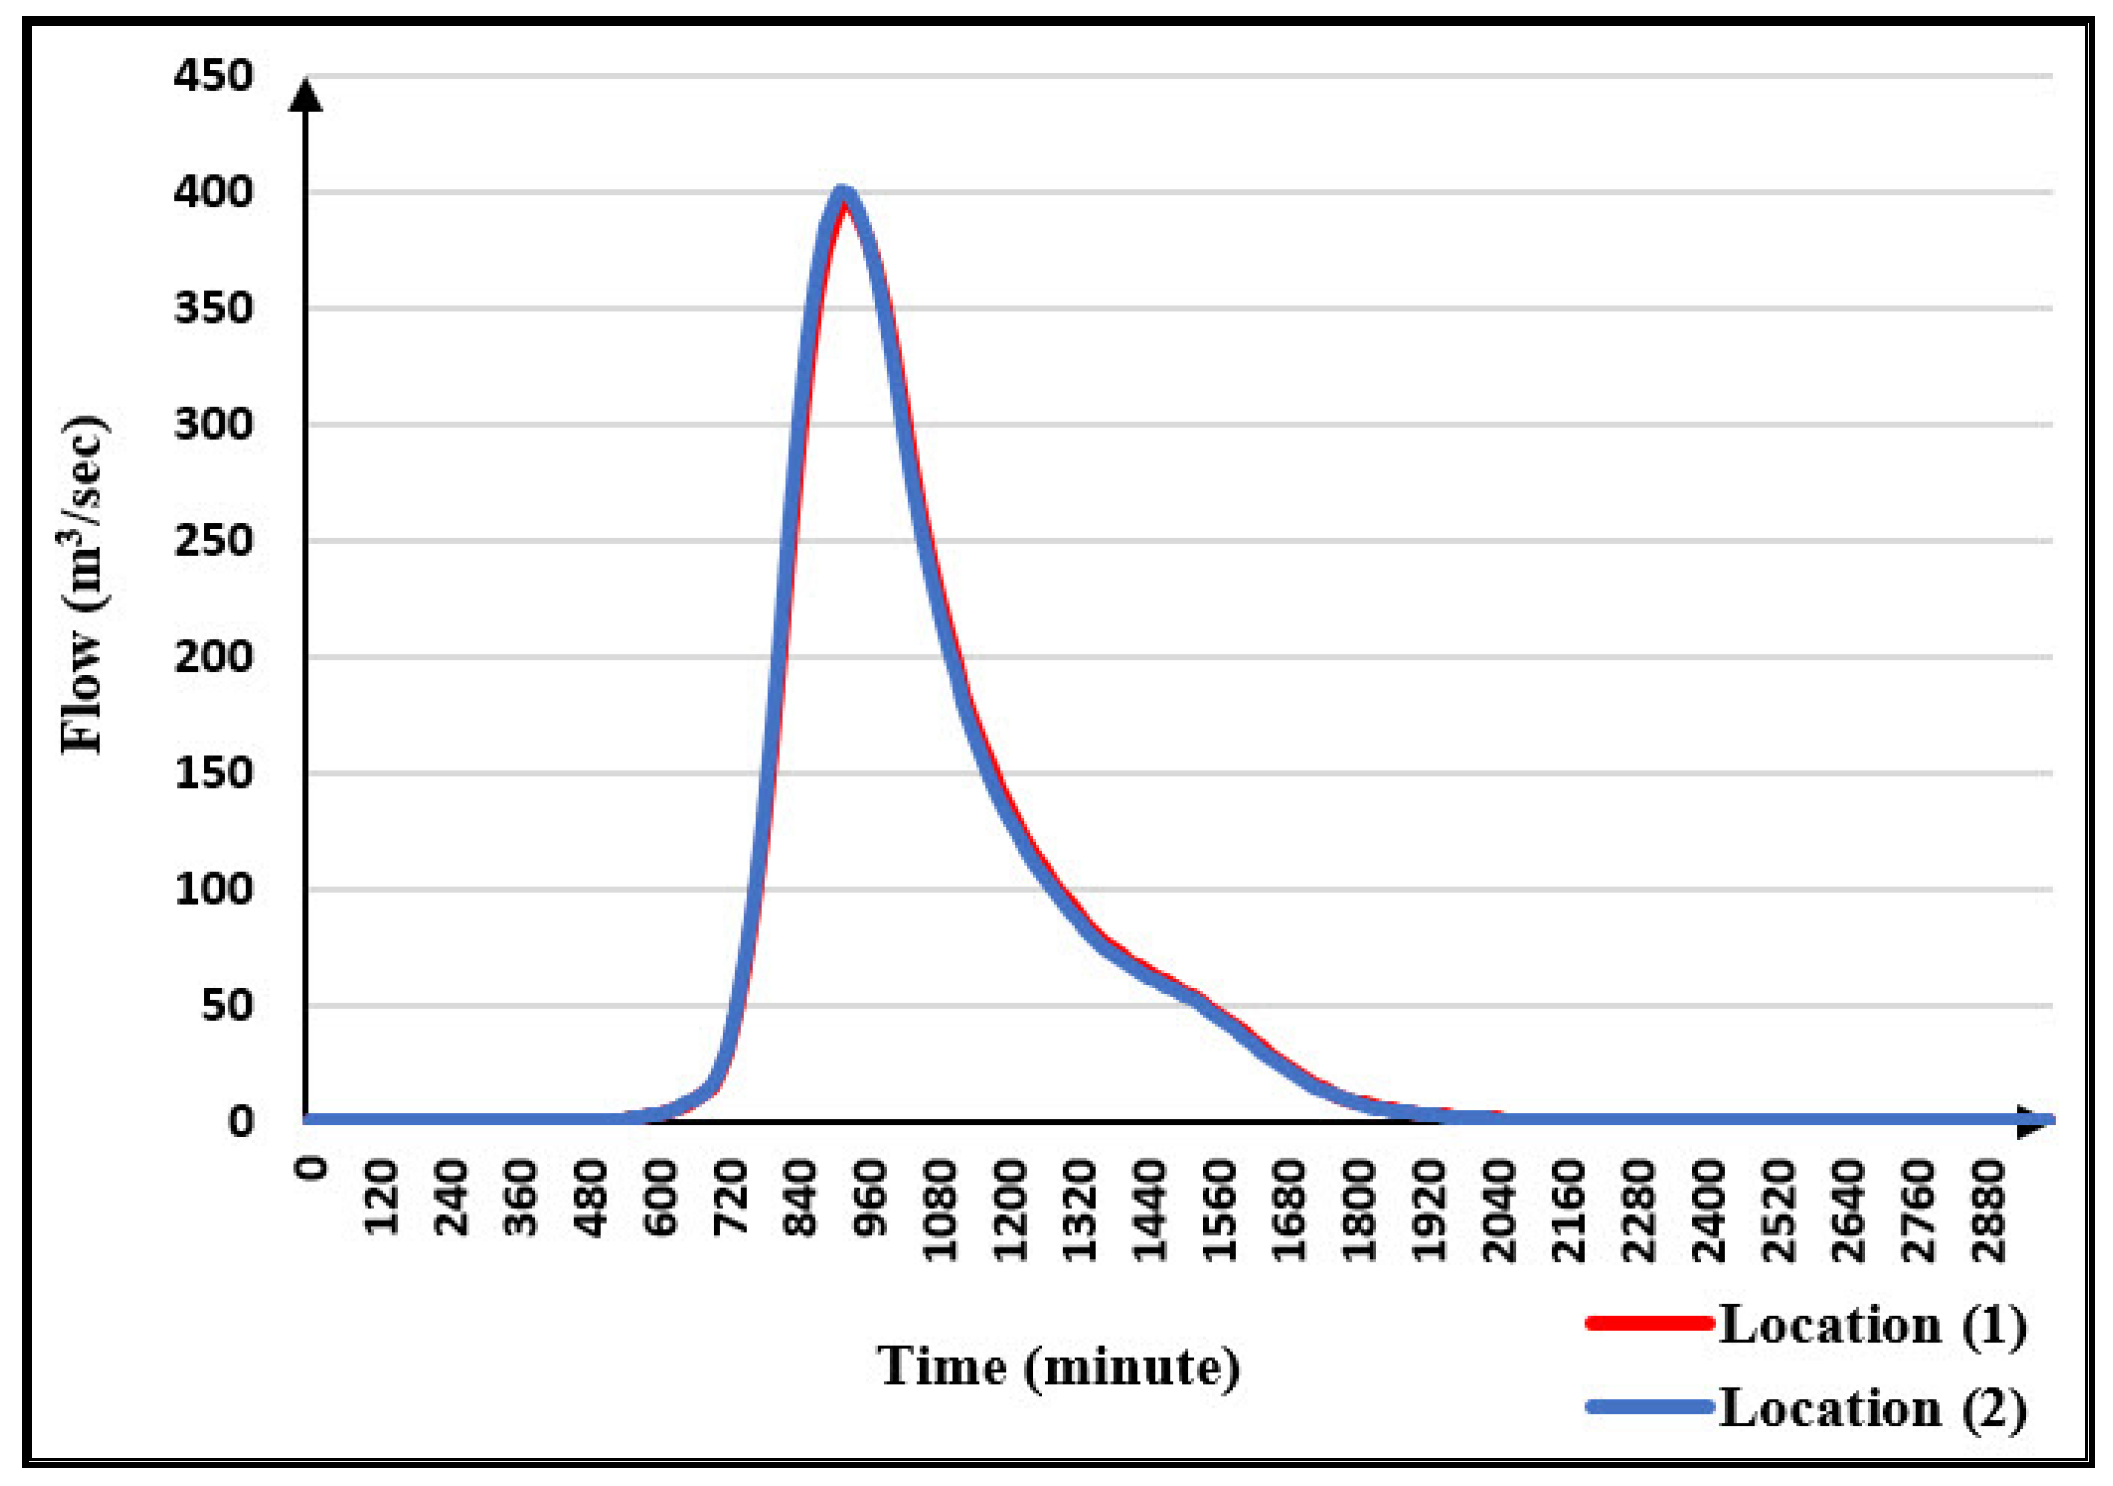
WMS is used for rainfall data analysis through the required inputs, including the amount of precipitation, curve number, and delay time required for the arrival of the flood to the end of the valley. The computed parameters for the two proposed dam locations are shown in Table 6, which include peak flow, time, and volume of flow. The hydrograph produced by HEC-1 for the two proposed dam locations is shown in Figure 8. For the first location, the volume of the flow was 9.375 MCM with a peak of 396.39 m3/sec at a time of 930 min. However, for the second location, the volume of flow was 9.323 MCM with a peak of 401.17 m3/sec in a time of 915 min.
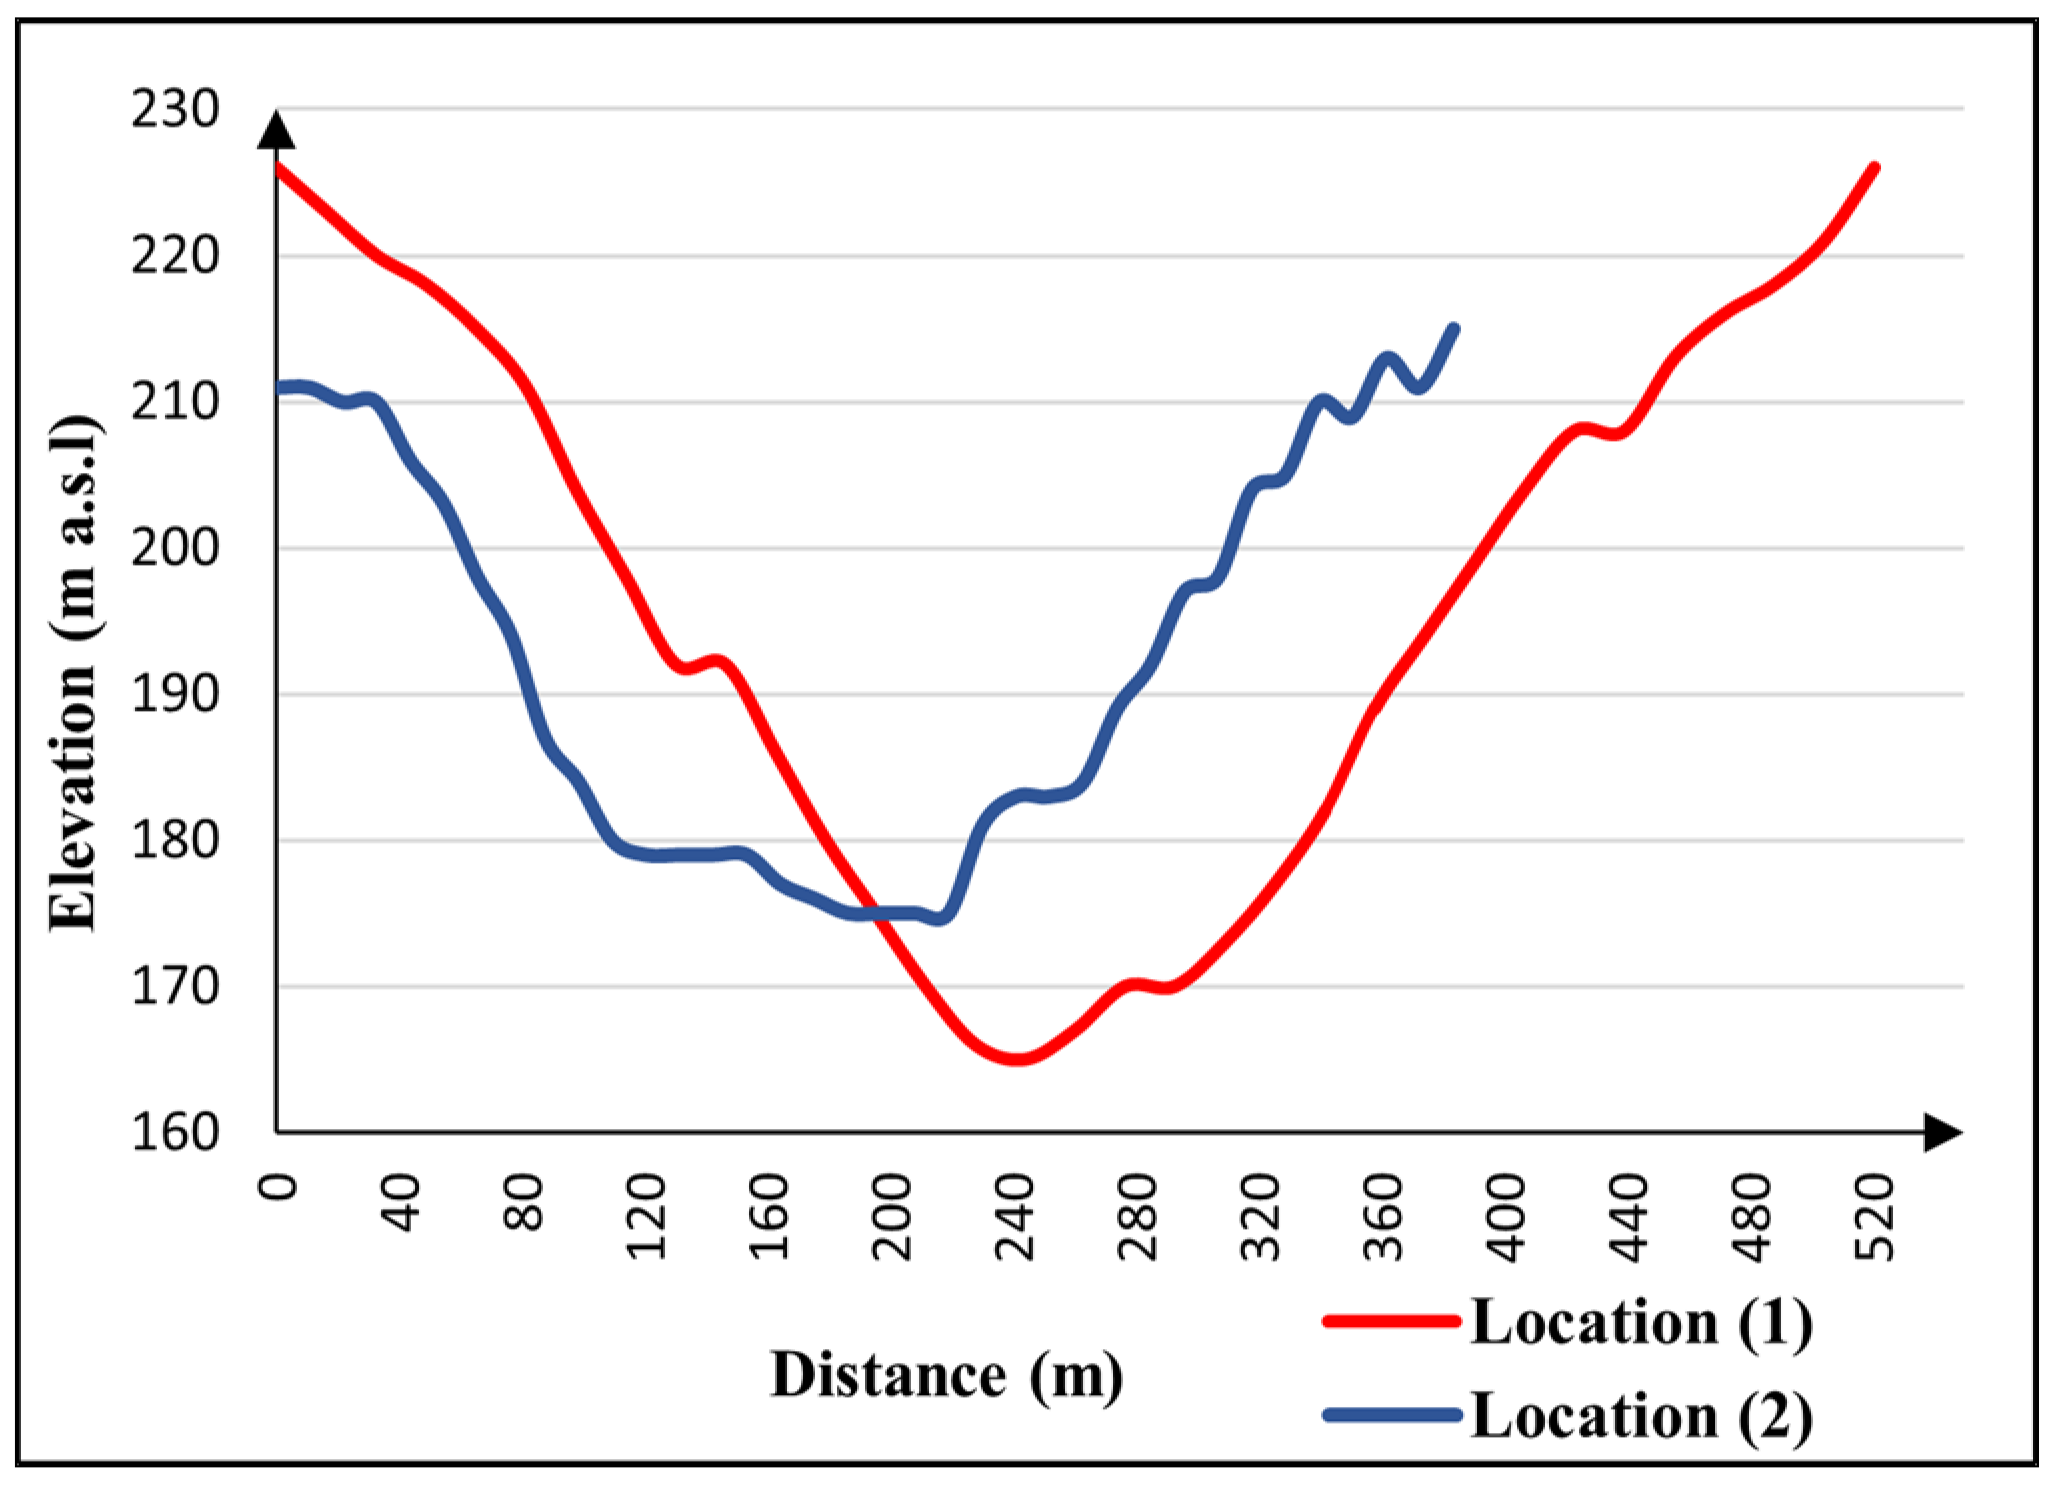
Then a relation between the vertical heights and the corresponding horizontal distances to reach the lateral shape of the valley stream for each of the proposed sites was determined. The maximum height that the dam can reach was investigated to indicate the capability of construction. For the first location, the maximum permissible height of the dam is 61 m, and the maximum horizontal distance representing the width of the dam corresponding to this height is 520.37 m. However, for the second location, the maximum height is 36 m, and the maximum horizontal distance is 383.81 m, as shown in Figure 9. Accordingly, the shape of the side sector of the first location was more regular than the second one, which is better to facilitate the dam stability and reduce the construction cost.
The dam storage capacity was calculated using the amount of precipitation, the area of the watershed, and the valley topography. Moreover, the annual rainfall volume was obtained. Furthermore, the volume of annual runoff was investigated using the volumetric runoff coefficient, which was estimated at 40% of the value of the volumetric flow, as shown in Table 7.
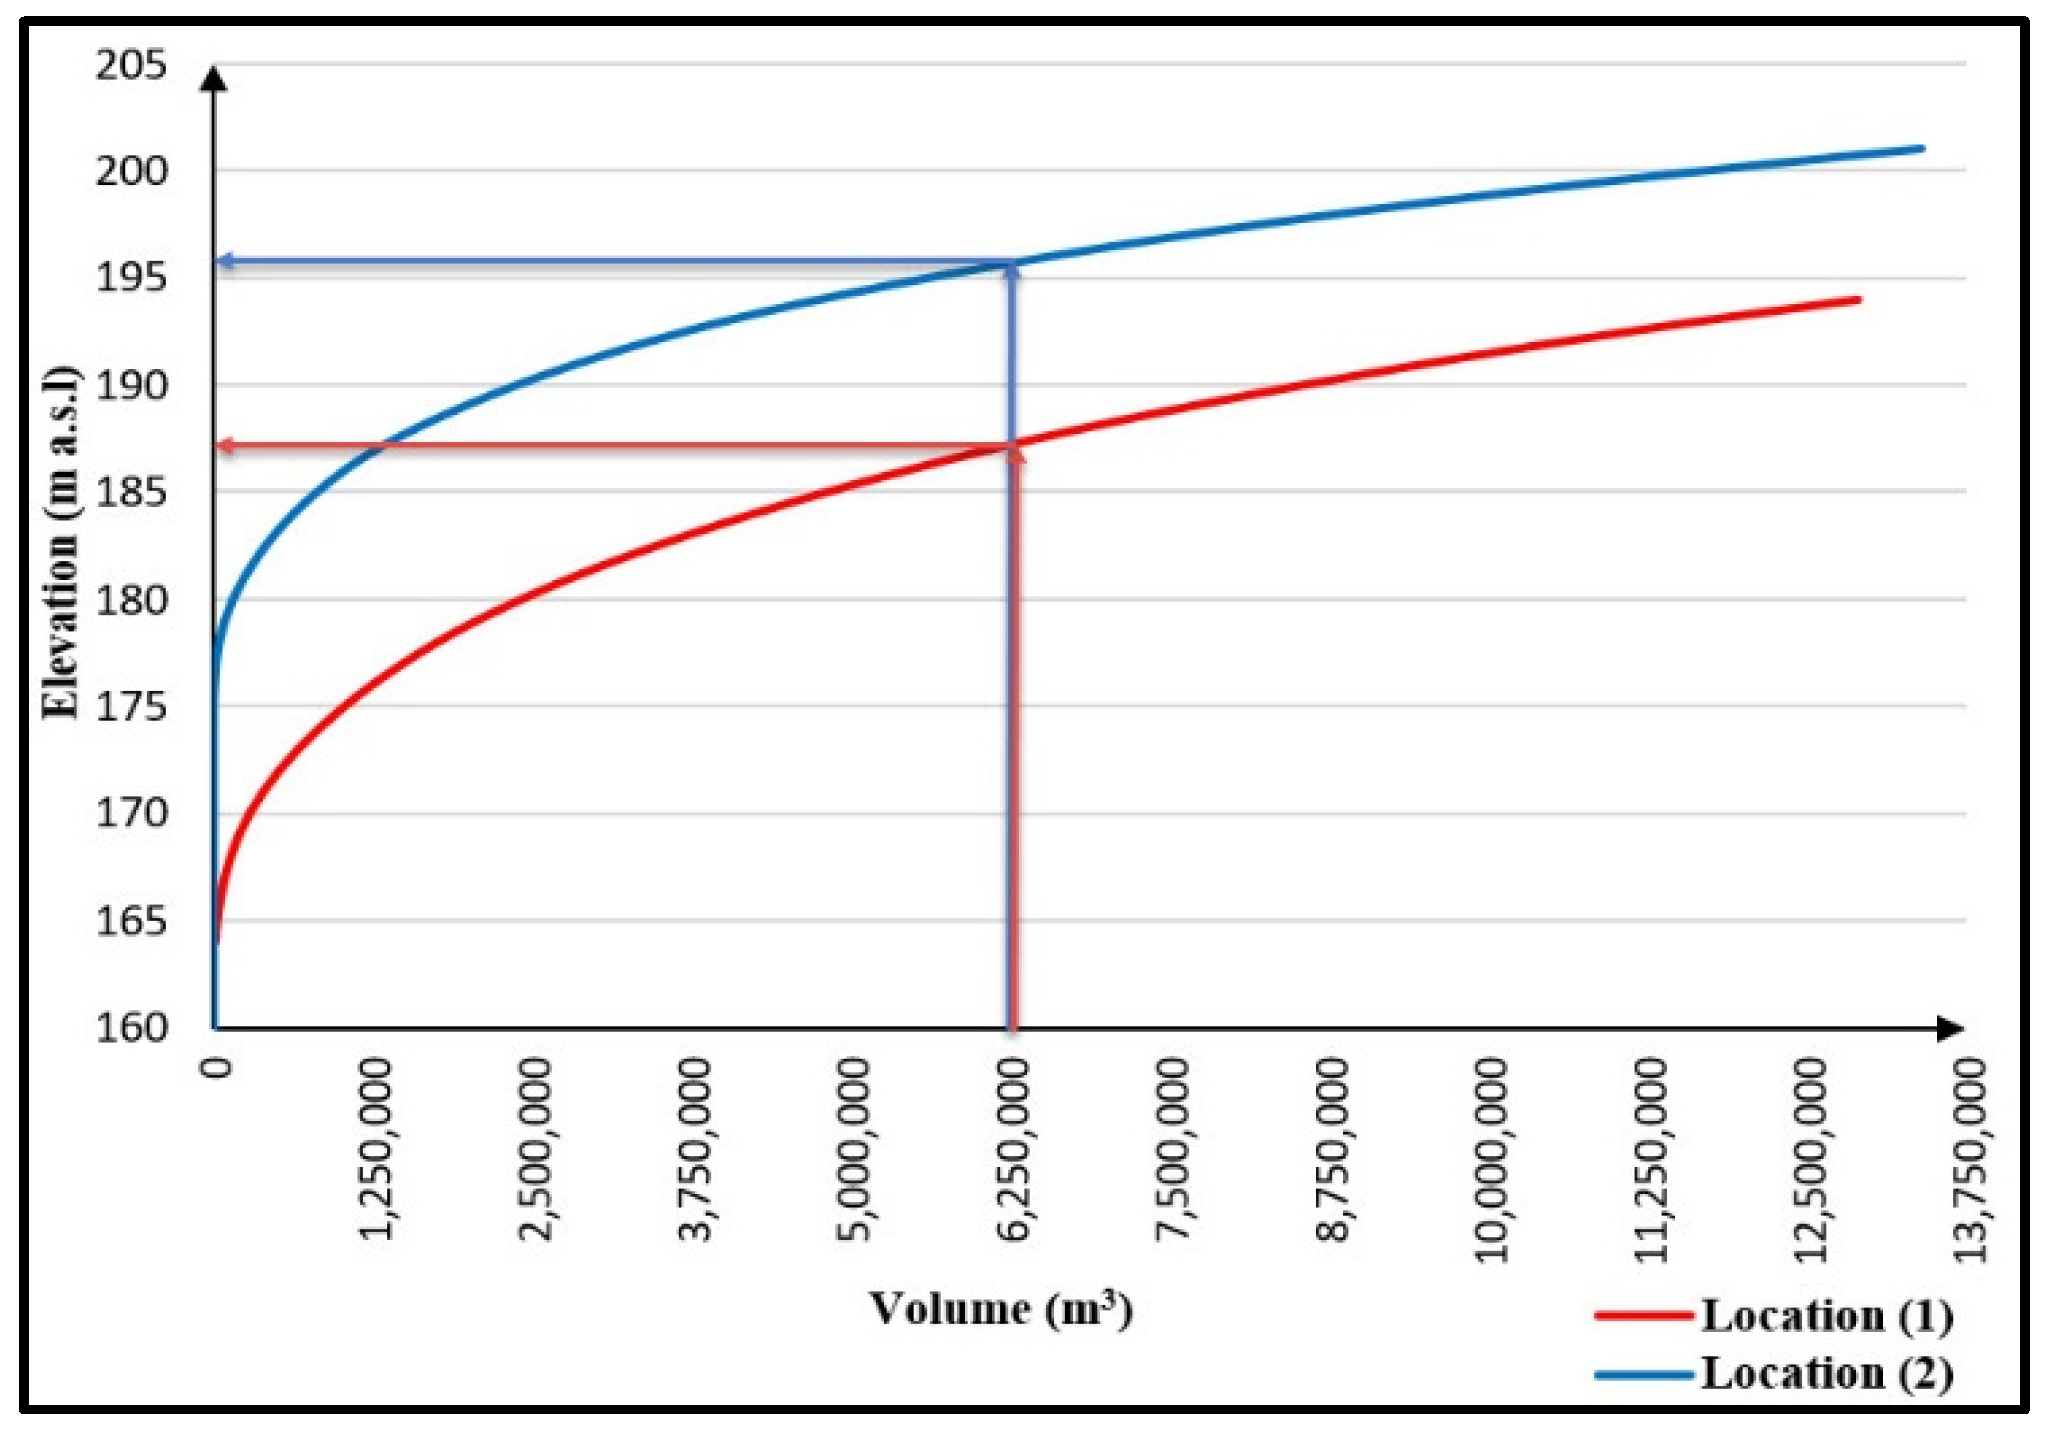
The storage capacity was estimated for the two proposed locations of the dam from the storage elevation curve, as shown in Figure 10.
The expected height of the dam was investigated. This process was carried out for the two proposed locations for dams. It was found that the heights corresponding to the quantities of storage for the first and second proposals were 187 m and 197 m, respectively. Moreover, the heights of the first and second dam sites were 164 m and 175 m, respectively. Accordingly, the water height in front of the dam for the first location was 23 m, while it was 22 m for the second one. Figure 11 shows the relationship between the water storage height and the area of the valley upstream of the dam. For the first location, the water spread area was 6.081 million square meters, while the second was 6.587 million square meters.
Based on the analysis of the proposed locations of the two dams, it was found that the first location is more suitable for the construction of the dam for the following reasons: it has a higher storage capacity than the second, and the water depth in front of the dam is greater than in the second, the width of the valley is less than the second, and the area covered by water in the lake is less than in the second. In addition, the shape is, to some extent, more regular than the second, which is better for dam stability and reduces construction cost.
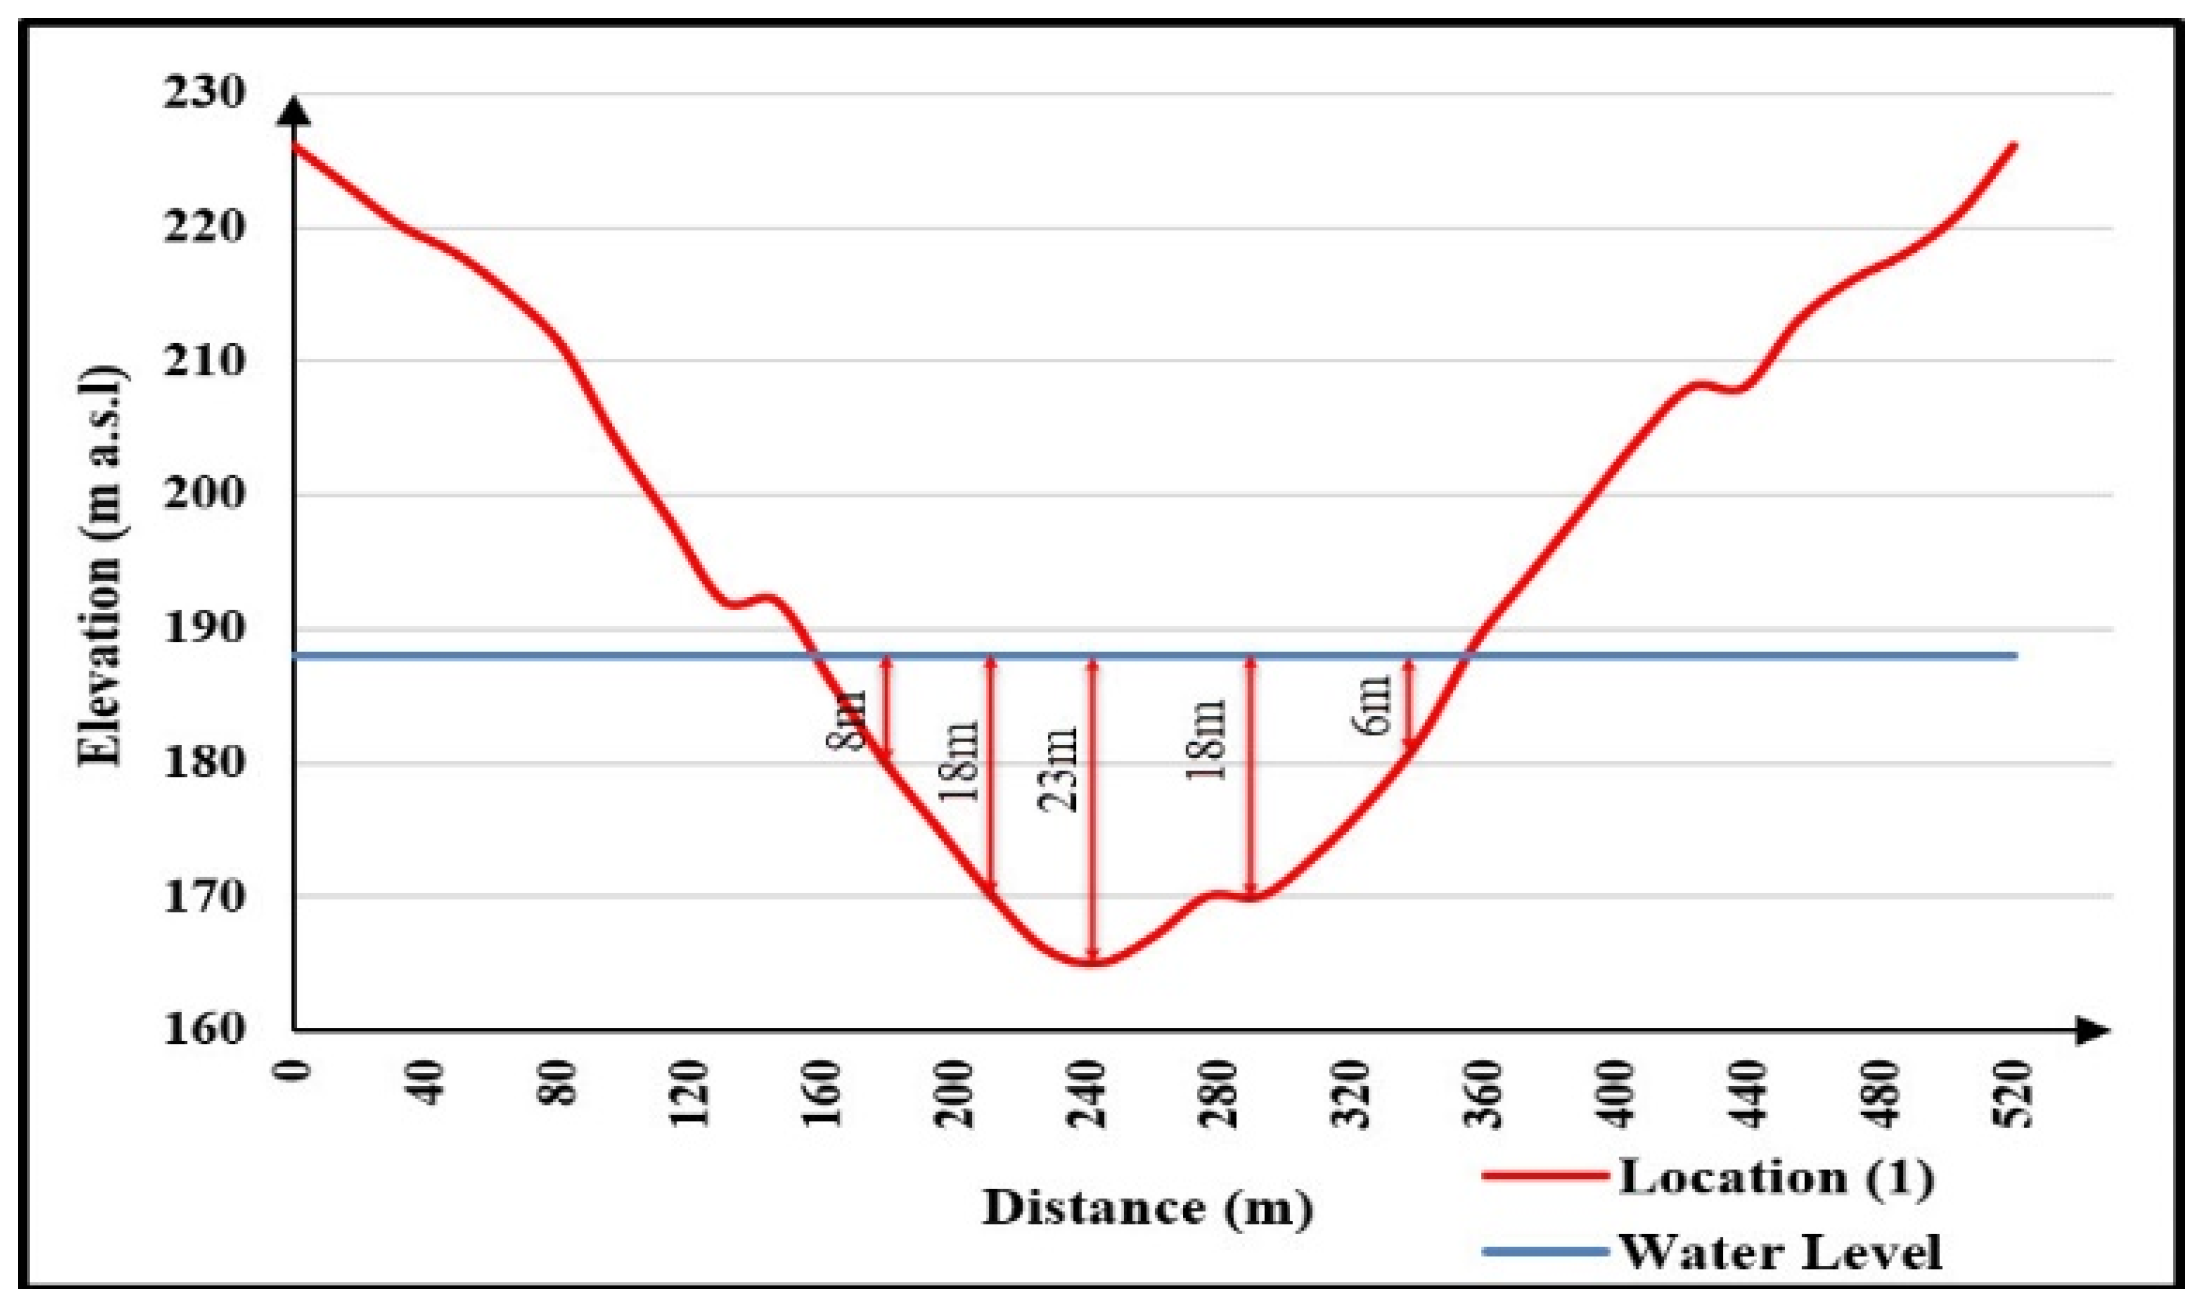
After settling on the first location of the dam in accordance with the above-mentioned criteria, Figure 12 shows a cross-section describing the water heights longitudinally, where they are 6 m and 8 m for right and left shoulders, respectively. Moreover, the highest water depth in the mid-span equals 23 m.
4.4. Selection of the Most Appropriate Dam Location Using the Weighted Linear Combination (WLC) Analysis
In this stage, weighted linear combination (WLC) analysis and suitability index (SI) are used to select the most appropriate dam location for the two proposed locations. This is performed in two steps: identifying the standards for locating dams and reservoirs and using the weighted linear combination (WLC) analysis, and determining the suitability index (SI) that helps in the selection of the most appropriate location.
4.4.1. Identifying the Standards
The most pertinent criteria for locating dams and reservoirs were determined after a review of the literature. This exercise involved defining variables, restrictions, and exclusionary zones while taking into account the unique biophysical, socioeconomic, and data availability of the Wadi Sudr region, as shown in Table 8.
Weighted linear combination (WLC) is used in this work, which is based on an equal-weighted average and is simple to apply in a GIS setting using map algebra operations and cartographic modeling [42,43]. An appropriateness index was calculated by summing the products of the relative relevance, weight (% of influence), and standard suitability score of each criterion as follows:
where SI is the suitability index, wi corresponds to the relative importance of criterion i, and Si is the standardized suitability score of criterion i.
4.4.2. Suitability Index
Prior to doing the weighted linear combination (WLC) analysis, all the criteria were categorized into a similar evaluation scale (ESRI [45]). In this method, there were five categories of suitability used: highly unsuitable, not suitable, modestly suitable, suitable, and highly suitable. Dam sites should be placed at least 100 m away from lineaments since highly faulted areas are not suitable for building dams or reservoirs. The lineaments were divided into two suitability categories: highly inappropriate for distances under 100 m and highly suitable for distances above 100 m. In addition, classes of soil were categorized in accordance with how suitable they are [46]. The natural breaks (Jenks) classification method offered by ArcGIS was used to reclassify all of the remaining input criteria. This technique locates actual classes in the data, producing realistic depictions of data trends [47].
The level of suitability of the previous criteria was applied to each of the two proposed sites for the harvesting dams for the purpose of comparison between them, and then aggregated the criteria with equal weight using Equation (1) to obtain the value of the suitability index (SI) as shown in Table 11. From the previous results of the suitability index, it was concluded that the first location for the dam site had a value of 6.38, while the value of the second location was 5.46, and therefore the first site is the best according to the results of the weighted linear combination (WLC) analysis.
4.5. Design of the Dam in the Selected Site
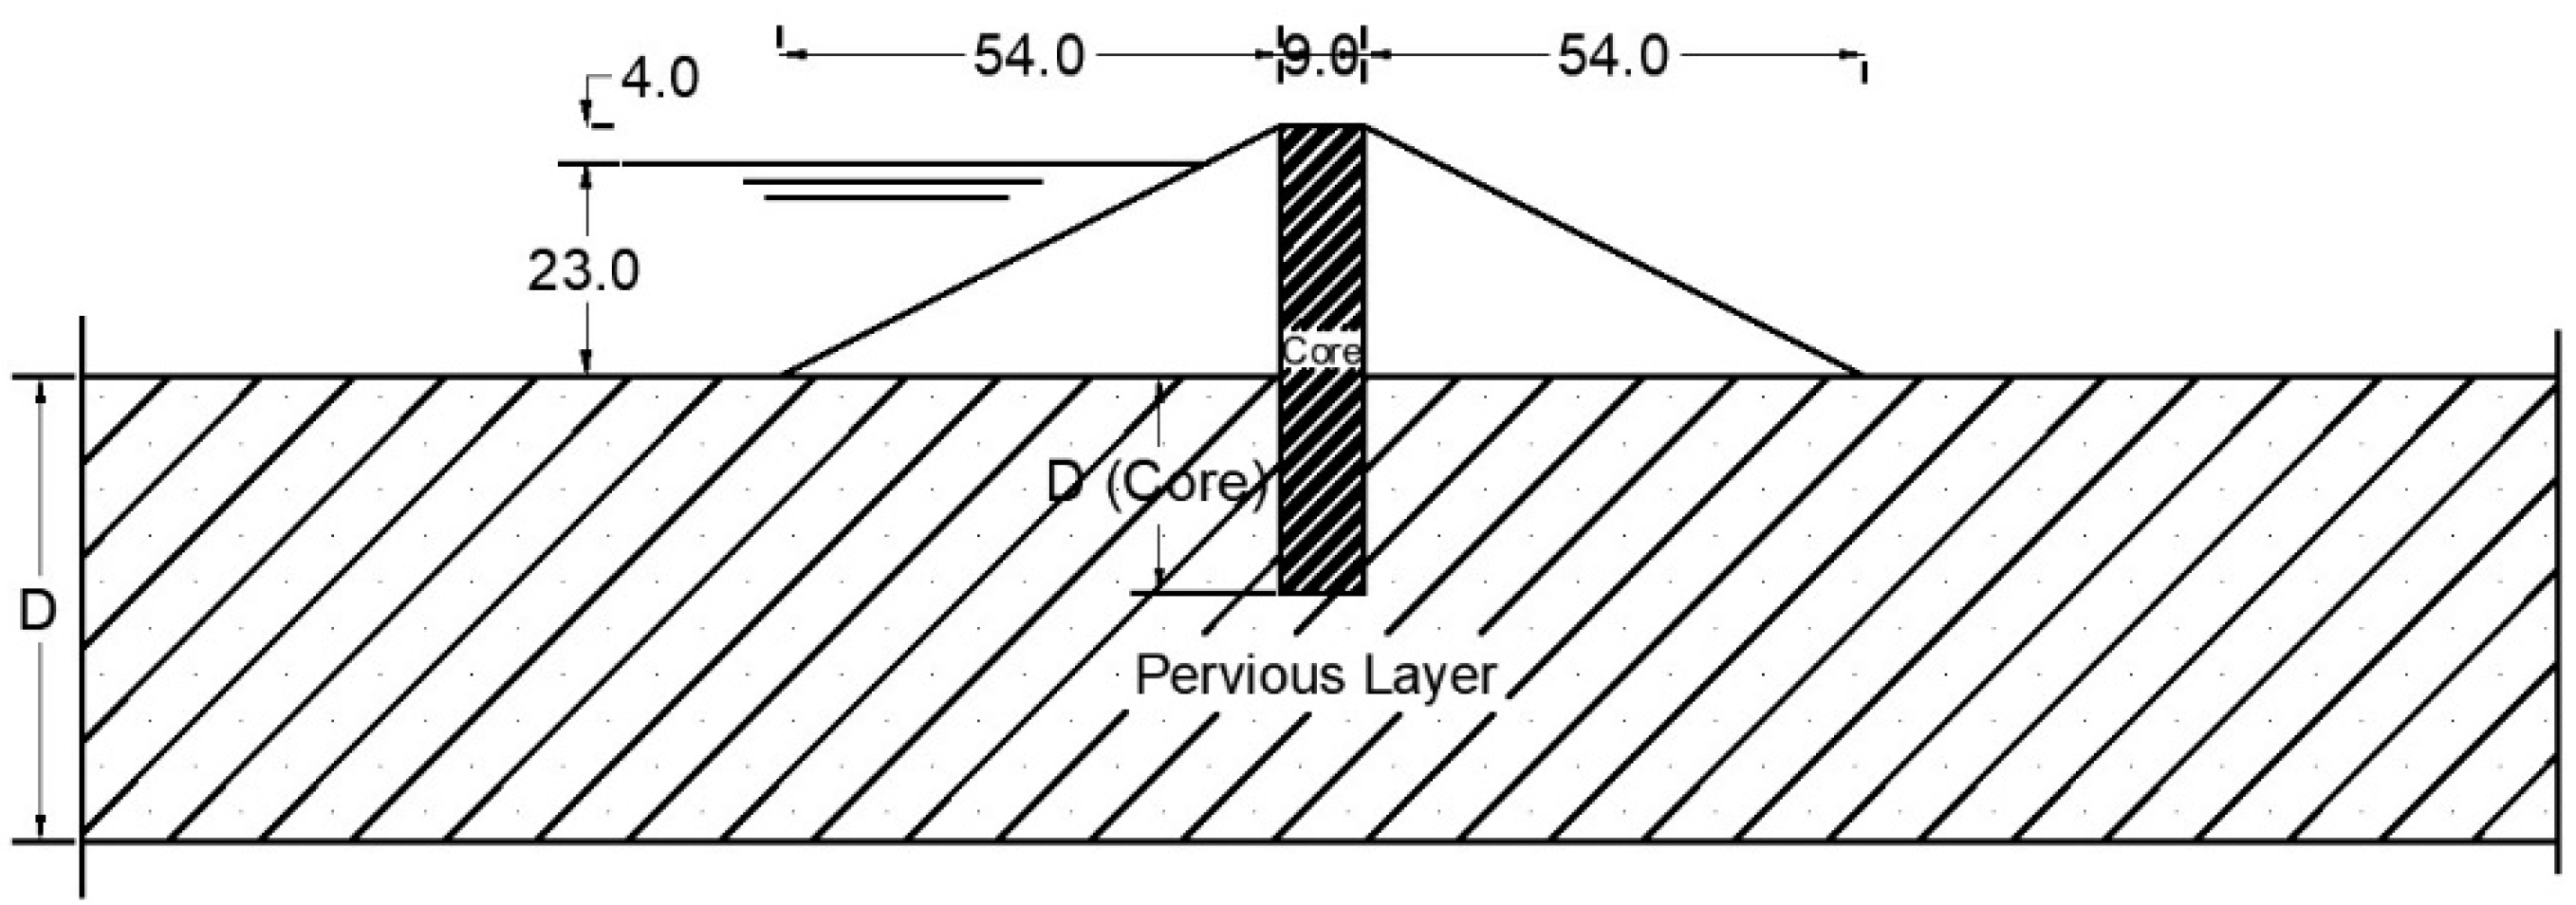
For designing the proposed dam and finding its dimensions, such as crest width, dam height, and length, an empirical equation developed by Khattab (1991) [48] is used. Moreover, after studying the geometry of the studied valley, especially the proposed location for the dam construction, the dam’s maximum height was selected to be 23 m. Furthermore, the other dimensions of the proposed dam are described in Table 12.
where: W is the width of the crest, and Z is the height of the dam above the stream bed (that equals the height of the water and the freeboard).
Figure 13 describes the cross-section of the proposed earth dam. The seepage control method is chosen as an internal impervious core. The dam crest width is 9.0 m. Moreover, the upstream and downstream lengths are 54 m each, dam height is chosen to be 23 m, and a freeboard of 4 m is also selected. Furthermore, the impervious core penetration relative depth Dcore/D, which significantly controls the quantity of seepage, depends on the soil properties of the foundation also the properties of the core. Many researchers described the relation between the core penetration and the seepage flow, as mentioned by Salem et al. [49]. In future work, we will deal in depth with modifying the design characteristics of the dam and making several different scenarios to keep the dam from collapsing, and choosing the most appropriate types. We will deal with detailed studies of the position of the core to reduce the rate of permeability of the dam.
5. Conclusions
Flash flood risks should be evaluated, and protection measures should be provided to reduce its impacts. The present study aims to evaluate the geomorphological parameters at Wadi Sudr, South Sinai, Egypt. The present study combines geographic information system (GIS) and watershed modeling system (WMS) to visualize and assess flood events in the study area. The morphological parameters, including linear, areal, and relief parameters, were determined for Wadi Sudr. Then constructing an earth dam for flood mitigation to protect the area from flash floods was discussed. GIS was used to analyze satellite images and determine the characteristics of the valley to reach the elongation and number of flow orders in the valley, and then WMS was used to estimate rainstorms and basin characteristics, as well as estimate the amount of rain that causes flooding. The data from GIS and WMS were used to select the best location of the protection dam based on some criteria, including storage capacity, water depth in front of the dam, width and shape of the valley, and the area covered by water in the lake. The morphometric analysis provided a quantitative portrayal of the Wadi Sudr watershed. It has 4029 streams connected with the seventh order of streams spread over an area of 547.45 km2. Using GIS and WMS with the HEC-HMS program led to hydrological demonstration and flood hydrograph for the watershed. Two locations for protection dams were proposed to protect the area from flood hazards. A comparison between the two locations showed that the first option is more appropriate for the dam based on the selected criteria. The first location had a higher storage capacity (6.286 million cubic meters) than the second (6.251 million cubic meters). In addition, the water depth in front of the dam is greater than in the second, the width of the valley is less than the second, and the area covered by water in the lake (6.081 million square meters) is less than in the second (6.286 million square meters). The shape of the valley in the first option is more regular than in the second. Due to these reasons, the cost of constructing the dam in the first location will be less in addition to the dam stability will be higher. To further verify that the proposed location for the dam is the best, a comparison was made between the two locations according to 13 criteria using a weighted linear combination that depends on the equal weight, where the SI was found whose value was higher in the case of the first location than the second location. The proposed methodology is capable of protecting the study area from flood risks and harvesting large amounts of water that can be used for different purposes. It is also can be applied in different areas for flood risk evaluation and mitigation.
Author Contributions
Conceptualization, H.A.S., E.M.R. and M.Z.; methodology, H.M.E. and E.M.R.; software, H.A.S., E.M.R. and H.M.E.; validation, H.F.A.-E., H.M.E. and M.Z.; formal analysis, H.A.S., E.M.R. and H.F.A.-E.; investigation, H.A.S., E.M.R. and M.Z.; resources, H.A.S. and M.Z.; data curation, H.A.S., E.M.R. and H.F.A.-E.; writing—original draft preparation, H.A.S., E.M.R. and H.M.E.; writing—review and editing, E.M.R., H.F.A.-E. and M.Z.; visualization, H.M.E. and H.F.A.-E.; supervision, E.M.R. and H.M.E.; project administration, H.F.A.-E. and M.Z; funding acquisition, M.Z. All authors have read and agreed to the published version of the manuscript.
Funding
This work was supported by the Slovak Research and Development Agency under contract no. APVV-20-0281. This work was supported by project HUSKROUA/1901/8.1/0088, Complex flood-control strategy on the Upper-Tisza catchment area.
Conflicts of Interest
The authors declare no conflict of interest.
References
- Fathy, I.; Negm, A.M.; El-Fiky, M.; Mohammed, N.; Al-Sayed, E. Runoff hydrograph modeling for arid regions (case study: Wadi sudr—Sinai). Int. Water Technol. J. IWTJ 2015, 5, 1. [Google Scholar]
- Giannaros, C.; Dafis, S.; Stefanidis, S.; Giannaros, T.M.; Koletsis, I.; Oikonomou, C. Hydrometeorological analysis of a flash flood event in an ungauged Mediterranean watershed under an operational forecasting and monitoring context. Meteorol. Appl. 2022, 29, e2079. [Google Scholar] [CrossRef]
- Yucel, I. Assessment of a flash flood event using different precipitation datasets. Nat. Hazards 2015, 79, 1889–1911. [Google Scholar] [CrossRef]
- Lotfy, A. Assessment of spatial rainfall variation on runoff in Wadi Sudr, Sinai Peninsula. In Proceedings of the Second International Symposium on Flash Floods in Wadi Systems, Hurghada, Egypt, 25–27 October 2016. [Google Scholar]
- Dewidar, K.M. Analysis of morphometric parameters using remote-sensing data and GIS techniques in the Wadi El Gemal basin, Red Sea coast, Egypt. Int. J. Remote Sens. GIS 2013, 2, 122–129. [Google Scholar]
- Abdel-Lattif, A.; Sherief, Y. Morphometric analysis and flash floods of Wadi Sudr and Wadi Wardan, Gulf of Suez, Egypt: Using digital elevation model. Arab. J. Geosci. 2012, 5, 181–195. [Google Scholar] [CrossRef]
- El-Bihery, M.A. Groundwater flow modeling of Quaternary aquifer Ras Sudr, Egypt. Environ. Geol. 2009, 58, 1095–1105. [Google Scholar] [CrossRef]
- El-Behiry, M.G.; Shedid, A.; Abu-Khadra, A.; El-Huseiny, M. Integrated GIS and remote sensing for runoff hazard analysis in Ain Sukhna industrial area, Egypt. Earth Sci. 2006, 17, 19–42. [Google Scholar] [CrossRef]
- El-Sayed, E.A.; Habib, E. Advanced Technique for Rainfall-Runoff Simulation in Arid Catchments Sinai, Egypt. In Proceedings of the Third International Conference on Water Resources and Arid Environments (2008) and the First Arab Water Forum, Riyadh, Saudi Arabia, 16–19 November 2008. [Google Scholar]
- Shaikh, M.; Birajdar, F. Analysis of Watershed Characteristics Using Remote Sensing and GIS Techniques. Int. J. Innov. Res. Sci. Eng. Technol. 2015, 4, 1971–1976. [Google Scholar]
- Soni, S.K.; Tripathi, S.; Maurya, A.K. GIS based Morphometric Characterization of Mini Watershed-Rachhar Nala of Anuppur District Madhya Pradesh. Int. J. Adv. Technol. Eng. Res. 2013, 3, 32–38. [Google Scholar]
- Thakur, K.K.; Pandita, S.K.; Goyal, V.C.; Singh, Y.; Kotwal, S.S. Characterisation of drainage basin morphometric parameters of Balawal Watershed, Jammu province, Jammu, and Kashmir. Himal. Geol. 2014, 35, 124–134. [Google Scholar]
- Abdul Rahaman, S.; Abdul Ajeez, S.; Aruchamy, S.; Jegankumar, R. Prioritization of Sub Watershed Based on Morphometric Characteristics Using Fuzzy Analytical Hierarchy Process and Geographical Information System. A Study of Kallar Watershed, Tamil Nadu. Aquat. Procedia 2015, 4, 1322–1330. [Google Scholar] [CrossRef]
- Javed, A.; Khanday, M.Y.; Ahmed, R. Prioritization of sub-watersheds based on morphometric and land use analysis using remote sensing and GIS techniques. J. Indian Soc. Remote Sens. 2009, 37, 261–274. [Google Scholar] [CrossRef]
- Chatzichristaki, C.; Stefanidis, S.; Stefanidis, P.; Stathis, D. Analysis of the Flash Flood in Rhodes Island (South Greece) on 22 November 2013. Silva Balc. 2015, 16, 76–86. [Google Scholar]
- Diakakis, M. Characteristics of Infrastructure and Surrounding Geo-Environmental Circumstances Involved in Fatal Incidents Caused by Flash Flooding: Evidence from Greece. Water 2022, 14, 746. [Google Scholar] [CrossRef]
- Omran, A.; Schröder, D.; El Rayes, A.; Geriesh, M. Flood Hazard Assessment in Wadi Dahab, Egypt Based on Basin Morphometry Using GIS Techniques; Herbert Wichmann Verlag, VDE VERLAG GMBH: Berlin, Germany; Offenbach, Germany, 2011; ISBN 978-3-87907-509-6. [Google Scholar]
- Negm, A.M.; Nassar, M.A.; Al-Sayed, E.A.; El-Fiky, M.M. Estimation of Lag Time and Peak Discharge of Flash Flood of Wadi Sudr in The Sinai Peninsula. Egypt. Int. J. Eng. Sci. Technol. 2014, 17, 4. [Google Scholar] [CrossRef]
- Wanga, Z.; Lai, C.; Chen, X.; Yang, B.; Zhao, S.; Bai, X. Flood Hazard Risk Assessment Model Based on Random Forest. J. Hydrol. 2015, 527, 1130–1141. [Google Scholar] [CrossRef]
- Stefanos, S.; Stathis, D. Assessment of Flood Hazard Based on Natural and Anthropogenic Factors Using Analytic Hierarchy Process (AHP). Nat. Hazards 2013, 68, 569–585. [Google Scholar] [CrossRef]
- Nektarios, N.; George, P. Flood Management and A GIS Modelling Method to Assess Flood-Hazard Areas—A Case Study. Hydrol. Sci. J. 2011, 56, 212–225. [Google Scholar]
- Gabr, S.; El Bastawesy, M. Estimating the Flash Flood Quantitative Parameters Affecting the Oil-Fields Infrastructures in Ras Sudr, Sinai, Egypt, During the January 2010 Event. Egypt. J. Remote Sens. Space Sci. 2015, 18, 137–149. [Google Scholar] [CrossRef]
- Abd-Elhamid, H.F.; Fathy, I.; Zeleňáková, M. Flood prediction and mitigation in coastal tourism areas, a case study: Hurghada, Egypt. Nat. Hazards 2018, 93, 559–576. [Google Scholar] [CrossRef]
- Fathy, I.; Abd-Elhamid, H.; Zelenakova, M.; Kaposztasova, D. Effect of Topographic Data Accuracy on Watershed Management. Int. J. Environ. Res. Public Health 2019, 16, 4245. [Google Scholar] [CrossRef] [PubMed]
- Orabi, O.H.; El-Sehamy, M.M.; Abdel Gawad, A.M.; Aly, A.T.; Abdella, H.F. Flash Flood Risk in West- Central Sinai, Egypt. Egypt. J. Geol. 2021, 65, 137–154. [Google Scholar] [CrossRef]
- Elewa, H.H.; Zelenakova, M.; Nosair, A.M. Integration of the Analytical Hierarchy Process and GIS Spatial Distribution Model to Determine the Possibility of Runoff Water Harvesting in Dry Regions: Wadi Watir in Sinai as a Case Study. Water 2021, 13, 804. [Google Scholar] [CrossRef]
- Fathy, I.; Ahmed, A.F.; Abd-Elhamid, H.F. Integrated management of surface water and groundwater to mitigate flood risks and water scarcity in arid and semi-arid regions. J. Flood Risk Manag. 2021, 14, e12720. [Google Scholar] [CrossRef]
- Fathy, I.; Zeleňáková, M.; Abd-Elhamid, H.F. Highways protection from flood hazards, a case study: New Tama road, KSA. Nat. Hazards 2020, 103, 479–496. [Google Scholar] [CrossRef]
- Abdel Aziz, M.F. Geomorphological Hazard Map Along Southwestern Sinai Coast El-Tur Area Using GIS. Geopolit. Hist. Int. Relat. 2013, 5, 168–187. [Google Scholar]
- Elsiad, A.A.; Ramadan, E.M.; Magdy, A. Quantitative Evaluation of Drainage Basin Characteristics Using GIS Based Morphometric Analysis: A Case Study of Wadi Sudr. In Proceedings of the 2017 3rd International Conference on Water Technology, Sinai, Egypt, 23–25 May 2017. [Google Scholar]
- Horton, R.E. Drainage-basin characteristics. Eos Trans. Am. Geophys. Union 1932, 13, 350–361. [Google Scholar] [CrossRef]
- Horton, R.E. Erosional development of streams and their drainage basins; hydrophysical approach to quantitative morphology. Geol. Soc. Am. Bull. 1945, 56, 275–370. [Google Scholar] [CrossRef] [Green Version]
- Strahler, A.N. Hypsometric (area-altitude) analysis of erosional topography. Geol. Soc. Am. Bull. 1952, 63, 1117–1142. [Google Scholar] [CrossRef]
- Strahler, A.N. Quantitative geomorphology of drainage basin and channel networks. In Handbook of Applied Hydrology; Chow, V.T., Ed.; McGraw Hill: New York, NY, USA, 1964. [Google Scholar]
- Faniran, A. The index of drainage intensity-A provisional new drainage factor. Aust. J. Sci. 1968, 31, 328–330. [Google Scholar]
- Schumm, S.A. Evolution of drainage systems and slopes in badlands at Perth Amboy, New Jersey. Geol. Soc. Am. Bull. 1956, 67, 597–646. [Google Scholar] [CrossRef]
- Miller, V.C. A quantitative Geomorphic Study of Drainage Basin Characteristic in the Clinch, Mountain Area, Virginia and Tennesser; Project NR 389-042, Technical Report 3; Columbia University, Department of Geology, ONR, Geography Branch: New York, NY, USA, 1953. [Google Scholar]
- Iqbal, M.; Sajjad, H.; Bhat, F.A. Morphometric Analysis of Shaliganga Sub Catchment, Kashmir Valley, India Using Geographical Information System. Int. J. Eng. Trends Technol. 2013, 4, 10–21. [Google Scholar]
- Sangle, A.S.; Yannawar, P.L. Morphometric Analysis of Watershed using GIS and RS: A Review. Int. J. Eng. Res. Technol. 2014, 3, 599–602. [Google Scholar]
- Strahler, A.N. Quantitative slope analysis. Geol. Soc. Am. Bull. 1956, 67, 571–596. [Google Scholar] [CrossRef]
- Sonbol, M.A.; Mtalo, F.; EL-Bihery, M.; Abdel-Motteleb, M. Watershed Modelling of Wadi Sudr and Wadi Al-Arbain in Sinai, Egypt. In Proceedings of the International Conference of UNESCO Flanders Fust Friend/Nile Project—Towards A Better Cooperation, The 5th Project Management Meeting & 9th Steering Committee Meeting, Sharm El-Shiekh, Egypt, 12–15 November 2005; pp. 1–12. [Google Scholar]
- Chen, J.; Zhang, X.; Zhu, Q. Multi-objective decision making for land use planning with ordered weighted averaging method. Syst. Eng. Procedia 2011, 2, 434–440. [Google Scholar] [CrossRef]
- Malczewski, J. GIS-based multicriteria decision analysis: A survey of the literature. Int. J. Geogr. Inf. Sci. 2006, 20, 703–726. [Google Scholar] [CrossRef]
- Saaty, R.W. The analytic hierarchy process—What it is and how it is used. Math. Model. 1987, 9, 161–176. [Google Scholar] [CrossRef]
- ESRI. November 20, ArcGIS. Environmental Systems Research Institute: Redlands, CA, USA, 2017. Available online: www.esri.com (accessed on 12 September 2022).
- Othman, A.A.; Al-Maamar, A.F.; Al-Manmi, D.A.M.A.; Liesenberg, V.; Hasan, S.E.; Obaid, A.K. GIS-based modeling for selection of dam sites in the kurdistan region, Iraq. ISPRS Int. J. Geo-Inf. 2020, 9, 244. [Google Scholar] [CrossRef]
- Karlsson, C.S.J.; Kalantari, Z.; Mörtberg, U.; Olofsson, B.; Lyon, S.W. Natural hazard susceptibility assessment for road planning using spatial multi-criteria analysis. Environ. Manag. 2017, 60, 823–851. [Google Scholar] [CrossRef] [Green Version]
- Design of Dams, 2nd ed.; Research Institute of Weed Control and Channel Maintenance, Water Research Center Ministry of Public Works and Water Resources: Cairo, Egypt, 1991.
- Salem, M.N.; Nofal, S.A.; Eldeeb, H.M. Analysis of Seepage through Earth Dams with Internal Core. Int. J. Eng. Res. Technol. 2019, 8, 768. [Google Scholar]
Figure 1.
Location map of Wadi Sudr.

Figure 2.
Geological map of Wadi Sudr [30].
Figure 2.
Geological map of Wadi Sudr [30].

Figure 3.
Wadi Sudr sub-watersheds and their streams orders.

Figure 4.
Elevations of Wadi Sudr from the WMS program.

Figure 5.
The general shape of Wadi Sudr.

Figure 6.
Comparison between Sonbol and WMS outlet hydrographs at Wadi Sudr.

Figure 7.
Selected locations for proposed dams.

Figure 8.
Outlet hydrograph created by HEC-1 for the two proposed locations of dams.

Figure 9.
The cross-section in the selected locations of dams.

Figure 10.
Relation between elevation and storage capacity for the two locations.

Figure 11.
Relation between elevation and area for the two locations.

Figure 12.
The height of the water longitudinally over the cross-section of the Wadi stream in the selected location of the dam.
Figure 12.
The height of the water longitudinally over the cross-section of the Wadi stream in the selected location of the dam.

Figure 13.
Cross-section of the first proposal dam.


Table 1.
The formulas used for the computation of morphometric parameters [30].
Table 1.
The formulas used for the computation of morphometric parameters [30].
| Property | Morphometric Parameters | Formula | Author |
|---|---|---|---|
| Linear | Stream order | Hierarchical rank | Strahler (1964) |
| Bifurcation ratio (Rb) | Rb = Nu/Nu + 1 | Schumm (1956) | |
| Mean bifurcation ratio (Rbm) | Rbm = Average of bifurcation ratios of all orders | Strahler (1964) | |
| Stream length (Lu) | Length of the stream (km) | Horton (1945) | |
| Mean stream length (Lsm) | Lsm = Lu/Nu, km | Strahler (1964) | |
| Stream length ratio (RI) | RI = Lu/Lu − 1 | Horton (1945) | |
| Areal | Drainage density (Dd) | Dd = (ΣLu/Au) km/km2 where Au = area of the basin (km2) | Horton (1932) |
| Drainage texture (Dt) | Dt = ΣNu/P where P = perimeter (km) | Horton (1945) | |
| Stream frequency (Fs) | Fs = ΣNu/Au | Horton (1932) | |
| Infiltration no. (If) | If = Dd × Fs | Faniran (1968) | |
| Length of overland flow (Lg) | Lg = 1/Dd × 2 km | Horton (1945) | |
| Form factor (Rf) | Rf = Au/Lb2 | Horton (1932) | |
| Elongation ratio (Re) | where Π = 3.14 | Schumm (1956) | |
| Circularity ratio (Rc) | Rc = 4πAu/P2 | Miller (1953) | |
| Relief | Relative relief (Rhp) | Rhp = H × (100)/P where H = maximum basin relief | Melton (1958) |
| Relief ratio (Rh) | Rh = H/Lb max | Schumm (1956) | |
| Ruggedness number (HD) | HD = H × Dd | Strahler (1956) |
Table 2.
Stream order, stream number, stream length, and bifurcation ratio for Wadi Sudr.
| Stream Order | Wadi Sudr Watershed | ||||
|---|---|---|---|---|---|
| Stream Number (Nu) | Stream Length (Lu) (km) | Mean Stream Length (Lsm) (km) | Stream Length Ratio (RI) | Bifurcation Ratio (Rb) | |
| 1st | 3118 | 1019.604 | 0.327 | 0.000 | 4.500 |
| 2nd | 693 | 518.729 | 0.748 | 0.509 | 4.175 |
| 3rd | 166 | 261.664 | 1.576 | 0.504 | 4.150 |
| 4th | 40 | 141.548 | 3.539 | 0.541 | 4.444 |
| 5th | 9 | 49.389 | 5.488 | 0.349 | 3.000 |
| 6th | 3 | 28.181 | 9.394 | 0.571 | 3.000 |
| 7th | 1 | 48.778 | 48.778 | 1.731 | 0.000 |
| Mean Bifurcation Ratio (Rm) | 3.324 | ||||
Table 3.
Morphometric areal aspects of Wadi Sudr.
| Areal Parameters | Value |
|---|---|
| Drainage Density (Dd) km−1 | 3.777 |
| Drainage Texture (Dt) | 16.878 |
| Stream Frequency (Fs) km−2 | 7.361 |
| Infiltration Number (If) | 27.803 |
| Length of Overland Flow (Lg) km | 0.132 |
| Form Factor (Rf) | 0.186 |
| Elongation Ratio (Re) | 0.487 |
| Circularity Ratio (Rc) | 0.121 |
Table 4.
Morphometric relief parameters of Wadi Sudr.
| Watershed | Total Relief (m) | Relative Relief (Rhp) | Relief Ratio (Rh) | Ruggedness Number (HD) |
|---|---|---|---|---|
| Wadi Sudr | 859 | 0.360 | 0.0159 | 3244.443 |
Table 5.
The drainage system characteristics of Wadi Sudr.
| Parameter | Area (km2) | Length (m) | Precipitation (mm) | Basin Slope (m/m) | Curve Number | Lag Time (h) |
|---|---|---|---|---|---|---|
| Wadi Sudr | 547.45 | 54,165.97 | 34.5 | 0.0067 | 94 | 4.673 |
Table 6.
The dams parameters of the basin.
| Wadi Sudr Basin | Peak (m3/s) | Time (min) | Volume of Flow (m3) |
|---|---|---|---|
| Location (1) | 396.39 | 930 | 9,375,477.30 |
| Location (2) | 401.17 | 915 | 9,322,995.60 |
Table 7.
The characteristics of the two dams.
| Location (1) | Location (2) | |
|---|---|---|
| Precipitation | 34.5 mm | 34.5 mm |
| Area | 455.53 km2 | 452.97 km2 |
| Annual rainfall volume | 15,715,785 m3 (15.72 MCM) | 15,627,465 m3 (15.63 MCM) |
| Volumetric runoff coefficient | 0.4 | 0.4 |
| Runoff volume | 6.286 MCM | 6.251 MCM |
| The proposed height of the dam | 23 | 22 |
Table 8.
Criteria and rationale.
| Criteria | Rationale |
|---|---|
| Elevation | Elevation influences the location of dams/reservoirs since it affects the water accumulation and movement. Lower elevations are preferable to higher elevations. |
| Slope | Higher slopes have a higher risk of landslides and put more pressure on the foundation of the infrastructures. The higher the slope in the construction site, the lower the potential for storing water and sediment, meaning that lower slopes have more storage volumes. |
| Soil type | Soil texture, structure, and depth influence the soil type, which determines soil infiltration rates and the amount of runoff. |
| Geological condition | Construction of dam affected mainly by the geological condition of the dam site; also, geology of underlying layer effect on the losses from dam reservoir. |
| Rainfall | Rain is the primary source of runoff and reservoir recharge. Rainfall intensity and its distribution are some of the pre-requisites for designing a water harvesting system. |
| Lineaments | Lineaments are linear features on the Earth’s surface which reflect the geological structure, such as faults or fractures. Areas near lineaments are potential weakness zones for installing infrastructures. |
| Distance to village | The closer dams/reservoirs are to populations, the lower will be the costs of water transportation. |
| Distance to roads | The presence of roads and settlements close to the proposed sites will reduce the costs of water transportation. |
| Stream density | Provides the necessary runoff water for dam/reservoir function since different drainage network levels indicate different amounts of runoff water when the streams are upper stream tributaries, and main downstream streams, Areas with high drainage density ranked higher in suitability compared to areas of low drainage. |
| Land use/land cover | Areas proposed for constructing dams/reservoirs should be in or close to agricultural land to reduce the distances of farmers searching for water and the cost of transferring water from the reservoir to agricultural land. In addition, the primary objective of the dam/reservoir proposed for the study area is to assist crops field irrigation. |
| Dam height | The dam height affect directly on its cost and the dam safety; small dam ranked higher in suitability compared to the higher dam. |
| Dam length | The dam height width affect directly on its cost, long dam ranked less in suitability compared to the long dam. |
| Construction cost | The dam construction cost decreases the suitability of dam construction. |
Table 9.
Relative importance, adapted from Saaty (1986) [44].
Table 9.
Relative importance, adapted from Saaty (1986) [44].
| Intensity of Relative Importance | Definition | Explanation |
|---|---|---|
| 1 | Equal importance | Two criteria contribute equally to the objective |
| 3 | Moderate importance | Experience and judgment slightly favor one criterion over another |
| 5 | Strong importance | Experience and judgment strongly favor one criterion over another |
| 7 | Very strong or demonstrated importance | A criterion is favored very strongly over another; its dominance is demonstrated in practice |
| 9 | Extreme importance | The evidence favoring one criterion over another is of the highest possible order of affirmation |
| 2, 4, 6, and 8 | Intermediate | Can be used if necessary |
Table 10.
Site selection criteria used and level of suitability.
| Criteria | Suitability Level | |||||
|---|---|---|---|---|---|---|
| Highly Unsuitable | Not Suitable | Modestly Suitable | Suitable | Highly Suitable | ||
| 1 | Elevation (m) | 530–870 | 320–530 | 170–320 | 50–170 | 0–50 |
| 2 | Slope (m/m) | 23.5–68.6 | 14.4–23.4 | 8.2–14.3 | 4.1–8.1 | 0–4 |
| 3 | Soil | Gravel | Sand | Sandy silt | Silt | Clay |
| 4 | Geology | Pleistocene and Holocene sediments | Clastics with interbedded anhydrite and occasional limestone | Chalky limestone with flint bands and nodules at the base and thin successive chert bands on top | Gypsiferous yellowish green shale and gray to white intercalation with a thin flint band at the base | Sandy shales with phosphatic marl and limestone intercalations |
| 5 | Rainfall (mm) | 0–10 | 10–25 | 25–35 | 35–50 | 50–70 |
| 6 | Lineaments (m) | 0–100 | - | - | - | >100 |
| 7 | Distance to village (km) | >54 | 35–54 | 23–35 | 1–23 | 0–1 |
| 8 | Distance to roads (km) | 40–50 | 28–40 | 16–28 | 1–16 | 0–1 |
| 9 | Stream density | 0–0.18 | 0.18–0.30 | 0.30–0.39 | 0.39–0.49 | 0.49–0.75 |
| 10 | Land use/land cover | Evergreen forest, bare areas, artificial water bodies | Grassland, shrub lands, deciduous forest, thickets | Closed to open forest with shift cultivation, regularly flooded shrub lands | Open forest, aquatic/regularly flooded | The vegetation includes a variety of communities and species with wide tracts covered by plants |
| 11 | Dam height (m) | 0–10 | 10–22.5 | 22.5–33 | 33–43 | 43–55 |
| 12 | Dam length (m) | 600–1000 | 450–600 | 190–450 | 75–190 | 0–75 |
| 13 | Construction cost (M$) | 15.31–25.52 | 11.48–15.31 | 6.38–11.48 | 2.55–6.38 | 0–2.55 |
Table 11.
Normalized level of suitability of the criteria.
| Criteria | 1 | 2 | 3 | 4 | 5 | 6 | 7 | 8 | 9 | 10 | 11 | 12 | 13 | SI | |
|---|---|---|---|---|---|---|---|---|---|---|---|---|---|---|---|
| Weight | Location 1 | 7 | 9 | 5 | 7 | 5 | 1 | 7 | 7 | 7 | 9 | 5 | 7 | 7 | 6.38 |
| Location 2 | 5 | 9 | 5 | 5 | 5 | 1 | 7 | 5 | 5 | 9 | 3 | 5 | 7 | 5.46 | |
Table 12.
The proposed dam dimensions.
| Parameters | Value |
|---|---|
| Crest width (b) m | 9 |
| Dam length (L) m | 180 |
| Dam height (H) m | 27 |
| Water height (h) m | 23 |
| U.S. and D.S. side slope (z:1) | 2:1 |
Publisher’s Note: MDPI stays neutral with regard to jurisdictional claims in published maps and institutional affiliations. |
© 2022 by the authors. Licensee MDPI, Basel, Switzerland. This article is an open access article distributed under the terms and conditions of the Creative Commons Attribution (CC BY) license (https://creativecommons.org/licenses/by/4.0/).
Share and Cite
MDPI and ACS Style
Ramadan, E.M.; Shahin, H.A.; Abd-Elhamid, H.F.; Zelenakova, M.; Eldeeb, H.M. Evaluation and Mitigation of Flash Flood Risks in Arid Regions: A Case Study of Wadi Sudr in Egypt. Water 2022, 14, 2945. https://doi.org/10.3390/w14192945
AMA Style
Ramadan EM, Shahin HA, Abd-Elhamid HF, Zelenakova M, Eldeeb HM. Evaluation and Mitigation of Flash Flood Risks in Arid Regions: A Case Study of Wadi Sudr in Egypt. Water. 2022; 14(19):2945. https://doi.org/10.3390/w14192945
Chicago/Turabian StyleRamadan, Elsayed M., Hossny A. Shahin, Hany F. Abd-Elhamid, Martina Zelenakova, and Hazem M. Eldeeb. 2022. "Evaluation and Mitigation of Flash Flood Risks in Arid Regions: A Case Study of Wadi Sudr in Egypt" Water 14, no. 19: 2945. https://doi.org/10.3390/w14192945
Note that from the first issue of 2016, this journal uses article numbers instead of page numbers. See further details here.