Article

Perspectives for Quality Evaluation of Some Mineral Waters from Slanic Moldova

1
Faculty of Engineering, “Vasile Alecsandri” University of Bacau, 156 Calea Marasesti, 600115 Bacau, Romania
2
“Dimitrie Ghika” Technical College Comanesti, 1, Liceului Street, 605200 Comanesti, Romania
3
Faculty of Science, “Vasile Alecsandri” University of Bacau, 156 Calea Marasesti, 600115 Bacau, Romania
4
Bacau Water Quality Laboratory, 1, Cuza Voda Street, 600274 Bacau, Romania
*
Authors to whom correspondence should be addressed.
Water 2022, 14(19), 2942; https://doi.org/10.3390/w14192942
Submission received: 7 July 2022 / Revised: 7 September 2022 / Accepted: 18 September 2022 / Published: 20 September 2022
(This article belongs to the Special Issue Geochemistry of Groundwater Used in Balneotherapy and Spa Treatments)

Abstract

:
In the present study, using a combination of several analytical techniques such as conductometry/total dissolved solids (TDS), pH-metry, ICP-MS and UV-Vis spectrometry, 38 parameters (Na, K, Mg, Ca, Al, Fe, B, Li, Cr, Mn, Ni, Cu, Zn, Se, Sr, Ag, Cd, Ba, Pb, Be, V, Co, Ga, As, Rb, Cs, Hg, Tl, U, F , Cl , SO 4 2 , NO 3 , NO 2 , HCO 3 , CO 2 , electric conductivity (EC)/TDS and pH) for seven natural mineral waters (springs 1 bis, 5, 10, 14, 15, Sonda 2 and Sfantul Spiridon) from the Slanic Moldova area (Romania) were evaluated. Our data were compared with the historical chemical analyses records and also with the limits established by international and Romanian regulations for qualitative evaluation of natural mineral waters. In the case of the Evolution of the mineralization degree over time, it was observed that, in the interval 1933–2021, for all the studied sources, there were variations of mineralization that could be attributed to climatic and geological changes, mode of exploitation, as well as to analysis techniques used. Although decreases in mineralization were observed between 1981 and 2006 for water sources 1 bis, 10, 15 and S2, with a slight recovery and stability period between 2006 and 2021, they have retained their characteristics over time. Moreover, spring 14 retains its status as the most mineralized spring of the seven, although it also recorded a decrease in the mineralization degree between 2013 and 2018. Even if the concentration of major and minor ions showed some variation, highlighting the diversity of the water intakes and its changes over time for some of the springs, it is noticeable that these springs have kept their characteristics over time. It was identified that Sodium ( Na + ) was present in all natural mineral waters but predominated in sodium chloride, sodium bicarbonate and sodium sulfate. The concentration of potassium ion has shown a fairly significant fluctuation, in 2006 being registered the lowest values for most sources: 1 bis (88.00 mg/L), 5 (6.00 mg/L), 10 (81.00 mg/L), 14 (115.00 mg/L), 15 (45.20 mg/L), S2 (11.00 mg/L). By means of ICP-MS, trace elements that have never before been tested or reported were identified, thus completing the chemical fingerprint of these natural mineral waters to increase their value for routine or therapeutic uses or further sustainable exploitation.

1. Introduction

Natural mineral water is a renewable resource whose sustainability requires strict management. Respecting the sources, taking care to preserve the quality and purity of the water, and protecting the balance of local ecosystems are all the more important as natural mineral water is a product that is part of the territorial identity and history of a region. The water quality level for specific uses is reflected in national [1], European [2,3] and worldwide regulations [4] not only for drinking purposes but also for the reduction and removal of potentially toxic substances from water. Water analysis is conclusively not only for the quality assessment of water but also for the study of water origin and evolution, considering water-soil and water-rock influences, pollution factors, natural and anthropogenic influences, and exploitation regulations.
Water passes through many different layers of soil and rocks, thus enriching itself with a wide variety of dissolved substances. The result is a complex water composition that can be defined as a hydro-chemical fingerprint. Even if some of them are heavy or radioactive metals, their concentrations in natural mineral waters do not exceed the maximum limit allowed by current legislation [1,2].
According to data from the literature, both classical methods of qualitative and quantitative analysis based on gravimetric, volumetric or electrochemical determinations and modern instrumental analysis techniques are commonly used for the analysis of natural mineral waters: liquid (IC, HPLC, HPLC-MS) [5,6,7,8,9,10], gas chromatography (GC-ECD, GC-NPD) [8,9,10,11,12,13,14,15,16], atomic spectroscopy (F-AAS, GF-AAS, AFS, ICP-AES, ICP-MS), [16,17,18,19,20] UV-Vis and IR molecular spectroscopy [18,19,20,21,22,23,24,25,26]. To these are added fluorescence spectroscopy [27] used to monitor the microbiological quality of bottled mineral water, but also to highlight the content of organic matter, gamma spectrometry [28,29] to measure radioactivity or techniques for sensory evaluation—“electronic tongue” [30].
Moreover, based on these data, numerous methods and models have been proposed and used for chemical characterization and classification of natural mineral waters (e.g., Haywood [31], Palmer [32], Kurlov [33], Piper [34], Stuyfzand [35], Van Wïrdum [36]).
The application, over time, of different methods and techniques of work has proved its effectiveness in research conducted to highlight the specific characteristics of natural mineral waters in a given region, confirming that there are no identical waters in terms of composition and possible applications in the food, cosmetics, pharmaceutical or spa industries.
The fingerprint permits the identification of each type of water, and it is based on the identification of major anions, cations and physicochemical parameters, which is completed by the determination of trace elements, even if their existence is very sensitive to geological changes or anthropogenic influences or geological changes. For determining the fingerprint of water, the inductively coupled plasma-mass spectrometry (ICP-MS) is particularly suitable for this purpose due to the possibility of rapid multi-element analysis in combination with excellent detection limits [37,38,39].
As mentioned in reference works [40,41,42,43,44,45,46,47,48,49], as a result of its complex geological structure, Romania has a wide variety of types of natural mineral waters, with over 2000 springs throughout the territory that have earned a well-deserved reputation for quality and health benefits.
The spa resort Slanic Moldova of Bacau County, located in the east of Romania, on sandstone deposits of Kliwa or Tisești, in a depression surrounded by coniferous and deciduous forests, also called the “Pearl of Moldova”, is distinguished by an extremely valuable potential of natural mineral waters [50,51,52]. The mineral springs in this area, discovered in 1801, soon attracted the attention of many scientists both for the originality of the chemical composition and its healing potential, being awarded gold medals at prestigious international exhibitions of balneology (1833—Vienna Exhibition; 1894—Bucharest; 1900—Universal Exhibition in Paris, etc.) [53,54].
Although the monitoring and evaluation process was intermittent, the data mentioned in the literature [55] indicate an important nutritional and therapeutic potential of natural mineral waters from Slanic Moldova, noting the possibility of using them as a table drink or support for treating a wide range of diseases.
From the analysis of the published data (1933 [50], 1957 [55], 1981 [56], 2006 [57], 2013 [58], 2018 [59], 2019 [60]) regarding the composition of these waters, it is found that the determinations performed aimed only the evaluation of the content in major components. Thus, since 1933, some cations ( Na + , Mg 2 + , Ca 2 + , K + , Fe 2 + , Al 3 + , NH 4 + ), anions ( NO 3 , Cl , Br , I , SO 4 2 , HCO 3 ), gases ( CO 2 , H 2 S ) and undissociated substances ( HBO 2 , H 2 SiO 3 ) have been identified using common analytical methods [50]. In addition to these elements, studies from 1951 to 1961 mentioned the presence of Mn and Li, which provide the natural mineral waters from Slanic Moldova with new attractive therapeutic properties [55].
In the general context of water resources management (scarcity, potable water, mineral water valorification, etc.), all sources must be considered very important. The Slanic Moldova area was a historical tradition in mineral water valorification, but over time, for economic reasons, the potential was not properly evaluated. In order to determine the optimum potential of the area, it is very important to evaluate in the first stages the mineral water quality by using validated scientific methods. So, the main objective of the study was to evaluate the mineral water quality using electrochemical and spectroscopic methods (conductometry/TDS, pH-metry, ICP-MS and UV-Vis spectrometry) for the chemical characterization of seven representative natural mineral waters from the Slanic Moldova area. Moreover, some historical data were discussed in order to create a better evaluation of the water’s quality over time and for the possible bottling and storage perspective.

2. Materials and Methods
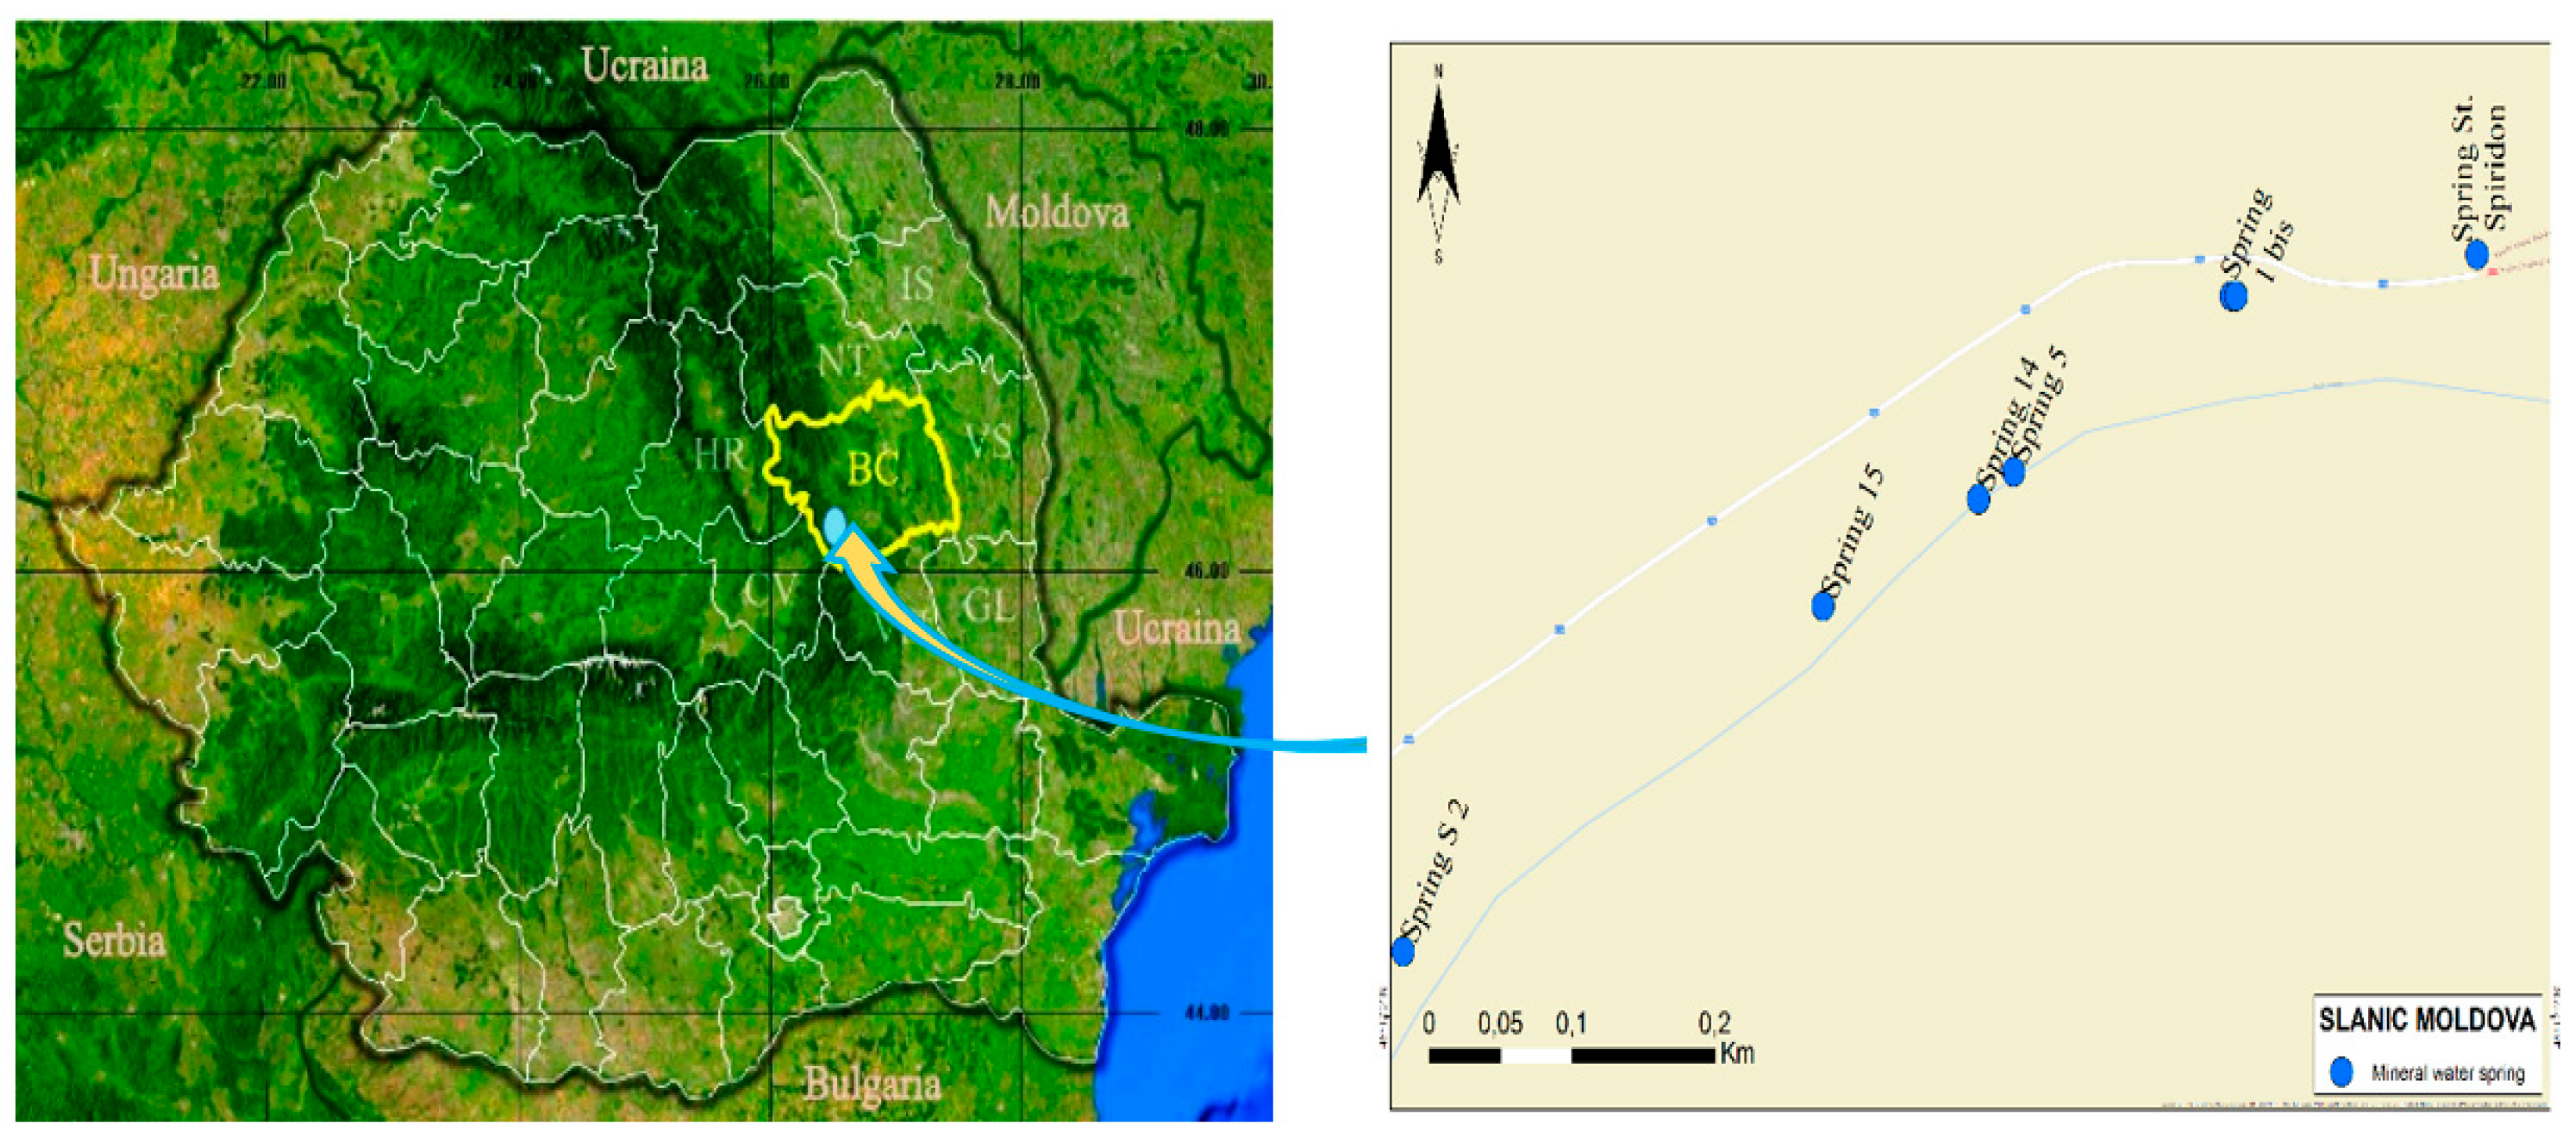
2.1. Sampling

Water samples were collected in January 2021 into 500 mL sterile glass bottles (LBG 3.3, with blue threaded lid (GL 45), graduated, transparent, autoclavable). The bottles were carefully rinsed with the sample (three times), filled to the top and then transported to the laboratory as soon as possible.
The selection of the 7 springs (1 bis, 5, 10, 14, 15, Sonda 2 (S2), and Sfantul Spiridon (SS)) was based on both historical data [50,51,52,53,54,55,56,57,58,59,60] and our previous studies [61,62]. These selected mineral water sampling points (Figure 1) exhibit therapeutic use, are accessible to the public and have a relatively constant flow.
All samples were stored in refrigeration conditions for 24 h (4 °C, in the absence of light). No chemicals were added to preserve the water as it is supposed to be used for human consumption, despite nitric acid mineralization being recommended and should be performed in accordance with ISO 15587-2 [63]. The natural mineral waters were analyzed within 24 h after sampling using electrochemical, UV-Vis and ICP-MS methods.

2.2. Measurement Techniques

Analytical techniques and selected parameters were considered, following the recommendations of Romanian regulations [1] and Standard Methods [4,64,65] (e.g., conductometry, pH, ICP-MS and UV-Vis spectroscopy were used in the determination of the physicochemical (TDS and pH) and chemical parameters).

2.2.1. Total Dissolved Solids (TDS) and pH

The conductivity/TDS and pH were measured using a Thermo Scientific™ Orion™ Versa Star Pro™ Multiparameter Benchtop Meter (produced by Thermo Fisher Scientific, Waltham, MA, USA) provided with DuraProbe conductivity cell 013005MD [66] and ROSS Ultra pH/ATC Trode electrode.

2.2.2. UV-Vis

The HACH DR 3900 spectrophotometer (Hach, CO, USA) was used for measuring the concentration of the following: Fe 2 + , Mn 2 + , Cu 2 + , total Cr, F , Cl , NO 3 , SO 4 2 , HCO 3 , CO 2 (Table 1).
The calibrations, standard solution sample preparations and measurements were performed according to HACH procedures [67]. All reagents (LCK Cuvette Test Parameters) used to perform the analyses were purchased from Hach Company (Loveland, CO, USA).

2.2.3. ICP-MS

ICP-MS method to scan the water for trace elements such as Cd, Ni, Cr, Pb, Cu, Co, Zn, Ca, Mg, Hg [68,69] was implemented in European countries [70] as an advanced technique for monitoring water quality.
The multi-element scanning of the natural mineral waters from Slanic Moldova was performed by ICP-MS, using an inductively coupled plasma mass spectrometer Agilent 7500cx ICP-MS (produced by Agilent Technologies, Santa Clara, CA, USA).
Timing of 90–10–90 s of uptake-acquisition-washout for Group 1; 90–60–90 s for Groups 2 and 3 was determined to be adequate for these procedures.
Nitric acid of analytical grade was purchased from Merck (Romania). All solutions, samples and reference materials were prepared in 1% v/v HNO3. Purified water of 18.2 MΩ cm–1 type Milli Q Plus was used for preparation and/or dilution of solutions, if necessary. In order to determine the dissolved fractions of the elements, the samples were filtered on filter membranes with a nominal pore size of 0.45 µm. Each batch of filter membranes had been inspected for impurities. Several portions of the sample were used to wash the filter device, which was discarded, and then the required volume of filtrate was collected. Mixed-element reference solutions were prepared from 1000 mg/L single-element standard solutions (Aldrich, St. Louis, MO, USA). For Na determination, the samples were diluted 1:50 as a general rule due to higher element concentration in water samples. The limited calibration range was chosen to allow for more accurate measurements in the low concentration range.
There were three groups of elements traced (Table 2): Group 1: Na, K, Mg, Ca, Al, Fe and B); Group 2: general trace elements (Li, Cr, Mn, Ni, Cu, Zn, Se, Sr, Ag, Cd, Ba and Pb); and Group 3: special trace elements of interest to fingerprint ground waters (Be, V, Co, Ga, As, Rb, Cs, Hg, Tl, and U) [1,2,3,4]. The elements were split in three groups in order to streamline multi-elemental detection capability by adjusting the time for each one.
The residence time value for the evaluated parameters was different: the Na was 0.05 ms, K Mg and Ca was 1, Al 5, Fe and B 10 ms. For 12 parameters (Li, Cr, Mn, Ni, Cu, Zn, Se, Sr, Ag, Cd, Ba and Pb), the residence time was 10 ms and for 10 parameters (Be, V, Co, Ga, As, Rb, Cs, Hg, Tl and U) the residence time value was 20 s.

2.3. Programs Used for Data Processing

The data obtained were processed using the IBM SPSS Statistics software, version 20.0 (SPSS Inc., Chicago, IL, USA). The graphs and figures were made using the OriginPro 2019b software (OriginLab, OrginPro 2019b, Northampton, MA, USA). The maps were drawn using ArcGIS Maps for SharePoint 4.2 software (Esri Romania S.R.L., Bucharest Romania Inc.) and the WaterShed application [61].

3. Results

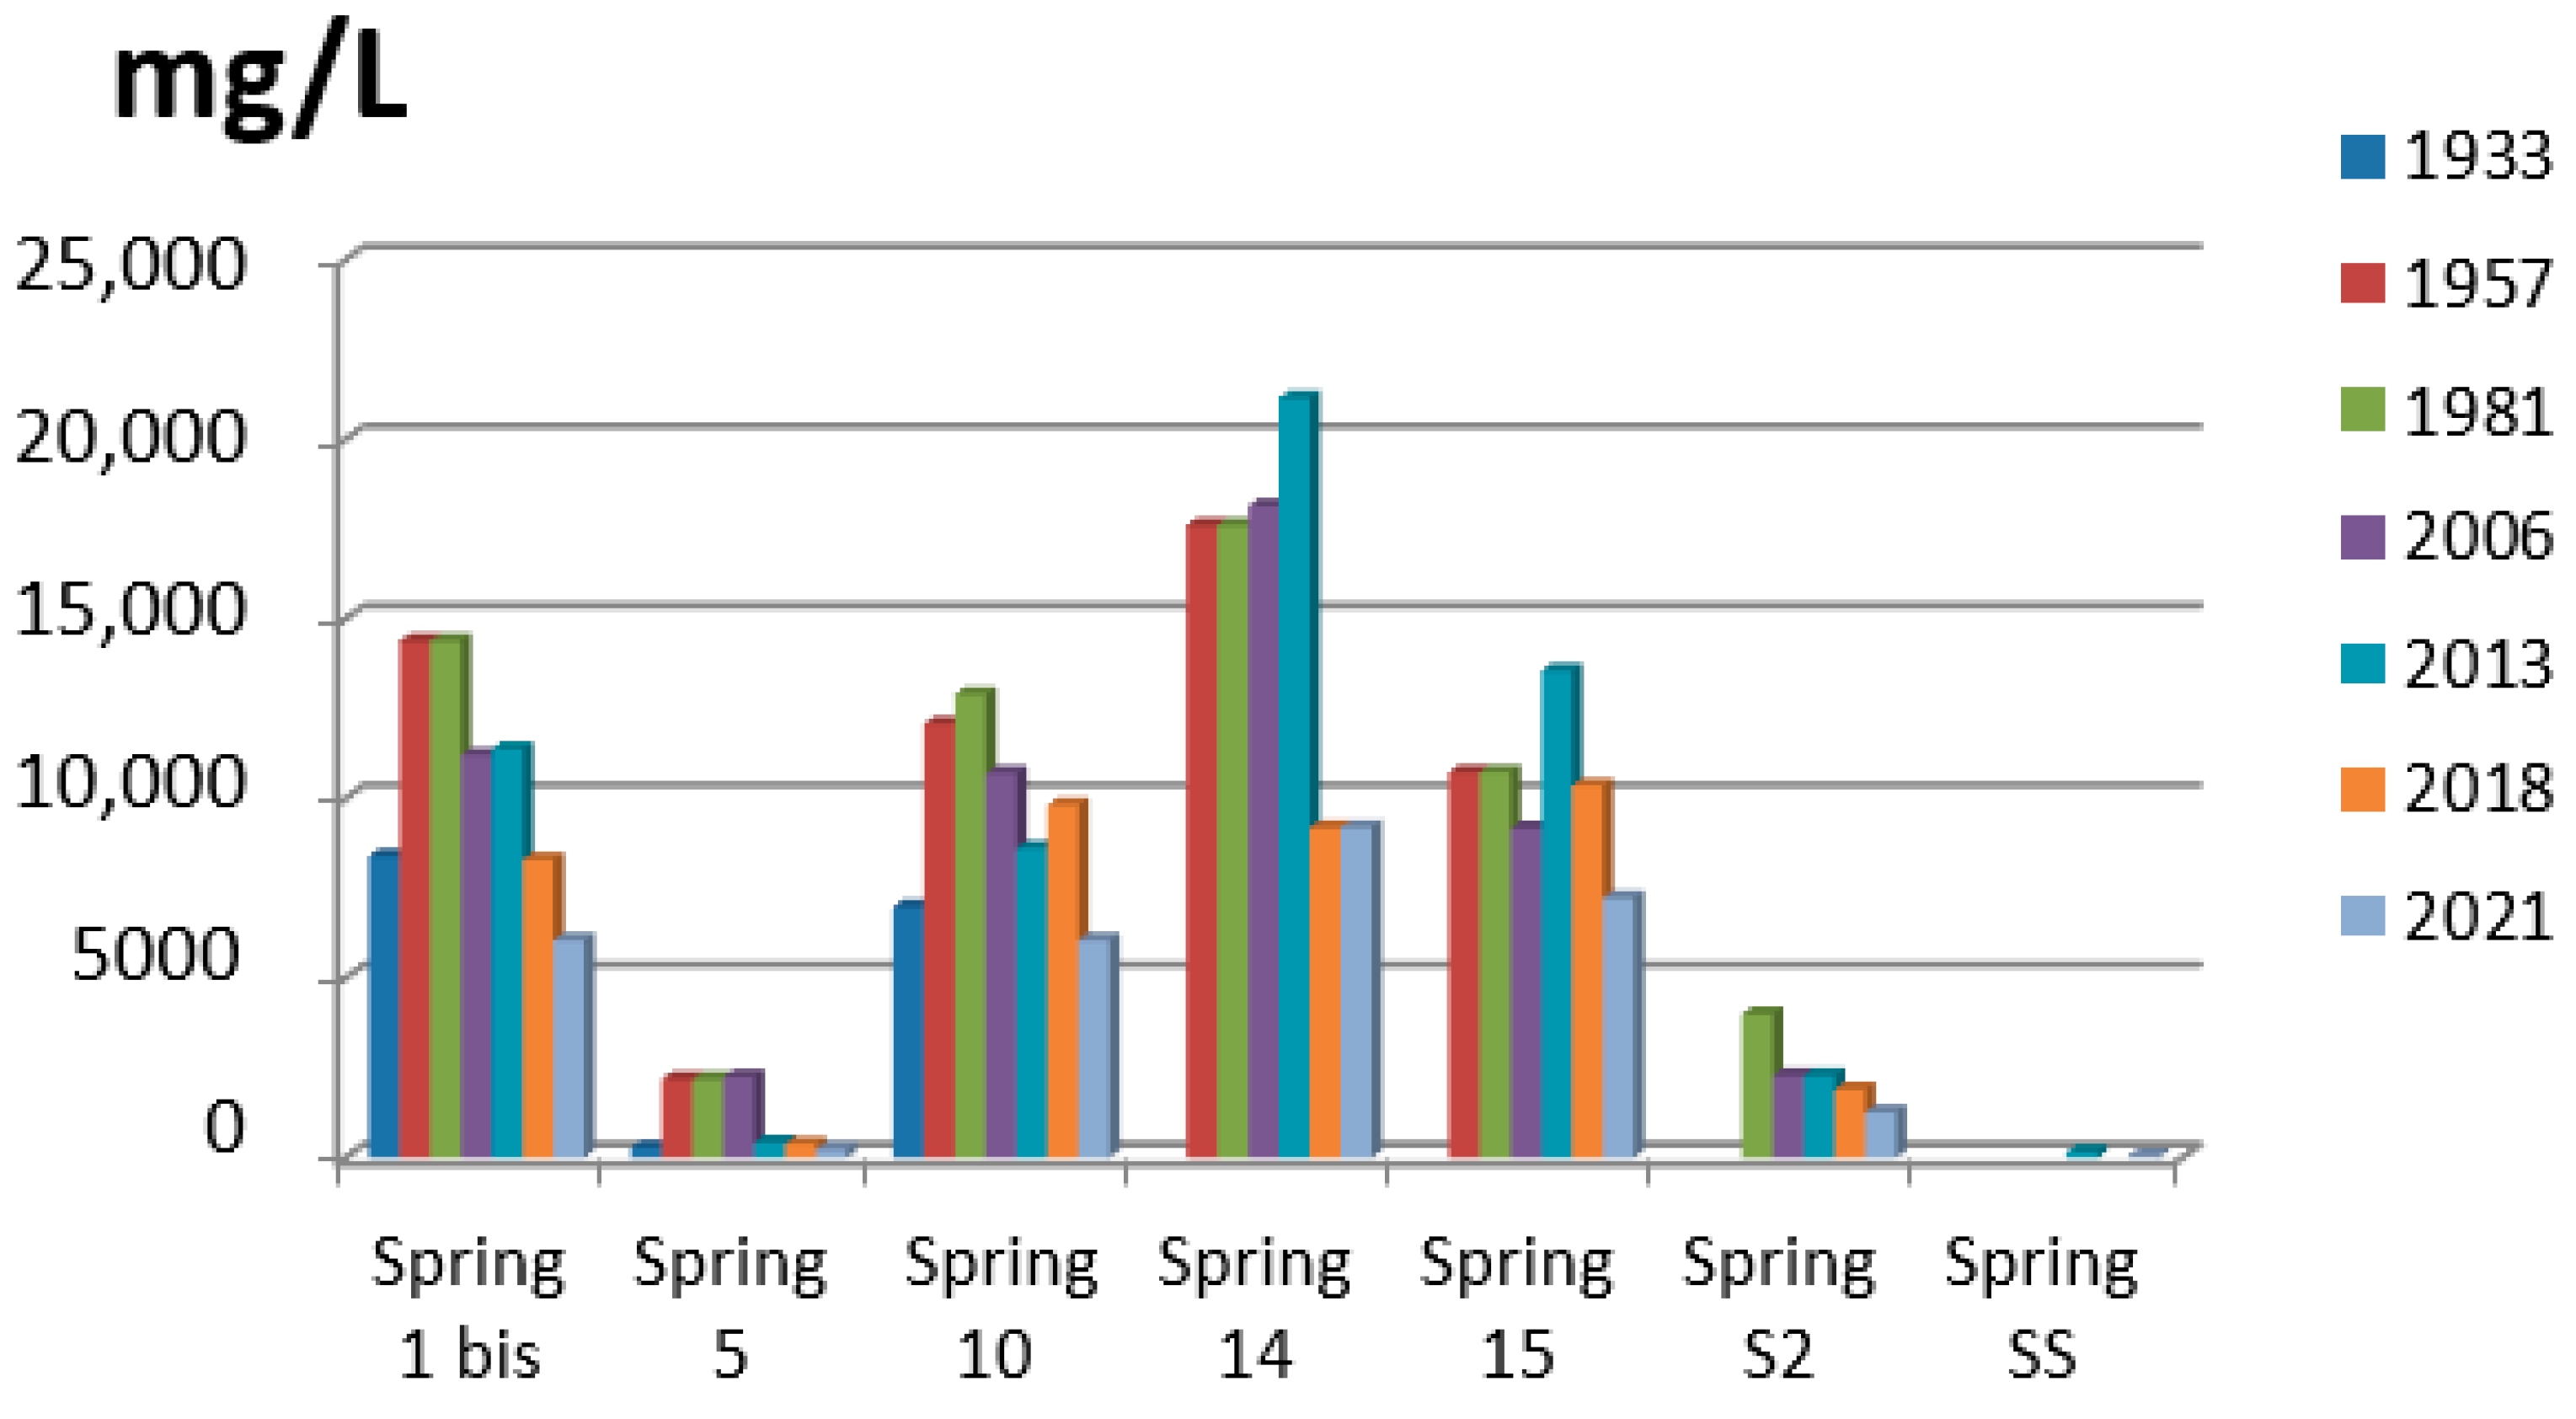
3.1. Evolution of the Mineralization Degree over Time

Comparative analysis of the mineralization degree of the studied natural mineral waters using historical records for 1933 [50], 1957 [55], 1981 [56], 2006 [57], 2013 [58], 2019 [59] and more recent data obtained in the present research (2021) are shown in Figure 2.
From the data presented in Figure 2, it is observed that, in the interval 1933–2021, for all the studied sources, there were variations of mineralization that could be attributed to climatic and geological changes, mode of exploitation, as well as to analysis techniques used. Although decreases in mineralization were observed between 1981 and 2006 for sources 1 bis, 10, 15 and S2, with a slight recovery and stability period between 2006 and 2021, they have retained their characteristics over time. Moreover, spring 14 retains its status as the most mineralized spring of the seven, although it also recorded a decrease in the mineralization degree between 2013 and 2018. According to the present study and the data provided in 2013 by the National Institute of Recovery, Physical Medicine and Balneology, the least mineralized is the SS spring which falls into the category of oligomineral waters.

3.2. Evaluation and Comparative Analyses of the Quality Indicators of the Natural Mineral Waters

The results of our study concerning the species determined by UV-Vis spectrophotometry ( Fe 2 + , Mn 2 + , Cu 2 + , total Cr, F , Cl , SO 4 2 , NO 3 , NO 2 , HCO 3 , CO 2 ) were compared with literature data [56,57] (Table 3).

3.3. Determination of Major and Trace Elements Using ICP-MS
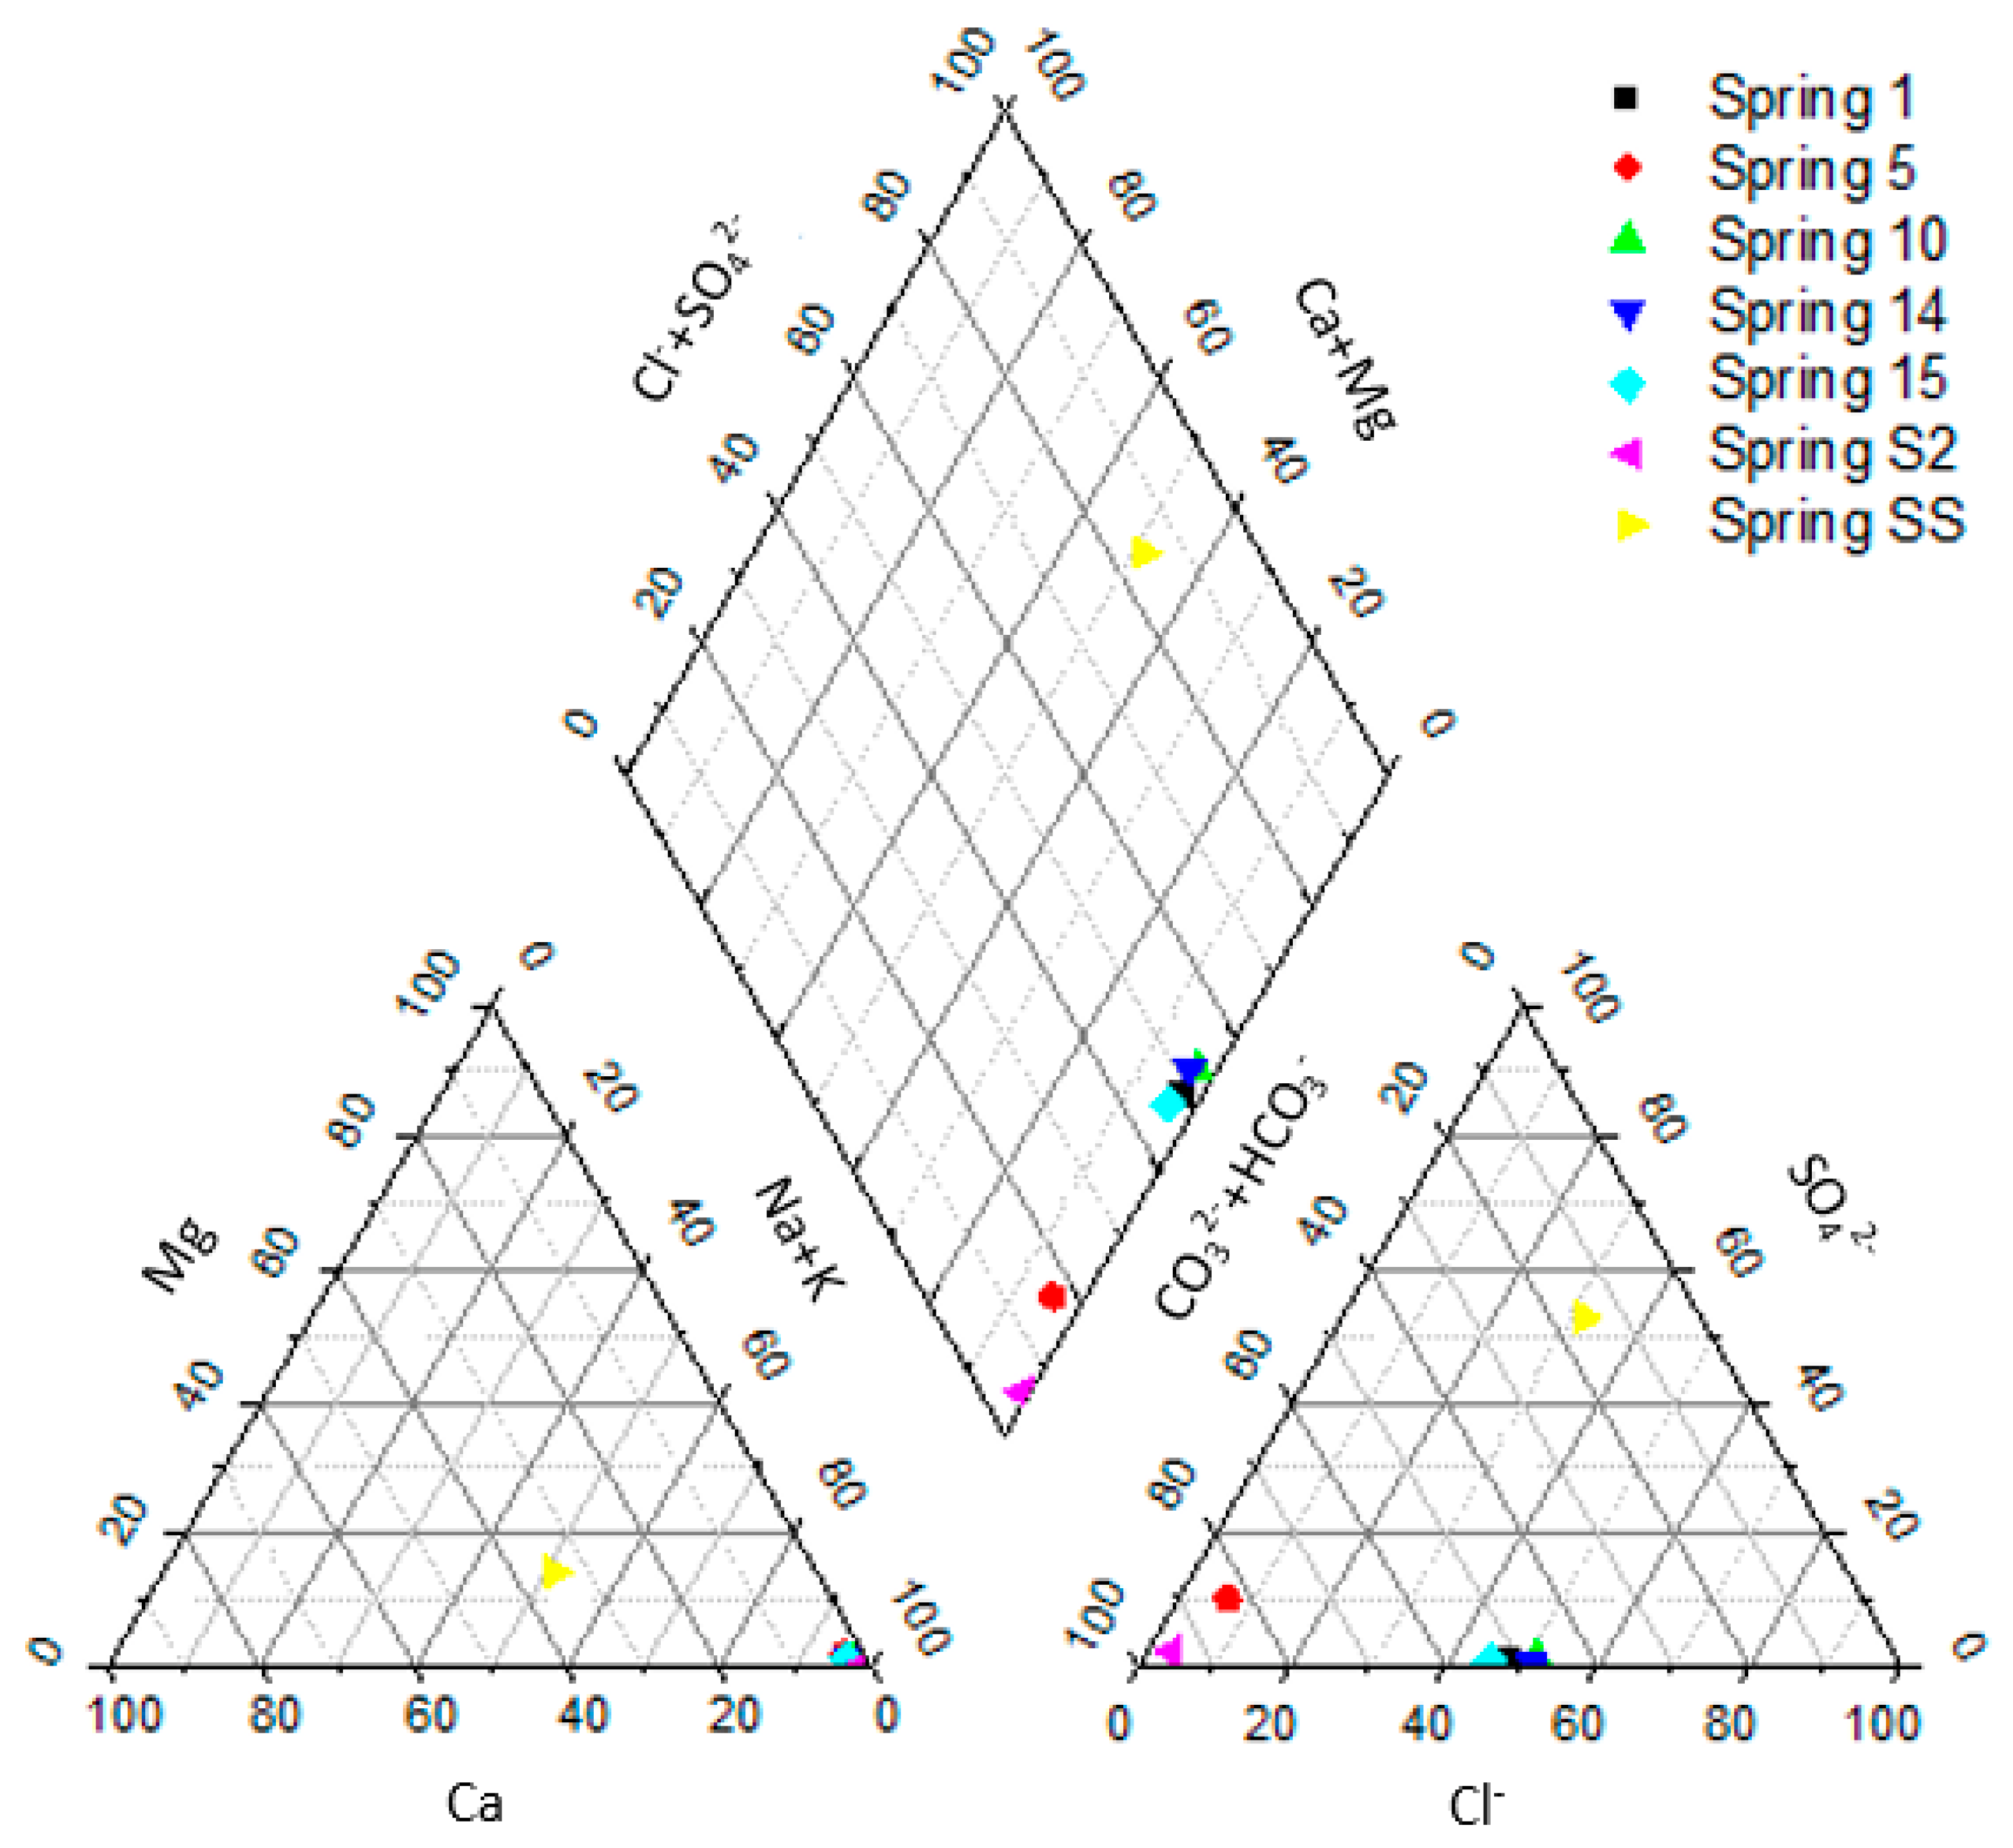
The elements identified in the natural mineral waters from Slanic Moldova are presented in Table 4 as an average of two repeated determinations for each water for 24 h after sampling.
Sodium ( Na + ), present in all natural mineral waters but predominating in sodium chloride, sodium bicarbonate and sodium sulfate, has its origin in the residual salinity of sedimentary rocks. Fossil waters and those that infiltrate the salt massifs also contain sodium chloride [47].
Excepting springs 5 and SS, the natural mineral waters from Slanic Moldova fall into the category of sodium-rich waters. The source that contains the most sodium is spring 14. The sodium concentration has remained relatively constant over time for springs 10, 14 and 15. According to literature data [56,57], there is a significant increase in the concentration of Na for source 5, from 34.05 mg/L in 1933 to 96.87 mg/L in 2021; meanwhile, springs 1 bis and S2 show a decrease in the sodium content of approximately 30% in the period 1981–2021.
Coming from feldspar and mica rocks, as well as from the residual salinity of sediments, potassium ( K + ) has a higher concentration in natural mineral waters because it is retained in clayey rocks [47].
Over time, the concentration of potassium ion has shown a fairly significant fluctuation, in 2006 being registered the lowest values for most sources: 1 bis (88.00 mg/L), 5 (6.00 mg/L), 10 (81.00 mg/L), 14 (115.00 mg/L), 15 (45.20 mg/L), S2 (11.00 mg/L) [57]. Currently (Table 4), the highest concentration in potassium is shown for spring 14 (165.30 mg/L), followed by springs 10 (147.70 mg/L), 1 bis (108.70 mg/L) and 15 (105.40 mg/L). The SS (4.95 mg/L) and S2 (7.06 mg/L) springs have the lowest K + content.
Magnesium ( Mg 2 + ) is present in natural mineral waters, usually together with calcium; alkaline-earth waters contain both calcium and magnesium—in bitter waters, the latter is found as magnesium sulfate. The origin of magnesium in natural mineral waters is found in dolomitic rocks (double calcium and magnesium carbonates).
Compared to 1981 [56], currently springs 14 (49.40 mg/L), 10 (31.47 mg/L) and 15 (31.19 mg/L) are richer in magnesium, while for sources 1 bis (23.68 mg/L) and S2 (1.55 mg/L) a decrease in Mg 2 + concentration was found.
The average recovery rate for each investigated element ranged from 93 to 109 % (Table 4).

3.4. Piper Diagram

The influence of the amount of the major cations ( Na + ,   K + , Ca 2 + ,   Mg 2 + ) and anions ( Cl , SO 4 2 , CO 3 2 ,   HCO 3 ) on the characteristics of the studied natural mineral waters is also noticeable in the Piper diagram (Figure 3).
The results presented in Figure 3 evidence that there are three types of water patterns for the analyzed samples. Moreover, according to the diagram, we observe that four out of the seven natural mineral waters (1 bis, 10, 14 and 15) have similar characteristics: alkaline waters, mixed type (Na-K-HCO3-Cl), without predominant anion.
In the case of waters from springs 5 and S2, also alkaline, the predominance of bicarbonate anion is noticeable, while the water from the SS spring belongs to the mixed type Ca-Mg-Na-K-SO4, in which the concentration of weak acids is exceeded by that of strong acids.

4. Discussion

As can be seen from the interpreted results, in the period 1981–2021, the amount of iron in the analyzed natural mineral waters decreased, and the values registered in 2021 (between 0.02–4.43 mg/L) are kept above those indicated in the standards (0.3 mg/L allowed concentration) for 2 out of the 7 springs. This result indicates that unlike sources SS (0.02 mg/L), S2 (0.05 mg/L), 1 bis (0.057 mg/L), 10 (0.14 mg/L), 14 (0.15 mg/L), the water of springs 15 (2.89 mg/L) and 5 (4.43 mg/L) encountering a larger variety of minerals, the ferruginous character is accentuated.
The amount of Mn 2 + is slightly higher for the sources 1 bis (1.15 mg/L), 10 (1.55 g/L), 14 (1.72 mg/L) and 15 (1.65 mg/L), while the concentrations of Cu 2 + and total chromium fall within the limits defined by applicable standards.
The analysis of the determined fluoride quantities indicates an important presence in the water of spring 5—spring for external use (130 mg/L) and SS (17.00 mg/L).
The concentration of NO 3 and NO 2 , important parameters in the monitoring process, providing information on the quality of natural mineral waters, falls within the limits allowed by the applicable standards for all the 7 springs.
Although springs 10, 14 and 15 currently have the highest chloride anion content, over time, springs 1 bis and 10 have maintained their concentration best. The source of SS has the lowest concentration in Cl - , followed by sources 5 and S2.
Spring 5 has the highest concentration of sulfate ions of all natural mineral waters in Slanic Moldova, a concentration preserved over time, maintaining its “vitriolic” water characteristics. For most of the analyzed sources, there is an increase in the concentration of SO 4 2 - ion during the studied/analyzed period. Springs 15, S2 and SS recorded the largest increase in sulfate anions content.
Regarding the hydrogen carbonate ion, three out of the seven sources (1 bis, 10 and S2) have best preserved their characteristics over time. Springs 14 and 15 show variations in the concentration of HCO 3 , without losing the quality of bicarbonate water. The SS spring, with a concentration of 230 mg/L, falls into the category of still water springs.
Except for the S2 and SS springs, the waters of Slanic Moldova are carbonated, even though the concentration of carbon dioxide has decreased over time. Although source 14 initially had the highest concentration of CO 2 , it has decreased over time, spring 1 bis being currently the richest in carbon dioxide content.
Calcium ( Ca 2 + ), present in many natural mineral waters, comes from geological layers (calcareous sedimentary rocks and gypsum).
For five (1 bis, 5, 10, 14 and 15) out of the six sources evaluated between 1957 and 2006 [55,56,57], the concentration of Ca 2 + ions remained constant; in 2021, the values determined for springs 5 (5.16 mg/L), 10 (76.70 mg/L), 14 (127.10 mg/L) and 15 (92.99 mg/L) were comparable to those reported in 1957.
A Ca 2 + :   Mg 2 + ratio range between 1.7 and 2.6 has been suggested to be optimal in the organism [71], so in the consumed water, the same proportion should be found. With the exception of spring 5 (for external use), which has a ratio of 1.69, and springs 15 and S2, which exceed the value of 2.6, for the other four sources, this ratio falls between 2.43 (SS) and 2.57 (spring 14).
Although ICP-MS is a more advanced analysis technique, the results of UV-Vis (Table 3) and ICP-MS (Table 4) concentration values for Fe 2 + , Mn 2 + , Cu 2 + , total Cr are magnitude comparable and in accordance with the characteristics of the 7 springs.
The determination of the elements from group 1 revealed the presence of boron in a significant amount (between 20.95 mg/L and 33.52 mg/L) in 5 of 7 sources: 1 bis, 10, 14, 15 and S2.
Among the elements included in the second group, the presence of lithium, zinc, selenium, strontium and barium is reported in all sources; silver is present in four (1 bis, 10, 14 and 15) out of the seven sources.
All the trace elements shown in Table 4, including heavy or radioactive metals, are present within the maximum allowable limits for natural mineral waters [1,2,4].
Both ICP-MS and UV-Vis reveal a complex water composition specific to each spring. The fingerprint of each water spring has great importance for its therapeutic uses.
Spring 1 bis (pH = 6.2) has a high content of essential minerals for the human body (Na, Mg, Al, K, Ca, Fe, B) [72] and trace elements with known biological uses [73] (Li, Cr, Mn, Ni, Cu, Zn, Se, Sr, Ba, Be, V, Co, Rb, Cs, Tl). Source 1 bis contains small amounts of U and Hg, far below the maximum allowed limit (0.001 mg/L) and amounts of Ag (0.03 µg/L).
Spring 5 (pH = 4.5) is siliceous and ferruginous water, containing K, Al, Ca, Fe, Mg, Si, Mn, is recommended for external use. This mineral water has some property and composition similar to that of Avène and Herculane thermal waters [74]: fixed residue 238 mg/L, Ca 2 + :   Mg 2 + ratio = 2, very rich in trace elements (B, Li, Cr, Cu, Zn, Se, Sr, Ba, Be, V, Co, Ga, As, Cs).
Spring 10 (pH = 6.4) is a carbonated, bicarbonated, chlorinated water rich in Na, K, Ca, Mg, Al, Fe, B, that contains significant amounts of Li (1166 µg/L) and Mn (1103 µg/L), along with trace elements: Ag, Se, Ba, Sr, Zn, Cu, Co, Cr, Ni, Be, V, Ga, As, Rb, Cs. Moreover, source 10 contains small amounts of U and Hg, below the maximum allowed limit (0.001 mg/L).
Spring 14 (pH = 6.3) is a hypertonic, carbonated, bicarbonated water, with a high chloride content, which falls into the category of ferruginous waters due to its high iron content. Source 14 contains the highest amounts of Na (4438 mg/L), Mg (50 mg/L), K (165.3 mg/L), Ca (130 mg/L), B (35 mg/L), Li (1390 µg/L), Mn (1102 µg/L), Cu (98.05 µg/L) and Ag (0.075 µg/L) of all natural mineral waters in Slanic Moldova and small amounts of trace elements (Be, V, Co, Ga, As, Rb, Cr, Se, Ni, Zn).
Spring 15 (pH = 6.4) has a composition similar to spring 14 of carbonated, bicarbonated, sodium-chlorinated, ferruginous water, but with slightly lower concentrations of Na, Mg, Al, Ca K, Fe ions. Moreover, this spring contains Ag (0.208 µg/L) and trace elements such as: Li, Cu, Zn, Se, Sr, V, Ga, Rb and Cs.
Spring Sonda 2 (S2) is an alkaline water (pH = 8.1) with an average concentration of Na, K, Ca, B, Mg, Al, and rich in trace elements (Li, Cr, Cu, Se, Sr, Ba, Be, V, Ga, Rb).
Spring Sfantul Spiridon (SS) is a low sodium water (pH = 5.5), rich in Ca, Mg, K, Al, and trace elements (Li, Cr, Mn, Ni, Cu, Zn, Se, Sr, Ba, B, Be, V, Co, Ga, Rb), aerated, with a pleasant taste, has all the physicochemical qualities of a drinking water.
In addition, a good correlation between the major constituents of these natural mineral waters was confirmed by the results of the conductometric measurement of TDS (water mineralization according to Figure 2 data), as well as by the construction of the Piper diagram.

5. Conclusions

In this study, in order to analyze and scan seven different mineral water springs (1 bis, 5, 10, 14, 15, Sonda 2 and Sfantul Spiridon) from the Slanic Moldova resort, a combination of the following techniques were used: ICP-MS, UV-Vis and conductometry/TDS.
The application of the ICP-MS instrumental technique allowed, first of all, the highlighting of the presence of trace elements (Ni, Cu, Zn, Sr, Ag, Cd, Ba, Pb, Be, V, Co, Ga, As, Rb, Cs, Hg, Tl, U) that have not been mentioned in previous studies. Moreover, this method confirmed the data from the literature regarding the content of these waters in major cations ( Na + , K + , Mg 2 + , Ca 2 + ), as well as the determinations of four chemical indicators (Fe, Mn, Cu and Cr) made in the present study using UV-Vis spectroscopy.
For the screening of natural mineral waters from Slanic Moldova, the ICP-MS method proved its applicability for water analysis by its sensitivity and quick multielement detection, revealing for the first time the complex composition of these springs. In total, 29 elements were determined by this method. According to the literature and the obtained data, it can be mentioned that mineral waters from Slanic Moldova have some particularities specific to medicinal water. So, these water categories do not meet the evaluation criteria for drinking water, its effect being due precisely to the increased concentrations in some elements, sometimes unwanted, but which have shown therapeutic effects (for example: Fe, Ag, Mn, As, Se, etc.).
Moreover, the variety of mineral water constituents and ion concentrations detected using ICP-MS and UV-Vis indicate that ICP-MS could be a very useful tool to screen the water composition and process a large number of samples quickly and efficiently, while UV-Vis spectroscopy could be an effective method for monitoring the chemical indicators (major elements) of natural mineral waters quality.
The waters of Slanic Moldova have geochemical characteristics that allow them to be grouped by their chemical characteristics and the evolution of their composition. The obtained results can represent a perspective for the future development of the Slanic Moldova area in the context of mineral water management with the mention that the studied mineral waters present a perspective of bottling and storage for a longer period of time.

Author Contributions

Conceptualization, A.-L.F., L.G. (Lucian Gavrila) and O.-I.P.; methodology, L.M., N.B., L.G. (Luminita Grosu), O.-I.P., L.G. (Lucian Gavrila) and A.-L.F.; software, L.M., N.B. and F.M.N.; formal analysis, L.M., N.B., F.M.N., D.R., C.R. and L.G. (Luminita Grosu); investigation, L.M., N.B., D.R., C.R., L.G. (Luminita Grosu) and O.-I.P.; resources, A.-L.F.; writing—original draft preparation, L.M., L.G. (Luminita Grosu), A.-L.F., L.G. (Lucian Gavrila) and O.-I.P.; writing—review and editing, A.-L.F., L.G. (Lucian Gavrila), N.B. and O.-I.P.; supervision, A.-L.F. and L.G. (Lucian Gavrila); funding acquisition, A.-L.F. All authors have read and agreed to the published version of the manuscript.

Funding

This work was funded by Doctoral School of “Vasile Alecsandri” University of Bacau. Also, this work was partially supported by CNFIS-FDI-0123/2021, CNFIS-FDI-0132/2022 and CNFIS-FDI-0208/2022 grants, funded by the Ministry of Education and Research through the Executive Agency for Higher Education, Research, Development and Innovation Funding (UEFISCDI).

Data Availability Statement

Not applicable.

Acknowledgments

Not applicable.

Conflicts of Interest

The authors declare no conflict of interest.

References

  1. Government Decision no. 1020 for the Approval of the Technical Norms for the Exploitation and Marketing of Natural Mineral Waters. Romanian Official Monitor no. 854 from 22nd September (GD 1020: 2005). 2005. Available online: http://www.namr.ro/legislation/romanian-legislation/water-domain (accessed on 11 January 2021).
  2. Directive 2009/54/EC of the European Parliament and of the Council of 18 June 2009 on the Exploitation and Marketing of Natural Mineral Waters. Available online: https://op.europa.eu/en/publication-detail/-/publication/41c107dd-8061-4bb5-bf05-d12ecf8c4697 (accessed on 11 January 2021).
  3. Commission Directive 2003/40/EC of 16 May 2003 Establishing the List, Concentration Limits and Labelling Requirements for the Constituents of Natural Mineral Waters and the Conditions for Using Ozone-Enriched Air for the Treatment of Natural Mineral Waters and Spring Waters. Available online: https://op.europa.eu/en/publication-detail/-/publication/1ddc0621-7e4c-4fac-bc2b-3cd4a50e78a3 (accessed on 11 January 2021).
  4. WHO (World Health Organisation). Guidelines for Drinking-Water Quality, 4th ed.; Incorporating the 1st Addendum; World Health Organization: Geneva, Switzerland, 2017; Guideline; Available online: https://www.who.int/publications/i/item/9789241549950 (accessed on 11 January 2021).
  5. Giurgea, E. Mesure quantitative de l’alcalinite des eaux minerales de Roumanie. Bull. Sect. Sci. Acad. Roum. 1914, 18–23. [Google Scholar]
  6. Kamiwaki, M.; Terasawa, M.; Masuda, Y.; Uzawa, M. Anions, cations and silica in commercial mineral water products, city waters and well waters. J. Jpn. Soc. Food Sci. Technol. Nippon Shokuhin Kagaku Kogaku Kaishi 1992, 39, 432–438. [Google Scholar]
  7. Fernández-Turiel, J.L.; Llorens, J.F.; López-Vera, F.; Gómez-Artola, C.; Morell, I.; Gimeno, D. Strategy for water analysis using ICP-MS. Fresenius J. Anal. Chem. 2000, 368, 601–606. [Google Scholar] [CrossRef] [PubMed]
  8. Saleh, M.A.; Ewane, E.; Jones, J.; Wilson, B.L. Chemical evaluation of commercial bottled drinking water from Egypt. J. Food Compos. Anal. 2001, 14, 127–152. [Google Scholar] [CrossRef]
  9. Ikem, A.; Odueyungbo, S.; Egiebor, N.O.; Nyavor, K. Chemical quality of bottled waters from three cities in eastern Alabama. Sci. Total Environ. 2002, 285, 165–175. [Google Scholar] [CrossRef]
  10. Barut, I.F.; Erdogan, N.; Basak, E. Hydrogeochemical evaluation of Western Anatolian mineral waters. Environ. Geol. 2004, 45, 494–503. [Google Scholar] [CrossRef]
  11. Rosborg, I.; Nihlgård, B.; Gerhardsson, L.; Gernersson, M.L.; Ohlin, R.; Olsson, T. Concentrations of inorganic elements in bottled waters on the Swedish market. Environ. Geochem. Health 2005, 27, 217–227. [Google Scholar] [CrossRef]
  12. Thirumalini, S.; Kurian, J. Correlation between Electrical Conductivity and Total Dissolved Solids in natural waters. Malays. J. Sci. 2009, 28, 55–61. [Google Scholar] [CrossRef]
  13. Bodiš, D.; Kordik, J.; Slaninka, I.; Malík, P.; Liščák, P.; Panák, D.; Božíková, J.; Marcin, D. Mineral waters in Slovakia—Evaluation of chemical composition stability using both historical records and the most recent data. J. Geochem. Explor. 2010, 107, 382–390. [Google Scholar] [CrossRef]
  14. Birke, M.; Reimann, C.; Demetriades, A.; Rauch, U.; Lorenz, H.; Harazim, B.; Glatte, W. Determination of major and trace elements in European bottled mineral water—Analytical methods. J. Geochem. Explor. 2010, 107, 217–226. [Google Scholar] [CrossRef]
  15. Rajković, M.B.; Sredović, I.D.; Račović, M.B.; Stojanović, M.D. Analysis of quality mineral water of Serbia: Region Arandjelovac. J. Water Resource Prot. 2012, 4, 783–794. [Google Scholar] [CrossRef]
  16. Bodiš, D.; Božíková, J.; Mackových, D. Mineral waters of the Slovak spas—Chemical analysis, history and present. Slovak Geol. Mag. 2016, 16, 41–56. [Google Scholar]
  17. Levei, E.A.; Hoaghia, M.-A.; Senila, M.; Miclean, M.; Tanaselia, C.; Carstea, E.M. Chemical composition of some Romanian bottled natural mineral waters. Stud. Univ. Babes-Bolyai Chem. 2016, 61, 391–400. [Google Scholar]
  18. Brima, E.I. Physicochemical properties and the concentration of anions, major and trace elements in groundwater, treated drinking water and bottled drinking water in Najran area, KSA. Appl. Water Sci. 2017, 7, 401–410. [Google Scholar] [CrossRef] [Green Version]
  19. Kilic, S. Survey of trace elements in bottled natural mineral waters using ICP-MS. Environ. Monit. Assess. 2019, 191, 452. [Google Scholar] [CrossRef]
  20. Vardè, M.; Servidio, A.; Vespasiano, G.; Pasti, L.; Cavazzini, A.; Di Traglia, M.; Rosselli, A.; Cofone, F.; Apollaro, C.; Cairns, W.R.L.; et al. Ultra-trace determination of total mercury in Italian bottled waters. Chemosphere 2019, 219, 896–913. [Google Scholar] [CrossRef]
  21. Roje, V.; Šutalo, P. Trace and major elements in Croatian bottled waters. J. Geochem. Explor. 2019, 201, 79–87. [Google Scholar] [CrossRef]
  22. Untila, C.; Caraman, M.; Nedeff, V.; Barsan, N.; Sandu, I.; Chitimus, A.D.; Cretu, V.V.; Tomozei, C.; Sandu, A.V. Evaluation of heavy metals and organic compounds in water samples collected from various sources from Republic of Moldova and Romania. Rev. Chim. 2019, 70, 3570–3574. [Google Scholar] [CrossRef]
  23. Apollaro, C.; Buccianti, A.; Vespasiano, G.; Vardè, M.; Fuoco, I.; Barca, D.; Bloise, A.; Miriello, D.; Cofone, F.; Servidio, A.; et al. Comparative geochemical study between the tap waters and the bottled mineral waters in Calabria (southern Italy) by compositional data analysis (CoDA) developments. Appl. Geochem. 2019, 107, 19–33. [Google Scholar] [CrossRef]
  24. Reyes-Toscano, C.A.; Alfaro-Cuevas-Villanueva, R.; Cortés-Martínez, R.; Morton-Bermea, O.; Hernández-Álvarez, E.; Buenrostro-Delgado, O.; Ávila-Olivera, J.A. Hydrogeochemical characteristics and assessment of drinking water quality in the urban area of Zamora, Mexico. Water 2020, 12, 556. [Google Scholar] [CrossRef]
  25. Lyubomirova, V.; Mihaylova, V.; Djingova, R. Chemical characterization of Bulgarian bottled mineral waters. J. Food Compos. Anal. 2020, 93, 103595. [Google Scholar] [CrossRef]
  26. Bodor, K.; Bodor, Z.; Szep, A.; Szep, R. Classification and hierarchical cluster analysis of principal Romanian bottled mineral waters. J. Food Compos. Anal. 2021, 100, 103903. [Google Scholar] [CrossRef]
  27. Carstea, E.M.; Levei, E.A.; Hoaghia, M.-A.; Savastru, R. Quality assessment of Romanian bottled mineral water and tap water. Environ. Monit. Assess. 2016, 188, 521. [Google Scholar] [CrossRef]
  28. Schoenhofer, F. Natural radionuclides in mineral waters sold in upper Silesia, Poland. Their measurement, doses and compliance with regulations. In Proceedings of the LSC 2008 International Conference on Advances in Liquid Scintillation Spectrometry (LSC 2008 Proceedings), Davos, Switzerland, 25–30 May 2008; Eikenberg, J., Jäggi, M., Beer, H., Baehrle, H., Eds.; Radiocardon: Tucson, AZ, USA, 2009. [Google Scholar]
  29. Jobbágy, V.; Kávási, N.; Somlai, J.; Máte, B.; Kovács, T. Radiochemical characterization of spring waters in Balaton Upland, Hungary, estimation of radiation dose to members of public. Microchem. J. 2010, 94, 159–165. [Google Scholar] [CrossRef]
  30. Sipos, L.; Kovács, Z.; Sági-Kiss, V.; Csiki, T.; Kókai, Z.; Fekete, A.; Héberger, K. Discrimination of mineral waters by electronic tongue, sensory evaluation and chemical analysis. Food Chem. 2012, 135, 2947–2953. [Google Scholar] [CrossRef]
  31. Haywood, J.K.; Smith, B.H. Mineral waters of the United States. U.S. Dept. Agr. Bur. Chem. Bull. 1907, 91, 8–11. [Google Scholar]
  32. Palmer, C. The Geochemical Interpretation of Water Analyses; U.S. Geological Survey Bulletin; Government Printing Office: Washington, DC, USA, 1911; Volume 479, pp. 1–35. [CrossRef]
  33. Kurlov, I.G. Classification of Siberian medicinal mineral waters. Physiother. Inst. Tomsk. (USSR) 1928, 24, 1348–1349. [Google Scholar] [CrossRef]
  34. Piper, A.M. A graphic procedure in the geochemical interpretation of water-analyses. Eos. Trans. Am. Geophys. Union 1944, 25, 914–928. [Google Scholar] [CrossRef]
  35. Stuyfzand, P.J. A new hydrochemical classification of water types. In Regional Characterization of Water Quality (Proceedings of the Baltimore symposium, May 1989); International Association of Hydrological Sciences (IAHS) Publications: Oxford, UK, 1989; Volume 182, pp. 89–98. Available online: www.researchgate.net/publication/238108172 (accessed on 20 January 2021).
  36. van der Aa, M. Classification of mineral water types and comparison with drinking water standards. Environ. Geol. 2003, 44, 554–563. [Google Scholar] [CrossRef]
  37. Brenner, I.B.; Taylor, H.E. A critical review of inductively coupled plasma-mass spectrometry for geoanalysis, geochemistry, and hydrology. Part I. Analytical performance. Crit. Rev. Anal. Chem. 2006, 23, 355–367. [Google Scholar] [CrossRef]
  38. Hart, B.T.; Hines, T. Trace Elements in Rivers. In Trace Elements in Natural Waters; Salbu, B., Steinnes, E., Eds.; CRC Press: Boca Raton, FL, USA, 1995; pp. 203–221. [Google Scholar]
  39. Hall, G.E.M.; Vaive, J.E.; Pelchat, J.C. Performance of inductively coupled plasma mass spectrometric methods u sed in the determination of trace elements in surface waters in hydrogeochemical surveys. J. Anal. At. Spectrom. 1996, 11, 779–786. [Google Scholar] [CrossRef]
  40. Mares, G. Mineral Waters in Romania (Chemical Composition, Temperature, Notions of Pharmacodynamics); Vestirea Publishing House: Bucharest, Romania, 1937. (In Romanian) [Google Scholar]
  41. Crasu, V.; Manole, V.; Cociasu, E.M. Mineral Waters from Romania. Bucegi County (Technical and Economic Studies, Series B, Chemistry, No. 15/Geological Institute of Romania); Official Monitor; National Publishing House: Bucharest, Romania, 1941; (In Romanian). Available online: https://igr.ro/wp-content/uploads/2021/02/STE_B_v15.pdf (accessed on 10 March 2021).
  42. Geamanu, N.; Geamanu, V.; Lungu, P.; Lazu, I. Chemical differentiations in the mineral waters of the subcarpathian zone between the Suceava valley and the Buzau valley (In French). In Technical and Economic Studies, Series E, Hydrogeology, No. 12, Institute of Geology and Geophysics (Proceedings of the Interna-tional Symposium on Mineral and Thermal Waters, Eforie, Romania, 7–14 June 1974); Geological Institute of Romania: Bucharest, Romania, 1975; pp. 77–83. Available online: https://igr.ro/wp-content/uploads/2021/03/STE_E_v12.pdf (accessed on 28 January 2021).
  43. Pricăjan, A.; Airinei, Ş.t. Spa Hydromineral Wealth in Romania; Scientific and Encyclopedic Publishing House Romania: Bucharest, Romania, 1981. (In Romanian) [Google Scholar]
  44. Feru, A. A Comparative Revue of the Bottled Mineral Natural Water Characteristics in Roumania and the Most Important European States. In Proceedings of the International Symposium A. H. R. “Mineral and thermal groundwater”, Miercurea Ciuc, Romania, 24–27 June 1998; pp. 77–82. [Google Scholar]
  45. Ţenu, A.; Davidescu, F. Environmental isotopic studies on mineral and thermal waters in Romania: A review over the last 25 years. In Proceedings of the International Symposium A. H. R. “Mineral and thermal groundwater”, Miercurea Ciuc, Romania, 24–27 June 1998; pp. 271–280. [Google Scholar]
  46. Lujerdean, A.; Bunea, A.; Fogorosi, C. Chemical characterization of carbonated and uncarbonated mineral water from Stâna de Vale sources. Bull. Univ. Agric. Sci. Vet. Med. Cluj Napoca Anim. Sci. Biotechnol. 2006, 62, 223–227. [Google Scholar] [CrossRef]
  47. Feru, A. Natural Mineral Water Guide; Novis SRL Publishing House: Cluj Napoca, Romania, 2012. (In Romanian) [Google Scholar]
  48. Enciu, P.; Feru, A.; Mitrofan, H.; Oraseanu, I.; Palcu, M.; Tenu, A. A brief history of Romanian hydrogeology. In History of Hydrogeology, 1st ed.; Howden, N., Mather, J.R., Eds.; Taylor & Francis Group, LLC: Boca Raton, FL, USA, 2013; pp. 229–242. [Google Scholar]
  49. Mereţ, R.; Zaharia, L. Mineral waters in Brașov county. Characteristics and use. In Proceedings of the International Conference Conference: Air and Water—Components of the Environment, 10th Edition, Sovata, Romania, 15–17 March 2018; Presa Universitara Clujeana: Cluj-Napoca, Romania, 2018; pp. 271–278. [Google Scholar] [CrossRef]
  50. Șumuleanu, C.; Botezatu, M.; Gheorgiu, A. Chemical Analysis of Mineral Waters from Slănic Moldova (Bacău County); Cultura Publishing House: Bucharest, Romania, 1933. (In Romanian) [Google Scholar]
  51. Jeanrenaud, P.; Saraiman, A. Geology of Central Moldova between Siret and Prut; Alexandru, I., Ed.; Cuza Publishing House: Iasi, Romania, 1995; p. 196. (In Romanian) [Google Scholar]
  52. Stoica, C. Encyclopedia of the Trotus River Valley; Magic Print Publishing House: Onești, Romania, 2008. (In Romanian) [Google Scholar]
  53. Konya, S. Waters from Slănic, Critique of Recent Chemical Analyzes on Mineral Springs No. I and No. III from Slănic (Moldova); H. Goldner Publishing House: Iași, Romania, 1895. (In Romanian) [Google Scholar]
  54. Busnea, R.D. The Story of a Corner of Heaven, Slănic Moldova; Magic Print Publishing House: Onesti, Romania, 2013; pp. 15–21. (In Romanian) [Google Scholar]
  55. Berlescu, E.; Chioreanu, T.; Cociașu, E.; Dene, A.; Dinculescu, T.; Ștefănescu, S.; Tătăranu, I. Guide for Referrals to the Balneo-climatic Cure; Medical Publishing House: Bucharest, Romania, 1965; pp. 28–41, 172–173. (In Romanian) [Google Scholar]
  56. Nicoară, Y.; Busnea, R. Slănic Moldova. Small Tourist Guide Moldova; Sport-Turism Publishing House: Bucharest, Romania, 1981; pp. 136–137. (In Romanian) [Google Scholar]
  57. Sîrcu, R.E. Hydrogeochemical Study of Mineral Waters in the Eastern Carpathians, with Special Regard to the Slănic Moldova Area. Ph.D. Thesis, Alexandru Ioan Cuza University, Iasi, Romania, 2006. (In Romanian). [Google Scholar]
  58. Report of the National Institute of Recovery, Physical Medicine and Balneology; Romanian National Institute of Recovery: Slănic Moldova, Romania, 2013. (In Romanian)
  59. Report of the National Research-Development Institute for Industrial Ecology; Romanian National Institute of Recovery: Slănic Moldova, Romania, 2018. (In Romanian)
  60. Stoica, C. Slănic Moldova “Pearl” of the Eastern Carpathians; Magic Print Publishing House: Onești, Romania, 2021; pp. 308–347. (In Romanian) [Google Scholar]
  61. Misăilă, L.; Nedeff, F.M.; Barsan, N.; Grosu, L.; Patriciu, O.I.; Gavrilă, L.; Fînaru, A.L. WATERSHED—Android Application for the Mineral Waters Classification. Rev. Chim. 2019, 6, 2212–2217. [Google Scholar] [CrossRef]
  62. Misăilă, L.; Bârsan, N.; Nedeff, F.M.; Răducanu, D.; Grosu, L.; Patriciu, O.I.; Gavrilă, L.; Fînaru, A.L. Quality assessment of Slanic-Moldova mineral waters stored in reusable bottles. Sci. Study Res. Chem. Chem. Eng. Biotechnol. Food Ind. 2020, 21, 253–262. Available online: https://pubs.ub.ro/?pg=revues&rev=cscc6&num=202002&vol=2&aid=5109 (accessed on 15 February 2021).
  63. ISO 15587-2:2002; Water Quality—Digestion for the Determination of Selected Elements in Water—Part 2: Nitric Acid Digestion. Available online: https://www.iso.org/standard/31355.html (accessed on 15 March 2021).
  64. Guidelines for the Safety Assessment of Natural Mineral Waters, French Food Safety Agency. 2008. Available online: https://www.anses.fr/en/system/files/EAUX-Ra-EauxMineralesEN.pdf (accessed on 15 January 2021).
  65. APHA-WWA-WPC. Standard Methods for the Examination Water and Wastewater, 21st ed.; APHA-AWWA-WPCF, Ed.; APHA-AWWA-WPC: Washington, DC, USA, 2005. [Google Scholar]
  66. SR EN 27888:1997; Water Quality Standard—Determination of Electrical Conductivity. Romanian Association for Standardization (ASRO): Bucharest, Romania, 1997.
  67. HACH Company. DR 3900 UV-Vis Spectrophotometer Procedures Manual; HACH Company: Loveland, CO, USA, 2018. [Google Scholar]
  68. ISO 17294-1:2004; Water Quality—Application of Inductively Coupled Plasma Mass Spectrometry (ICP-MS)—Part 1: General Guidelines. Available online: https://www.iso.org/standard/32957.html (accessed on 25 January 2021).
  69. ISO 17294-2:2016; Water Quality—Application of Inductively Coupled Plasma Mass Spectrometry (ICP-MS)—Part 2: Determination of Selected Elements Including Uranium Isotopes. Available online: https://www.iso.org/standard/62962.html (accessed on 15 January 2021).
  70. Commission Directive 2009/90/EC of 31 July 2009 Laying Down, Pursuant to Directive 2000/60/EC of the European Parliament and of the Council, Technical Specifications for Chemical Analysis and Monitoring of Water Status. Available online: https://eur-lex.europa.eu/legal-content/EN/TXT/?uri=CELEX%3A32009L0090 (accessed on 21 January 2021).
  71. Dai, Q.; Shu, X.O.; Deng, X.; Xiang, Y.B.; Li, H.; Yang, G.; Shrubsole, M.J.; Ji, B.; Cai, H.; Chow, W.H.; et al. Modifying effect of calcium/magnesium intake ratio and mortality: A population-based cohort study. BMJ Open 2013, 3, e002111. [Google Scholar] [CrossRef]
  72. Rattanachaiwong, S.; Singer, P. Diets and Diet Therapy: Trace Elements. In Encyclopedia of Food Security and Sustainability; Ferranti, P., Berry, E.M., Anderson, J.R., Eds.; (Food Security, Nutrition and Health); Elsevier: Amsterdam, NL, USA, 2019; Volume 2, pp. 143–160. [Google Scholar] [CrossRef]
  73. Prashanth, L.; Kattapagari, K.K.; Chitturi, R.T.; Baddam, V.R.; Prasad, L.K. A review on role of essential trace elements in health and disease. J. NTR Univ. Health Sci. 2015, 4, 75–85. [Google Scholar] [CrossRef]
  74. Berlescu, E. Small Encyclopedia of Balneology of Romania; All Publishing House: Bucharest, Romania, 1996. (In Romanian) [Google Scholar]
Figure 1. Position of the selected mineral water sampling points from Slanic Moldova, Bacau County (Romania).
Water 14 02942 g001
Figure 2. Variation of water mineralization from Slanic Moldova from 1933–2021.
Water 14 02942 g002
Figure 3. Piper diagram of the studied natural mineral waters.
Water 14 02942 g003
Table 1. Methods used for UV-Vis determination of chemical parameters.
ParameterUnit of MeasurementMethod Used/Code LCK Cuvette TestLevel of Allowed Concentration [1]
Fe 2 + mg/LSpectrophotometric/LCK 321/LCW 0210.3 *
Mn 2 + µg/LSpectrophotometric/LCW 032/Method 80340.5∙× 103
Cu 2 + µg/LSpectrophotometric/LCK 5291.0 × 103
Total Crµg/LSpectrophotometric/LCK 100/Method 80240.05 × 103
F mg/LSpectrophotometric/LCK 323/Method 80295.0 **
Cl mg/LSpectrophotometric/LCK 311/Method 8207According to the specific characteristics of mineral water
NO 3 mg/LSpectrophotometric/LCK 339/Method 819250
NO 2 mg/LSpectrophotometric/LCK 341/Method 85070.1
SO 4 2 mg/LSpectrophotometric/LCK 353/Method 8051According to the specific characteristics of mineral water
HCO 3 mg/LDetermined by calculation/Titrimetric method/SR EN ISO 9963/2-2002According to the specific characteristics of mineral water
CO 2 mg/LSpectrophotometric/LCK 388According to the specific characteristics of mineral water
Notes: * Total iron content according to the specific characteristics of natural mineral waters. ** Concentrations greater than 1.5 g/mL shall be specified on the label; product not recommended under 7 years.
Table 2. Isotopes used in the ICP-MS analysis of water (peak jumping acquisition mode).
ElementMassElementMassElementMass
Group 1Group 2Group 3
Na23Li7Be9
K39Cr53V51
Mg24Mn55Co59
Ca43Ni60Ga69
Al27Cu63As75
Fe56Zn66Rb85
B11Se82Cs133
--Sr88Hg202
--Ag107Tl205
--Cd111U238
--Ba137--
--Pb208--
Table 3. Chemical parameters of natural mineral waters from Slanic Moldova based on literature data (1981 and 2006) and determined by UV-Vis spectrophotometry (2021–this work).
SpringYear (Analyzed)Chemical Parameters
Fe 2 + Mn 2 + Cu 2 + Total Cr F Cl SO 4 2 NO 3 NO 2 HCO 3   * CO 2
mg/L
1 bis19812.00----4586.0059.00--3507.501695.00
2006-----3630.8062.7014.800.063635.60756.80
20210.0571.150.200.023.503653.3588.00-03125,001450.00
519819.00----49.00101.00--15.001909.00
20064.70----61.2080.3017.020.1023.201812.00
20214.430.240.100.005130.0063.85105.00-0.0135.001114.00
1019813.00----3803.0058.00--2818.201686.00
20060.10----3805.7058.0012.400.063025.60616.00
20210.1421.550.100.022.004544.0074.000.1103320.601034.00
14198110.00----5661.0030.00--4343.002137.00
2006-----5367.9032.5019.800.035142.701660.80
20210.151.720.0950.0083.504301.0040.21-03580.681045.00
1519815.00----2291.004.00--2293.001732.00
20062.60----3056.3068.303.500.032875.001015.00
20212.891.650.060.012.604288.0070.110.1704108.801047.00
S219816.00----113.00---2745.00178.00
2006-----31.0053.7017.300.031523.20-
20210.05-0.030.0030.0795.5670.450.2302002.50132.00
SS1981-----------
2006-----------
20210.020.040.020.0317.0054.3290.230.520230.0026.23
Note: * determined by calculation/titrimetric method.
Table 4. Results of analyzed samples by ICP-MS.
Spring1 bis5101415S2SSMean Recovery Rate %
Group 1 [mg/L]
Na *2590.0096.873692.004438.003563.00718.5010.71101
K108.708.27147.70165.30105.407.064.95107
Mg23.683.0631.4749.4031.191.554.3393
Ca58.375.1676.70127.1092.996.4910.54103
Al *0.155.290.100.090.130.020.13106
Fe *0.033.900.210.281.680.050.04101
B *24.241.4527.2333.5225.9120.950.27103
Group 2 [μg/L]
Li764.6053.771166.001390.00740.90119.0029.41106
Cr *10.627.37517.9311.098.1132.8443.422105
Mn *873.70276.001103.001102.00748.100.48514.36104
Ni *1.2915.04731.660.7900.8240.15916.99103
Cu *73.833.854111.3098.0563.0727.3615.5494
Zn *62.677.856416.403.71319.761.86329.2797
Se *7.6670.68711.2010.247.0960.5401.133104
Sr488.0058.38611.101192.00483.70172.8091.74107
Ag0.02<LOD **0.0320.0750.208<LOD **<LOD **98
Cd *0.028<LOD **0.030.030.030.010.21999
Ba *64.4623.9684.54247.00138.6035.236.478102
Pb *<LOD **<LOD **<LOD **<LOD **<LOD **<LOD **<LOD **94
Group 3 [μg/L]
Be0.6191.0030.5810.1020.1110.00320.129103
V4.1002.0475.7274.4933.1680.5750.961104
Co0.4610.5410.1820.1880.4140.0300.165109
Ga2.4501.2802.8567.8614.2071.2840.222109
As *3.9540.5422.8093.2962.1170.5080.801107
Rb278.6024.78357.40346.50203.904.7807.097102
Cs6.8540.4557.8095.0211.3120.0890.036104
Hg0.7490.0160.0310.0161.1930.2210.04797
Tl0.050<LOD **<LOD **<LOD **0.031<LOD **0.03498
U *0.0240.0390.0140.0120.0240.0060.054103
Notes: * Regulations: Maximum concentrations level Romanian regulations [1]: B (1000 μg/L), Cr (0.05 mg/L), Mn (0.05 mg/L), Ni (0.001 mg/L), Cu (1 mg/L), Zn (5 mg/L), Se (0.01 mg/L), Cd (0.003 mg/L), Ba (1.0 mg/L), Pb (0.01 mg/L), As (0.01 mg/L), Hg (0.001 mg/L); Maximum concentrations level Directive 2009/54/EC [2]: Na (200 mg/L), Al (200 μg/L), Fe (200 μg/L), Cr (0.05 mg/L), Mn (0.05 mg/L), Ni (0.02 mg/L), Cu (2 mg/L), Se (0.01 mg/L), Cd (0.005 mg/L), Ba (2 mg/L), Pb (0.01 mg/L), As (0.01 mg/L), Hg (0.001 mg/L); Maximum concentrations level World Health Organization (WHO) [4]: Na (200 mg/L), Al (200 μg/L), Fe (300 μg/L), Cr (0.05 mg/L), Mn (0.5 mg/L), Cu (1 mg/L), Zn (5 mg/L), Se (0.01 mg/L), Cd (0.005 mg/L), Ba (2 mg/L), Pb (0.05 mg/L), As (0.05 mg/L), Hg (0.001 mg/L). ** <LOD = below limit of detection.
Publisher’s Note: MDPI stays neutral with regard to jurisdictional claims in published maps and institutional affiliations.

