
Showering Thermal Sensation in Residential Bathrooms

Department of Building Environment and Energy Engineering, Research Institute for Smart Energy, The Hong Kong Polytechnic University, Hong Kong, China
*
Author to whom correspondence should be addressed.
Water 2022, 14(19), 2940; https://doi.org/10.3390/w14192940
Submission received: 1 August 2022
/
Revised: 5 September 2022
/
Accepted: 16 September 2022
/
Published: 20 September 2022
(This article belongs to the Section Water and One Health)
Abstract
:The thermal energy consumed by showering to the satisfaction of the showering subject, is largely dependent on the water temperature, shower duration, water flow rate, and bathroom air temperature. A research gap, between human thermal preferences and the smart use of thermal energy in high-rise urban residential bathroom environments, has been identified. This study examines the influence of a bathroom’s thermal environment on the showering subject’s thermal sensation. Of the 98 invited respondents, a total of 31 volunteers (12 females and 19 males) participated in the showering experiments, under three thermal conditions (control, colder, and warmer); their subjective thermal responses, including thermal sensation, thermal comfort, and thermal acceptability votes, were recorded. The results showed a non-linear trend of thermal sensation vote (TSV) against the bathroom air temperature. The predicted dissatisfied (PD) was asymmetrical, and the showering subjects preferred a slightly warm environment. Although the female TSV values were more sensitive than the male ones, in both the colder and warmer experiments, there were no significant gender differences. The findings of this study—including the expressions derived from the shower-water and bathroom air temperatures for the thermal comfort zone in a bathroom environment—can be used as a reference to enhance our understanding of thermal energy consumption in environmental design, and to help optimize the thermal environment in bathrooms.
1. Introduction
The concept of optimizing domestic hot water usage is often overlooked, especially in subtropical cities, where winters are relatively short, and ambient temperatures are generally higher [1,2]. Statistics of residential energy consumption show that 20% of the end-use energy is for water-heating, especially for personal hygiene, such as bathing and showering. It is known that the amount of thermal energy consumed by showering—the most common form of bathing—is related to water temperature, shower duration, water flow rate, and bathroom temperature [3].
A study found that the preferred shower-water temperature, which is affected by seasonal climate change, is inversely proportional to the bathroom air temperature [4]. A hot shower is usually taken not only for maintaining body temperature but also for achieving thermal comfort. Thermal sensation and comfort estimates for humans under showers have been investigated under warmer environmental conditions. The experimental results revealed that, in the same thermal environment, many subjects feel colder and more uncomfortable in a shower than in a whole-body bath [5]. In other words, extra heat-energy is required for meeting the thermal comfort demand resulting from a shower. A study found that if both the bathroom air and bathwater temperatures required for a neutral thermal preference are reached, then further air and water temperature adjustments in the bathroom are not necessary [6].
Studies have also demonstrated that the range of desirable shower-water temperatures is 36–41 °C [3,7]. A study by Masuda et al. [8] reported that when the skin temperature was about 40 °C, different subjects had similar thermal perceptions at bathroom temperatures 15 °C and 25 °C. However, the skin temperature measurements before and after bathing in a bathroom controlled at 15 °C were significantly lower than those in a bathroom controlled at 25 °C. Moreover, a study by Herrmann et al. [9], that used lower shower-water temperatures (32–39 °C), recorded a thermal neutral level at a higher bathroom air temperature of 28 °C.
In fact, research efforts have focused on the thermophysiological responses to shower-water temperatures (e.g., 40–42 °C), rather than neutral air temperatures (≤25 °C) [5,10,11]. Although the air temperature in a bathroom affects both energy and human health [12], the thermal responses of showering subjects at different air temperatures were not studied in detail.
There is a gap in our knowledge of human thermal preferences and the smart use of thermal energy in high-rise urban residential bathroom environments. To meet sustainability challenges in cities dominated by high-rise housing developments, the modelling of factors affecting the use of energy in buildings must be based on thermal sensation studies reflecting realistic bathroom conditions. The objective of this study was to examine the influence of a bathroom’s thermal environment on the showering subject’s thermal sensations. This study generated new data on the thermal response of showering subjects, based on measurements and experimental data available from open literature. The survey subjects and the experimental procedure are described in Section 2. The measurement results are presented in Section 3, with the thermal responses of the showering subjects estimated at a range of air and water temperatures. Concluding remarks are presented in Section 4.
2. Materials and Methods
To generate new data on the thermal response of showering subjects at a new air-temperature range, this study recruited volunteers for the experiment, using a protocol described in this section.
2.1. Subjects of Investigation
A pre-screening interview survey was conducted, to collate details of showering habits. Shower-water temperature, time spent in the shower, and time spent on other activities in the bathroom were recorded for a year. A sample of the survey questions is shown in Appendix A. Invitations were sent via online platforms, and 98 participants completed the survey. The showering habits of these participants covered all the possible options; therefore, they can be seen as representative samples. Among those participants, 12 females and 19 males (corresponding to an acceptance rate of 32%) took part in the subsequent showering experiments, and their details are summarized in Table 1. The average heights and weights were 1.56 m and 54.6 kg for the females (body mass index (BMI) = 22.6) and 1.74 m and 66.8 kg for the males (BMI = 22.2), respectively. The showering experiments included three different experiments (control, colder, and warmer) arranged on different days in different bathroom air temperatures. None of the showering subjects were told about the experimental conditions, to minimize participant bias. Ethical approval was obtained for the study protocols from the Human Subjects Ethics Sub-Committee of the Hong Kong Polytechnic University (Reference Number HSEAR20201015003).
2.2. Conditions and Procedures
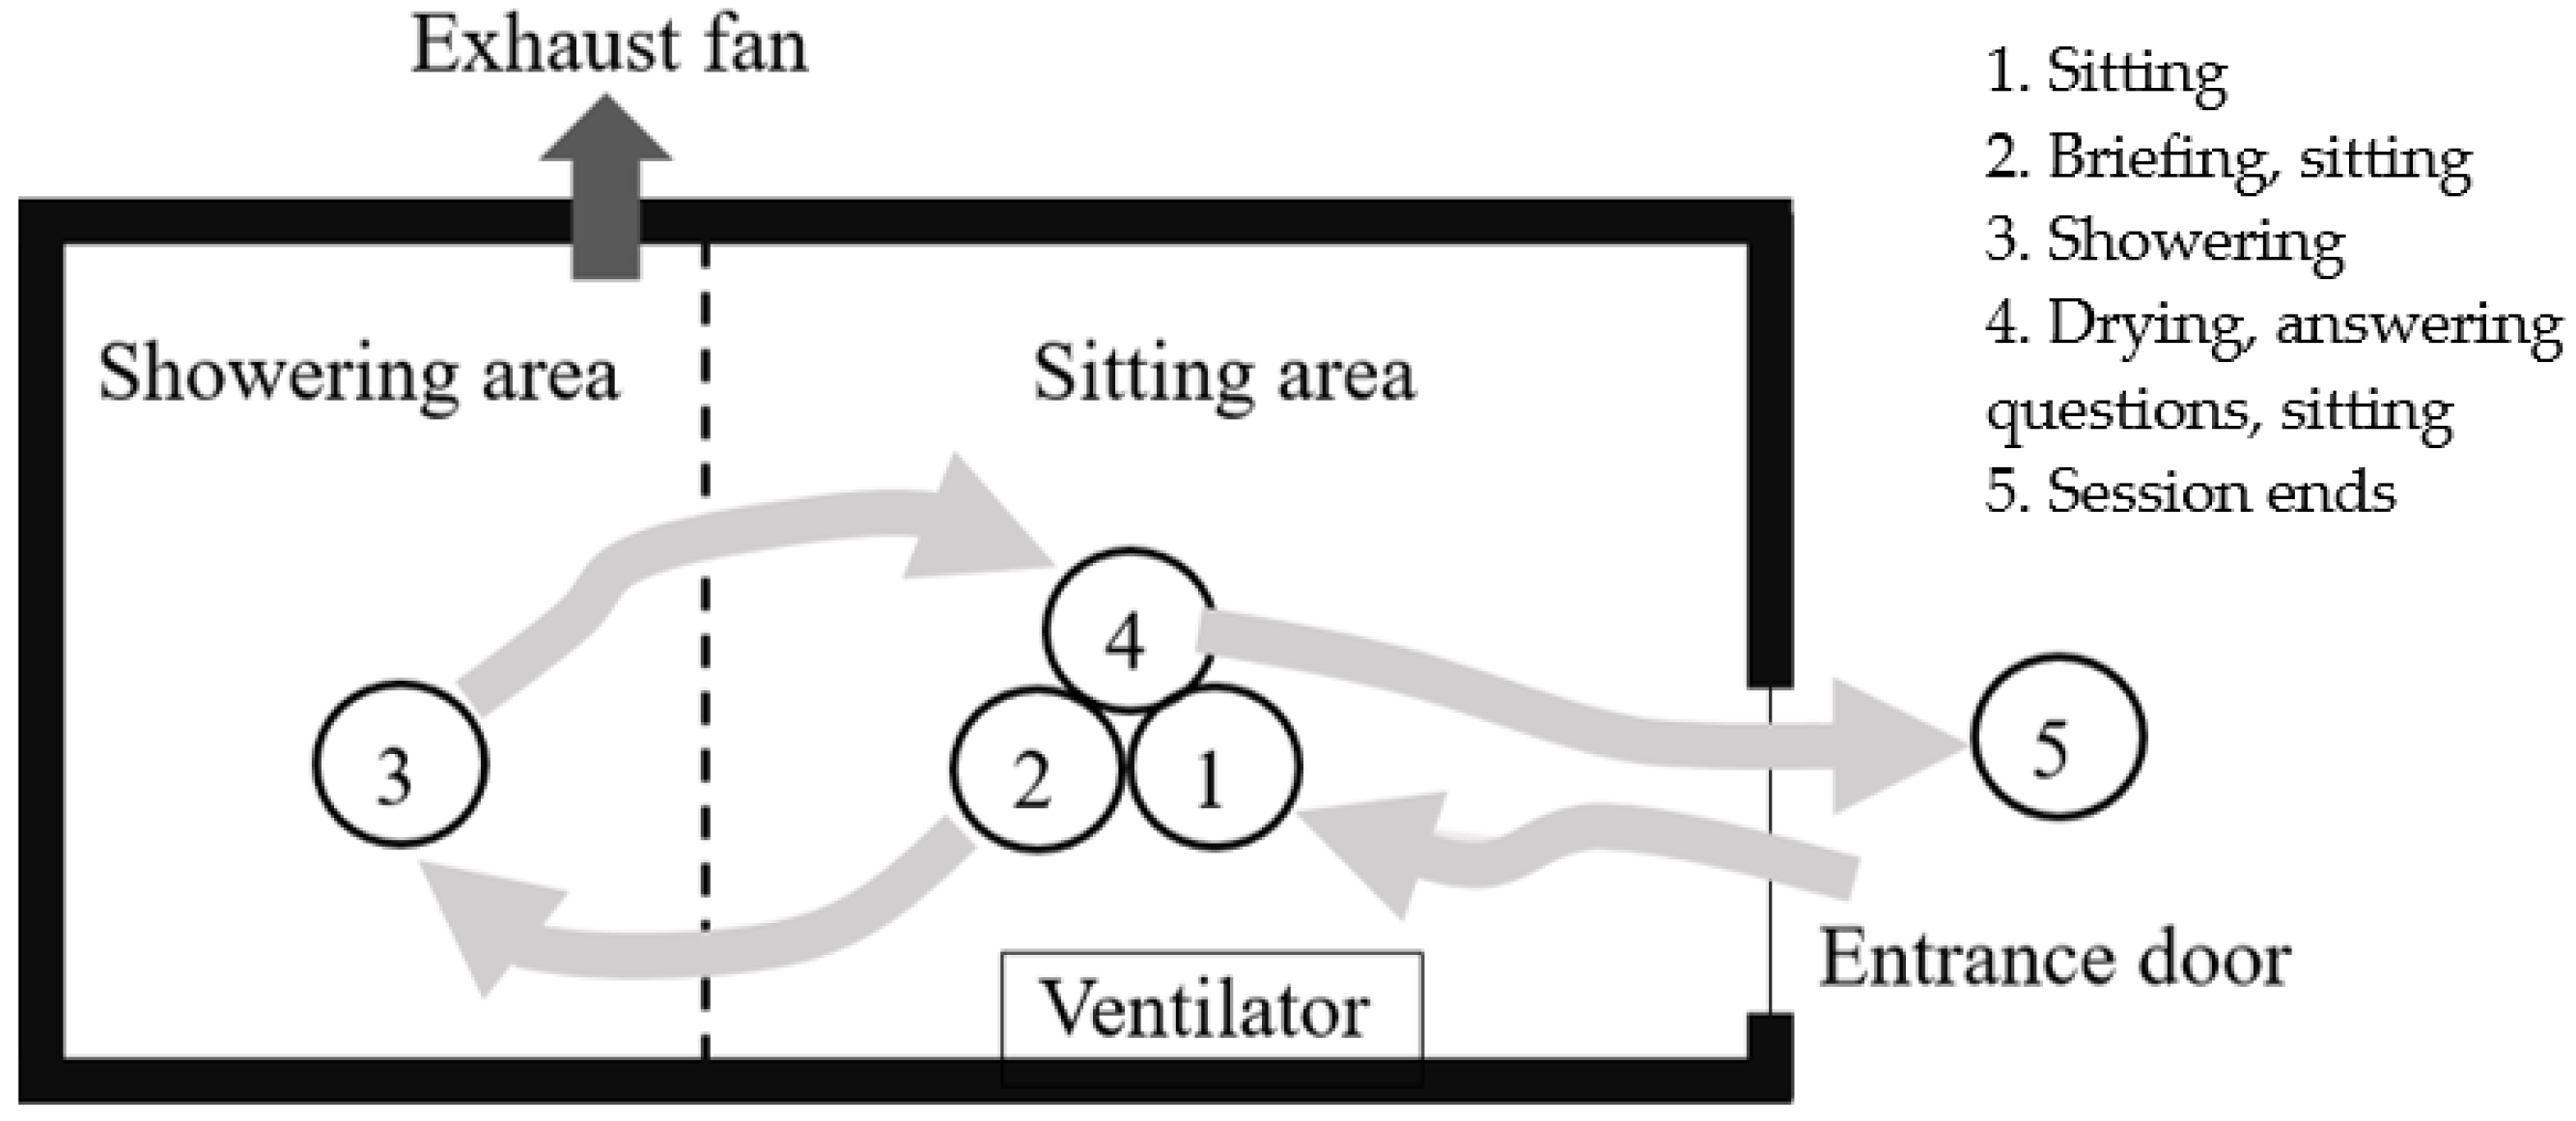
The size of the bathroom used in the experiments was 2.1 m × 1.5 m—the typical size of a local residential bathroom in high-rise buildings. It comprised two areas (sitting and showering) separated by a showering curtain, as shown in Figure 1. Inside the bathroom, there was an exhaust fan for ventilation, and a thermal ventilator for indoor temperature and velocity controls.
The air temperature in the bathroom could be set to: the control condition (mean air temperature ≈ 26 °C); the colder condition (mean air temperature ≈ 18 °C in the colder months, from December to March); or the warmer condition (mean air temperature ≈ 30 °C in the warmer months, from March to September).
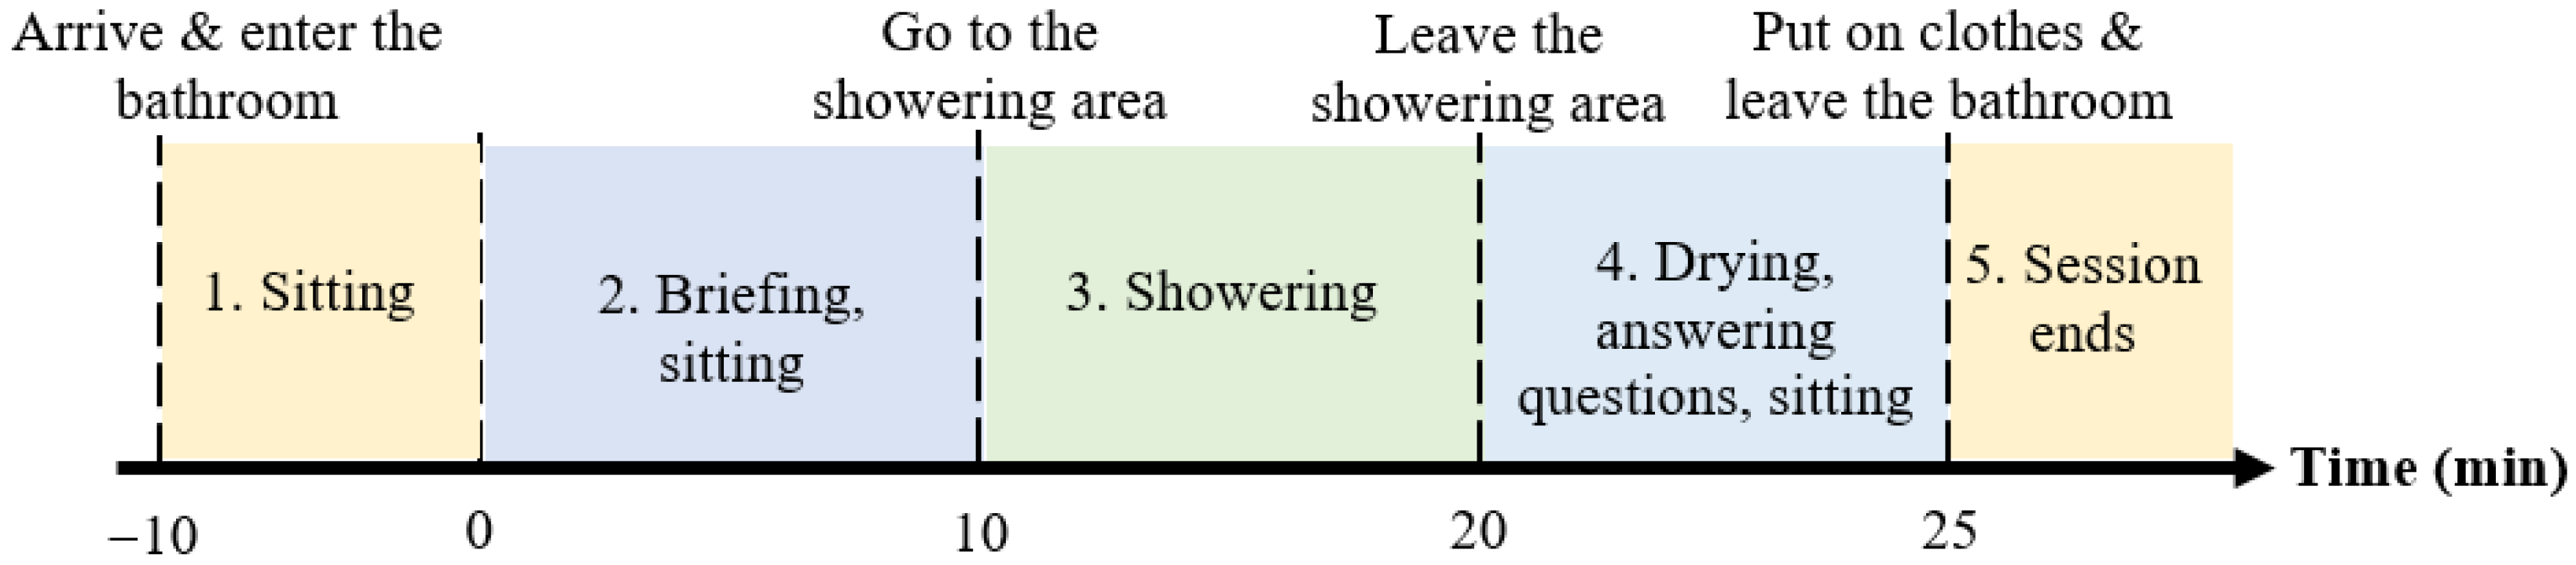
Figure 2 illustrates the 35 min experimental procedure, based on an experimental protocol adopted in previous studies, that required the subject to sit for at least 15 min, shower for at least 10 min, and spend at least 10 min on after-shower drying [11]. Upon entering the sitting area of the bathroom, the showering subject was briefed on the experiment details. Sitting in the bathroom for at least 20 min enabled the subject to reach a thermally stable state, in which the thermal sensation vote was estimated to be 0, −3, and 1 for the control, colder, and warmer conditions, respectively, based on the environmental conditions, and on the metabolic rate of 1.1 Met and clothing value of 0.6 clo [13].
The physical environmental parameters (air temperature Ta in °C; black globe temperature Tg in °C; relative humidity RH in %; and air velocity Va in ms−1) and shower-water temperature Tc (°C) at the showerhead outlet were recorded continuously throughout the experimental procedure. The shower-water temperature, measured at the showerhead outlet, was set according to the choice of the showering subject. The outdoor air temperature was also measured. The indoor mean radiant temperature Tr (°C) was determined by [14]:
The thermal sensation of the showering subject was recorded after each showering session, using a 7-point semantic differential scale for thermal comfort [13], i.e., Cold (−3), Cool (−2), Slightly Cool (−1), Neutral (0), Slightly Warm (+1), Warm (+2), and Hot (+3). In addition, the showering subject was required to describe the feeling of comfort (Comfortable/Slightly Uncomfortable/Uncomfortable/Very Uncomfortable) and the overall thermal acceptability (Acceptable/Unacceptable).
3. Results and Discussion
3.1. Pre-Screening Interview
A total of 98 participants (55 females and 43 males) completed the pre-screening interview survey. Table 2 summarizes the survey results. The total time spent in the bathroom (21.6–27.4 min) was similar to the design experiment time of 25 min. The average time spent in the bathroom before showering (including using the toilet, washing up, brushing teeth, etc.) was 8.9 min (SD = 5.2); this was comparable to the pre-showering time of 7–10 min adopted by a previous study [5]. While the female participants spent a longer time on the pre-showering activities than the male participants (M = 9.3 min, SD = 5.6 vs. M = 8.3 min, SD = 4.6), there was no significant difference relating to gender (p = 0.34, t-test).
The average times spent in the shower were 13.9 min (SD = 6.7) in summer and 17.3 min (SD = 7.0) in winter. A previous field measurement study reported that, with an outdoor temperature drop of 6 °C, the shower duration was 10% [15]. In this study, there was no significant difference in the showering time relating to gender, either in summer (p = 0.42, t-test) or in winter (p = 0.23, t-test).
Although 75 participants preferred a higher shower-water temperature in winter than in summer, 8 participants expressed otherwise. Furthermore, 56 participants preferred a lower shower-water temperature in summer than in winter, while 20 participants did not. The results indicated that the preferred shower-water temperature could be seasonally influenced. However, in a previous field measurement study, no significant difference in the preferred shower-water temperature had been found, with an outdoor temperature drop of 7 °C [15].
3.2. Thermal Responses
Table 3 summarizes the experimental results of the control, colder, and warmer case averages, with standard deviation given in brackets. Determined by the following expression, where Va (ms−1) is the average air velocity, Ta (°C) is the indoor air temperature and (°C) is the indoor mean radiant temperature, the operative temperature Top (°C) in the bathroom was [14]:
In the experiments, the Top and relative humidity (RH) values were maintained between 25.2–26.1 °C and 75–85% for the control cases, 16.7–18.8 °C and 76–85% for the colder cases, and 29.4–30.0 °C and 78–83% for the warmer cases. The findings revealed that females preferred a higher shower-water temperature (39.2 °C, SD = 0.6) than males (38.6 °C, SD = 0.7) (p = 0.016, t-test). In the control cases, the most preferred shower-water temperature—a temperature at which all showering subjects felt thermally neutral (i.e., thermal sensation vote TSV = 0), comfortable, and acceptable—was 38.8 °C (SD = 0.7). It was also employed in the subsequent colder and warmer experiments.
All subjects in the control cases expressed that the thermal environment was neutral, comfortable, and acceptable. In the colder cases, however, 9 (out of 12) females and 10 (out of 19) males felt slightly cool or cool. Among those female subjects, 7 stated they were slightly uncomfortable, while 2 expressed that the thermal environment was unacceptable. Among those male subjects, only 2 felt cool, yet they accepted the thermal environment.
In the warmer cases, 8 (out of 12) female subjects felt slightly warm or warm. While 5 of them were slightly uncomfortable, only 1 of them expressed that the thermal environment was unacceptable. Although 3 (out of 19) male subjects felt slightly uncomfortable in the warmer environment, no male subjects found the thermal environment unacceptable.
As exhibited in Table 3, even though the female TSV values in both the colder and warmer experiments (TSV = −0.90, SD = 0.67, and TSV = 0.80, SD = 0.62, respectively) were more sensitive than the male ones (TSV = −0.60, SD = 0.61, and TSV = 0.60, SD = 0.62, respectively), there were no significant gender differences (p = 0.21, t-test).
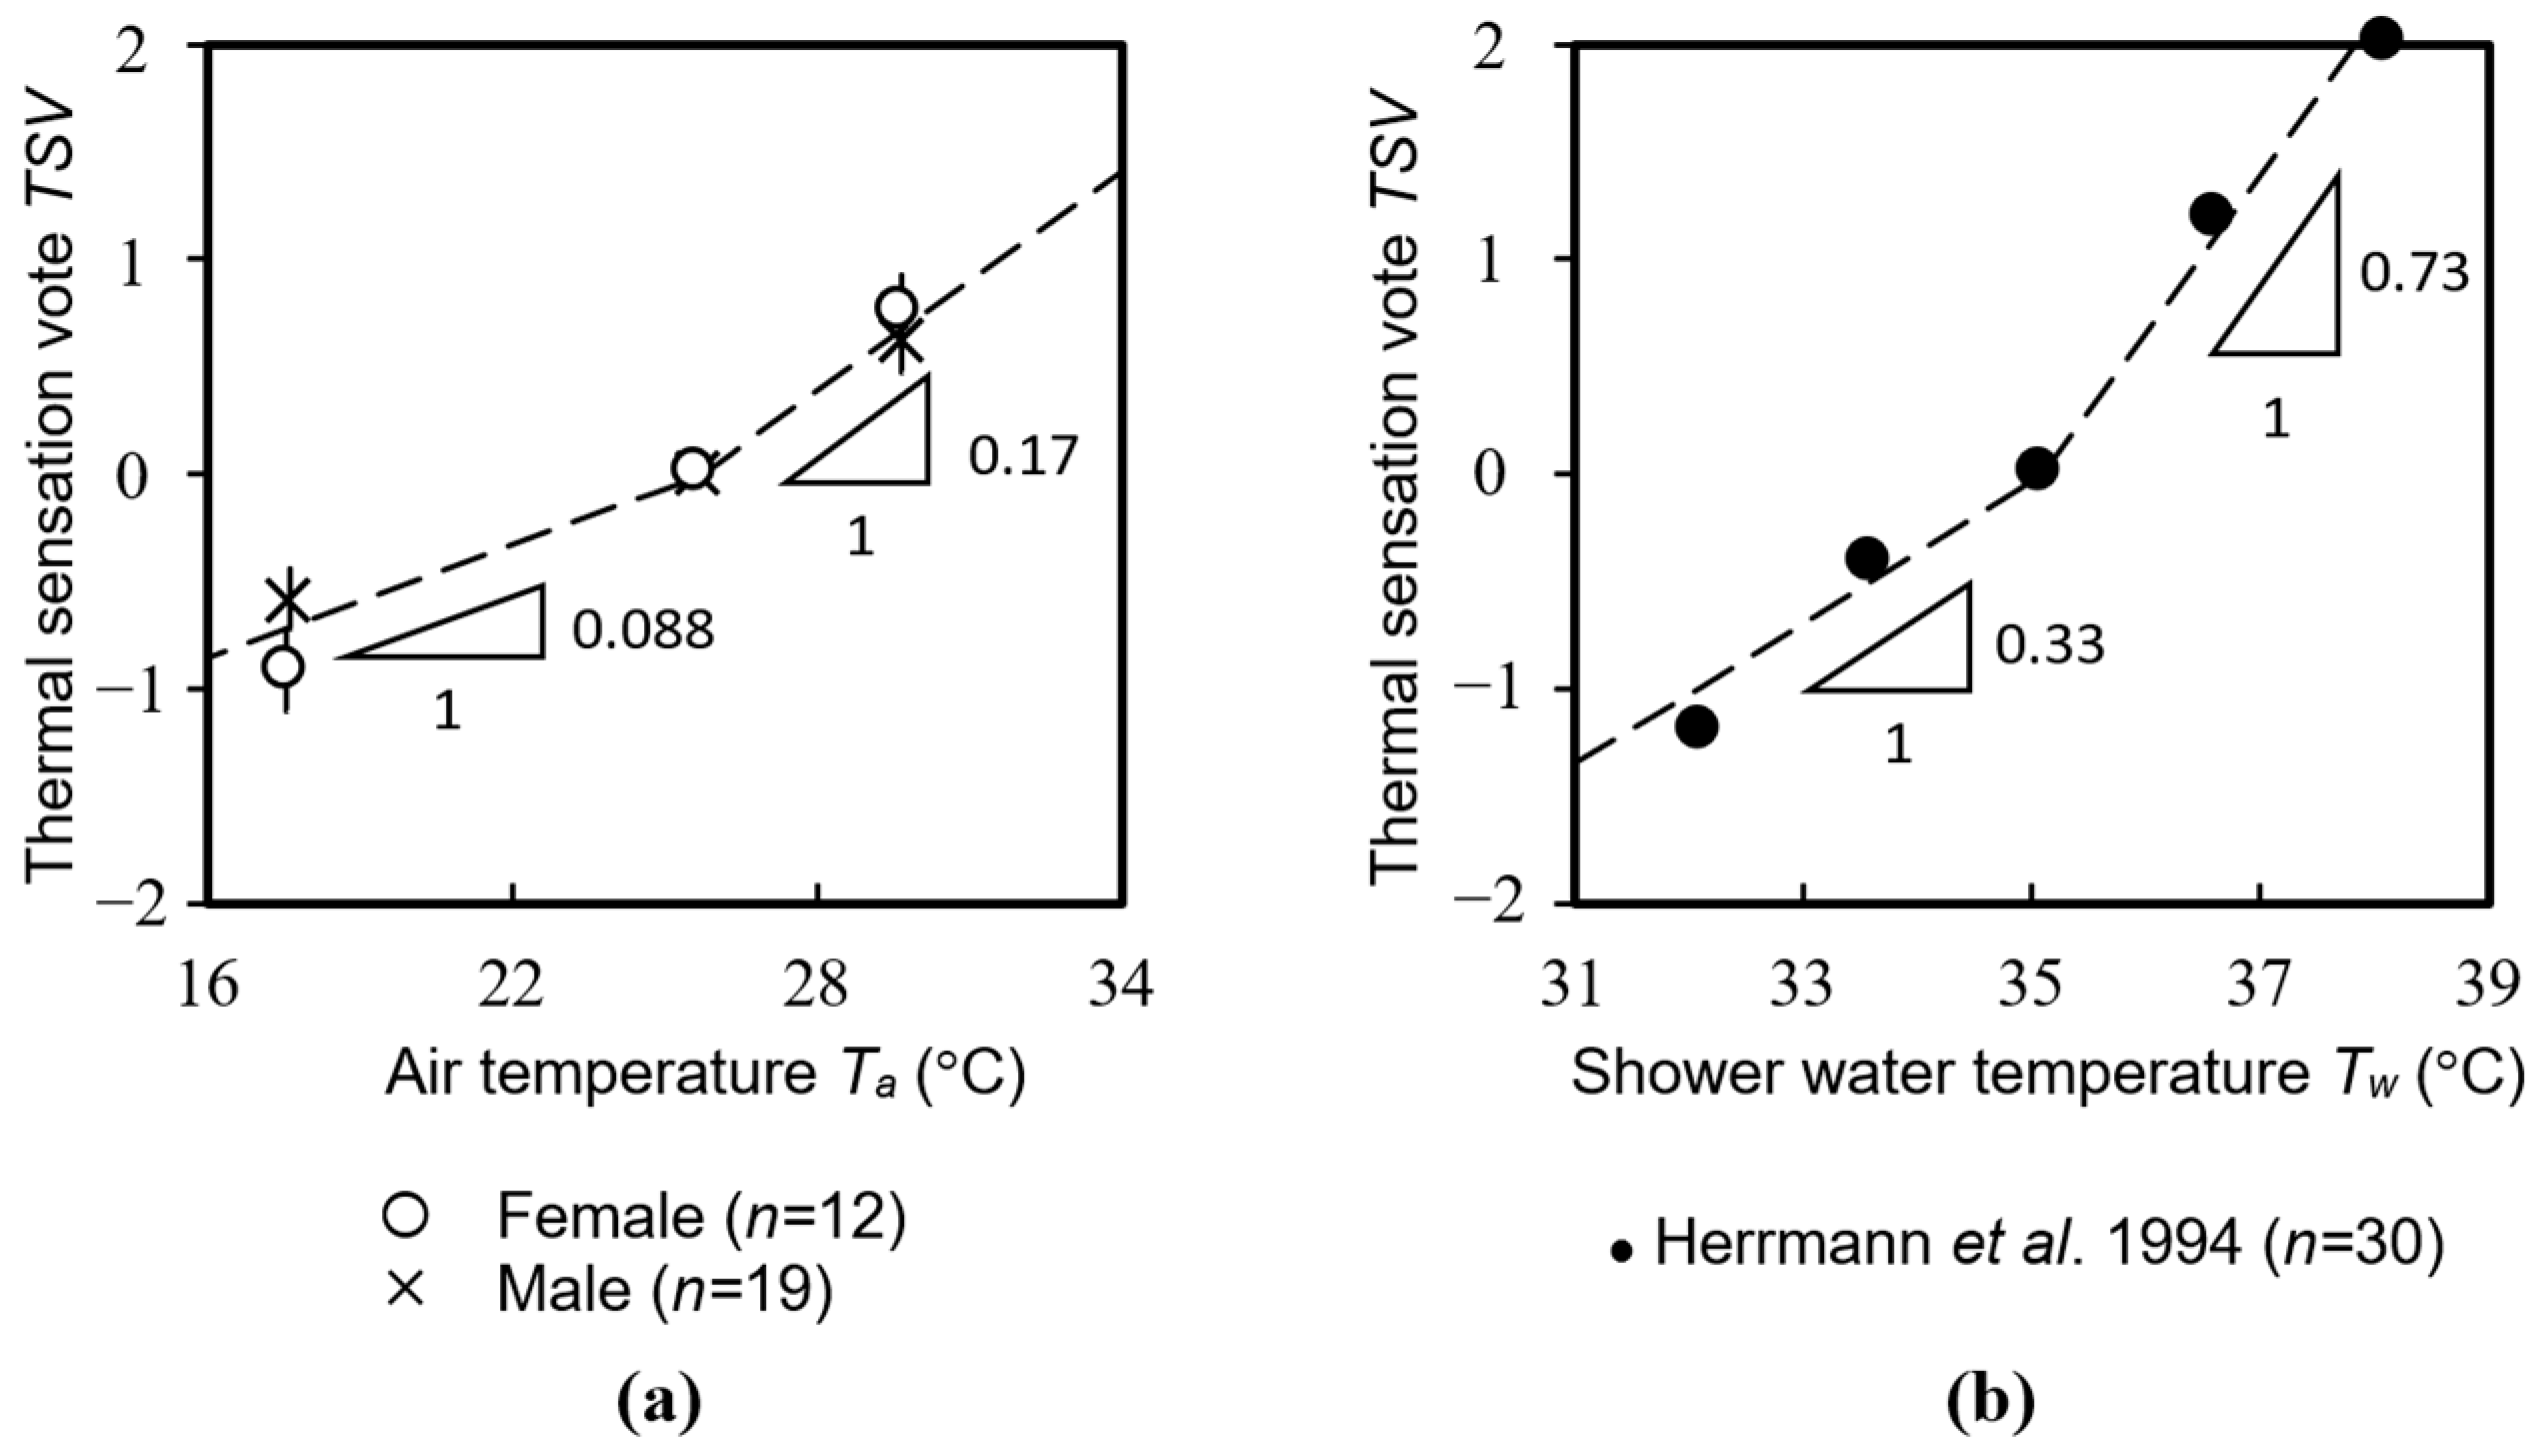
According to Figure 3, TSV was more sensitive in a warm environment than in a cold one. Figure 3a shows a non-linear trend of TSV against the air temperature. An average TSV drop of −0.71 was recorded for an average air temperature drop of 8.1 °C from a neutral air temperature Ta= 25.8 °C, with an average shower-water temperature Tw = 38.8 °C, corresponding to a TSV gradient of −0.088 °C−1. An average increment of TSV = +0.68 was recorded for an increment of 4 °C for both Ta and Top, corresponding to a TSV gradient of +0.17 °C−1.
Figure 3b illustrates the results from a previous experimental study by Herrmann et al. [9] (Tw = 32.4, 33.9, 35.4, 36.9, 38.4 °C, and at Ta = 28 °C); the TSV gradient estimates were −0.33 °C−1 for the colder test conditions and +0.73 °C−1 for the warmer test conditions [9].
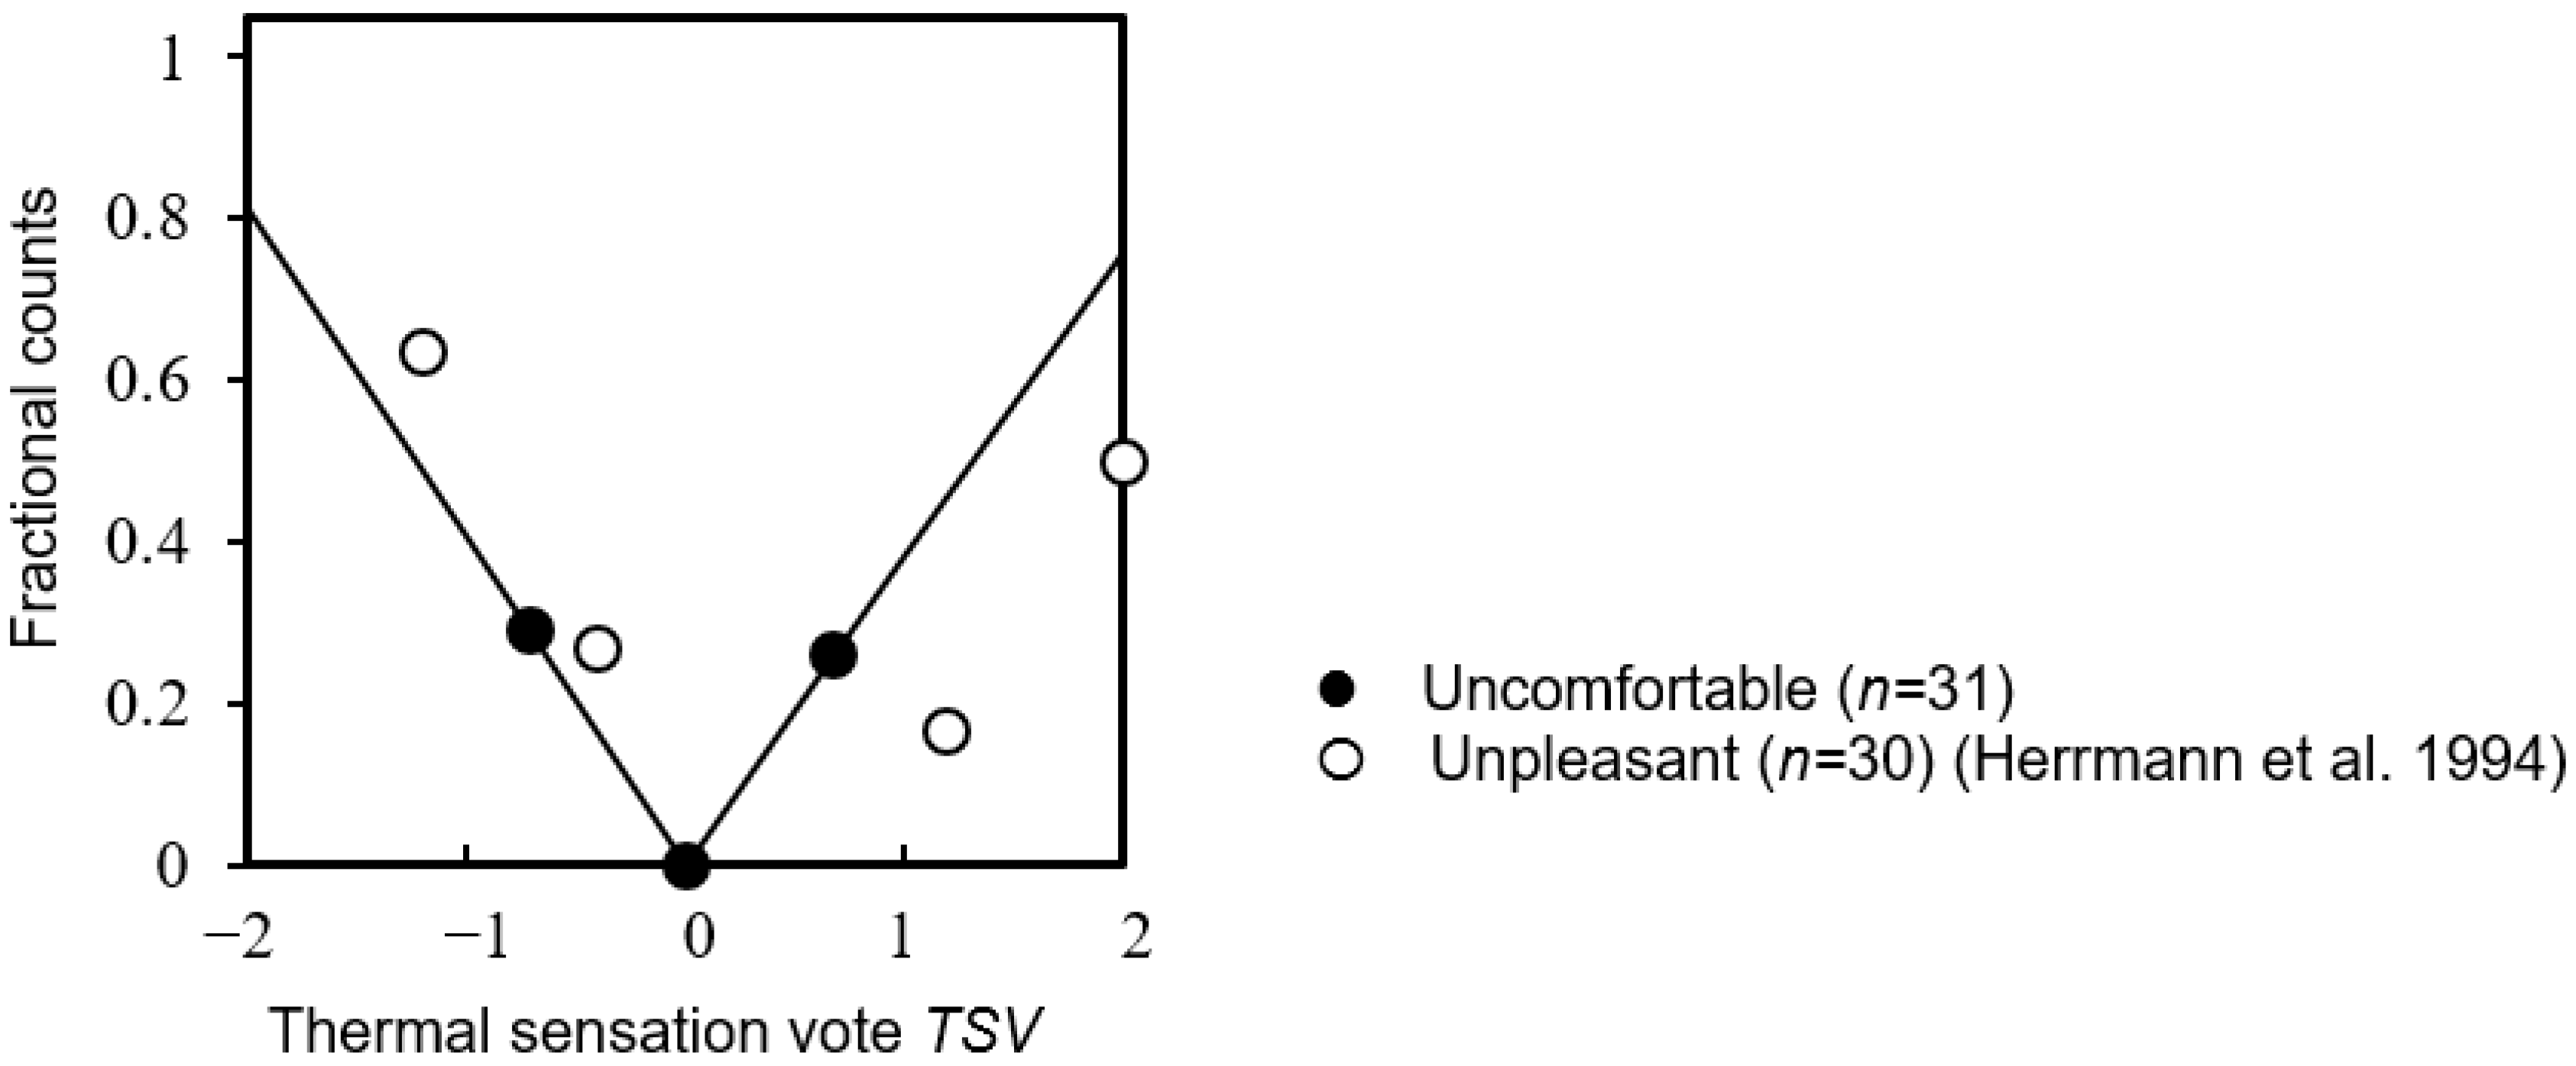
Figure 4 shows the fractional counts of the showering subjects, who felt slightly uncomfortable with the thermal environment they were exposed to, against TSV. The results gave a more sensitive TSV in a colder environment, i.e., 41% at TSV = −1 (slightly cool and uncomfortable) vs. 38% at TSV = +1 (slightly warm and uncomfortable). Similarly, the above-mentioned previous study reported a more sensitive TSV in a colder environment, i.e., ~50% at TSV = −1 vs. 20% at TSV = +1 [9].
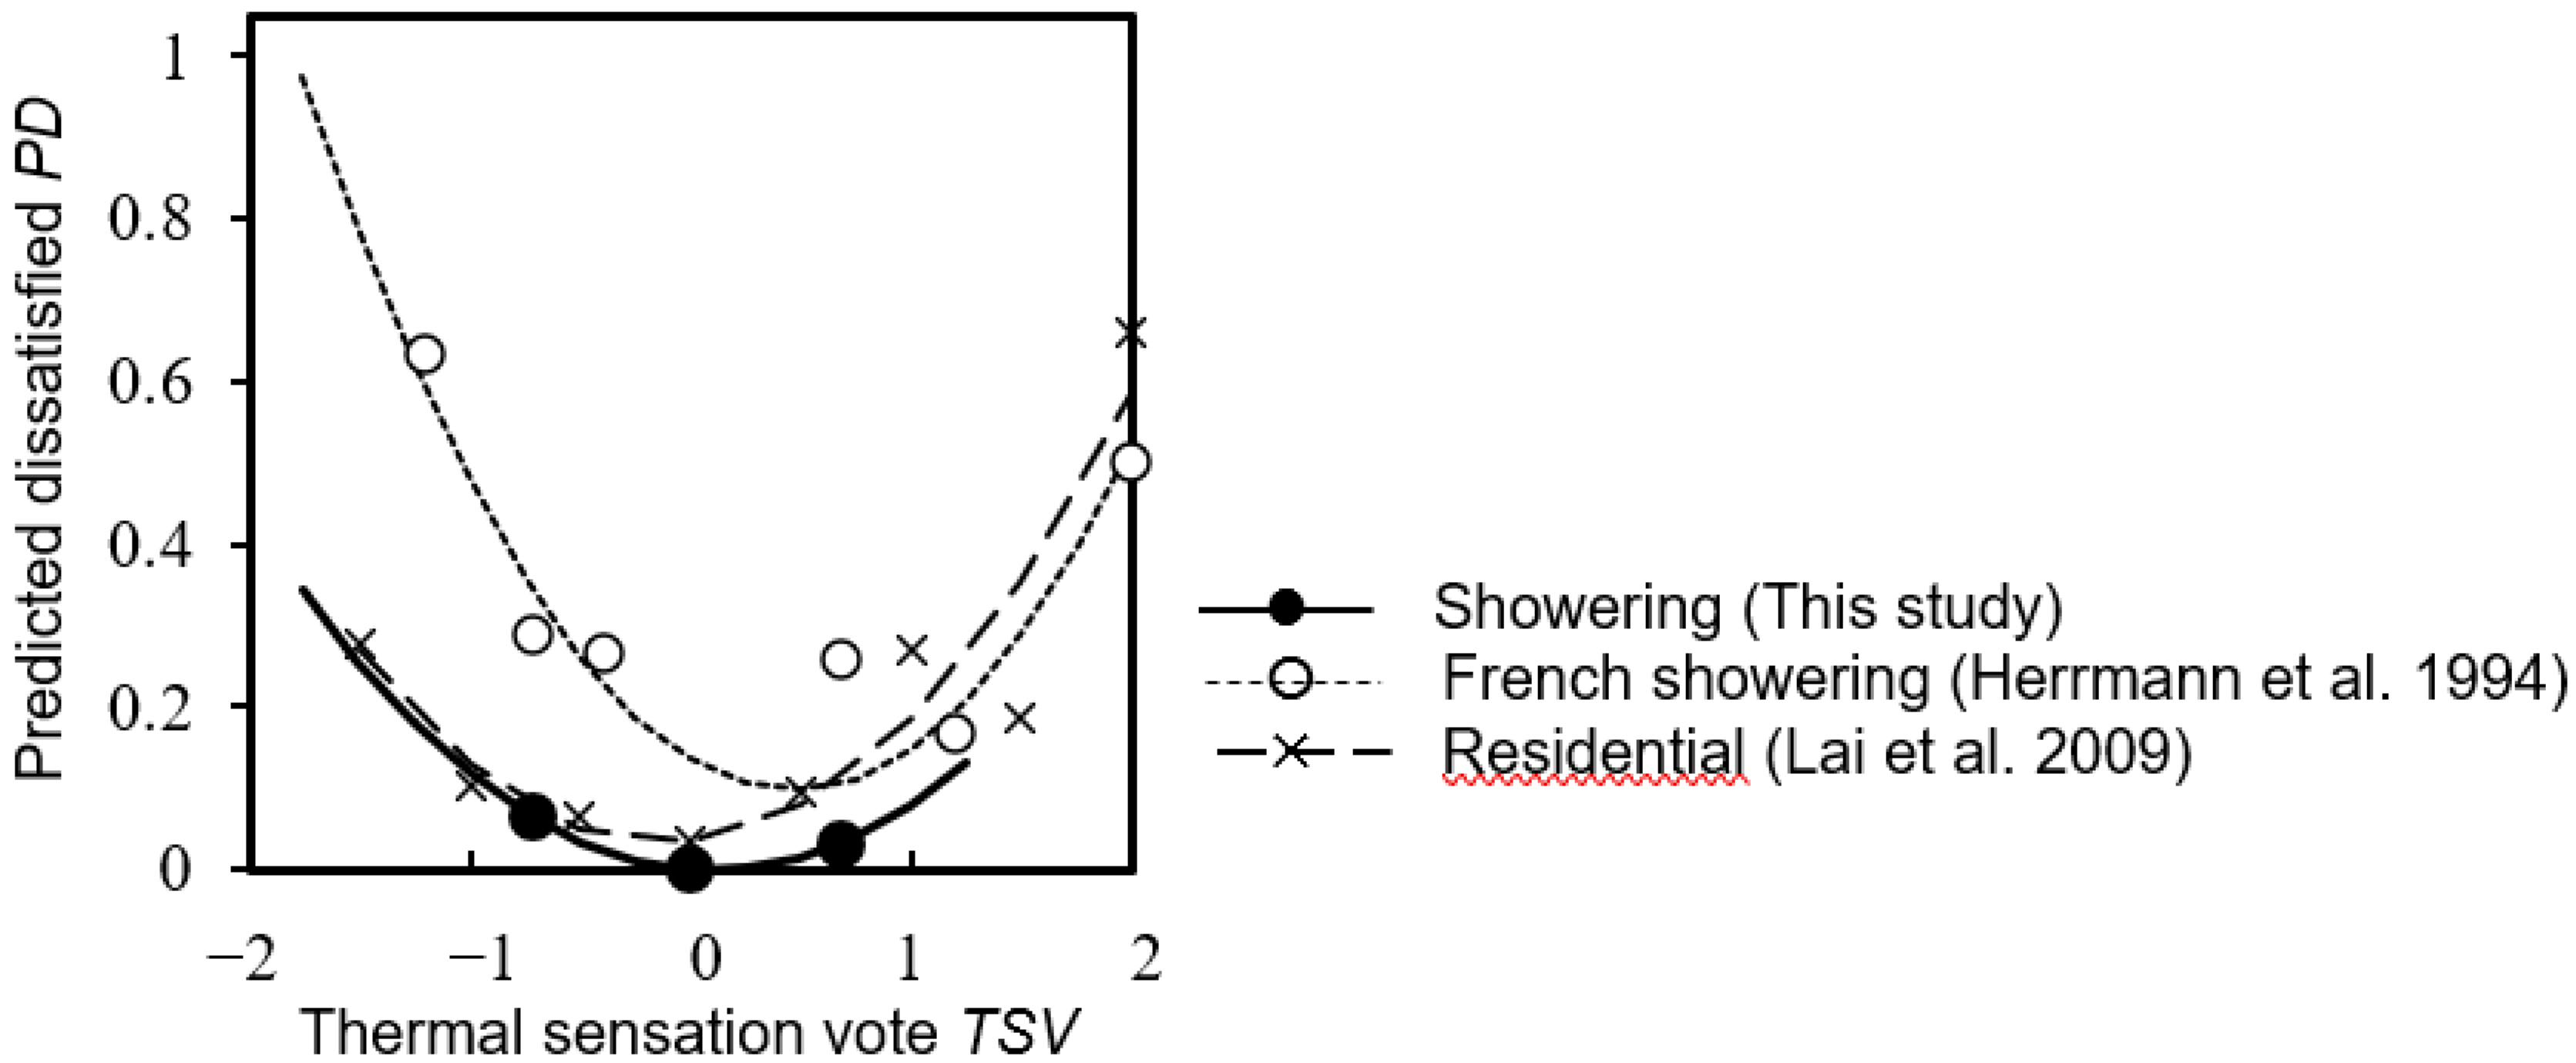
Figure 5 graphs the predicted dissatisfied (PD) as the fractional counts of the unacceptable votes for the thermal conditions in the bathroom. An asymmetrical PD was recorded, and there were more sensitive responses in a colder showering environment than in a warmer one. Comparatively, the PD values on the warm side were lower than those reported by Herrmann et al. [9]. Moreover, the PD in a residential environment is shown in the figure for comparison [16]. For the positive TSV values, lower PD values were found in this study, indicating a slightly warm environment was favored.
3.3. Thermal Comfort Zone
The TSV for a showering environment is given by the following expression, where Ta (°C) and Tw (°C) are the air and shower-water temperatures, respectively, with Ta,o (°C) and Tw,o (°C) representing their respective values in a state of thermal neutrality (i.e., TSV = 0) [17]:
Determined experimentally in this study, ca and cw are the unit changes of TSV for the air and shower-water temperatures, respectively:
By applying Ta = 25.8 °C and Tw = 38.8 °C in a state of thermal neutrality to Equations (3) and (4), two thermal comfort zones for PD = 0.05 (TSV = −0.62 and 0.82) and PD = 0.10 (TSV = −0.91 and 1.11), as shown in Figure 6, were determined. The higher thermal neutral temperature found in this study—as compared with the thermal neutral temperature reported by Herrmann et al. [9] for French consumers—indicated that the showering subjects in this study generally preferred a warm showering environment. This is consistent with the findings of some previous local survey studies, in which all winter showers and over 90% of summer showers were hot showers [3,4].
4. Conclusions
This study examined the influence of the thermal environment in a bathroom on the thermal sensations of the showering subjects, who comprised 12 females and 19 males. The showering subjects participated in the showering experiments under three thermal conditions, i.e., the control, colder, and warmer experiments. The results showed a non-linear trend of thermal sensation vote (TSV) against the bathroom air temperature. An average TSV drop of −0.088 °C−1 was recorded for an average air temperature drop from the neutral air temperature Ta = 25.8 °C, with an average shower-water temperature Tw = 38.8 °C. An average TSV increment of +0.17 °C−1 was recorded for an increment air temperature. The predicted dissatisfied (PD) was asymmetrical, and the showering subjects preferred a slightly warm environment. Two example thermal comfort zones at PD = 0.05 and 0.1 were estimated, using Equation (3) for the shower-water temperature of 34–42 °C, and the air temperature of 18–34 °C. Despite the fact that the female TSV values were more sensitive than the male ones, in both the colder and warmer experiments, there were no significant gender differences. The expressions derived in this study for the thermal comfort zone in a bathroom environment can be used as a reference to enhance our understanding of showering subjects’ thermal sensation in environmental design, and to help optimize the thermal environment in bathrooms.
Author Contributions
Conceptualization, L.-T.W.; Data curation, L.-T.W. and Y.-W.C.; Formal analysis, L.-T.W.; Funding acquisition, L.-T.W. and K.-W.M.; Investigation, L.-T.W.; Methodology, L.-T.W. and K.-W.M.; Project administration, K.-W.M.; Supervision, L.-T.W.; Writing—original draft, L.-T.W., K.-W.M. and Y.-W.C.; Writing—review & editing, K.-W.M. All authors have read and agreed to the published version of the manuscript.
Funding
This research was funded by the Research Grants Council of the Hong Kong Special Administrative Region, China (Project no. 15217221, PolyU P0037773/Q86B).
Institutional Review Board Statement
Ethical approval was obtained for the study protocols from the Human Subjects Ethics Sub-Committee of the Hong Kong Polytechnic University (Reference Number HSEAR20201015003).
Informed Consent Statement
Informed consent was obtained from all subjects involved in the study.
Data Availability Statement
The data presented in this study are available on request from the corresponding author.
Conflicts of Interest
The authors declare that they have not known competing financial interests or personal relationships that could have appeared to influence the work reported in this paper.
Appendix A. Sample Survey Questions
What is your gender? (Female/Male)
In the past 12 months, how long on average time you stay in the bathroom before taking a shower? (In minutes)
In the past 12 months, how long on average time you spend for a summertime shower? (In minutes)
In the past 12 months, how long on average time you spend for a wintertime shower? (In minutes)
Do you prefer a higher showering water temperature in winter than in summer? (Yes/No)
Do you prefer a lower showering water temperature in summer than in winter? (Yes/No)
References
- Cheng, C.L.; Lee, M.C. Research on hot water issues in residential buildings in subtropical Taiwan. J. Asian Archit. Build. Eng. 2005, 4, 259–264. [Google Scholar] [CrossRef]
- McMahon, J.E.; Price, S.K. Water and energy interactions. Annu. Rev. Environ. Resour. 2011, 36, 163–191. [Google Scholar] [CrossRef]
- Wong, L.T.; Mui, K.W.; Guan, Y. Shower water heat recovery in high-rise residential buildings of Hong Kong. Appl. Energy 2010, 87, 703–709. [Google Scholar] [CrossRef]
- Wong, L.T.; Mui, K.W.; Zhou, Y. Carbon dioxide reduction targets of hot water showers for people in Hong Kong. Water 2017, 9, 576. [Google Scholar] [CrossRef]
- Hashiguchi, N.; Ni, F.; Tochihara, Y. Effects of room temperature on physiological and subjective responses during whole-body bathing, half-body bathing and showering. J. Physiol. Anthropol. Appl. Hum. Sci. 2002, 21, 277–283. [Google Scholar] [CrossRef] [PubMed]
- Kanda, K.; Ohnaka, T.; Tochihara, Y.; Tsuzuki, K.; Shodai, Y.; Nakamura, K. Effects of the thermal conditions of the dressing room and bathroom on physiological responses during bathing. Appl. Hum. Sci. 1996, 15, 19–24. [Google Scholar] [CrossRef]
- McNabola, A.; Shields, K. Efficient drain water heat recovery in horizontal domestic shower drains. Energy Build. 2013, 59, 44–49. [Google Scholar] [CrossRef]
- Masuda, Y.; Marui, S.; Kato, I.; Fujiki, M.; Nakada, M.; Nagashima, K. Thermal and cardiovascular responses and thermal sensation during hot-water bathing and the influence of room temperature. J. Therm. Biol. 2019, 82, 83–89. [Google Scholar] [CrossRef]
- Herrmann, C.; Candas, V.; Hoeft, A.; Garreaud, I. Humans under showers: Thermal sensitivity, thermoneutral sensations, and comfort estimates. Physiol. Behav. 1994, 56, 1003–1008. [Google Scholar] [CrossRef]
- Ohnaka, T.; Tochihara, Y.; Kubo, M.; Yamaguchi, C. Physiological and subjective responses to standing showers, sitting showers, and sink baths. Appl. Hum. Sci. 1995, 14, 235–239. [Google Scholar] [CrossRef] [PubMed] [Green Version]
- Munir, A.; Takada, S.; Matsushita, T.; Kubo, H. Prediction of human thermophysiological responses during shower bathing. Int. J. Biometeorol. 2010, 54, 165–178. [Google Scholar] [CrossRef] [PubMed]
- Ying, Y.; Shi, P.C.; Li, Y.N.; Tan, X.; Li, Y.H.; Hokoi, S. Study on a thermophysiological model for health assessment of showering environment in China. J. Phys. Conf. Ser. 2021, 2069, 012179. [Google Scholar] [CrossRef]
- Fanger, P.O. Assessment of man’s thermal comfort in practice. Occup. Environ. Med. 1973, 30, 313–324. [Google Scholar] [CrossRef] [PubMed]
- Moss, K.J. Heat and Mass Transfer in Buildings; Routledge: Oxfordshire, England, 2015. [Google Scholar]
- Wong, L.T.; Mui, K.W.; Zhou, Y. Impact evaluation of low flow showerheads for Hong Kong residents. Water 2016, 8, 305. [Google Scholar] [CrossRef]
- Lai, A.C.K.; Mui, K.W.; Wong, L.T.; Law, L.Y. An evaluation model for indoor environmental quality (IEQ) acceptance in residential buildings. Energy Build 2009, 41, 930–936. [Google Scholar] [CrossRef]
- Mui, K.W.; Tsang, T.W.; Wong, L.T. Bayesian updates for indoor thermal comfort models. J. Build. Eng. 2020, 29, 101117. [Google Scholar] [CrossRef]
Figure 1.
The bathroom (2.1 m × 1.5 m).

Figure 2.
Experimental procedure.

Figure 3.
Subjective thermal responses to the showering environment: (a) thermal sensation votes of 12 females and 19 males at Tw = 38.8 °C (SD = 0.7 °C) and at Ta = 17.7, 25.8, 29.8 °C; (b) thermal sensation votes of 30 subjects at Tw = 32.4, 33.9, 35.4, 36.9, 38.4 °C and at Ta = 28 °C; the values reported by Herrmann et al. [9] are shown for comparison.

Figure 4.
Fractional counts of thermal discomfort; the values reported by Herrmann et al. [9] are shown for comparison.
Figure 4.
Fractional counts of thermal discomfort; the values reported by Herrmann et al. [9] are shown for comparison.

Figure 5.
Predicted dissatisfied PD; the values reported by Herrmann et al. [9] and by Lai et al. [16] are shown for comparison.

Figure 6.
Estimates of predicted dissatisfied PD = 0.05 and PD = 0.10 at thermal neutral Ta = 25.8 °C and Tw = 38.8 °C; the value reported by Herrmann et al. [9] is shown for comparison.
Figure 6.
Estimates of predicted dissatisfied PD = 0.05 and PD = 0.10 at thermal neutral Ta = 25.8 °C and Tw = 38.8 °C; the value reported by Herrmann et al. [9] is shown for comparison.


Table 1.
Subject information.
| Gender | Count | Height (m) | Weight (kg) | BMI | Age |
|---|---|---|---|---|---|
| Female | 12 | 1.47–1.62 | 43–64 | 19.3–27.3 | 24–45 |
| Male | 19 | 1.65–1.84 | 52–86 | 17.2–26.6 | 24–55 |
Table 2.
Screening interview aspects and responses.
| Gender | 55 Females | 43 Males |
|---|---|---|
| Time spent in the bathroom before taking a shower (including using the toilet, washing up, brushing teeth, etc.) | 9.3 min (SD = 5.6) | 8.3 min (SD = 4.6) |
| Time spent in the shower | 14.4 min (SD = 6.4), Summer 18.1 min (SD = 6.9), Winter | 13.3 min (SD = 7.1), Summer 16.3 min (SD = 7.1), Winter |
| Time spent in the bathroom | 23.7 min (SD = 9.7), Summer 27.4 min (SD = 10), Winter | 21.6 min (SD = 9.7), Summer 24.7 min (SD = 9.4), Winter |
| Prefer a higher shower-water temperature in winter than in summer | Yes = 44 No = 4 Maybe = 7 | Yes = 31 No = 4 Maybe = 8 |
| Prefer a lower shower-water temperature in summer than in winter | Yes = 27 No = 14 Maybe = 14 | Yes = 29 No = 6 Maybe = 8 |
Table 3.
Results.
| Parameter | Control | Colder | Warmer | |
|---|---|---|---|---|
| Outdoor daily mean temperature Tod (°C) | 17.4 (0.7) | 17.7 (0.7) | 30.7 (1.4) | |
| Indoor air temperature Ta (°C) | 25.8 (0.3) | 17.7 (0.7) | 29.8 (0.2) | |
| Indoor mean radiant temperature (°C) | 25.4 (0.2) | 17.3 (0.6) | 29.4 (0.2) | |
| Average air velocity Va (ms−1) | 0.57 (0.02) | 0.55 (0.05) | 0.57 (0.02) | |
| Operative temperature Top (°C) | Overall Female Male | 25.7 (0.3) 25.6 (0.2) 25.7 (0.3) | 17.6 (0.6) 17.6 (0.7) 17.6 (0.7) | 29.7 (0.2) 29.7 (0.2) 29.7 (0.2) |
| Relative humidity RH (%) | 80 (4) | 81 (3) | 80 (2) | |
| Shower-water temperature Tw (°C) | Overall Female Male | 38.8 (0.7) 39.2 (0.6) 38.6 (0.7) | 38.8 (0.7) 39.2 (0.6) 38.6 (0.7) | 38.8 (0.7) 39.2 (0.6) 38.6 (0.7) |
| Thermal sensation vote TSV | Overall Female Male | 0 (0) 0 (0) 0 (0) | −0.71 (0.64) −0.90 (0.67) −0.60 (0.61) | 0.68 (0.65) 0.80 (0.62) 0.60 (0.68) |
| Thermally comfortable Slightly thermal uncomfortable | Female Male Female Male | 12 19 0 0 | 5 17 7 2 | 7 16 5 3 |
| Thermally acceptable Thermally unacceptable | Female Male Female Male | 12 19 0 0 | 10 19 2 0 | 11 19 1 0 |
Note: Standard deviation in brackets.
Publisher’s Note: MDPI stays neutral with regard to jurisdictional claims in published maps and institutional affiliations. |
© 2022 by the authors. Licensee MDPI, Basel, Switzerland. This article is an open access article distributed under the terms and conditions of the Creative Commons Attribution (CC BY) license (https://creativecommons.org/licenses/by/4.0/).
Share and Cite
MDPI and ACS Style
Wong, L.-T.; Mui, K.-W.; Chan, Y.-W. Showering Thermal Sensation in Residential Bathrooms. Water 2022, 14, 2940. https://doi.org/10.3390/w14192940
AMA Style
Wong L-T, Mui K-W, Chan Y-W. Showering Thermal Sensation in Residential Bathrooms. Water. 2022; 14(19):2940. https://doi.org/10.3390/w14192940
Chicago/Turabian StyleWong, Ling-Tim, Kwok-Wai Mui, and Yiu-Wing Chan. 2022. "Showering Thermal Sensation in Residential Bathrooms" Water 14, no. 19: 2940. https://doi.org/10.3390/w14192940
Note that from the first issue of 2016, this journal uses article numbers instead of page numbers. See further details here.