

The Role of Environmental Flows in the Spatial Variation of the Water Exploitation Index
by
 , , and
Jesús Pardo-Loaiza
,
Rafael J. Bergillos
* ,
,
Abel Solera
,
Javier Paredes-Arquiola
and
Joaquín Andreu
Research Institute of Water and Environmental Engineering (IIAMA), Universitat Politècnica de València (UPV), 46022 Valencia, Spain
*
Author to whom correspondence should be addressed.
Water 2022, 14(19), 2938; https://doi.org/10.3390/w14192938
Submission received: 19 July 2022
/
Revised: 8 September 2022
/
Accepted: 16 September 2022
/
Published: 20 September 2022
(This article belongs to the Section Water Resources Management, Policy and Governance)
Abstract
:This article presents a novel methodology to assess the spatial and temporal variations of water resources exploitation within regulated river basins. The methodology, which is based on the application of a basin management model to properly assess the consumed and available water, was applied to a case study in the Iberian Peninsula to analyze the effects of environmental flows in the water resources exploitation of all rivers in the basin. It was demonstrated that the river sections in the upper part of the Órbigo River are subjected to lower water stress levels, so that they would be more suitable alternatives to supply new possible water uses. In addition, it was found that, during the summer months, the available water resources in natural regime are more than 1.5, 1.8 and 2.4 times lower than the consumed water in the upper, lower and middle stretches of the Órbigo River, respectively. This reveals the necessity of regulating the water resource to fulfill the water demands of the basin throughout the year. Finally, it was found that increases (decreases) in environmental flows not only lead to reductions (rises) in water availability, but also can induce decreases (increases) in consumed water resources due to lower (greater) water availability. This effect is more significant as water stress levels are higher. The results of this paper highlight the importance and usefulness of basin management models to accurately estimate the spatial variability of the water exploitation index, and the effects of environmental flows on both water availability and consumed water resources. The proposed approach to reduce the spatial scale of the water exploitation index is also helpful to identify the best water sources in river basins to meet future demands and/or higher values of environmental flows.
1. Introduction
Water scarcity is a matter of concern in society, since although water is considered a renewable resource, it is also a finite resource that cannot be replaced [1]. Water scarcity, which can be defined as a condition where available water resources do not meet demand [2], is estimated to affect around 80% of the world’s population [3]. In fact, water scarcity is considered a key driver of migration due to its impact on health and livelihoods, as well as the conflicts it can trigger [4].
Climate change is generating a reduction in naturally available water resources by creating alterations in the hydrological cycle [5,6,7]. The reduction in water availability induced by climate change leads to a worsening of water quality [8,9], affecting river ecosystems and compromising the future sustainability of water resources. Therefore, the impact of climate change on socioeconomic activities and the environment represents an aggravating factor of the problem of water scarcity [10,11,12]. In addition, the projected growth of the world population [13] will imply a greater demand for food in the future and, consequently, a greater use of water in agriculture [14].
Assessing the effects of water management decisions on nature and socioeconomic activities is essential for sustainable water resource planning [15]. The use of water basin management models allows for simulating, in an integrated manner, the different sources, uses and demands of water resources. Therefore, sustainable planning strategies that address water scarcity can be optimized using such basin management models, which are helpful in supporting decision-making processes [16,17].
Environmental flows (also known as ecological flows) can be defined as the flow regime that sustain aquatic ecosystems, which, in turn, support human cultures, economies, sustainable livelihoods and human well-being [18]. The range of intra and interannual variation of the regime, as well as its characteristics of magnitude, seasonality, duration, frequency and rate of change are essential to preserve natural biodiversity and the integrity of aquatic ecosystems [19,20,21]. In regulated basins, the use of operating rules in reservoirs allows for both the maintenance of environmental flow regimes in most river sections and the supply of water for different uses and demands [22,23]. Ecological flow regimes are established in river sections in order to guarantee the maintenance of a good ecological status and the biodiversity of the basin [24]. Therefore, the definition of environmental flow regimes affects the amount of water available for socioeconomic activities in the basin and river ecosystems.
In this context, it is important to have indicators that allow for evaluating the effects of environmental flows on the availability of water resources for other uses and the water stress of the basins. Given the random nature of climatic factors, a proper assessment of water scarcity is a complex task. The use of water scarcity indicators is useful to help decision makers assess the balance between supply and demand in water resources systems. During the last decades, various indicators of water scarcity have been proposed, such as the vulnerability index of water resources [25], the water stress index [26], the international water management institute (IWMI) index [27], the criticality ratio [28,29], the water poverty index [30,31] or the SDG6 index [32], among others. Most of these indices address one or more aspects of water scarcity with a sectoral approach [2]. Other indicators related to water scarcity are the system of environmental and economic accounting for water (SEEAW) [33], the water footprint and virtual water [34,35] or the water resource exploitation index (WEI) [36,37,38,39].
The WEI is obtained as the percentage of annual average freshwater demand with respect to long-term annual average freshwater resources. It is an indicator of the pressure of the total water demand on the availability of water resources [40]. However, the way this indicator was initially conceived did not allow for the monthly variability to be represented. This leads to unreliable results if demands and resources are not properly assessed [41]. These limitations were overcome with the introduction of a modified water resources exploitation index (WEI+), which can be used on different time scales and, thus, allows for addressing seasonal variabilities. The WEI+ has been evaluated in Europe from 1990 to 2017 by the European Environment Agency [42]. This index has been commonly applied at river basin scales; however, to our best knowledge, it has not been used to analyze the spatial variability of the water resource exploitation within a river basin by means of basin management models.
The main objective of this work is to investigate the effects of environmental flows on the spatial variability of the water exploitation index (WEI+). To this end, a novel methodology is proposed to assess the WEI+ in each river stretch of regulated water resources systems based on the implementation and application of basin management models. The methodology is applied to a case study in northwestern Spain (the Órbigo River basin). This manuscript is structured as follows: (i) the main characteristics of the studied river basin are described in Section 2; (ii) Section 3 details the material and methods, including data collection, natural regime estimation, implementation and application of the basin management model, and assessment of WEI+ for nine environmental flow scenarios; (iii) the results obtained are reported and discussed in Section 4; and (iv) the conclusions derived from these results are summarized in Section 5.
2. Study Site
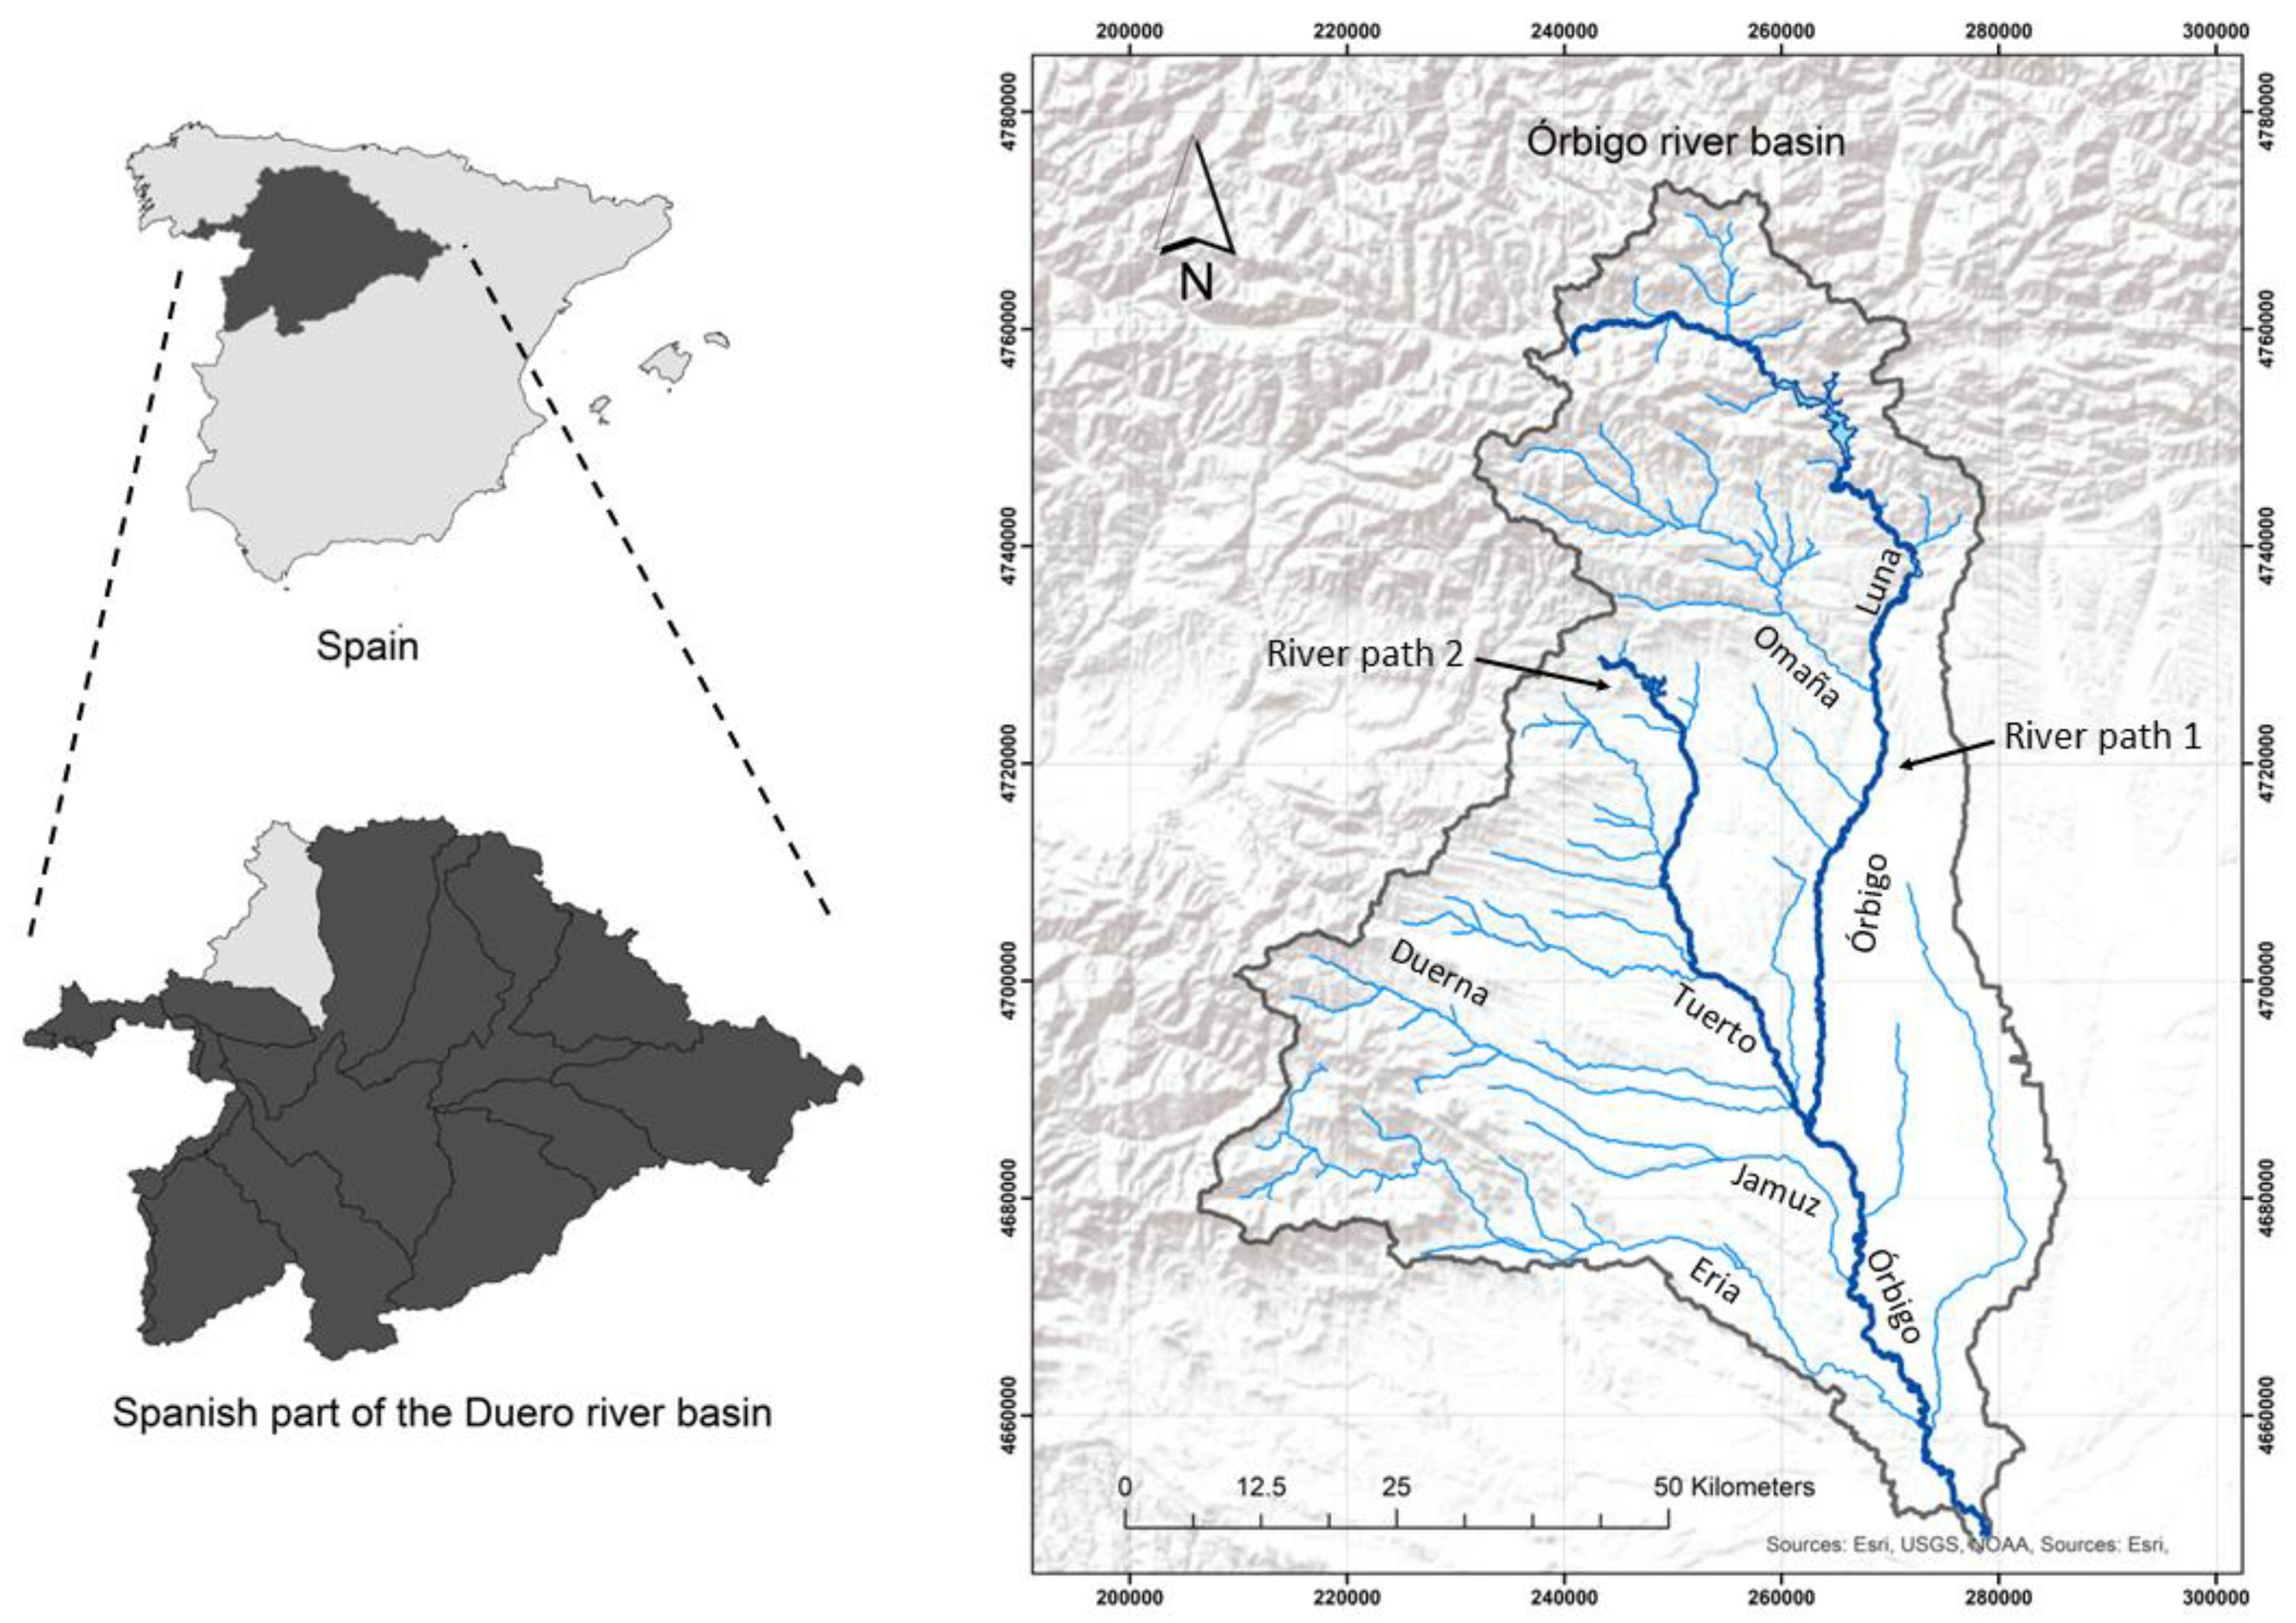
The Órbigo River basin is an exploitation system that belongs to the Duero River basin district. It is located in the northwestern part of Spain, on the Iberian Peninsula (Figure 1). The total area drained by the Órbigo River is about 5000 km2 and the length of the river is 162 km. The average annual precipitation in the Órbigo basin is 725 mm. This rainfall is irregular, with a significant difference between the average precipitation of the driest month (23 mm, in July) and the rainiest month (74 mm, in November). Under natural conditions, the average flow is equal to 1576 hm3 per year (i.e., 49.97 m3/s). The climate is temperate, and the summers are dry. The annual average temperature is 11.2 °C, and the mean temperature of the hottest month is 19.9 °C (in July). The potential evapotranspiration is, on average, equal to 755 mm/year.
The reservoirs of the Órbigo water resources system have a total regulation capacity of 373.6 hm3 (i.e., 373,600 m3). The reservoirs are essential to provide water resources in summer, and to prevent flooding events during the spring and autumn rains. Thus, the reservoirs are often filled for the irrigation season, and are emptied at the end of the summer, which represents an intra-annual regulation cycle. Among the reservoirs of the Órbigo River basin, Villameca and Barrios de Luna, which are located in the upper part of the basin, are the two most important regulation infrastructures.
3. Methodology
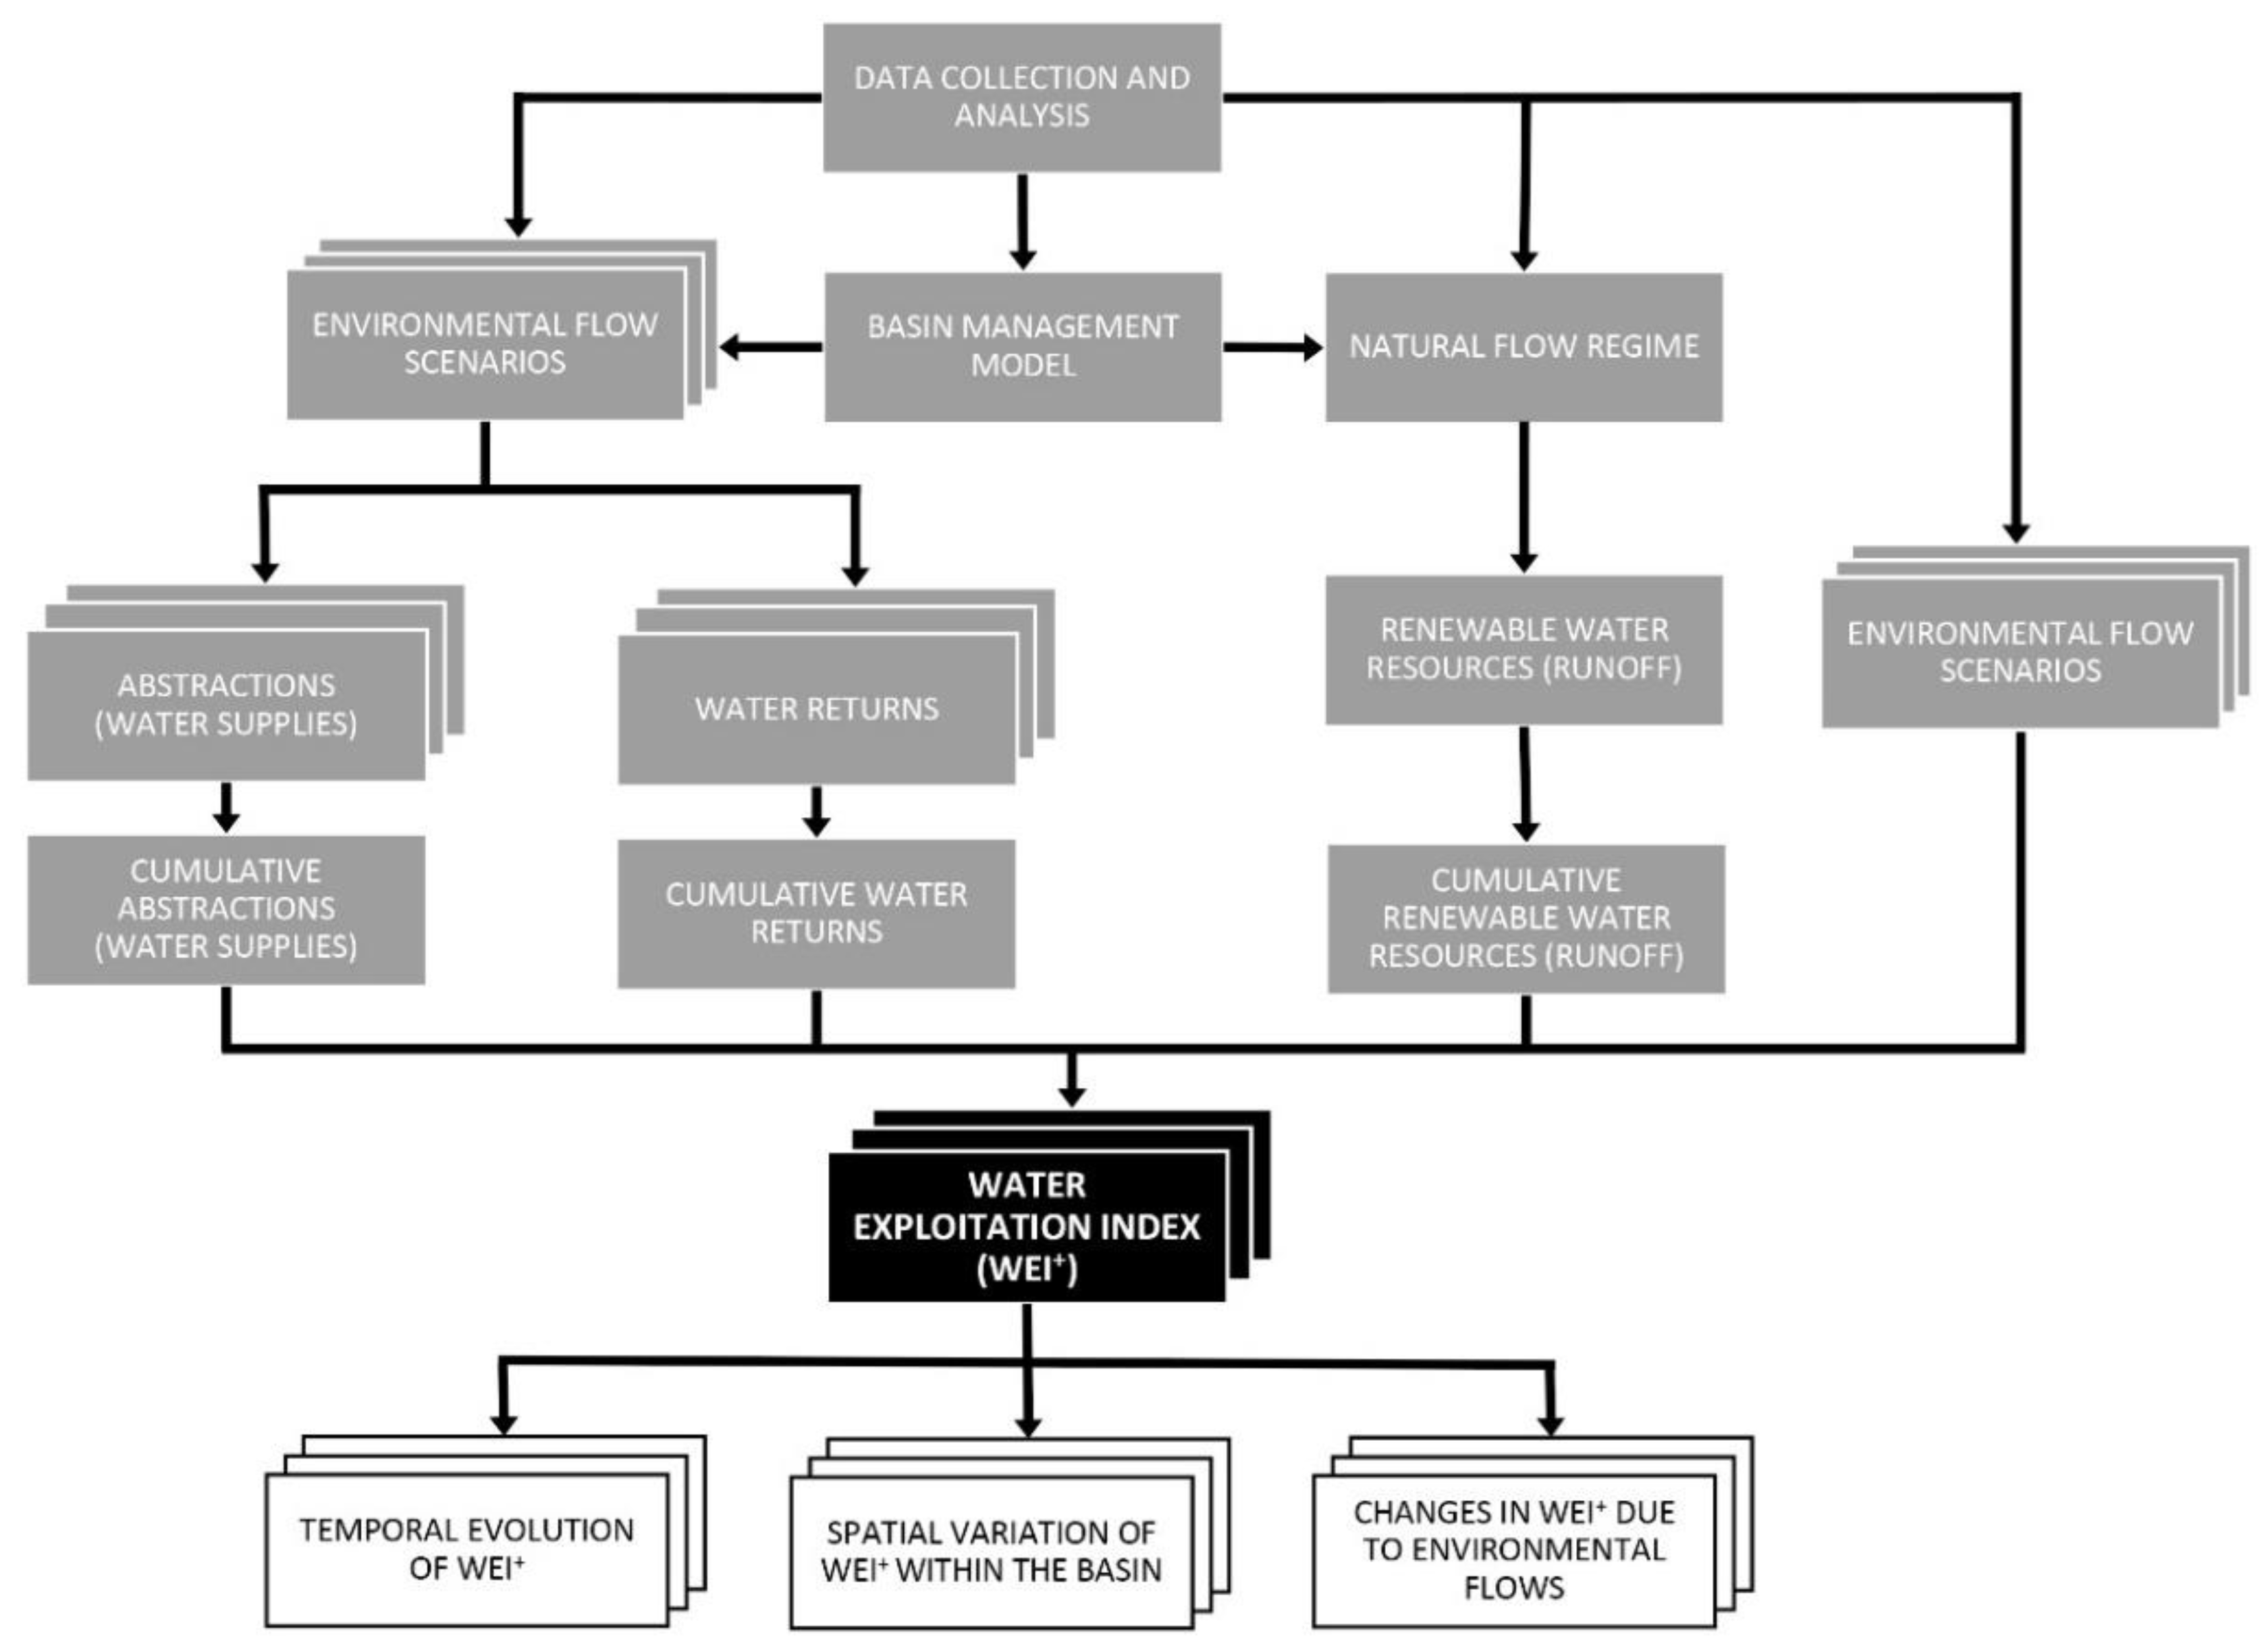
The methodology proposed in this work, and applied to the case study, is mainly based on: (i) collecting and analyzing the data required to implement a basin management model of the water resources system and to compute the natural flow regime; (ii) estimating renewable water resources in natural regime; (iii) simulating water supplies and returns for different environmental flow scenarios; (iv) calculating the WEI+ in each river stretch; and (v) analyzing the temporal evolution, spatial variation and changes in WEI+ induced by different environmental flow scenarios (Figure 2). The environmental flow values are input data for the basin management model, whereas water supplies and returns are output variables of the model. As it is detailed in Section 3.3, the basin management model is used to obtain water supplies, water returns and WEI+ values for the current environmental flow regimes and for eight additional environmental flow scenarios (Figure 2).
3.1. Natural Flow Regime
The estimation of the natural flow regime is required in this work to calculate the renewable water resources (which are used to obtain the WEI+), and to provide the hydrological data that are used as input by the basin management model to simulate the managed (altered) scenarios. The natural regime is commonly estimated by means of rainfall-runoff models, such as HBV [43,44], SWAT [45,46], TOPDM [47], GR4J [48], Témez [49] or SAC-SMA [50,51], among others.
In this work, we used the same hydrological data employed by the Duero River Basin Agency for the Hydrological Plan [52] as the input series to model the altered regime, as well as to compute the natural flow regime in each river stretch of the water resources system. This last task was carried out through the basin management model (detailed in Section 3.2). For this, all the elements that represent alterations of the natural regime (demands, reservoirs, intakes, etc.) were eliminated.
3.2. Basin Management Model
The current managed situation of the basin was simulated through the SIMGES basin management program, which is a module of the AQUATOOL Decision Support System [53] that allows for the simulation of the management of complex water resource systems by means of a conservative flow network that considers surface and underground regulation and/or storage elements, intakes, transport elements, water demands, artificial recharge and pumping devices, etc. Thus, SIMGES allows for simulating all the elements and variables of a water resources system, such as surface water bodies, groundwater bodies, natural water supplies, aquifer recharges, hydraulic infrastructures, demands, returns or environmental flows, among others.
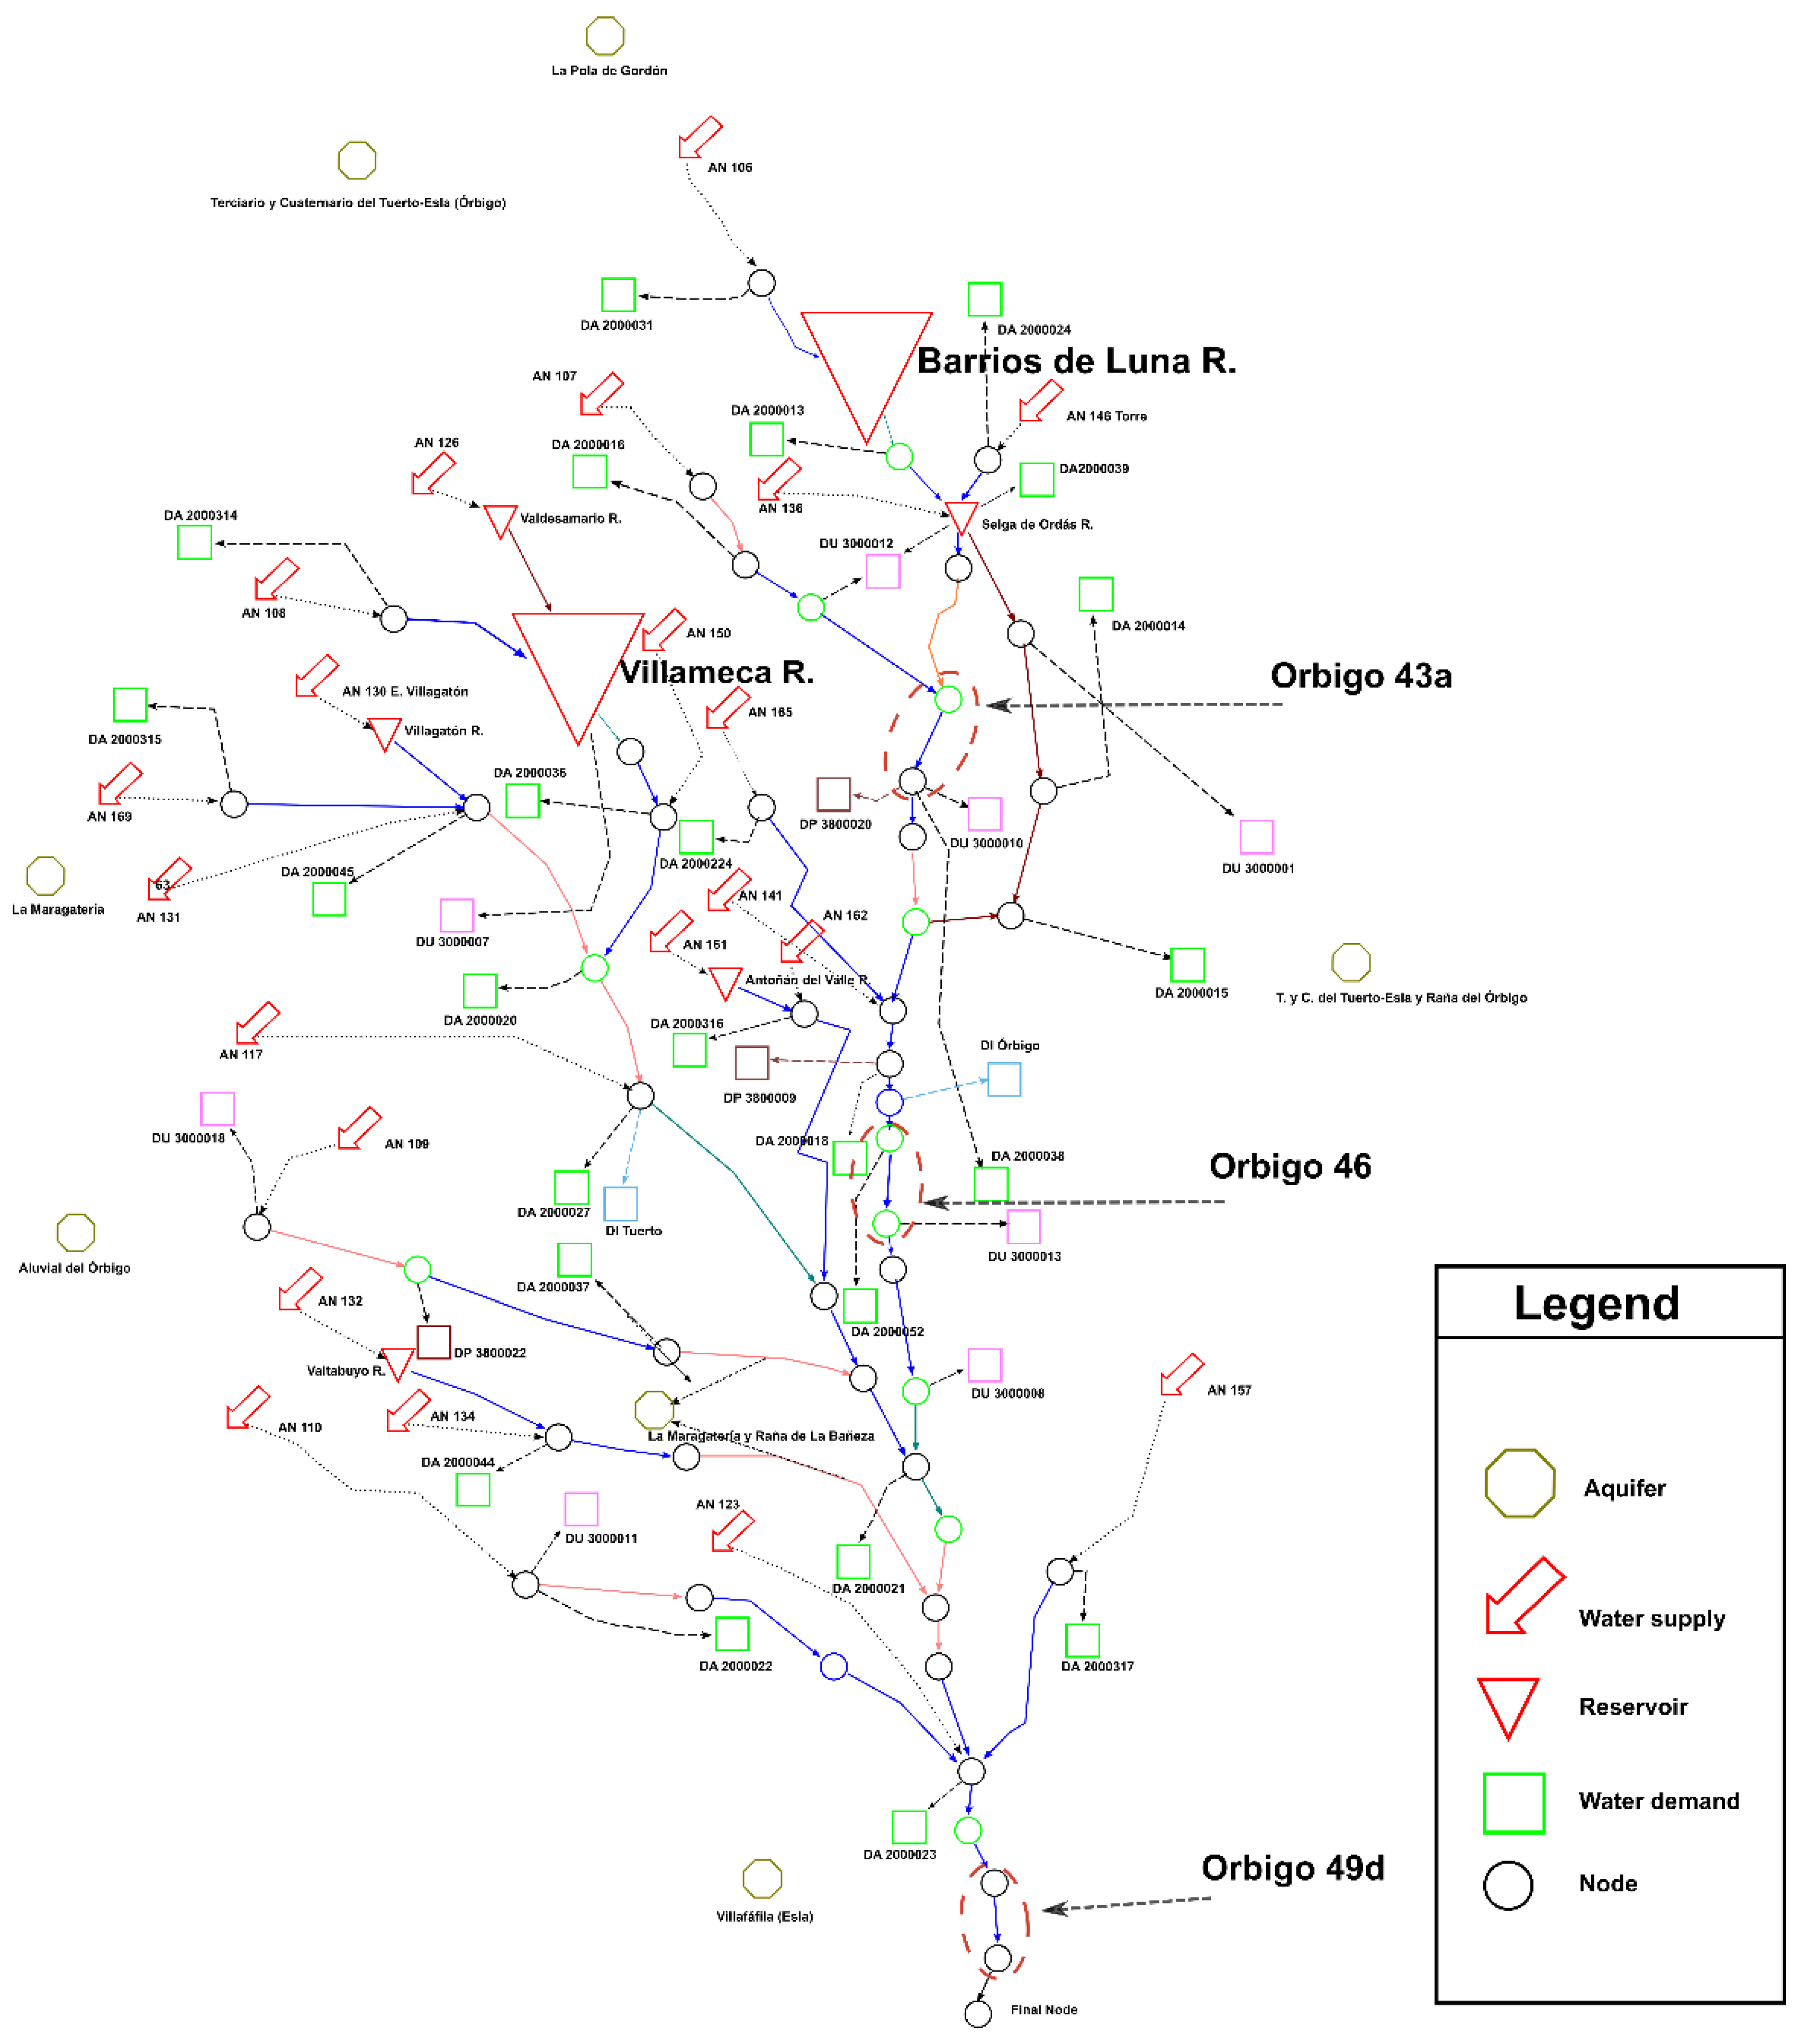
In this paper, a model of the Órbigo water resources system was implemented for the proper application of SIMGES. The model, which is shown in Figure 3, includes 52 river stretches, 7 reservoirs, 21 runoff elements, 26 agricultural demands, 8 urban demands, 7 aquifers and 50 nodes. This model was previously calibrated for the elaboration of the Hydrological Plan of the Duero River basin district [52].
The operating rules of the reservoirs, the priorities between sources of water resources and the priorities between the different water uses (urban demands, environmental flows, agricultural demands, etc.) were also defined in accordance with the Hydrological Plan of the Duero River basin district. The Spanish water planning regulations [54] establish that, among the different water uses, urban demands generally have priority in the supply of available water, followed by environmental flows and agricultural demands. Thus, the environmental flow regimes defined in the basin management model have a negative effect on the reliability of agricultural water demands [22].
3.3. Assessment of the Water Exploitation Index: Environmental Flow Scenarios
The values of the water exploitation index in each month and each river stretch were computed by means of the following equation:
where Abstractions are the supplies to water demands, Returns are the water returns of the demands, Renewable Water Resources are the resources in natural regime and Environmental Flows are the flows specified in each river stretch to meet environmental restrictions. The four terms of Equation (1) are expressed as volume per unit of time and must have the same units.
To compute abstractions, returns and renewable water resources in each river stretch, the results of the basin management model for these variables upstream of each stretch were accumulated. On the other hand, the environmental flow values are specified in the Hydrological Plan of the Duero River basin district [52] and were used not only to calculate the water exploitation index (Equation (1)), but also as input data to apply the basin management model (Section 3.2). The environmental flow values of the Hydrological Plan were obtained through hydrological methods and habitat simulation methods.
The values of the water exploitation index were obtained in each river stretch of the Órbigo water resources system for the current environmental flow regimes established in the Hydrological Plan, and for eight additional environmental flow scenarios: −30%, −20%, −10%, +10%, +20%, +30%, +40% and +50% with respect to the current environmental flow values. The environmental flow values for these eight scenarios were obtained by multiplying the environmental flows of the current scenario by 0.7, 0.8, 0.9, 1.1, 1.2, 1.3, 1.4 and 1.5, respectively.
4. Results and Discussion
4.1. Spatial Distribution of the Water Exploitation Index
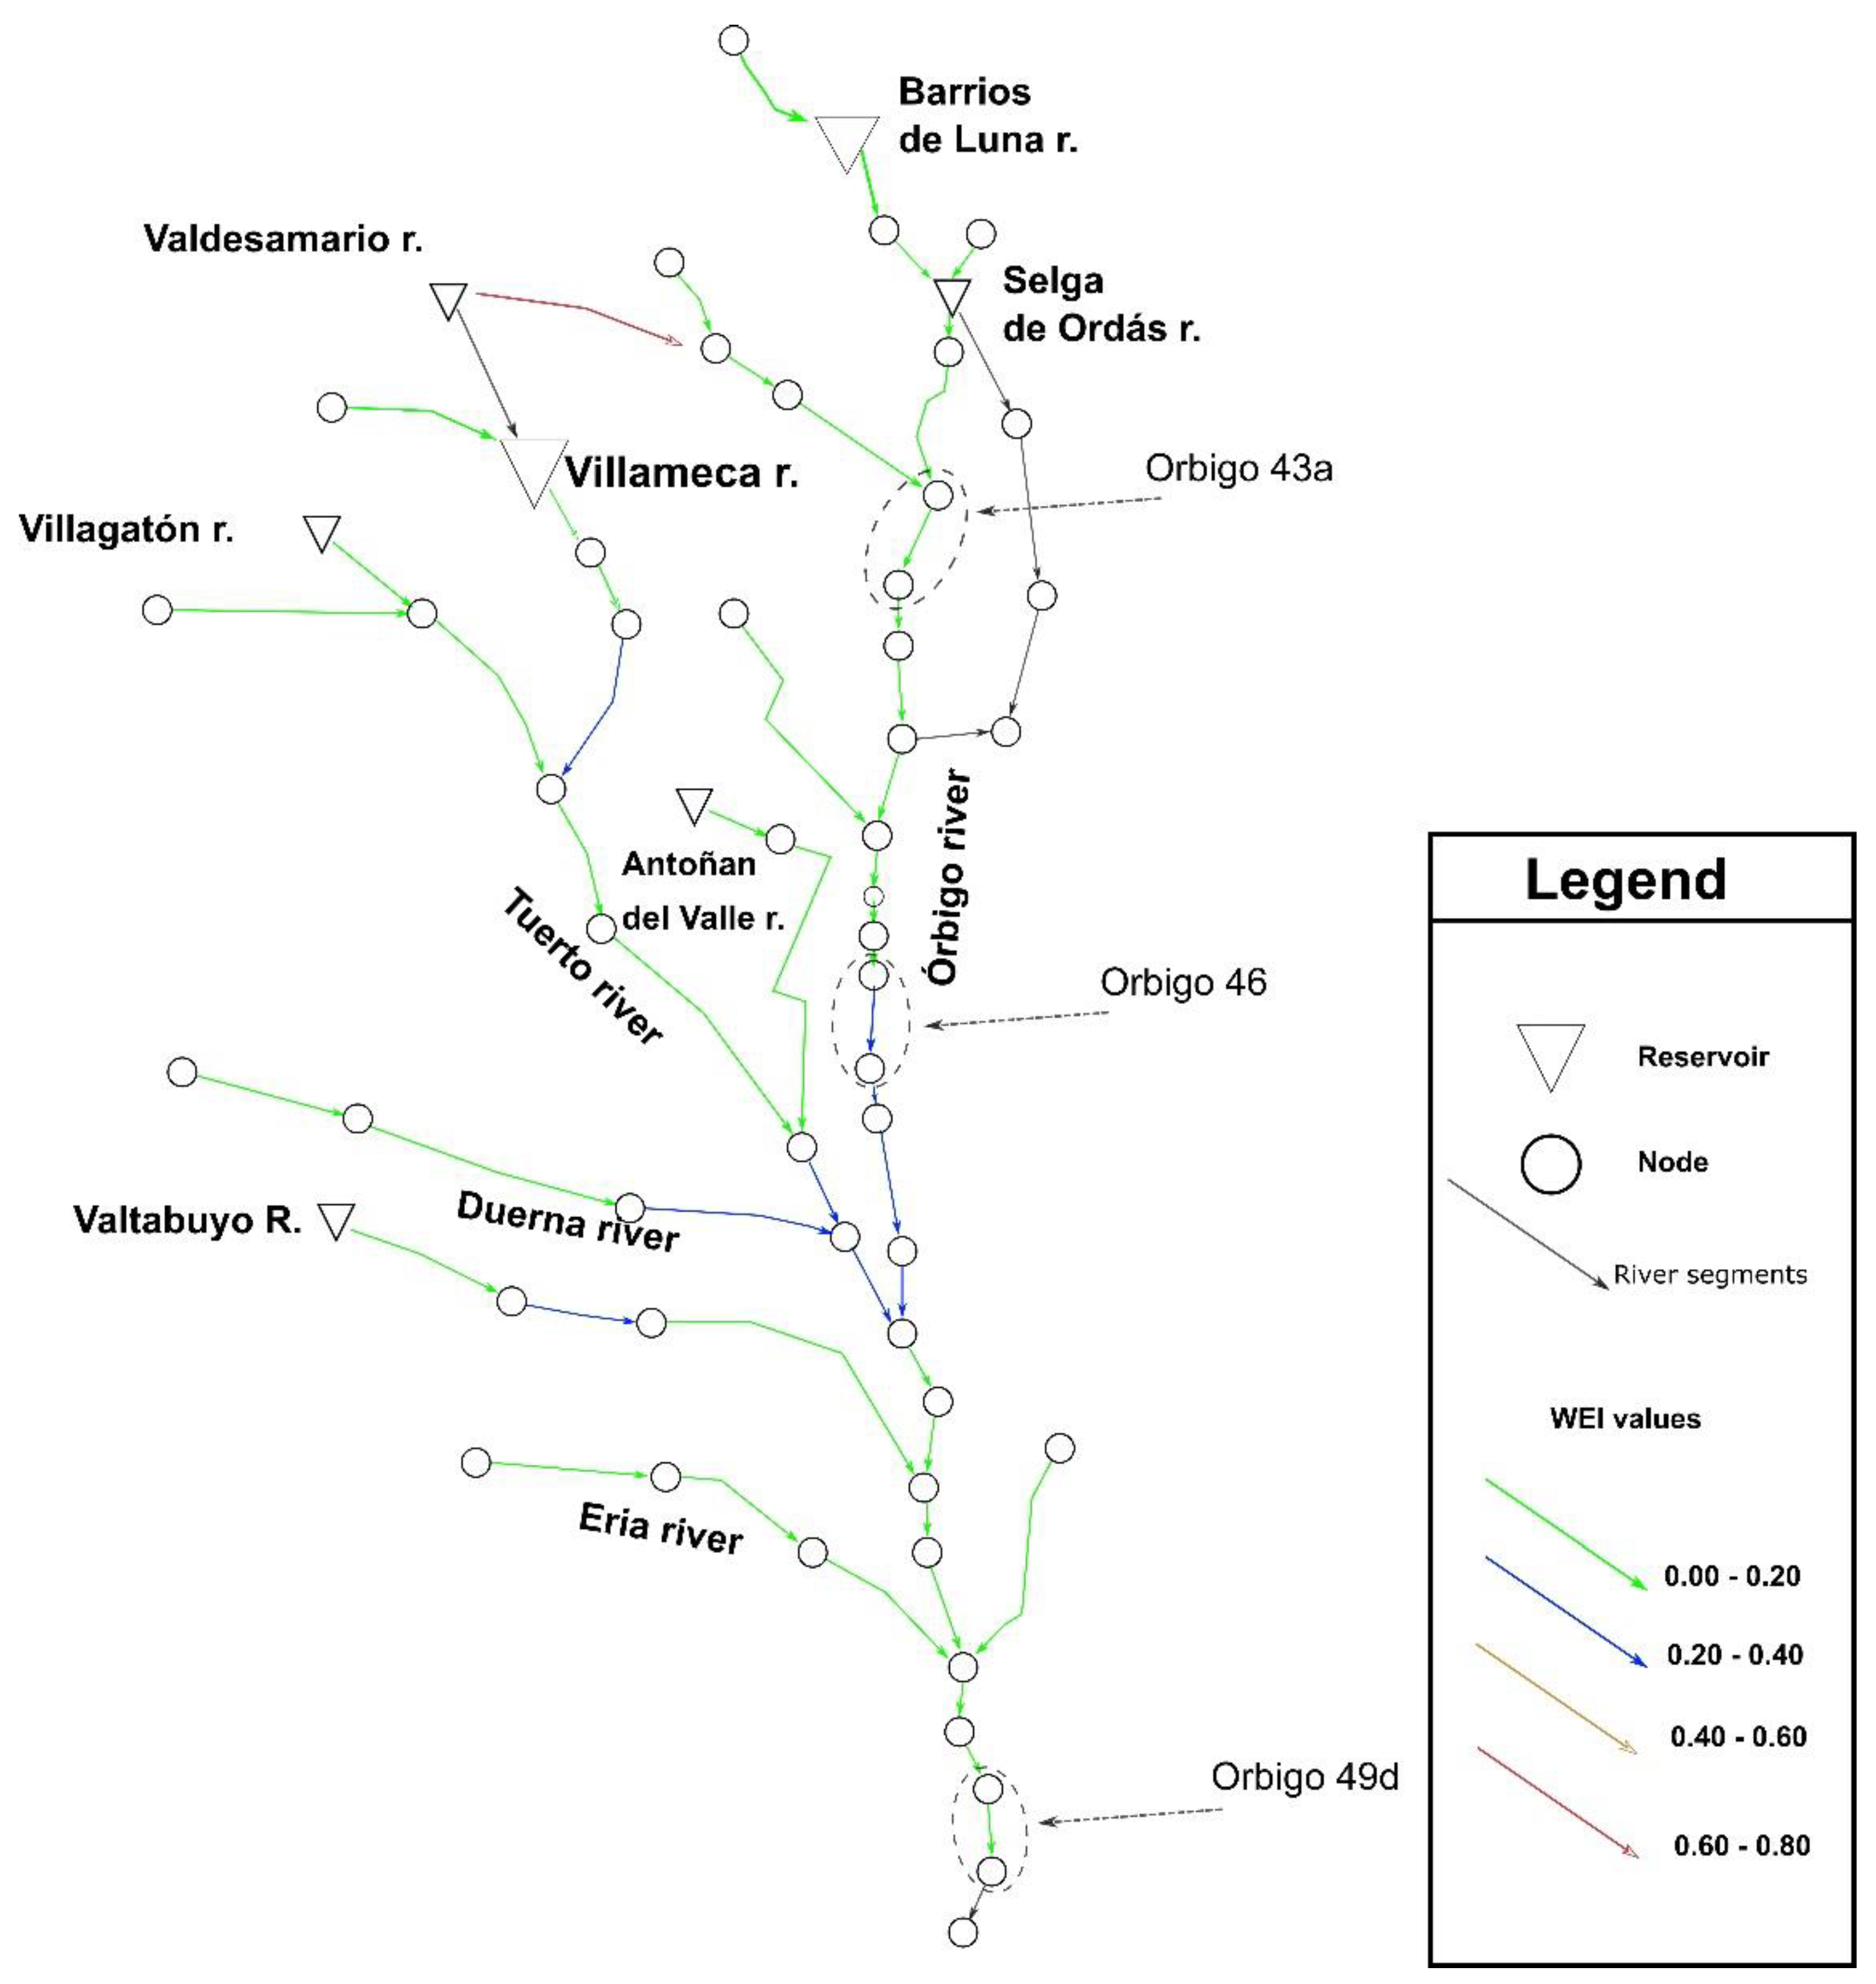
In this section, the spatial distribution of the water exploitation index within the Órbigo water resources system is analyzed. Firstly, Figure 4 shows the overall water exploitation index (i.e., the WEI+ based on the sum of all the monthly values of abstractions, returns, renewable water resources and environmental flows during the entire simulated period) in each river stretch. It is observed that the values of the overall WEI+ are generally lower than 0.2. The WEI+ is greater than 0.6 only in one river stretch (Valdesamario River, Figure 4). These results indicate that, on average, the water stress in the river basin during the simulated period is generally low. However, for a more exhaustive analysis of the water stress, the calculation of the yearly values of WEI+ is helpful since the regulation of the Órbigo water resources system is annual.
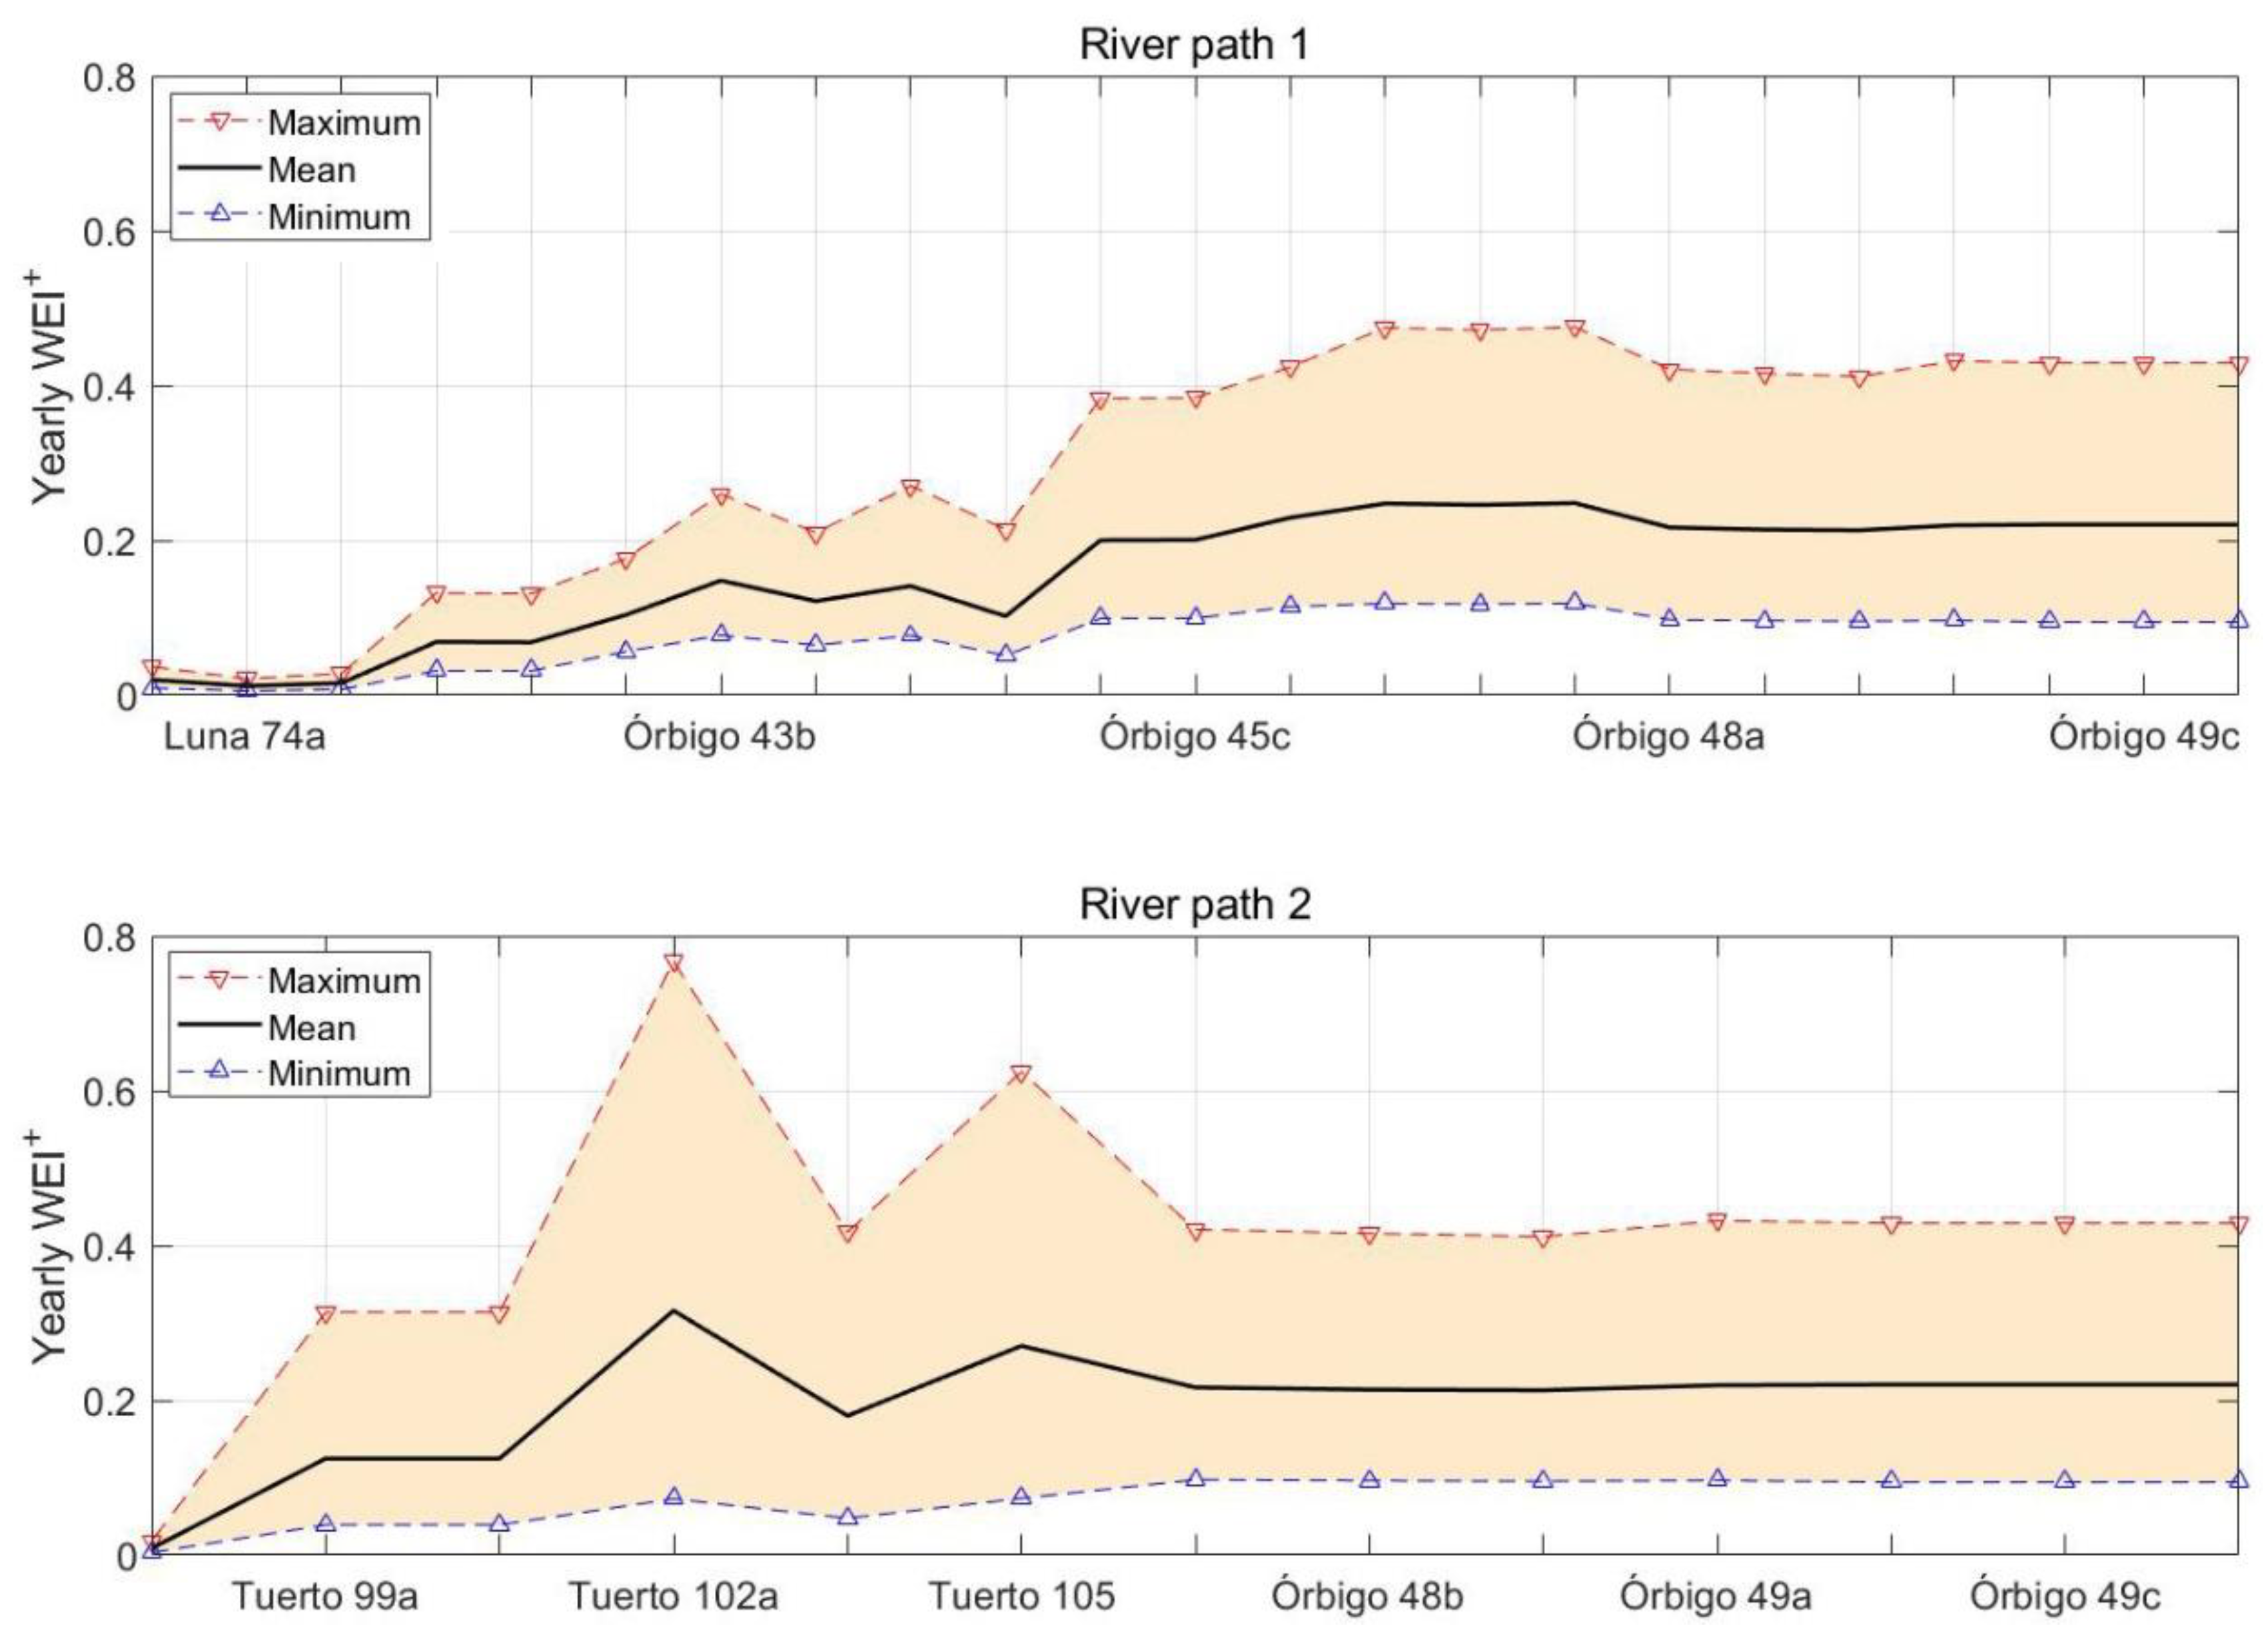
Figure 5 depicts the minimum, mean and maximum values of the yearly WEI+ along the two river paths indicated in Figure 1. In the first river path, the mean values of the yearly WEI+ along the middle and lower parts of the basin are higher than in the upper basin, but the mean values along path 1 are always less than 0.25. However, in some years the WEI+ values are much greater, reaching maximum values above 0.47.
On the other hand, the highest values of the yearly WEI+ along river path 2 are obtained in the upper part of the basin (Tuerto river stretch, Figure 5), which indicates that this river stretch is subjected to greater water stress than the Órbigo River. In fact, in some years, the yearly WEI+ values in the Tuerto River are greater than 0.6, reaching a maximum value of 0.76 in the Tuerto 102a river stretch. Thus, if new demands are projected in the Órbigo River basin, it would be more recommendable to supply these demands with water resources from the Órbigo River than from the Tuerto River. For this reason, the following section (Section 4.2) analyzes the temporal evolution of the yearly and monthly WEI+ in three river stretches of the Órbigo River in the upper, lower and middle parts of the basin.
4.2. Temporal Evolution of the Water Exploitation Index
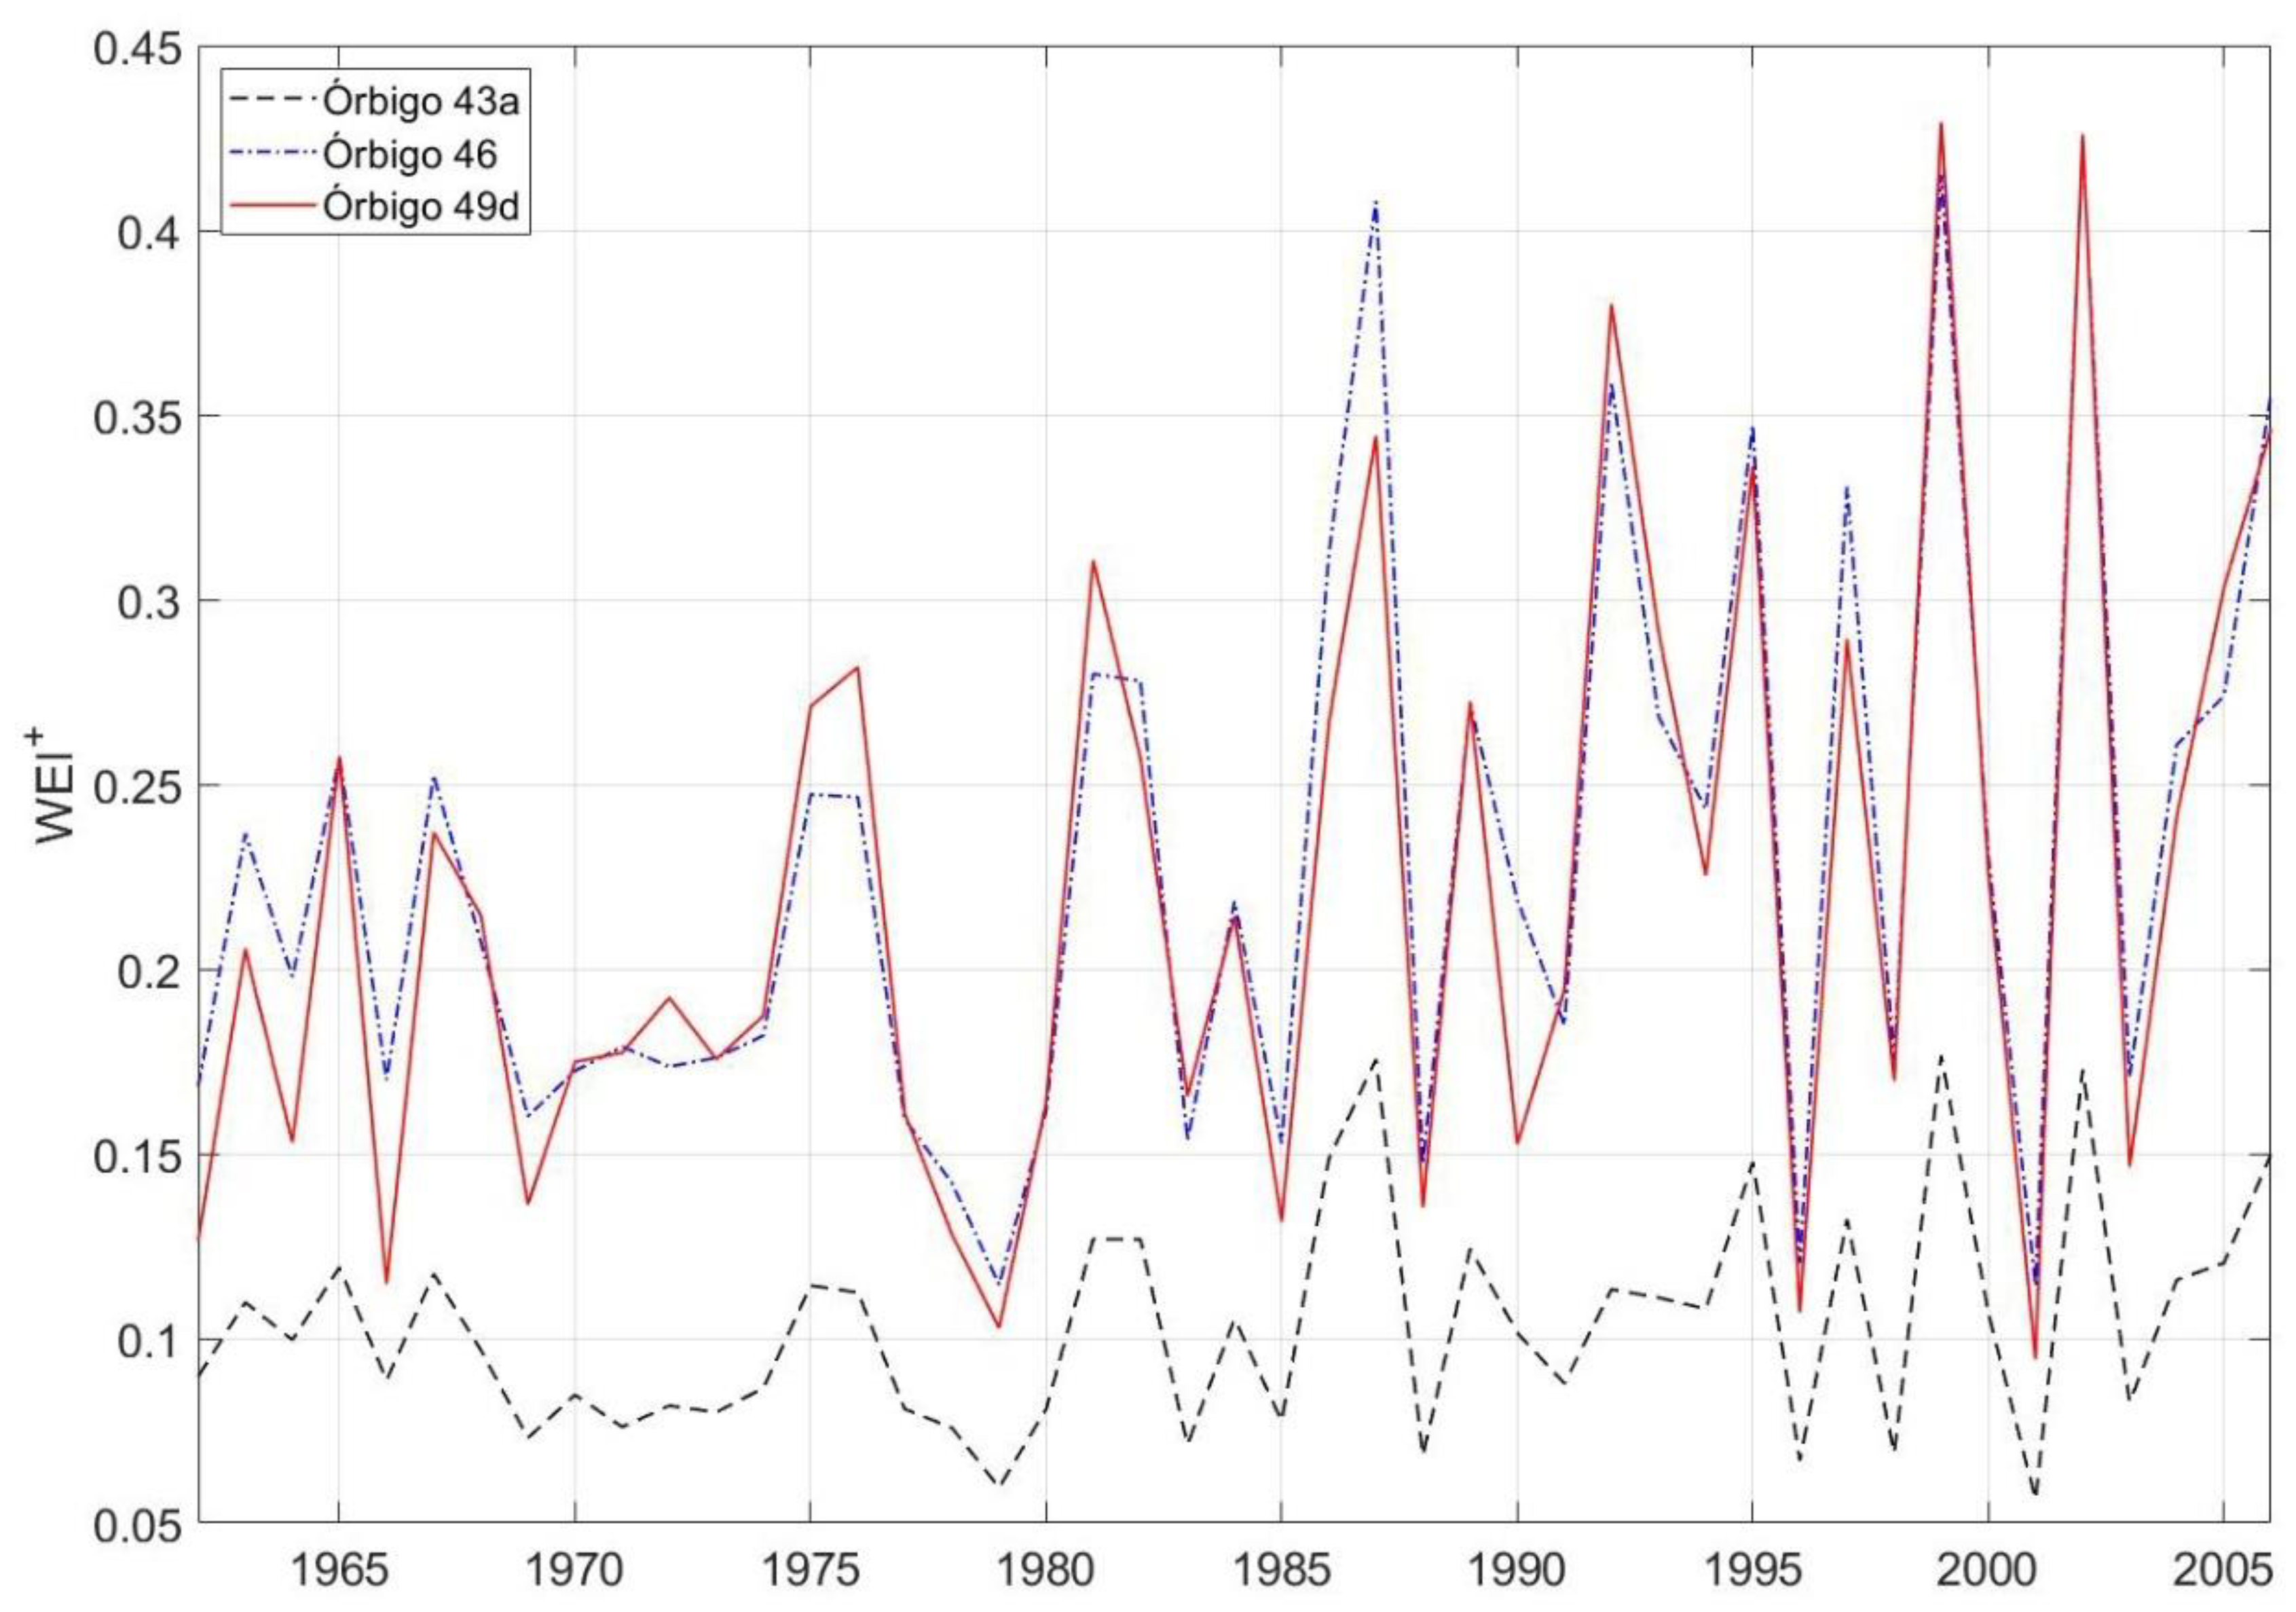
Figure 6 shows the temporal evolution of the yearly WEI+ in three stretches of the Órbigo River in the upper, middle and lower parts of the basin, which are indicated in Figure 3. It can be observed that the yearly WEI+ values experience a significant variability between years. These yearly WEI+ values are higher in the middle and lower parts of the basin (Órbigo 46 and Órbigo 49d) than in the upper part (Órbigo 43a). Thus, along the Órbigo River, the stretches of the upper part are subjected to lower levels of water stress, so that they could be more suitable to satisfy possible new water demands (and/or greater values of environmental flows) in the future. However, the monthly evolution of the water evolution index should also be considered to ensure that the regulation capacity of the upstream reservoirs (Barrios de Luna and Selga de Ordás, Figure 3 and Figure 4) is enough to satisfy all the water demands and environmental restrictions throughout the year.
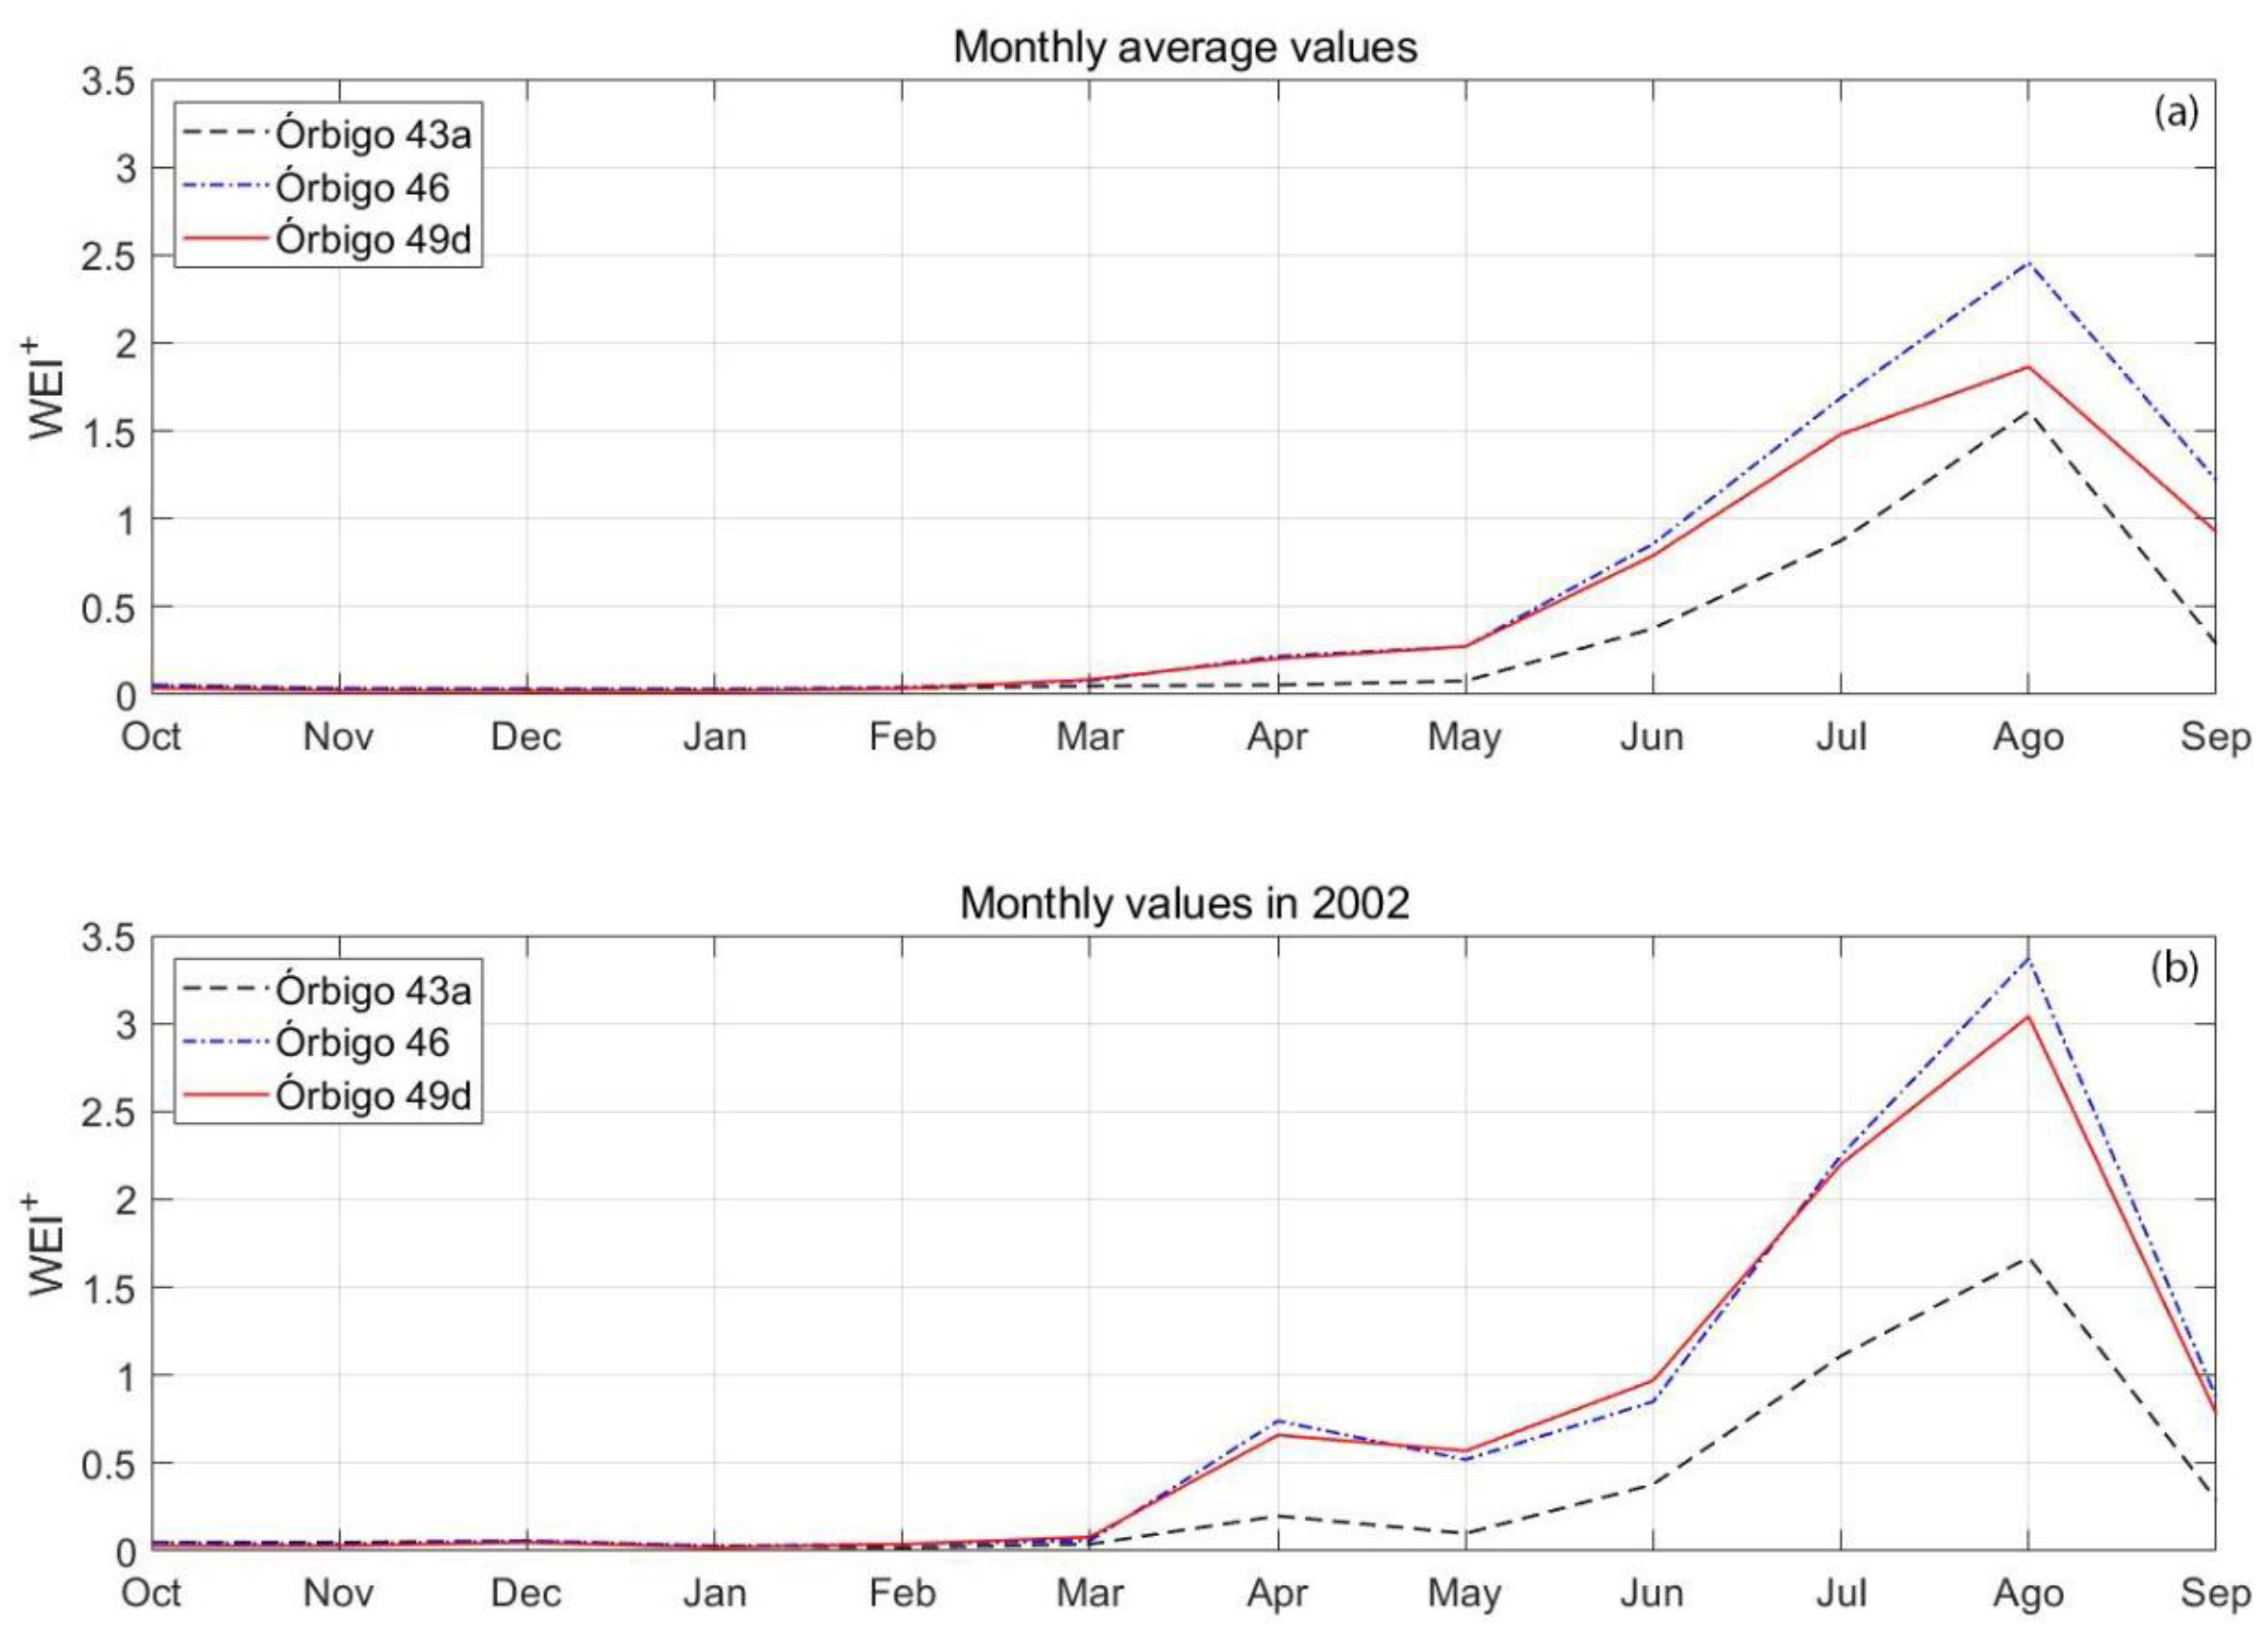
In Figure 7, the monthly average values of WEI+ and the WEI+ values during a year with a high level of water stress (2002, Figure 6) are depicted for the three Órbigo river stretches previously analyzed (Órbigo 43a, Órbigo 46 and Órbigo 49d). It is observed that the monthly WEI+ values are negligible between October and March, whereas in August, the average WEI+ is greater than 1.6, 1.85 and 2.45 in the upper, lower and middle stretches of the Órbigo River, respectively. These maximum monthly WEI+ values in 2002 (lower panel of Figure 6) are equal to 1.67, 3.04 and 3.37, respectively.
These WEI+ values indicate the high levels of water stress in the summer months in the upper, middle and lower parts of the river basin, as well as the importance and necessity of river regulation to satisfy the water demands and environmental constraints during all the months. In fact, the consumed water resources (numerator of Equation (1)) in August in the upper, lower and middle stretches of the Órbigo River are, on average, more than 1.6, 1.85 and 2.45 times greater than the available water resources (denominator of Equation (1)) in this month, respectively. The values of available and consumed water resources are influenced by the environmental flow regimes established in the river stretches, as reported in Section 4.3.
4.3. Effects of Environmental Flows on the Water Exploitation
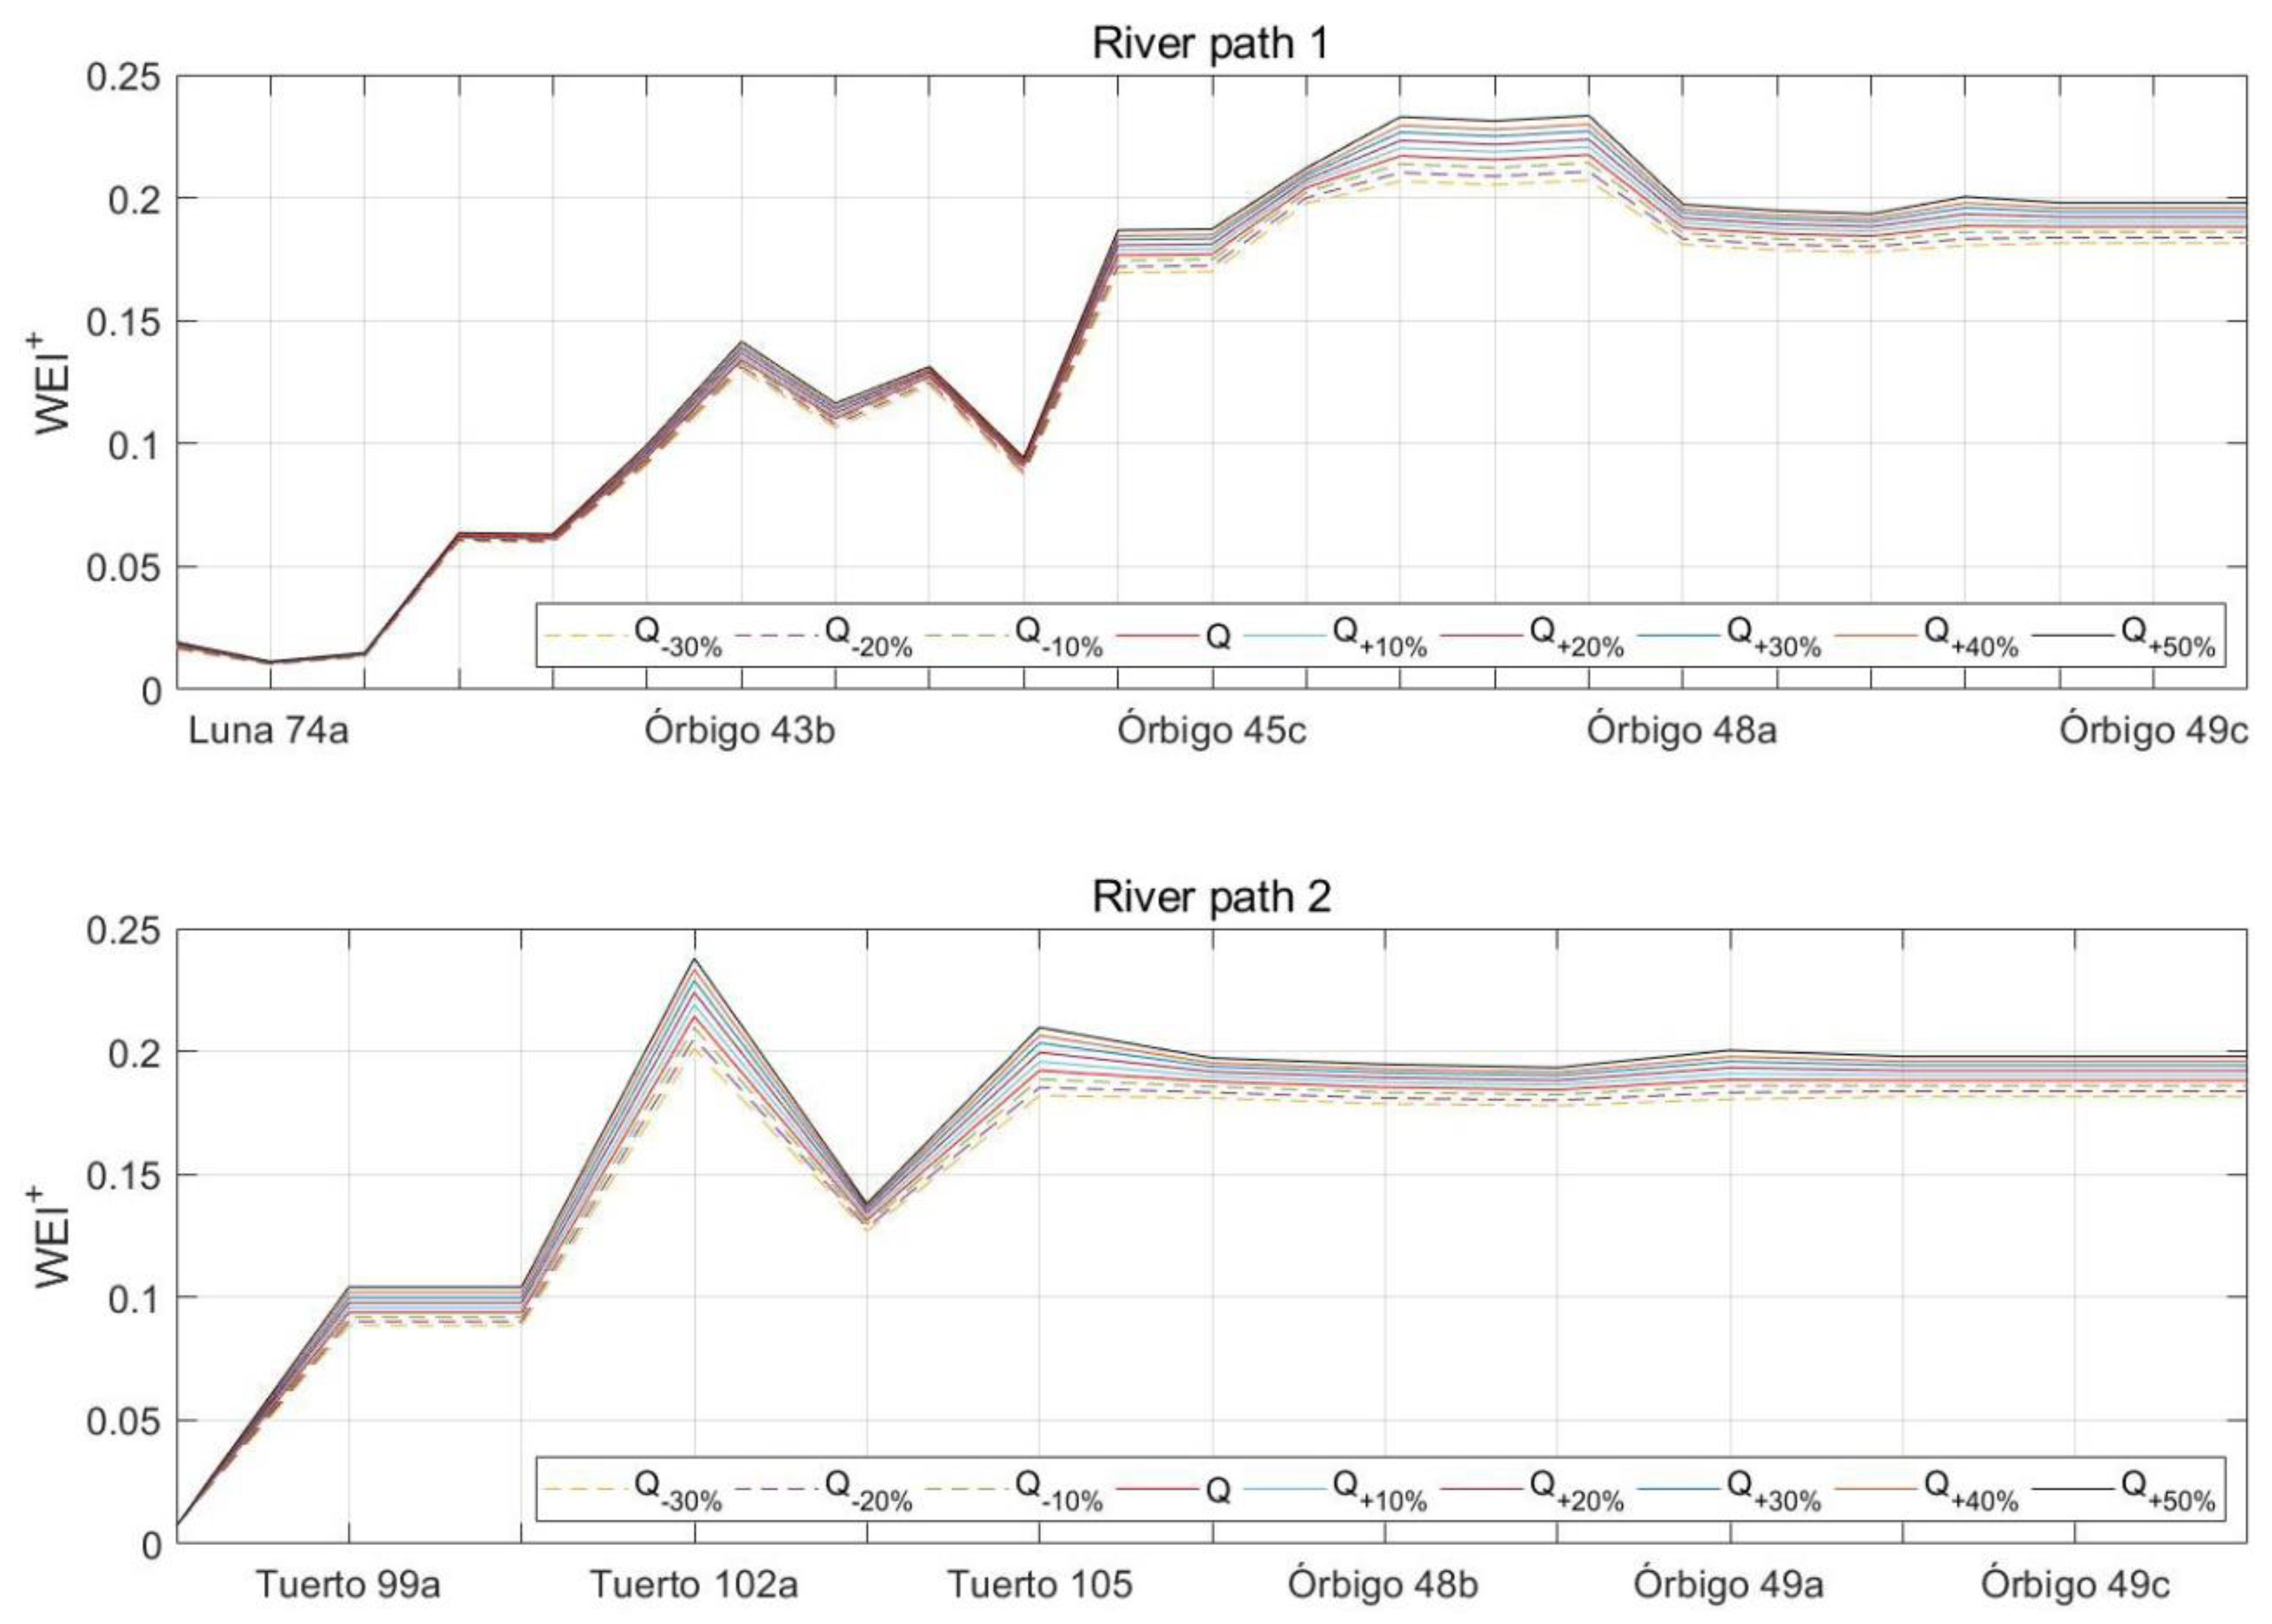
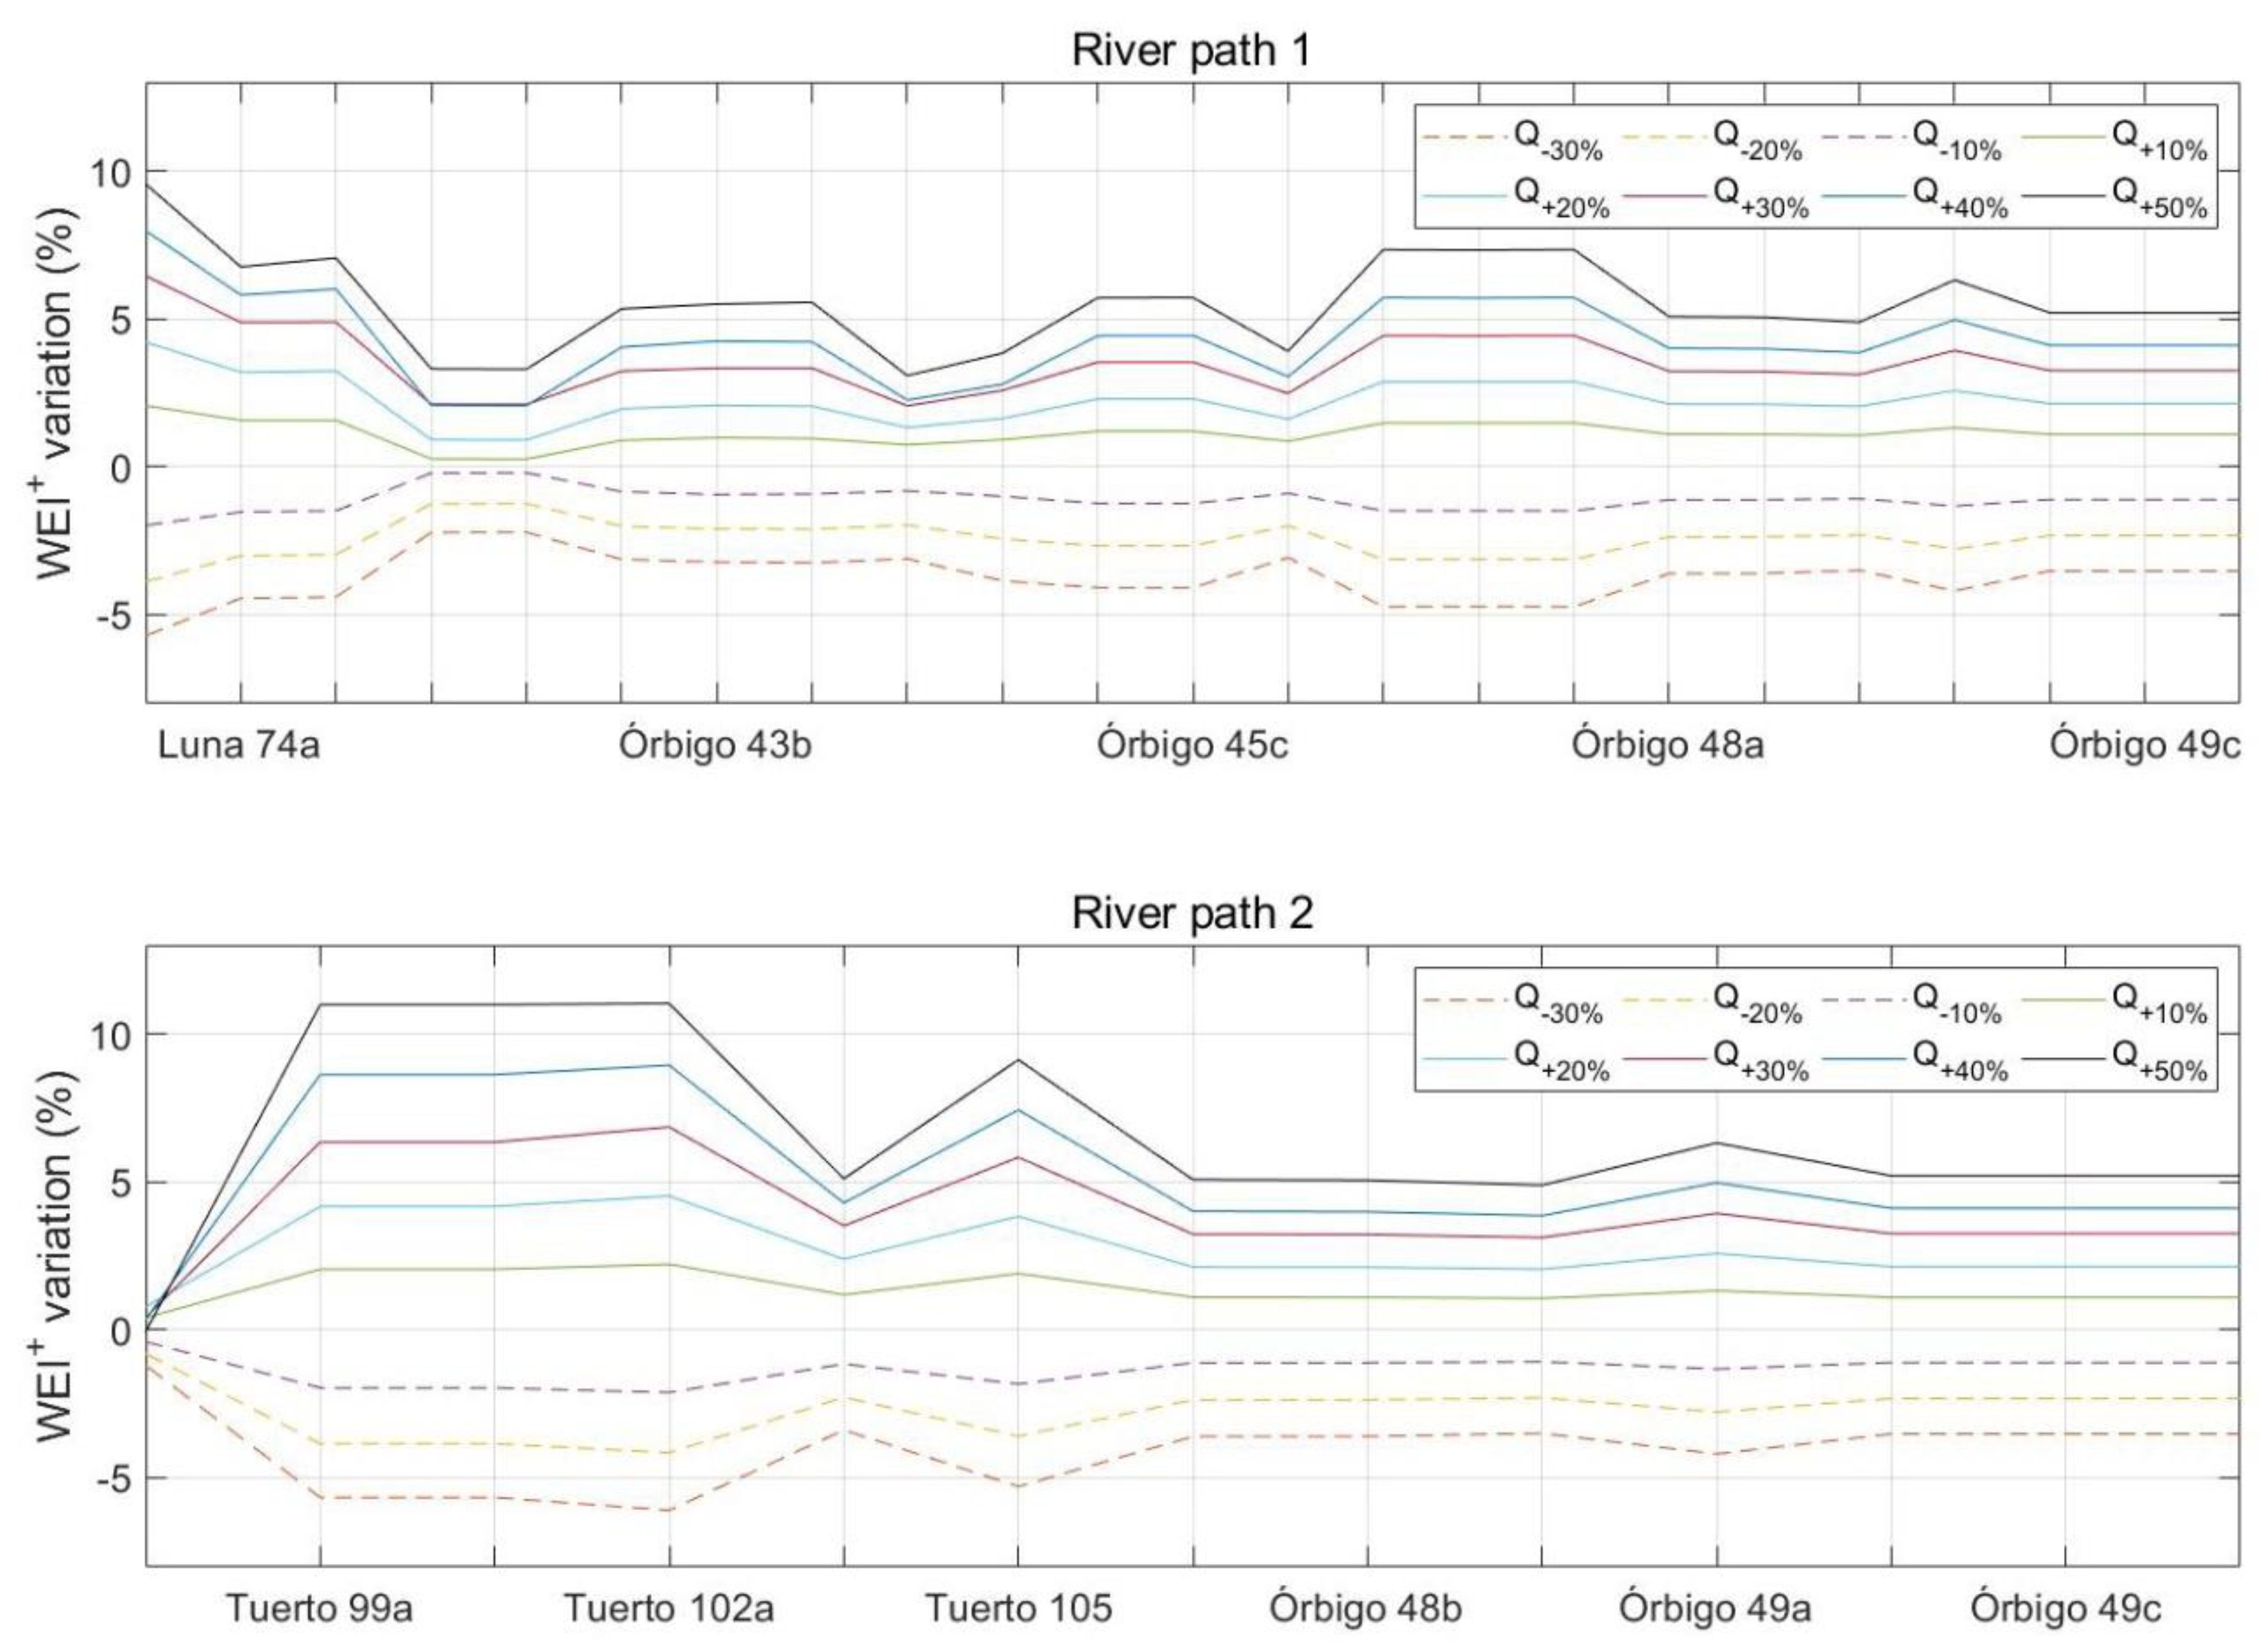
This section deals with the implications of the environmental flows on the spatial variability of the water exploitation index. To this end, the WEI+ values were obtained for each river stretch for the nine ecological flow scenarios defined in Section 3.3 (i.e., from −30% to +50% with respect to current environmental flows). Figure 8 shows the overall WEI+ values for the nine scenarios along the two river paths indicated in Figure 1, whereas Figure 9 depicts the WEI+ variation along these paths with respect to the current scenario of ecological flow scenario, i.e., (WEIscenario,I − WEIcurrent)/WEIcurrent.
Firstly, it is observed in Figure 8 that the spatial variability of the WEI+ values along both paths for all scenarios is consistent with the results of the current situation (reported in Section 4.1 and summarized in Figure 5). Regarding the variability between the WEI+ values for the different scenarios, as a general trend, the higher the ecological flows, the greater the WEI+ values. This is induced by the reduction of available water resources (denominator of Equation (1)) as the ecological flows increase.
However, this trend is not proportional, as the ecological flow values also induce variations in the consumed water resources. An increase (decrease) in the environmental flows causes a reduction (rise) in available water resources that, in turn, could lead to a reduction (rise) in consumed water resources due to the lower (greater) availability of water. This effect is observed, for example, in the Q+30% and Q+40% scenarios in the river path 1 (upper panel of Figure 9). In this case, the increase in the environmental flows from scenario Q+30% to scenario Q+40% induces a lower availability of water resources, but also a lower volume of consumed water, which leads to similar WEI+ values, even equal in some stretches. Thus, despite the increase in ecological flows, water stress in some river stretches in the Q+40% scenario is the same as in the Q+30% scenario (Figure 8 and Figure 9).
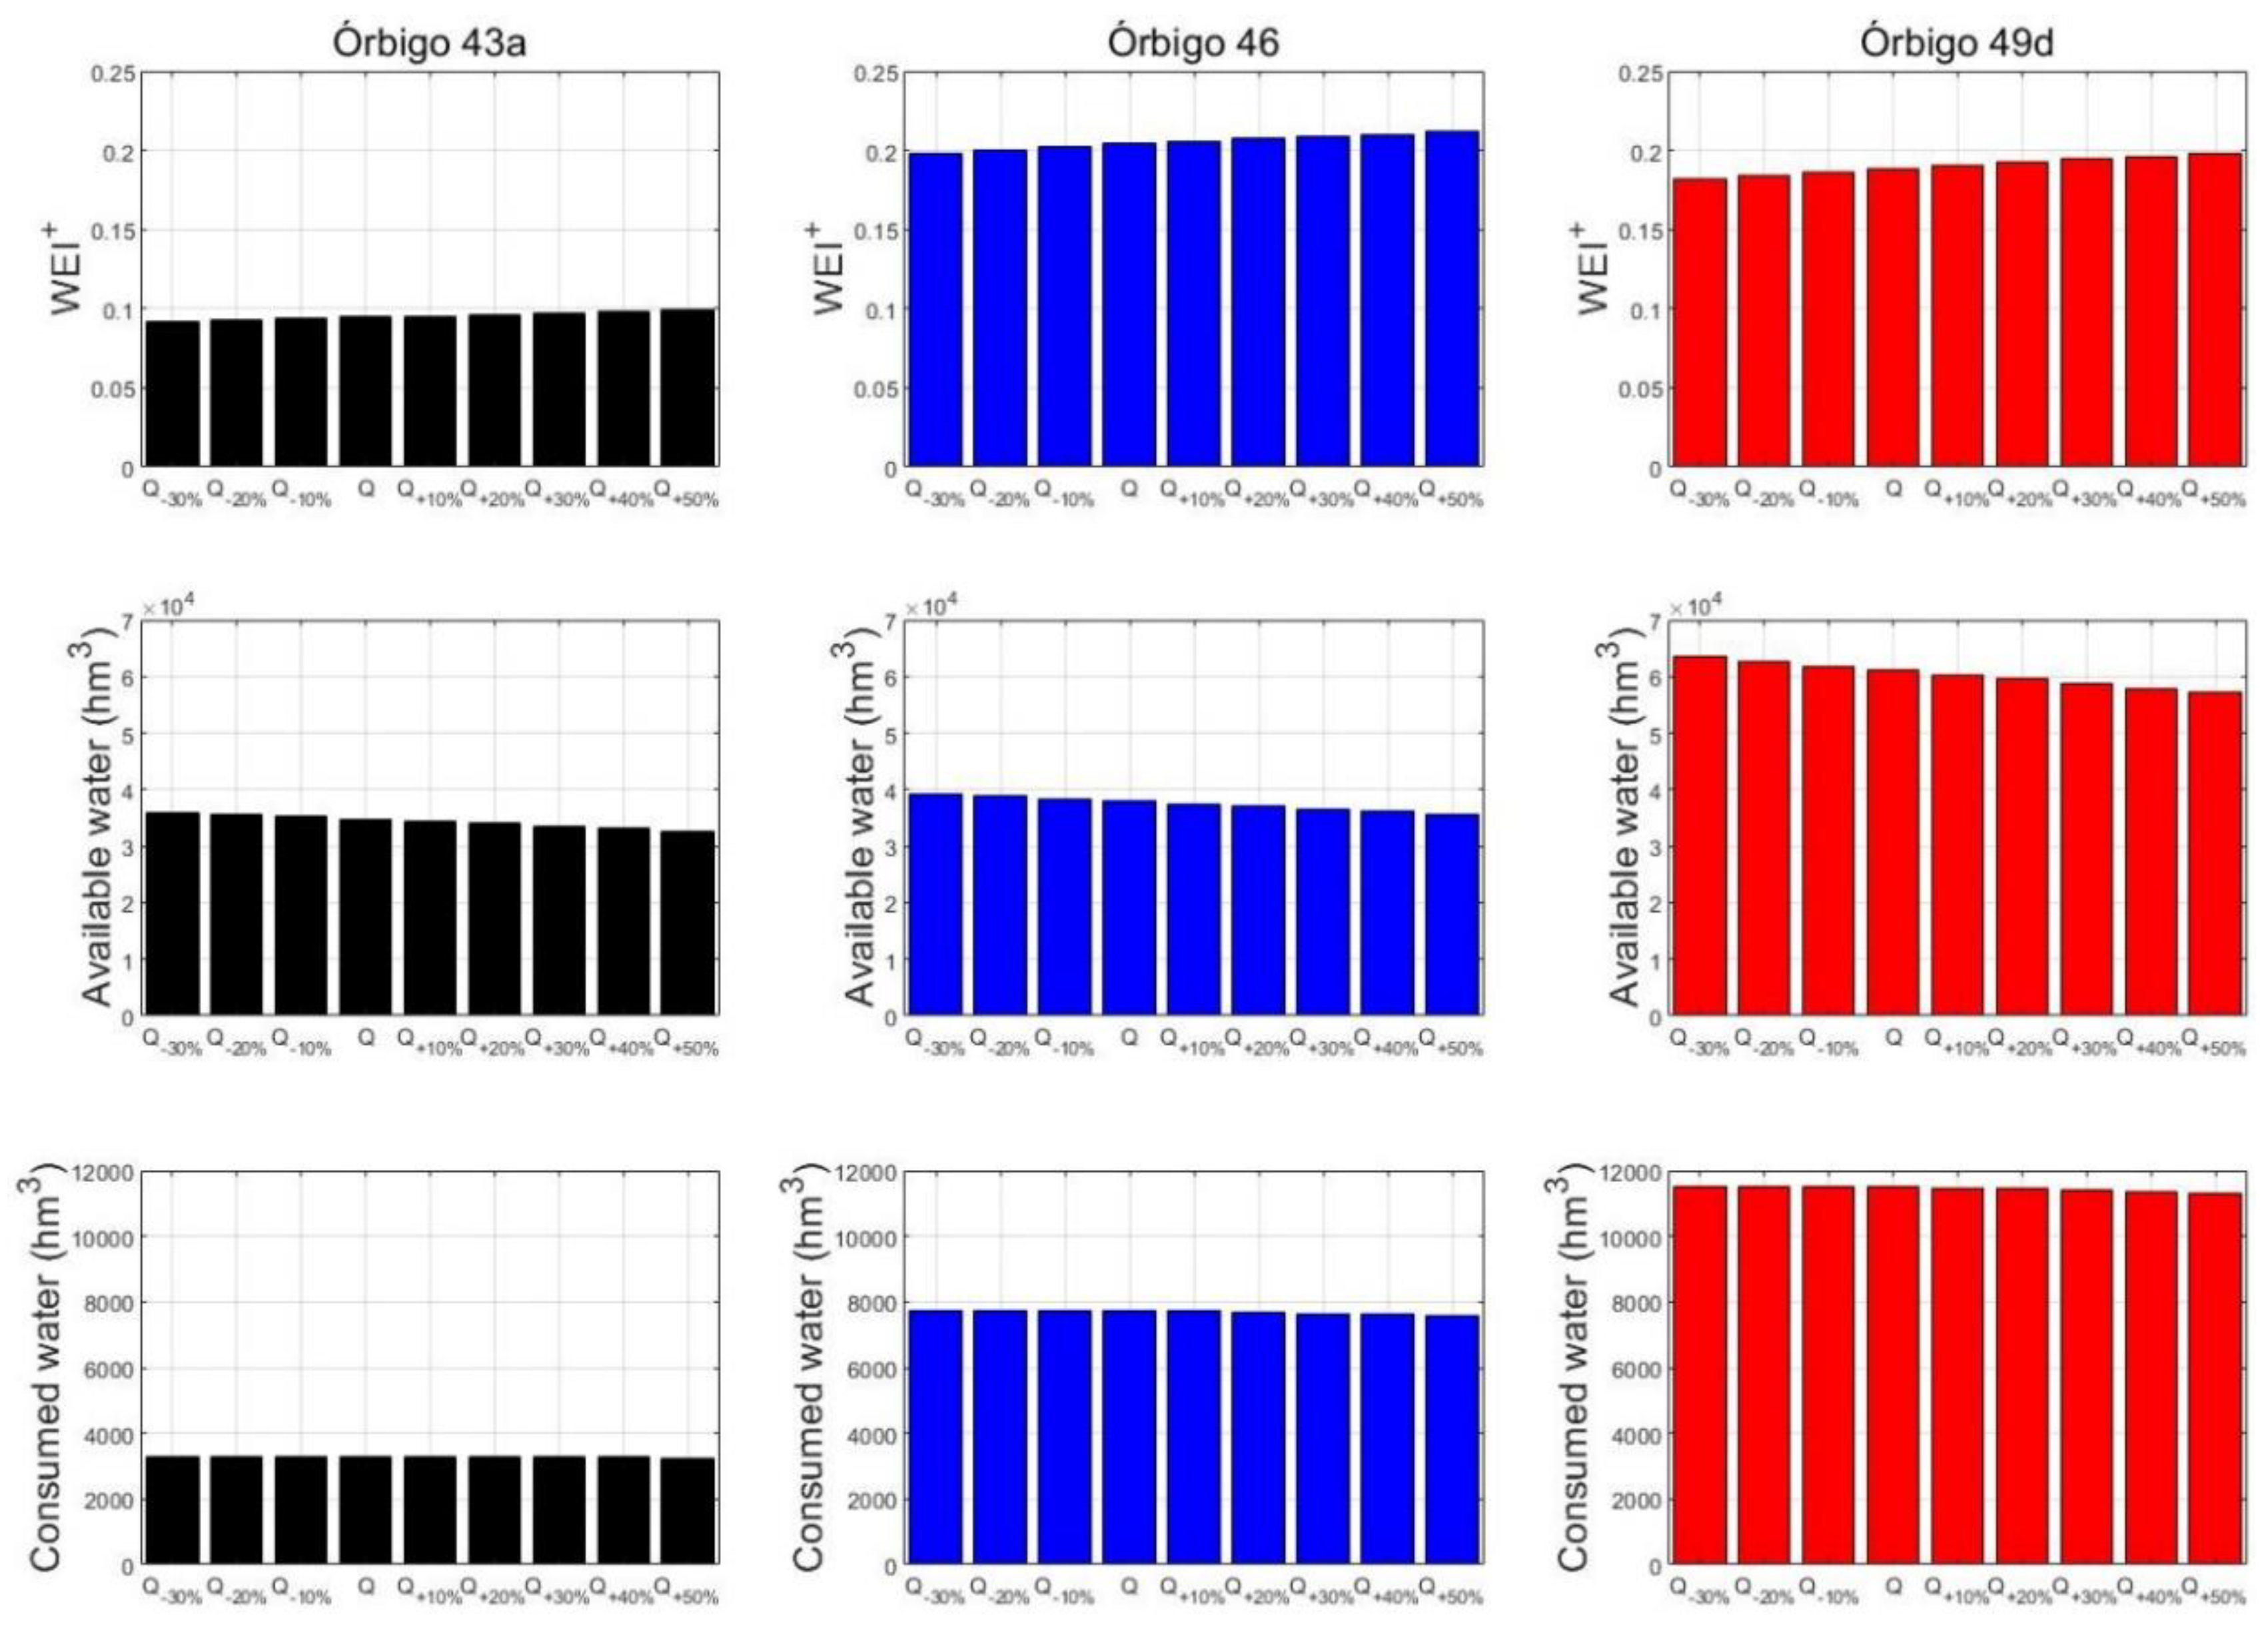
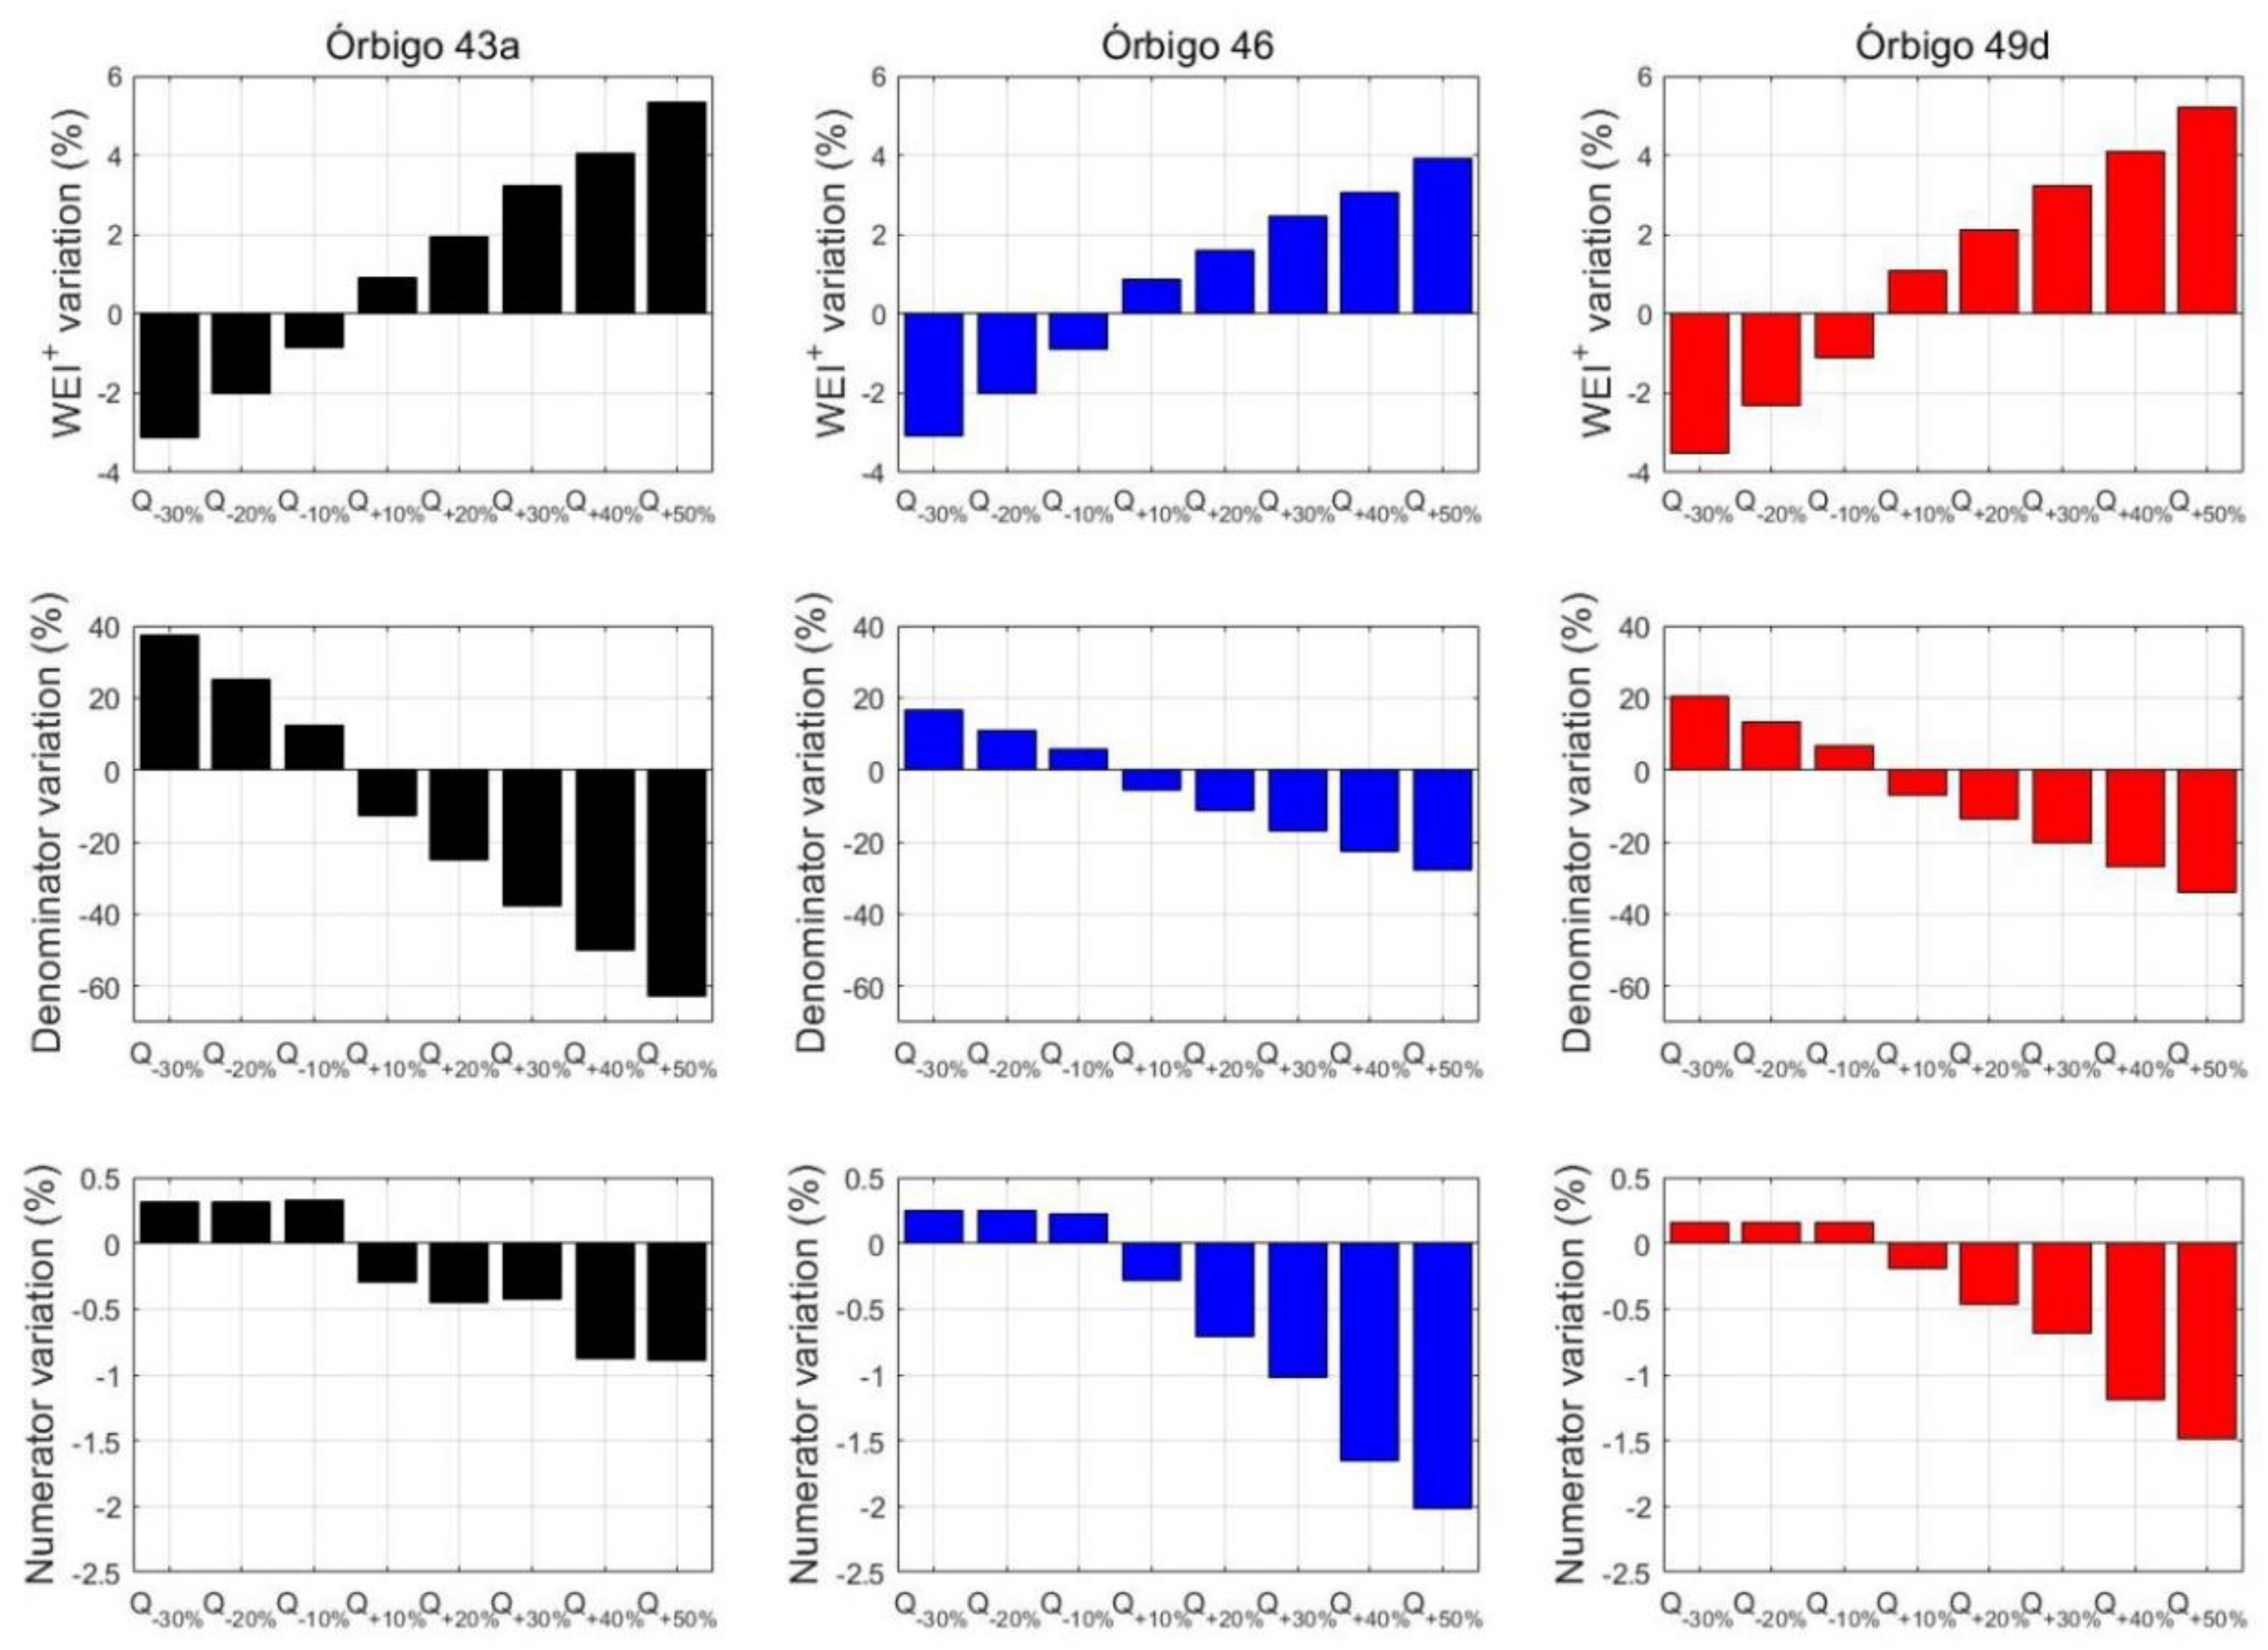
For a more exhaustive analysis of the effects of environmental flows on available and consumed water resources, Figure 10 shows the overall WEI+ in the three river stretches indicated in Figure 3, as well as the values of available water (denominator of Equation (1)) and consumed water (numerator of Equation (1)) for the nine environmental flow scenarios. The percentage variations with respect to the current scenario are displayed in Figure 11. It is clearly observed that the increases in environmental flows induce a reduction in available water (middle panels), but also a reduction in water consumption (lower panels) due to the lower availability of water resources. This leads to a non-constant/proportional relationship between ecological flows and WEI+ values, which was previously mentioned and is clearly visible in the upper panels of Figure 10 and Figure 11.
The effects of ecological flows on consumed water are greater as the level of water stress are higher. Among the three river stretches analyzed, Órbigo 46 and Órbigo 49d, which are located in the middle and lower parts of the basin, respectively (Figure 3), experience a higher level of water stress (Figure 6 and Figure 7) than Órbigo 43a. As shown in the lower panels of Figure 10 and Figure 11, the variations in consumed water between ecological flow scenarios are more notable in these river stretches with greater water stress, since in stressed river sections, the probability of not meeting water demands is higher.
The results of this section highlight the importance and necessity of using basin management models to adequately compute the water exploitation index, the spatial and temporal variability of these WEI+ values, as well as the effects of environmental flows not only on availability of water resources, but also on water consumption.
5. Conclusions
In this paper, a novel methodology is proposed to address the spatial variability of the water exploitation index within river basins. The methodology is endorsed by the implementation of a basin management model and is applicable to any regulated river basin. It was illustrated through a case study in Spain (the Órbigo River basin), where the spatio-temporal variation and the changes in the water exploitation index (WEI+) induced by nine environmental flow scenarios were investigated.
It was found that the Órbigo River is subjected to less water stress than the Tuerto River, so that the former would be a more suitable alternative to supply new future water demands. Within the Órbigo River, the sections of the upper part of the river have a greater availability of water to fulfill new water uses and/or environmental restrictions, since they have lower values of the WEI+. The assessment of the monthly evolution of the water resources exploitation in all the river stretches indicated that the monthly WEI+ values are negligible between October and March, while in August, the consumed water is more than 1.6, 1.85 and 2.45 times greater than renewable water resources in the upper, lower and middle stretches of the Órbigo River, respectively. This highlights the paramount importance of water regulation to satisfy all the water uses in the basin.
Finally, it was proven that the relationship between ecological flow values and water exploitation index is not as simple as might be expected based on the WEI+ equation, since the reduction or rise in environmental flows not only induces an increase or decrease, respectively, in available water resources, but can also lead to increases/decreases of the consumed water due to the greater/lower availability of water resources. This effect is more evident as the water stress of the river stretch is greater. These results reveal the necessity and usefulness of the methodology proposed in this work to accurately assess the intra-basin variability of the water exploitation index, which is the main novelty of this paper.
Author Contributions
Conceptualization, R.J.B. and J.P.-A.; Formal analysis, R.J.B. and J.P.-A.; Funding acquisition, A.S. and J.A.; Investigation, J.P.-L., R.J.B., A.S., J.P.-A. and J.A.; Methodology, J.P.-L., R.J.B. and J.P.-A.; Project administration, A.S. and J.A.; Software, J.P.-L. and A.S.; Supervision, R.J.B., A.S. and J.P.-A.; Writing—original draft, J.P.-L. and R.J.B.; Writing—review and editing, A.S., J.P.-A. and J.A. All authors have read and agreed to the published version of the manuscript.
Funding
This work was partly funded by the Spanish Research Agency (Ministry of Science and Innovation) through the project PID2019-106322RB-I00 (MCIN/AEI/10.13039/501100011033) and the research contract IJC2019-038848-I (MCIN/AEI/10.13039/501100011033).
Conflicts of Interest
The authors declare no conflict of interest.
References
- European Union. Communication from the Commission to the Council and the European Parliament: Addressing the Challenge of Water Scarcity and Droughts in the European Union; European Union: Maastricht, The Netherlands, 2007. [Google Scholar]
- Hussain, Z.; Wang, Z.; Wang, J.; Yang, H.; Arfan, M.; Hassan, D.; Wang, W.; Azam, M.I.; Faisal, M. A comparative Appraisal of Classical and Holistic Water Scarcity Indicators. Water Resour. Manag. 2022, 36, 931–950. [Google Scholar] [CrossRef]
- Vörösmarty, C.J.; McIntyre, P.B.; Gessner, M.O.; Dudgeon, D.; Prusevich, A.; Green, P.; Glidden, S.; Bunn, S.E.; Sullivan, C.A.; Liermann, C.R.; et al. Global threats to human water security and river biodiversity. Nature 2010, 467, 555–561. [Google Scholar] [CrossRef]
- World Health Organization. United Nations High Commissioner for Refugees Global Report 2021; World Health Organization: Geneva, Switzerland, 2021.
- Zobeidi, T.; Yaghoubi, J.; Yazdanpanah, M. Farmers’ incremental adaptation to water scarcity: An application of the model of private proactive adaptation to climate change (MPPACC). Agric. Water Manag. 2022, 264, 107528. [Google Scholar] [CrossRef]
- Mehrazar, A.; Bavani, A.R.M.; Gohari, A.; Mashal, M.; Rahimikhoob, H. Adaptation of Water Resources System to Water Scarcity and Climate Change in the Suburb Area of Megacities. Water Resour. Manag. 2020, 34, 3855–3877. [Google Scholar] [CrossRef]
- Paudel, B.; Zhang, Y.; Yan, J.; Rai, R.; Li, L.; Wu, X.; Chapagain, P.S.; Khanal, N.R. Farmers’ understanding of climate change in Nepal Himalayas: Important determinants and implications for developing adaptation strategies. Clim. Chang. 2019, 158, 485–502. [Google Scholar] [CrossRef]
- Whitehead, P.G.; Wilby, R.L.; Battarbee, R.W.; Kernan, M.; Wade, A.J. A review of the potential impacts of climate change on surface water quality. Hydrol. Sci. J. 2009, 54, 101–123. [Google Scholar] [CrossRef]
- Li, X.; Li, Y.; Li, G. A scientometric review of the research on the impacts of climate change on water quality during 1998–2018. Environ. Sci. Pollut. Res. 2020, 27, 14322–14341. [Google Scholar] [CrossRef]
- Richter, B.D.; Bartak, D.; Caldwell, P.; Davis, K.F.; Debaere, P.; Hoekstra, A.Y.; Li, T.; Marston, L.; McManamay, R.; Mekonnen, M.M.; et al. Water scarcity and fish imperilment driven by beef production. Nat. Sustain. 2020, 3, 319–328. [Google Scholar] [CrossRef]
- Tang, Q. Global change hydrology: Terrestrial water cycle and global change. Sci. China Earth Sci. 2019, 63, 459–462. [Google Scholar] [CrossRef]
- Liu, X.; Liu, W.; Tang, Q.; Liu, B.; Wada, Y.; Yang, H. Global Agricultural Water Scarcity Assessment Incorporating Blue and Green Water Availability Under Future Climate Change. Earth’s Futur. 2022, 10, e2021EF002567. [Google Scholar] [CrossRef]
- Buettner, T. Population projections and population policies. In International Handbook of Population Policies; Springer: Cham, Switzerland, 2022; pp. 467–484. [Google Scholar]
- Mancosu, N.; Snyder, R.L.; Kyriakakis, G.; Spano, D. Water Scarcity and Future Challenges for Food Production. Water 2015, 7, 975–992. [Google Scholar] [CrossRef]
- Candido, L.A.; Coêlho, G.A.G.; de Moraes, M.M.G.A.; Florêncio, L. Review of Decision Support Systems and Allocation Models for Integrated Water Resources Management Focusing on Joint Water Quantity-Quality. J. Water Resour. Plan. Manag. 2022, 148, 03121001. [Google Scholar] [CrossRef]
- Pardo-Loaiza, J.; Bergillos, R.; Solera, A.; Paredes-Arquiola, J.; Andreu, J. Habitat alteration assessment for the management of environmental flows in regulated basins. J. Environ. Manag. 2022, 319, 115653. [Google Scholar] [CrossRef]
- Andreu, J.; Pérez, M.A.; Paredes-Arquiola, J.; Solera, A. Participatory analysis of the Jucar-Vinalopo (Spain) water conflict using a decision support system. In Proceedings of the 18th World IMACS/MODSIM Congress, Cairns, Australia, 13–17 July 2009; pp. 13–17. [Google Scholar]
- Arthington, A.H.; Bhaduri, A.; Bunn, S.E.; Jackson, S.E.; Tharme, R.E.; Tickner, D.; Young, B.; Acreman, M.; Baker, N.; Capon, S.; et al. The Brisbane Declaration and Global Action Agenda on Environmental Flows (2018). Front. Environ. Sci. 2018, 6, 45. [Google Scholar] [CrossRef]
- Poff, N.L.; Allan, J.D.; Bain, M.B.; Karr, J.R.; Prestegaard, K.L.; Richter, B.D.; Sparks, R.E.; Stromberg, J.C. The Natural Flow Regime. Bioscience 1997, 47, 769–784. [Google Scholar] [CrossRef]
- Arthington, A.H.; Bunn, S.; Poff, N.L.; Naiman, R.J. The Challenge of Providing Environmental Flow Rules to Sustain River Ecosystems. Ecol. Appl. 2006, 16, 1311–1318. [Google Scholar] [CrossRef]
- Bunn, S.E.; Arthington, A.H. Basic Principles and Ecological Consequences of Altered Flow Regimes for Aquatic Biodiversity. Environ. Manag. 2002, 30, 492–507. [Google Scholar] [CrossRef]
- Monico, V.; Solera, A.; Bergillos, R.J.; Paredes-Arquiola, J.; Andreu, J. Effects of environmental flows on hydrological alteration and reliability of water demands. Sci. Total Environ. 2021, 810, 151630. [Google Scholar] [CrossRef]
- Pardo-Loaiza, J.; Solera, A.; Bergillos, R.J.; Paredes-Arquiola, J.; Andreu, J. Improving Indicators of Hydrological Alteration in Regulated and Complex Water Resources Systems: A Case Study in the Duero River Basin. Water 2021, 13, 2676. [Google Scholar] [CrossRef]
- Arthington, A.H.; Kennen, J.G.; Stein, E.D.; Webb, J.A. Recent advances in environmental flows science and water management—Innovation in the Anthropocene. Freshw. Biol. 2018, 63, 1022–1034. [Google Scholar] [CrossRef] [Green Version]
- Raskin, P.; Gleick, P.; Kirshen, P.; Pontius, G.; Strzepek, K. Water Futures: Assessment of Long-Range Patterns and Problems. Comprehensive Assessment of the Freshwater Resources of the World; SEI: Oaks, PA, USA, 1997. [Google Scholar]
- Falkenmark, M.; Lundqvist, J.; Widstrand, C. Macro-scale water scarcity requires micro-scale approaches. Nat. Resour. Forum 1989, 13, 258–267. [Google Scholar] [CrossRef]
- Seckler, D.; Amarasinghe, U.; Molden, D.; de Silva, R.; Barker, R. World Water Demand and Supply, 1990 to 2025: Scenarios and Issues; Research Report 19; Iwmi: Colombo, Sri Lanka, 1998. [Google Scholar]
- Alcamo, J.; Henrichs, T.; Rosch, T. World Water in 2025; World Water Series Report 2; Center for Environmental Systems Research; University of Kassel: Kassel, Germany, 2000. [Google Scholar]
- Perveen, S.; James, L.A.; James, A. Multiscale Effects on Spatial Variability Metrics in Global Water Resources Data. Water Resour. Manag. 2009, 24, 1903–1924. [Google Scholar] [CrossRef]
- Sullivan, C.A.; Meigh, J.; Giacomello, A.M. The Water Poverty Index: Development and application at the community scale. Nat. Resour. Forum 2003, 27, 189–199. [Google Scholar] [CrossRef]
- Sullivan, C.A.; Meigh, J.; Lawrence, P. Application of the Water Poverty Index at Different Scales: A Cautionary Tale. Water Int. 2006, 31, 412–426. [Google Scholar] [CrossRef]
- Vanham, D.; Hoekstra, A.Y.; Wada, Y.; Bouraoui, F.; de Roo, A.; Mekonnen, M.M.; van de Bund, W.J.; Batelaan, O.; Pavelic, P.; Bastiaanssen, W.G.M.; et al. Physical water scarcity metrics for monitoring progress towards SDG target 6.4: An evaluation of indicator 6.4.2 “Level of water stress”. Sci. Total Environ. 2018, 613–614, 218–232. [Google Scholar] [CrossRef]
- United Nations. Statistical Division, & London Group on Environmental Accounting. Subgroup on Water Accounting. System of Environmental-Economic Accounting for Water; United Nations Publications: New York, NY, USA, 2012; Volume 100. [Google Scholar]
- Hoekstra, A.Y. Water footprint accounting. In Water Accounting: International Approaches to Policy and Decision-making; Edward Elgar Publishing: Cheltenham, UK, 2012; pp. 58–75. [Google Scholar]
- Hoekstra, A.Y. Water Footprint Assessment: Evolvement of a New Research Field. Water Resour. Manag. 2017, 31, 3061–3081. [Google Scholar] [CrossRef]
- European Environment Agency. The European Environment. State and Outlook 2005; European Environment Agency: Copenhagen, Denmark, 2005.
- Kanakoudis, V.; Tsitsifli, S.; Papadopoulou, A.; Cencur-Curk, B.; Karleusa, B. Estimating the Water Resources Vulnerability Index in the Adriatic Sea Region. Procedia Eng. 2016, 162, 476–485. [Google Scholar] [CrossRef]
- Kanakoudis, V.; Tsitsifli, S.; Papadopoulou, A.; Cencur-Curk, B.; Karleusa, B. Water resources vulnerability assessment in the Adriatic Sea region: The case of Corfu Island. Environ. Sci. Pollut. Res. 2017, 24, 20173–20186. [Google Scholar] [CrossRef]
- Kanakoudis, V.; Papadopoulou, A.; Tsitsifli, S.; Cencur-Curk, B.; Karleusa, B.; Matic, B.; Altran, E.; Banovec, P. Policy recommendation for drinking water supply cross-border networking in the Adriatic region. J. Water Supply Res. Technol. 2017, 66, 489–508. [Google Scholar] [CrossRef]
- Pedro-Monzonís, M.; Solera, A.; Ferrer, J.; Estrela, T.; Paredes-Arquiola, J. A review of water scarcity and drought indexes in water resources planning and management. J. Hydrol. 2015, 527, 482–493. [Google Scholar] [CrossRef] [Green Version]
- Casadei, S.; Peppoloni, F.; Pierleoni, A. A New Approach to Calculate the Water Exploitation Index (WEI+). Water 2020, 12, 3227. [Google Scholar] [CrossRef]
- European Environment Agency. Water Scarcity Conditions as Measured Using the Water Exploitation Index Plus (WEI+) by Country; European Environment Agency: Copenhagen, Denmark, 2017.
- Bergström, S. Development and Application of a Conceptual Runoff Model for Scandinavian Catchments; SMHI RHO: Norrköping, Sweden, 1976; Volume 7, p. 134. [Google Scholar]
- Bergström, S. The HBV model. In Computer Models of Watershed Hydrology; Water Resources Publications: Littleton, CO, USA, 1995; pp. 443–476. [Google Scholar]
- Arnold, J.G.; Srinivasan, R.; Muttiah, R.; Williams, J. Large area hydrologic modeling and assessment. Part I: Model development. J. Am. Water Resour. Assoc. 1998, 34, 73–89. [Google Scholar] [CrossRef]
- Srinivasan, R.; Ramanarayanan, T.; Arnold, J.G.; Bednarz, S. Large area hydrologic modeling and assessment. Part II: Model application. J. Am. Water Resour. Assoc. 1998, 34, 91–101. [Google Scholar] [CrossRef]
- Noto, L.V. Exploiting the Topographic Information in a PDM-Based Conceptual Hydrological Model. J. Hydrol. Eng. 2014, 19, 1173–1185. [Google Scholar] [CrossRef]
- Perrin, C.; Michel, C.; Andréassian, V. Improvement of a parsimonious model for streamflow simulation. J. Hydrol. 2003, 279, 275–289. [Google Scholar] [CrossRef]
- Témez, J.R. Modelo Matemático de Transformación Precipitaciòn-Escorrentía; Asociación de Investigación Industrial Eléctrica: Madrid, Spain, 1977. [Google Scholar]
- Burnash, R.J.; Ferral, R.L.; McGuire, R.A. A Generalized Streamflow Simulation System: Conceptual Modeling for Digital Computers; US Department of Commerce, National Weather Service, and State of California, Department of Water Resources: Sacramento, CA, USA, 1973.
- Burnash, R. The NWS River Forecast System-catchment modeling. In Computer Models of Watershed Hydrology; Water Resources Publications: Littleton, CO, USA, 1995; pp. 311–366. [Google Scholar]
- CHD. Plan Hidrológico de la Parte Española de la Demarcación Hidrográfica del Duero (2015–2021); CHD: Valladolid, Spain, 2015. [Google Scholar]
- Andreu, J.; Capilla, J.; Sanchís, E. AQUATOOL, a generalized decision-support system for water-resources planning and operational management. J. Hydrol. 1996, 177, 269–291. [Google Scholar] [CrossRef]
- MARM. Orden ARM/2656/2008; de 10 de Septiembre, por la que se Aprueba la Instrucción de Planificación Hidrológica. BOE: Madrid, Spain, 2008; Volume 229, pp. 38472–38582.
Figure 1.
Location of the Spanish part of the Duero River basin, and the Órbigo River basin (northwestern Spain). The main river sections of the Órbigo River Basin and the two river paths analyzed in this work are indicated in the right panel.
Figure 1.
Location of the Spanish part of the Duero River basin, and the Órbigo River basin (northwestern Spain). The main river sections of the Órbigo River Basin and the two river paths analyzed in this work are indicated in the right panel.

Figure 2.
Flowchart of the methodology of this work.

Figure 3.
Topology of the Órbigo water resources system used in the basin simulation model (SIMGES). The green, pink and blue squares represent agricultural, urban and industrial demand units, respectively. Three river stretches (represented as arrows in the figure) analyzed in this work (Órbigo 43a, Órbigo 46 and Órbigo 49d) are marked in the figure.

Figure 4.
Plan view of the water exploitation index (WEI+) in each river stretch based on the entire simulated period.
Figure 4.
Plan view of the water exploitation index (WEI+) in each river stretch based on the entire simulated period.

Figure 5.
Variation of the yearly WEI+ along the two river paths indicated in Figure 1. The maximum, mean and minimum values are marked in red, black and blue, respectively.
Figure 5.
Variation of the yearly WEI+ along the two river paths indicated in Figure 1. The maximum, mean and minimum values are marked in red, black and blue, respectively.

Figure 6.
Evolution of the yearly WEI+ in three river stretches in the upper (Órbigo 43a), middle (Órbigo 46) and lower (Órbigo 49d) parts of the basin (Figure 3).
Figure 6.
Evolution of the yearly WEI+ in three river stretches in the upper (Órbigo 43a), middle (Órbigo 46) and lower (Órbigo 49d) parts of the basin (Figure 3).

Figure 7.
Monthly average values of the WEI+ (a) and monthly values of the WEI+ in 2001 (b) in three river stretches in the upper (Órbigo 43a), middle (Órbigo 46) and lower (Órbigo 49d) parts of the basin (Figure 3).
Figure 7.
Monthly average values of the WEI+ (a) and monthly values of the WEI+ in 2001 (b) in three river stretches in the upper (Órbigo 43a), middle (Órbigo 46) and lower (Órbigo 49d) parts of the basin (Figure 3).

Figure 8.
WEI+ values for each environmental flow scenario along the two river paths indicated in Figure 1.
Figure 8.
WEI+ values for each environmental flow scenario along the two river paths indicated in Figure 1.

Figure 9.
Variation of the WEI+ induced by environmental flow scenarios along the two river paths indicated in Figure 1.
Figure 9.
Variation of the WEI+ induced by environmental flow scenarios along the two river paths indicated in Figure 1.

Figure 10.
WEI+, available water (WEI+ denominator) and consumed water (WEI+ numerator) for each environmental flow scenario in three river stretches in the upper (Órbigo 43a), middle (Órbigo 46) and lower (Órbigo 49d) parts of the basin (Figure 3).
Figure 10.
WEI+, available water (WEI+ denominator) and consumed water (WEI+ numerator) for each environmental flow scenario in three river stretches in the upper (Órbigo 43a), middle (Órbigo 46) and lower (Órbigo 49d) parts of the basin (Figure 3).

Figure 11.
Variation of the WEI+, available water (WEI+ denominator) and consumed water (WEI+ numerator) induced by environmental flow scenarios in three river stretches in the upper (Órbigo 43a), middle (Órbigo 46) and lower (Órbigo 49d) parts of the basin (Figure 3).
Figure 11.
Variation of the WEI+, available water (WEI+ denominator) and consumed water (WEI+ numerator) induced by environmental flow scenarios in three river stretches in the upper (Órbigo 43a), middle (Órbigo 46) and lower (Órbigo 49d) parts of the basin (Figure 3).

Publisher’s Note: MDPI stays neutral with regard to jurisdictional claims in published maps and institutional affiliations. |
© 2022 by the authors. Licensee MDPI, Basel, Switzerland. This article is an open access article distributed under the terms and conditions of the Creative Commons Attribution (CC BY) license (https://creativecommons.org/licenses/by/4.0/).
Share and Cite
MDPI and ACS Style
Pardo-Loaiza, J.; Bergillos, R.J.; Solera, A.; Paredes-Arquiola, J.; Andreu, J. The Role of Environmental Flows in the Spatial Variation of the Water Exploitation Index. Water 2022, 14, 2938. https://doi.org/10.3390/w14192938
AMA Style
Pardo-Loaiza J, Bergillos RJ, Solera A, Paredes-Arquiola J, Andreu J. The Role of Environmental Flows in the Spatial Variation of the Water Exploitation Index. Water. 2022; 14(19):2938. https://doi.org/10.3390/w14192938
Chicago/Turabian StylePardo-Loaiza, Jesús, Rafael J. Bergillos, Abel Solera, Javier Paredes-Arquiola, and Joaquín Andreu. 2022. "The Role of Environmental Flows in the Spatial Variation of the Water Exploitation Index" Water 14, no. 19: 2938. https://doi.org/10.3390/w14192938
Note that from the first issue of 2016, this journal uses article numbers instead of page numbers. See further details here.