Article

Adsorption of Pesticides Using Wood-Derived Biochar and Granular Activated Carbon in a Fixed-Bed Column System

1
Department of Environmental Sciences, University of Peshawar, Peshawar 25120, Pakistan
2
Department of Environmental Sciences, Kohat University of Science and Technology, Kohat 26000, Pakistan
3
Department of Medical Laboratory Technology, Riphah International University, Islamabad 45320, Pakistan
4
Department of Chemical and Life Sciences, Qurtuba University of Science and Information Technology, Peshawar 25120, Pakistan
5
State Key Laboratory of Desert and Oasis Ecology, Xinjiang Institute of Ecology and Geography, Chinese Academy of Sciences, Urumqi 830011, China
6
Unit of Bee Research and Honey Production, Biology Department Faculty of Science, King Khalid University, P.O. Box 9004, Abha 61413, Saudi Arabia
7
Research Center for Advanced Materials Science (RCAMS), King Khalid University, P.O. Box 9004, Abha 61413, Saudi Arabia
8
Biology Department, Faculty of Science, King Khalid University, Abha 9004, Saudi Arabia
9
Department of Biological Sciences, Faculty of Science, King Abdulaziz University, Jeddah 21589, Saudi Arabia
10
Department of Biology, College of Science, Imam Abdulrahman Bin Faisal University, P.O. Box 1982, Dammam 31441, Saudi Arabia
11
Department of Botany, Bacha Khan University, Charsadda 24420, Pakistan
*
Authors to whom correspondence should be addressed.
Water 2022, 14(19), 2937; https://doi.org/10.3390/w14192937
Submission received: 23 June 2022 / Revised: 4 August 2022 / Accepted: 17 August 2022 / Published: 20 September 2022

Abstract

:
Pesticides have great potential to contaminate resources of drinking water by percolating and leaching, when applied in the agriculture sector as well as in domestic region. Activated carbon (AC) and Biochar (BCH) were used for adsorption in a fixed-bed column system. Both of the adsorbent-packed columns indicated an increase in the breakthrough time for atrazine from 3350 to 5800 min and 3200 to 5700 min, chlorothalanil 3200–5600 min and 3150–5550 min, β-endosulfan 3050–5400 min and 2950–5400 min, and α-endosulfan 2900–5200 min and 2850–5200 min with bed heights from 10 cm to 15 cm, respectively. Similarly, when flow rate increased from 0.5 to 1.5 mL min−1 and contaminant concentration from 50–100 µg L−1, it resulted in a decrease in exhaust time. The models of Yoon–Nelson (R2 = 0.9427) and Thomas (R2 = 0.9921) describe the process of adsorption to be best well-under optimal conditions. Both the adsorbents would be efficiently utilized as the best adsorbents to remediate pesticide-contaminated water under optimal conditions. Pesticides adsorption onto adsorbents followed the order of atrazine > chlorothalanil > β-endosulfan > α-endosulfan.

1. Introduction

Pesticides have a significant role throughout the world in the field of food production and farming [1]. Pesticides are a substance utilized to deter, eradicate, kill, or diminish pests; to regulate the growth of plant [2]; and to prevent loss to yield of crops [3]. After application of pesticides, rainfall or irrigation water carries pesticides residues to the nearby surface and ground water bodies through runoff or percolation [4,5], contaminating water resources and consequently deteriorating drinking water quality [6]. Due to their non-biodegradable, carcinogenic, persistent, and toxic nature [7], pesticides have undesirable impacts on the ecosystem and human health [8]. Atrazine (C8H14ClN5) is an odorless, flammable, and reactive chemical with a melting point of 175 °C that easily dissolves in water. Chlorothalonil (C8Cl4N2), a fungicide, is grayish in color, has a slightly pungent odor, is soluble in water at room temperature at a level of 0.6 mg L−1, and has a melting point of 251 °C. α-endosulfan (C9H6Cl6O3S) is a toxic brown crystalline solid with a pungent odor used as an herbicide and fungicide. β-endosulfan is used as an insecticide; it has a melting point of 210 °C and is soluble in water at 22 °C [9]. Chronic exposure to these pesticides causes cardiovascular problems, muscle and retinal degenerations, and cancer in humans [10]. Hence, removal of pesticides from water is a major concern to sustain human health and preserve the natural environment. Various methods are in use for pesticide remediation in water, for example, advanced oxidation [11], ion-exchange [12], membrane technology [13], Fenton’s reaction [14], adsorption [15], chlorination [16], and biological treatments [17]. The most popular method applied for pesticides removal from water is adsorption through carbonaceous materials [18,19]. A variety of carbonaceous materials have been used as an adsorbents such as powdered activated carbon (PAC) [20], granular activated carbon (GAC) [21,22], activated carbon composites [23], coconut shell [24,25], corn stillage [26], date stone [27,28], and green waste [29,30]. Adsorption of pesticides in a fixed-bed column system is inexpensive, feasible, rapid, influential, and unique and could be applied to treat huge volumes of contaminated water [5]. These methods are simple and have high efficiency for removal of organic pollutants [31]. Moreover, this method has the capability to be upgraded from a laboratory level setting to industrial level setting [32,33,34]. AC pore surface areas, surface chemistry, pore volume, and the chemical activity prevailing on these surfaces regulate its adsorption capability [35]. The interaction of adsorbent with adsorbate is highly dependent on its chemical structure, while the chemical reactions occurring with other molecules are determined by its active sites. Likewise, biochar can be utilized for removal of organic contaminants from contaminated water [36]. Enhanced surface functional groups are the biochar’s exceptional properties that make it a better adsorbent, in comparison with other adsorbents, for the reduction of organic pollutants (pesticides) from water [18,37]. Its usefulness is also confirmed by the availability of its feed stock at low cost in abundance, derived from solid waste, remains of wood carbs, and agriculture biomass [38]. No previous column adsorption study on AC and BCH has been recorded for the pesticides in reference, which shows the significance and novelty of the current research study.

2. Materials and Methods

2.1. Chemicals and Reagents

Atrazine (58% purity), chlorothalanil (33% purity), β-endosulfan, and α-endosulfan (47% purity), were purchased from local market manufactured by FMC United (pvt.) Ltd. and were utilized as adsorbates. Stock solutions of 1000 µg L−1 of all the four pesticides were prepared in deionized water, from which further 12 µg L−1 working solutions were prepared, composed of all the four pesticides to be used in the column experiment. Diluted HCl and NaOH (Riedel-de-Haen, Seelze, Germany) was utilized to regulate the pH, and buffer solutions of pH—3, 5, 7, 9, and 11 were prepared and used to maintain the specific pH of the solution. Hard wood (Dalbergia sissoo) was used to prepare BCH in a dry muffle furnace (Shanghai Haoyue Technology Co., Ltd., Shanghai, China) through the process of pyrolysis. The furnace temperature was programmed to rise slowly at a rate of 2 °C min−1 until the desired temperature of 500 °C was achieved (selected as a typical mid-level pyrolysis temperature) for 6 h under a very low continuous flow of nitrogen at a rate of 150 to 200 cm−3 min−1. Once the desired temperature was obtained, the flow of nitrogen was stopped [39]. AC applied in the study was purchased from Norit Nederland BV Amersfoort. All chemicals used in the study such as n-hexane, dichloromethane, NaOH, HCl, and Na₂SO₄ (Riedel-de-Haen) were analytical grade. Prior to each experiment, all the glassware were washed with dichloromethane and deionized water was used for washing repeatedly.

2.2. Equipments

For pH measurements, a pH meter-1120—manufactured by Mettler-Toledo GmbH Process, Postfach, 8902 Urdorf, Switzerland—was used. Gas chromatographic mass spectrophotometry (GC–MS Shimadzu, 2010, Kyoto, Japan) was used for determination of pesticides. The analysis of FTIR (IR model Shimadzu 8201, Kyoto, Japan) and X-Ray diffractometry XRD model JDX-3532 were used to examine spectral characteristics of AC and BCH. Surface morphology was investigated by the help of scanning electron microscopy (SEM) model JSM 5910 JEOL, Tokyo, Japan.

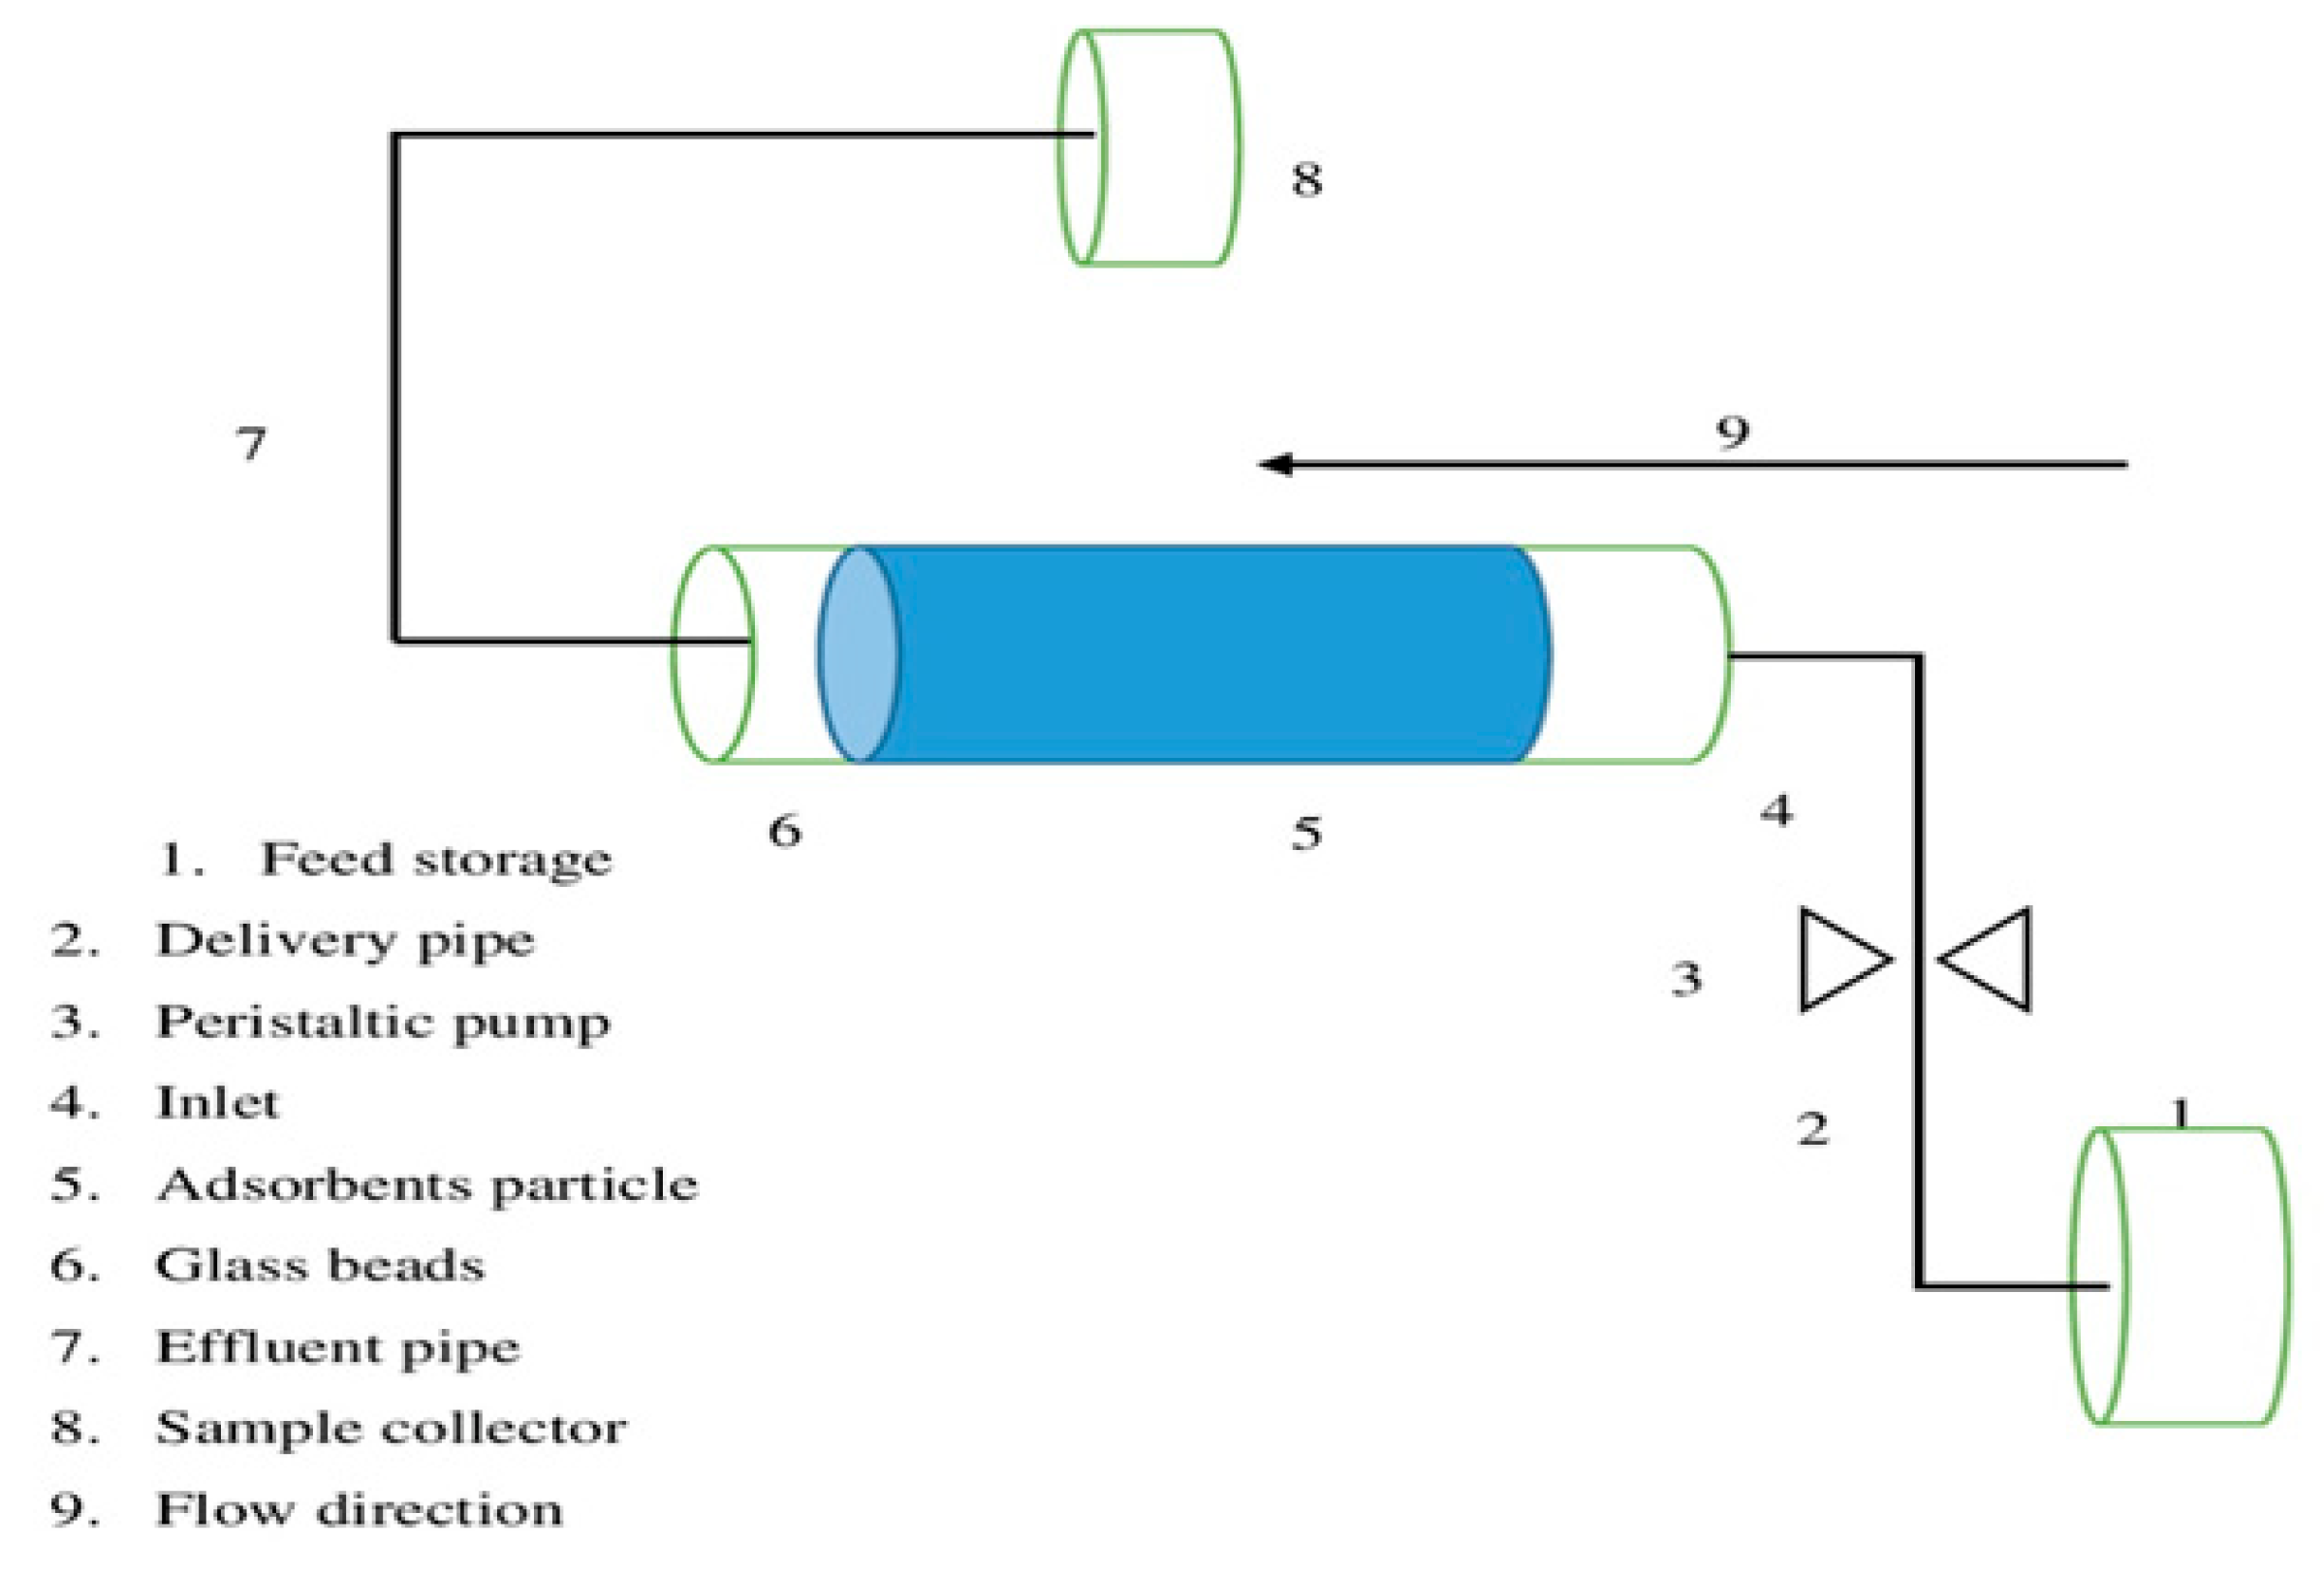
2.3. Fixed-Bed Column Experiment

The experiment of fixed-bed column was performed in a 2.8 cm-diameter, 40 cm-height glass column for the determination of AC and BCH dynamic adsorption characteristics, for removal of pesticides. The experimental fixed-bed column graphical diagram is presented in Figure 1. The experimental setup includes teflon tubing, feed storage, glass column, peristaltic pump, and a sample collector. In the entire experiment, the glass column was packed with each adsorbent bulk volume and about 2 cm (height) of glass beads. For uniform flow and effluent blockage prevention, glass wool small volume was added at the lower and upper ends of the glass column. During performance of all tests, a stable room temperature of (25 ± 2 °C) was maintained. The impact of flow rate (0.5, 1, 1.5 mL min−1), bed height (10, 15 cm), and influent initial concentrations (50, 75 µg L−1) were examined on the process of adsorption by the breakthrough curves (C/Ci changes versus time, where Ci and C represent the influent and effluent concentrations of the aqueous solution, respectively [40,41]. The adsorption capacity for pesticides uptake, represented as qe (mg/g), was determined through the following equation:
qe = (Ci − Cf) V/W
where
  • Ci = initial pesticides’ concentration (µg L−1),
  • Cf = final pesticides’ concentration (µg L−1),
  • V = volume of the solution, and
  • W = weight of the adsorbent (g).
Experiments were repeated three times and the average values of the obtained data were recorded.

2.4. Thomas Model

The most frequently applied Thomas model is used for the prediction of breakthrough curve and determination of column adsorption efficiency. Value of the adsorbent maximum adsorption capacity is significant to design adsorption column, and for assessment of adsorbent adsorption capacity. Thomas’ model has been used in a continuous column study. This model is suitable where the rate limiting steps for adsorption are not dependent on internal and external diffusion [42]. Following is the general expression of the model:
ln ci cf 1 = kTh q 0 W Q kThCf t
whereas, at time (t), Cf is the effluent pesticides concentration (µg L−1) and Ci is the influent pesticides concentration (µg L−1). Thomas’ model rate constant is represented by kTh (L min−1 mg−1) and the adsorbent’s adsorption capacity by q0 (mg g−1), while (t) expresses the total time of flow (min). Quantity of adsorbent packed in a column is represented by W (g) and rate of flow by Q (ml min−1). The values of kTh and q0 can be attained by plotting the graph amongst ln [(Ci/Cf) − 1] and (t).

2.5. Yoon–Nelson Model

Yoon–Nelson is the simplest model, which describes that the molecule of adsorbate reduction rate possibility is directly proportional to the possibility of adsorbate breakthrough and adsorption onto the adsorbents [43,44,45]. The model general equation is as follows:
ln C f C i C f = K YN t τ K YN
where KYN stands for Yoon–Nelson rate constant (min−1). Required time (min) for 50% breakthrough of pesticides is represented by τ; t represents processing time in (min). Values of KYN and τ are obtained by plotting (Ct/ (Ci Cf) vs. (t) to determine the plot slope and intercept.

2.6. Analytical Method

2.6.1. Extraction of Pesticides

The obtained filtrates were extracted by liquid–liquid extraction method [46]. Briefly, in a conical flask, 40 mL of filtrate, 12 mL of solvent n-hexane, and 4 g of NaCl were taken and shaken at 80 rpm for 1 h in a horizontal shaker (Bremen, POB 105363, Bremen, Germany). Few drops of phosphate buffer were added to adjust pH to 7 and, if necessary, diluted HCl or NaOH would also be added. The filtrate was collected in a separatory funnel and was held until the creation of two distinctive layers. The n-hexane layer was collected as a filtrate and was washed two times by addition of 2.4 mL n-hexane solvent. To remove water particles from the separated layer, sodium sulphate (Na2SO4) was added. Once the contents were separated through separating funnel, it was evaporated at 25 °C on a rotary evaporator to reduce the volume to 1 mL. Reference material and sample blanks were also used to verify the precision and accuracy of the analysis and extraction processes.

2.6.2. GC–MS Chromatography

The saturated organic solvents were collected in 1-mL GC–MS vials and placed in GC–MS Agilent port for determination of the pesticides by gas chromatograph. A gas chromatograph mass spectrophotometer was used for analysis, equipped with a splitless mode injector system, a flame photometer detector, and a capillary glass column of 5 MS TRB with 30 m-length, an internal diameter of 0.25 mm, and stationary film thickness of 0.25 μm, manufactured from Phenomenex, which was used for pesticides determination. The temperature of the oven was held for 1 min at 50 °C; then, at 25 °C min−1 programmed to 125 °C; from 125 °C to 200 °C at interval rate of 10 °C min−1; from 200 to 270 °C at interval rate of 5 °C min−1; and at the end, held for 2 min. Samples of 1 μL under split mode (split ratio 10:1) were injected. The total time taken by one run of GC was 27.50 min. Following are the other operational conditions: Ultra-pure-helium was passed over trap of sieves of molecules trapping oxygen and further utilized as a carrier gas at 40 cm s−1 of stable linear velocity. The injection port temperature was 250 °C, utilized at a ratio of 10:1 in splitless mode. The detector temperature was held at 270 °C. The instrument of hydrogen generator was installed to supply hydrogen gas to the flame photometric detector (FPD) at a constant flow rate of 69.0 mL min−1.

2.7. Quality Control and Statistical Analysis

To ensure accuracy, standard solutions and reagent blanks were incorporated with each column. The results confirm that the glassware used in the experiment were contamination-free; the findings of standard solutions was also satisfactory (97–99%). Each set of experiments was conducted in triplicate and the average values of the findings were documented. At various pesticide concentrations, the absorbance of adsorbents were determined by providing a standard calibration curve. For preparation and presentation of graphs, the software Origin Pro 2019 was used.

3. Results and Discussion

3.1. Characterization of Adsorbent Material

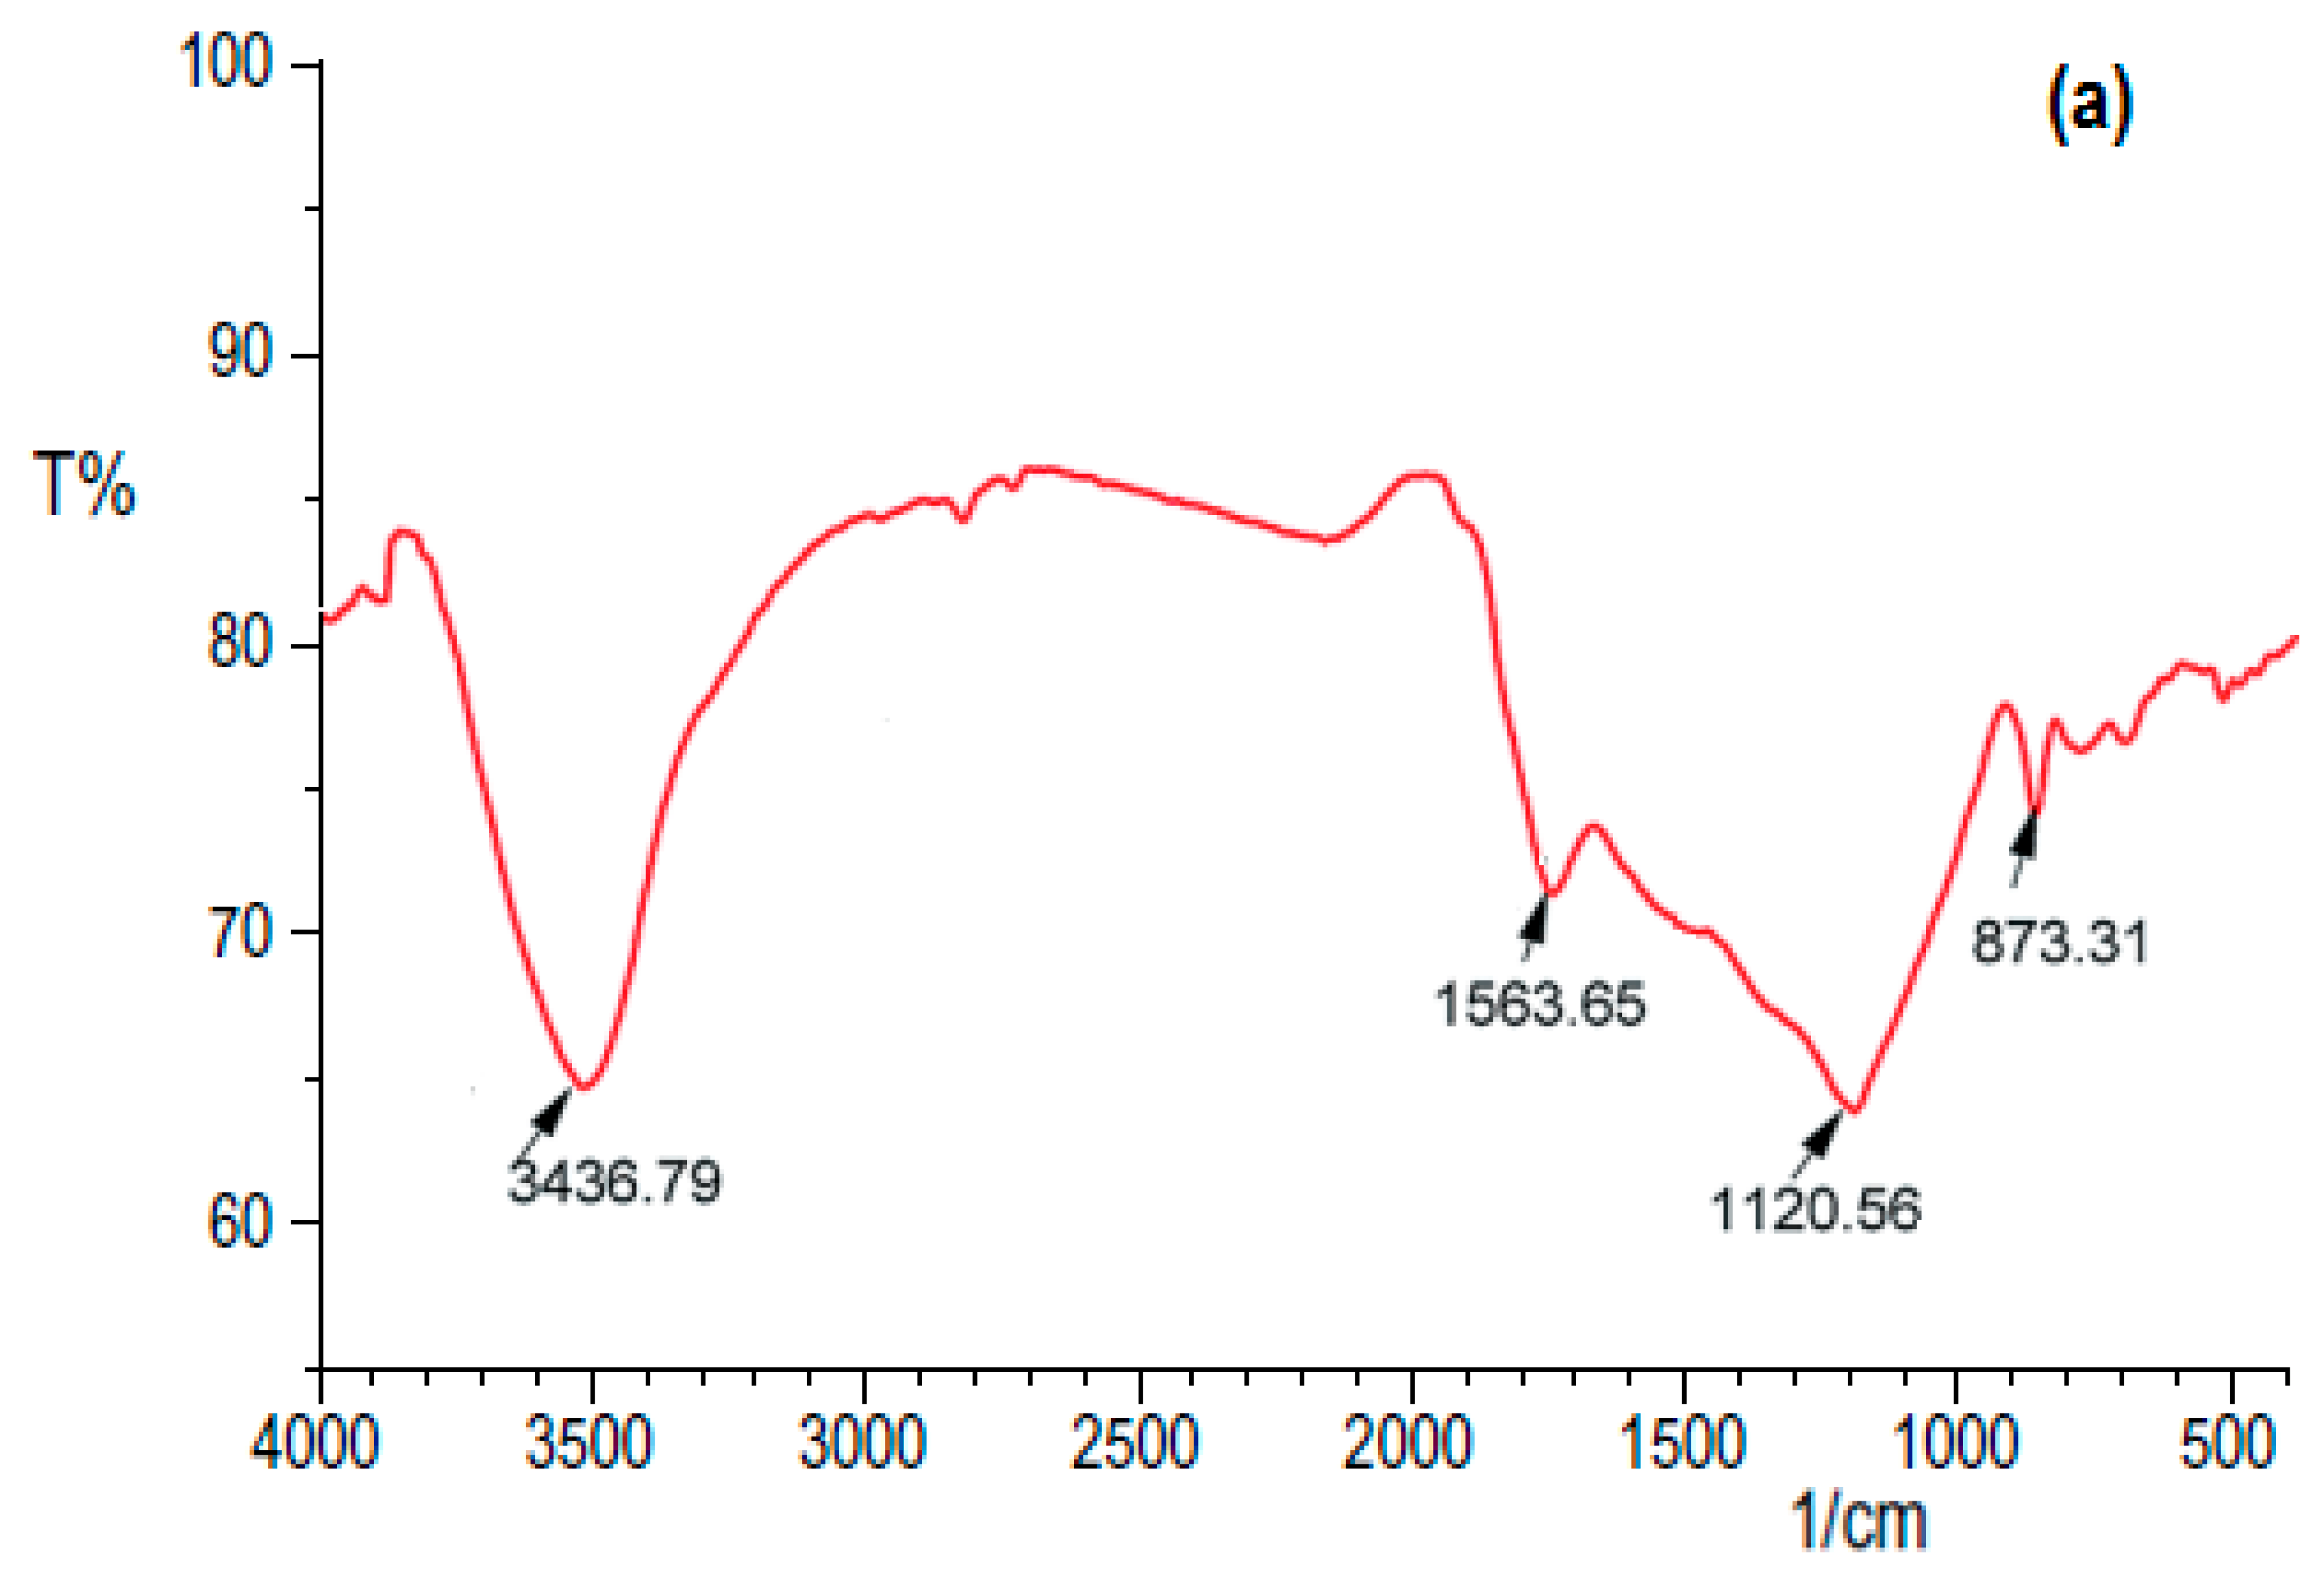
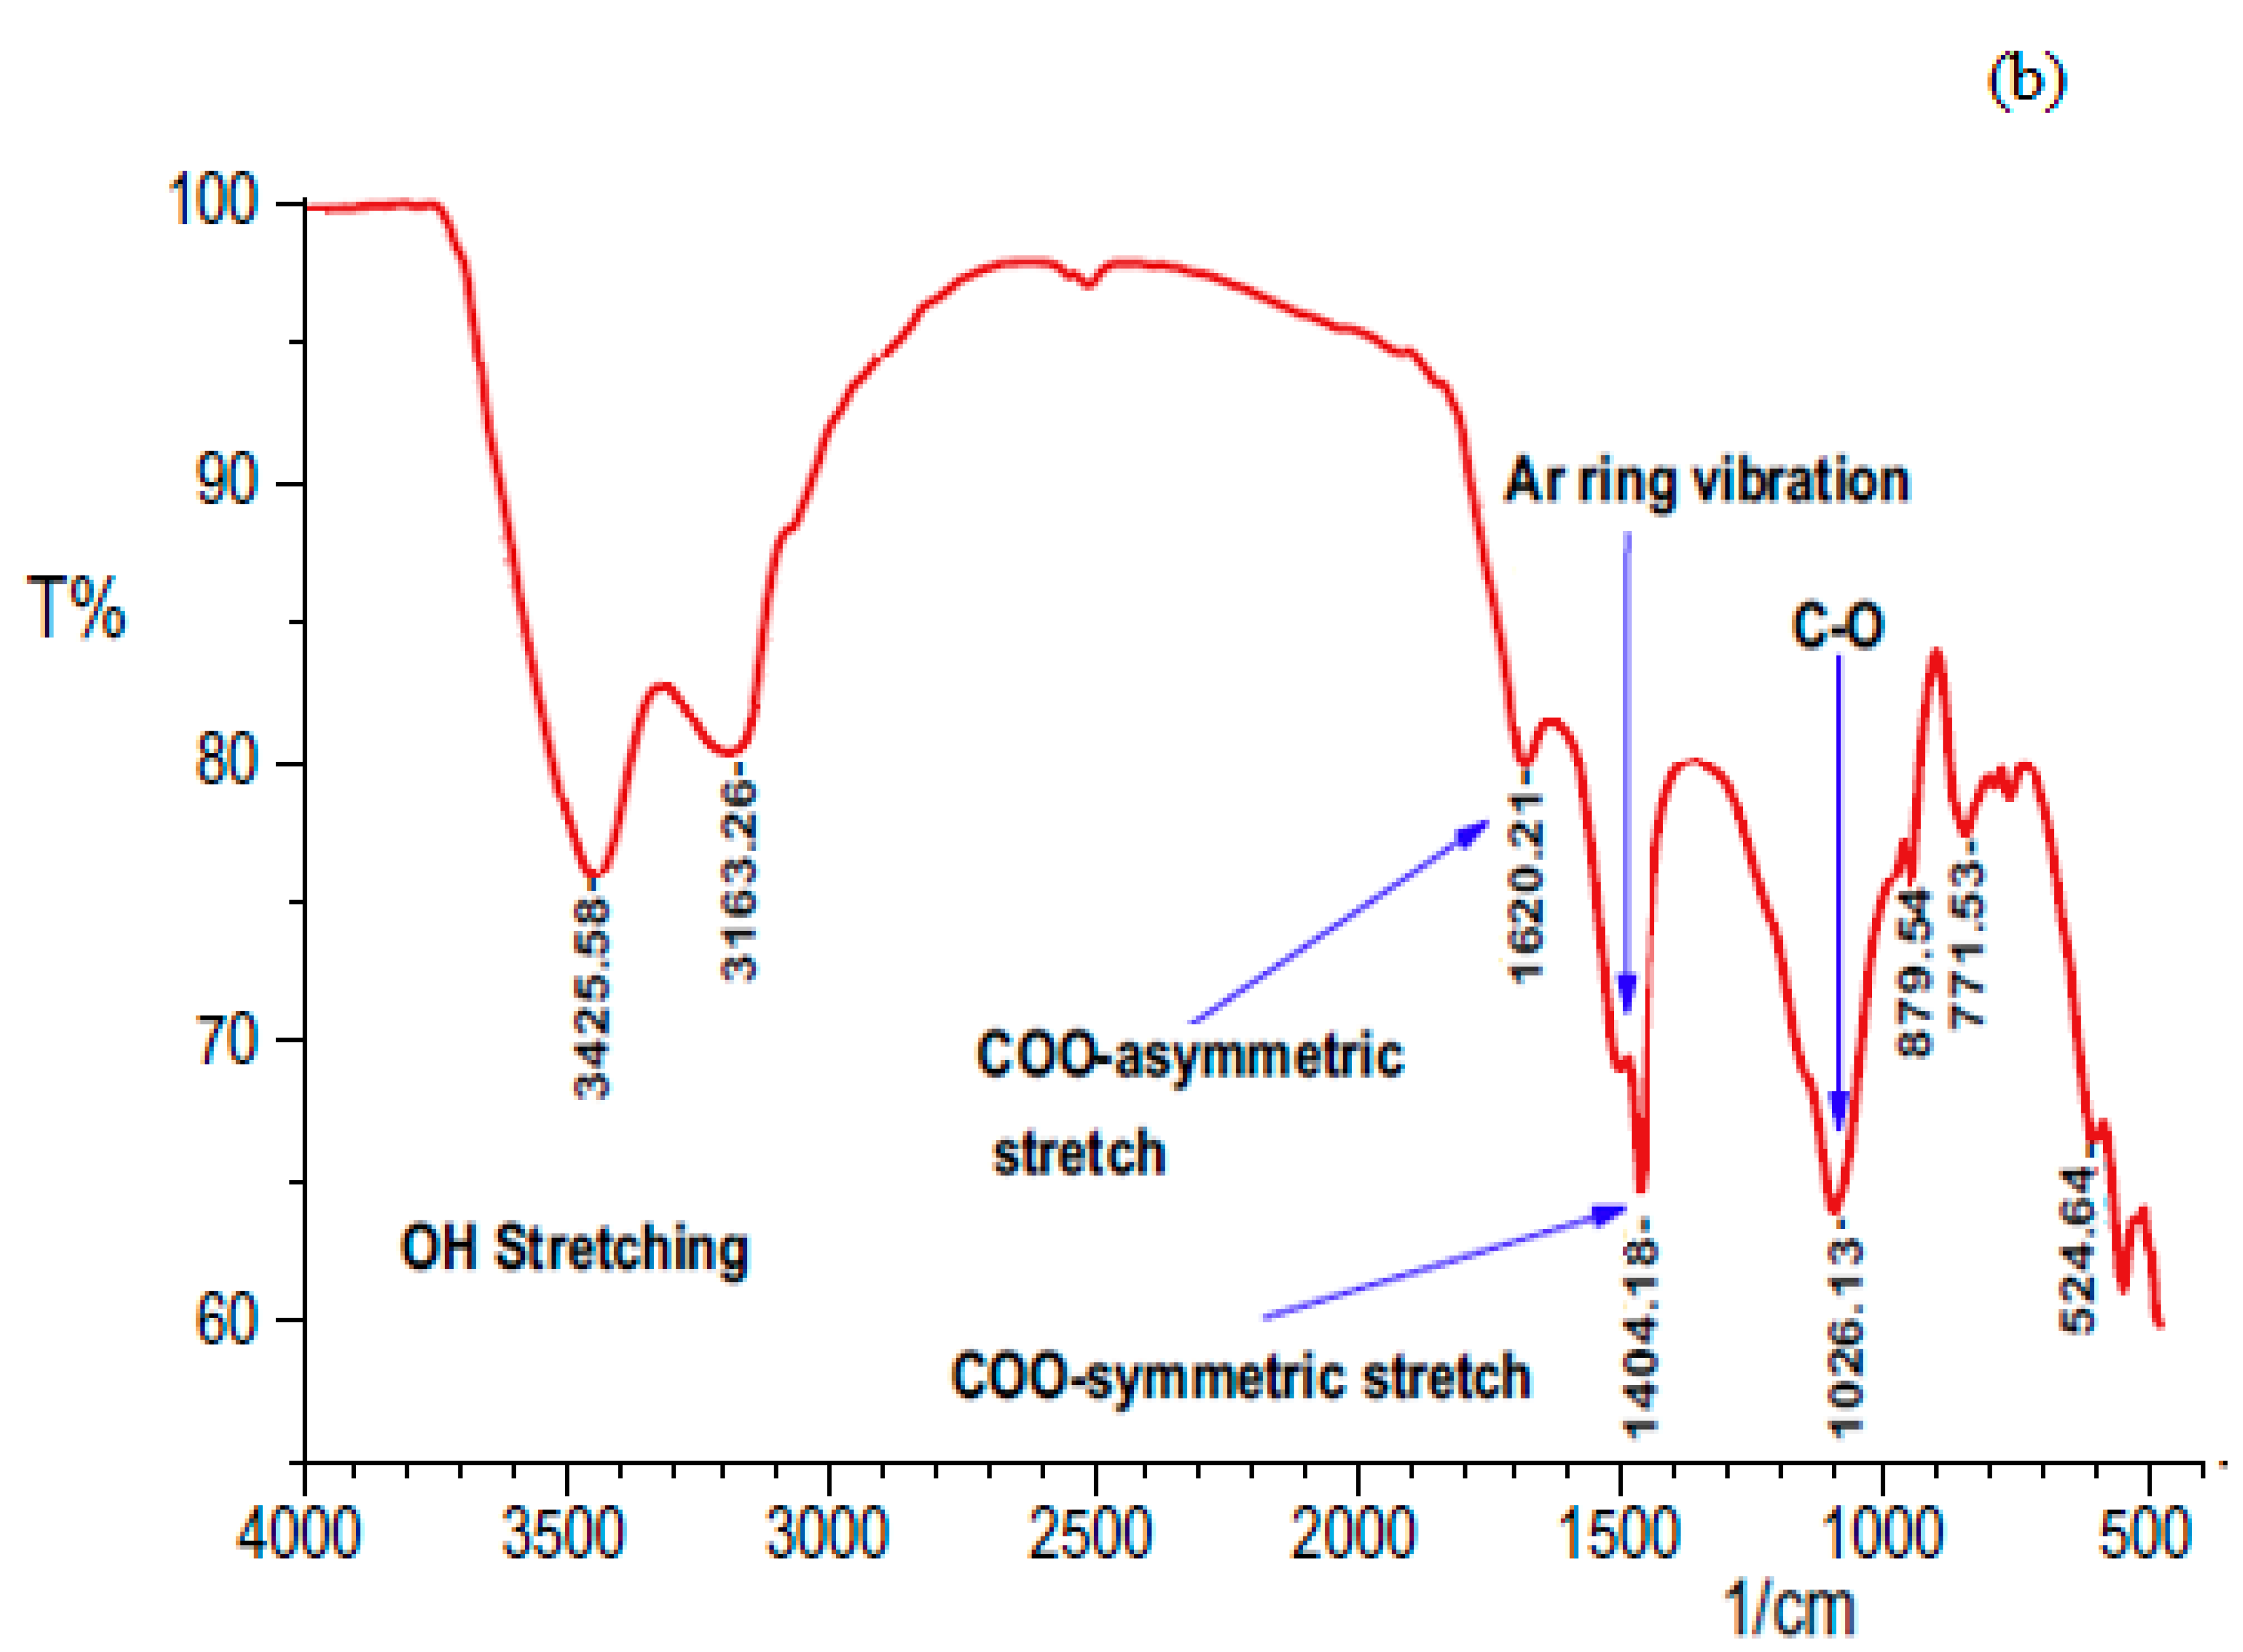
3.1.1. Fourier-Transform Infrared (FTIR) Spectroscopy

Figure 2 shows the spectra of FTIR for adsorbent AC and BCH. It was observed that each adsorbent material has a different surface functional group. Functional groups present in the surface area of adsorbent are overbearing to adsorption [47]. Peaks obtained on the spectra for AC adsorbent are 3436, 2930, 2860, 1583, and 1120 cm−1. The documented peaks at 3436 cm−1 showed stretching vibration of the O-H bond [48,49], while those at 2930 cm−1 and 2860 cm−1 were assigned to vibration of C-H stretching bond [50].
Adsorption peak at 1583 cm−1 was noted due to vibration of C=C bond stretching in the aromatic ring, while the absorption peak at 1120 cm−1 was attributed to the C-O bond-stretching vibration [48,51]. Additionally, activated carbon FTIR spectrum has a weak adsorption peak at 873 cm−1, which is attributed to C-H bond bending vibration in the aromatic ring replacement at a high degree level. The results showed that aromatic rings were formed due to the carbonization of AC, and in the produced aromatic ring, hydrogen contents were replaced due to 900 °C of activation temperature. The results obtained were in good agreement with the study performed by Puziy et al. [50], who studied AC FTIR spectrum synthesized from styrene-divinyl benzene at 1000 °C by activation through phosphoric acid. The presence of several coordinated carbonyl groups above the AC surface led to some sort of association [52]. Similarly, spectra of FTIR for BCH (Figure 2b) specifies correspondence between the OH stretching and broad bands at 3425.58 [53]. The stretching at COO symmetric and COO asymmetric shows correspondence of the broad band at 1620.21 and 1404.18, respectively, while correspondence to C-O presence on the surface of BCH is indicated by the peak obtained at 1026.12.

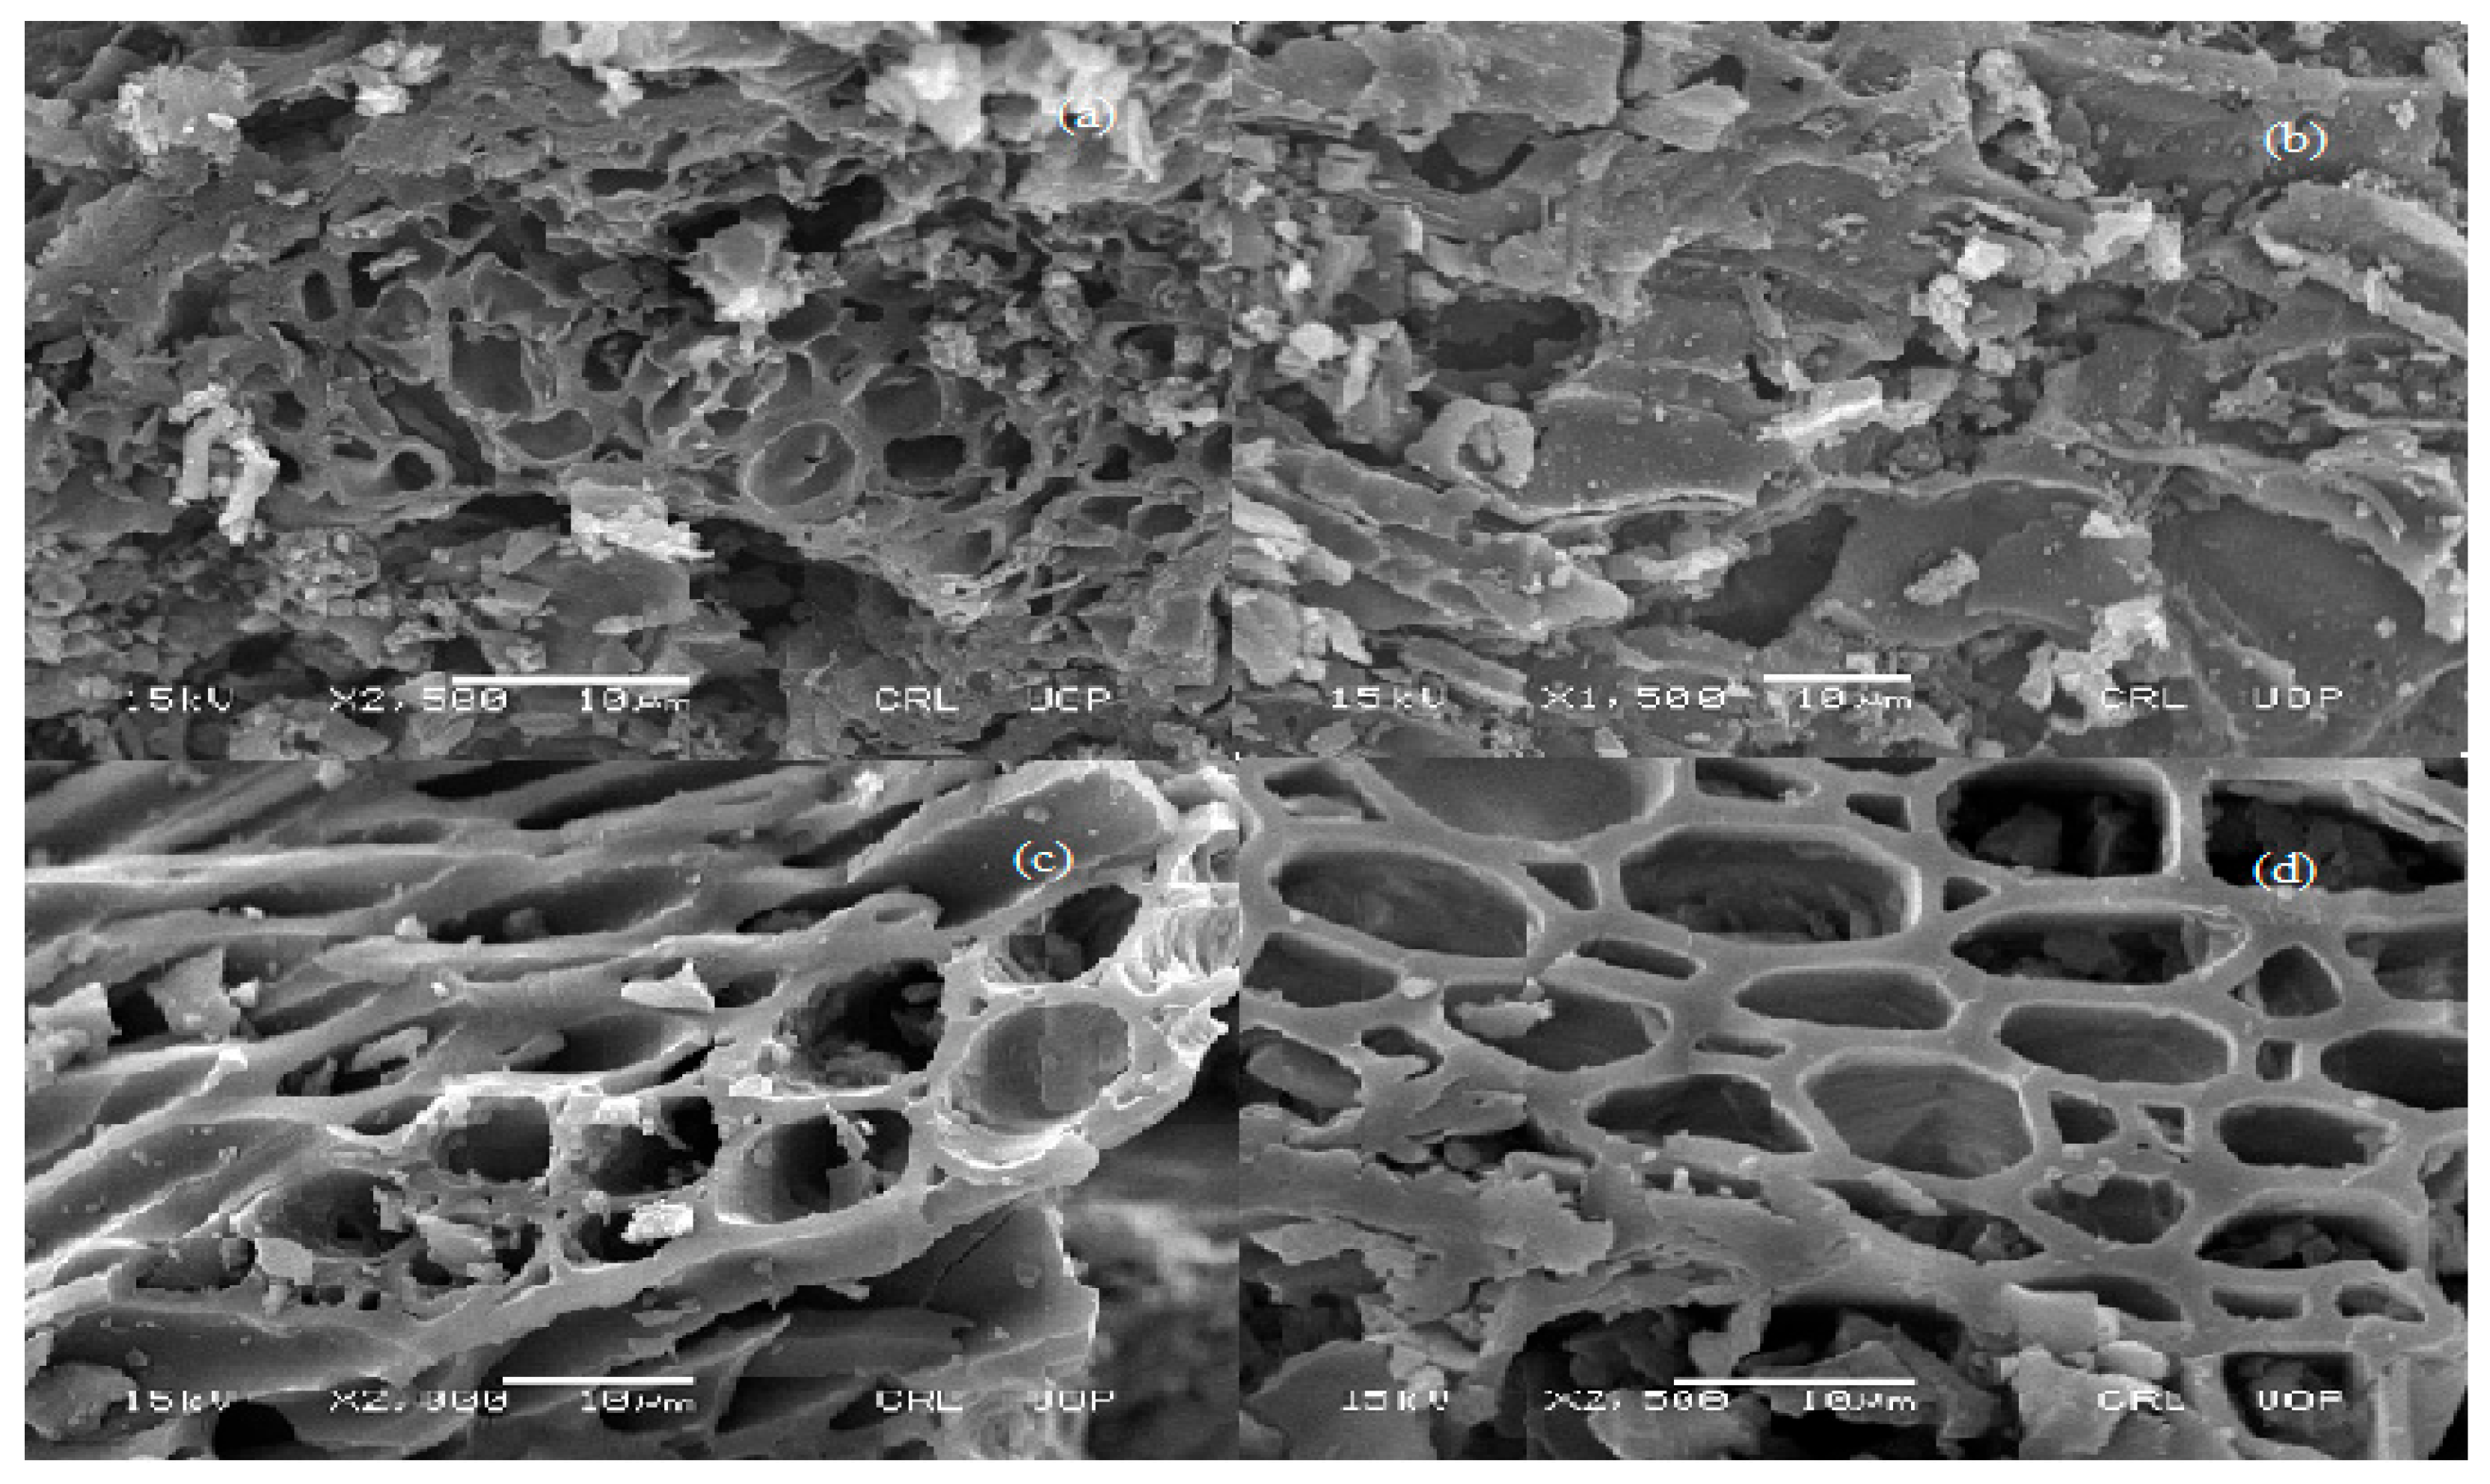
3.1.2. Scanning Electron Microscopy (SEM)

Analysis of the SEM was used to study the adsorbents’ physical and morphological characteristics, as shown in Figure 3. The obtained images show chromatographic-mass pores for BCH, indicating variation in the pore size and carbon flakes during the washing step of BCH manufacturing as compared with the commercially acquired carbon. Morphologically, BCH provides a larger surface area for adsorption, which can be witnessed by comparing pre- and post-adsorption images in multiple pattern deposition, indicating the deposition of pesticides on BCH following the phenomenon of adsorption. The images also show that during the adsorption process, the available pores were fully occupied. Similar results were also obtained for AC following the same patterns.

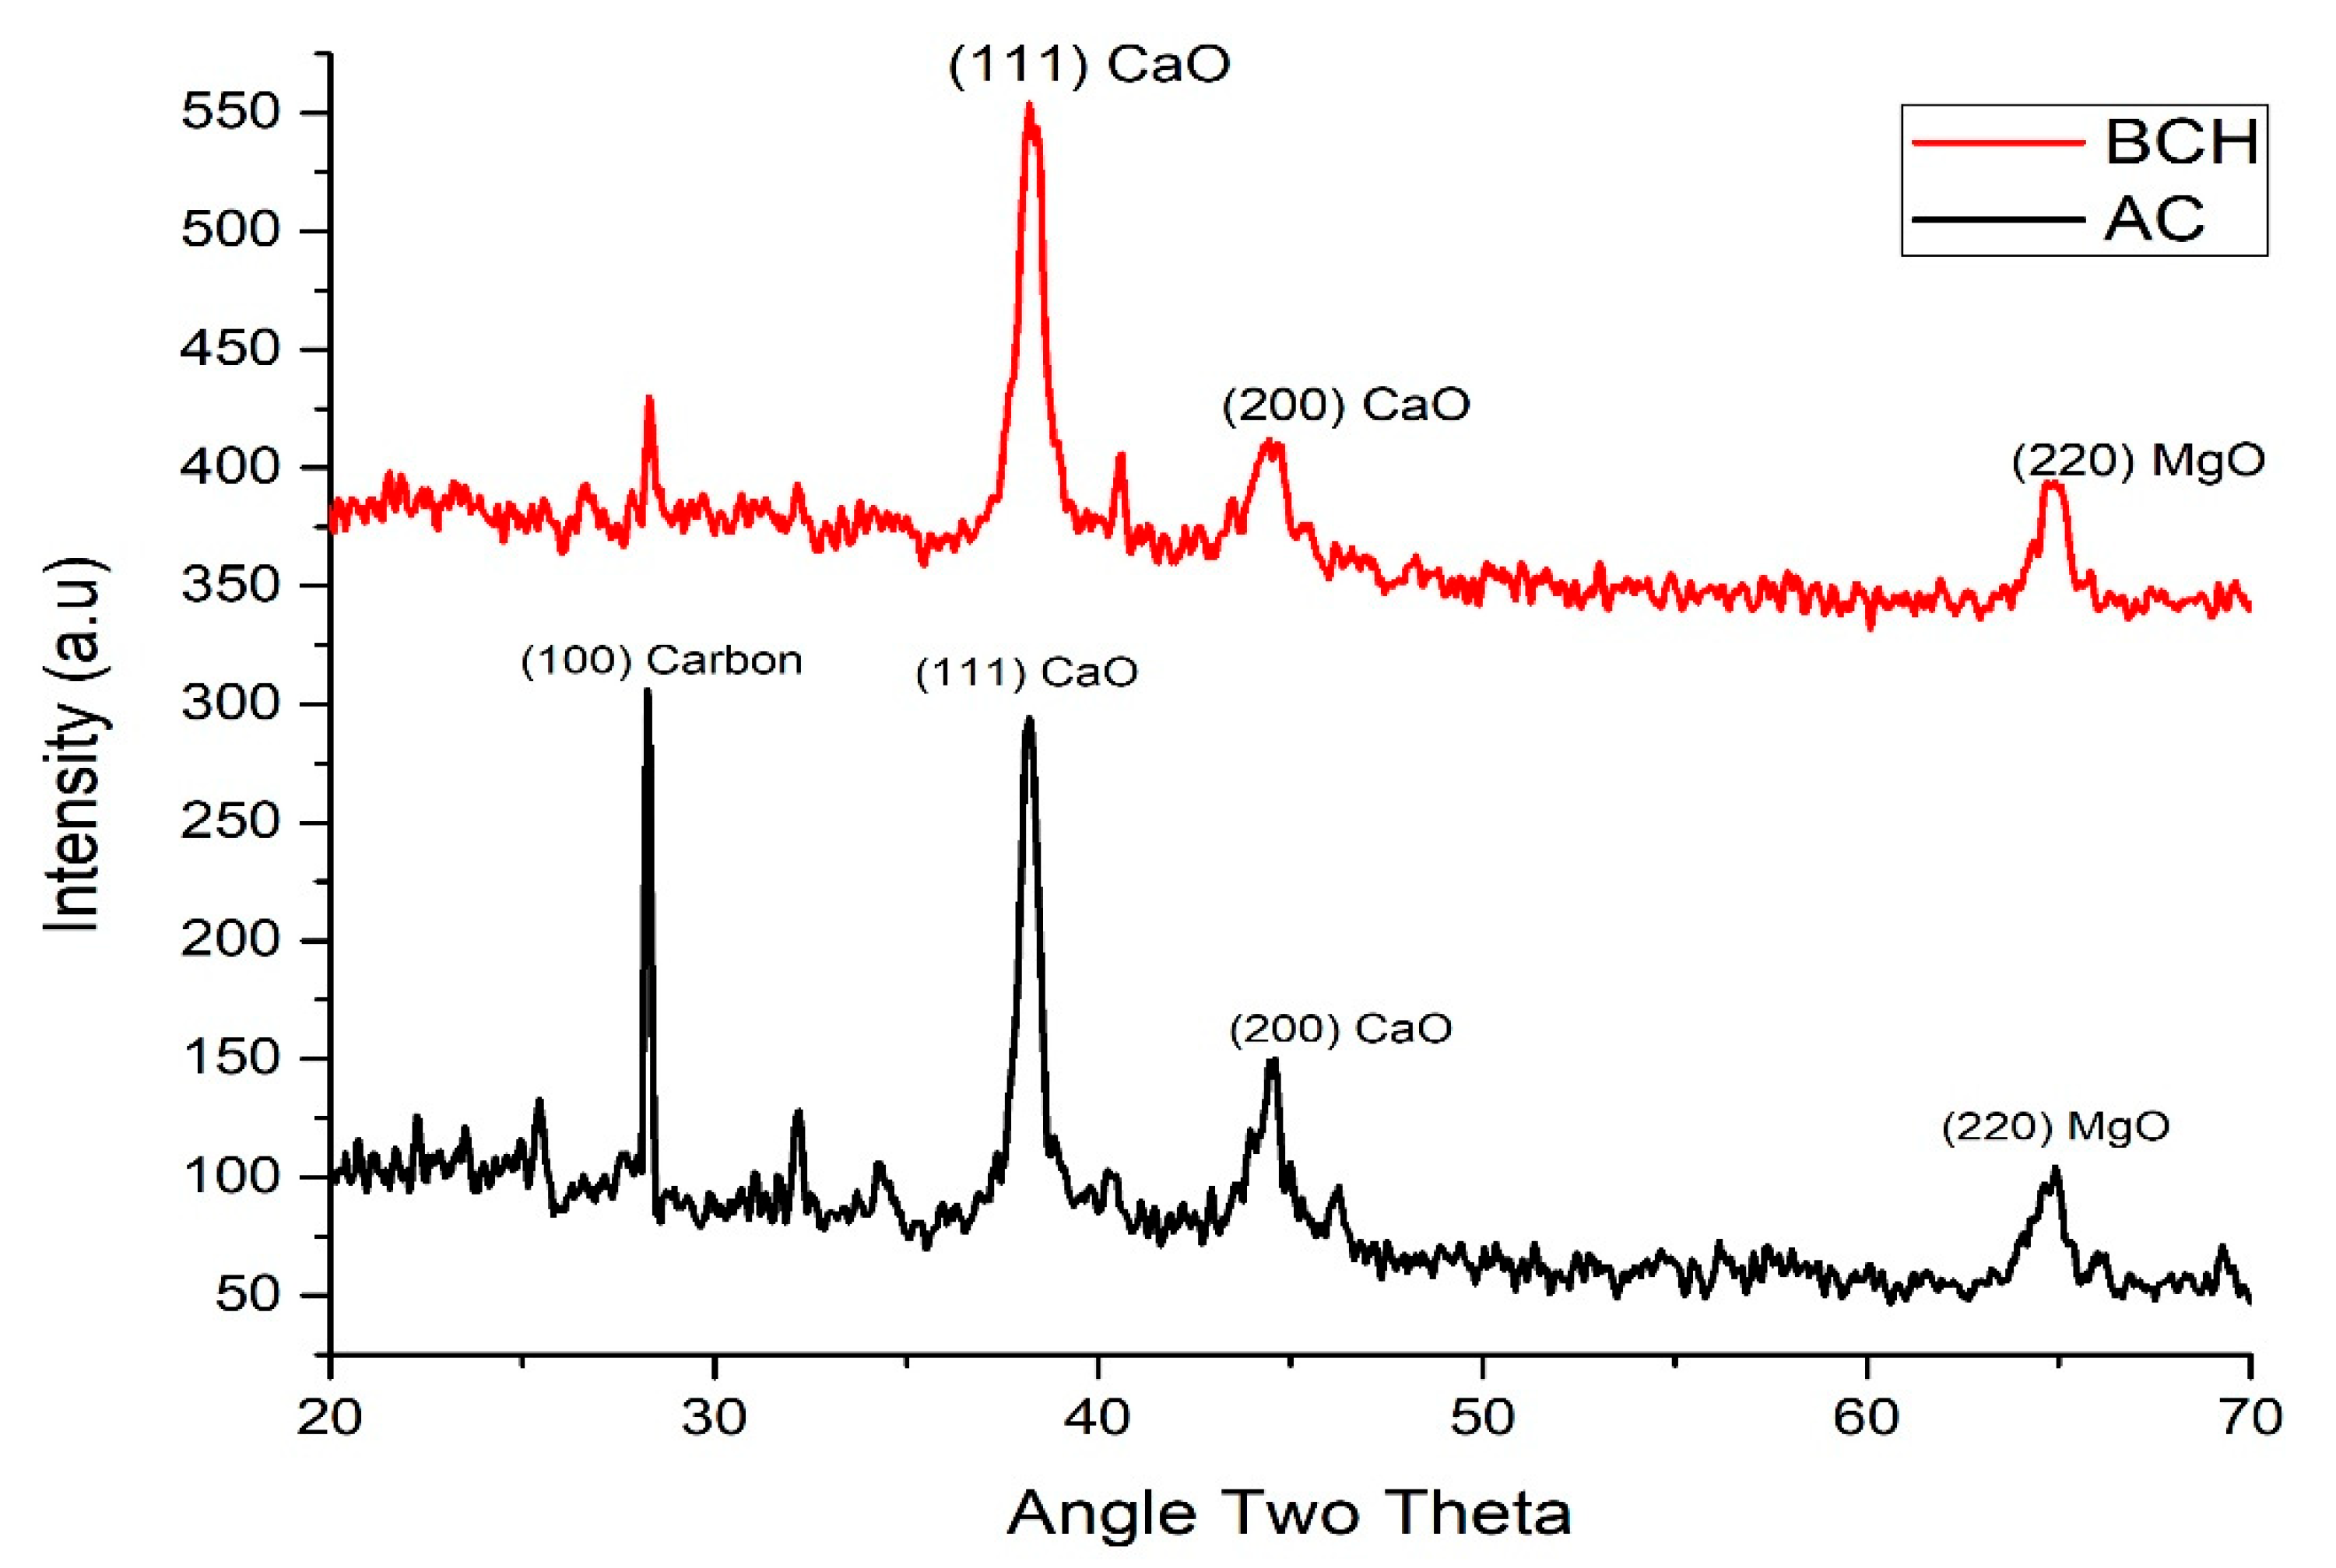
3.1.3. X-ray Diffraction (XRD)

XRD images for AC between 22° and 25° indicate the presence of unlabeled carbon broad peaks, while the sharp peaks at 29.3° (100) and 38.9° (111) were attributed to the presence of carbon and CaO, respectively, suggesting crystallinity of the compound [54]. The peaks at 45° (200) and 65° (220) were attributed to CaO and MgO, respectively. Due to the fine alignment of layers, sharp peaks were produced, suggesting an enhanced crystalline structure. AC amorphous structure was observed due to the absence of sharp peaks in the region of 45° to 64° and represents a useful property of a good adsorbent [55,56]. Likewise, for BCH, the obtained XRD pattern expressed peaks at 2θ = 30°–40°, referring to the stacking aromatic layer structure of 2 graphite [57]. The inorganic miscellaneous compounds were indicated by the unlabeled BCH peaks between 2θ = 45°–60°. Consistency, pervasiveness, and higher contents of CaO and MgO were observed at (111), (200), and (220) peaks, respectively. At 2θ = 36°, the sturdiest and most piercing peak represents CaO and the sharpness of the peaks indicates the crystal-clear nature of the originate. The heterogeneity of BCH surface was confirmed by the peaks at X-ray diffraction (Figure 4).

3.2. Column Adsorption Experiment

Absorption experiment of packed-bed column was conducted for pesticides removal using AC and BCH at various flow rates such as 0.5, 1, and 1.5 mL min−1; pesticides initial solution concentrations (i.e., 50 and 75 µg L−1); and different bed heights (10 and 15 cm), taken in adsorption glass column of a specific length of (40 cm) having 2.8 cm-diameter.

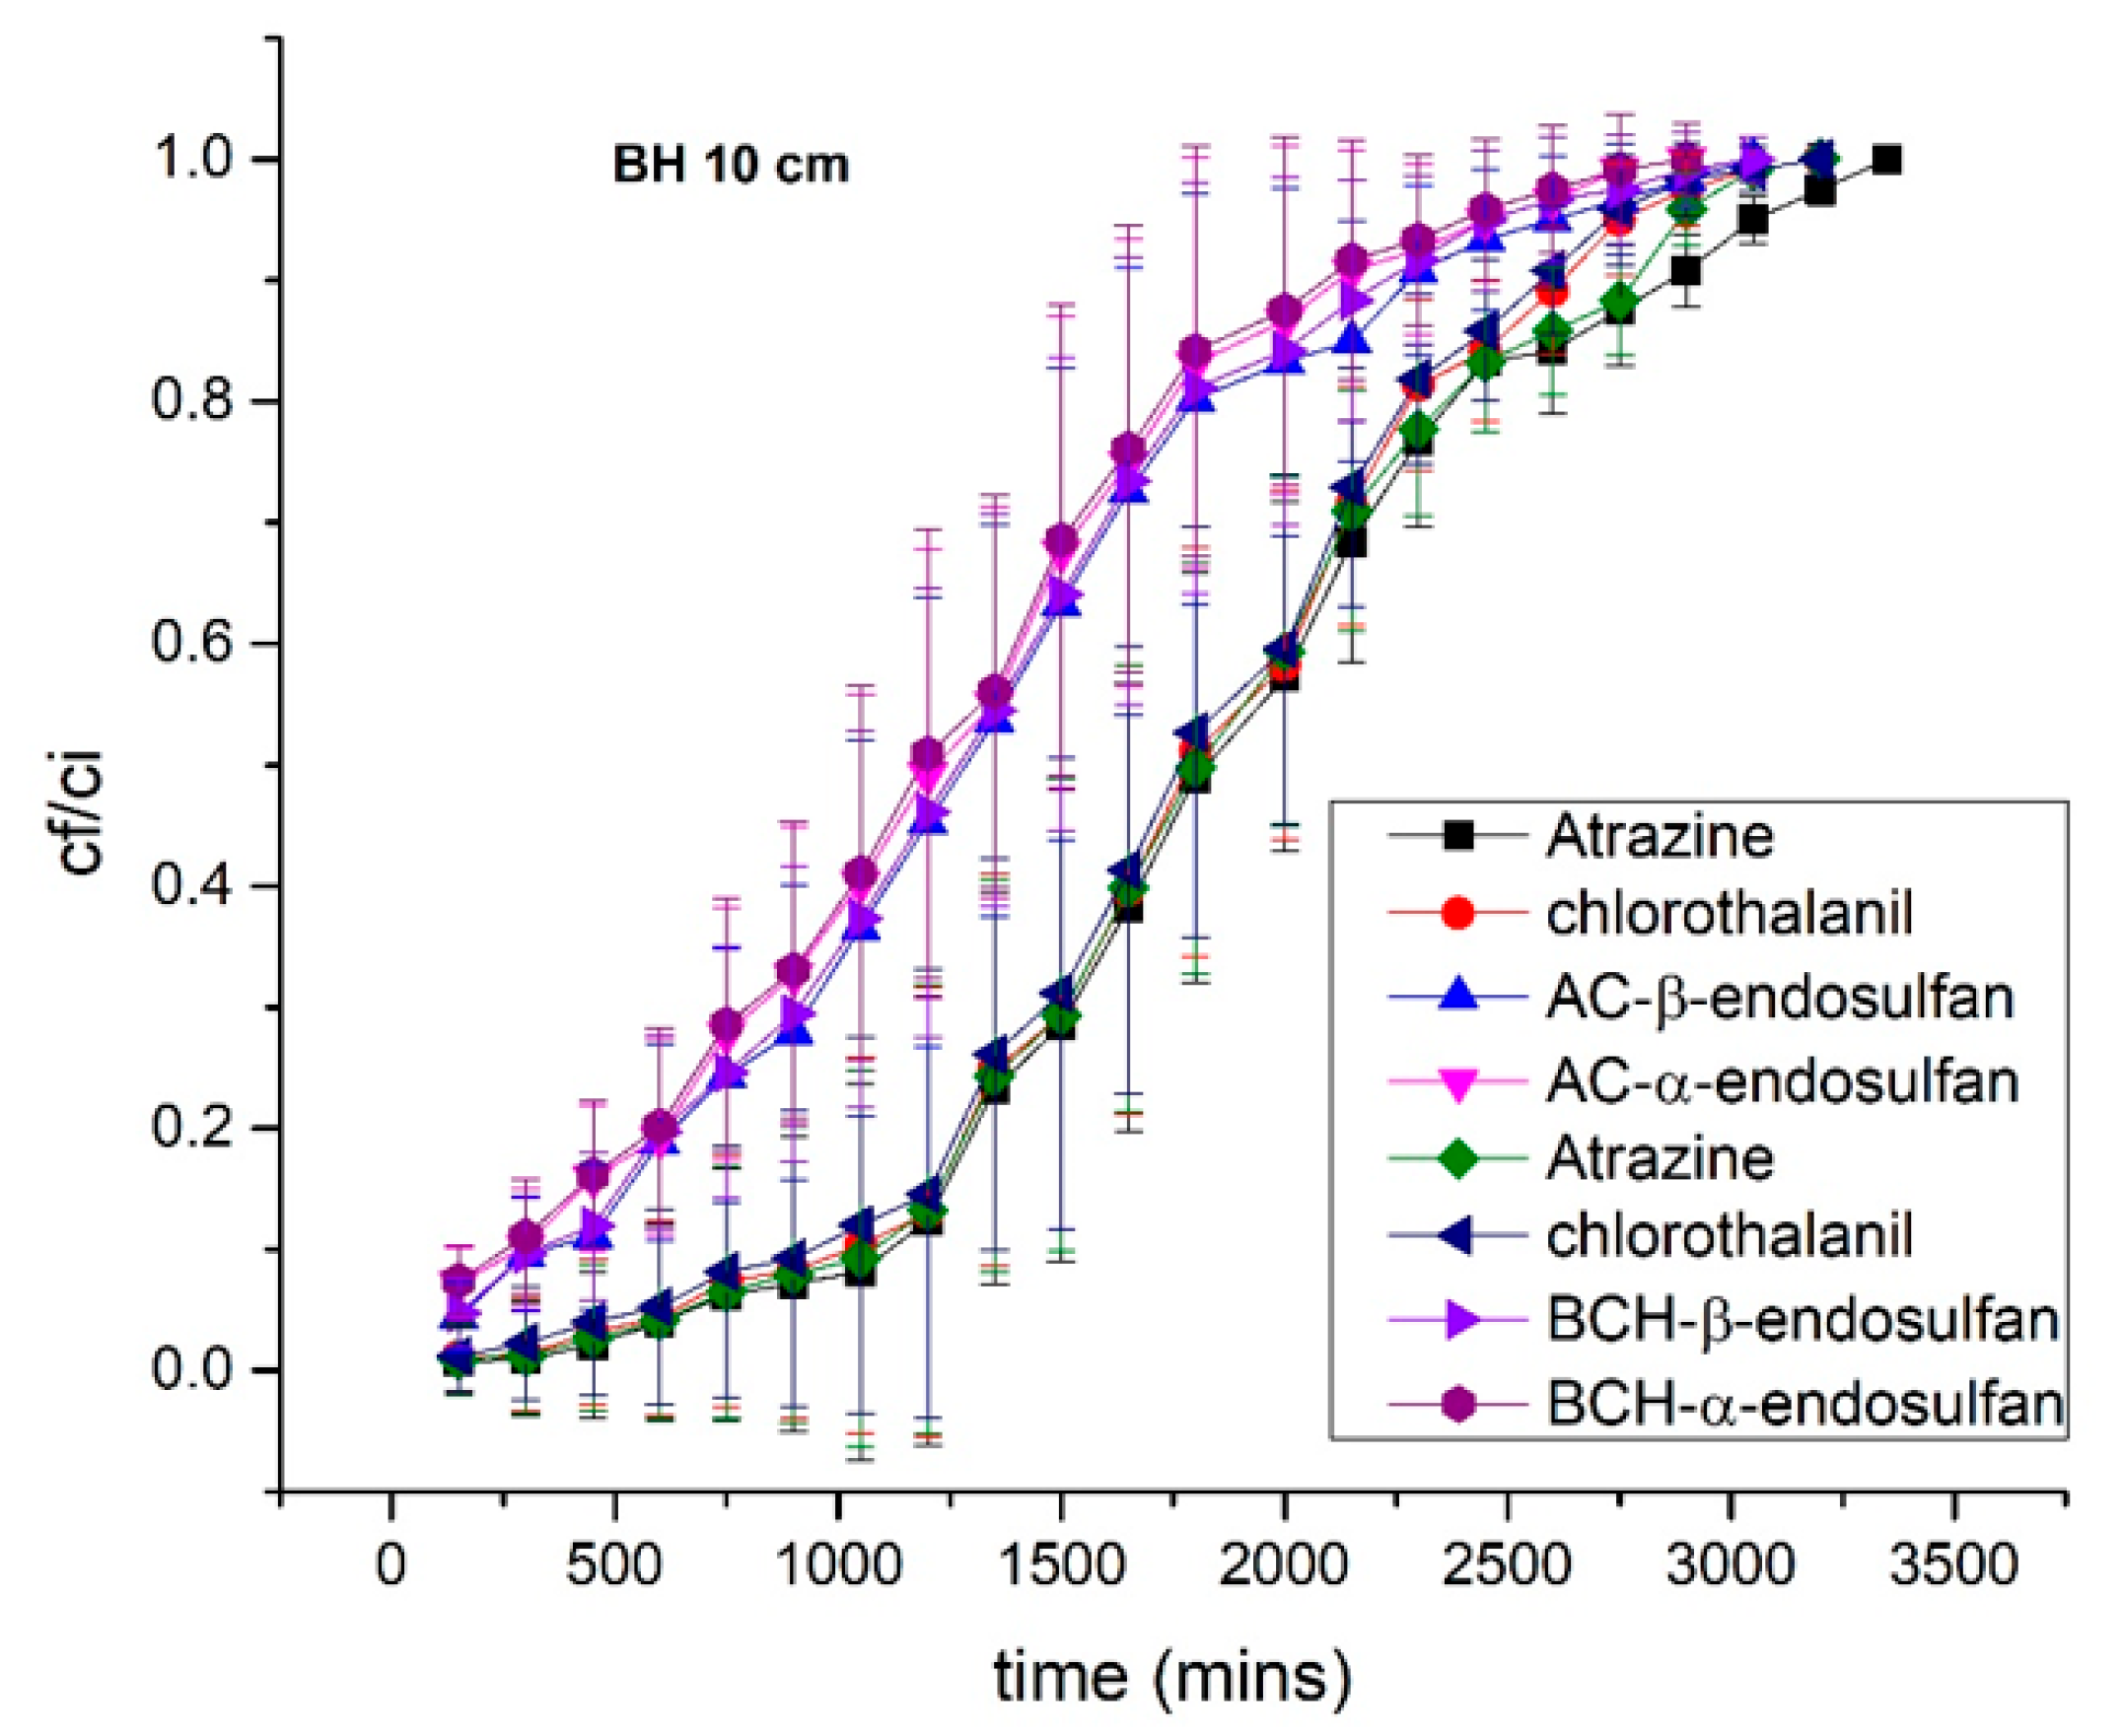
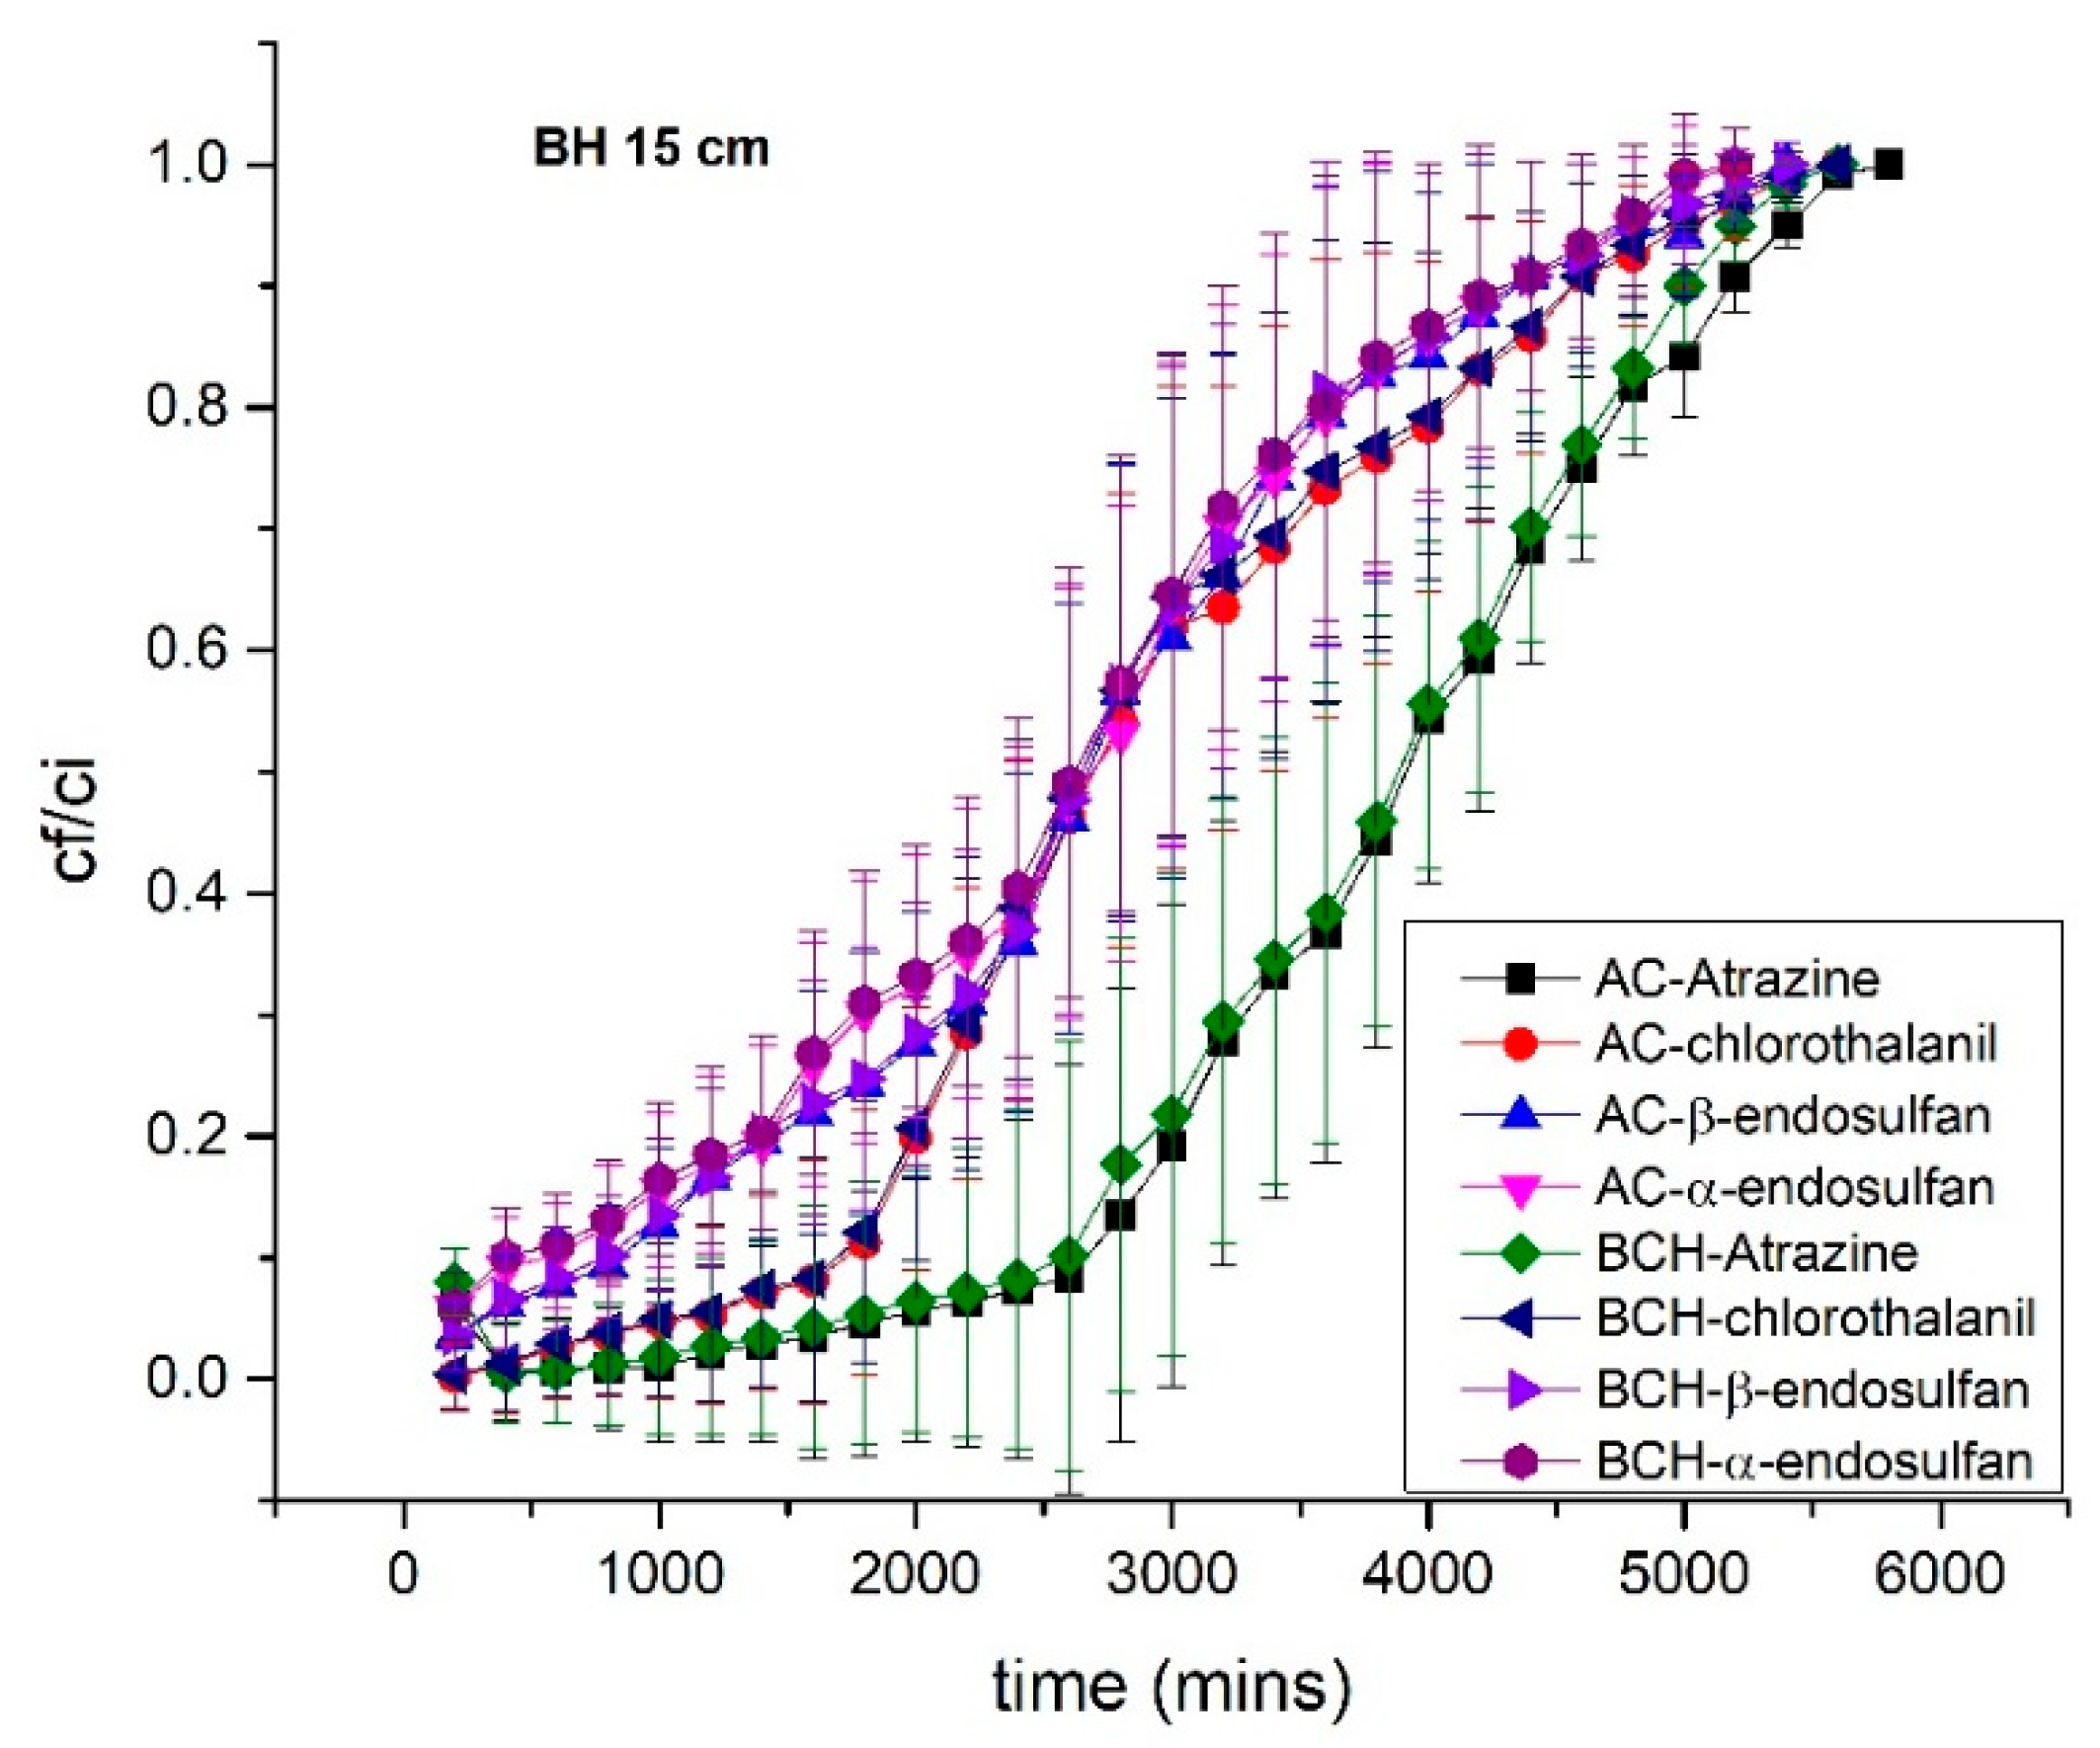
Impact of Bed Height (BH)

In adsorption column studies, breakthrough curve (BT) can be highly influenced by bed height, as pesticide treatment depends upon the used amount of packed adsorbents in the column, which subsequently describes the height of the column bed. To investigate the impact of bed height, equivalent amounts of each adsorbent of 52 g and 78 g were filled in separate columns, respectively, yielding particular bed heights of 10 cm and 15 cm, at 0.5 mL min−1 of constant flow rate, with pH of 7 and 12 µg L−1 of pesticides’ aqueous solution initial concentration. Figure 5 and Figure 6 show the adsorption of pesticides at bed heights of 10 and 15 cm, respectively. The obtained results declared that adsorption of pesticides was improved and the time of breakthrough was shifted away from the origin with the increase in bed heights. Increases in exhaust time (Cf/Ci = 1) recorded at 10 cm and 15 cm for atrazine were 3350 min to 5800 min and 3200 min to 5700 min; chlorothalanil were 3200 min to 5600 min and 3150 min to 5550 min; β-endosulfan were 3050 min to 5400 min and 2950 min to 5400 min; α-endosulfan 2900 min to 5200 min and 2850 min to 5200 min for AC and BCH, respectively. So, the maximum utilized volume for bed heights of 10 and 15 cm were 2000 mL to 3000 mL and 1800 mL to 2850 mL, for AC and BCH, respectively. At a constant flow rate, this increase in influent volume leads to longer interaction time, resulted in an increase in the ability of adsorption. So, by increasing bed height, a large volume of influent was treated, which shows that an increase in height of column bed subsequently needs a large quantity of adsorbent and, thus, provides a substantial number of binding sites for pesticides adsorption. This indicates that at 15 cm bed height, the amount of pesticides adsorbed is greater than at a bed height of 10 cm. The reason for this adsorption is that when the bed height of the column increases it creates more active and vacant sites on the surfaces of the adsorbents, creating the opportunity for longer contact time between adsorbate and adsorbent molecules, resulting in greater adsorption capacity. Similarly, when the bed height of the column decreased, the available adsorption vacant sites were saturated more quickly on the surfaces of the adsorbents; therefore, not enough time was attained to diffuse pesticides molecules in the pores of adsorbents. Thus, the BT curve moves to the origin and the efficacy of adsorption is reduced [41]. Relevant results were also achieved by Amiri et al. [58], who described that adsorption of pesticides and BT time increases with the rise in height of the column bed. These findings would be accredited to the enhancement in the zone of mass transfer that would adsorb the molecules additionally escaped from underlay. Consequently, the reduction resulted in the dissolution of BT curve, as an increase in mass led to specific surface area expansion, providing more vacant sites for adsorption [59]. By comparing exhaustion time for 10- and 15-cm bed heights, the results show that for a bed height of 10 cm, the exhaustion time strongly decreased, due to the phenomena of axial dispersion [60].

3.3. Physical Properties of AC and BCH

Significant physical properties of BCH and AC include bulk density, porosity, surface area, particle size, and water holding capacity. BCH showed a lower density of 0.42 g cm−3 than AC having 34.4 g cm−3 bulk density at particle size of 250 µm. The pore volume of AC was 1.39 nm while that of BCH was 0.03–0.02 nm. Similarly, water holding capacity of BCH was greater than that of AC, while solid density of AC was greater than that of BCH. Both the adsorbents had high surface area, resulting in good water holding capacity, as shown in Table 1.

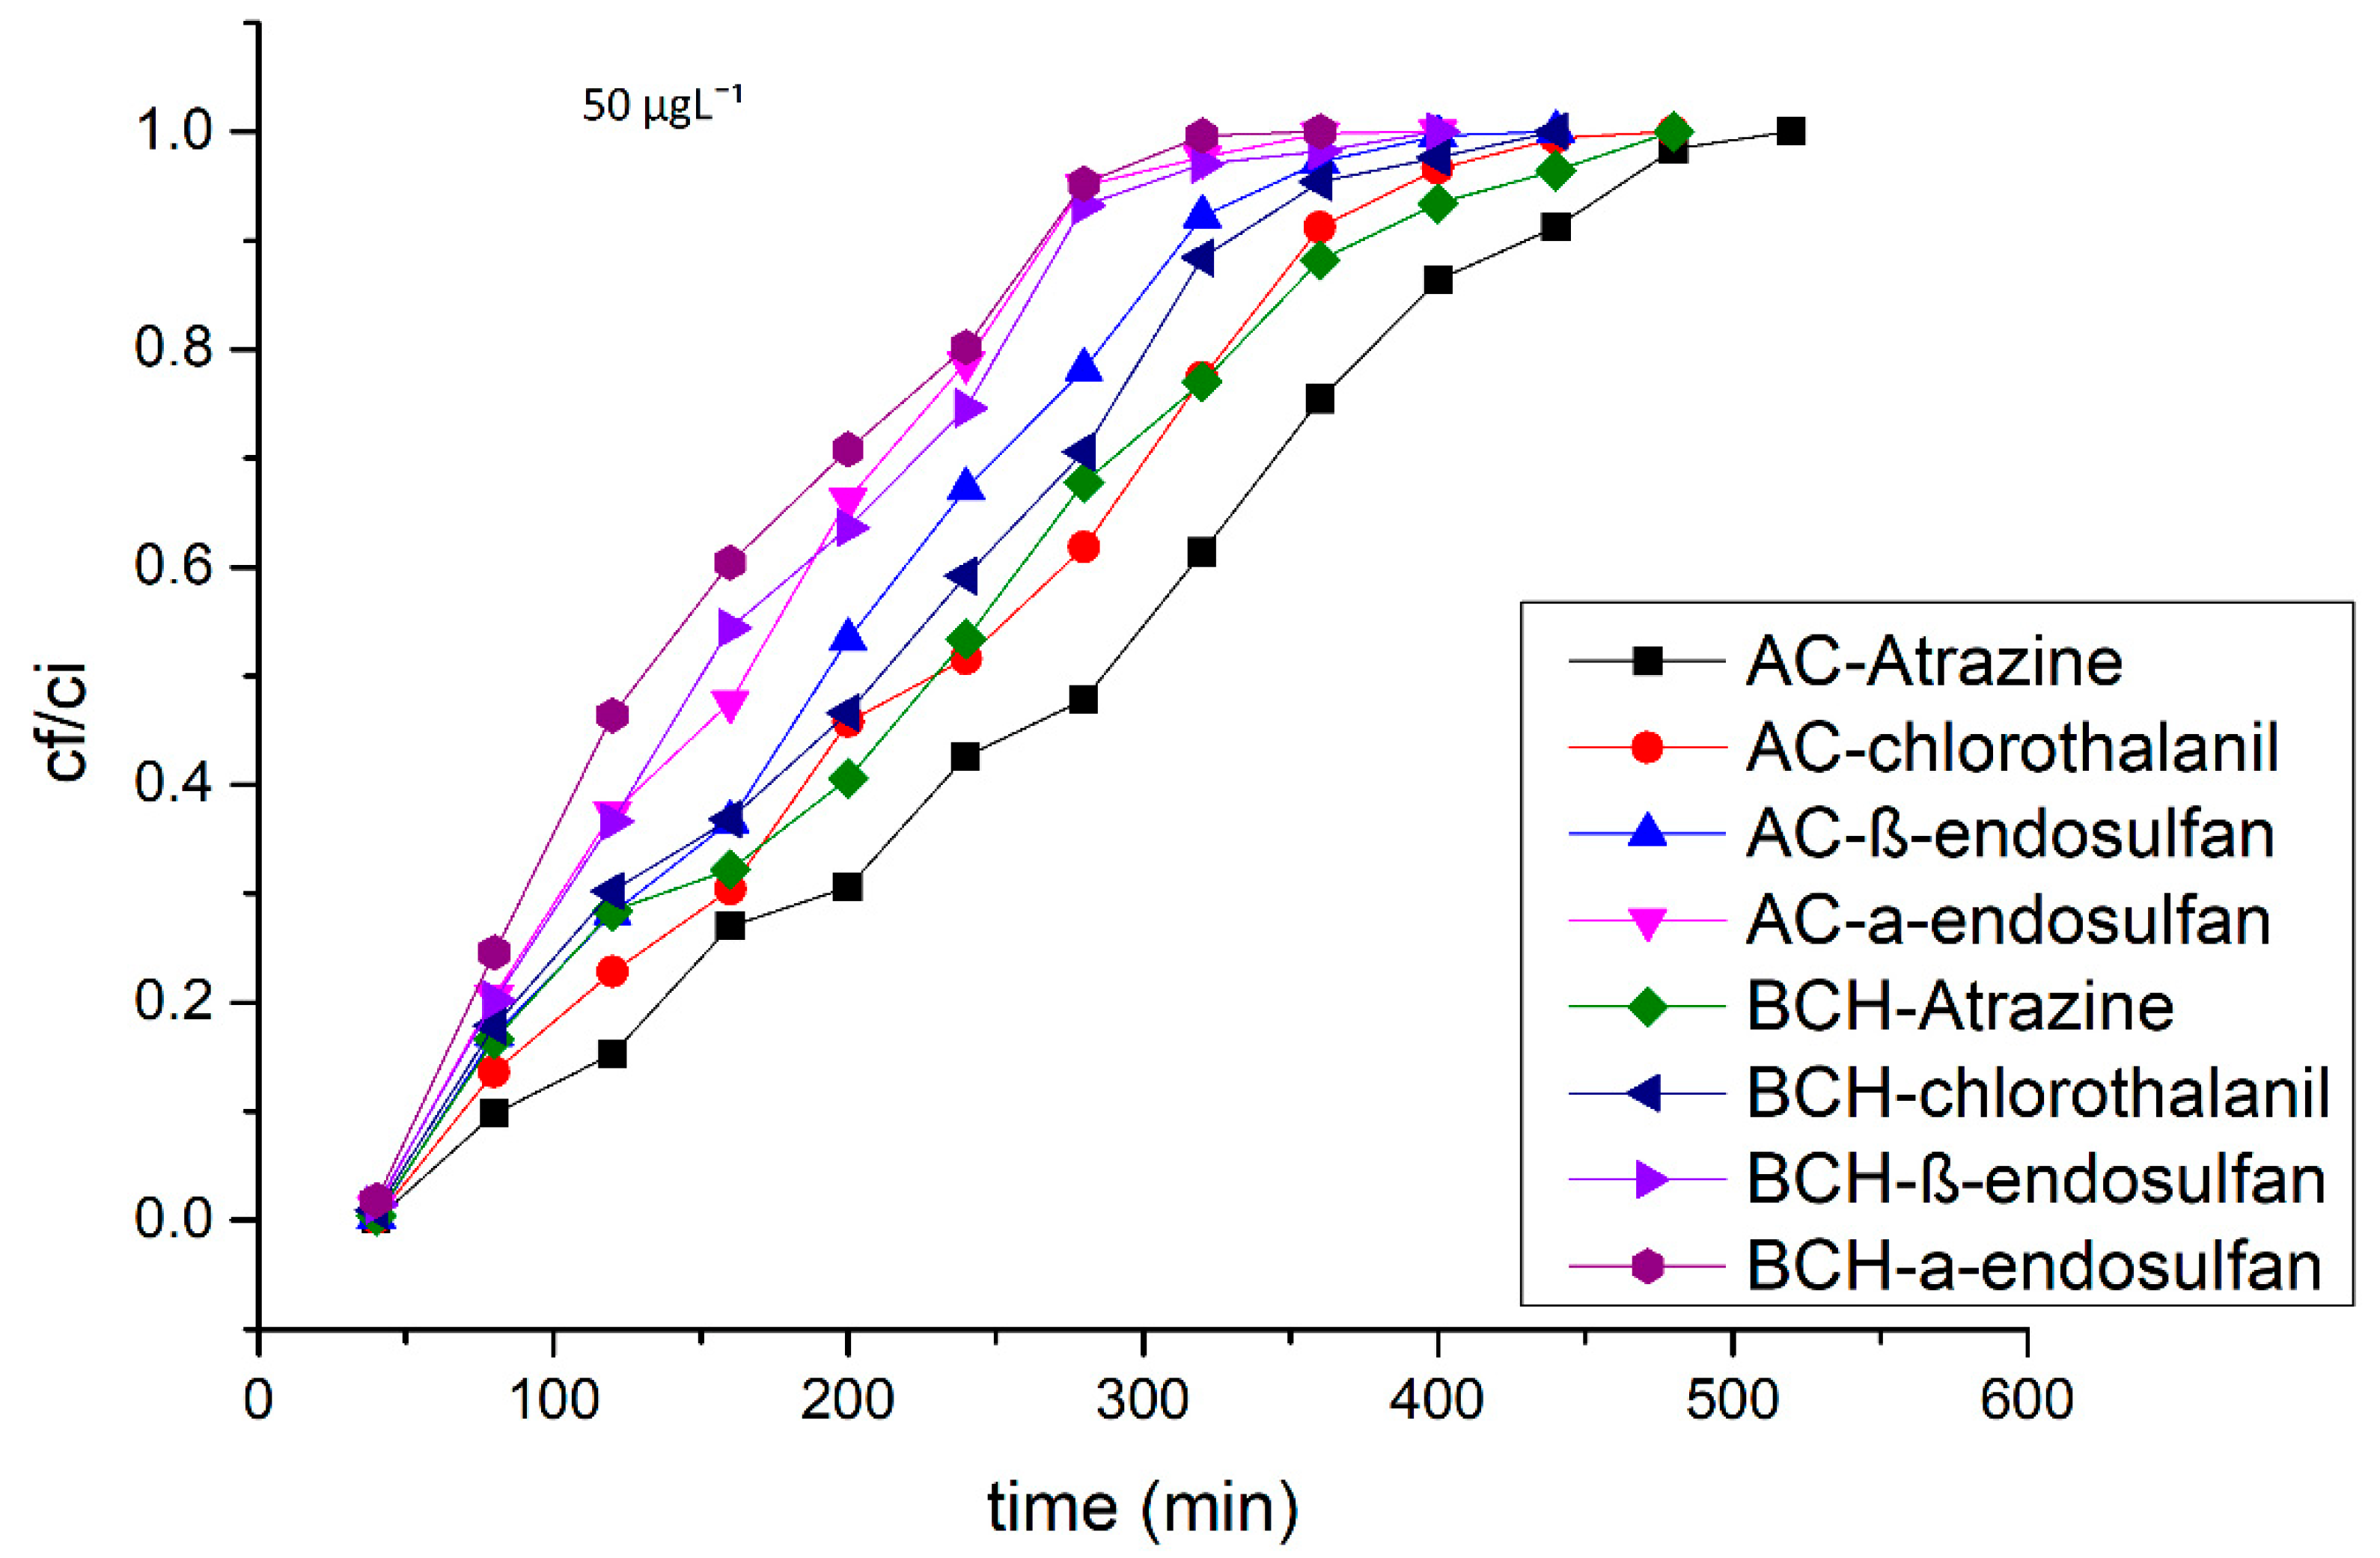
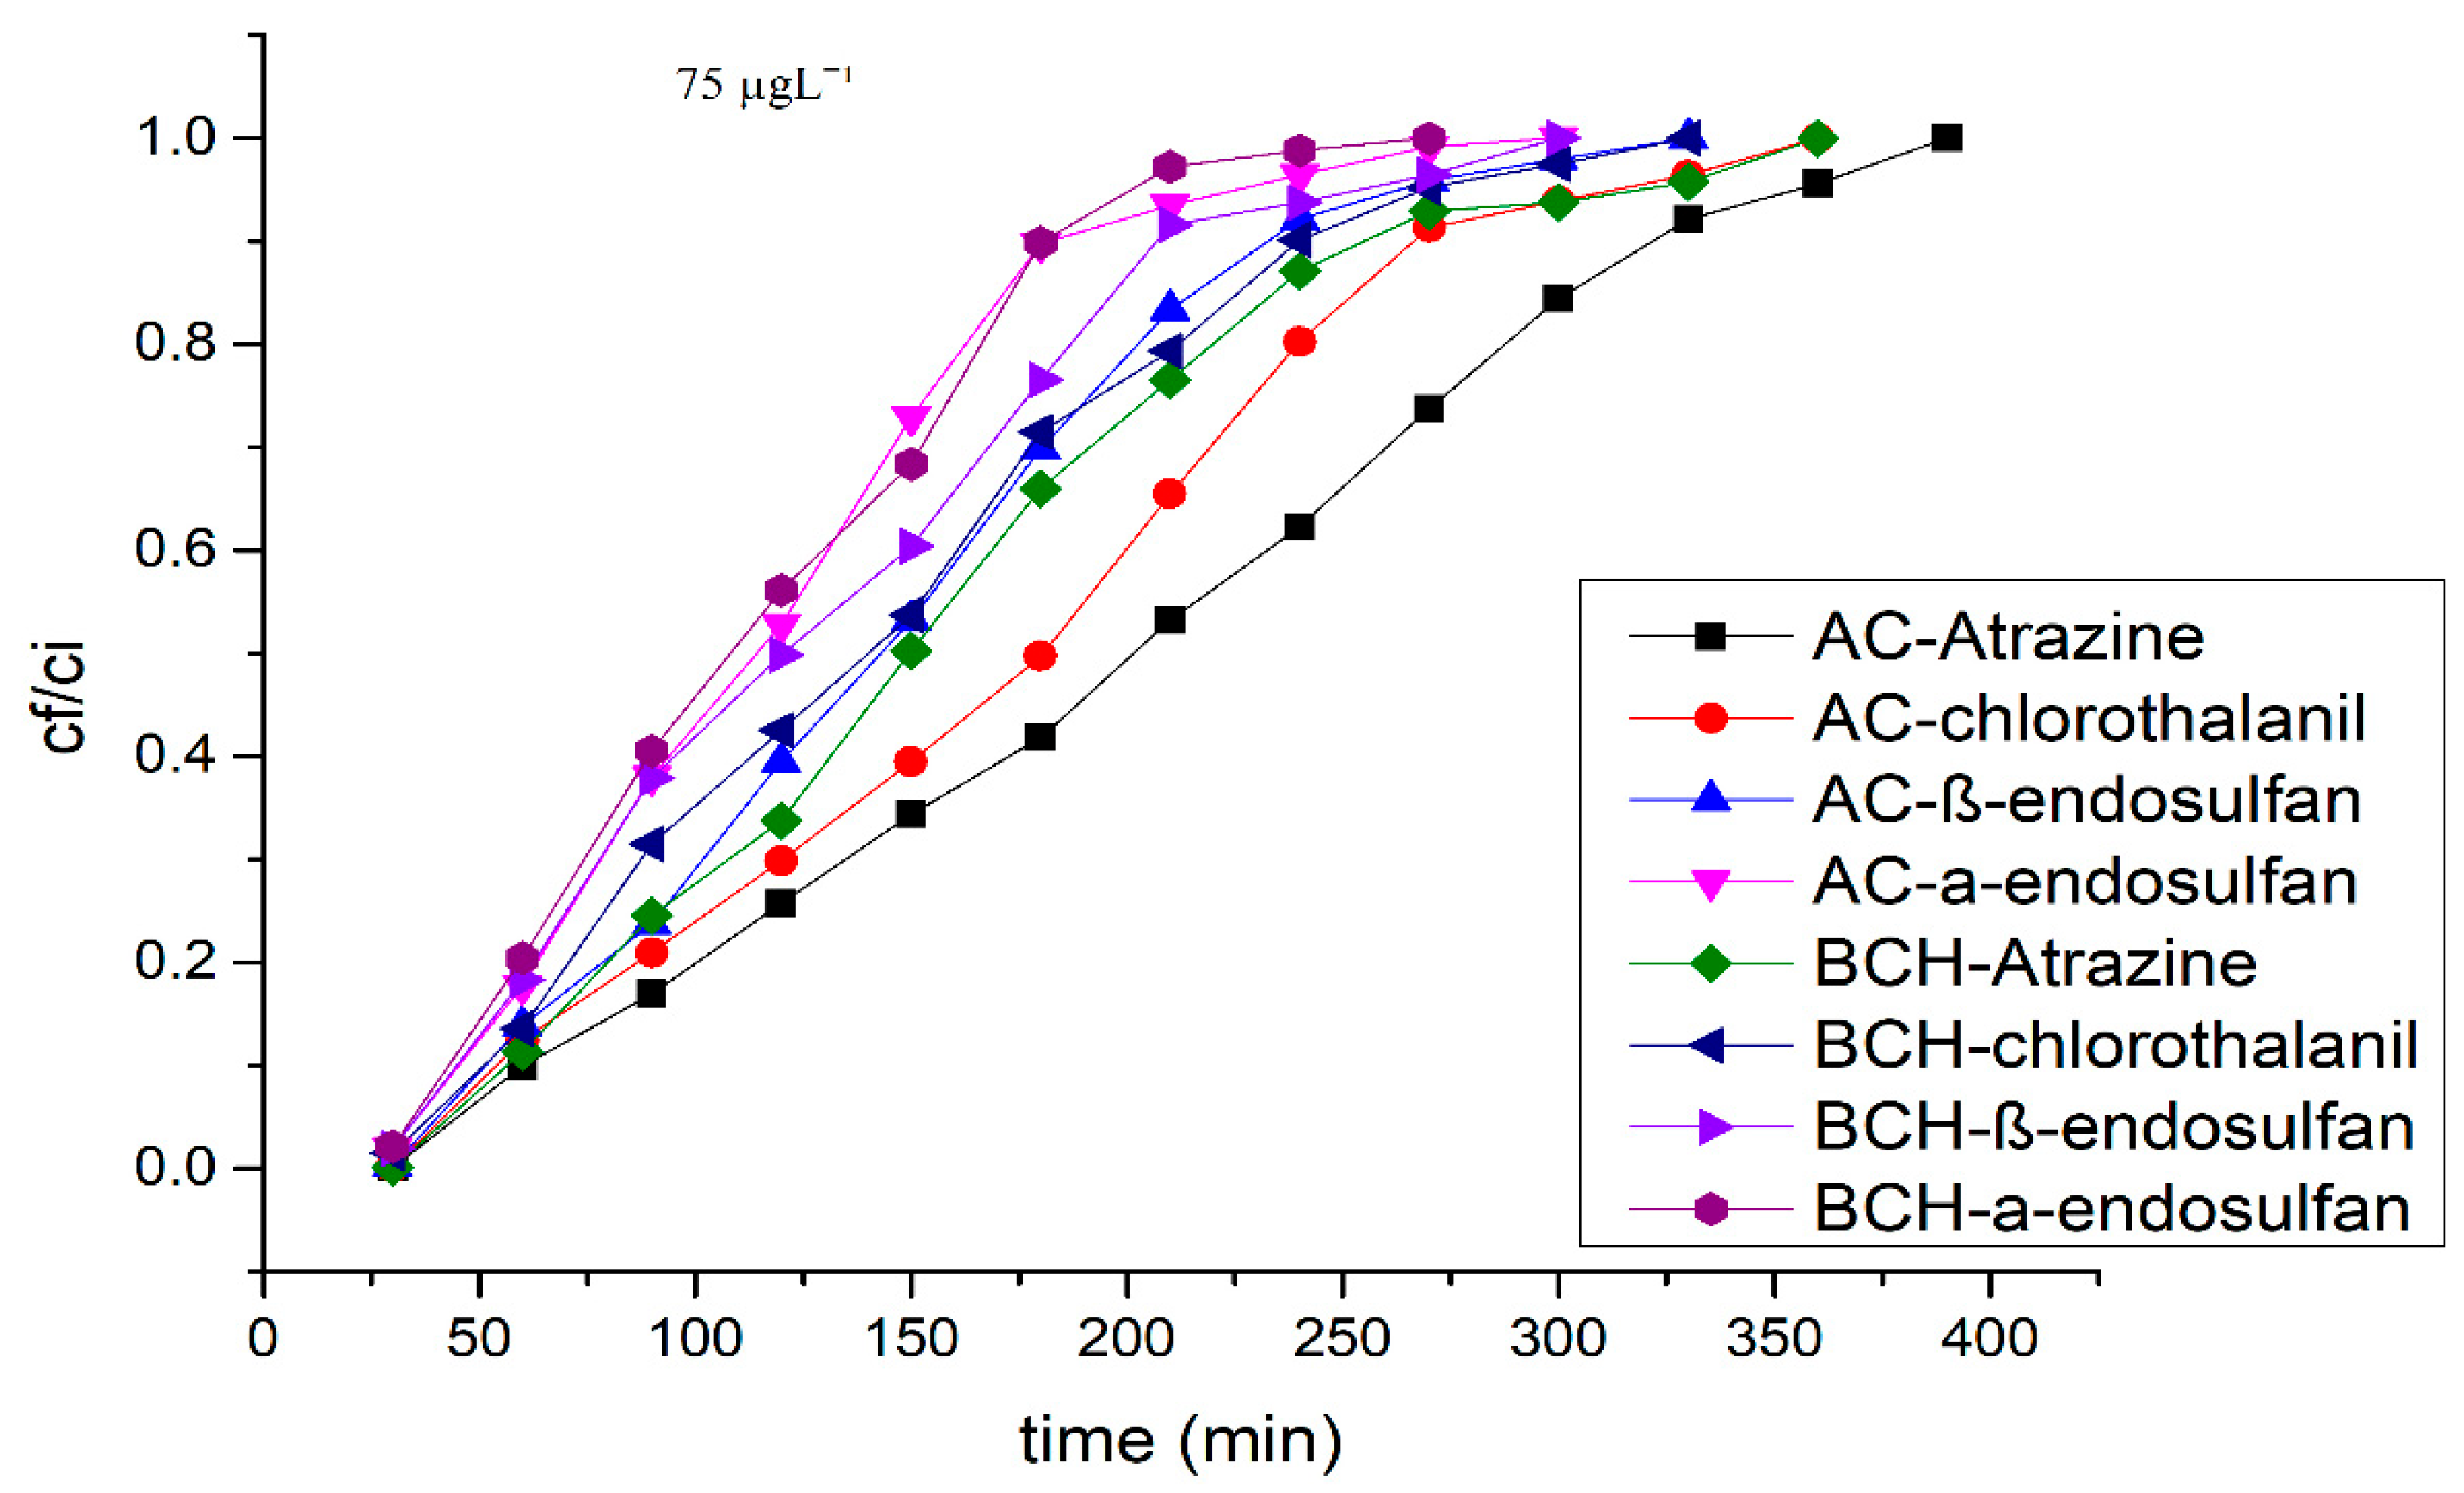
3.4. Impact of Initial Concentration (Ci)

Breakthrough curves for packed columns of both AC and BCH adsorbents at 50 µg L−1 and 75 µg L−1 of inlet concentrations of pesticides are shown in Figure 7 and Figure 8, respectively, while all other conditions such as flowrate rate (0.5 mL min−1), influent pH 7, and height of bed (5 cm) were kept constant. Breakthrough time shows a decrease for both AC and BCH adsorbents when the initial concentration of the pesticides increases, because the sites of adsorbent are exhausted rapidly with higher concentration [41]. Similar results were also obtained by Pradhan et al. [6], who reported that the increase in inlet concentration resulted in the decrease in adsorption rate of pesticides. This suggests that the adsorbent-available binding sites were rapidly occupied with pesticide molecules at greater concentration, resulting in earlier saturation of adsorbent and the time of exhaustion being reached earlier [61]. The result indicates that when influent pesticides solution concentration increases from 50 to 75 µg L−1, exhaustion time decreases for atrazine from 520 min to 390 min and 480 min to 360 min, chlorothalanil from 480 min to 360 min and 440 min to 330 min, β-endosulfan from 440 min to 330 min and 400 min to 300 min, and α-endosulfan from 400 min to 300 min and 360 min to 270 min on AC and BCH, respectively, due to the rapid saturation of the adsorbent sites. This is due to the fact that at lower influent pesticides solution concentrations, a decrease in diffusion coefficient and mass transfer driving force leads to the adsorbate molecules’ good diffusion in the adsorbent pores. Consequently, increases in the contact time were reported and the solution left the column in a longer time. Hence, at lower concentration, the ability of adsorbent adsorption increased. However, in the column driving forces for diffusion of pesticides molecules were boosted in the higher inlet concentration. Further, during the process of adsorption, the influent increasingly occupied and therefore rapidly saturated the active sites of the adsorbent, resulted in the decreased extent of adsorptions [62,63]. Relevant results were obtained by Raiman et al. [8] who investigated atrazine adsorption in a fixed-bed column from prepared aqueous solution. The obtained results showed that atrazine adsorption decreases due to the rise in initial concentrations of atrazine in synthesized aqueous solution (used as an influent). Similarly, Bayat et al. [59] suggested that the adsorption sites rapid saturation can be the cause of high inlet concentration, resulting in accelerated breakthrough and reaching the saturation point in less time. In summation, from our findings, it can be inferred that adsorption can be significantly affected by the influent initial concentrations in a fixed-bed column, thus, effecting the morphology, molecule charge, and adsorbent surface properties.

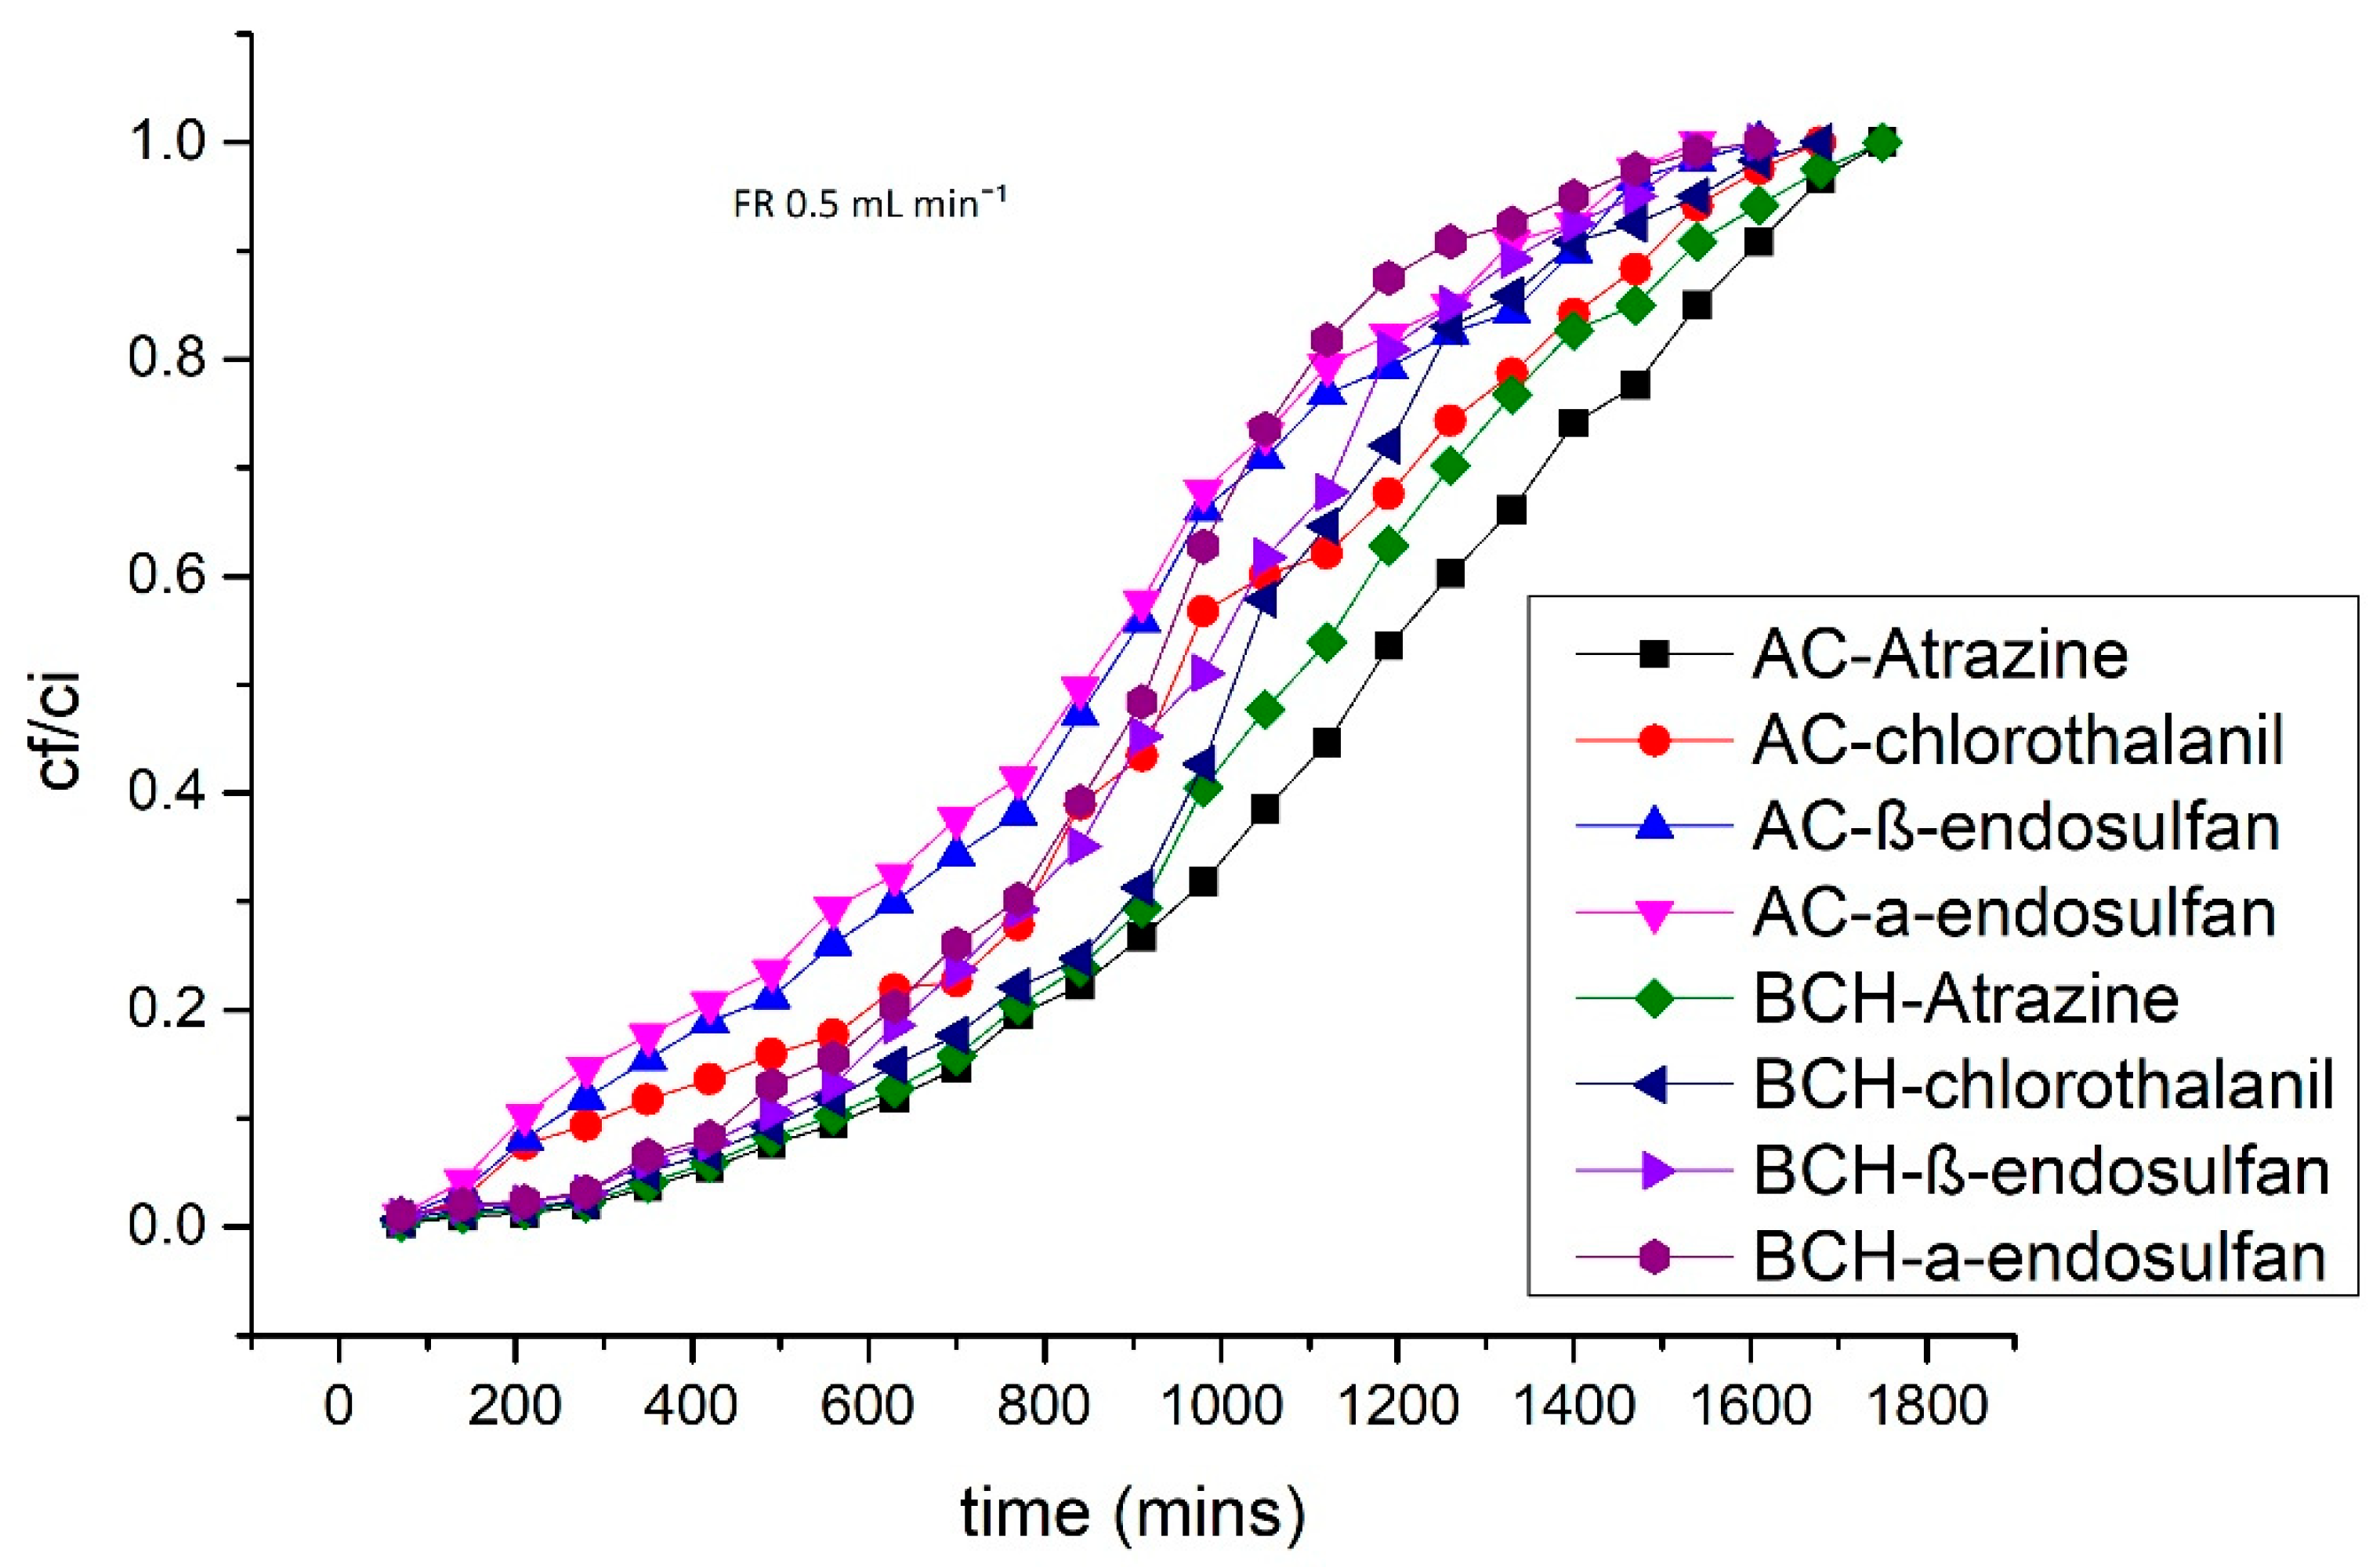
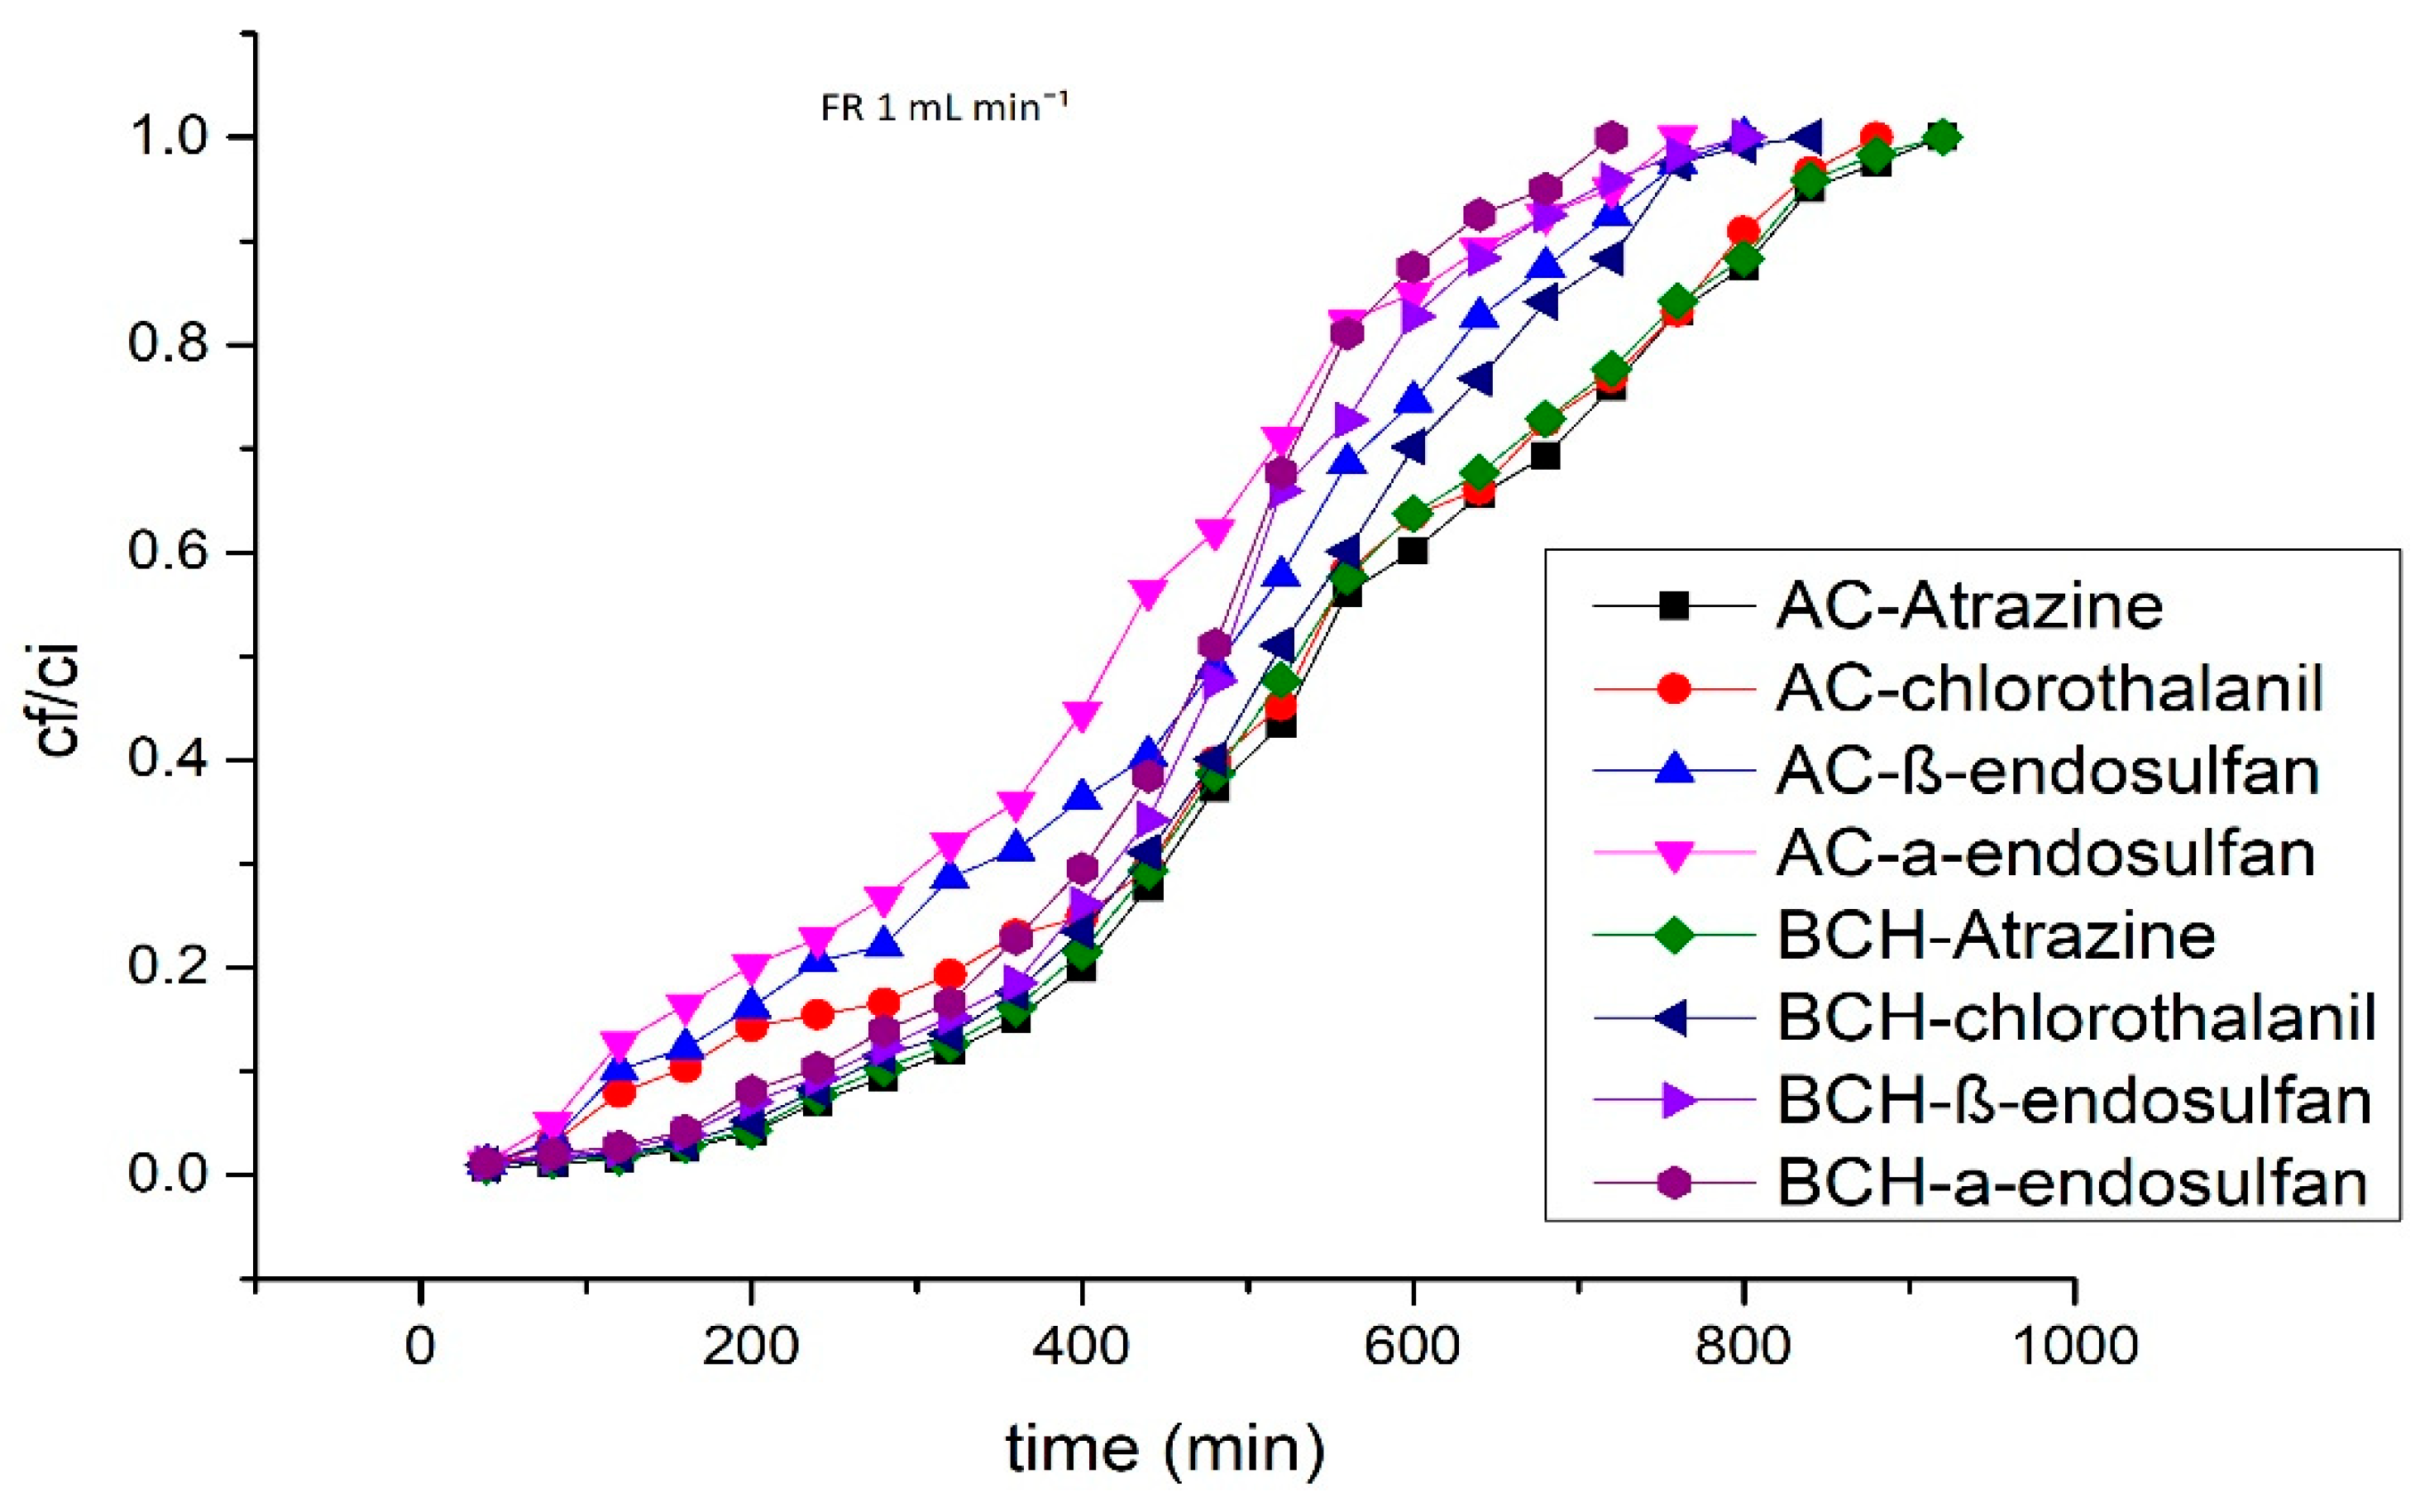
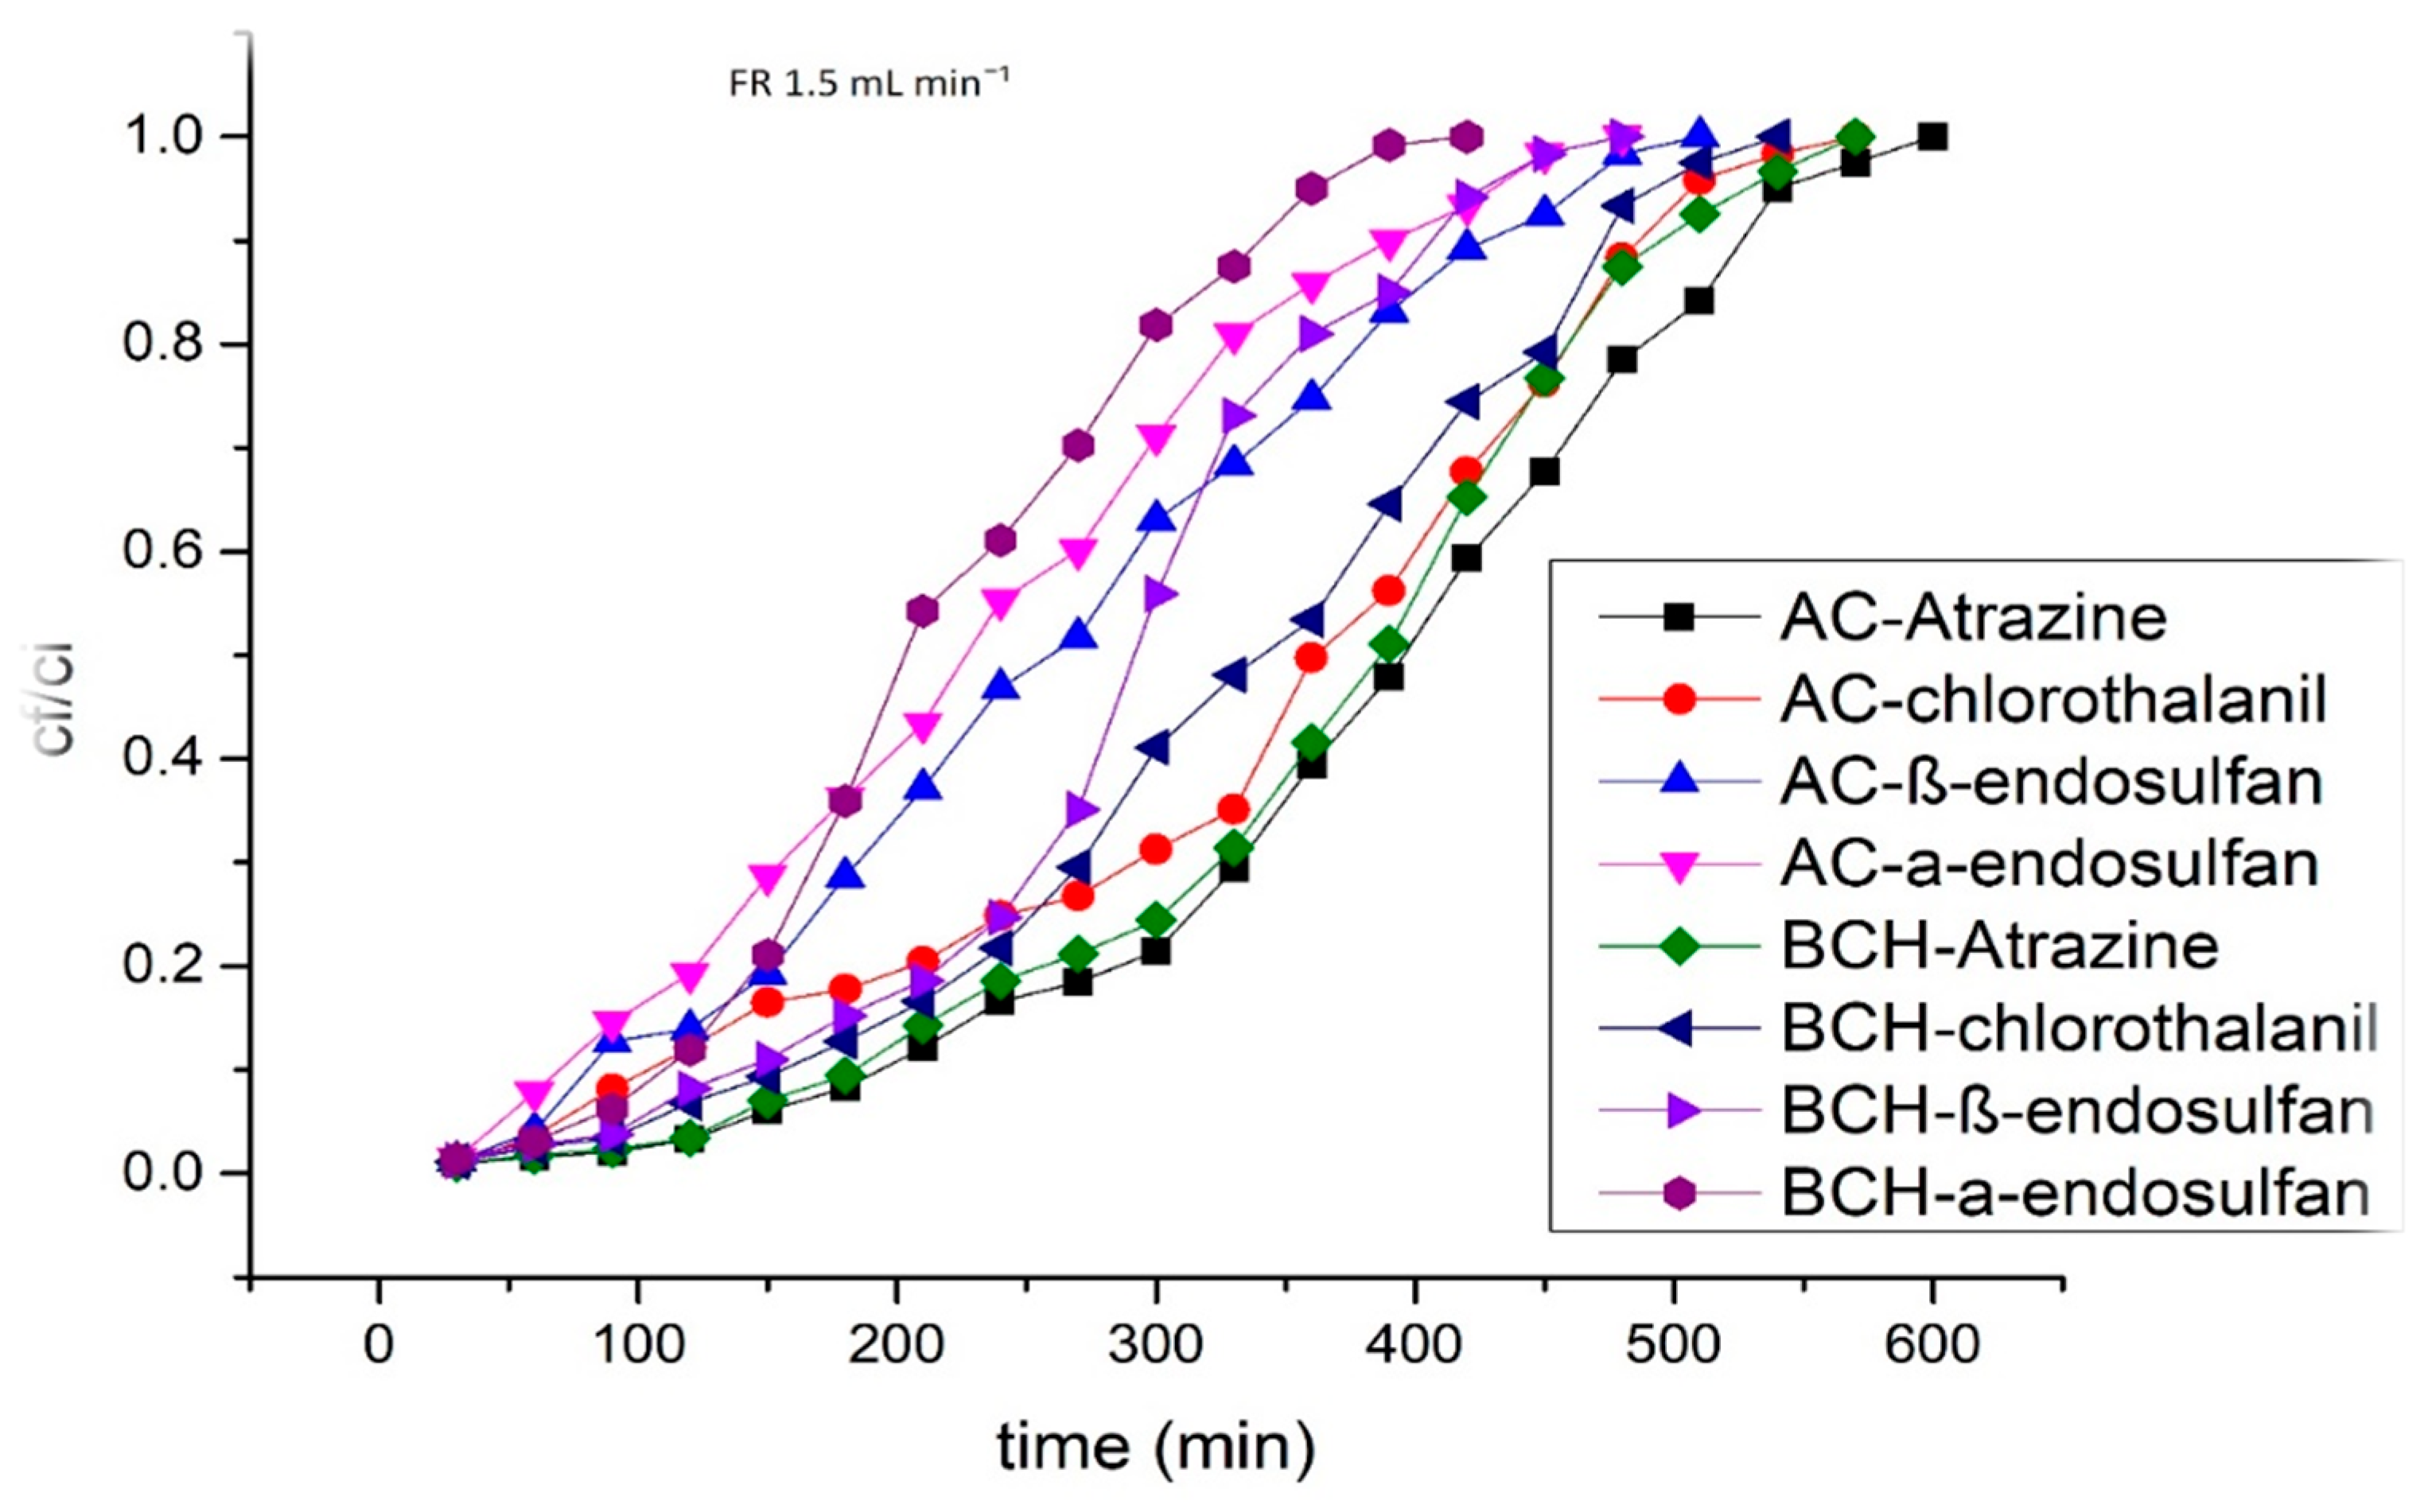
3.5. Impact of Flow Rate (Q)

In adsorption studies, flow rate affects the breakthrough curve, predicts the contact time of the influents with adsorbent, and evaluates the capacity of adsorbent uptake of the column. Flow rate’s impact on pesticides combined solution adsorption onto AC and BCH was investigated by varying the flow rate to 0.5, 1, and 1.5 mL min−1 with 12 µg L−1 of initial concentration, bed height of 5 cm, and neutral pH of 7. The obtained curves at 0.5, 1, and 1.5 mL min−1 flow rates are shown in Figure 9, Figure 10 and Figure 11, respectively. The obtained results showed that, at lower flow rate, the exhaust time and breakthrough increased, suggesting the maximum utilization of the adsorbents AC and BCH for pesticides adsorption; at high flow rate, breakthrough and exhaust time decreased. The decreases in exhaust time for atrazine were 1750 min to 600 min and 1700 to 570 min, chlorothalanil 1680 min to 570 min and 1640 min to 540 min, β-endosulfan 1620 min to 510 min and 1590 min to 480 min, and α-endosulfan 1560 min to 480 min and 1530 min to 420 min at flow rates ranging from 0.5 to 1.5 mL min−1 on AC and BCH, respectively. This indicates that at 0.5 mL min−1 of lower influent flow rate, the adsorbent shows higher adsorption capability. Similar results were also obtained by Raiman et al. [8], who reported that with the increase in flow rate, decreased in the adsorption of pesticides were noted. The reason for this aggravated capability of adsorption is that the increase in mass transfer into the adsorbent pores occurs due to the increase in the time of residence; consequently, on the surface of adsorbent, the pesticides’ molecules gain greater access to approach active binding sites. Subsequently, uptake of pesticides increases. Although, when the flow rate increased, a decrease in the breakthrough time and exhaust time was reported due to the shorter mass transfer zone; therefore, the adsorption of pesticides was lower because of minimum contact time amongst pesticides molecules and adsorbent [41]. Similarly, Amiri et al. [62] studied that at higher breakthrough times and lower flow rates, more accessible adsorption sites were available and molecules of pesticides adsorb easily, so the adsorption quantity decreased with increasing flow rate. Relevant results were also obtained by Xu et al. [63]. According to him, higher driving forces were produced at higher influent flow rate in the column for mass transport, which ultimately reduce the contact time; therefore, no sufficient time for pesticides molecule diffusion into the adsorbent pores was available. Bayat et al. [59] also reported that fixed-bed column reaches an early saturation point due to high influent flow rate. This is why, before leaving the column, less of the solution volume is purified and the capacity of adsorption decreases.

3.6. Modeling

3.6.1. Thomas Model

In a fixed-bed column system, to describe the dynamic adsorptions of different pollutants, the popular Thomas equation has been used broadly to observe BTC [64]. By applying nonlinear regression analysis, the experimental data obtained were best fitted to Thomas’ model. The model accuracy was evaluated on the basis of determined coefficient (R2) calculations. The results indicate that Thomas’ model satisfactorily describes experimental data at each operating condition and fit the breakthrough curves well, and due to higher R2 (0.9986) value, nearly a perfect match amongst the estimated and experimental data was accomplished. Values of Thomas’ constants (kTH) and adsorption (q0) were also used to describe the dynamic adsorption behavior of AC and BCH, for pesticides adsorption under several operational parameters. With the increase in flow rate from 0.5 to 1.5 mL min−1, the kTH value of all selected pesticides increases for both AC and BCH. Similar trends were also obtained for the values of qo for both the adsorbents, as presented in Table 2. The results obtained are in good agreement with the study performed by Odunola et al. [65]. The values of R2 at 0.5 mL min−1 of flow rate for atrazine were 0.9427 and 0.9637; chlorothalanil, 0.9588 and 0.9628; β-endosulfan, 0.9353 and 0.9389; α-endosulfan, 0.9583 and 0.9389 for AC and BCH, respectively, which shows good fit to the adsorption data. Baharami et al. [41] obtained the same results by studying the adsorptions of 2, 4 D pesticides onto the adsorbents “AC and BCH” and the obtained data were examined using Thomas’ model, which shows best fit to the adsorptions data.

3.6.2. Yoon–Nelson Model

Yoon–Nelson’s model is a general mathematics model investigating 50% of the breakthrough time. Basically, the model measure, proportionality “rate of decrease in the probability of adsorption for each adsorbate molecule”, and “the probability of adsorbate adsorption and the probability of adsorbate breakthrough on the adsorbent” [65]. Ln cf/ci-cf against time t linear plot were elucidated by Yoon–Nelson model, presented in Table 3. The value of Kyn for both AC and BCH increases with the rise in the flow rate. The Kyn value was observed in the range of 0.001 and 0.0066 mg g−1 for AC and 0.0019 and 0.0086 for BCH. The τ value for AC and BCH was found to be between 0.001181–930.6111 and 217.668–1066.368 mL min−1 mg−1, respectively. Relevant results was also given by Bayat et al. [59], who studied diazinon removal through fixed-bed column. According to higher R2 values, the fluent removal of pesticides was well-described by Yoon–Nelson’s model under optimal conditions onto AC and BCH, which illustrate the model’s validity for this study. A comparison of the obtained results with literature data is summarized in Table 4.

4. Conclusions

This study demonstrates that pesticides adsorption from aqueous solutions in a fixed-bed column system might be potentially useful. As an adsorbent, both AC and BCH show high adsorption affinity for selected pesticides. Bed height (BH), flow rate (Q), and influent initial concentration (Ci) were the essential parameters used in the study. The results reveal that pesticides adsorption increases with the rise in column bed height from 5 cm to 15 cm, while a decrease in adsorption was found when flow rate increases from 0.5 mL min−1 to 1.5 mL min−1, and influent initial concentration from 50 µg L−1 to 75 µg L−1. Such promising results provide a basis for implementation of a novel continuous treatment system for water contaminated with pesticides. Thomas’ and Yoon–Nelson’s models well-describe the dynamic adsorption behavior of a fixed-bed column system under optimal conditions (R2 = 0.9427 and R2 = 0.9921), respectively. The studied adsorption technique was suitable for each environmental condition and, for adsorbents preparation, rely on available resources, which confirm its cost-effectiveness. The outcomes of the current study determine that under optimal conditions both the adsorbents could be efficiently implied as best adsorbents to adsorb pesticides from prepared aqueous solutions.

Author Contributions

Conceptualization, S.K.; performed laboratory experiments, K.; wrote the manuscript, K.; statistical analysis, R.U.; review and editing M.A., A.W., K.A.K., H.A.G.; H.F.A., Y.M.A., S.A.A., N.M.A. and F.R.; Validation and software, Editing final draft, resources, funding. All authors have read and agreed to the published version of the manuscript.

Funding

The Deanship of Scientific Research (DSR) at King Abdulaziz University (KAU), Jeddah, Saudi Arabia has funded this project, under grant no. (KEP-MSc:87-130-1443). The authors, therefore, gratefully acknowledge DSR technical and financial support.

Institutional Review Board Statement

Not applicable.

Informed Consent Statement

Not applicable.

Data Availability Statement

During this study, all the data generated and analyzed are included in this published article.

Conflicts of Interest

The authors declare no conflict of interest.

References

  1. Kalyabina, V.P.; Esimbekova, E.N.; Kopylova, K.V.; Kratasyuk, V.A. Pesticides: Formulants, distribution pathways and effects on human health—A review. Toxicol. Rep. 2021, 8, 1179–1192. [Google Scholar] [CrossRef] [PubMed]
  2. Dorschner, K.; Kunkel, D.; Braverman, M. Agricultural pesticide registration in the United States. In Sustainable Management of Arthropod Pests of Tomato; Academic Press: Cambridge, MA, USA, 2018; pp. 343–350. [Google Scholar]
  3. Kudsk, P.; Jørgensen, L.N.; Ørum, J.E. Pesticide Load—A new Danish pesticide risk indicator with multiple applications. Land Use Policy 2018, 70, 384–393. [Google Scholar] [CrossRef]
  4. Ippolito, A.; Fait, G. Pesticides in surface waters: From edge-of-field to global modelling. Curr. Opin. Environ. Sustain. 2019, 36, 78–84. [Google Scholar] [CrossRef]
  5. Vimal, V.; Patel, M.; Mohan, D. Aqueous carbofuran removal using slow pyrolyzed sugarcane bagasse biochar: Equilibrium and fixed-bed studies. RSC Adv. 2019, 9, 26338–26350. [Google Scholar] [CrossRef] [PubMed]
  6. Pradhan, S.S.; Gowda, G.B.; Adak, T.; Guru-Pirasanna-Pandi, G.; Patil, N.B.; Annamalai, M.; Rath, P.C. Pesticides Occurrence in Water Sources and Decontamination Techniques. In Pesticides; IntechOpen: London, UK, 2022. [Google Scholar]
  7. Khan, M.I.; Shoukat, M.A.; Cheema, S.A.; Arif, H.N.; Niazi, N.K.; Azam, M.; Qadri, R. Use contamination and exposure of pesticides in Pakistan: A review. Pak. J. Agric. Sci. 2020, 57, 131–149. [Google Scholar]
  8. Levio-Raiman, M.; Schalchli, H.; Briceño, G.; Bornhardt, C.; Tortella, G.; Rubilar, O.; Diez, M.C. Performance of an optimized fixed-bed column packed with an organic biomixture to remove atrazine from aqueous solution. Environ. Technol. Innov. 2020, 21, 101263. [Google Scholar] [CrossRef]
  9. Tomlin, C.D.S. (Ed.) The Pesticide Manual—World Compendium, 11th ed.; British Crop Protection Council: Surrey, UK, 1997; p. 459. [Google Scholar]
  10. Saleh, I.A.; Zouari, N.; Al-Ghouti, M.A. Removal of pesticides from water and wastewater: Chemical, physical and biological treatment approaches. Environ. Technol. Innov. 2020, 19, 101026. [Google Scholar] [CrossRef]
  11. Marican, A.; Durán-Lara, E.F. A review on pesticide removal through different processes. Environ. Sci. Pollut. Res. 2018, 25, 2051–2064. [Google Scholar] [CrossRef]
  12. Humbert, H.; Gallard, H.; Suty, H.; Croué, J.P. Natural organic matter (NOM) and pesticides removal using a combination of ion exchange resin and powdered activated carbon (PAC). Water Res. 2008, 42, 1635–1643. [Google Scholar] [CrossRef]
  13. Ahmad, A.L.; Tan, L.S.; Shukor, S.A. Dimethoate and atrazine retention from aqueous solution by nanofiltration membranes. J. Hazard. Mater. 2008, 151, 71–77. [Google Scholar] [CrossRef]
  14. Goodwin, L.; Carra, I.; Campo, P.; Soares, A. Treatment options for reclaiming wastewater produced by the pesticide industry. Int. J. Water Wastewater Treat. 2017, 4, 2381–5299. [Google Scholar]
  15. Chidambaram, R. Application of rice husk nanosorbents containing 2, 4-dichlorophenoxyacetic acid herbicide to control weeds and reduce leaching from soil. J. Taiwan Inst. Chem. Eng. 2016, 63, 318–326. [Google Scholar]
  16. Ahmed, M.B.; Zhou, J.L.; Ngo, H.H.; Guo, W.; Thomaidis, N.S.; Xu, J. Progress in the biological and chemical treatment technologies for emerging contaminant removal from wastewater: A critical review. J. Hazard. Mater. 2017, 323, 274–298. [Google Scholar] [CrossRef]
  17. Santacruz, G.; Bandala, E.R.; Torres, L.G. Chlorinated pesticides (2, 4-D and DDT) biodegradation at high concentrations using immobilized Pseudomonas fluorescens. J. Environ. Sci. Health 2005, 40, 571–583. [Google Scholar] [CrossRef] [PubMed]
  18. Mohan, D.; Sarswat, A.; Ok, Y.S.; Pittman, C.U. Organic and inorganic contaminants removal from water with biochar, a renewable, low cost and sustainable adsorbent—A critical review. Bioresour. Technol. 2014, 160, 191–202. [Google Scholar] [CrossRef]
  19. Kyriakopoulos, G.; Doulia, D. Adsorption of pesticides on carbonaceous and polymeric materials from aqueous solutions: A review. Sep. Purif. Rev. 2006, 35, 97–191. [Google Scholar] [CrossRef]
  20. Ohno, K.; Minami, T.; Matsui, Y.; Magara, Y. Effects of chlorine on organophosphorus pesticides adsorbed on activated carbon: Desorption and oxon formation. Water Res. 2008, 42, 1753–1759. [Google Scholar] [CrossRef]
  21. Domingues, V.; Alves, A.; Cabral, M.; Delerue-Matos, C. Sorption behaviour of bifenthrin on cork. J. Chromatogr. 2005, 1069, 127–132. [Google Scholar] [CrossRef]
  22. Kitous, O.; Cheikh, A.; Lounici, H.; Grib, H.; Pauss, A.; Mameri, N. Application of the electrosorption technique to remove Metribuzin pesticide. J. Hazard. Mater. 2009, 161, 1035–1039. [Google Scholar] [CrossRef]
  23. Castro, C.S.; Guerreiro, M.C.; Gonçalves, M.; Oliveira, L.C.; Anastácio, A.S. Activated carbon/iron oxide composites for the removal of atrazine from aqueous medium. J. Hazard. Mater. 2009, 164, 609–614. [Google Scholar] [CrossRef]
  24. Sharma, R.K.; Kumar, A.; Joseph, P.E. Removal of atrazine from water by low cost adsorbents derived from agricultural and industrial wastes. Bull. Environ. Contam. Toxicol. 2008, 80, 461–464. [Google Scholar] [CrossRef] [PubMed]
  25. Ignatowicz, K. Selection of sorbent for removing pesticides during water treatment. J. Hazard. Mater. 2009, 169, 953–957. [Google Scholar] [CrossRef] [PubMed]
  26. Tsui, L.; Roy, W.R. The potential applications of using compost chars for removing the hydrophobic herbicide atrazine from solution. Bioresour. Technol. 2008, 99, 5673–5678. [Google Scholar] [CrossRef] [PubMed]
  27. Danish, M.; Sulaiman, O.; Rafatullah, M.; Hashim, R.; Ahmad, A. Kinetics for the removal of paraquat dichloride from aqueous solution by activated date (Phoenix dactylifera) stone carbon. J. Dispers. Sci. Technol. 2010, 31, 248–259. [Google Scholar] [CrossRef]
  28. Hameed, B.H.; Salman, J.M.; Ahmad, A.L. Adsorption isotherm and kinetic modeling of 2, 4-D pesticide on activated carbon derived from date stones. J. Hazard. Mater. 2009, 163, 121–126. [Google Scholar] [CrossRef] [PubMed]
  29. Zheng, W.; Guo, M.; Chow, T.; Bennett, D.N.; Rajagopalan, N. Sorption properties of greenwaste biochar for two triazine pesticides. J. Hazard. Mater. 2010, 181, 121–126. [Google Scholar] [CrossRef]
  30. Hu, R.; Huang, X.; Huang, J.; Li, Y.; Zhang, C.; Yin, Y.; Cui, F. Long-and short-term health effects of pesticide exposure: A cohort study from China. PLoS ONE 2015, 10, e0128766. [Google Scholar] [CrossRef]
  31. Saleh, T.A.; Gupta, V.K. Column with CNT/magnesium oxide composite for lead (II) removal from water. Environ. Sci. Pollut. Res. 2012, 19, 1224–1228. [Google Scholar] [CrossRef]
  32. Varjani, S.; Kumar, G.; Rene, E.R. Developments in biochar application for pesticide remediation: Current knowledge and future research directions. J. Environ. Manag. 2019, 232, 505–513. [Google Scholar] [CrossRef]
  33. Sotelo, J.L.; Rodríguez, A.; Álvarez, S.; García, J. Removal of caffeine and diclofenac on activated carbon in fixed bed column. Chem. Eng. Res. Des. 2012, 90, 967–974. [Google Scholar] [CrossRef]
  34. Sotelo, J.L.; Ovejero, G.; Rodríguez, A.; Álvarez, S.; Galán, J.; García, J. Competitive adsorption studies of caffeine and diclofenac aqueous solutions by activated carbon. Chem. Eng. J. 2014, 240, 443–453. [Google Scholar] [CrossRef]
  35. Mohammad, S.G.; Ahmed, S.M. Preparation of environmentally friendly activated carbon for removal of pesticide from aqueous media. Int. J. Ind. Chem. 2017, 8, 121–132. [Google Scholar] [CrossRef]
  36. Mandal, A.; Singh, N.; Purakayastha, T.J. Characterization of pesticide sorption behaviour of slow pyrolysis biochars as low cost adsorbent for atrazine and imidacloprid removal. Sci. Total Environ. 2017, 577, 376–385. [Google Scholar] [CrossRef] [PubMed]
  37. Chen, W.; Parette, R.; Zou, J.; Cannon, F.S.; Dempsey, B.A. Arsenic removal by iron-modified activated carbon. Water Res. 2007, 41, 1851–1858. [Google Scholar] [CrossRef] [PubMed]
  38. Qian, L.; Chen, B. Dual role of biochars as adsorbents for aluminum: The effects of oxygen-containing organic components and the scattering of silicate particles. Environ. Sci. Technol. 2013, 47, 8759–8768. [Google Scholar] [CrossRef]
  39. Jusoh, A.; Lam, S.S.; Hartini, W.J.H.; Ali, N.A. Removal of pesticide in agricultural runoff using granular-activated carbon: A simulation study using a fixed-bed column approach. Desalin. Water Treat. 2014, 52, 861–866. [Google Scholar] [CrossRef]
  40. Bahrami, M.; Amiri, M.J.; Beigzadeh, B. Adsorption of 2, 4-dichlorophenoxyacetic acid using rice husk biochar, granular activated carbon, and multi-walled carbon nanotubes in a fixed bed column system. Water Sci. Technol. 2018, 78, 1812–1821. [Google Scholar] [CrossRef]
  41. Yahaya, N.K.E.M.; Abustan, I.; Latiff, M.F.P.M.; Bello, O.S.; Ahmad, M.A. Fixed-bed column study for Cu (II) removal from aqueous solutions using rice husk based activated carbon. Int. J. Eng. Technol. 2011, 11, 248–252. [Google Scholar]
  42. Ahmad, A.A.; Hameed, B.H. Fixed-bed adsorption of reactive azo dye onto granular activated carbon prepared from waste. J. Hazard. Mater. 2010, 175, 298–303. [Google Scholar] [CrossRef]
  43. Baral, S.S.; Das, N.; Ramulu, T.S.; Sahoo, S.K.; Das, S.N.; Chaudhury, G.R. Removal of Cr (VI) by thermally activated weed Salvinia cucullata in a fixed-bed column. J. Hazard. Mater. 2009, 161, 1427–1435. [Google Scholar] [CrossRef]
  44. Calero, M.; Hernáinz, F.; Blázquez, G.; Tenorio, G.; Martín-Lara, M.A. Study of Cr (III) biosorption in a fixed-bed column. J. Hazard. Mater. 2009, 171, 886–893. [Google Scholar] [CrossRef] [PubMed]
  45. AOAC. Official Methods of Analysis, 17th ed.; Association of Official Analytical Chemists: Arlington, VA, USA, 2000. [Google Scholar]
  46. Tansel, B.; Nagarajan, P. SEM study of phenolphthalein adsorption on granular activated carbon. Adv. Environ. Res. 2004, 8, 411–415. [Google Scholar] [CrossRef]
  47. Wang, Y.; Tao, Z.; Wu, B.; Xu, J.; Huo, C.; Li, K.; Chen, H.; Yang, Y.; Li, Y. Effect of metal precursors on the performance of Pt/ZSM-22 catalysts for n-hexadecane hydroisomerization. J. Catal. 2015, 322, 1–13. [Google Scholar] [CrossRef]
  48. Kazemi, F.; Younesi, H.; Ghoreyshi, A.A.; Bahramifar, N.; Heidari, A. Thiol-incorporated activated carbon derived from fir wood sawdust as an efficient adsorbent for the removal of mercury ion: Batch and fixed bed column studies. Process Saf. Environ. Prot. 2016, 100, 22–35. [Google Scholar] [CrossRef]
  49. Puziy, A.M.; Poddubnaya, O.I.; Martınez-Alonso, A.; Suárez-Garcıa, F.; Tascón, J.M.D. Synthetic carbons activated with phosphoric acid: I. Surface chemistry and ion binding properties. Carbon 2002, 40, 1493–1505. [Google Scholar] [CrossRef]
  50. Jaouen, G.; Salmain, M. (Eds.) Bioorganometallic Chemistry: Applications in Drug Discovery, Biocatalysis, and Imaging; John Wiley & Sons: Hoboken, NJ, USA, 2015. [Google Scholar]
  51. Boag, N.M.; Haghgooie, H.; Hassanzadeh, A. Synthesis and dynamic NMR studies of Pt(η5-C5Me5)(CO){C(O)NR2} complexes. Spectrochim. Acta Part A Mol. Biomol. Spectrosc. 2008, 69, 156–159. [Google Scholar] [CrossRef]
  52. Paiva, T.C.; Sato, S.; Visconti, A.E.; Castro, L.A. Continuous alcoholic fermentation process in a tower reactor with recycling of flocculating yeast. Appl. Biochem. Biotechnol. 1996, 57, 535–541. [Google Scholar] [CrossRef]
  53. Kalyani, P.; Anitha, A. Refuse derived energy-tea derived boric acid activated carbon as an electrode material for electrochemical capacitors. Port. Electrochim. Acta 2013, 31, 165–174. [Google Scholar] [CrossRef]
  54. Kennedy, L.J.; Vijaya, J.J.; Kayalvizhi, K.; Sekaran, G. Adsorption of phenol from aqueous solutions using mesoporous carbon prepared by two-stage process. Chem. Eng. J. 2007, 132, 279–287. [Google Scholar] [CrossRef]
  55. Pechyen, C.; Atong, D.; Aht-Ong, D.; Sricharoenchaikul, V. Investigation of pyrolyzed chars from physic nut waste for the preparation of activated carbon. J. Solid Mech. Mater. Eng. 2007, 1, 498–507. [Google Scholar] [CrossRef]
  56. Takagi, H.; Maruyama, K.; Yoshizawa, N.; Yamadab, Y.; Sato, Y. XRD analysis of carbon stacking structure in coal during heat treatment. J. Fuel 2004, 83, 2427–2433. [Google Scholar] [CrossRef]
  57. Amiri, M.J.; Abedi-Koupai, J.; Eslamian, S. Adsorption of Hg (II) and Pb (II) ions by nanoscale zero valent iron supported on ostrich bone ash in a fixed-bed column system. Water Sci. Technol. 2017, 76, 671–682. [Google Scholar] [CrossRef] [PubMed]
  58. Bayat, M.; Alighardashi, A.; Sadeghasadi, A. Fixed-bed column and batch reactors performance in removal of diazinon pesticide from aqueous solutions by using walnut shell-modified activated carbon. Environ. Technol. Innov. 2018, 12, 148–159. [Google Scholar] [CrossRef]
  59. Auta, M.; Hameed, B.H. Chitosan–clay composite as highly effective and low-cost adsorbent for batch and fixed-bed adsorption of methylene blue. Chem. Eng. J. 2014, 237, 352–361. [Google Scholar] [CrossRef]
  60. Bhaumik, M.; Setshedi, K.; Maity, A.; Onyango, M.S. Chromium (VI) removal from water using fixed bed column of polypyrrole/Fe3O4 nanocomposite. Sep. Purif. Technol. 2013, 110, 11–19. [Google Scholar] [CrossRef]
  61. Amiri, M.J.; Abedi-Koupai, J.; Jafar Jalali, S.M.; Mousavi, S.F. Modeling of fixed-bed column system of Hg (II) ions on ostrich bone ash/nZVI composite by artificial neural network. J. Environ. Eng. 2017, 143, 04017061. [Google Scholar] [CrossRef]
  62. Xu, L.; Wang, S.; Zhou, J.; Deng, H.; Frost, R.L. Column adsorption of 2-naphthol from aqueous solution using carbon nanotube-based composite adsorbent. Chem. Eng. J. 2018, 335, 450–457. [Google Scholar] [CrossRef]
  63. Khajeh Amiri, M.; Ghaemi, A.; Arjomandi, H. Experimental, Kinetics and Isotherm Modeling of Carbon Dioxide Adsorption with 13X Zeolite in a fixed bed column. Iran. J. Chem. Eng. 2019, 16, 54–64. [Google Scholar]
  64. Omitola, O.B.; Abonyi, M.N.; Akpomie, K.G.; Dawodu, F.A. Adams-Bohart, Yoon-Nelson, and Thomas modeling of the fix-bed continuous column adsorption of amoxicillin onto silver nanoparticle-maize leaf composite. Appl. Water Sci. 2022, 12, 94. [Google Scholar] [CrossRef]
  65. Nazari, G.; Abolghasemi, H.; Esmaieli, M.; Pouya, E.S. Aqueous phase adsorption of cephalexin by walnut shell-based activated carbon: A fixed-bed column study. Appl. Surf. Sci. 2016, 375, 144–153. [Google Scholar] [CrossRef]
Figure 1. Experimental fixed-bed column system.
Water 14 02937 g001
Figure 2. Fourier-transform infrared (FTIR) spectra of AC (a) and BCH (b).
Water 14 02937 g002aWater 14 02937 g002b
Figure 3. The surface of AC and BCH using Scanning Electron Micrograph of AC and BCH: (a) AC before adsorption, (b) AC after adsorption, (c) BCH before adsorption, (d) BCH after adsorption.
Water 14 02937 g003
Figure 4. X-ray diffraction curve of AC and BCH.
Water 14 02937 g004
Figure 5. Breakthrough curves of pesticides on AC and BCH at bed height of 10 cm (constant flow rate of 0.5 mL min−1, pH of 7, and initial influent concentration of 12 µg/L−1).
Water 14 02937 g005
Figure 6. Breakthrough curves of pesticides on AC and BCH at bed height of 15 cm (constant flow rate of 0.5 mL min−1, pH of 7, and initial concentration of 12 µg/L−1).
Water 14 02937 g006
Figure 7. Breakthrough curves of pesticides on BCH and AC at initial concentrations of 50 µg L−1 with constant bed height of 5 cm, flow rate of 0.5 mL min−1, and pH of 7.
Water 14 02937 g007
Figure 8. Breakthrough curves of pesticides on BCH and AC at initial concentration of 75 µg/L−1 with constant bed height of 5 cm, flow rate of 0.5 mL min−1, and pH of 7.
Water 14 02937 g008
Figure 9. Breakthrough curves of pesticides on BCH and AC at flow rate of 0.5 mL min−1 (initial concentrations of 12 µg L−1 with constant bed height of 5 cm and pH of 7).
Water 14 02937 g009
Figure 10. Breakthrough curves of pesticides on AC and BCH at flow rate of 1 mL min−1 (initial concentrations of 12 µg L−1 with constant bed height of 5 cm and pH of 7).
Water 14 02937 g010
Figure 11. Breakthrough curves of pesticides on AC and BCH at flow rate of 1.5 mL min−1 (initial concentrations of 12 µg L−1 with constant bed height of 5 cm and pH of 7).
Water 14 02937 g011
Table 1. Physical properties of AC and BCH.
Sr. No.PropertiesACBCH
1Bulk density34.4 kg cm−30.42 g cm−3
2Particle size250 µm250 µm
3Solid Density2.0–2.1 g cm−31.66 g cm−3
5Pore volume1.39 nm0.03–0.02 nm
5Surface area4.25 m2 g−12000 m2 g−1
6Water holding capacity67.3%274.1%
Table 2. Constants of the Thomas model for AC and BCH.
Thomas Model
AC BCH
AdsorbateFRkThq0R2kThq0R2
Atrazine0.50.0000510.879120.94270.0001115.87810.9637
1.00.00017130.83520.92530.0001127.01540.9148
1.50.00030165.03120.94140.0002127.82690.9748
Chlorothalanil0.56.67 × 10−537.846200.95880.0001112.84620.9628
1.00.0001141.670300.97520.0001118.19410.9518
1.50.0001742.285710.97830.000288.293960.9544
β-endosulfan0.55.83 × 10−50.7912090.93530.000995.853150.9389
1.00.0001321.913000.98370.0001107.43360.9464
1.50.0001633.317310.90890.0035223.10440.9617
α-endosulfan0.55.83 × 10−510.879120.95830.000967.976780.9389
1.00.0001112.381000.95980.000281.377620.9986
1.50.0001830.272730.9135 0.0004109.69780.9175
Table 3. Constants of Yoon–Nelson model for AC and BCH (Q = flow rate).
AC BCH
AdsorbateQKYNτR2KYNτR2
Atrazine0.50.0012022.30.99210.00191066.3680.9977
10.003558.780.98890.0039539.64100.9873
1.50.006371.200.97610.0064349.25000.9621
Chlorothalanil0.50.001930.610.95510.0021996.52380.9892
10.003501.570.93630.0047490.51060.9665
1.50.005332.000.88360.0065323.33850.9431
β-endosulfan 0.50.0010.00110.99450.0022922.81820.9961
10.003439.720.97410.0052457.09620.9712
1.50.006254.120.95520.0073287.97260.9505
α-endosulfan 0.50.001766.70590.99120.0024873.8750.9894
10.003395.16670.98320.0045460.64440.9662
1.50.006220.54550.96910.0086217.66280.9856
Table 4. Comparison of obtained results with literature data.
Obtained ResultsDiscussion
FTIRAromatic rings were formed due to the carbonization of ACPuziy et al. [49] reported the same results
SEMAdsorbents show smaller cavities and morphologically large surface areaN/A
XRDThe adsorbents indicates the presence of unlabeled carbon peaksThese results were in good agreement with the data obtained by Kalyania and Anithab [53]
Impact of bed height (BH)Adsorption of pesticides was improved and the time of breakthrough was shifted away from the origin with the increase in bed heightsRelevant results were also achieved by Amiri et al. [57], Bahrami et al. [40], Bayat et al. [58] who described that adsorption of pesticides and BT time increases with the rise in height of column bed.
Impact of initial concentration (Ci)Breakthrough time shows decrease for both AC and BCH adsorbents when initial concentration of the pesticides increasesThe obtained results were in good agreement with Pradhan et al. [6], Bhaumik et al. [60], and Raiman et al. [8], who reported that the increase in inlet concentration resulted in the decrease in pesticides adsorption
Impact of Flow Rate (Q)At lower flow rates, the exhaust time and breakthrough were increasedSimilar results were obtained by Raiman et al. [8] who reported that an increase in the flow rate resulted in a decrease in pesticides’ adsorption
Thomas modelExperimental data obtained were best fitted to Thomas’ model due to the higher R2 (0.9986) valueBharami et al. [40] obtained the same results
Yoon–Nelson ModelAccording to higher R2 values (0.9977), illustrate Yoon–Nelson model validity for this studyRelevant results were also given by Bayat et al. [58]
Publisher’s Note: MDPI stays neutral with regard to jurisdictional claims in published maps and institutional affiliations.

