Article

Pore Size in the Removal of Phosphorus and Nitrogen from Poultry Slaughterhouse Wastewater Using Polymeric Nanofiltration Membranes

by
Timoth Mkilima
1,
Tursynkul Bazarbayeva
2,
Kydyrbekova Assel
3,*,
Nurgul Nurkenovna Nurmukhanbetova
4,
Idiya Bolatovna Ostretsova
4,
Aina Sultanseitovna Khamitova
5,
Saule Makhanova
4 and
Samal Sergazina
4
1
Department of Civil Engineering, Faculty of Architecture and Construction, L.N. Gumilyov Eurasian National University, Nur-Sultan 010000, Kazakhstan
2
Department of Geography and Environmental Sciences, UNESCO Chair for Sustainable Development, Al-Farabi Kazakh National University, Almaty 050040, Kazakhstan
3
Department of Management, Faculty of Economics, L.N. Gumilyov Eurasian National University, Satpayev Street 2, Nur-Sultan 010000, Kazakhstan
4
Department of Chemistry and Biotechnology, Faculty of Natural Sciences, Sh. Ualikhanov Kokshetau University, Kokshetau 020000, Kazakhstan
5
Department of Biology, Faculty of Natural Sciences, Pedagogical Institute, Sh. Ualikhanov Kokshetau University, Kokshetau 020000, Kazakhstan
*
Author to whom correspondence should be addressed.
Water 2022, 14(18), 2929; https://doi.org/10.3390/w14182929
Submission received: 1 September 2022 / Revised: 12 September 2022 / Accepted: 16 September 2022 / Published: 19 September 2022
(This article belongs to the Section Wastewater Treatment and Reuse)

Abstract

:
Nutrients (nitrogen and phosphorus) are among the water quality parameters that cannot be easily removed from wastewater. Unfortunately, the excessive accumulation of nutrients in water can lead to numerous health issues for humans and the environment in general (including aquatic life). This study looked into the potential use of polymeric nanofiltration membranes to remove total phosphorus, ammonia, nitrate, and nitrite from poultry slaughterhouse wastewater. The wastewater samples were subjected to three different treatment systems determined by pore sizes (0.4, 0.6, and 0.8 nm) as well as an integrated system composed of ultrafiltration and nanofiltration as the main units. The results of the study showed that pore size can significantly affect a nanofiltration system’s overall performance for removing nutrients from poultry slaughterhouse wastewater. The phenomenon was supported by the analysis of variance (ANOVA) results, which showed that the treated effluent’s concentrations of the investigated water quality parameters at different pore sizes produced p-values that were less than 0.01 (statistically significant). According to the results of the removal efficiency analysis, the combination of ammonia and a 0.8 nm pore size demonstrated the lowest removal efficiency, with a removal rate of around 54.57%. However, the combination of nitrate and a 0.4 nm pore size showed the best removal efficiency of about 90.5%. On the other hand, the integrated treatment was observed to be highly effective in the removal of the investigated parameters with a removal efficiency ranging from 97.8 to 99.71%. The study’s findings offer useful information about the potential use of nanofiltration treatment systems for wastewater from poultry slaughterhouses.

Graphical Abstract

1. Introduction

Nutrients are among the most challenging pollutants in receiving water bodies around the world [1]. Production activities, such as those involved in poultry slaughterhouse processes, generate highly polluted wastewater with high levels of contaminants including nutrients in the form of phosphorous and nitrogen. Eutrophication is a typical example of the challenges faced due to the excessive accumulation of nutrients in water bodies [2]. The phenomena can have a considerable impact on navigational activities in a water body. A good example is Lake Victoria in Tanzania [3], whereby, the discharge of wastewater into the lake has led to the overstimulated growth of water hyacinth.
Additionally, increased aquatic plant growth can result in oxygen depletion and light interception in a water body, affecting aquatic life [4]. Therefore, the treatment of wastewater with a potential nutrient is of great importance before any sort of discharge into a water body. Different forms of nitrogen can be found in water, including nitrite–nitrogen [5], nitrate–nitrogen [6], ammonia [7], and ammonium [8]. In drinking water, the excessive consumption of nitrate can be associated with several health issues, especially in infants, that include the potential for the development of serious difficulties in transporting oxygen within the bloodstream, leading to methemoglobinemia or blue baby syndrome [9,10,11]. Also, phosphorous in water can be present in different forms including white phosphorus, red phosphorus, and black phosphorus [12]. All these forms of nutrients should be properly analyzed and reduced to acceptable levels before being subjected to a water system.
Moreover, the removal of nutrients from poultry slaughterhouse wastewater can be achieved using physical [13,14,15], chemical [16,17], and biological (natural) [18] treatment technologies. Typical examples of physical wastewater treatment systems are filtration methods such as membrane filtration [19] (microfiltration, ultrafiltration, nanofiltration, and reverse osmosis) and adsorption. Typical examples of chemical-based wastewater treatment approaches are electrochemical [20] and photochemical methods [21]. Typical examples of biological (natural) treatment systems are waste stabilization ponds (anaerobic, facultative, and maturation) [22], activated sludge systems [23], trickling filters [24], phytoremediation, and aerated lagoons [25].
Unfortunately, some particular strengths and flaws can be found in each of the wastewater treatment methods discussed above. For example, physical and biological treatment methods can be very flexible to a range of wastewater compositions with little to no risk of by-product formation [26,27]. However, biological methods, in particular, require vast areas, generate a lot of sludge, and are generally slow [26]. The majority of the contaminants found in wastewater are typically removed using physical treatment techniques, particularly membrane filtration [28]. As an illustration, reverse osmosis can remove practically all of the wastewater’s contaminants including the minerals (regardless of whether they are good or harmful) [29]. To force the wastewater through the membrane filter, however, the systems need high pressure, which in turn, necessitates adequate and reliable energy sources [30]. On the other hand, although it is well known that chemical-based treatment methods, such as electrochemical systems, are extremely durable and compact, most of them also need energy to run and have the potential to produce by-products when wastewater pollutants react with the chemicals used for the treatment [31].
However, nanofiltration treatment systems have recently been gaining more attention in the field of wastewater treatment. Although reverse osmosis and nanofiltration have similar fundamental processes, they are each unique due to their unique features and applications. The distinction between nanofiltration (another ion-rejecting membrane technology) and reverse osmosis is that nanofiltration has a higher flux rate at low pressures. This results in fewer membrane components being needed and a reduced pump pressure (measured in pounds per square inch, or bars), which lowers operating expenses. Moreover, nanofiltration works well for applications that do not require a feed stream fully free of dissolved particles, whereas reverse osmosis removes almost all the dissolved substances in water.
It should be emphasized that wastewater from poultry slaughterhouses is one of the most severely polluted types of wastewater [32,33,34], necessitating a highly effective and efficient treatment technique to achieve high removal efficiency. For instance, it has already been found that certain types of nitrogen from the effluent from poultry slaughterhouses are extremely resistant to treatment [16,35]. As a result, it is crucial to research various treatment options under various operational scenarios.
It is also important to note that because a weakness in one unit can be fixed by another, integrating many therapy units into one system can be advantageous in some circumstances [36,37]. However, how effectively these systems function in terms of eliminating contaminants depends largely on the properties of the wastewater to be treated and the type of treatment approach used. Unfortunately, there is currently a lack of sufficient information regarding the effectiveness of nanofiltration in terms of removing nutrients from poultry slaughterhouse wastewater.
The removal of nutrients from poultry slaughterhouse effluent using a nanofiltration treatment system as the main plant unit with different pore sizes is explored in this work. Three different polymeric nanofilters with pore diameters of 0.4, 0.6, and 0.8 nm are used to purify the wastewater samples collected from the poultry slaughterhouse. The Izevski poultry farm in the Republic of Kazakhstan’s Izhevsk hamlet provided the wastewater samples used in this analysis. The investigation covers a total of four nutrient parameters: total phosphorus, ammonia, nitrate, and nitrites. For each session of the experiments, 1.7 L of wastewater is used.

2. Materials and Methods

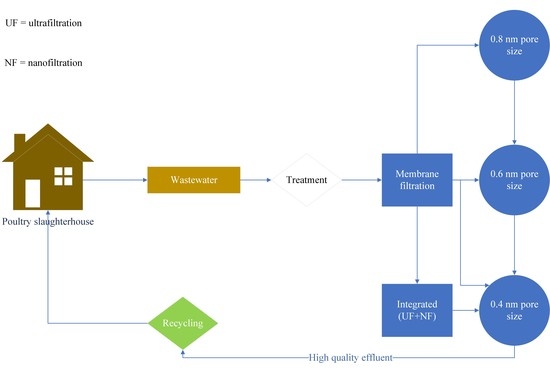
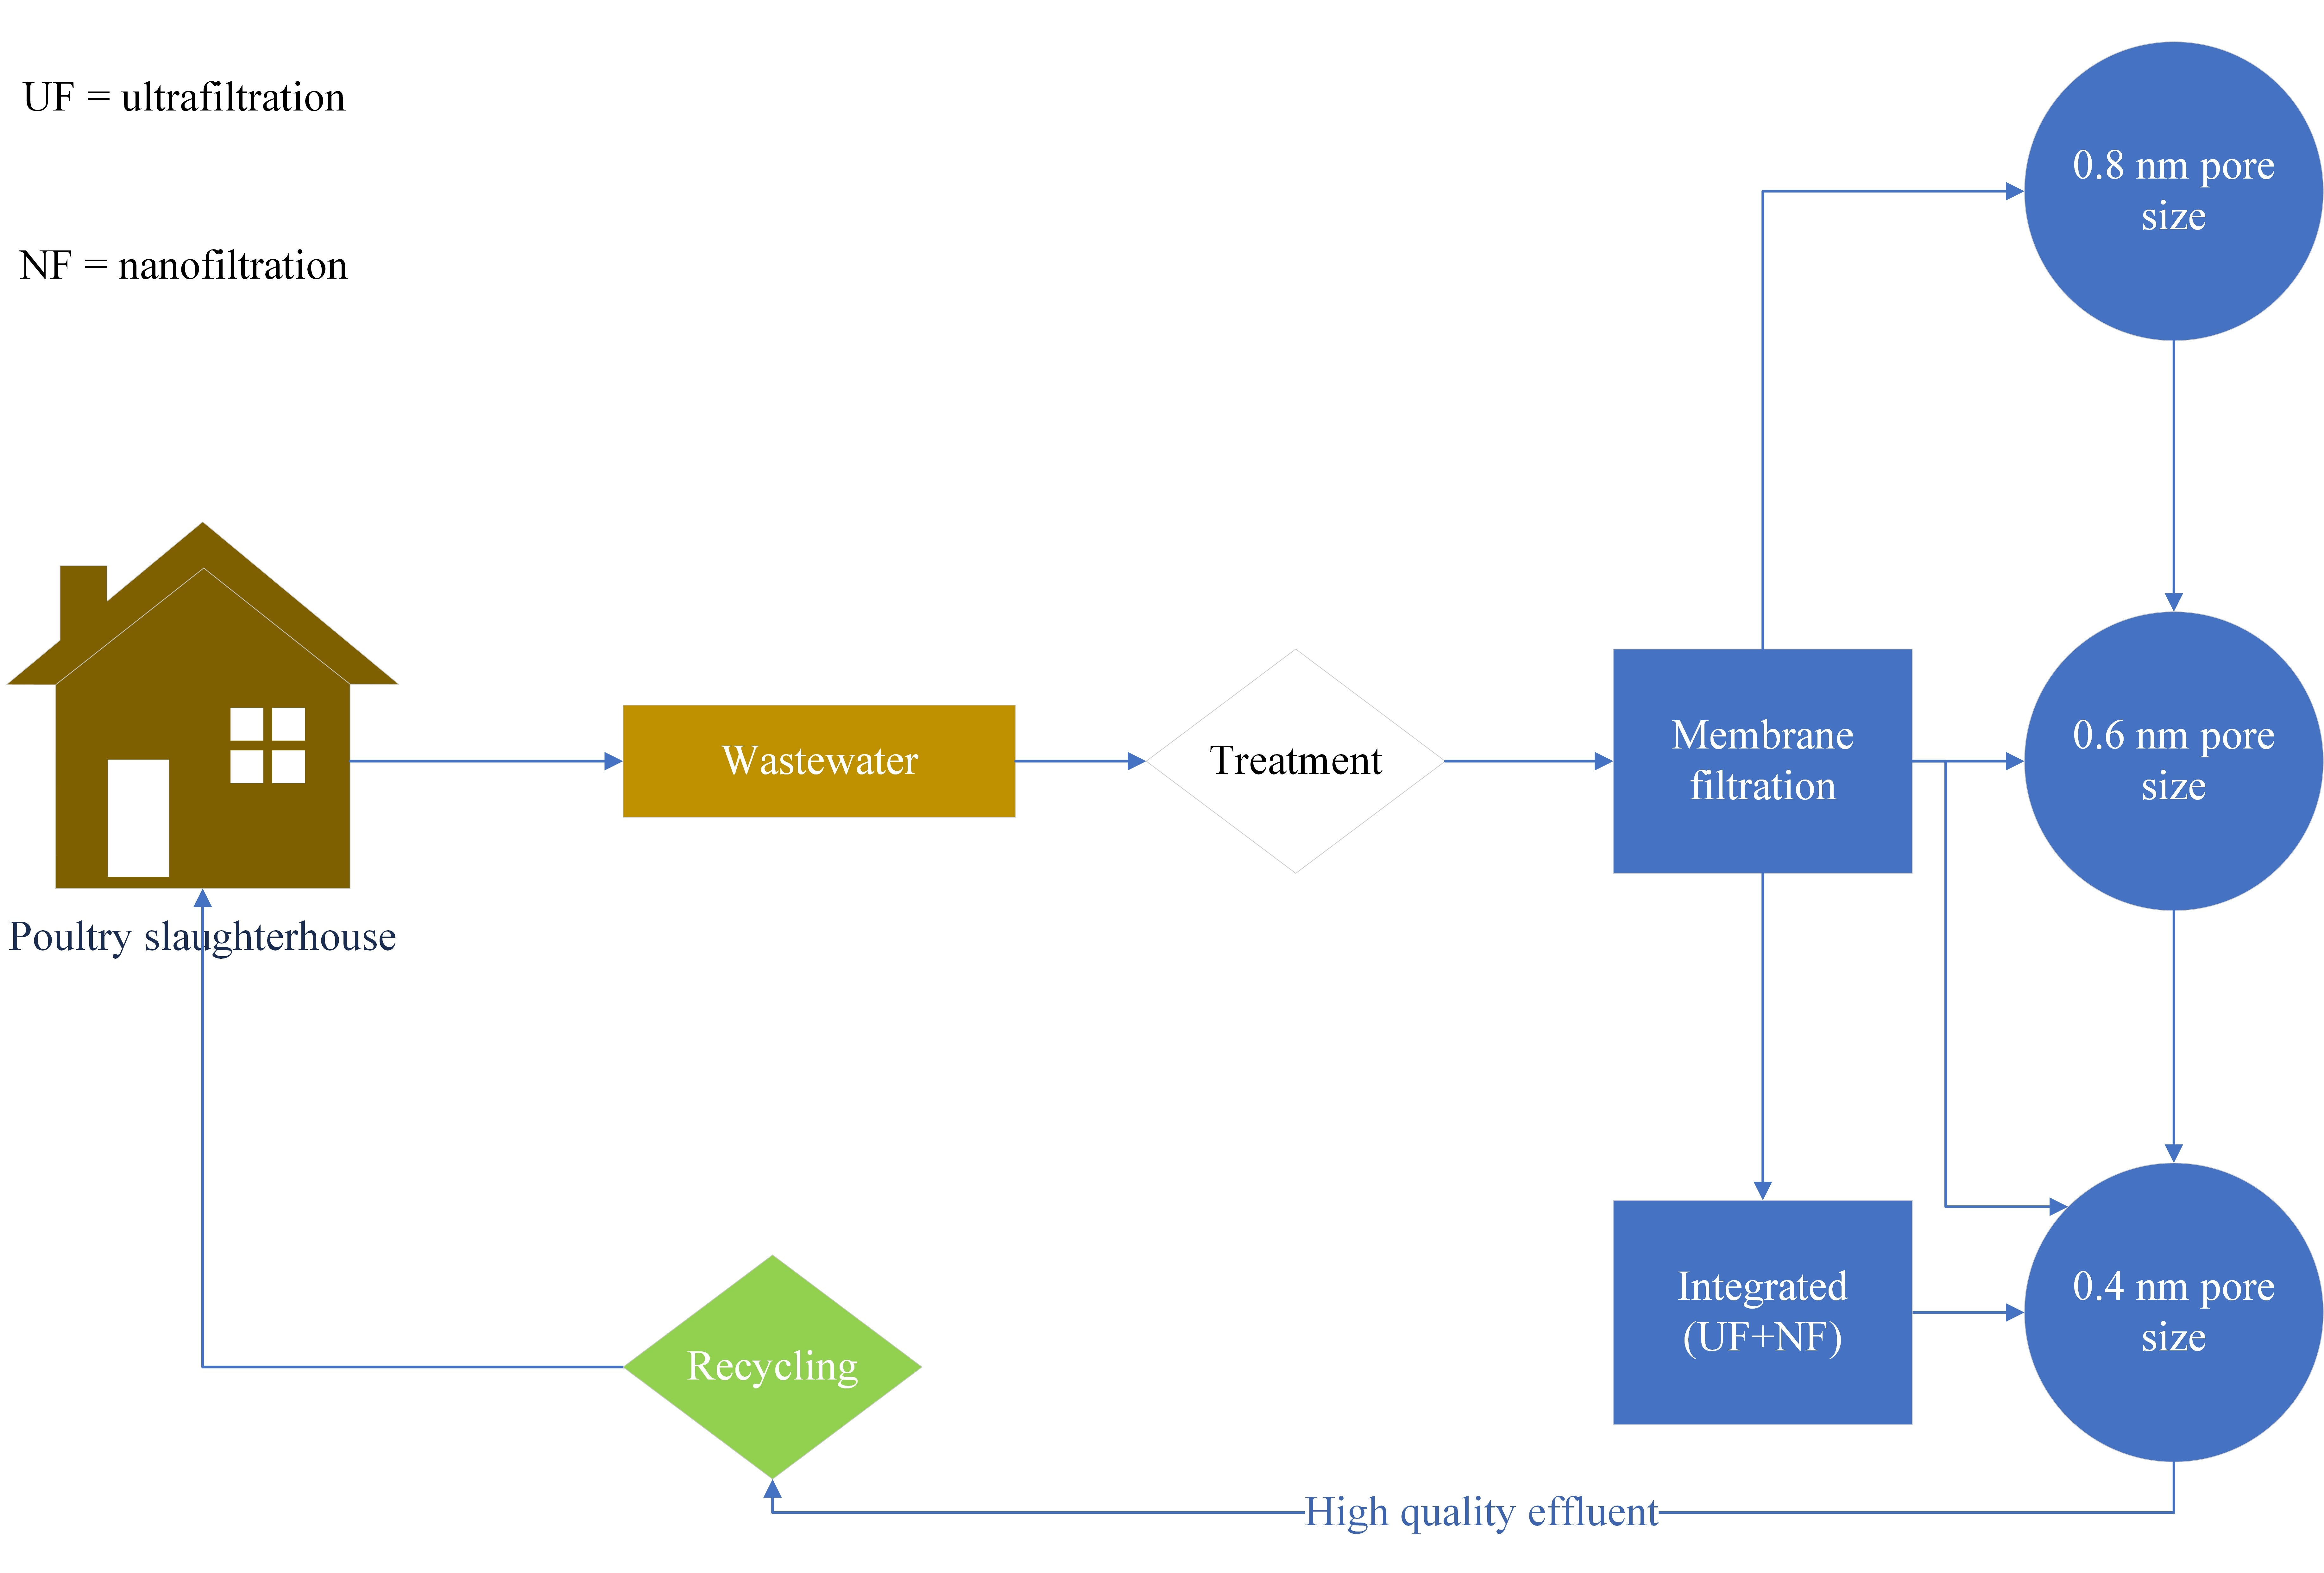
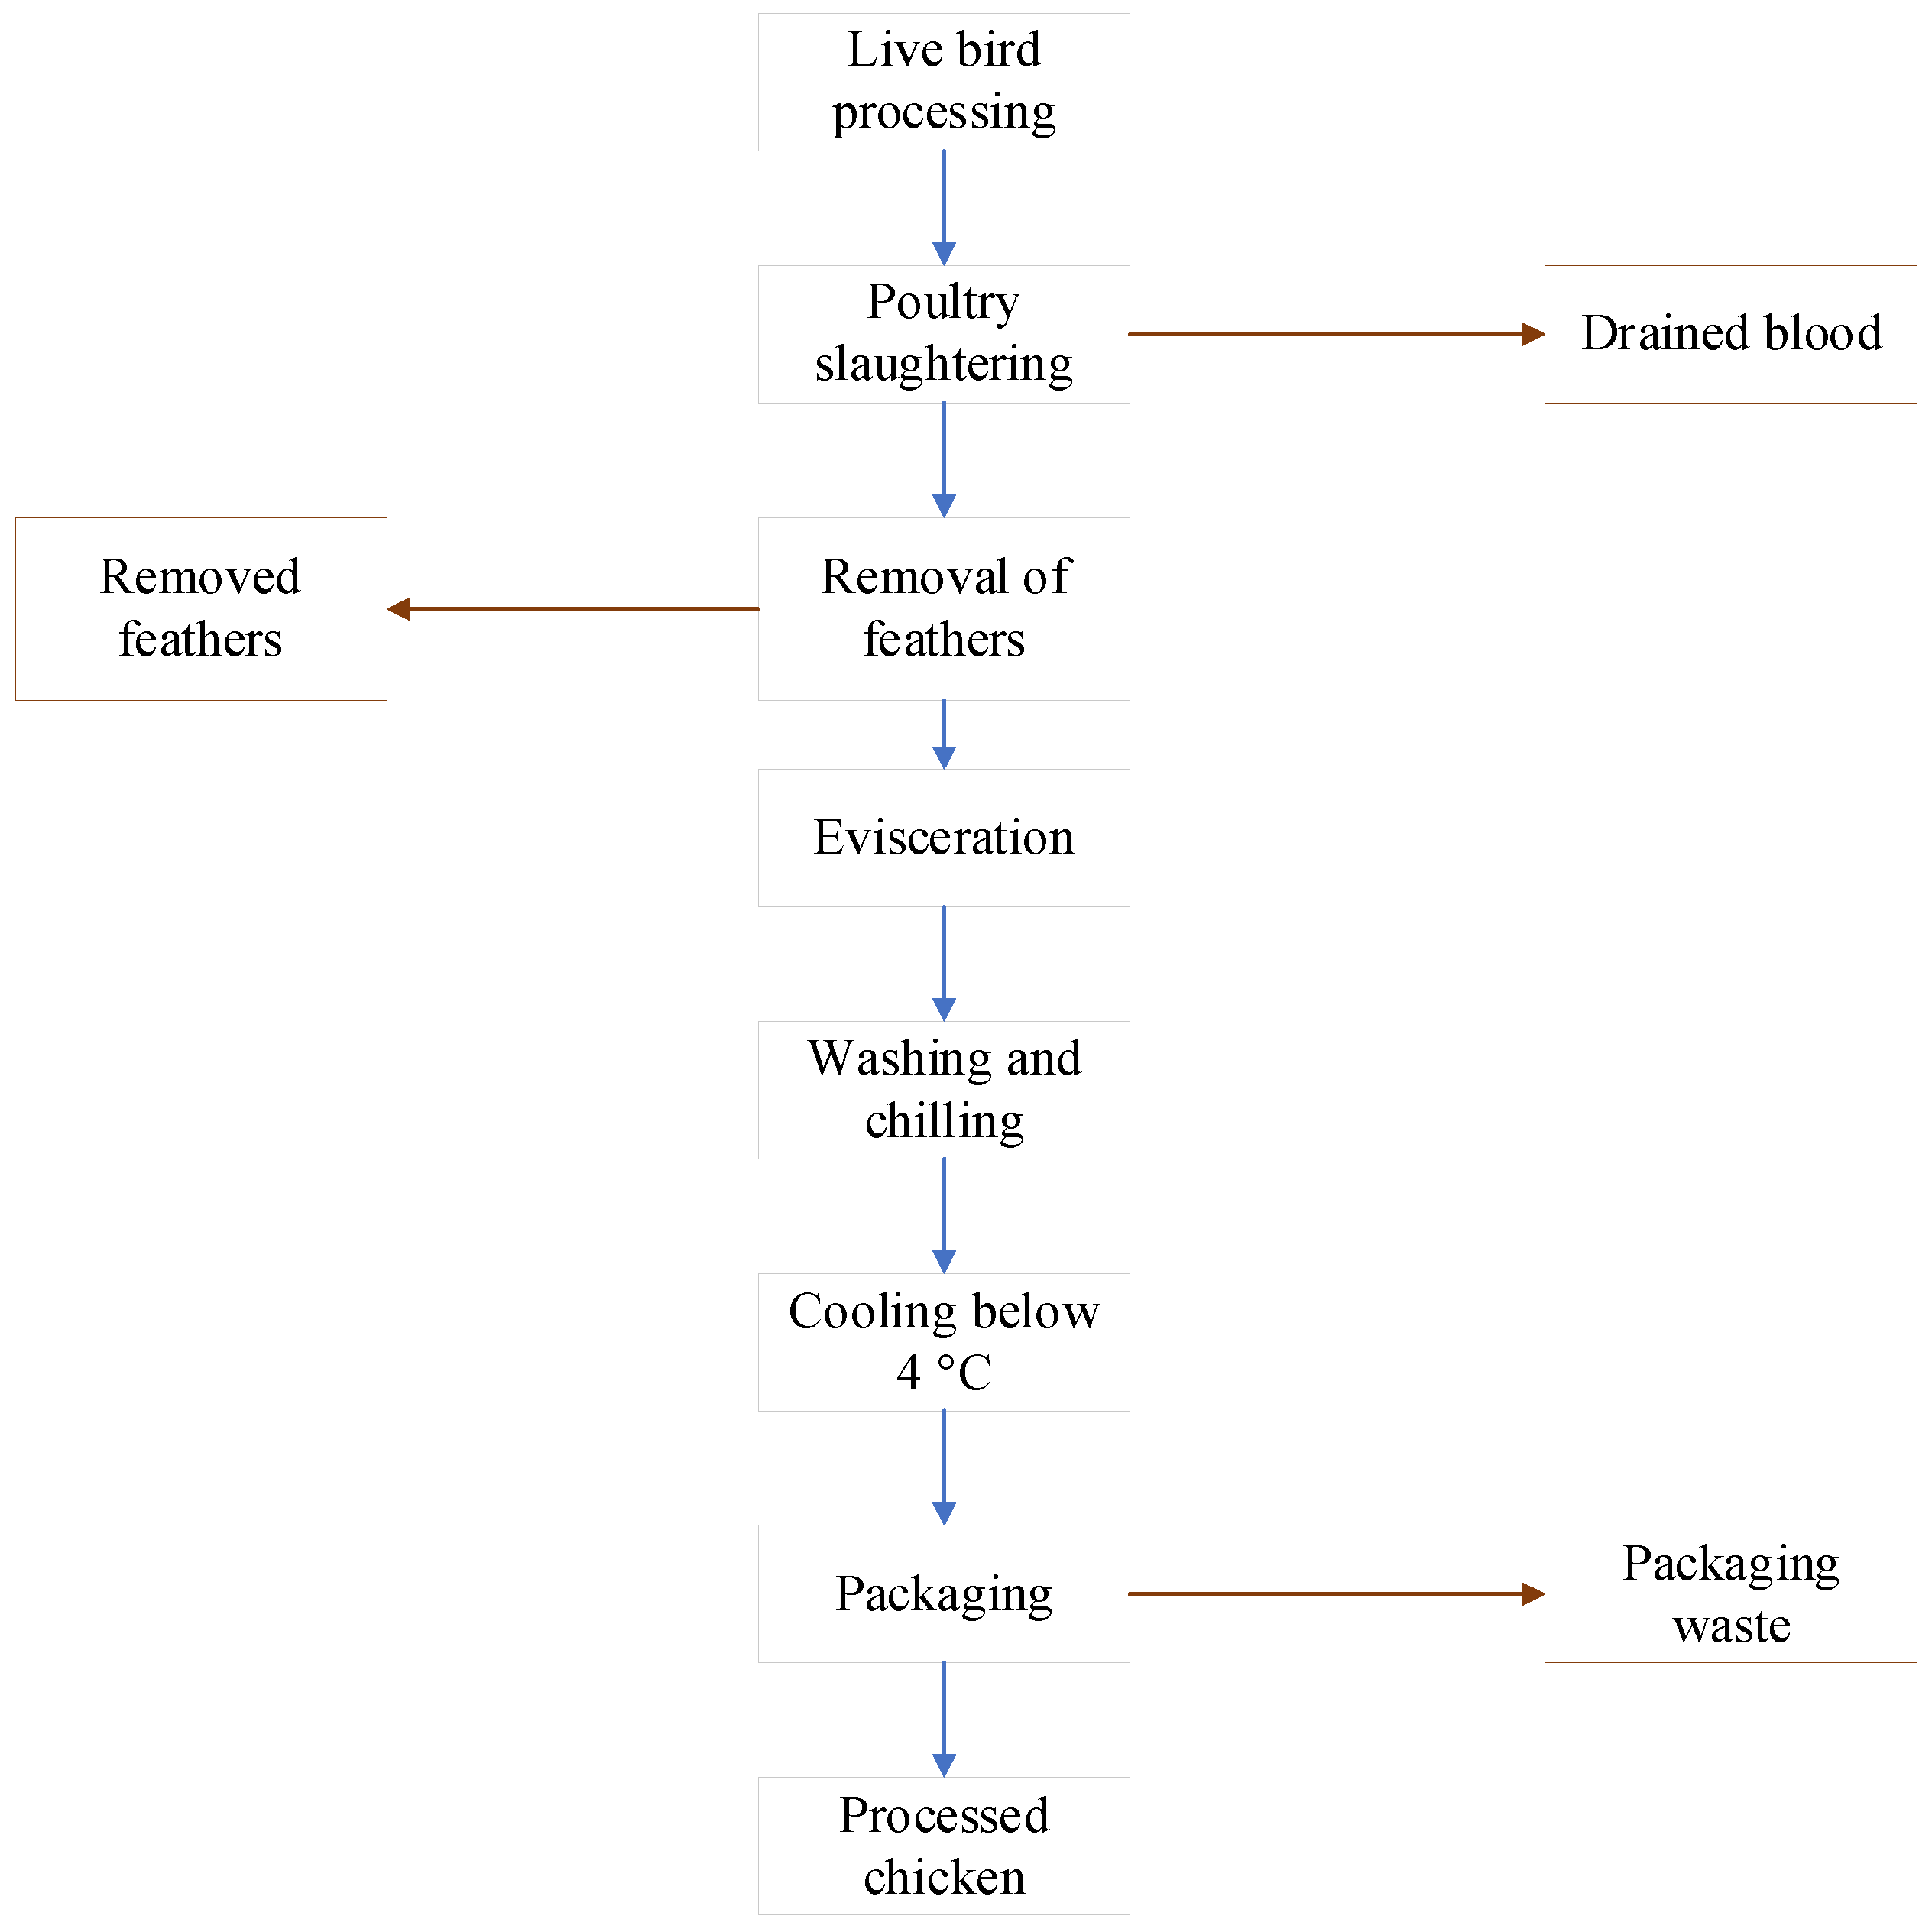
2.1. Case Study Description, Sampling, Wastewater Characteristics, and Analytical Methods

The Izevski Production Corporate, one of Central Asia’s largest poultry farms, producing more than 280 million eggs annually, is located in the village of Izhevsk in Kazakhstan, about 70 km from the capital city of Nur-Sultan (51°10′ North latitude and 71°26′ East longitude). The raw wastewater samples were collected there using the discrete sampling method. Figure 1 shows the primary production processes in the poultry slaughterhouse.
Plastic bottles each with a capacity of 5 L were used to collect the samples. Before exposing the collection bottles to the wastewater samples, they were thoroughly washed. Replication of the samples was also carried out in order to statistically assess the variation of data in the gathered samples and guarantee a high degree of data quality. In order to keep the wastewater in its natural state before treatment and analysis in the lab, sample preservation was another crucial component of the study. This was accomplished by keeping the wastewater samples at 4 °C. Additionally, on the day that the samples were collected, all of the samples were treated and examined; this was done to prevent any reactions in the wastewater that could change its natural state over time. Before subjecting the wastewater to the nanofiltration system, the wastewater samples were first subjected to mechanical filters (approximately 20 nm) to remove large, suspended particles.
As previously highlighted, this study investigated a total of four nutrient parameters: total phosphorus, ammonia, nitrate, and nitrites. A spectrophotometer (Hach DR3900, HACH/LANGE, Berlin, Germany) was utilized together with high-quality reagents and proper test kits, which were supplied by the Hach Company (Loveland, CO, USA) [38]. Total phosphorus was examined using the 4500-Nor APHA (APHA, Washington, DC, USA). Table 1 lists the characteristics of raw wastewater.

2.2. Experimental Setup and Procedures

Measurements of the membrane surface’s contact angle, made with a Goniometer CAM 101 (KSV Instruments Ltd., Helsinki, Finland), were used to determine the hydrophobicity of the surface. The measurements were conducted using the sessile drop technique. An average value was computed after more than six measurements of each contact angle. Both clean and contaminated membranes were used for all contact angle measurements. Through analysis of membrane fouling using measures of contact angles, a membrane surface change was identified. Material is more hydrophobic if the contact angle is bigger. Using a JEOL/JSM-6335F-INCA (Jeol, Tokyo, Japan) apparatus with an accelerating voltage of 10.0 kV, a scanning electron microscope was used to observe the membrane fouling on the pores of the membranes [39].
The general technical information of the nanofiltration treatment system is summarized in Table 2. Apart from the individual treatment systems covered by different nanofiltration pore sizes, the study also investigated the potential integration of ultrafiltration and nanofiltration for poultry slaughterhouse wastewater treatment. The integrated treatment system was mainly composed of ultrafiltration and nanofiltration (0.4 nm pore size). The pre-treatment unit covered by ultrafiltration was characterized by a pore size of 0.008 μm or 8 nm. Additionally, the ultrafiltration’s transboundary pressure varied from 3.5 to 4 bars, its pump supply voltage was 24 V, and its power ranged from 200 to 400 W. The integrated treatment system was mainly composed of ultrafiltration.

2.3. Statistical Methods

Minimum and maximum concentration values from the series of data were computed with the help of Microsoft Excel 2019’s in-built functions. Some other statistical parameters, such as arithmetic mean, standard deviation, and percent removal efficiencies, were also computed.

2.3.1. Relationship among Parameters

Moreover, correlation coefficients were extracted from the computed matrices based on the potential relationships among the studied water quality parameters of interest (total phosphorous, ammonia, nitrate, and nitrites). The general definitions of the correlation coefficients are as follows:
  • From 0 to 0.29: Regarded as a weak relationship
  • From 0.3 to 0.49: Defined as moderately related parameters
  • From 0.5 to 0.69: Defines a strong relationship
  • From 0.7 to 1: Defined as a very strong relationship

2.3.2. Data Distribution Analysis

Data distribution analysis is an important aspect of water quality-related investigations; this helps to obtain a clearer picture of the levels of pollution in wastewater. In this study, box and whisker plots were used to summarize the extent of the data distribution and unsymmetry among the nutrients investigated. This approach is also highly useful for identifying whether the data series contains potential unusual observations (outliers). Also, the box and whisker plots were useful in visually comparing the quality before and after the treatment processes.

2.3.3. Removal Efficiency Computations

Treatment efficiencies (in terms of percentage) from raw wastewater and the purified water analysis results were calculated as summarized in Equation (1).
T e ( % ) = ( C b C a C b ) × 100
Whereby; T e , treatment efficiency, C b , concentration before treatment, and C a , concentration after treatment.

2.3.4. Percent Compliance Computations

The percent compliance of the raw wastewater and treated effluent for the investigated nutrients based on drinking water quality guidelines was conducted using the guidelines set by the World Health Organization (WHO). These standards for drinking water quality were chosen because they provide the most accurate assessment of water quality. The approach used for the calculation of the percent compliance is based on Equation (2).
C p ( % ) = ( S i C i S i ) × 100
Whereby; C p , percent compliance, S i , the recommended standard for an ith parameter, C i , the concentration of the ith parameter.

2.3.5. Analysis of Variance (ANOVA)

The statistical significance of the differences between the two sets of data was examined using a single-factor analysis of variance (ANOVA). The levels of variance within each group were evaluated using the samples from each group in this method. To be more precise, the p-value and alpha (0.05) were combined to calculate the significance level. It should be emphasized that the probability that the null hypothesis will be rejected even if it is true is represented by the alpha value. The null hypothesis is accepted if the p-value is larger than the alpha value since it reflects the likelihood of achieving a result that is more extreme than the one received from the experiment.

2.3.6. Tukey’s HSD and Scheffé Multiple Comparison Tests

The study also employed the single-step multiple comparison procedures of Tukey’s HSD (honestly significant difference) and Scheffé multiple comparison tests. They were used to find methods that were considerably different from one another.

2.3.7. Flux Decline Computations

According to Darcy’s law [40], the permeate flux can be expressed as follows:
J = V A × T
where J = filtrate flux rate, A = membrane area, V = volume of filtrate generated, T = filtration or process time.
To calculate the percentage of flux reduction, the permeate fluxes were monitored three times. First, the flux of pure water was measured and the steady-state flux was designated as JP. Second, the amount of wastewater permeate flux was measured and quantified as JE at the end of the experiment. Finally, the pure water permeate flux with the fouled membrane was measured again until a stable permeate flux occurred and it was defined as JF.
The relative flux, RF, was defined as
RF   = × 100
The flux decline occurring during filtration was expressed as 100 − RF.
The flux recovery, FR, was defined as
FR   = × 100
In this instance, the (100 − FR) value represents the fouling-induced, irreversible flow reduction. Additionally, (FR − RF) represents the reversible flux drop brought on by the reversible adsorption phenomena or concentration polarization [39].

3. Results and Discussion

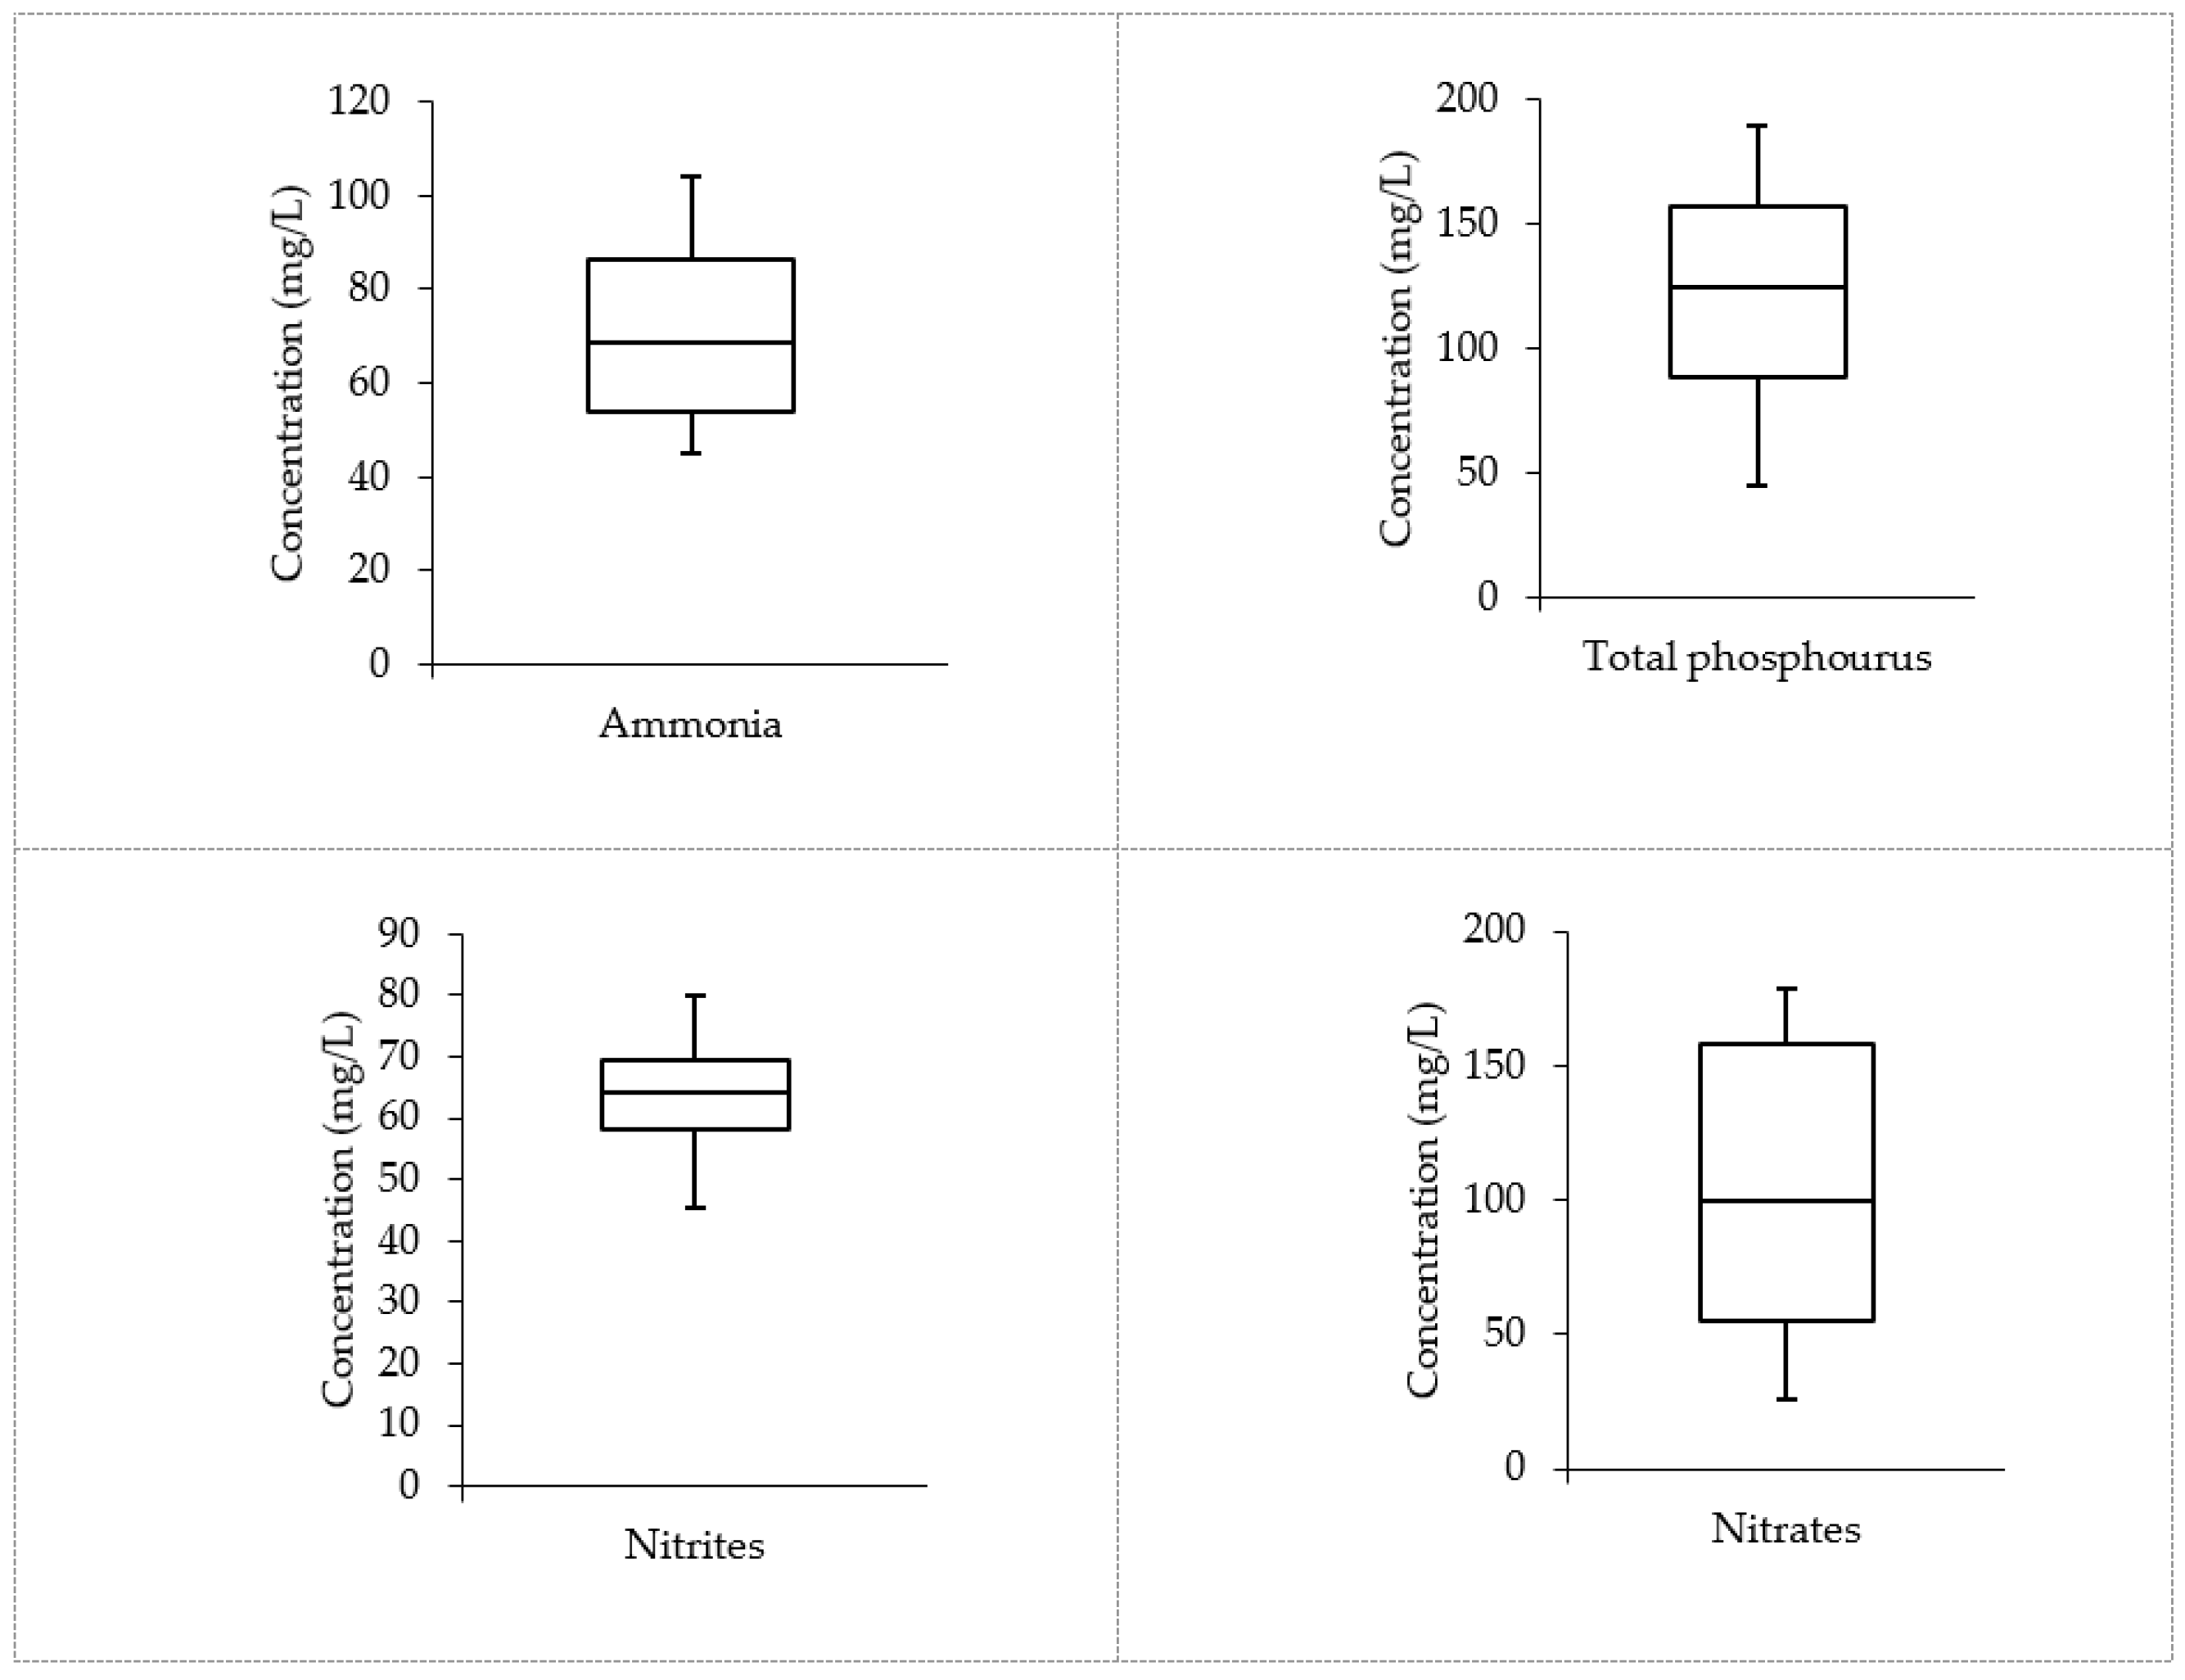
3.1. Wastewater Characterization

Analysis of the samples before (raw wastewater) and after treatment was successfully executed based on ammonia, total phosphorous, nitrites, and nitrate. An average concentration of 71.51 mg/L was recorded for ammonia in the raw wastewater, whereas 44.99 mg/L and 104 mg/L were the minimum and maximum recorded concentration values, respectively. It should be emphasized that no organization or research has expressly established evidence to show that ammonia consumption can be carcinogenic to humans at an average level. The World Health Organization (WHO) and the United States Environmental Protection Agency (US EPA) both regard the level of ammonia detected in drinking water to be of little concern to human health (with no significant or potential effect on drinking water) [41]. However, ammonia can be associated with adverse effects on human health if consumption and accumulation exceed the body’s capacity for self-detoxification. Apart from the human aspect, if a water body, such as a lake, pond, or river, is characterized by a relatively high concentration of ammonia, it becomes difficult for aquatic organisms to properly excrete the toxicant, whereby the toxic elements can accumulate in their bodies, especially in internal tissues and blood that would, in turn, lead to death and potential extinction [42,43].
For the total phosphorous, 45 mg/L was recorded as the minimum concentration value in the raw wastewater, 189.44 mg/L was recorded as the maximum concentration value, and 120.65 mg/L was the average concentration. The US EPA imposed phosphorus limitations in 1986, saying that phosphorus concentration levels in streams that do not drain into reservoirs should not exceed 0.1 mg/L. Additionally, streams that discharge into reservoirs should not surpass 0.05 mg/L and reservoirs should not exceed 0.024 mg/L [44].
The average nitrate concentration in the raw wastewater was 63.47 mg/L, with minimum and maximum concentration values of 45.3 mg/L and 80 mg/L, respectively. The minimum and maximum concentrations of nitrate were found to be 25.8 mg/L and 178.4 mg/L, respectively, whereas the average concentration was 103.41 mg/L.

3.2. Relationships among Parameters in the Raw Wastewater

To investigate the potential relationships among the studied water quality parameters, correlation indices were computed. Table 3 shows that the total phosphorous and ammonia in the raw wastewater were hardly correlated, with a correlation index of 0.13. Similarly, a relatively low correlation was observed between nitrites and phosphorus, with a correlation index of 0.41. However, “very high” concentrations were observed for nitrites and ammonia, with a correlation index of 0.94. In addition, a “very high” correlation index of 0.87 was observed between nitrates and ammonia. Similarly, a “very high” correlation index of 0.97 was observed between nitrates and nitrites.
In general, ammonia as a nutrient can be found in drinking water as a result of natural and anthropogenic activities. A typical example of anthropogenic activities leading to the introduction of ammonia in drinking water is the process of adding ammonia during secondary disinfection to form chloramines. The high relationship among ammonia, nitrites, and nitrates can be linked to the fact that they are all a product of nitrogen, whereas ammonia is the most reduced nitrogen form in wastewater; nitrite (NO2), and nitrate (NO3) are the most oxidized forms of nitrogen. Therefore, in the case of anaerobic conditions (absence of oxygen), the other two forms of nitrogen (nitrate and nitrites) are reduced, leading to ammonia.
Moreover, the very high correlation between ammonia, nitrites, and nitrates can be further explained based on their chemical compositions as well as their mode of production. From a chemical composition perspective, it is well known that nitrites are composed of one nitrogen atom and two oxygen atoms, whereas nitrates are composed of one nitrogen atom and one more oxygen atom than nitrites. From a production perspective, both nitrite and nitrate can be produced following a nitrification process achieved by nitrifying bacteria.
To be more precise, every single mole of ammonia in the nitrification process is equivalent to a single mole of nitrite. The bacteria that oxidize ammonia play a key role in the conversion of ammonia to nitrite, as shown in Equation (6), which results in the aforementioned phenomena [45].
NH 3 + O 2 NO 2 + 3 H + + 2 e
Using bacteria that can oxidize nitrites, oxidation occurs after the conversion of ammonia to nitrite, resulting in the conversion of nitrite to nitrate (Equation (7) [46].
NO 2 + H 2 O NO 3 + 2 H + + 2 e

3.3. Data Distribution in the Raw Wastewater

As previously mentioned, to assess the distribution of data of the studied parameters in the raw wastewater, box and whisker plots were developed. Figure 2 shows that the line defining the median of the ammonia box plot shifted slightly to the lower quartile (Q1) of the box plot; this means that the recorded concentration values of ammonia in the raw wastewater were composed of more high concentration values than low concentration values in the data series and this phenomenon is known as positive unsymmetry. However, despite the small shift, the general phenomenon shows that there was a significant balance between the lower concentration values and the higher concentration values. In the nitrite and total phosphorus box plots, the median lines shifted slightly toward the upper quartile (Q3), showing that the data distribution was negatively unsymmetrical. Moreover, nitrates exhibited a similar phenomenon to that seen in the ammonia box plot. In general, box plots are helpful because they offer a visual summary of the data, allowing researchers to recognize the mean values, dispersion of the data sets, and indicators of skewness [47].

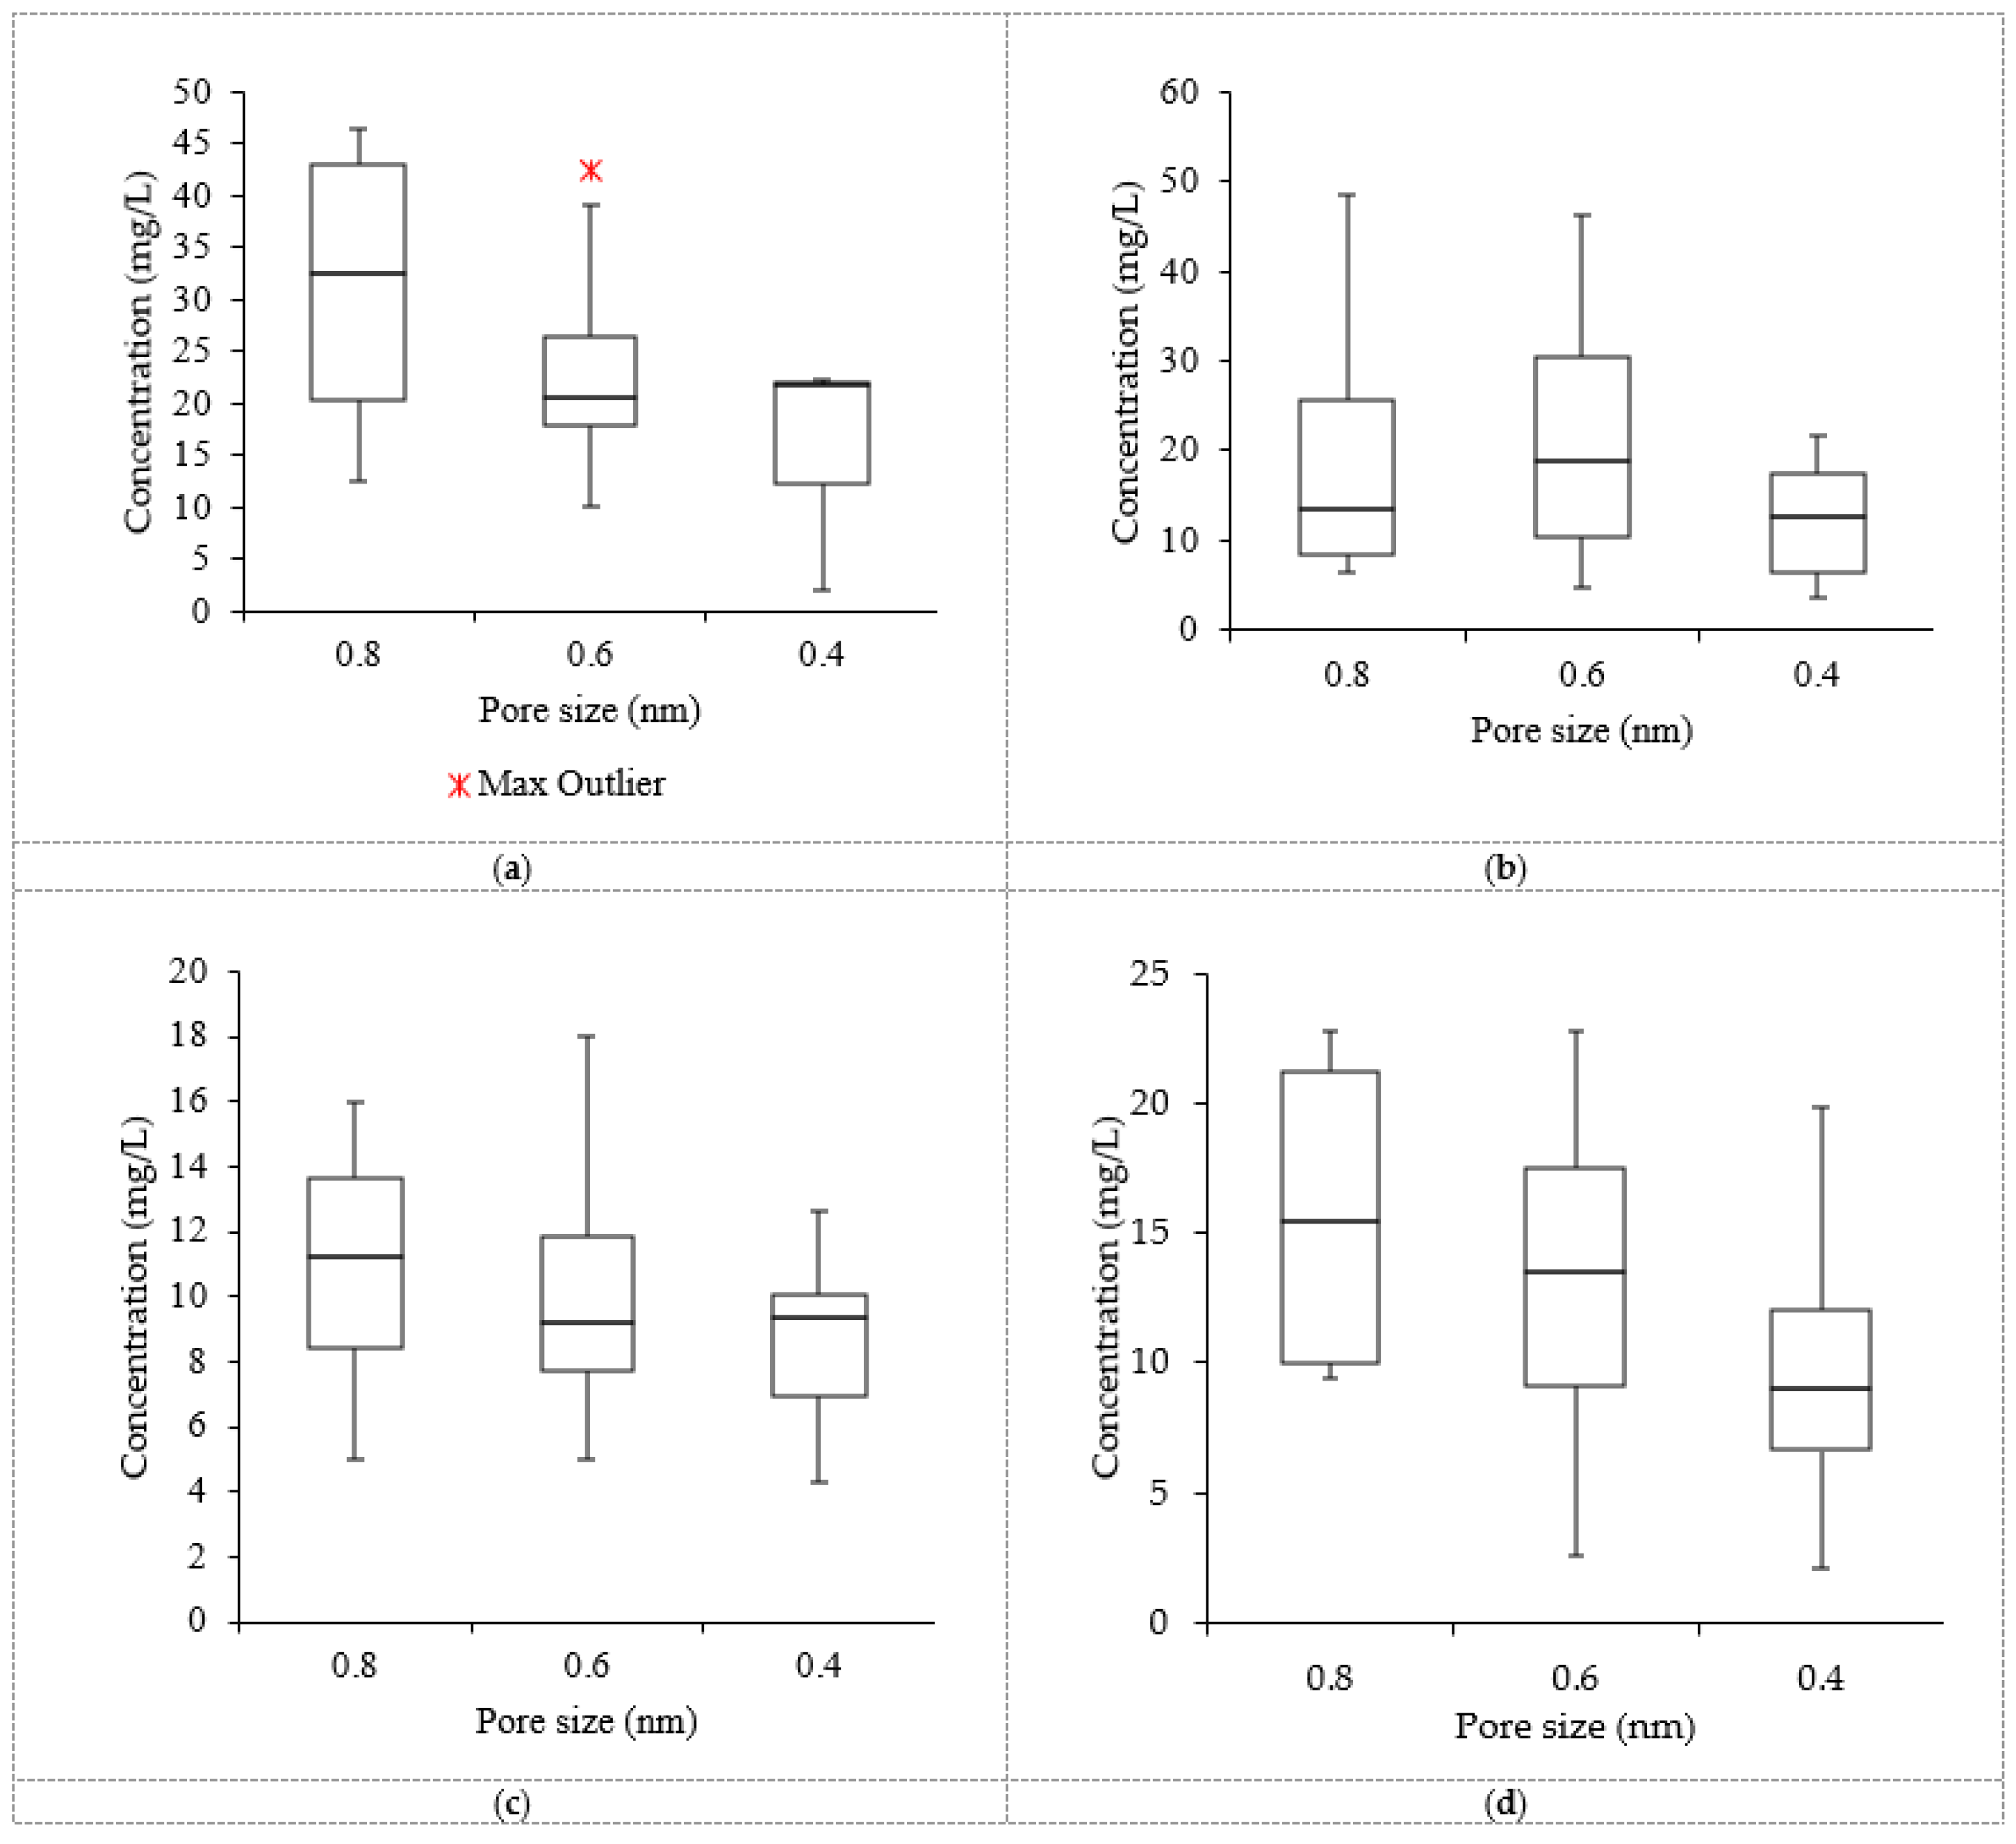
3.4. Data Distribution in the Treated Effluent Using Nanofiltration

Figure 3 shows that the medians in the ammonia box plot for the 0.4 nm pore size, the total phosphorus box plot for the 0.4 nm pore size, the nitrite box plots for the 0.8 nm and 0.4 nm pore sizes, and the nitrate box plot for the 0.6 nm pore size were relatively closer to the Q3, indicating that the distribution of data was negatively unsymmetrical. The phenomenon can be interpreted as a higher frequency of low concentration values was observed and recorded in comparison to the high recorded concentration values. The ammonia box plot for the 0.6 nm pore size, the total phosphorus box plot for the 0.8 nm pore size, the nitrite box plot for the 0.6 nm pore size, and the nitrate box plot for the 0.4 nm show size show that the medians were relatively closer to the Q1; this means that the recorded concentrations of the aforementioned nutrients were composed of more high concentration values than low concentration values. Likewise, such a phenomenon can be defined as positive skewness. In addition, the nitrate box plot for the 0.8 nm pore size shows median lines closer to the middle, indicating that the data distribution was symmetrical or normal (equally distributed data).

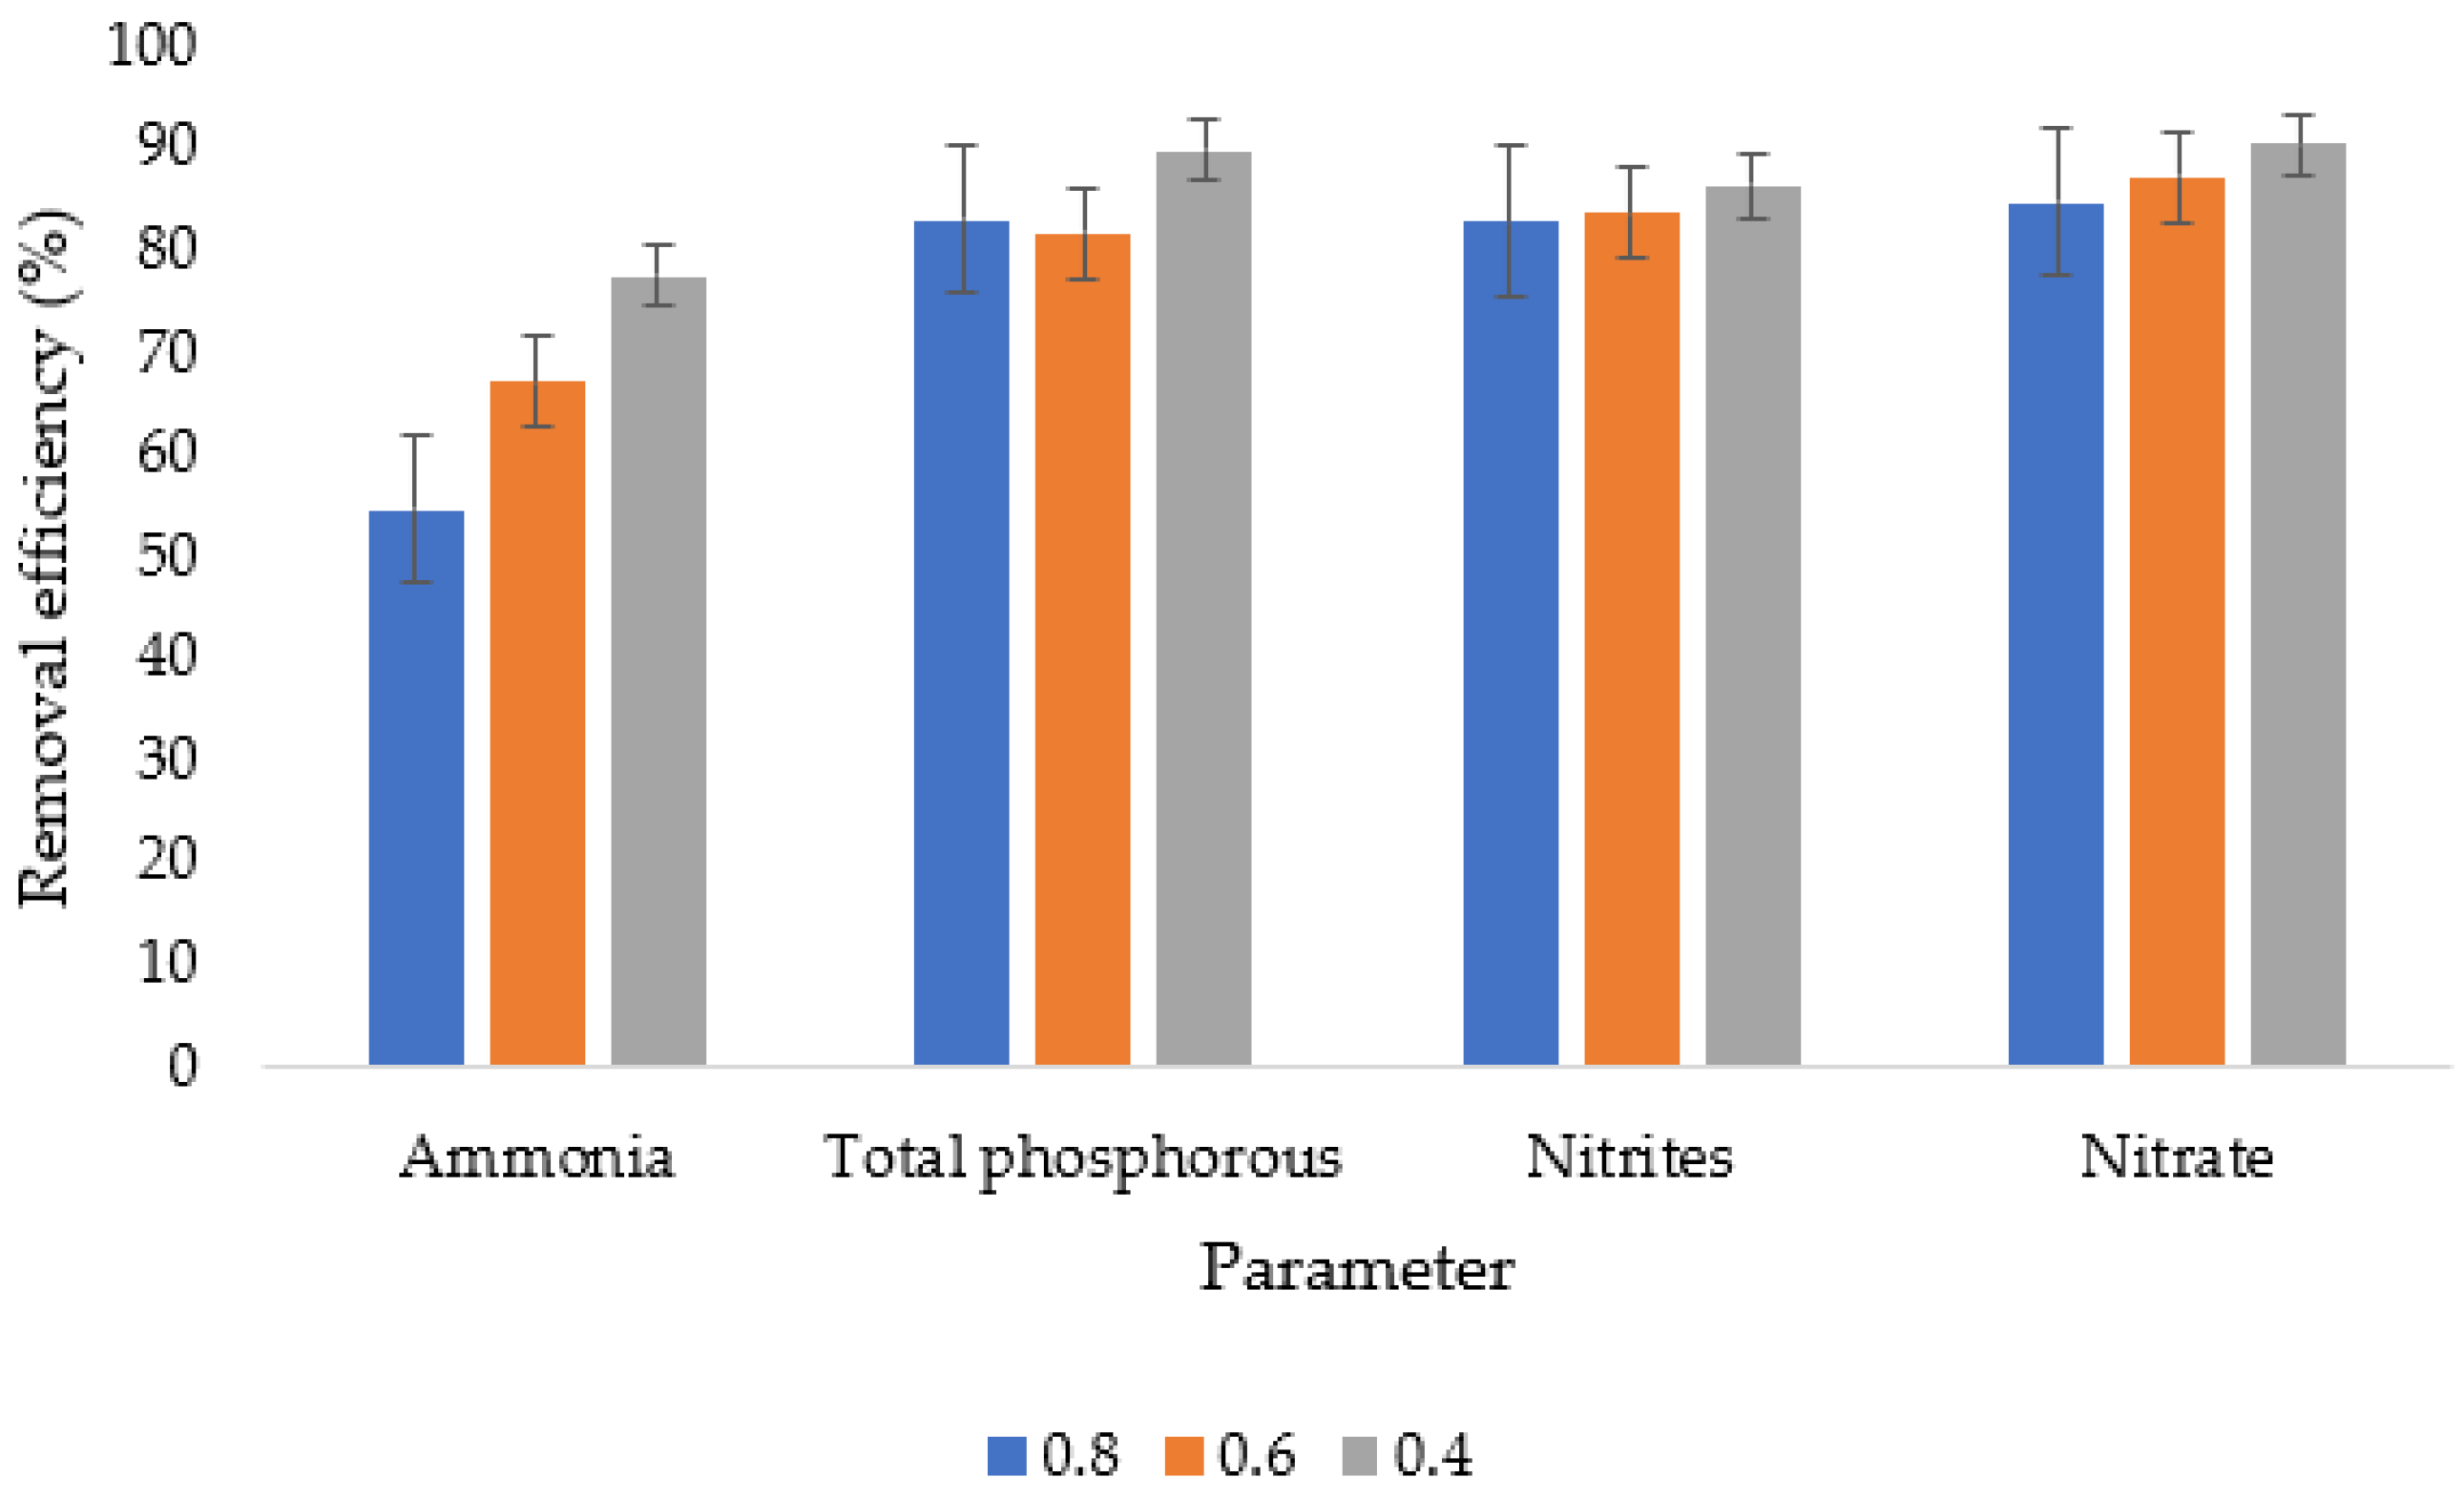
3.5. Removal Efficiencies from the Nanofiltration Systems

Figure 4 shows that the pore sizes and pollutants to be removed had a significant influence on the removal efficiency of the nanofiltration treatment approaches. The lowest removal efficiency was observed with the combination of ammonia and a 0.8 nm pore size, with an approximately 54.57% removal efficiency, whereas the highest removal efficiency was observed with the combination of nitrate and a 0.4 nm pore size, with an approximately 90.5% removal efficiency. In general, the removal efficiency of the investigated pore sizes ranged from 54.57% to 90.5% In the literature, it has been observed that, unlike reverse osmosis that removes approximately 98–99% of monovalent ions, a nanofiltration membrane typically removes 50% to 90% of monovalent ions [48,49].

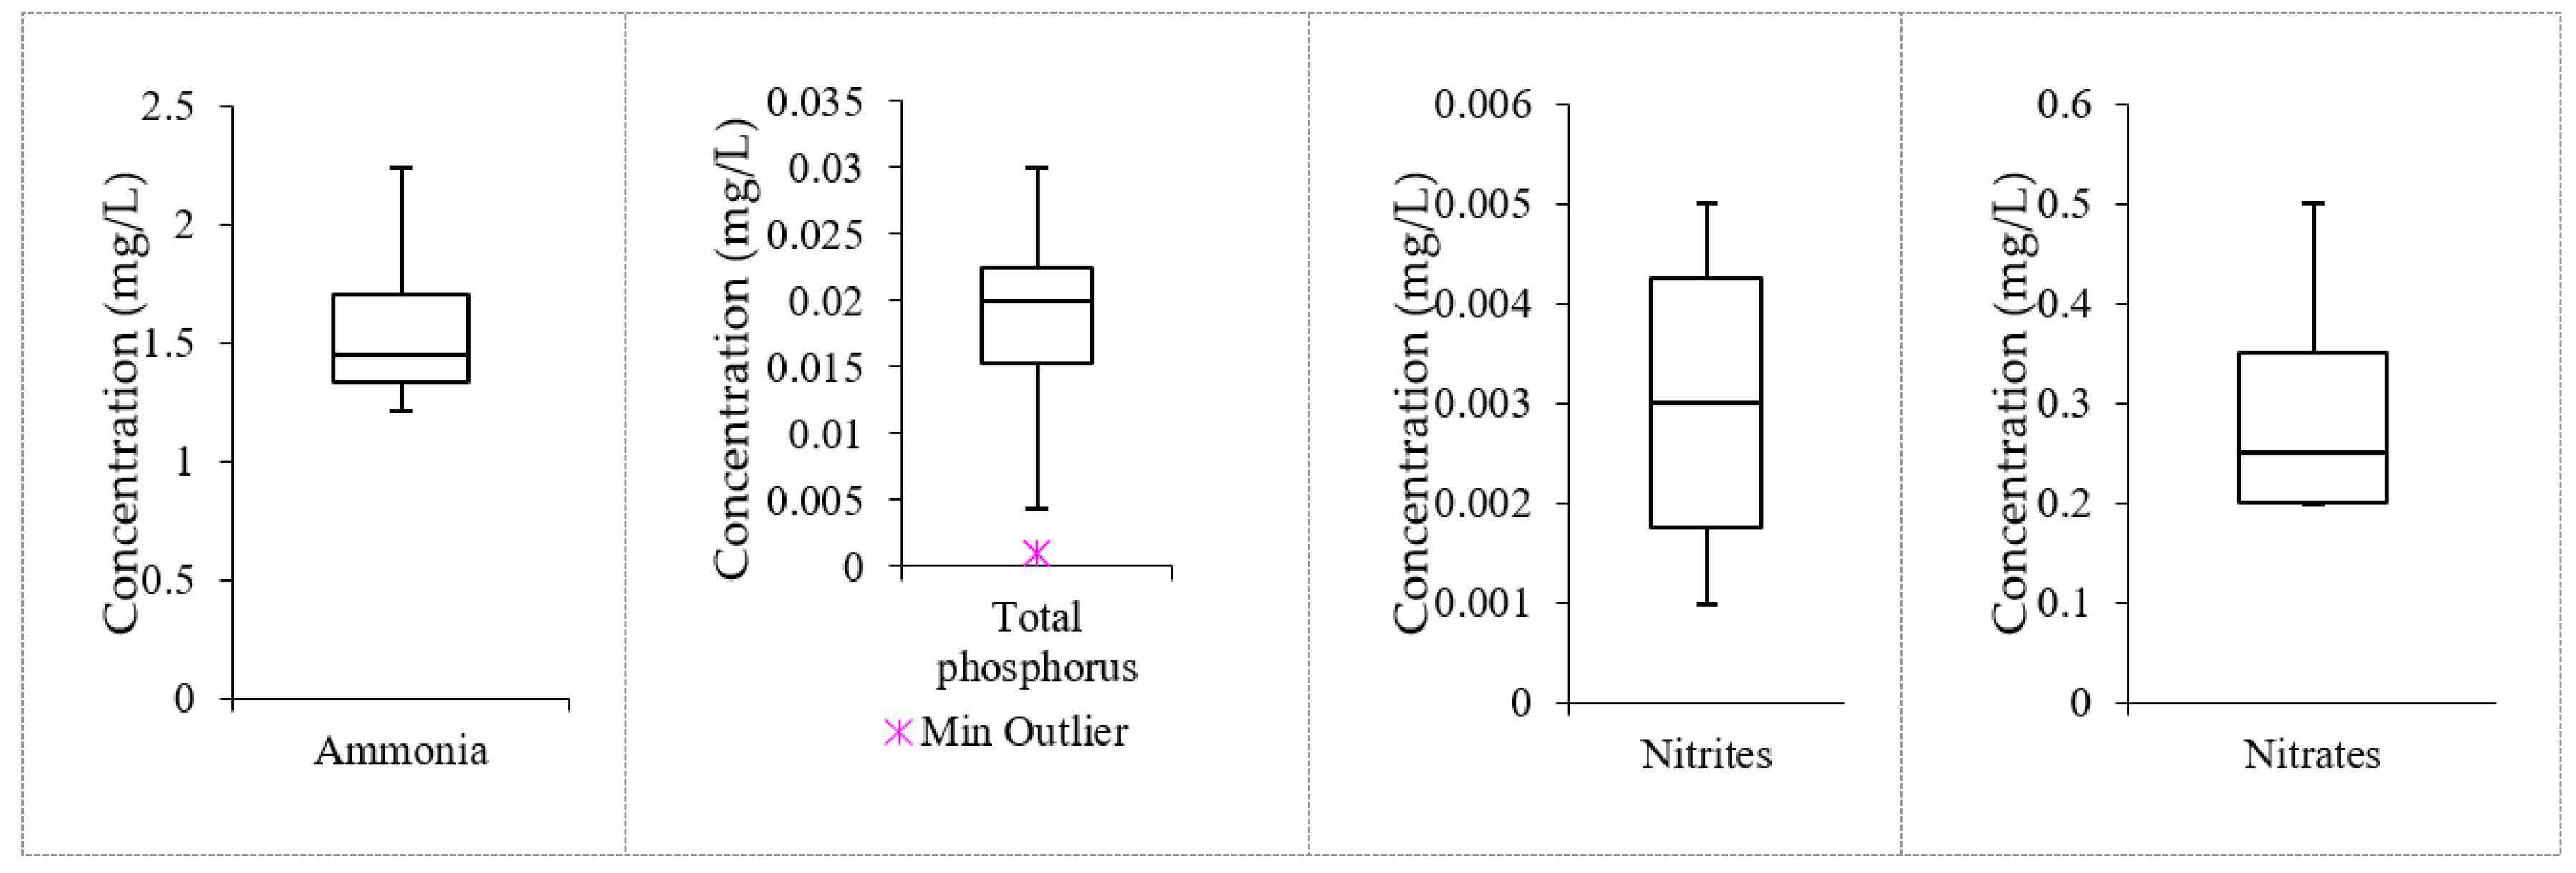
3.6. Data Distribution from Integrated Treatment System Effluent

Figure 5 shows that the medians for the ammonia and nitrate box plots were relatively closer to the Q1; this means that the recorded concentrations of the aforementioned nutrients were composed of more high concentration values than low concentration values. In the total phosphorus box plot, the median lines were closer to the Q3, indicating that the distribution of data was negatively unsymmetrical. This phenomenon can be interpreted from the analysis results as a higher frequency of low concentration values was observed and recorded in comparison to high concentration values, whereas the nitrite box plot had the median line closer to the middle, indicating that the data distribution was symmetric or normal (equally distributed).

3.7. Removal Efficiencies from the Integrated Treatment System

When the wastewater from the treated effluent (Table 4) was subjected to the integrated treatment approach, 1.21 mg/L was recorded as the minimum concentration and 2.24 mg/L as the maximum concentration, whereas 1.588 mg/L was recorded as the average concentration. In addition, 0.001 mg/L was recorded as the minimum concentration for total phosphorus and nitrites whereas 0.03 mg/L and 0.005 mg/L were recorded as the maximum concentration values for total phosphorus and nitrites, respectively. Moreover, 0.018 mg/L and 0.003 mg/L were recorded as the average concentrations for total phosphorus and nitrites, respectively. Also, an average concentration of 0.3 mg/L was recorded for nitrates, which is equivalent to a 99.7% removal efficiency. Figure 5 shows that the integrated treatment was highly effective in the removal of the nutrients with a removal efficiency ranging from 97.8 to 99.7%. From the results, we understand that pre-treatment can play a significant role in the performance of a membrane filtration system. According to a study conducted by Monnot et al. [50], in community-scale seawater reverse osmosis desalination plants, the influence of a novel pre-treatment system on process intensification and general performance was significant. It is worth highlighting that pre-treatment becomes useful because it reduces membrane fouling, scaling, and degradation and extends the effectiveness and lifespan of the membrane elements.

3.8. Percent Compliance

A summary of the percent compliance of the investigated parameters in the treated effluent and raw wastewater to the established water quality standards for the various pore sizes of the nanofiltration system is shown in Table 5. Based on the average concentrations in the final effluent after the wastewater was processed by the nanofiltration system alone, it can be seen that most water quality parameters did not comply with the recommended water quality standards for drinking water (negative values) with the exception of ammonia. Table 5 shows, however, that the combined treatment was quite successful in removing the bulk of the contaminants, with compliance rates ranging from 67.3% to 99.8%.

3.9. Analysis of Variance (ANOVA)

The single-factor analysis of variance was applied to the concentrations of ammonium, phosphates, nitrite, and nitrate in the treated effluent from each treatment system (as determined by the pore size). The summary of the p-values obtained by the ANOVA is shown in Table 6. Notably, the null hypothesis is that if there is no difference between the means, it is rejected when the p-value is less than 0.05, leading to the conclusion that there is a significant difference. The ammonium concentrations with the investigated pore sizes produced a p-value of 0.000138, which is less than 0.05 (alpha value), making the variations in concentrations statistically significant, as can be seen in Table 6. Phosphates, nitrites, and nitrate exhibited similar phenomena. We can further conclude from the ANOVA results that the system’s overall treatment performance can be significantly impacted by the nanofilter’s pore size. In the literature, when different pore sizes of monofilament woven filter cloth of monofilament made of polypropylene were used to treat high-strength food wastewater, an average COD removal higher than 80% and 70% for smaller pore sizes and larger pore sizes was achieved, respectively [51].

3.10. Tukey’s Honestly Significant Difference

Tukey’s honestly significant difference was used to further investigate the significance level of the mean differences in terms of the investigated parameters’ concentrations in the treated effluent. From Table 7, it can be seen that a significant difference (p < 0.01) was observed between the 0.8 nm vs. 0.4 nm, 0.8 nm vs. the integrated treatment system, 0.6 nm vs. 0.4 nm, and the 0.6 nm vs. the integrated treatment system, whereas insignificant differences were observed between the 0.8 nm vs. 0.6 nm and the 0.4 vs. the integrated treatment system. According to the findings, the difference in the ammonia content in the final effluent between one pore size and another decreased when the pore size of the nanofilter was increased. Similar to this, the concentration of ammonia in the treated effluent approached that of the integrated treatment system the more the nanofilter pore size was reduced.
Table 8 presents the Tukey’s HSD analysis results from the phosphate datasets, whereby a significant difference (p < 0.01) was observed for all the combinations, except for the 0.4 vs. the integrated treatment system. Similar to the phenomenon observed with ammonia, the concentration of phosphates in the treated effluent approached that of the integrated treatment system the more the nanofilter pore size was reduced.

3.11. Scheffé Multiple Comparison

The variations in the results were further investigated using the Scheffé multiple comparison analysis to examine the significance level of the mean differences in terms of the studied parameters’ concentrations in the treated effluent. From Table 9, it can be seen that a significant difference (p < 0.01) was observed between the 0.8 nm vs. 0.4 nm, 0.8 nm vs. the integrated treatment system, 0.6 nm vs. 0.4 nm, and the 0.6 nm vs. the integrated treatment system, whereas insignificant differences were observed between the 0.8 nm vs. 0.6 nm and the 0.4 vs. the integrated treatment system.
Table 10 presents the Scheffé multiple comparison analysis results from the phosphate datasets, whereby it can be seen that a significant difference (p < 0.01) was observed for all the combinations, except for the 0.4 vs. the integrated treatment system. Similar to the phenomenon with the ammonia, as the pore size of the nanofilter was reduced, the concentration of phosphates in the treated effluent approached that of the integrated treatment system.

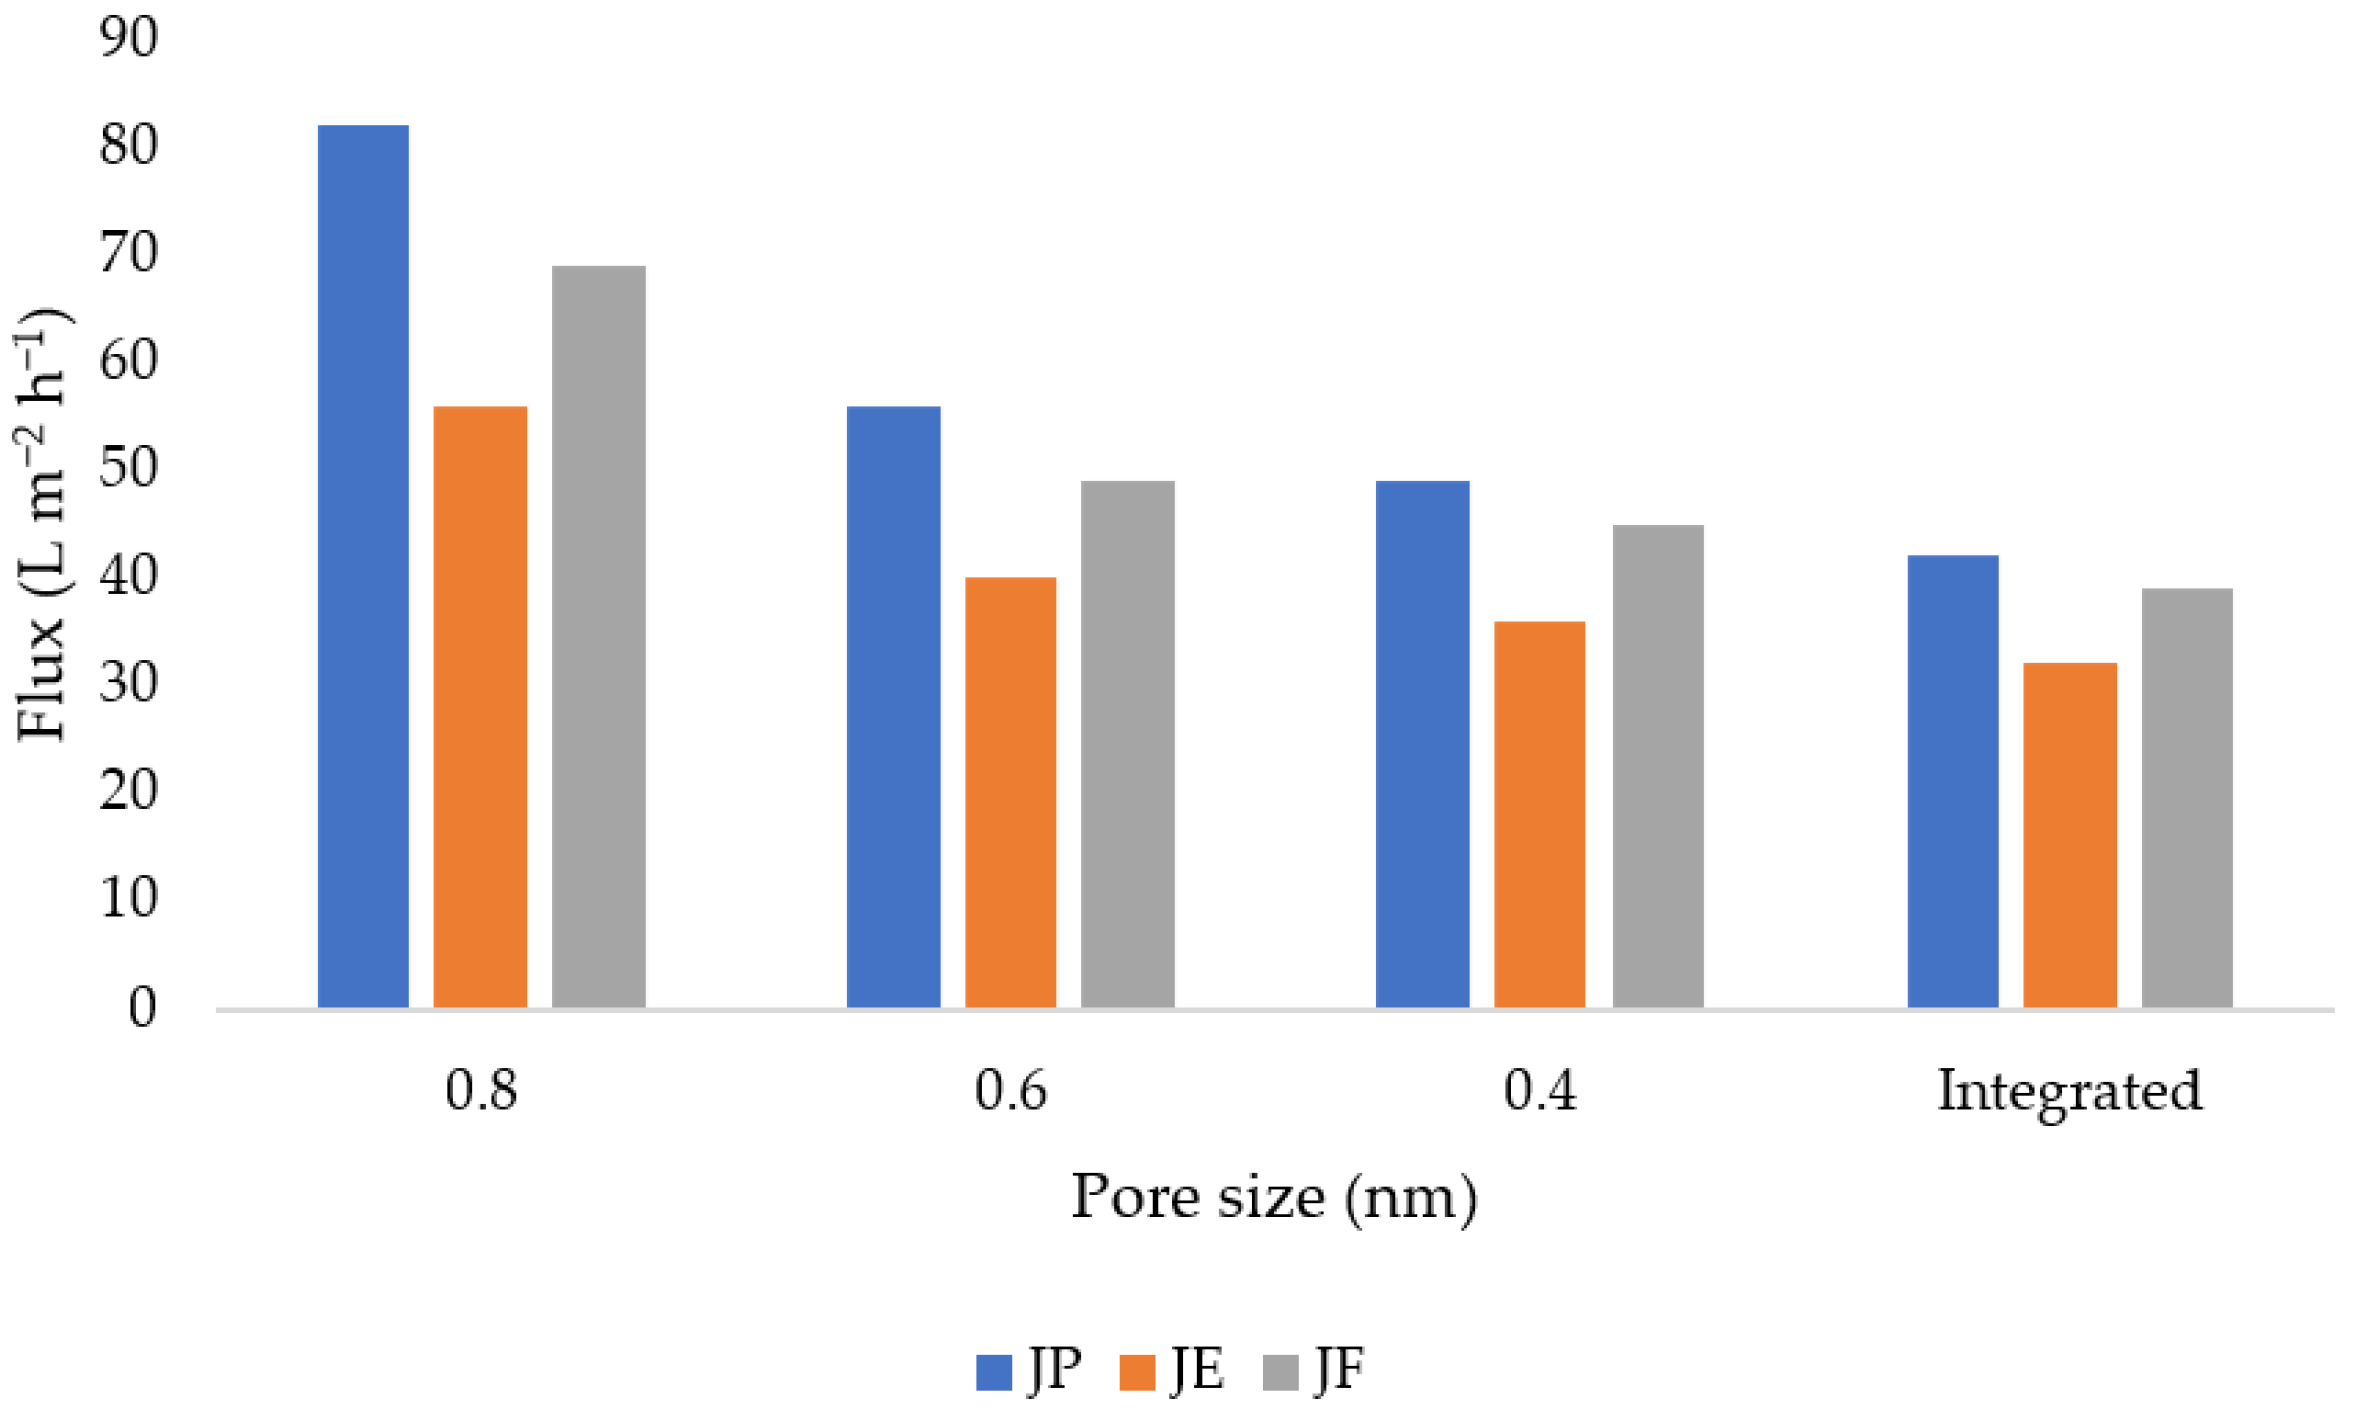
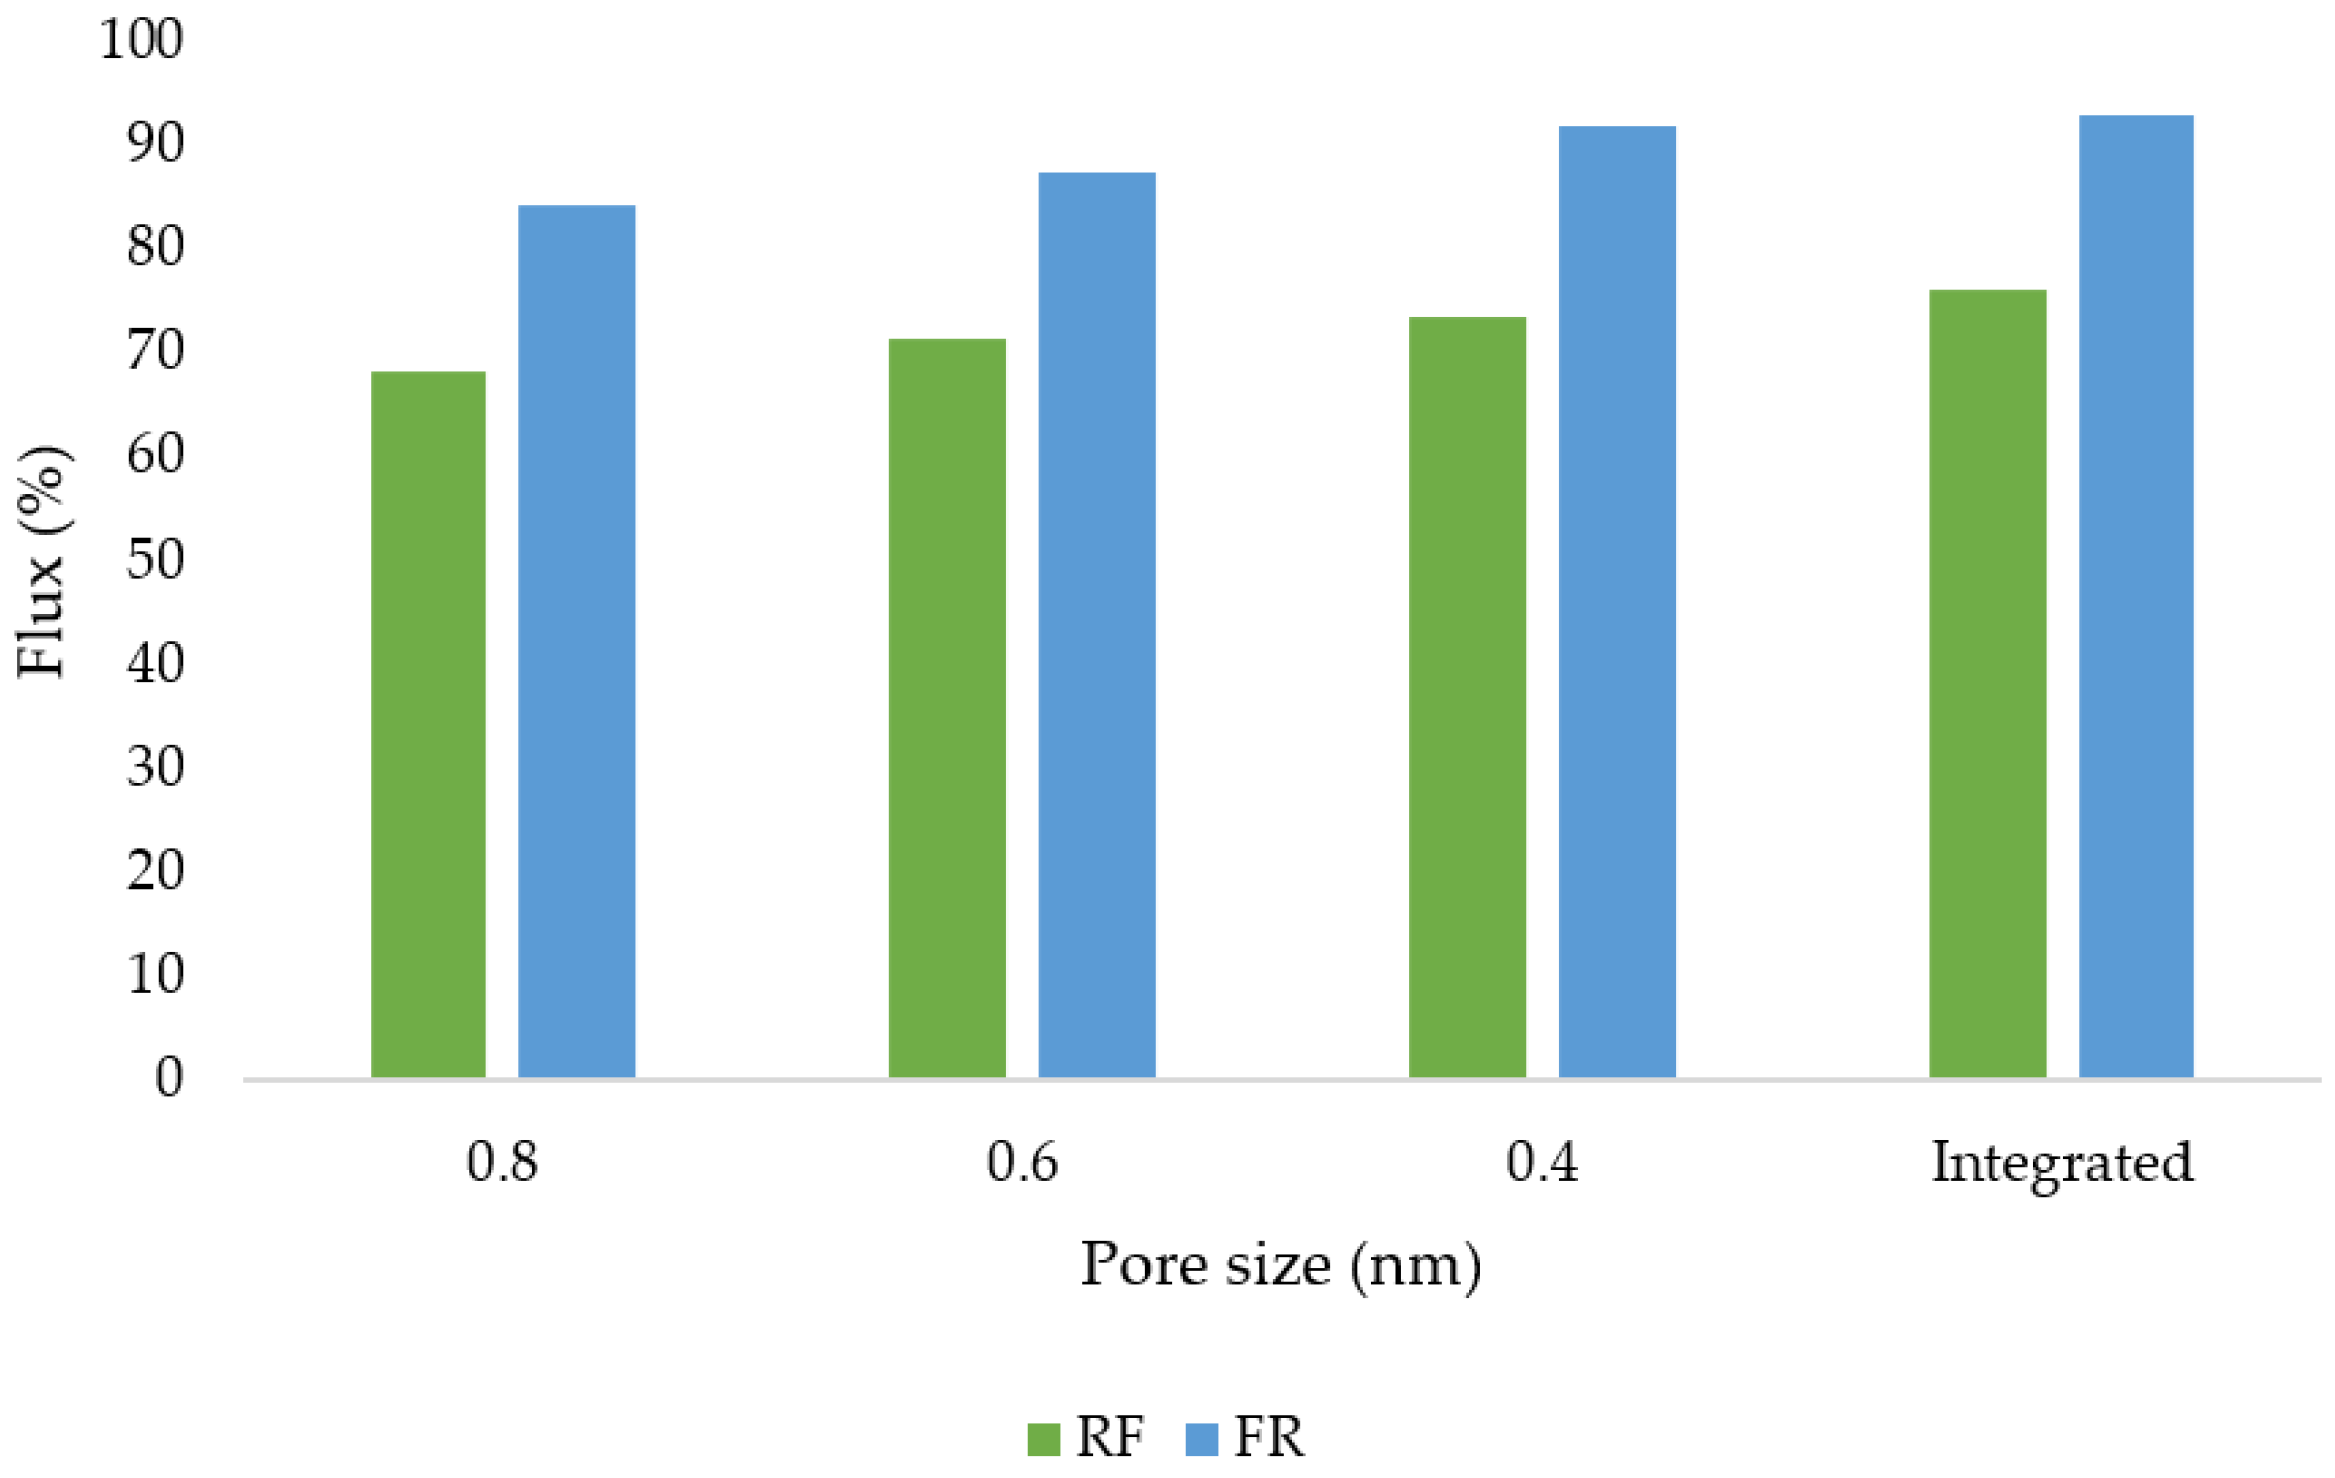
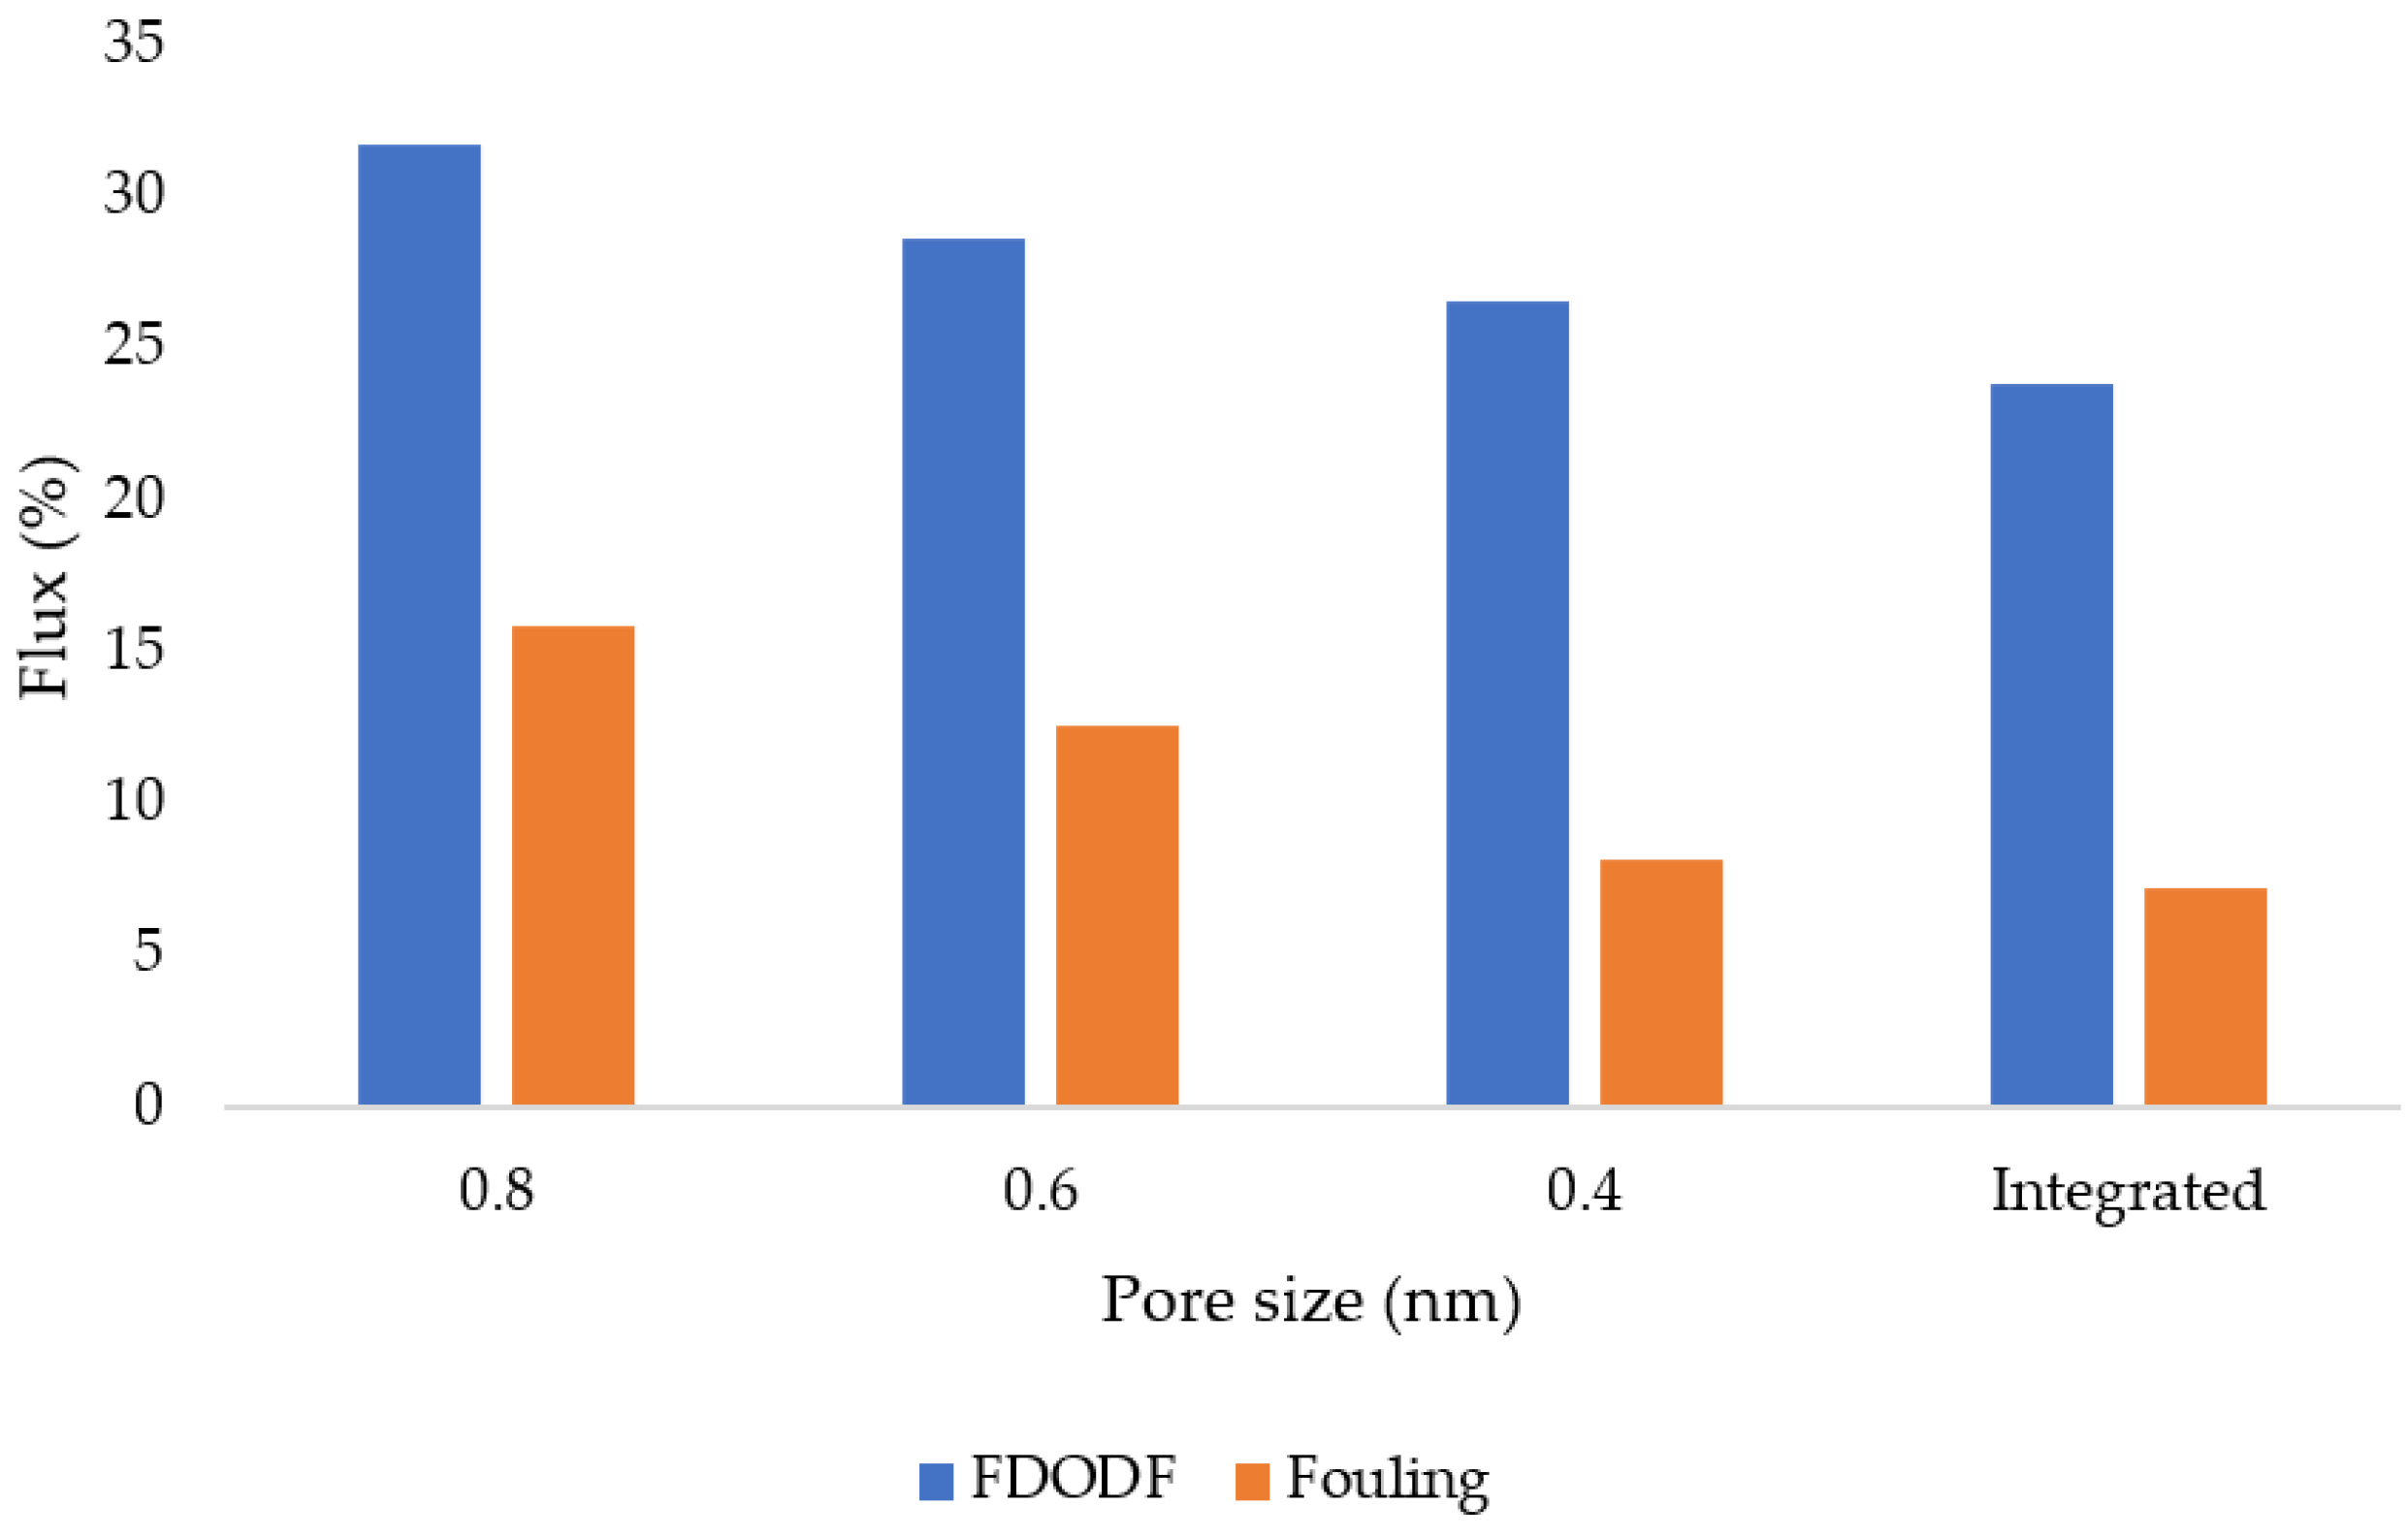
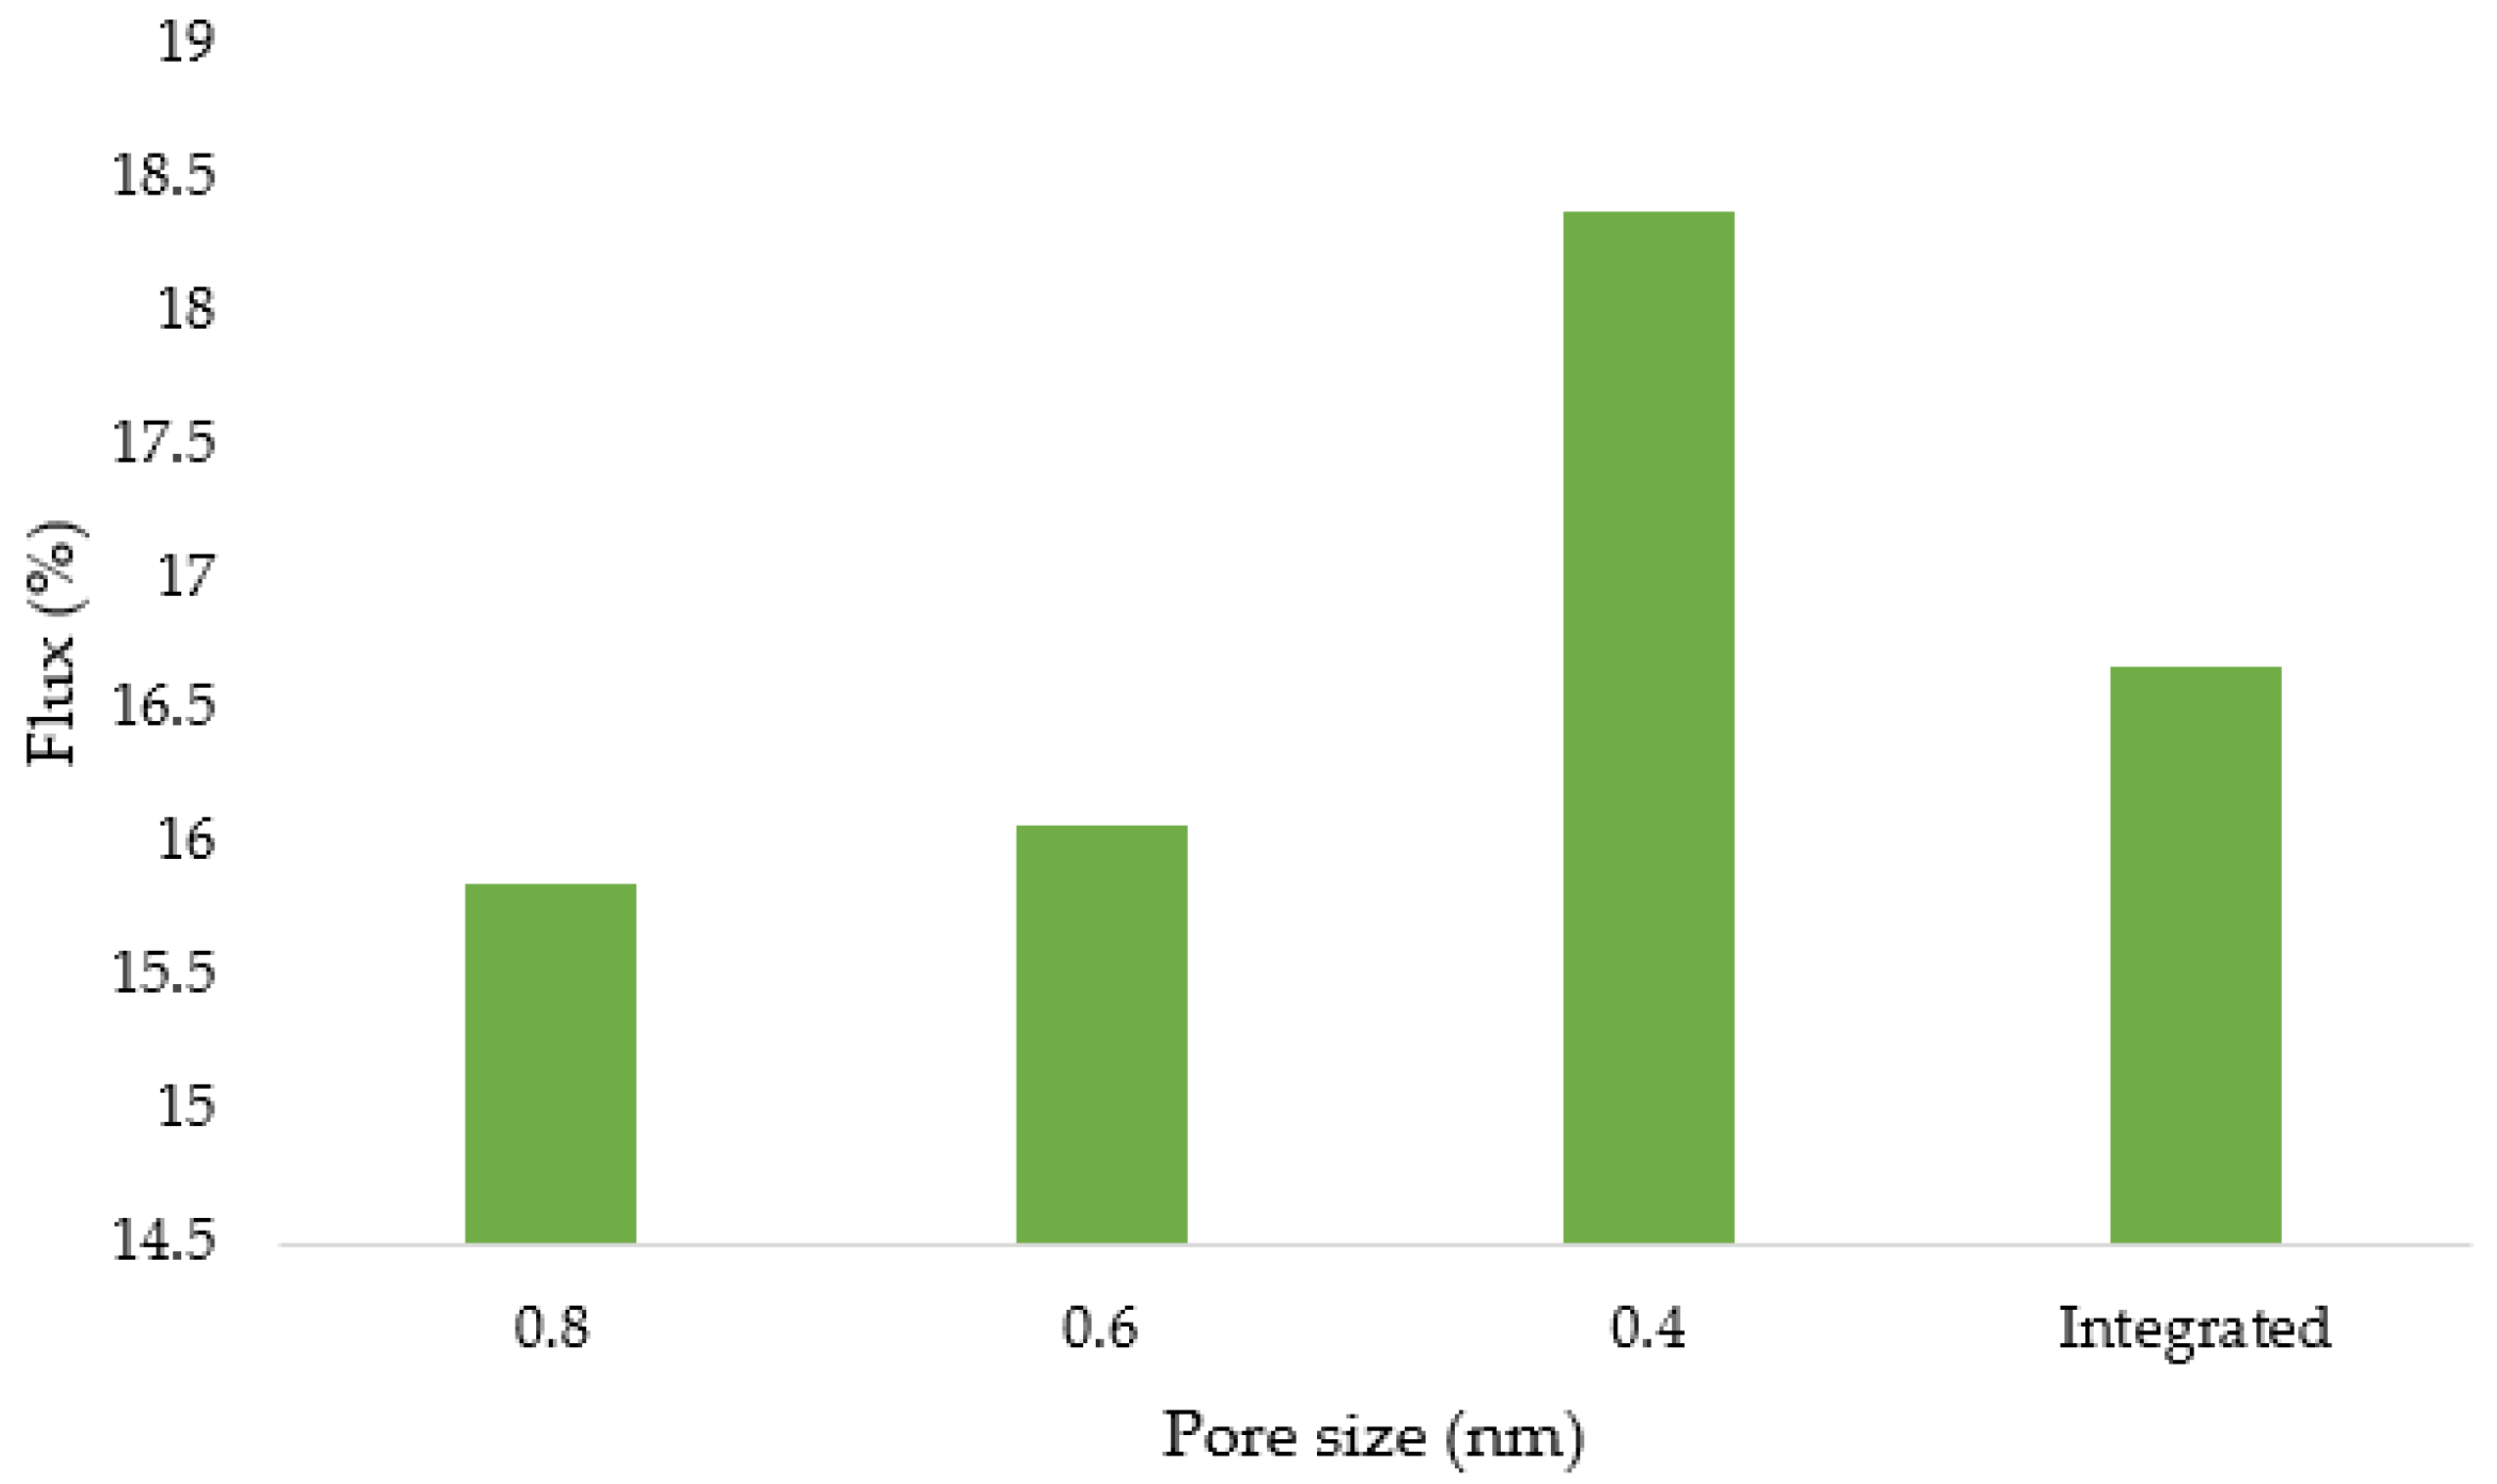
3.12. Flux and Membrane Fouling Analysis

As previously mentioned, one of the criteria investigated was how much water passed through a membrane. Figure 6 demonstrates that the pure water flux decreased as the pore size decreased, or, to put it another way, the pure water flux increased as the pore size increased. A similar phenomenon was observed for the wastewater permeate flux and the permeate flux with the fouling membrane. The highest JP (82 L m−2 h−1) was obtained with the 0.8 nm pore size, whereas a pore size of 0.4 nm resulted in a JP of approximately 49 L m−2 h−1. The highest JE (56 L m−2 h−1) was obtained for the size treatment system with a pore size of 0.8 nm, whereas the system with a pore size of 0.4 nm resulted in a JE of approximately 36 L m−2 h−1. On the other hand, the highest JF of approximately 69 L m−2 h−1 was obtained when the wastewater was subjected to a 0.8 nm pore size, whereas a pore size of 0.4 nm resulted in a JE of approximately 39 L m−2 h−1. An increased pore size typically equates to higher porosity. In a study by Mohammad et al. [52] that investigated the performance of ultrafiltration using nanofibers, it was shown that the porosity level had a significant impact on the flux. To be more specific, in comparison to the bleached rice straw nanofiber membrane, which could reject 79.7% of the bovine serum albumin soluble in water, the unbleached rice straw nanofiber membrane was able to reject 58.4% of the bovine serum albumin [52]. The bleached rice straw nanofiber membrane’s greater ability to reject bovine serum albumin from the water was observed to be a result of its lower porosity compared to the unbleached rice straw nanofiber membrane [52].
Figure 7 presents the summary of the relative flux and flux recovery estimated in the study. It can be seen that both the relative flux and flux recovery gradually increased with the decrease in the pore size. To be more specific, when the wastewater was subjected to a 0.8 nm pore size, a relative flux of approximately 68.3% was obtained, 71.4% was obtained with a 0.6 nm pore size, and 73.5% with a 0.4 nm pore size. On the other hand, based on the flux recovery, approximately 84.1% was obtained with a 0.8 nm pore size, 87.5% with a 0.6 nm pore size, and 91.8% with a 0.4 nm pore size. The material of the membrane, the pore size, the characteristics of the wastewater, and the hydrodynamic circumstances were among the factors mentioned in the literature that have a significant impact on membrane flux [53]. Numerous researchers have thoroughly investigated membrane fouling, which has a direct impact on the membrane flux. Therefore, to improve the performance of a membrane, fouling should be kept under control [54]. Membrane fouling can be reduced by pretreating influents, optimizing operational circumstances, changing the properties of the sludge, and changing the membrane properties [54]. Of note is the fact that the membrane’s resistance to fouling by the feed solution is also represented by the relative flux [55].
Figure 8 presents the summary of the estimated flux decline occurring during filtration and membrane fouling. It can be observed that both parameters decreased with the decrease in the pore size. In general, the membrane fouling that reduced with the reduction in the filter pore size was an interesting phenomenon to observe. A membrane fouling flux of approximately 15.9% was estimated with the 0.8 nm pore size treatment system, and approximately 8.2% was estimated with the 0.4 nm pore size. Similar results have also been reported in studies conducted by Fangchao et al. [56] and Kuo-Jen et al. [57], where, in order to filter 0.15 mm polymethyl methacrylate particles, two track-etched membranes with mean pore sizes of 0.2 and 0.4 mm, respectively, were utilized as the filter media. The results showed that the blocking index gradually changed during the first phase of filtering, maintained a value of around 0.5 for a time, and then abruptly decreased to zero under critical conditions [57]. Due to more severe membrane blocking, the blocking index for the 0.4 mm membrane was always higher than that for the 0.2 mm membrane under the same filtration pressure and flux [57].
Moreover, according to the literature, the type of fouling that predominates and, as a result, the retention of specific pollutants, is directly related to the size of the membrane pores; however, in order to evaluate the influence of pore size on membrane fouling, the feed composition should also be taken into account [58]. Applying a membrane filtering technique, such as nanofiltration, can result in a drop in flux and yield. One of the causes is concentration polarization, or the accumulation of retained solutes, which happens rapidly and can be reversed [58]. Another is fouling phenomena, which include long-term and practically irreversible processes such as the adsorption, pore-blocking, and deposition of solidified solutes [58]. These processes result in a decrease in the driving power of the filter or an increase in the transport resistance of the penetrating solvent [58].
Figure 9 presents the summary of the concentration polarization estimated in the study. It is also worth noting that concentration polarization is a phenomenon that can significantly impair overall nanofiltration process efficiency. An interesting phenomenon is that the highest concentration polarization (18.4%) was observed with the 0.4 nm pore size treatment system, whereas the concentration polarization significantly reduced when the wastewater was treated using the integrated treatment system. It should be noted that rejected solutes typically build up on the membrane’s surface, where their concentration progressively rises; on the bulk side, a concentration buildup takes place [59]. In other words, concentration polarization describes the steady flow of contaminated influent to the membrane surface and the selective retention of some constituents causes an accumulation of some solutes on or near the membrane surface. Their concentration grows over the course of the operation, leading to the formation of a boundary layer with a higher concentration. The fluid in this layer is almost stationary and the membrane surface has zero velocity [60].

4. Conclusions

The potential applicability of nanofiltration systems with different pore sizes (0.4, 0.6, and 1.8 nm) for the removal of nutrients from poultry slaughterhouse wastewater has been investigated. Also, an integrated system with ultrafiltration and nanofiltration has been investigated for its potential applicability for the removal of nutrients from poultry slaughterhouse wastewater. The combination of nitrate and a 0.4 nm pore size demonstrated the highest removal efficiency (90.5%) out of the three investigated pore sizes. The combined treatment, on the other hand, was shown to be extremely effective in eliminating the examined parameters, with removal effectiveness rates ranging from 97.8 to 99.71%. The majority of the water quality parameters did not meet the recommended water quality guidelines for drinking water as determined by the average concentrations in the final effluent after the wastewater was processed solely by the nanofiltration systems. However, the combined treatment achieved compliance rates ranging from 67.3% to 99.8%. p-values of less than 0.01 were obtained for the concentrations of the examined water quality parameters in the treated effluent using the various pore sizes, meaning that the concentration differences were statistically significant. The differences were further justified by Tukey’s honestly significant difference and Scheffé’s multiple comparisons. Moreover, the differences in the pore size were also observed to affect the general phenomenon of flux and membrane fouling, where the membrane fouling was generally observed to decrease with the decrease in the pore size. The results of this study provide some important information regarding the prospective application of nanofiltration treatment devices for wastewater from poultry slaughterhouses.

Author Contributions

Conceptualization, T.M.; methodology, T.M.; software, K.A., N.N.N., I.B.O., S.S. and T.M.; validation, S.M., T.B, T.M. and A.S.K.; formal analysis, T.M.; investigation, resources, and data curation, T.M., S.M. and K.A.; writing—original draft preparation, T.M.; writing—review and editing, T.M.; visualization, T.M.; supervision, project administration, and funding acquisition, T.M., K.A., T.B., N.N.N., I.B.O. and A.S.K. All authors have read and agreed to the published version of the manuscript.

Funding

This research was funded by the Ministry of Education and Science, the Republic of Kazakhstan to support “Reducing the technogenic impact on water resources with using water recycling technology”, № BR05236844/215 for 2018–2020 years.

Data Availability Statement

Not applicable.

Conflicts of Interest

The authors declare no conflict of interest. The funders had no role in the design of the study; in the collection, analyses, or interpretation of data; in the writing of the manuscript, or in the decision to publish the results.

References

  1. Orians, G.H.; Milewski, A.V. Ecology of Australia: The effects of nutrient-poor soils and intense fires. Biol. Rev. 2007, 82, 393–423. [Google Scholar] [CrossRef]
  2. Lemley, D.A.; Adams, J.B. Eutrophication. In Encyclopedia of Ecology; Elsevier: Amsterdam, The Netherlands, 2019; pp. 86–90. ISBN 9780444641304. [Google Scholar]
  3. Kateregga, E.; Sterner, T. Indicators for an invasive species: Water hyacinths in Lake Victoria. Ecol. Indic. 2007, 7, 362–370. [Google Scholar] [CrossRef]
  4. Chambers, P.A.; Vis, C.; Brua, R.B.; Guy, M.; Culp, J.M.; Benoy, G.A. Eutrophication of agricultural streams: Defining nutrient concentrations to protect ecological condition. Water Sci. Technol. 2008, 58, 2203–2210. [Google Scholar] [CrossRef]
  5. Sato, Y.; Ishihara, M.; Fukuda, K.; Nakamura, S.; Murakami, K.; Fujita, M.; Yokoe, H. Behavior of Nitrate-Nitrogen and Nitrite-Nitrogen in Drinking Water. Biocontrol Sci. 2018, 23, 139–143. [Google Scholar] [CrossRef]
  6. Jiao, X.; Maimaitiyiming, A.; Salahou, M.; Liu, K.; Guo, W. Impact of Groundwater Level on Nitrate Nitrogen Accumulation in the Vadose Zone Beneath a Cotton Field. Water 2017, 9, 171. [Google Scholar] [CrossRef]
  7. Hu, B.; Huang, S.; Shao, Y.; Chen, J. Thermodynamic analysis of a new ammonia-water power cycle. Energy Rep. 2020, 6, 567–573. [Google Scholar] [CrossRef]
  8. Huang, J.; Kankanamge, N.R.; Chow, C.; Welsh, D.T.; Li, T.; Teasdale, P.R. Removing ammonium from water and wastewater using cost-effective adsorbents: A review. J. Environ. Sci. 2018, 63, 174–197. [Google Scholar] [CrossRef]
  9. Avery, A.A. Infantile methemoglobinemia: Reexamining the role of drinking water nitrates. Environ. Health Perspect. 1999, 107, 583–586. [Google Scholar] [CrossRef] [PubMed]
  10. Majumdar, D. The Blue Baby Syndrome. Resonance 2003, 8, 20–30. [Google Scholar] [CrossRef]
  11. Knobeloch, L.; Salna, B.; Hogan, A.; Postle, J.; Anderson, H. Blue babies and nitrate-contaminated well water. Environ. Health Perspect. 2000, 108, 675–678. [Google Scholar] [CrossRef]
  12. Khosravi, A.; Zarei, M.; Ronaghi, A. Influence of Biofertilizers and Phosphate Sources on the Phosphorus Uptake of Lettuce and Chemical Forms of Phosphorus in Soil. Commun. Soil Sci. Plant Anal. 2017, 48, 2701–2714. [Google Scholar] [CrossRef]
  13. Kesari, K.K.; Verma, H.N.; Behari, J. Physical methods in wastewater treatment. Int. J. Environ. Technol. Manag. 2011, 14, 43. [Google Scholar] [CrossRef]
  14. Meiramkulova, K.; Mkilima, T.; Baituk, G.; Beisembayeva, K.; Meirbekov, A.; Kakabayev, A.; Adilbektegi, G.; Tleukulov, A.; Tazhkenova, G. Treatment of waste stabilization pond effluent using natural zeolite for irrigation potential. PLoS ONE 2022, 17, e0259614. [Google Scholar] [CrossRef] [PubMed]
  15. Kuntubek, A.; Kinayat, N.; Meiramkulova, K.; Poulopoulos, S.G.; Bear, J.C.; Inglezakis, V.J. Catalytic Oxidation of Methylene Blue by Use of Natural Zeolite-Based Silver and Magnetite Nanocomposites. Processes 2020, 8, 471. [Google Scholar] [CrossRef]
  16. Meiramkulova, K.; Jakupova, Z.; Orynbekov, D.; Tashenov, E.; Kydyrbekova, A.; Mkilima, T.; Inglezakis, V.J. Evaluation of Electrochemical Methods for Poultry Slaughterhouse Wastewater Treatment. Sustainability 2020, 12, 5110. [Google Scholar] [CrossRef]
  17. Meiramkulova, K.; Bazarbayeva, T.; Orynbassar, R.; Tleukulov, A.; Madina, N.; Mashan, T.; Dariya, A.; Apendina, A.; Nurmukhanbetova, N. Assessing the Influence of Electrode Polarity on the Treatment of Poultry Slaughterhouse Wastewater. Molecules 2022, 27, 1014. [Google Scholar] [CrossRef] [PubMed]
  18. Delforno, T.P.; Lacerda Júnior, G.V.; Noronha, M.F.; Sakamoto, I.K.; Varesche, M.B.A.; Oliveira, V.M. Microbial diversity of a full-scale UASB reactor applied to poultry slaughterhouse wastewater treatment: Integration of 16S rRNA gene amplicon and shotgun metagenomic sequencing. Microbiologyopen 2017, 6, e00443. [Google Scholar] [CrossRef]
  19. Meiramkulova, K.; Devrishov, D.; Zhumagulov, M.; Arystanova, S.; Karagoishin, Z.; Marzanova, S.; Kydyrbekova, A.; Mkilima, T.; Li, J. Performance of an Integrated Membrane Process with Electrochemical Pre-Treatment on Poultry Slaughterhouse Wastewater Purification. Membranes 2020, 10, 256. [Google Scholar] [CrossRef] [PubMed]
  20. Meiramkulova, K.; Devrishov, D.; Marzanov, N.; Marzanova, S.; Kydyrbekova, A.; Uryumtseva, T.; Tastanova, L.; Mkilima, T. Performance of Graphite and Titanium as Cathode Electrode Materials on Poultry Slaughterhouse Wastewater Treatment. Materials 2020, 13, 4489. [Google Scholar] [CrossRef] [PubMed]
  21. Makhatova, A.; Mazhit, B.; Sarbassov, Y.; Meiramkulova, K.; Inglezakis, V.J.; Poulopoulos, S.G. Effective photochemical treatment of a municipal solid waste landfill leachate. PLoS ONE 2020, 15, e0239433. [Google Scholar] [CrossRef] [PubMed]
  22. Del Nery, V.; Damianovic, M.H.Z.; Pozzi, E.; de Nardi, I.R.; Caldas, V.E.A.; Pires, E.C. Long-term performance and operational strategies of a poultry slaughterhouse waste stabilization pond system in a tropical climate. Resour. Conserv. Recycl. 2013, 71, 7–14. [Google Scholar] [CrossRef]
  23. Baker, B.R.; Mohamed, R.; Al-Gheethi, A.; Aziz, H.A. Advanced technologies for poultry slaughterhouse wastewater treatment: A systematic review. J. Dispers. Sci. Technol. 2021, 42, 880–899. [Google Scholar] [CrossRef]
  24. Żyłka, R.; Dąbrowski, W.; Gogina, E.; Yancen, O. Trickling Filter for High Efficiency Treatment of Dairy Sewage. J. Ecol. Eng. 2018, 19, 269–275. [Google Scholar] [CrossRef]
  25. Godini, K.; Azarian, G.; Kimiaei, A.; Dragoi, E.N.; Curteanu, S. Modeling of a real industrial wastewater treatment plant based on aerated lagoon using a neuro-evolutive technique. Process Saf. Environ. Prot. 2021, 148, 114–124. [Google Scholar] [CrossRef]
  26. Crini, G.; Lichtfouse, E. Advantages and disadvantages of techniques used for wastewater treatment. Environ. Chem. Lett. 2019, 17, 145–155. [Google Scholar] [CrossRef]
  27. Mkilima, T.; Meiramkulova, K.; Nurbala, U.; Zandybay, A.; Khusainov, M.; Nurmukhanbetova, N.; Tastanova, L.; Mashan, T.; Meirbekov, A. Investigating the Influence of Column Depth on the Treatment of Textile Wastewater Using Natural Zeolite. Molecules 2021, 26, 7030. [Google Scholar] [CrossRef] [PubMed]
  28. Liang, C.; Wei, D.; Zhang, S.; Ren, Q.; Shi, J.; Liu, L. Removal of antibiotic resistance genes from swine wastewater by membrane filtration treatment. Ecotoxicol. Environ. Saf. 2021, 210, 111885. [Google Scholar] [CrossRef]
  29. Thaçi, B.S.; Gashi, S.T. Reverse osmosis removal of heavy metals from wastewater effluents using biowaste materials pretreatment. Pol. J. Environ. Stud. 2019. [Google Scholar] [CrossRef]
  30. Kyllönen, H.; Heikkinen, J.; Ceras, J.; Fernandez, C.; Porc, O.; Grönroos, A. Membrane-based conceptual design of reuse water production from candy factory wastewater. Water Sci. Technol. 2021, 84, 1389–1402. [Google Scholar] [CrossRef]
  31. Afanga, H.; Zazou, H.; Titchou, F.E.; Rakhila, Y.; Akbour, R.A.; Elmchaouri, A.; Ghanbaja, J.; Hamdani, M. Integrated electrochemical processes for textile industry wastewater treatment: System performances and sludge settling characteristics. Sustain. Environ. Res. 2020, 30, 2. [Google Scholar] [CrossRef] [Green Version]
  32. Aziz, H.A.; Puat, N.N.A.; Alazaiza, M.Y.D.; Hung, Y.T. Poultry slaughterhouse wastewater treatment using submerged fibers in an attached growth sequential batch reactor. Int. J. Environ. Res. Public Health 2018, 15, 1734. [Google Scholar] [CrossRef] [PubMed]
  33. Meiramkulova, K.; Orynbekov, D.; Saspugayeva, G.; Aubakirova, K.; Arystanova, S.; Kydyrbekova, A.; Tashenov, E.; Nurlan, K.; Mkilima, T. The Effect of Mixing Ratios on the Performance of an Integrated Poultry Slaughterhouse Wastewater Treatment Plant for a Recyclable High-Quality Effluent. Sustainability 2020, 12, 6097. [Google Scholar] [CrossRef]
  34. Kanafin, Y.N.; Makhatova, A.; Meiramkulova, K.; Poulopoulos, S.G. Treatment of a poultry slaughterhouse wastewater using advanced oxidation processes. J. Water Process Eng. 2022, 47, 102694. [Google Scholar] [CrossRef]
  35. Meiramkulova, K.; Zorpas, A.A.; Orynbekov, D.; Zhumagulov, M.; Saspugayeva, G.; Kydyrbekova, A.; Mkilima, T.; Inglezakis, V.J. The Effect of Scale on the Performance of an Integrated Poultry Slaughterhouse Wastewater Treatment Process. Sustainability 2020, 12, 4679. [Google Scholar] [CrossRef]
  36. Frascari, D.; Zanaroli, G.; Motaleb, M.A.; Annen, G.; Belguith, K.; Borin, S.; Choukr-Allah, R.; Gibert, C.; Jaouani, A.; Kalogerakis, N.; et al. Integrated technological and management solutions for wastewater treatment and efficient agricultural reuse in Egypt, Morocco, and Tunisia. Integr. Environ. Assess. Manag. 2018, 14, 447–462. [Google Scholar] [CrossRef]
  37. Hoh, D.; Watson, S.; Kan, E. Algal biofilm reactors for integrated wastewater treatment and biofuel production: A review. Chem. Eng. J. 2016, 287, 466–473. [Google Scholar] [CrossRef]
  38. Hach Company. Standard Solutions: Chemicals and Reagents; Hach Company: Frederick, MD, USA, 2007; Volume 2549. [Google Scholar]
  39. Gönder, Z.B.; Kaya, Y.; Vergili, I.; Barlas, H. Optimization of filtration conditions for CIP wastewater treatment by nanofiltration process using Taguchi approach. Sep. Purif. Technol. 2010, 70, 265–273. [Google Scholar] [CrossRef]
  40. Lee, Y.; Clark, M.M. Modeling of flux decline during crossflow ultrafiltration of colloidal suspensions. J. Memb. Sci. 1998, 149, 181–202. [Google Scholar] [CrossRef]
  41. Baker, J.; Battye, W.H.; Robarge, W.; Pal Arya, S.; Aneja, V.P. Modeling and measurements of ammonia from poultry operations: Their emissions, transport, and deposition in the Chesapeake Bay. Sci. Total Environ. 2020, 706, 135290. [Google Scholar] [CrossRef] [PubMed]
  42. Wang, H.-J.; Xiao, X.-C.; Wang, H.-Z.; Li, Y.; Yu, Q.; Liang, X.-M.; Feng, W.-S.; Shao, J.-C.; Rybicki, M.; Jungmann, D.; et al. Effects of high ammonia concentrations on three cyprinid fish: Acute and whole-ecosystem chronic tests. Sci. Total Environ. 2017, 598, 900–909. [Google Scholar] [CrossRef]
  43. United States Environmental Protection Agency. Aquatic Life Criteria—Ammonia; United States Environmental Protection Agency: Washington, DC, USA, 2015.
  44. Gurung, D.P.; Githinji, L.J.M.; Ankumah, R.O. Assessing the Nitrogen and Phosphorus Loading in the Alabama (USA) River Basin Using PLOAD Model. Air Soil Water Res. 2013, 6, ASWR.S10548. [Google Scholar] [CrossRef]
  45. Dong, Y.; Zhang, Y.; Tu, B. Immobilization of ammonia-oxidizing bacteria by polyvinyl alcohol and sodium alginate. Braz. J. Microbiol. 2017, 48, 515–521. [Google Scholar] [CrossRef]
  46. Tiso, M.; Schechter, A.N. Nitrate Reduction to Nitrite, Nitric Oxide and Ammonia by Gut Bacteria under Physiological Conditions. PLoS ONE 2015, 10, e0119712. [Google Scholar] [CrossRef]
  47. Larsen, R.D. Box-and-whisker plots. J. Chem. Educ. 1985, 62, 302. [Google Scholar] [CrossRef]
  48. Liu, M.; Lü, Z.; Chen, Z.; Yu, S.; Gao, C. Comparison of reverse osmosis and nanofiltration membranes in the treatment of biologically treated textile effluent for water reuse. Desalination 2011, 281, 372–378. [Google Scholar] [CrossRef]
  49. Amar, N.B.; Kechaou, N.; Palmeri, J.; Deratani, A.; Sghaier, A. Comparison of tertiary treatment by nanofiltration and reverse osmosis for water reuse in denim textile industry. J. Hazard. Mater. 2009, 170, 111–117. [Google Scholar] [CrossRef]
  50. Monnot, M.; Nguyên, H.T.K.; Laborie, S.; Cabassud, C. Seawater reverse osmosis desalination plant at community-scale: Role of an innovative pretreatment on process performances and intensification. Chem. Eng. Process. Process. Intensif. 2017, 113, 42–55. [Google Scholar] [CrossRef]
  51. Mahat, S.B.; Omar, R.; Lee, J.L.; Mohd Idris, A.I.; Che Man, H.; Mustapa Kamal, S.M.; Idris, A. Effect of pore size of monofilament woven filter cloth as supporting material for dynamic membrane filtration on performance using aerobic membrane bioreactor technology. Asia-Pac. J. Chem. Eng. 2020, 15, e2453. [Google Scholar] [CrossRef]
  52. Hassan, M.L.; Fadel, S.M.; Abouzeid, R.E.; Abou Elseoud, W.S.; Hassan, E.A.; Berglund, L.; Oksman, K. Water purification ultrafiltration membranes using nanofibers from unbleached and bleached rice straw. Sci. Rep. 2020, 10, 11278. [Google Scholar] [CrossRef]
  53. Miyamoto, M.; Nakashimada, Y.; Uemiya, S. Membrane reactors for biogas production and processing. In Membrane Reactors for Energy Applications and Basic Chemical Production; Elsevier: Amsterdam, The Netherlands, 2015; pp. 345–365. ISBN 9781782422273. [Google Scholar]
  54. Lin, H.; Yu, G.; Shen, L.; Li, R.; Xu, Y. Advanced membrane bioreactor fouling control and prevention strategies. In Current Developments in Biotechnology and Bioengineering; Elsevier: Amsterdam, The Netherlands, 2020; pp. 209–224. ISBN 9780128198094. [Google Scholar]
  55. Tibi, F.; Park, S.-J.; Kim, J. Improvement of Membrane Distillation Using PVDF Membrane Incorporated with TiO2 Modified by Silane and Optimization of Fabricating Conditions. Membranes 2021, 11, 95. [Google Scholar] [CrossRef]
  56. Zhao, F.; Han, X.; Shao, Z.; Li, Z.; Li, Z.; Chen, D. Effects of different pore sizes on membrane fouling and their performance in algae harvesting. J. Memb. Sci. 2022, 641, 119916. [Google Scholar] [CrossRef]
  57. Hwang, K.-J.; Liao, C.-Y.; Tung, K.-L. Effect of membrane pore size on the particle fouling in membrane filtration. Desalination 2008, 234, 16–23. [Google Scholar] [CrossRef]
  58. Mora, F.; Pérez, K.; Quezada, C.; Herrera, C.; Cassano, A.; Ruby-Figueroa, R. Impact of Membrane Pore Size on the Clarification Performance of Grape Marc Extract by Microfiltration. Membranes 2019, 9, 146. [Google Scholar] [CrossRef] [Green Version]
  59. Koseoglu, H.; Guler, E.; Harman, B.I.; Gonulsuz, E. Water Flux and Reverse Salt Flux. In Membrane-Based Salinity Gradient Processes for Water Treatment and Power Generation; Elsevier: Amsterdam, The Netherlands, 2018; pp. 57–86. ISBN 9780444639615. [Google Scholar]
  60. Sadr, S.M.K.; Saroj, D.P. Membrane technologies for municipal wastewater treatment. In Advances in Membrane Technologies for Water Treatment; Elsevier: Amsterdam, The Netherlands, 2015; pp. 443–463. ISBN 9781782421269. [Google Scholar]
Figure 1. Poultry production flowchart.
Water 14 02929 g001
Figure 2. Box plots of raw wastewater.
Water 14 02929 g002
Figure 3. Data distribution from treated effluent from different pore sizes (a) ammonia (b) total phosphorus (c) nitrites (d) nitrates.
Water 14 02929 g003
Figure 4. Removal efficiencies from nanofiltration systems.
Water 14 02929 g004
Figure 5. Integrated treatment.
Water 14 02929 g005
Figure 6. Presentation of different types of fluxes.
Water 14 02929 g006
Figure 7. Relative flux and flux recovery.
Water 14 02929 g007
Figure 8. Flux decline occurred during filtration and fouling. FDODF = flux decline occurring during filtration.
Water 14 02929 g008
Figure 9. Concentration polarization.
Water 14 02929 g009
Table 1. Characteristics of the poultry slaughterhouse raw wastewater (n = 12).
ParameterMinMaxMedianAMSDGuidelineAgency
Ammonia44.9910468.52571.5122.67432.5US EPA
Total phosphorous45189.44124.08120.6553.40110US EPA
Nitrites45.38064.28563.467512.3501US EPA
Nitrate25.8178.499.95103.4154.1810.1WHO
All parameters in mg/L; minimum concentration values (Min), maximum concentration (Max), arithmetic mean or average (AM), and standard deviation (SD).
Table 2. Nanofiltration general technical specifications.
ParameterUnitValue
Pore sizenm0.4, 0.6, and 0.8
Pump supply voltageV36
Pump powerkW0.3–0.5
Table 3. Correlations among studied water quality parameters in the raw wastewater.
AmmoniaTotal PhosphorousNitritesNitrate
Ammonia1
Total phosphorous0.131
Nitrites0.940.411
Nitrate0.870.590.971
Table 4. Effluent quality characteristics and removal efficiency using the integrated treatment system.
ParameterMinMaxMedianMeanSTDRemoval Efficiency (%)
Ammonia1.212.241.451.5880.39297.78
Total phosphorous0.0010.030.020.0180.01098.33
Nitrites0.0010.0050.0030.0030.00298.42
Nitrate0.20.50.250.30.12299.71
Table 5. Percent compliance from raw wastewater and treated effluent.
ParameterRaw Wastewater (%)0.8 (%)0.6 (%)0.4 (%)Integrated (%)
Ammonia−120.030.0527.7450.41895.12
Total phosphorous−1106.5−105.18−121.4−23.1599.82
Nitrites−6246.75−985.75−935.75−767.66799.70
Nitrate−103,310−15,675−13,025−972067.31
Table 6. ANOVA results from the different pore sizes.
ParameterF Critp-ValueStatus (Is p-Value < 0.05?)
Ammonium3.7080.000138TRUE
Phosphates3.4111.08 × 10−6TRUE
Nitrites3.4118.13× 10−5TRUE
Nitrate3.5870.001481TRUE
Table 7. Tukey’s honestly significant difference analysis results from ammonia datasets.
Treatment PairsTukey’s HSD Q StatisticTukey’s HSD p-ValueTukey’s HSD Inference
0.8 vs. 0.61.32260.770407insignificant
0.8 vs. 0.48.89670.001005** p < 0.01
0.8 vs. integrated7.8940.001116** p < 0.01
0.6 vs. 0.47.41810.001778** p < 0.01
0.6 vs. integrated6.57140.004229** p < 0.01
0.4 vs. integrated0.0710.899995insignificant
** statistically significant.
Table 8. Tukey’s honestly significant difference analysis results from phosphate datasets.
Treatment PairsTukey’s HSD Q StatisticTukey’s HSD p-ValueTukey’s HSD Inference
0.8 vs. 0.66.13330.003926** p < 0.01
0.8 vs. 0.412.48010.001005** p < 0.01
0.8 vs. integrated13.17140.001005** p < 0.01
0.6 vs. 0.45.76140.00631** p < 0.01
0.6 vs. integrated7.4930.001005** p < 0.01
0.4 vs. integrated2.8340.236134insignificant
** statistically significant.
Table 9. Scheffé multiple comparison analysis results from ammonia datasets.
Treatment PairsScheffé TT-StatisticScheffé p-ValueScheffé Inference
0.8 vs. 0.60.93520.830639insignificant
0.8 vs. 0.46.29090.000824** p < 0.01
0.8 vs. integrated5.58190.002047** p < 0.01
0.6 vs. 0.45.24540.003213** p < 0.01
0.6 vs. integrated4.64670.007378** p < 0.01
0.4 vs. integrated0.05020.999964insignificant
** statistically significant.
Table 10. Scheffé multiple comparison analysis results from phosphates datasets.
Treatment PairsScheffé TT-StatisticScheffé p-ValueScheffé Inference
0.8 vs. 0.64.33690.007271** p < 0.01
0.8 vs. 0.48.82489.22 × 10−6** p < 0.01
0.8 vs. integrated9.31365.07 × 10−6** p < 0.01
0.6 vs. 0.44.07390.011374* p < 0.05
0.6 vs. integrated5.29840.001464** p < 0.01
0.4 vs. integrated2.00390.304666insignificant
Note: ** statistically significant (alpha value 0.01). * statistically significant (alpha value 0.05).
Publisher’s Note: MDPI stays neutral with regard to jurisdictional claims in published maps and institutional affiliations.

