Article

Water Resources Allocation in the Tingjiang River Basin: Construction of an Interval-Fuzzy Two-Stage Chance-Constraints Model and Its Assessment through Pearson Correlation

1
College of New Energy and Environment, Jilin University, Changchun 130012, China
2
MOE Key Laboratory of Resources Environmental Systems Optimization, North China Electric Power University, Beijing 102206, China
3
Northeast Asian Studies College, Jilin University, Changchun 130012, China
*
Author to whom correspondence should be addressed.
Water 2022, 14(18), 2928; https://doi.org/10.3390/w14182928
Submission received: 18 August 2022 / Revised: 13 September 2022 / Accepted: 14 September 2022 / Published: 19 September 2022
(This article belongs to the Section Water Resources Management, Policy and Governance)

Abstract

:
Water scarcity has become a major impediment to economic development, and a scientifically sound water allocation plan is essential to alleviate water scarcity. An opportunity constraint approach is introduced to optimise the uncertainty of the minimum regional development level under five hydrological scenarios, and an interval-fuzzy two-stage chance-constraint model (IFTSC) is constructed to improve the reliability of the model results. The correlation of each stochastic parameter in the IFTSC model with the water allocation results and the economic benefits of the Tingjiang River basin is analysed by the Pearson correlation coefficient method. Simulation results from the IFTSC model show a downward trend in overall water scarcity and an upward trend in overall economic benefits in the Tingjiang River basin. Taking the dry water scenario as an example, the water shortage in the industrial sector decreases by 9.7%, and the overall economic benefits of the Tingjiang River basin increase by 41.58 × 10⁸ CNY. The results of the correlation analysis based on Pearson’s correlation coefficient show that water allocation is strongly positively correlated with variables such as water price and regional minimum development requirements, and economic efficiency is strongly positively correlated with unit scale output value and losses caused by water shortage. This paper provides constructive suggestions and guiding directions for the rational allocation of water resources in the Tingjiang River basin through a detailed analysis of the results and identification of the main stochastic parameters in the water allocation process.

1. Introduction

Water, the source of life, plays a vital role in preserving social equity and ecosystem stability [1,2]. The global water demand is estimated to increase by one percent each year, keeping one out of every two people at risk of water scarcity by 2050 [3,4]. Even though China is the most populated developing country, its water resources per capita are significantly less than the global average [5]. Water scarcity restricts human development and harms the environment severely [6]. The growing water scarcity in China has highlighted the need for improved water allocation [7]. Scientific allocation of water resources provides effective utilization and promotes the development of environmental work in the basin [8,9]. Water resource allocation and ecological governance in Chinese river basins are problematic due to geographical conditions, economic level, leading industries, and other factors, resulting in frequent abuse of water resources [10,11,12]. The Tingjiang River basin is a large watershed covering the Fujian and Guangdong provinces. The water distribution in the Fujian and Guangdong provinces has a significant impact on the survival and development of people. Based on the study conducted in the 14 administrative units in the Tingjiang River basin by Hao et al., the suitable water resource allocation scheme model was determined using the interval-fuzzy two-stage stochastic programming method (IFTS) to improve the water resource allocation status and water resource utilization efficiency of the basin and maximize the economic benefits. Water resources have become an important factor hindering the economic development of the Tingjiang River basin, which is currently under-utilized and has an uneven spatial and temporal distribution of water resources leading to water shortages in some areas [13]. However, the interval-fuzzy two-stage uncertainty optimization method alone cannot ensure that the uncertainty of each stochastic parameter in the model is optimized. For example, the IFTS model does not take into account the uncertainty of the minimum regional development requirements, which is not conducive to meeting regional development needs. At the same time the IFTS model cannot effectively analyse the correlation between the stochastic parameters in water allocation and the magnitude of the impact of each stochastic parameter on water allocation. Therefore, this paper further reduces the uncertainty of the model by introducing the chance-constraint method to optimise the uncertainty of the minimum regional development requirements, and analyse the correlation of the stochastic parameters in the model by Pearson’s correlation coefficient method. This method can effectively ensure the reliability of the selection of the parameters in the model and suggest more specific improvement measures for the water resources allocation scheme of the Tingjiang River basin.
The uncertainty and variability of influencing factors such as water resource quantity, pollutant discharge, treatment level, and regional minimum development needs may lead to more complicated and challenging scheme designs in water resource allocation [14]. The three common methods for dealing with multiple random variables in the research process are interval programming, random programming, and fuzzy programming [15,16]. The interval programming method may be used to solve a system with uncertain bounded parameters, and the introduction of intervals reduces the uncertainty of parameters [17,18]. The programming model for performing the dynamic management of farm water under indeterminate conditions, based on the interval chance-constraint, has incorporated the uncertainty of interval and probability information for the dynamic analysis of water resources during the planning period. An incorporation that was achieved by Zhang et al. [19]. When the constraints are unknown parameters, the stochastic programming method, which combines two-stage programming and opportunity-constrained programming, investigates the maximum expected value of returns. Meng et al. developed an optimum resource allocation model built for the basin by adopting two-stage stochastic planning and downward risk management that reduced the risk of water resources utilization and improved the comprehensive benefits of the basin under three hydrological scenarios (low, medium, and high) [20]. By developing an opportunity constrained programming model based on parameters consistent with lognormal distribution (rainfall, runoff, etc.), the non-point source pollution caused by agricultural production was reduced with the assistance of decision-makers in determining the optimal production mode under complex and uncertain conditions [21]. The fuzzy method was utilized to solve the fuzzy parameters in the model to minimize the fuzziness of variables [22]. The algorithm-solving model developed based on fuzzy optimization, by reducing the indeterminate effects of Chaohu lake using fuzzy variables, demonstrated the significance of government policies and growth in watershed ecosystems and thereby filled the gaps in the environmental measures of the government [23]. The Tingjiang River basin is a large inter-provincial basin with various influencing factors. Hence, the uncertainties in water resources allocation cannot be effectively solved with mere two-stage stochastic planning, which puts the decision-makers at great risk. To further limit the influence of uncertain factors in the basin, several studies have advocated the use of the chance-constraint method based on the two-stage stochastic programming method. For example, Ranarahu et al. reduced the influence of uncertain factors using a new optimization model by combining two-stage stochastic programming and opportunity constrained programming methods in the fuzzy constraint environment to solve more complex, realistic environmental and economic problems [24].
Spatial and temporal variability in water availability is driven by a complex combination of social, economic and natural factors, including the impact of multiple factors such as water use coming online, water development and management [25,26]. Pearson’s correlation coefficient measures the correlation between each driver and water allocation as well as the correlation between drivers [27]. Hu et al. proposed a water quality prediction method based on deep LSTM learning networks, using techniques such as linear interpolation to repair and correct water quality data, and using Pearson correlation coefficients to obtain correlations between parameters such as pH and water temperature to construct models with prediction accuracies of over 95% in both short- and long-term predictions [28]. Lon et al. used PCA and Pearson’s correlation coefficient statistical methods to assess water quality testing indicators (turbidity, ammonia nitrogen, conductivity, phosphate, etc.) for Budeasa Reservoir from 2005 to 2009, as well as to assess the quality of Budeasa Reservoir as a cited water source [29]. Rodriguez used the Pearson test to study the chemical composition of tap water and bottled water in Spain and found that calcium and magnesium concentrations and bicarbonate and sodium concentrations were highly correlated, and that water was classified according to calcium and magnesium, bicarbonate and sodium concentrations to provide patients with the best choice of drinking water [30]. Godeke et al. used an autocorrelation function to analyse the relationship between water quality changes and climate change in Brunei and found that climate change manifested itself in reduced precipitation and increased precipitation intensity, with the highest correlation between turbidity and colour and a Pearson correlation coefficient greater than 0.8, highlighting the importance of water management in climate change [31].
Therefore, interval programming, two-stage programming, chance-constraint programming, and fuzzy programming methods are integrated to construct an interval-fuzzy two-stage chance-constraint model (IFTSC) to further reduce the influence of uncertain factors in the model and improve Hao’s research on IFTS model [13]. The IFTSC model is used to optimize the water resources allocation scheme of the Tingjiang River basin by the scientific adjustment of the original water resources allocation scheme, shortening the decision-making scope and reduction of the decision risks of decision-makers under five hydrological scenarios such as extreme abundance, abundance, normal flow, dryness, and extreme dryness. Considering the minimum development requirements, pollution discharge levels, and several other factors to ensure the rationality and scientific nature of the water resources allocation scheme in the Tingjiang River basin, the economic benefits are optimized using the IFTSC model. In addition, Pearson correlation coefficients have been used to correlate the hydrological conditions and water allocation results of the Tingjiang River Basin and the overall economic benefits of the Tingjiang River basin to explore the dominant factors affecting water allocation and economic benefits of the Tingjiang River basin. In this paper, on the basis of improving the water resources allocation model of the Tingjiang River basin, the Pearson correlation coefficient method is used to check the correlation between each stochastic parameter in the model and the water resources allocation to ensure the reliability of each stochastic parameter in the model. Similarly, the correlation of each parameter is analysed according to the Pearson correlation coefficient method to provide a more accurate reference basis for the water resources allocation of the Tingjiang River basin. The results show that the IFTSC model provides scientific and reasonable suggestions for managers to protect the ecological environment of the Tingjiang River basin, improve the efficiency of water resources use and improve the quality of the water environment.

2. Case Study

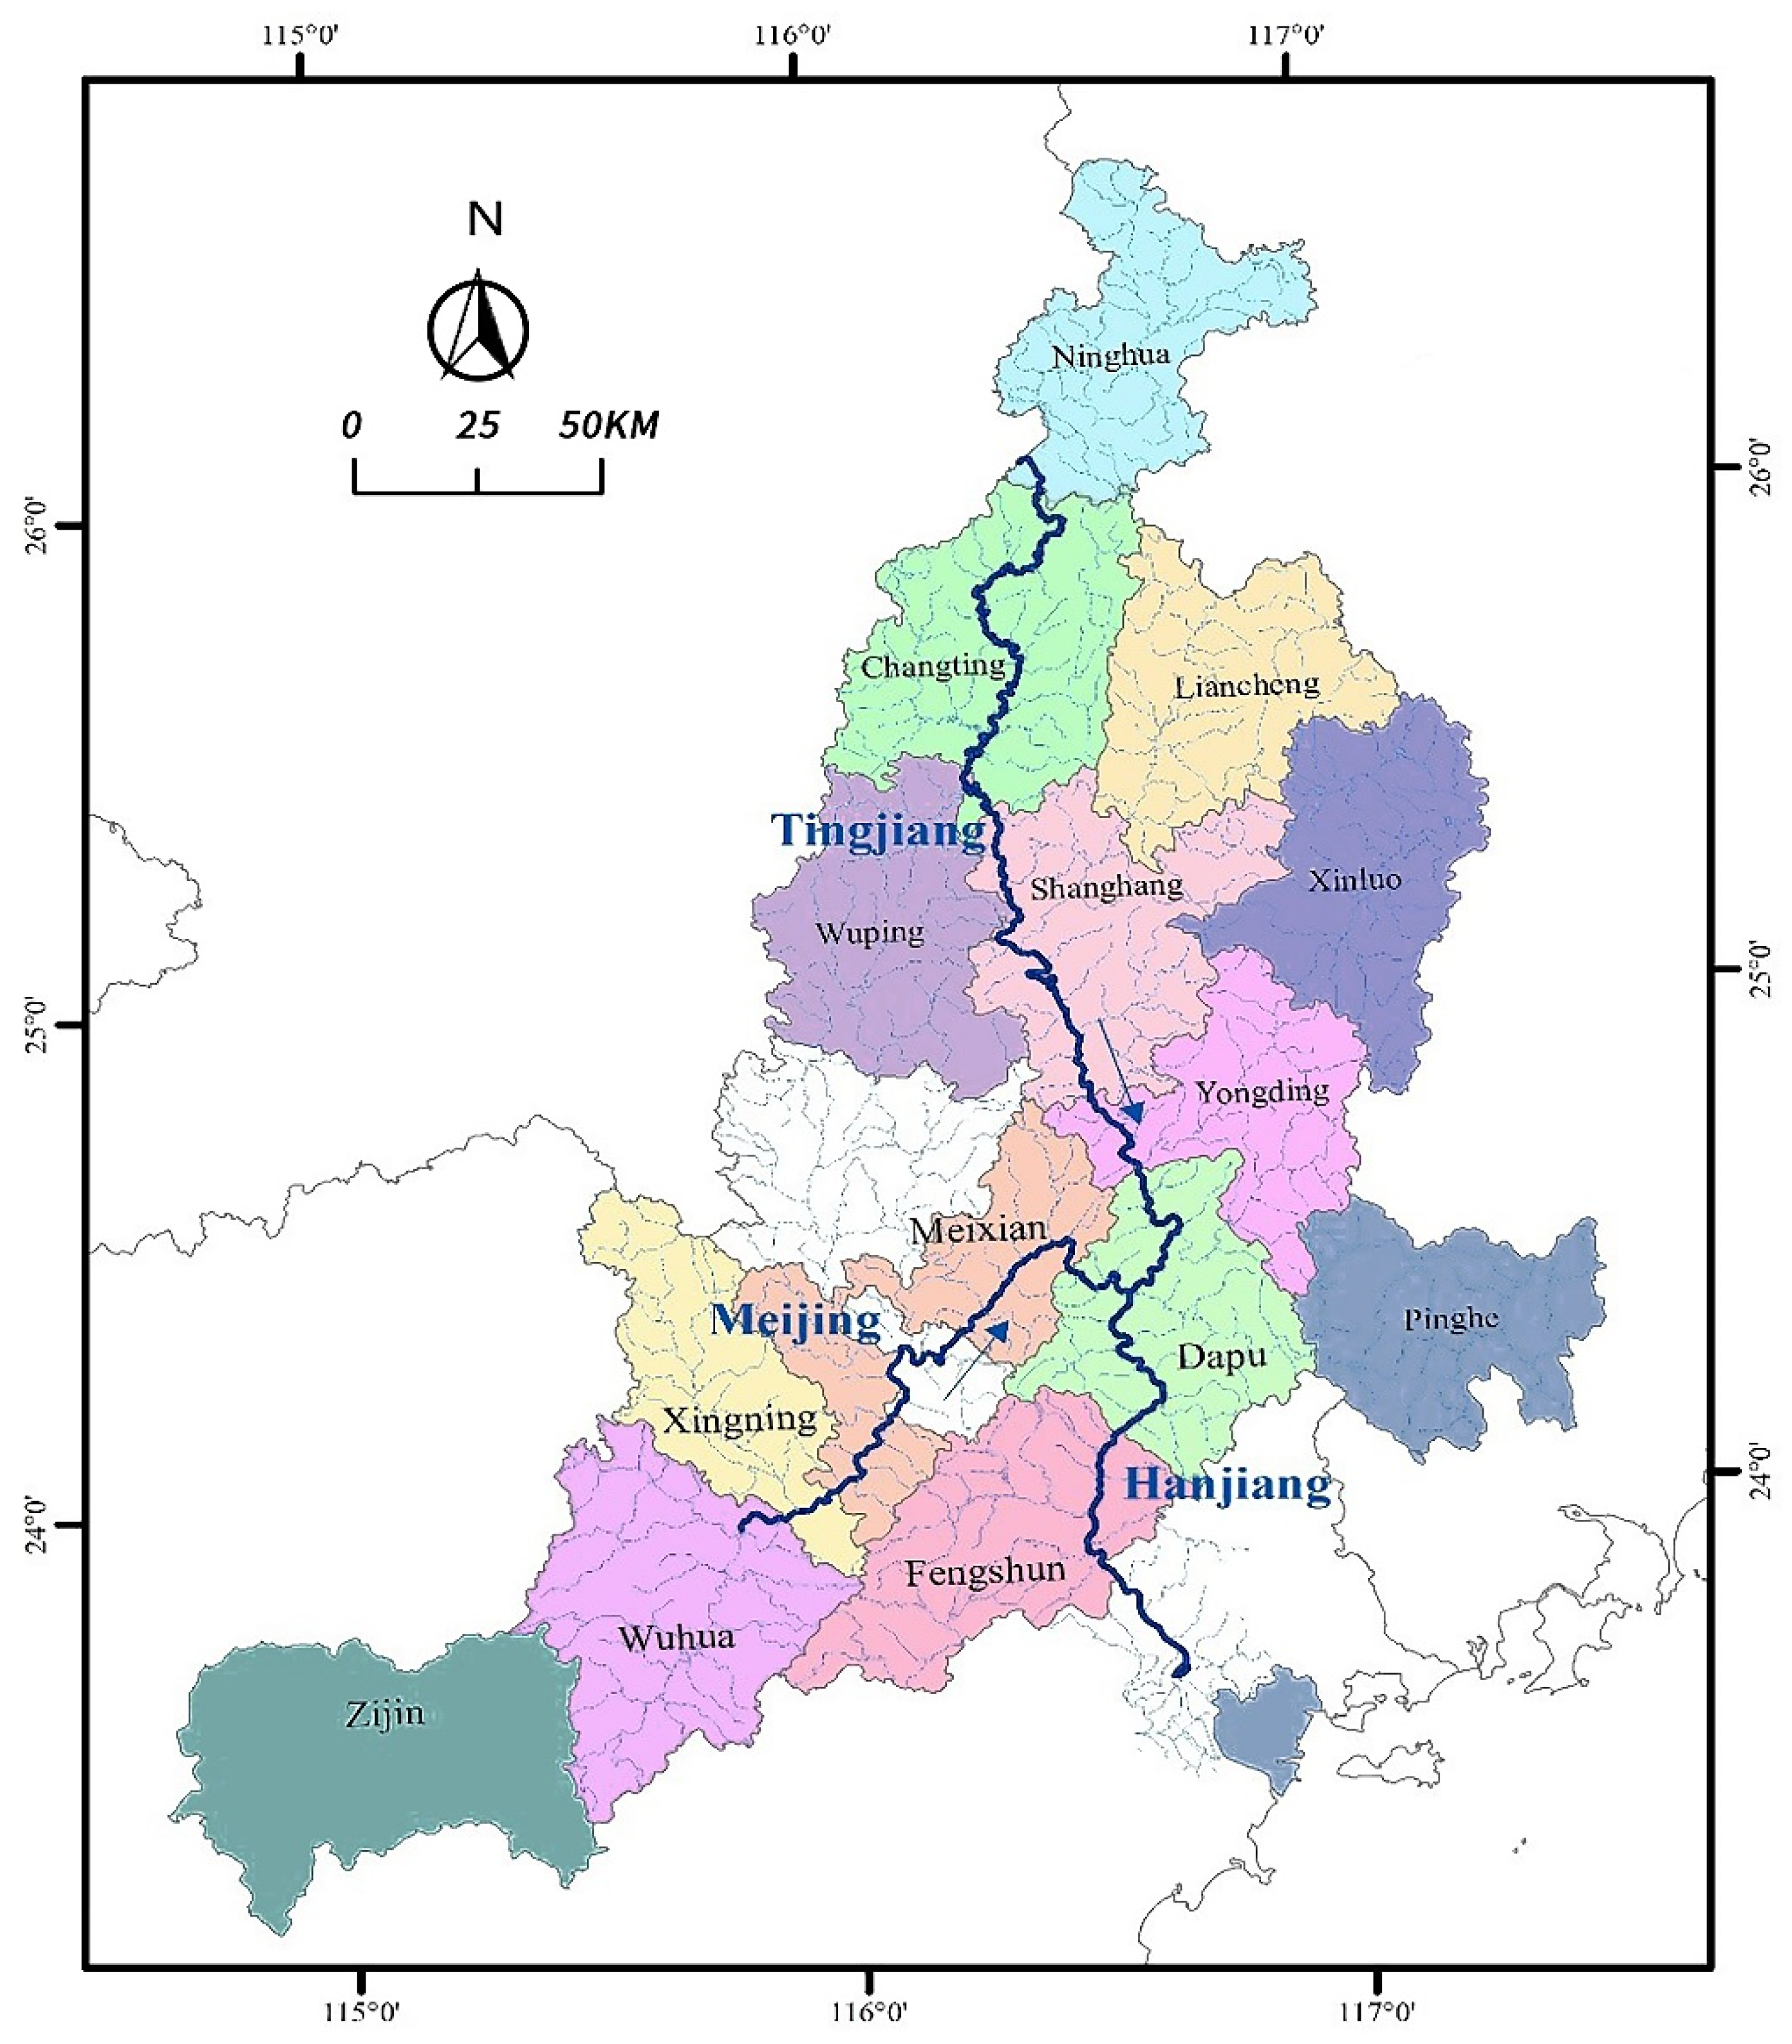
2.1. Natural Characteristics and Optimization Background of the Tingjiang River Basin

The Tingjiang River basin, the tributary of the Hanjiang River in Guangdong province and the largest river in western Fujian province of China, originates in Ninghua county [32,33]. The natural profile of the Tingjiang River basin is shown in Figure 1. The Tingjiang River basin belongs to a subtropical monsoon climate, with precipitation reaching its peak from May to July and an annual average of 1500–2000 mm, with precipitation progressively decreasing from north to south [34]. There are around 28,156 water conservancy projects in the Tingjiang River basin related to drinking water, water storage, hydropower, and dikes, among which 122 are small (II) or above reservoirs and 19 are small (I) reservoirs [35].
The Tingjiang River basin is an important water source with many water function protection areas. In order to ensure the hydro environmental quality and a controlled ecosystem balance, the Fujian province has been steadily managing and improving the adverse effects of polluting industries in the basin and the limited development of basins in response to substantial economic pressures [36]. Further, Guangdong province aims to improve the water quality and the volume of water in the basin for its development [37]. The national government allocated a total of 100 million CNY from 2012 to 2013 to prevent water pollution at the sources in the Tingjiang River basin. However, as the Tingjiang River basin is a cross-provincial basin with complex situations and slow work progress, the Fujian province and Guangdong Province formulated an eco-compensation system in 2016, and the Tingjiang River basin thereby became the second inter-provincial watershed of the eco-compensation pilot in China behind the Xinan River [38]. In recent years, China has played a significant role in eco-environmental protection by improving the water quality of the Tingjiang River basin through an eco-compensation system. However, the pollution problems caused by animal husbandry and industry in the Tingjiang River basin remain unsolved, posing the risk of the eco-environment becoming increasingly severe. Therefore, a more scientific analysis of water allocation policies in the Tingjiang River basin is needed to propose more specific water allocation options that will improve the efficiency of water use and reduce the risk of decision making for policy makers.

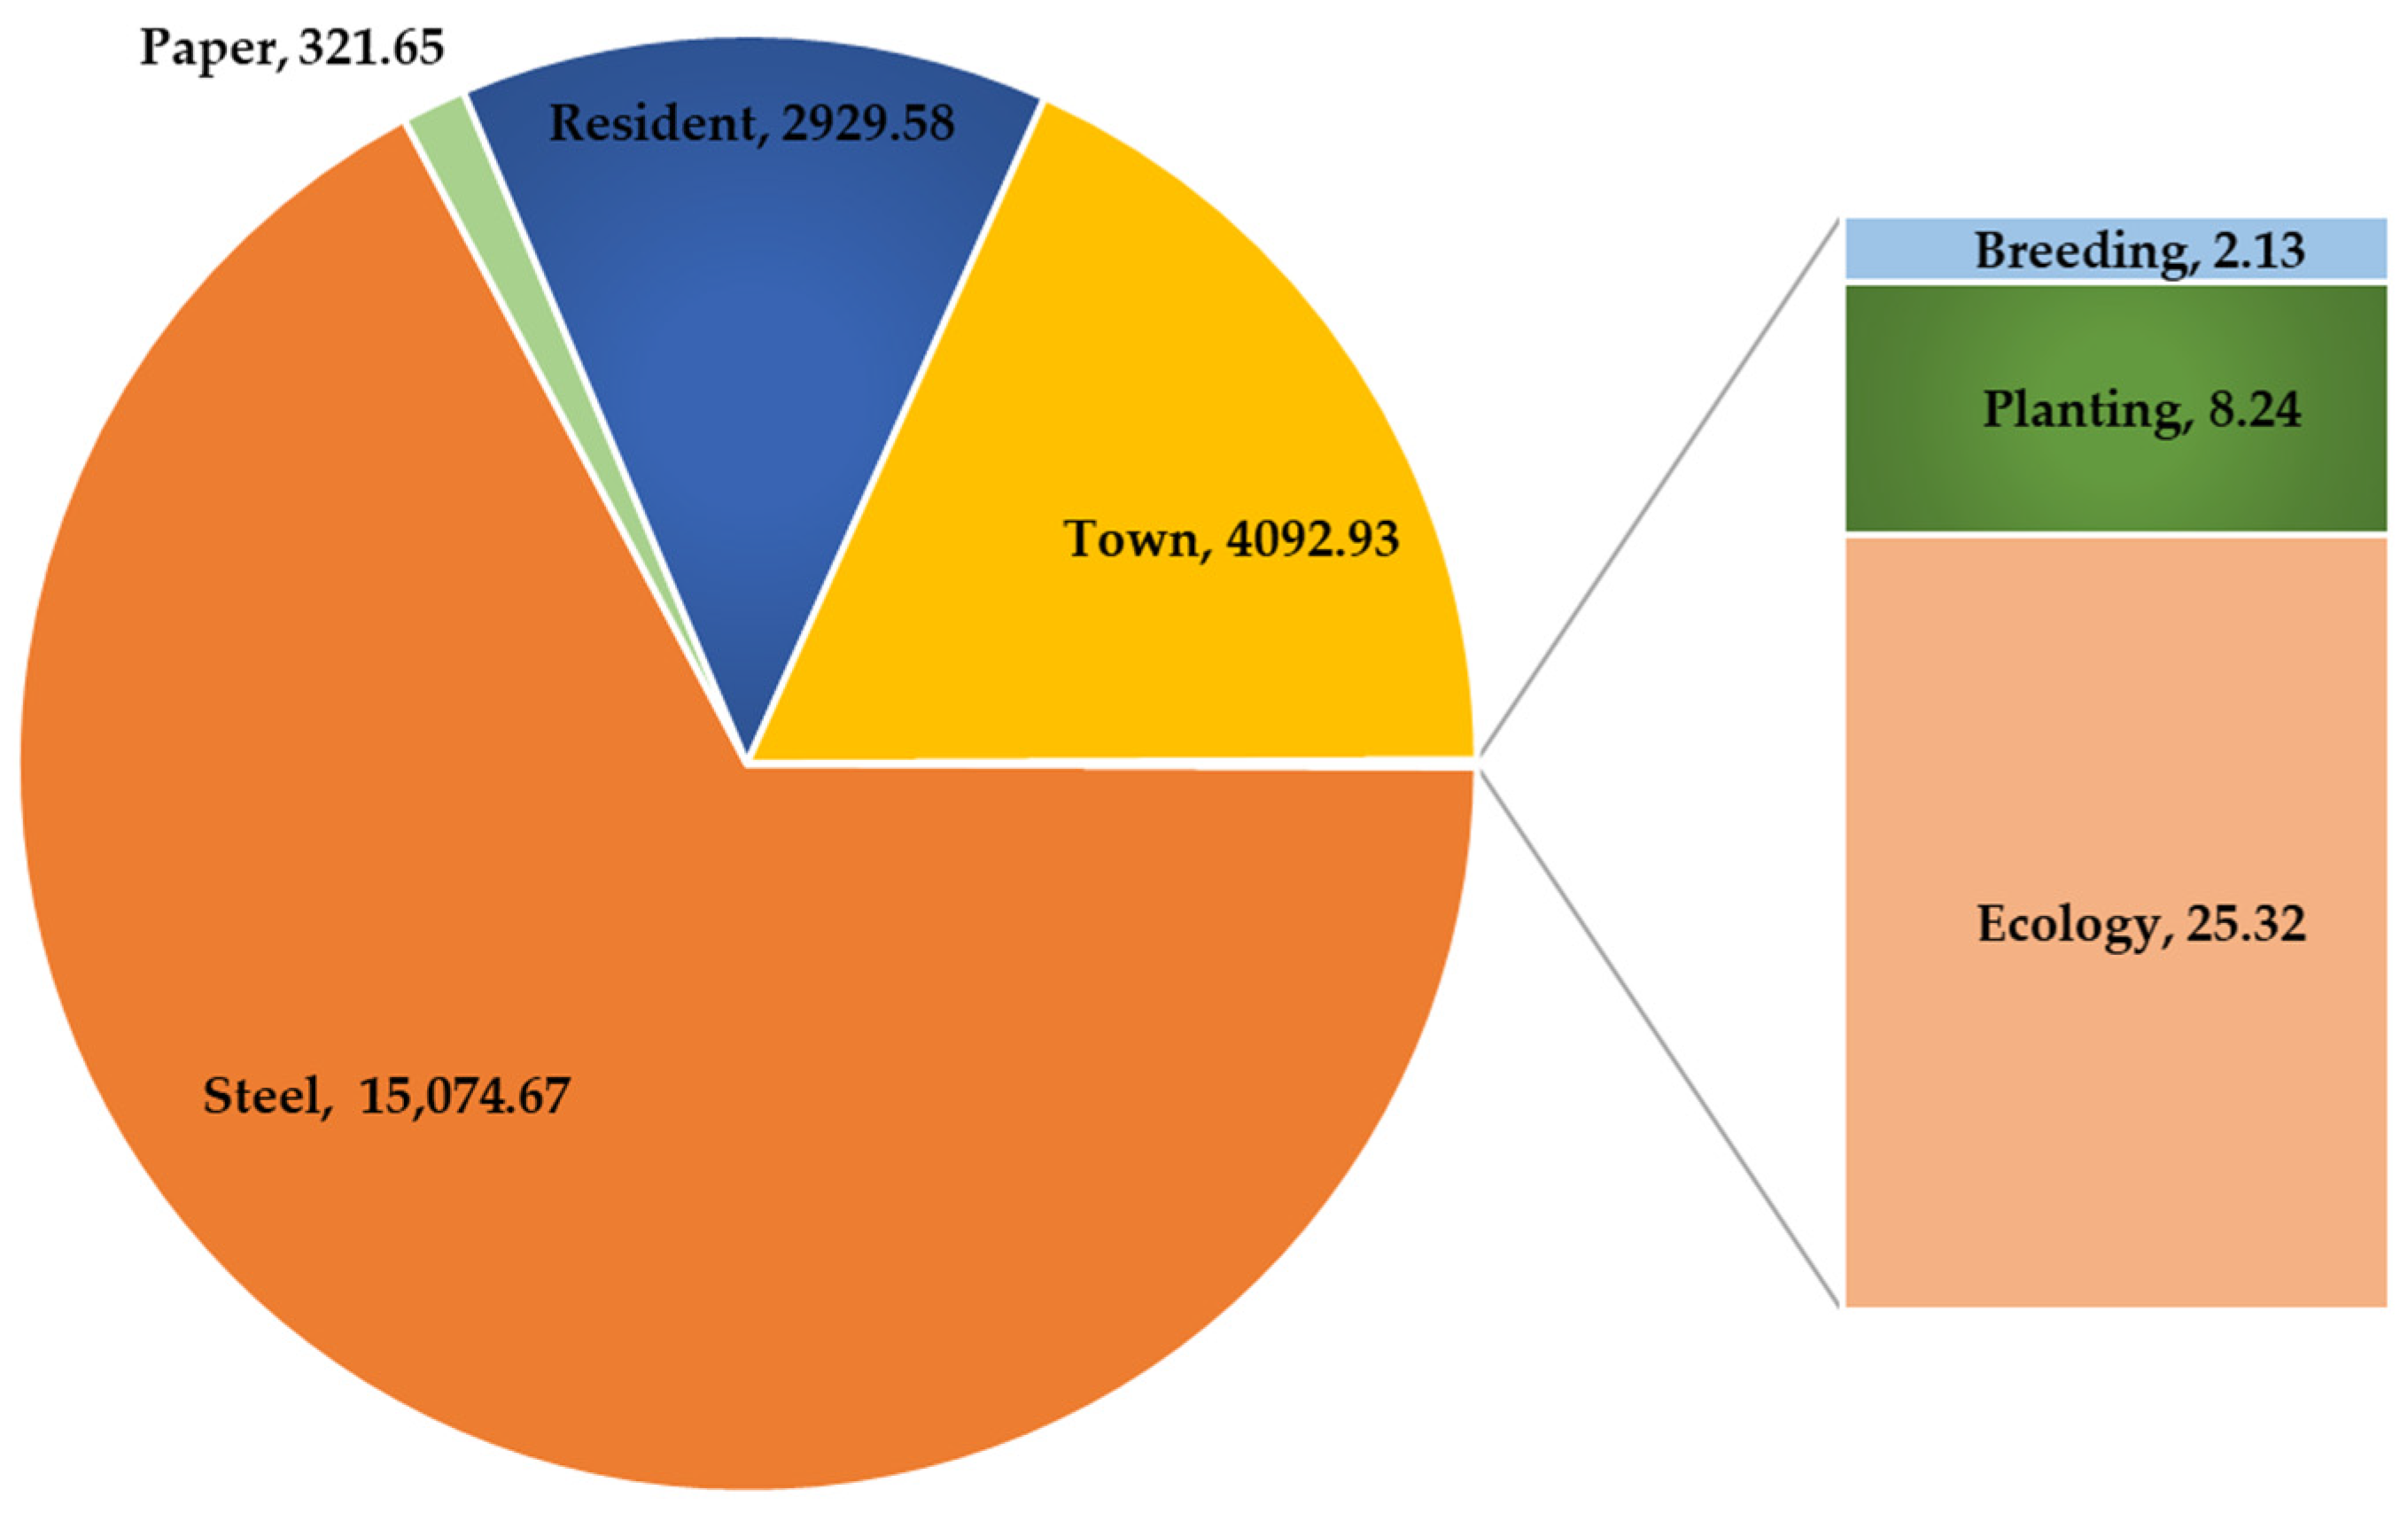
2.2. Research Object and Constraint Parameters

Around 14 districts and counties (Liancheng county, Shanghang county, etc.) and five hydrological scenarios (extreme abundance, abundance, normal flow, dryness, and extreme dryness hydrological scenarios) in Fujian and Guangdong provinces were studied using interval fuzzy two-stage (IFTS model) [13]. The objective of the study included the optimal economic benefit of the Tingjiang River basin, while the constraint conditions included the upper limit of water resources utilization and the minimum development requirements of each district and county. At the same time, the chance-constraint optimization method was employed in IFTS, with the model employed to deal with the constraint conditions of regional minimum development requirements. Further, an optimized interval-fuzzy two-stage chance-constraint model (IFTSC) was developed to reduce the influence of uncertain factors in the model and the decision-making risks. Using the constraints involved in the water resources allocation modelling process, such as the upper line of water resources use, integrated pollution production coefficient, regional development requirements and water price, as independent variables, and the water resources allocation results of the Tingjiang River basin and the economic benefits of each administrative unit as dependent variables, Pearson correlation analysis was conducted to further improve the accuracy of the model and explore the main factors affecting water resources allocation and economic benefits of the basin.

3. Model Formulation

3.1. Watershed IFTSC Model Construction

The existing water resources allocation was adjusted and refined to maximize the overall economic benefit of the Tingjiang River basin. The Tingjiang River basin covers several districts and counties, with complex and unpredicted natural factors such as climate and rainfall across the basin. Furthermore, each district and county in the Tingjiang River basin has distinct development status and goals. The uncertainty of the model is reduced by two-stage optimization and opportunity-constrained programming. The parameters of the Tingjiang River basin are mostly conventional monitoring values from monitoring stations, and hence the data are miscellaneous. Therefore, each parameter in this study is presented as an interval to improve its representativeness, universality, and scientificity. The fuzzy optimization method was utilized to cope with the fuzzy uncertainty caused by the maximum amount of water in the Tingjiang River basin. Therefore, this study used the IFTS model to determine the optimal economic benefit of the basin, wherein the upper limit of water resources utilization and the minimum development requirements of each district and county were considered constraints. An interval-fuzzy two-stage chance-constraint model (IFTSC) was built to determine the optimal water allocation and the water scarcity in each sector and industry. The coordinated development of various administrative units was promoted, and the water environment and ecological status of the basin were improved to achieve maximum economic benefit for each district and county. In the IFTSC model, “+” represents the upper limit of the parameter, and “-” represents the lower limit of the parameter. The equations involved in the IFTSC model are mainly from the study by Qiu [35] and Hao [13] et al. for the Tingjiang River basin. IFTSC model is as follows:
Objective function:
max = t ±   ( 0 t 1 )
where t ± represents the membership degree of fuzzy function.
Constraints:
(1)
Economic scale constraints [13]:
f 1 ± f 2 ± f 3 ± f 4 ± f 5 ± f ( 1 t ± ) · ( f f )  
f 1 ± = j = 1 I k = 1 3 m = 1 M N B j k m ± · I S O P T j k m
f 2 ± = j = 1 I k = 1 K m = 1 M W R j k ± · I S O P T j k m  
f 3 ± = j = 1 J k = 1 3 m = 1 M δ j k m ± · I S O P T j k m · S T C j k m ±  
f 4 ± = j = J 1 + 1 J 2 k = 1 3 m = 1 M W R D j ± · η · | λ |
f 5 ± = h = 1 5 P h · P N B h ± · D I S h ±
(2)
The water resources utilization online:
The water resource utilization of various industries in each region of the basin complies with the water resource utilization stipulated by the state [35]:
m = 1 M I S O P T j k m D I S j k m h ± I W U L j k ± ;   j , k , h    
The water resources for different regions in the basin should be sufficient to fulfil the upper limit of regional water consumption [13]:
k = 1 K m = 1 M I S O P T j k m D I S j k m h ± R W U L j + ( 1 t ± ) · ( R W U L j + R W U L j ) ;   j , h    
The water resources allocation in each region of the basin should fulfil the ecological water consumption of “three lines and one order” [35]:
m = 1 M I S O P T j k m D I S j k m h ± E C S j ± ;   j , h , k = 4    
The total amount of water resources allotted for each region in the basin does not exceed the maximum available water resources in the basin [13]:
j = 1 J k = 1 K m = 1 M I S O P T j k m D I S j k m h ± T A W R ± ( 1 t ± ) · ( T A W R + T A W R ) ;   h
(3)
Water quality requirements in the basin:
The discharge and concentration of pollutants in the basin should comply with the relevant regulations of the national and local governments [35]:
k = 1 2 m = 1 M ( I S O P T j k m D I S j k m h ± ) · ξ j k m r ± · γ j k m r ± + ( I S O P T j k m D I S j k m h ± ) · ξ j 3 m r ± A E P j r ± ;   j , r , h  
(4)
Minimum development requirements for each region in the basin:
The allocation of water resources in each region of the basin should fulfil the minimum water resource needs of each region:
Pr { j = 1 J i m = 1 M P N B ( ω ) j k m ± · ( I S O P T j k m D I S j k m h ± ) DSL ( ω ) i k ± ;   k , i = 1 } 1 θ
Pr { j = J 1 + 1 J i m = 1 M P N B ( ω ) j k m ± · ( I S O P T j k m D I S j k m h ± ) DSL ( ω ) i k ± ;   k , i = 2 } 1 θ

3.2. Solution of IFTSC Model for Watershed

The IFTSC model uses four optimization methods to provide optimal economic benefits: interval programming, two-stage programming, chance-constrained programming, and fuzzy programming. As part of solving the model, it is divided into sub-models of upper and lower limits. First, solve the upper limit sub-model:
Objective function:
max = t +   ( 0 t 1 )
Constraints:
f 1 + f 2 f 3 f 4 f 5 f ( 1 t + ) · ( f f )
f 1 + = j = 1 I k = 1 3 m = 1 M N B j k m + · I S O P T j k m
f 2 = j = 1 I k = 1 K m = 1 M W R j k · ( I S O P T j k m h = 1 H P h · D I S j k m h )
f 3 = j = 1 J k = 1 3 m = 1 M δ j k m · ( I S O P T j k m h = 1 H P h · D I S j k m h ) · S T C j k m
f 4 = j = J 1 + 1 J 2 k = 1 3 m = 1 M W R D j · ( I S O P T j k m h = 1 H P h · D I S j k m h ) · η · | λ |
f 5 = h = 1 5 P h · P N B h · D I S h  
m = 1 M I S O P T j k m D I S j k m h I W U L j k + ;   j , k  
k = 1 K m = 1 M I S O P T j k m D I S j k m h R W U L j + ( 1 t + ) · ( R W U L j + R W U L j ) ;   j  
m = 1 M I S O P T j k m D I S j k m h E C S j + ;   j , k = 4
j = 1 J k = 1 K m = 1 M I S O P T j k m D I S j k m h T A W R + ( 1 t + ) · ( T A W R + T A W R )
k = 1 2 m = 1 M ( I S O P T j k m D I S j k m h ) · ξ j k m r · γ j k m r + ( I S O P T j k m D I S j k m h ) · ξ j 3 m r A E P j r + ;   j , r
Pr { j = 1 J i m = 1 M N B ( ω ) j k m + · ( I S O P T j k m D I S j k m h ) DSL ( ω ) i k + ;   k , i = 1 } 1 θ
Pr { j = J 1 + 1 J i m = 1 M N B ( ω ) j k m + · ( I S O P T j k m D I S j k m h ) DSL ( ω ) i k + ;   k , i = 2 } 1 θ
The inequality (27) and (28) are solved by converting the two equations into Equations (29) and (30), with a default risk θ of 0.05 and a confidence level of 0.95 [39].
j = 1 J i m = 1 M ( μ 1 + · ( I S O P T j k m D I S j k m h ) φ 1 + ) Φ 1 ( 1 θ ) j = 1 J i m = 1 M ( σ 1 + · ( I S O P T j k m D I S j k m h ) ) 2 + ( ε 1 + ) 2 0   k ,   i = 1
j = J 1 + 1 J i m = 1 M ( μ 2 + · ( I S O P T j k m D I S j k m h ) φ 2 + ) Φ 1 ( 1 θ ) j = J 1 + 1 J i m = 1 M ( σ 2 + · ( I S O P T j k m D I S j k m h ) ) 2 + ( ε 2 + ) 2 0   k ,   i = 2
ISOPT j k m = I S j k m + + K N j k m · ( I S j k m + I S j k m ) ; 0 K N j k m 1  
The upper limit sub-model solved the optimal water resource allocation parameter I S O P T j k m in the first stage of the Tingjiang River basin, and the lower limit of the penalty value D I S in the second stage of the water resource allocation. Taking I S O P T j k m as constraint condition, the lower limit sub-model is solved:
Objective function:
max = t +   ( 0 t 1 )  
Constraints:
f 1 f 2 + f 3 + f 4 + f 5 + f ( 1 t + ) · ( f f )
f 1 = j = 1 I k = 1 3 m = 1 M N B j k m · I S O P T j k m
f 2 + = j = 1 I k = 1 K m = 1 M W R j k + · ( I S O P T j k m h = 1 H P h · D I S j k m h + )
f 3 + = j = 1 J k = 1 3 m = 1 M δ j k m + · ( I S O P T j k m h = 1 H P h · D I S j k m h + ) · S T C j k m +
f 4 + = j = J 1 + 1 J 2 k = 1 3 m = 1 M W R D j + · ( I S O P T j k m h = 1 H P h · D I S j k m h + ) · η · | λ |
f 5 + = h = 1 5 P h · P N B h + · D I S h +
m = 1 M I S O P T j k m D I S j k m h + I W U L j k ;   j , k
k = 1 K m = 1 M I S O P T j k m D I S j k m h + R W U L j + ( 1 t ) · ( R W U L j + R W U L j ) ;   j
m = 1 M I S O P T j k m D I S j k m h + E C S j ;   j , k = 4
j = 1 J k = 1 K m = 1 M I S O P T j k m D I S j k m h + T A W R + ( 1 t ) · ( T A W R + T A W R )
k = 1 2 m = 1 M ( I S O P T j k m D I S j k m h + ) · ξ j k m r + · γ j k m r + + ( I S O P T j k m D I S j k m h + ) · ξ j 3 m r + A E P j r ;   j , r
Pr { j = 1 J i m = 1 M N B ( ω ) j k m · ( I S O P T j k m D I S j k m h + ) DSL ( ω ) i k ;   k , i = 1 } 1 θ
Pr { j = J 1 + 1 J i m = 1 M N B ( ω ) j k m · ( I S O P T j k m D I S j k m h + ) DSL ( ω ) i k ;   k , i = 2 } 1 θ
The inequality (44) and (45) are solved by converting the two equations into Equations (46) and (47):
j = 1 J i m = 1 M ( μ 1 · ( I S O P T j k m D I S j k m h + ) φ 1 ) Φ 1 ( 1 θ ) j = 1 J i m = 1 M ( σ 1 · ( I S O P T j k m D I S j k m h + ) ) 2 + ( ε 1 ) 2 0   k , i = 1
j = J 1 + 1 J i m = 1 M ( μ 2 · ( I S O P T j k m D I S j k m h + ) φ 2 ) Φ 1 ( 1 θ ) j = J 1 + 1 J i m = 1 M ( σ 2 · ( I S O P T j k m D I S j k m h + ) ) 2 + ( ε 2 ) 2 0   k ,   i = 2
The upper limit of the second-stage penalty value in water resource allocation, D I S + , is obtained from the lower limit sub-model. A comprehensive analysis of upper limit and lower limit sub-models of the IFTSC model was used to find the optimal water allocation scheme and eco-compensation quota to reduce the decision-making risk in the basin.

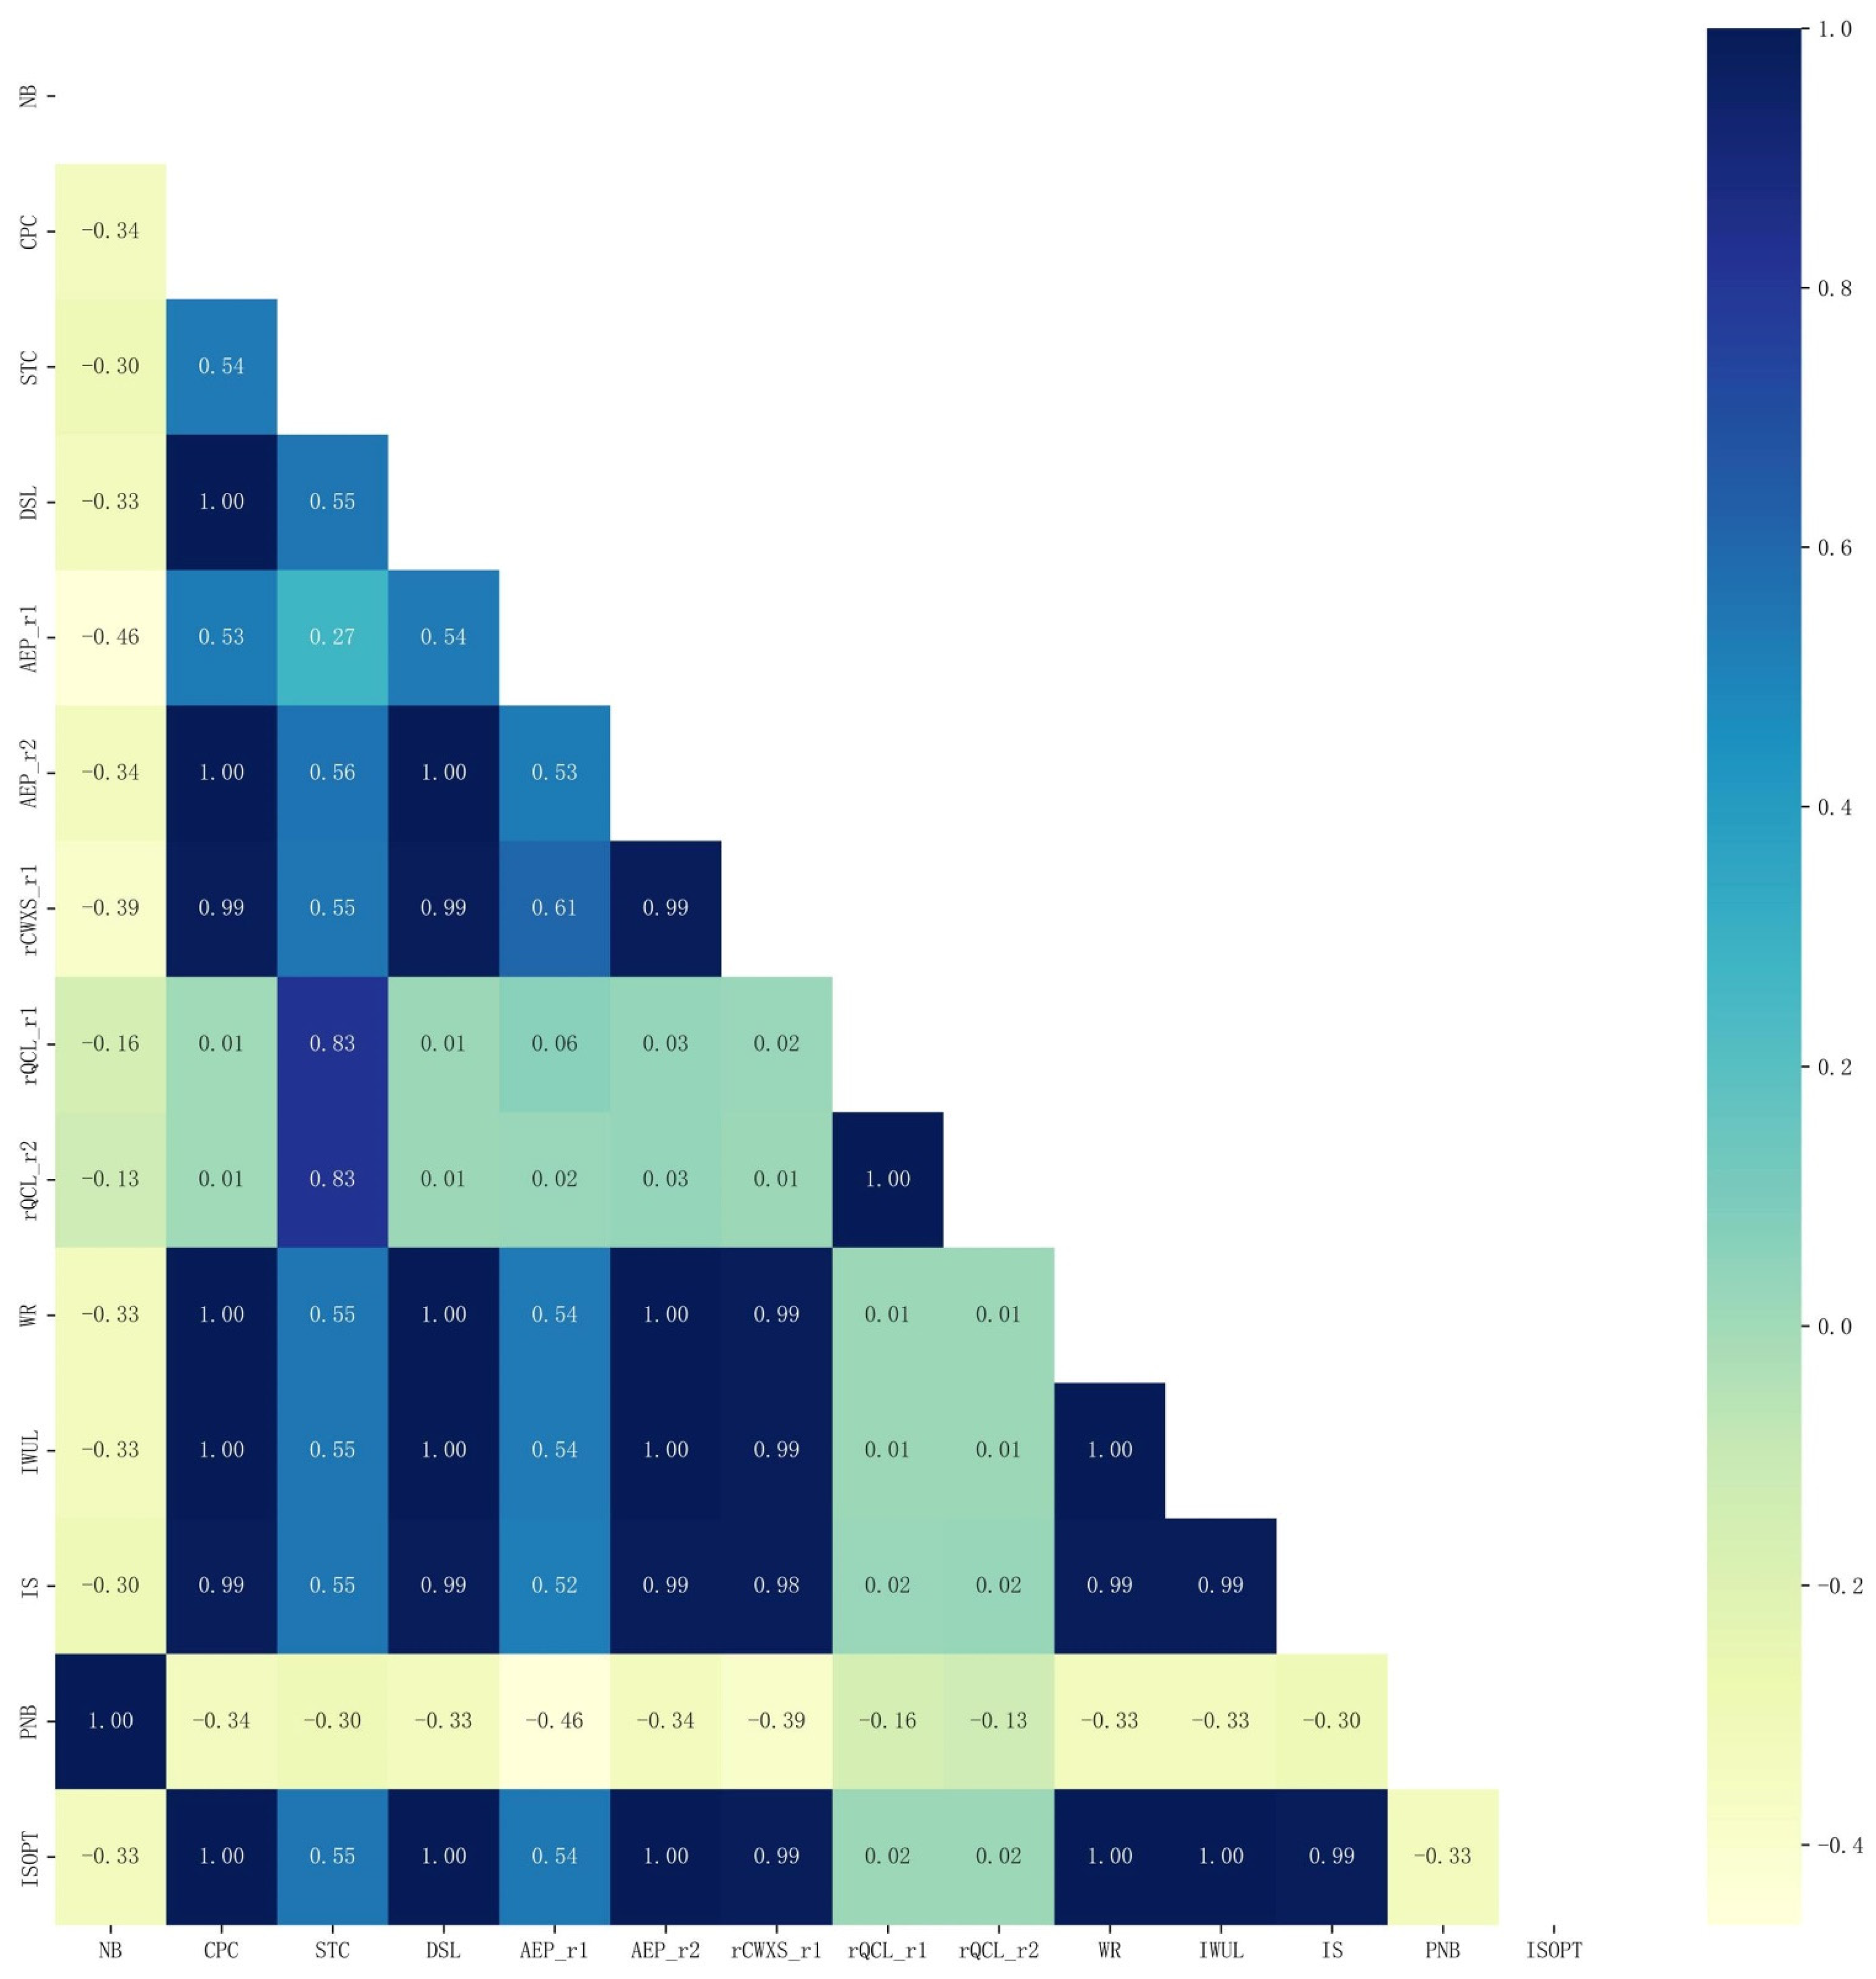
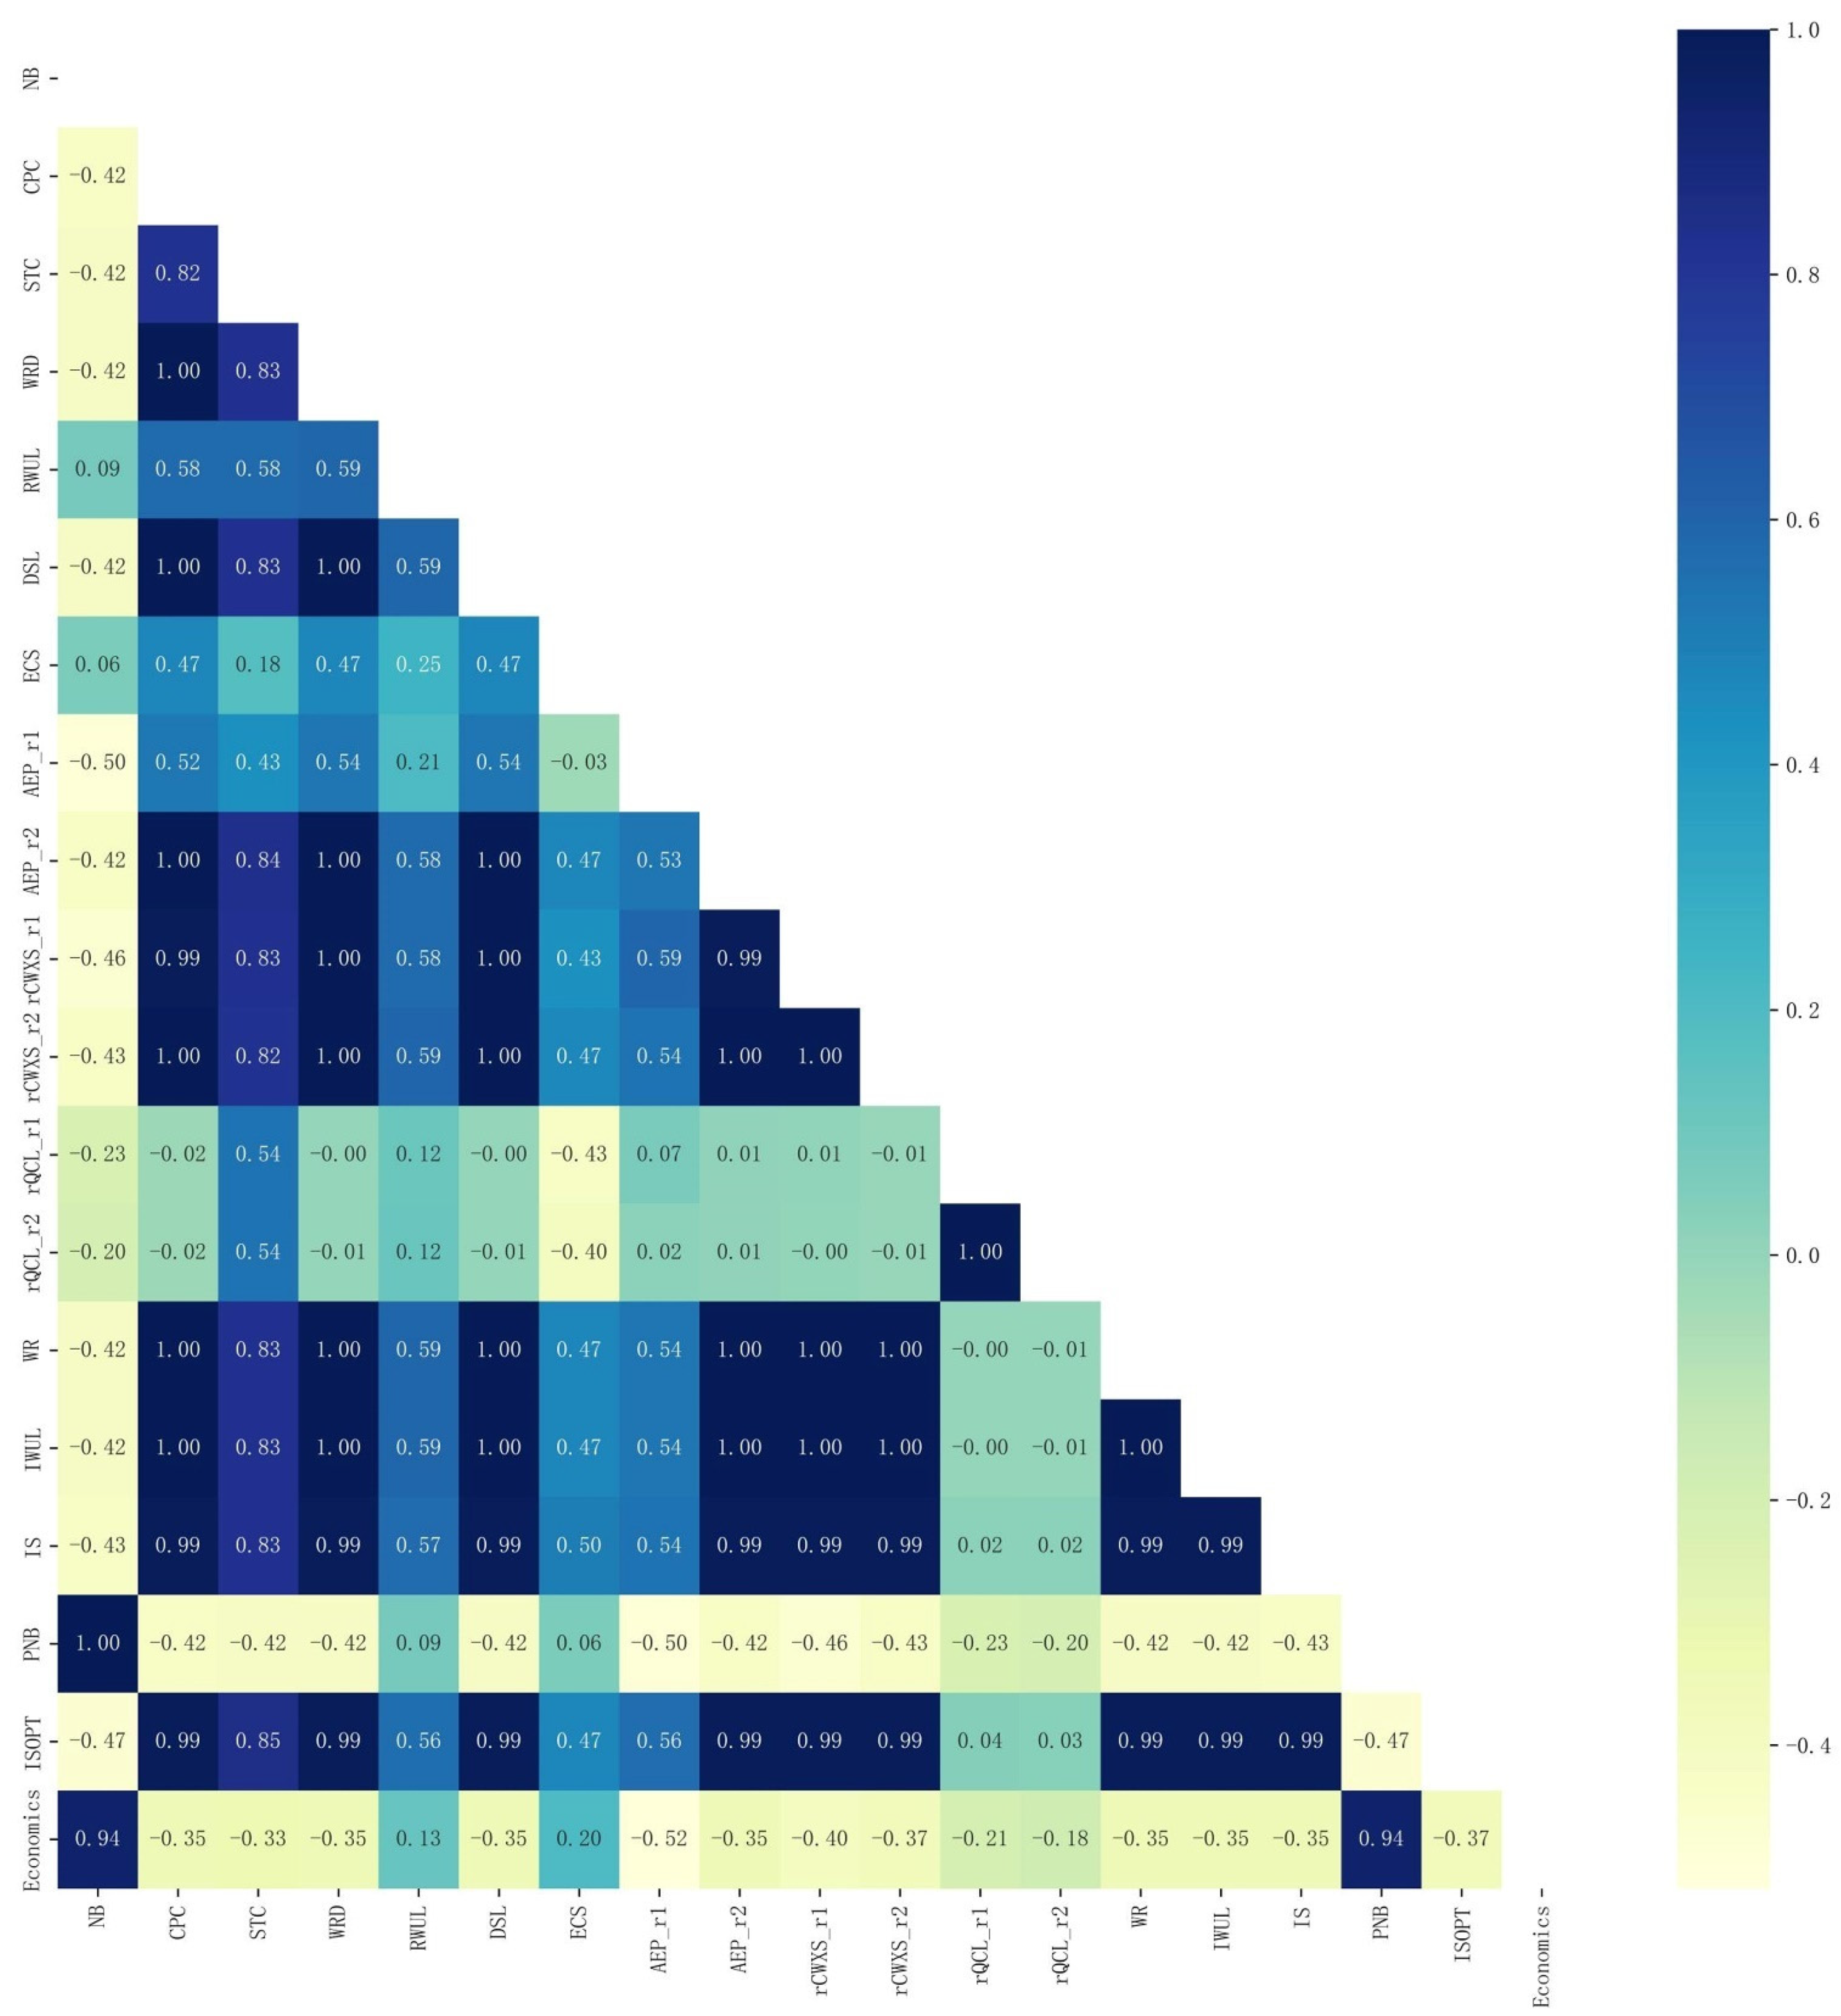
3.3. Correlation Analysis Model Based on Pearson’s Correlation Coefficient

Pearson’s correlation coefficient is widely used to measure the degree of correlation between two variables and has a value between −1 and 1 [40,41]. In this study, Pearson’s correlation coefficient is used to measure the correlation between the model water allocation results, economic efficiency results, and the random variables in the model.
r i j =   ( x i x ¯ ) ( y i y ¯ )   ( x i x ¯ ) 2   ( y i y ¯ ) 2          
x i and y i are any two variables in the IFTSC model (DSL, ISOPT, WR etc.), x ¯ and y ¯ are the means of any two variables, and r is the correlation between any two variables. The larger the absolute value of the correlation coefficient, the greater the correlation between the two variables (see Table 1 for the specific correlation relationship), i.e., the closer | r | is to 1, the higher the correlation. A positive value of r indicates a positive correlation, while a negative value of r indicates a negative correlation [42]. Table 1 shows the Pearson correlation coefficient intervals and correlation magnitudes.

4. Results and Discussion

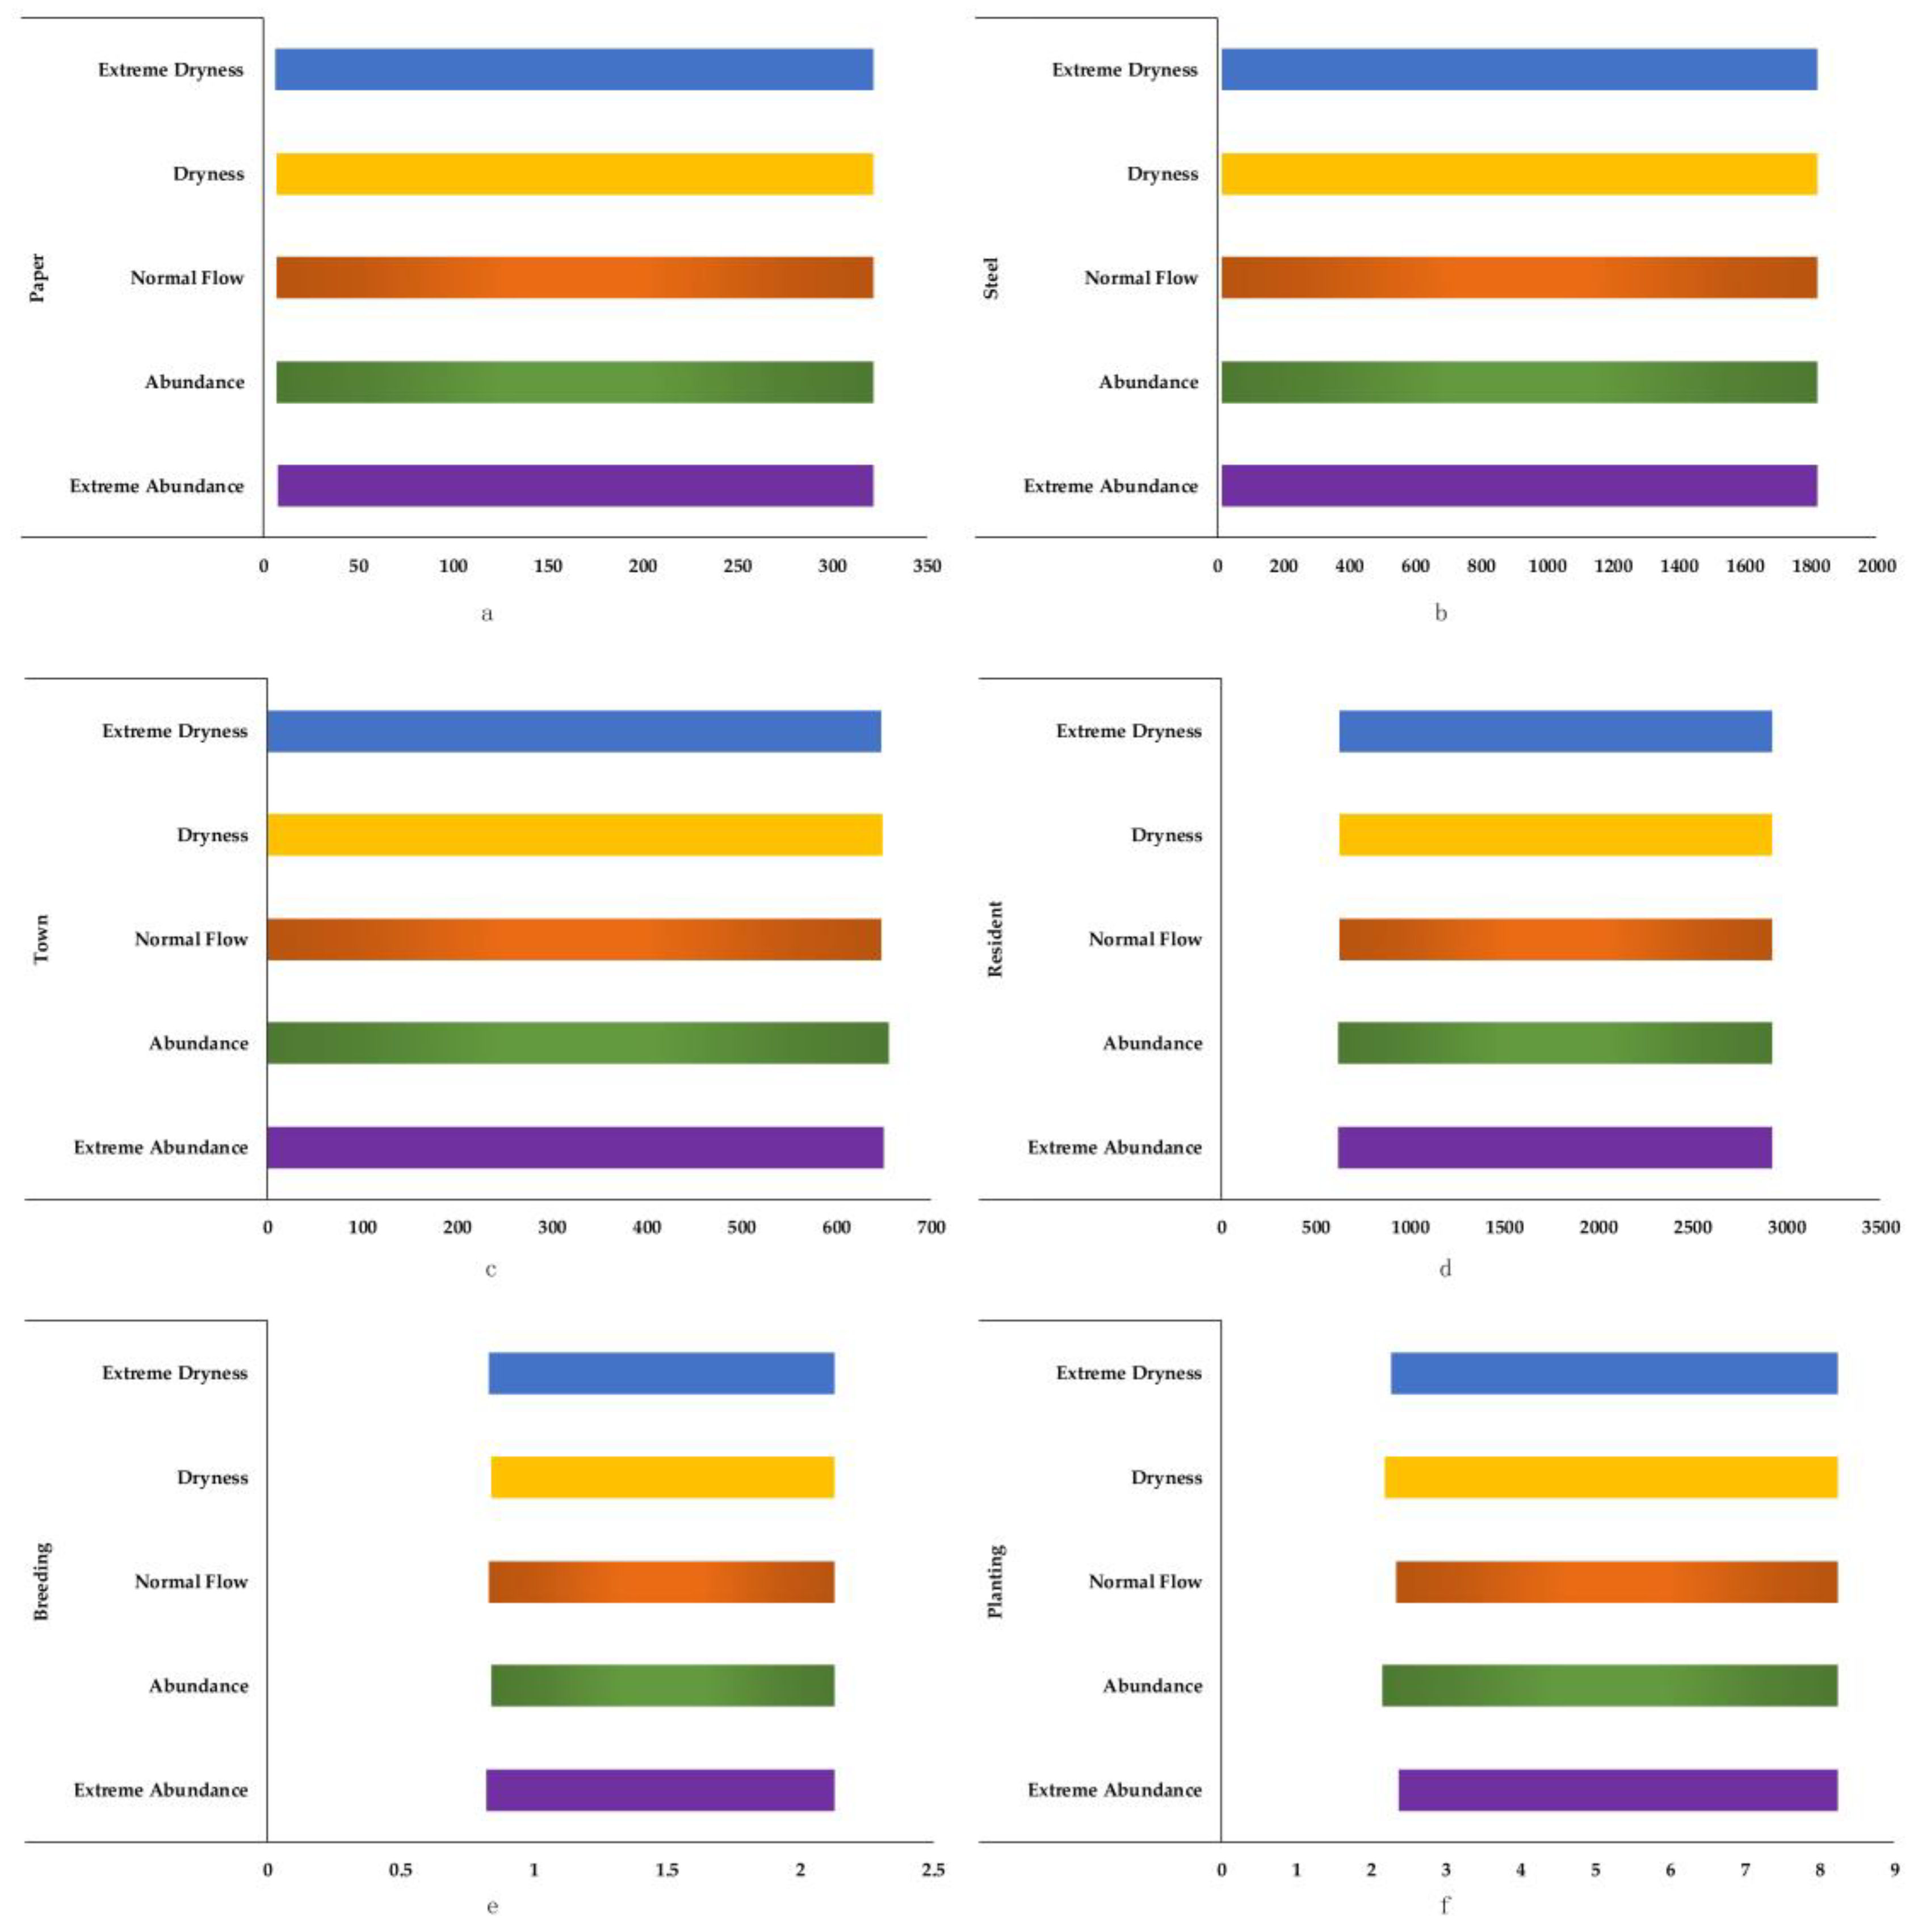
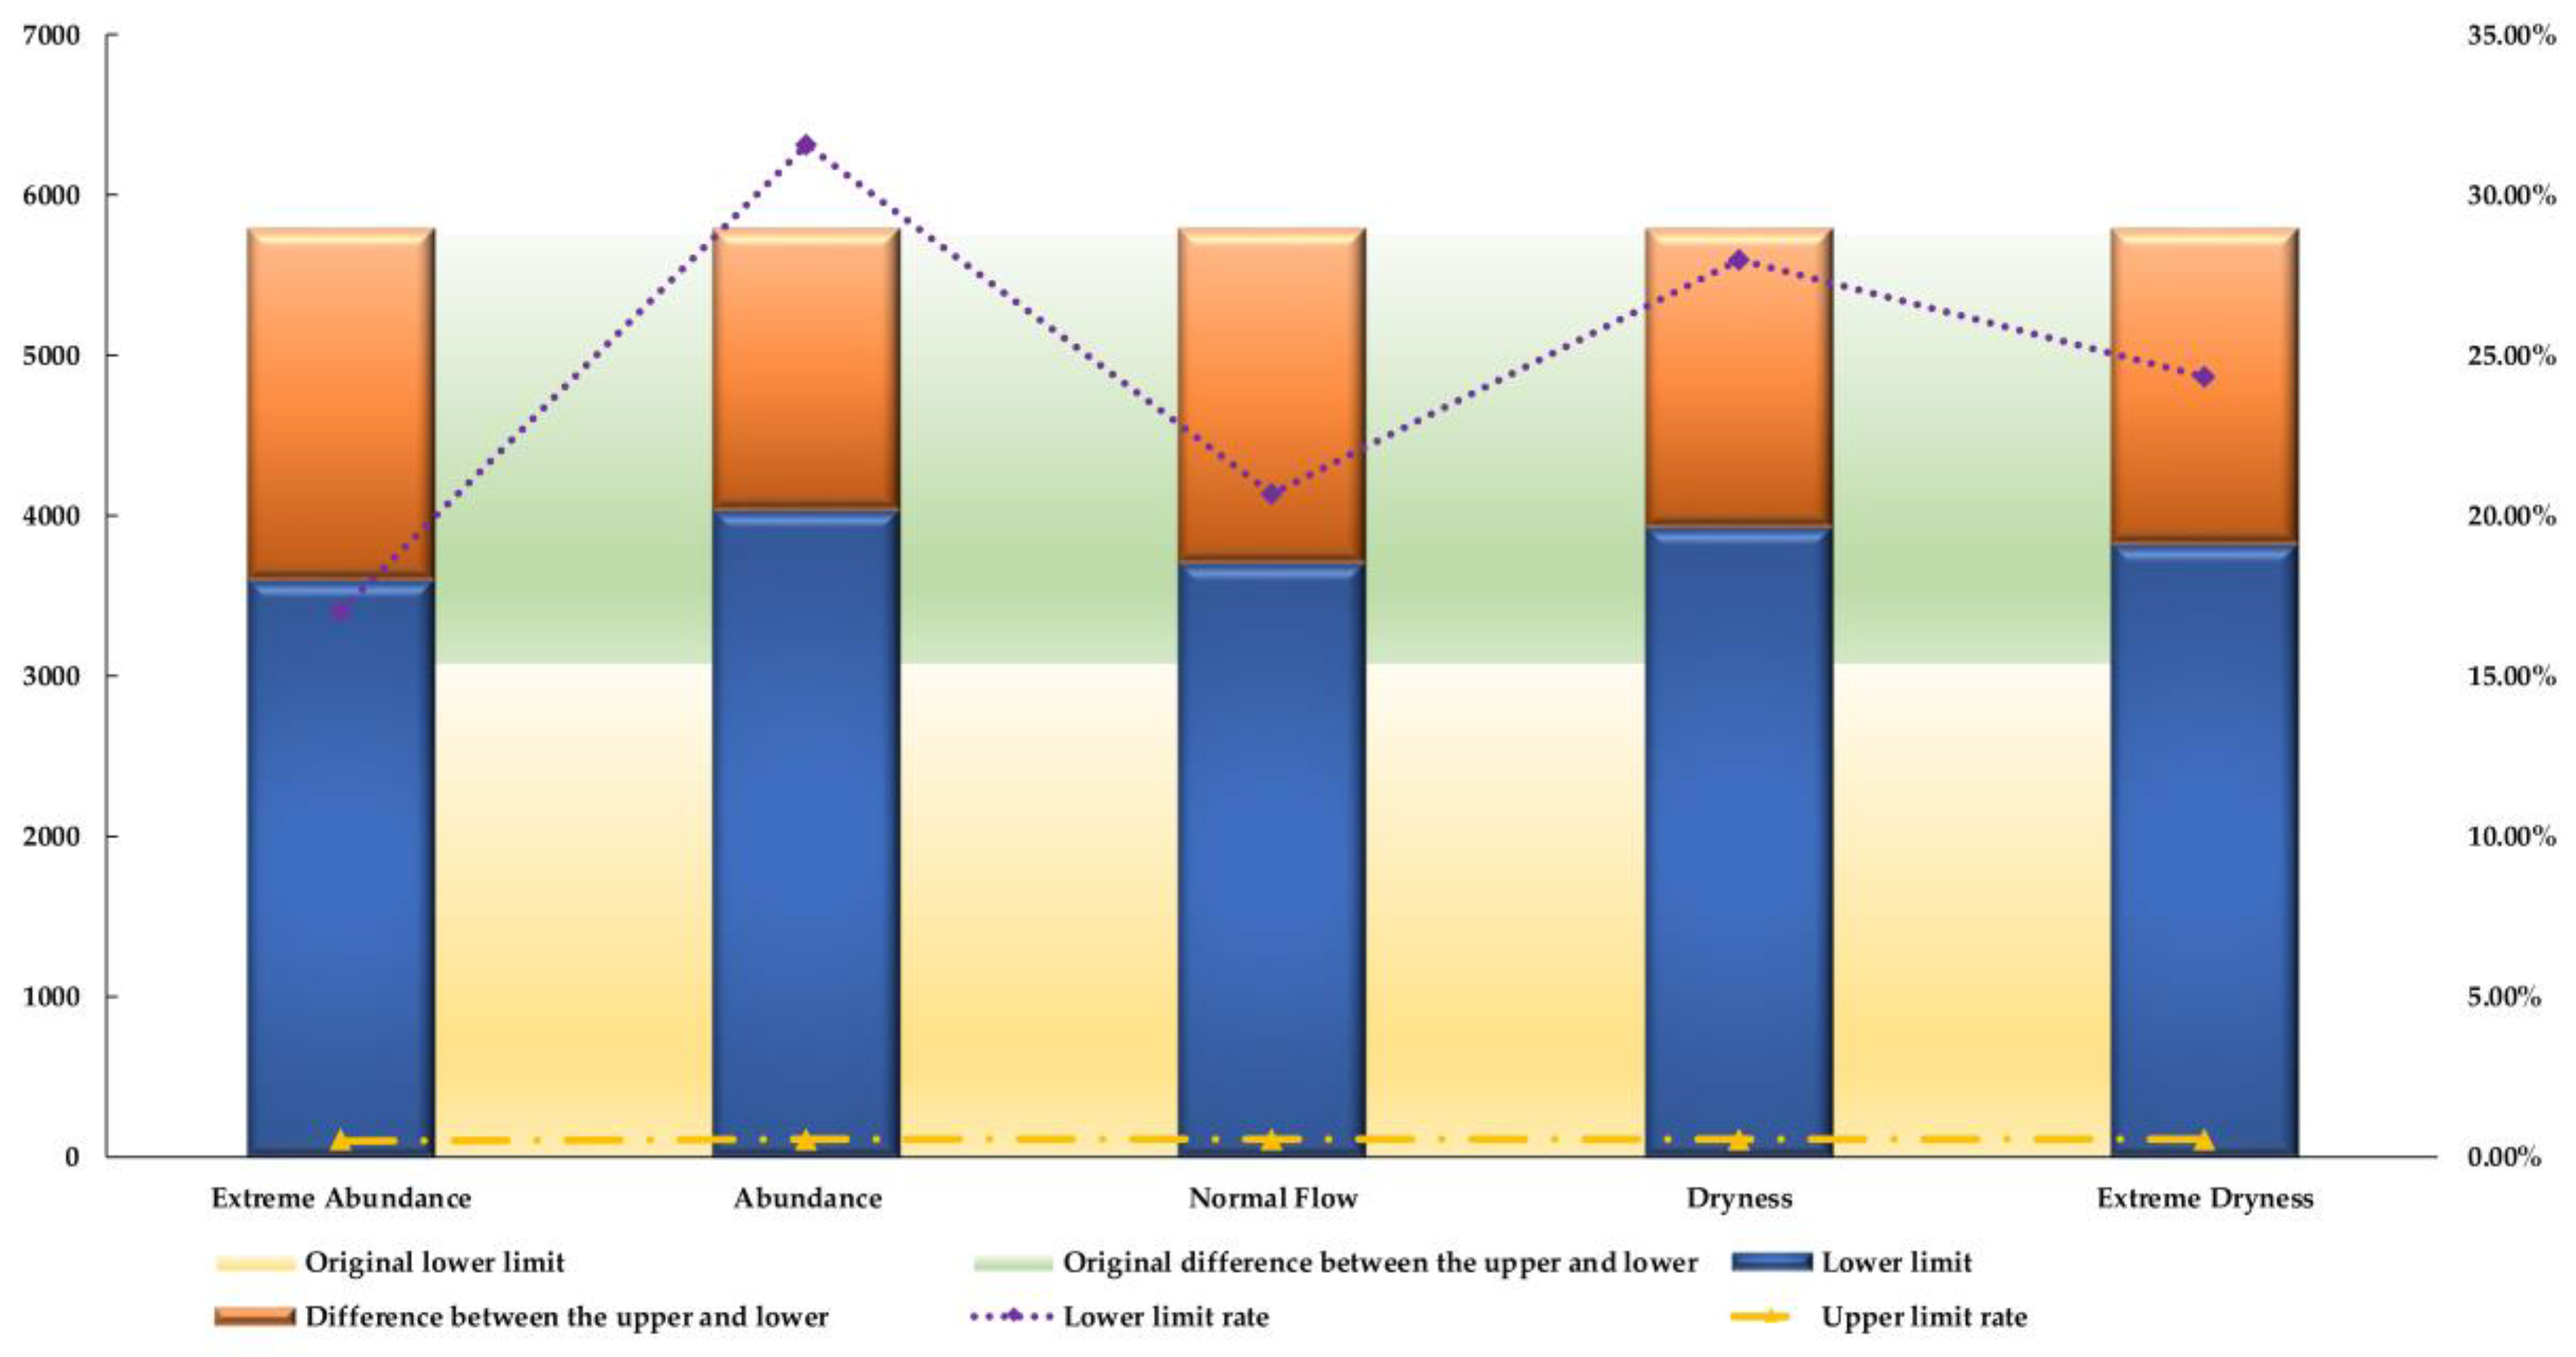
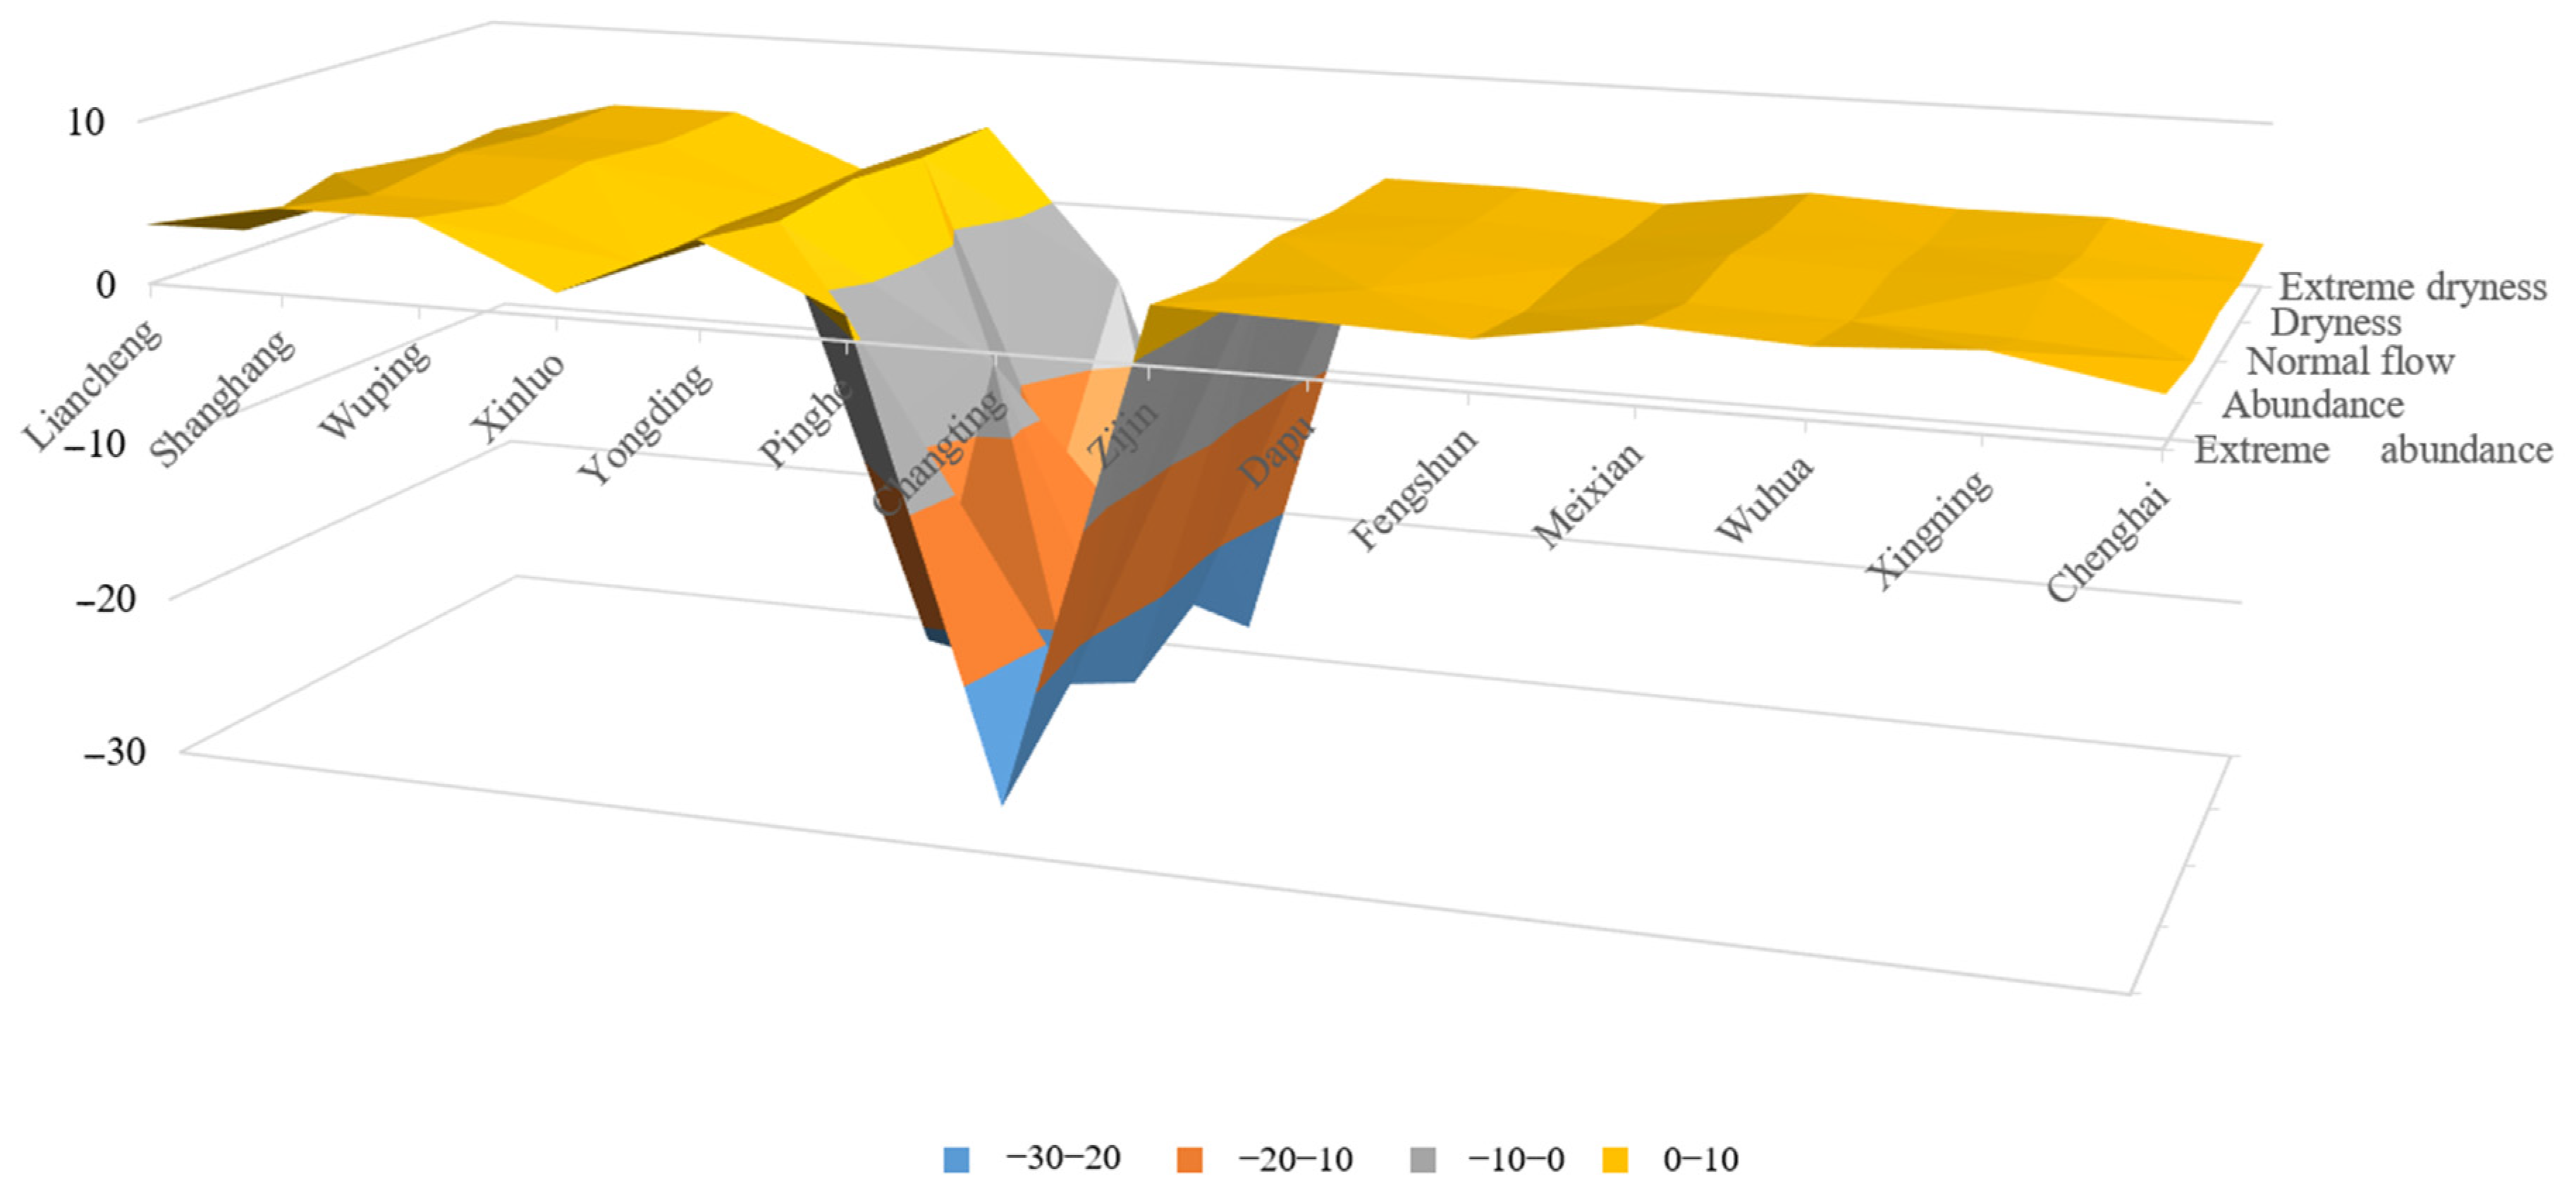
4.1. Analysis of IFTSC Model Simulating Two-Stage Water Resource Allocation in Tingjiang River Basin

The sustainable development of a river basin requires an effective water resource allocation, a foundation for enhancing water resource utilization efficiency, and a minimization of the water scarcity rates in each region [43,44]. Based on the original data from the IFTS model [13], the optimized IFTSC model using the interval-fuzzy two-stage chance-constraint optimization methods were solved to generate the fuzzy function membership t value [0.09, 0.45]. Meanwhile, based on the IFTSC model, the optimal water resource allocation scheme for the first stage of water resource allocation in the basin was obtained and is shown in Table 2. The IFTSC model simulation results were utilized to assess all sectors of administrative regions in the basin, with the Liancheng County in Fujian province given here as an example. The results of the water allocation in the first stage of various sectors in Liancheng County are illustrated in Figure 2. The results reveal that, in industry, 321.65 × 10⁴ t and 15,074.67 × 104 t of water should be allocated to the paper and steel industries in Liancheng County of Fujian province, respectively. Similarly, in municipal administration, 4092.93 × 104 t and 2929.58 × 104 t of water should be allocated to the town and residents, respectively. In agriculture, 2.13 × 10⁴ t and 8.24 × 10⁴ t of water should be allocated for breeding and planting, respectively, while 25.32 × 10⁴ t of water should be allocated for ecology. Furthermore, the results of the IFTSC model show that the water allocation in the first stage of water resources allocation for some industries in each district or county is 0.00, suggesting either the absence or less dominance of the industry in the respective district or county. As a result, it is not included here due to its negligible impact on the water resources allocation process in the basin.
After obtaining the optimal water distribution scheme in the first stage using the IFTSC upper limit sub-model, a chance-constraint method was used to optimize the minimum development requirements of the region as a random factor based on the IFTS model. Further, the penalty value of the second stage was obtained using the IFTSC lower limit sub-model according to the interactive algorithm, D I S j k m h ± . The compensation value of the optimal water allocation in the first stage cannot be satisfied due to the changes in the actual water quantity in the basin, as indicated in Table S1.
Figure 3 depicts the second-stage penalty value of water resources in Liancheng County. The absence of penalty values for ecological water in the second stage signifies sufficient ecological water under the five hydrological scenarios and hence cannot be considered. Industrial water consumption in China increases year after year, owing to the continuous economic growth of counties. Regional industrial water consumption should be ensured to guarantee the Tingjiang River basin [45]. The water resources for the paper industry increased by [7.36, 321.65] × 104 t under the extreme abundance hydrological scenario increased of water resources, [6.95, 321.65] × 104 t under the abundance hydrological scenario, [7.05, 321.65] × 104 t under the normal flow hydrological scenario, [6.93, 321.65] × 104 t under the dryness hydrological scenario, and [6.63, 321.65] × 104 t under the extreme dryness hydrological scenario. Similarly, the water resources for the steel industry were increased by [12.77, 1822.32] × 104 t under the extreme abundance hydrological scenario, [12.42, 1822.32] × 104 t under the abundance hydrological scenario, [12.70, 1822.32] × 104 t under the normal flow hydrological scenario, [12.55, 1822.32] × 104 t under the dryness hydrological scenario and [13.02, 1822.32] × 104 t under the extreme dryness hydrological scenario.
In addition to industrial water, municipal water supply also plays a significant role in the day-to-day operations of the government and the normal life of the citizens [46]. For municipal water usage, the water resources increased [0.00, 650.43] × 104 t during an extreme abundance hydrological scenario, [0.00, 656.03] × 104 t during an abundance hydrological scenario, [0.00, 648.09] × 104 t during normal flow hydrological scenario, [0.00, 648.09] × 104 t during dryness hydrological scenario, and [0.00, 647.81] × 104 t during extreme dryness hydrological scenario. Water resources for residential water use increased [623.05, 2929.58] × 104 t in an extreme abundance hydrological scenario, [618.42, 2929.58] × 104 t in an abundance hydrological scenario, [625.81, 2929.58] × 104 t in normal flow hydrological scenario, [625.09, 2929.58] × 104 t in dryness hydrological scenario, and [626.25, 2929.58] × 104 t in extreme dryness hydrological scenario.
Furthermore, agricultural water is the primary water sector in many areas and improving agricultural water efficiency is an essential strategy to alleviate water scarcity [47]. For breeding water, the water resources increased by [0.82, 2.13] × 104 t under the extreme abundance hydrological scenario, [0.84, 2.13] × 104 t under abundance and dryness hydrological scenarios, and [0.83, 2.13] × 104 t under normal flow and extreme dryness hydrological scenario. Similarly, for planting water, the water resources increased by [2.37, 8.24] × 104 t under extreme abundance hydrological scenario, [2.15, 8.24] × 104 t under abundance hydrological scenario, [2.33, 8.24] × 104 t under normal flow hydrological scenario, [2.18, 8.24] × 104 t under dryness hydrological scenario, and [2.27, 8.24] × 104 t under extreme dryness hydrological scenario. The second-stage penalty values are absent due to the significant impact of the ecological environment in restricting development, and that of water resources in the ecological environment, making the allocation of ecological water crucial [48].

4.2. Economic Benefit Analysis of the Tingjiang River Basin Based on the IFTSC Model

The economic benefits of counties and districts in the Tingjiang River basin based on the IFTSC model under five hydrological scenarios (Table 3 and Table 4) show that the economic benefits of some districts and counties, represented by the Wuping County significantly increase, while those represented by Xingning County significantly decrease in the lower limit model. On the other hand, the economic benefits of districts and counties represented by Wuping County decreased, while those represented by Xingning County increased in the upper limit model due to the improved lower limit of the model and reduction of the upper limit by the chance-constrained programming method, which resulted in short decision space and reduced decision risk. The results of the analysis reveal that the main reason for the negative economic growth is a lack of water resources, which considerably limits industrial water use and influences the local economic development. The greater the proportion of industry in the district and county, the greater the rate of decline in economic benefit under the scarce water resources scenario. Kosolapova et al. found that water availability was positively correlated with regional development, and that low water availability in areas with slow economic development affected the output of the industrial and agricultural sectors, limiting regional economic development, which is consistent with the findings of this paper [49]. Therefore, reasonable allocation of water resources in Tingjiang River basin can provide more considerable economic development space for the basin.
The optimization results of economic benefits of the Tingjiang River basin simulated by the IFTSC model under five hydrological scenarios are shown in Figure 4. The range of variation in the economic benefits of 14 administrative units in the basin based on the IFTSC lower limit sub-model is [−2.74%, 99.34%], with Dapu County and Wuping County showing the maximum decrease and increase in economic benefits. The probability of the overall economic benefit of the basin under five different hydrological scenarios such as extreme abundance, abundance, normal flow, dryness, and extreme dryness are 3592.31 × 108 CNY, 4037.79 × 108 CNY, 3704.22 × 108 CNY, 3926.83 × 108 CNY and 3815.62 × 108 CNY, respectively, which accounts for 9%. Although the decision-making risk is less in this scenario, the economic benefit is less. The range of variation in the economic benefits of the 14 administrative units in the basin based on the IFTSC upper limit sub-model is [−0.75%, 4.69%]. The maximum drop and rise in the economic benefits are in Liancheng County and Changting County, respectively. The probabilities of the overall economic benefit of the basin in hydrological scenarios such as extreme abundance, abundance, normal flow, dryness, and extreme dryness are 5787.15 × 108 CNY, 5789.02 × 108 CNY, 5787.64 × 108 CNY, 5788.88 × 108 CNY and 5788.45 × 108 CNY, respectively, which accounts for 45%. The decision-making risk is considerable right now, with substantial economic benefits.

4.3. Comparison of the IFTSC Model Optimized by Chance Constraint with the IFTS Model

A modified optimization model for water resources optimal allocation in the Tingjiang River basin (IFTSC model) based on the opportunity constraint method in the stochastic programming using an interval-fuzzy two-stage chance-constraint stochastic optimization method was constructed from the optimization model (IFTS model) using an interval-fuzzy-two-stage stochastic optimization method. The two models were compared to analyse the significance and function of chance-constraint method optimization based on the degree of change in the total economic interests in the basin.
Figure 5 shows the difference in the lower bound of economic benefits for each administrative unit of the IFTSC and IFTS models. With the introduction of the bilateral opportunity constraint approach, the IFTSC model increases the lower bound of total economic benefits in the Ting River basin by 21.15 × 10⁸ CNY, −8.65 × 10⁸ CNY, 12.13 × 10⁸ CNY, −1.52 × 10⁸ CNY and 7.81 × 10⁸ CNY under the five hydrological scenarios, respectively. After simulation of the IFTSC model, the water allocation of the industrial sector in the Tingjiang River basin is guaranteed, and the total water shortage in the industrial sector in the second stage decreases by 9.7% in the dryness scenario, for example. Industry, as an important driver of economic development [45], is conducive to promoting the economic development of administrative units along the Tingjiang River basin when water use in the industrial sector is fully guaranteed. Only Pinghe and Changting, the 14 administrative units in the Tingjiang River basin, show negative economic benefits in the IFTSC model, as both administrative units are simulated by the IFTS model with a lower limit value of 0.00 for the water deficit in the industrial sector in Phase II, and therefore Pinghe and Changting have greater economic benefits in the IFTS lower limit model. However, in the IFTSC model, the water deficit in the Pinghe and Changting industrial sectors reaches 1144.93 × 104 tons and 178.72 × 10⁴ tons respectively in the lower bound model, as the water deficit leads to a hindrance in the economic development of the industrial sector and thus Pinghe and Changting are less economically efficient in the lower bound of the IFTSC model. This ultimately leads to a downward trend in the overall economic benefits of the Tingjiang River basin under the dryness water scenario, but to a lesser extent. It can also be seen from Figure 6 that the economic benefits show an increasing trend after the introduction of the opportunity constraint approach, and for the same administrative unit under different hydrological scenarios, the trend in economic benefits is the same, indicating that the overall water quantity in the Tingjiang River basin has no significant effect on economic benefits, and that the trend in economic benefits is mainly influenced by water shortages in the industrial sector. The IFTSC model increases the upper limit of the total economic benefit of the Tingjiang River basin by 37.18 × 10⁸ CNY, 40.73 × 10⁸ CNY, 38.02 × 10⁸ CNY, 40.04 × 10⁸ CNY and 39.22 × 10⁸ CNY for the five hydrological scenarios, respectively. The difference between the IFTSC model and the IFTS model in terms of the upper limit of the economic efficiency of each administrative unit (see Figure S4 for details), only Changting economic efficiency shows a decreasing trend, while the economic efficiency of the rest of the administrative units has increased to some extent, thus improving the overall economic efficiency of the Tingjiang River basin. The IFTSC model, with the same total volume of water utilized, provides adequate protection for the water needs of the industrial sector through a more rational water allocation scheme, improves the efficiency of water resource utilization, enables the overall economic benefits of the Tingjiang River Basin to grow, and facilitates the sustainable development of the administrative units of the Tingjiang River basin.

4.4. Analysis of Factors Influencing Water Allocation Based on Pearson Correlation Coefficient

The Pearson correlation coefficient statistical method is commonly used in water quality correlation studies. Dai et al. studied eight water quality indicators (dissolved oxygen, total nitrogen, total phosphorus, etc.) in Taihu Lake to find correlations between them and explore the correlation between pollutants [50]. This paper builds on the Pearson correlation coefficient method in water quality research and extends its application to the water allocation process. Figure 6 shows the correlations between the variables in the IFTSC model for the industrial sector. The most important variables affecting water allocation are the combined pollution production coefficient (CPC), the maximum allowable discharge of pollutant r2 of the regional minimum development requirement (DSL) (AEP_r2), the pollution production coefficient of pollutant r1 (rCWXS_r1), the unit price of water (WR), the industry water use uptake line (IWUL) and the industry size (IS). The seven parameters are also highly correlated with each other, with a Pearson correlation coefficient of 1.00. The reason for this is that when the minimum regional development requirements rise, this indicates that the region is growing rapidly, the scale of industry is expanding, water demand and consumption is increasing, regional water use is coming online, the unit price of water is rising, environmental problems caused by economic development are increasing, the pollution production factor is increasing, and pollutant emissions are increasing, all of which leads to environmental damage. Pollution treatment cost (STC), which is mainly influenced by pollutant r1 removal rate (rQCL_r1) and pollutant r2 removal rate (rQCL_r2), increases when the removal rate of pollutants rises. When water supply rises, there is often water wastage and poor water utilizations, so output per unit size (NB) falls, but economic losses due to water scarcity (PNB) also fall because of adequate water supply and lower regional water scarcity. The correlation between the variables in the ISOPT and IFTSC models for the municipal sector is similar to that for the industrial sector, being influenced by seven parameters, all of which are positively correlated (see Figure S1 for details). The ISOPT for the agricultural and ecological sectors are similar in that they are both strongly positively correlated with IS, i.e., as the sector increases in size, water demand increases and water allocation should rise. This is followed by a moderate negative correlation with NB and PNB (see Figures S2 and S3).
The Pearson correlation coefficient method is widely used in the field of model feature selection. Liao et al. performed feature selection of network metadata based on Pearson correlation coefficient and maximum mutual information coefficient and used screening features for modelling and classification to improve the early warning capability of power system network security [51]. In this paper, the Pearson correlation coefficient was used to screen the correlation of the constructed model variables to reduce the complexity of the model and to lay the foundation for the next step of the study. Figure 7 shows the correlation between the variables in the IFTSC model and the overall economic performance of the Tingjiang River basin. Economic efficiency is mainly influenced by NB and PNB, which increases when NB rises, while economic efficiency also increases when PNB rises. Although PNB represents the economic loss due to water scarcity, which represents an unfavourable variable for economic development in the IFTSC model, the Pearson correlation coefficient gives an upward trend when water allocation decreases, i.e., water allocation is negatively correlated with economic efficiency. This is because the increase in the pollution production factor and the increase in the maximum permissible emissions of pollutants caused when the ISOPT rises leads to an increase in the cost of pollution control, and the economic benefits from the production of products cannot compensate for the costs incurred in controlling environmental pollution, resulting in a downward trend in economic benefits. At the same time, the rise in ISOPT will lead to a phenomenon that will exacerbate the waste of water resources in some areas, leading to a continuous decline in the utilizations of water resources and a decrease in the economic benefits created per unit of water resources, which is not conducive to the sustainable development of the region. In order to reduce the impact of variables such as CPC, AEP, etc., existing pollution control technologies should be improved to increase the capacity and reduce the cost of pollution control. Meanwhile, NB and PNB are highly correlated, CPC, IS, IWUL, WR, rCWXS_r1, rCWXS_r2, AEP_r2, DSL, WR and water resources price (WRD) are highly correlated. In the next study, the above highly correlated variables can be grouped together through feature screening to reduce the complexity of the model.

5. Conclusions

The present study constructed an optimization model for the optimal allocation and eco-compensation mechanism of water resources in the Tingjiang River basin (IFTSC model) using the opportunity constraint method based on the interval-fuzzy-two-stage stochastic optimization method. This can provide a more scientific and broader decision-making space for decision-makers and minimize the decision-making risks in the basin by reducing the uncertainty caused by random parameters in determining water resources allocation. Pearson correlation coefficients were used to analyse the correlation between the variables in the IFTSC model and water allocation and economic benefits to suggest more specific ideas for water resource management in the Tingjiang River basin. This paper used the optimized IFTSC model to achieve the research objectives of maximizing the overall economic benefits of the Tingjiang River basin, achieving optimal water resource allocation in the Tingjiang River basin, improving water resource utilizations efficiency and coordinating the overall economic relationship between the upper and lower reaches of the Tingjiang River basin. At the same time, uncertainty planning is widely used in the water resources allocation process of the river basin, so the water resources allocation model of the Ting River basin constructed in the text is universal and can be used in other basins for water resources planning. The IFTSC model simulation results are as follows:
(1)
The second-stage penalty value of the IFTSC model in the Tingjiang River basin was less than the original IFTS model, as evidenced by the decrease in the second-stage penalty value of the industrial sector by 9.7% under the dry hydrological scenario. The first stage is characterized by a relatively reasonable water allocation with improved water resources utilization rate and greatly relieves the water pressure of various departments and industries while minimizing the water resources waste or economic development restriction caused by unreasonable water resources allocation.
(2)
The stochastic optimization method with chance-constraint was introduced based on the original IFTS model to effectively reduce the uncertainty of minimum development requirements in the Tingjiang River basin. At the same time, the IFTSC model was allowed to violate the constraint conditions within a specified confidence interval to make it more realistic with a wider range of applications, which can satisfy the more differential and complex realistic hydrological scenarios to a certain extent.
(3)
The total economic benefits of the Tingjiang River basin simulated by the IFTSC model show an increasing trend compared with the original IFTS model (an increase of 49.36 × 10⁸ CNY under the abundant hydrology scenario), which further ensures the overall economic development of the Tingjiang River basin and balances the economic relationship between Fujian and Guangdong provinces upstream and downstream of the Tingjiang River basin while rationalizing water resources allocation.
(4)
Pearson correlation coefficient shows that water allocation in the Tingjiang River basin is positively correlated with seven parameters (CPC, DSL, AER_r2, rCWXS_r1, WR, IWUL and IS) and that economic efficiency in the Tingjiang River basin is positively correlated with two parameters (NB and PNB). In the water management process, the focus can be on these parameters and simpler and more efficient measures can be taken to address the environmental management objectives of the basin.
This paper only maximizes the economic benefits of the Tingjiang River basin through the optimal allocation of water resources, without introducing ecological values that consider the benefits derived from the environmental values generated by the water-using environment of the Tingjiang River basin. The real environment is more complex, and the models constructed in this study are mostly linear; the use of non-linear models may further improve the adaptability of the models.

Supplementary Materials

The following supporting information can be downloaded at: https://www.mdpi.com/article/10.3390/w14182928/s1, Table S1: Penalty value of IFTSC model in the second stage under different hydrological scenarios (×104 t); Figure S1: Correlation of variables in the IFTSC model for the municipal sector; Figure S2: Correlation of variables in the IFTSC model for the agricultural sector; Figure S3: Correlation of variables in the IFTSC model for the ecological sector; Figure S4: Difference between the upper limit of economic efficiency of each administrative unit in IFTSC and IFTS models.

Author Contributions

Conceptualization, N.H. and L.Y.; methodology, P.S. and W.H.; software, N.H.; validation, N.H. and W.Z.; analysis, N.H., P.S. and W.H.; data source, Y.Q. and Y.C.; writing—original draft preparation, N.H. and P.S.; writing—review and editing, N.H. and P.S.; visualization, N.H. and W.Z.; supervision, L.Y. and W.Z.; project administration, W.Z. All authors have read and agreed to the published version of the manuscript.

Funding

This research received no external funding.

Institutional Review Board Statement

Not applicable.

Informed Consent Statement

Not applicable.

Data Availability Statement

The data presented in this study are available contained within the article.

Conflicts of Interest

The authors declare no conflict of interest.

Abbreviations

f 1 ± Economic benefit of water, 104 CNY.
f 2 ± Water consumption cost, 104 CNY.
f 3 ± Cost of environmental management of water, 104 CNY.
f 4 ± Eco-compensation quota, 104 CNY.
f 5 ± The second stage to optimize the penalty value.
f The lowest economic benefit of the basin, 104 CNY.
f The highest economic benefit of the basin, 104 CNY.
j Administrative units (14 districts and counties).
k Major water consumption sectors ( k   = 1, 2, 3, 4 denote Industry, Municipal, Agriculture, Ecology).
m Different industry categories within each sector
i Watershed partition ( i = 1 denotes the regional scope of upstream Fujian province, and i = 2 denotes the regional scope of downstream Guangdong province).
h Hydrological situation ( h   = 1, 2, 3, 4, 5 denote extreme abundance, abundance, normal flow, dryness, and extreme dryness, with respective probabilities of 0.1, 0.3, 0.15, 0.25, and 0.2).
N B j k m ± Output value per unit scale, 104 CNY/104 t.
I S O P T j k m The optimal solution for water consumption in the first stage.
W R j k ± The unit price of water 104 CNY/104 t.
δ j k m ± Comprehensive pollution production coefficient, 104 g/104 t.
S T C j k m ± Pollution control cost, 104 CNY/104 t.
W R D j ± Downstream water price, 104 CNY/104 t.
η The proportion of downstream use of incoming water from the upstream.
λ Eco-compensation determination coefficient (the water quality is better than the III standard,   λ = 1; the water quality is inferior to class V, λ   = −1; in other cases, λ   = 0).
P Hydrological scenario probability.
P N B h ± The water supply that cannot meet the loss caused by the original water supply, 104 CNY/104 t.
D I S h ± Lack of water, 104 t.
I W U L j k ± The maximum water resources utilization stipulated by different regions and departments, 104 t.
R W U L j ± The maximum utilization of water resources in different regions, 104 t.
E C S j ± The ecological area range of different regions in the watershed, 104 t.
T A W R ± The maximum utilization of water resources in the basin, 104 t.
r Different pollutants.
ξ j k m r ± Pollutants producing coefficient, 104 g/104 t.
γ j k m r ± Pollutant removal rate.
A E P j r ± Maximum allowable discharge of pollutants, 104 t.
D S L i k ± Minimum regional development requirements, 104 CNY.
θ The risk of default.
μ i Expected value of N B j k m ± ( i   = 1, 2).
φ i Expected value of D S L i k ± ( i   = 1, 2).
σ i The variances of the N B j k m ± ( i   = 1, 2).
ε i The variances of the D S L i k ± ( i   = 1, 2).

References

  1. Liu, X.F.; Yu, X.F.; Yu, K. The current situation and sustainable development of water resources in China. Proc. Eng. 2012, 28, 522–526. [Google Scholar] [CrossRef]
  2. Wang, W.D.; Yang, T.; Guan, W.B.; Peng, W.X.; Wu, P.; Zhong, B.; Zhou, C.D.; Chen, Q.H.; Zhang, R.B.; Xu, K.W.; et al. Ecological wetland paradigm drives water source improvement in the stream network of Yangtze River Delta. J. Environ. Sci. 2021, 110, 55–72. [Google Scholar] [CrossRef] [PubMed]
  3. Wada, Y.; Flörke, M.; Hanasaki, N.; Eisner, S.; Fischer, G.; Tramberend, S.; Satoh, Y.; van Vliet, M.T.H.; Yillia, P.; Ringler, C.; et al. Modeling Global Water Use for the 21st century: The Water Futures and Solutions (WFaS) Initiative and its Approaches. Geosci. Model. Dev. 2016, 9, 175–222. [Google Scholar] [CrossRef]
  4. Roshan, A.; Kumar, M. Water End-Use Estimation Can Support the Urban Water Crisis Management: A Critical Review. J. Environ. Manag. 2020, 268, 110663. [Google Scholar] [CrossRef] [PubMed]
  5. Wang, Y.X.; Wang, Y.; Su, X.L.; Qi, L.; Liu, M. Evaluation of the comprehensive carrying capacity of interprovincial water resources in China and the spatial effect. J. Hydrol. 2019, 575, 794–809. [Google Scholar] [CrossRef]
  6. Da Silva, L.C.C.; Filho, D.O.; Silva, I.R.; Pinto, A.C.V.E.; Vaz, P.N. Water Sustainability Potential in a university Building—Case Study. Sustain. Cities Soc. 2019, 47, 101489. [Google Scholar] [CrossRef]
  7. Hou, J.; Wang, N.; Luo, J.G.; Zhang, X.; Wang, Z.H.; Xie, J.C. A multi-method integrated simulation system for water resources allocation. Water Supply 2021, 22, 2518–2532. [Google Scholar] [CrossRef]
  8. Wen, Q.; Zhang, L.D.; Fei, X.X.; Li, J.D. Discussions about Water Resources Allocation. In Proceedings of the 2019 3rd International Workshop on Renewable Energy and Development (IWRED 2019), Guangzhou, China, 8–10 March 2019; Volume 267, p. 022030. [Google Scholar]
  9. Sun, T.; Zhang, H.W.; Wang, Y. The application of information entropy in basin level water waste permits allocation in China. Resour. Conserv. Recycl. 2013, 70, 50–54. [Google Scholar] [CrossRef]
  10. Chen, Y.; Dou, S.Q.; Xu, D. The effectiveness of eco-compensation in environmental protection-A hybrid of the government and market. J. Environ. Manag. 2021, 280, 111840. [Google Scholar] [CrossRef]
  11. Wunder, S.; Engel, S.; Pagiola, S. Taking stock: A comparative analysis of payments for environmental services programs in developed and developing countries. Ecol. Econ. 2008, 65, 834–852. [Google Scholar] [CrossRef]
  12. Wunder, S. Revisiting the concept of payments for environmental services. Ecol. Econ. 2015, 117, 234–243. [Google Scholar] [CrossRef]
  13. Hao, N.; Sun, P.X.; Yang, L.Z.; Qiu, Y.; Chen, Y.Z.; Zhao, W.J. Optimal Allocation of Water Resources and Eco-Compensation Mechanism Model Based on the Interval-Fuzzy Two-Stage Stochastic Programming Method for Tingjiang River. Int. J. Environ. Res. Public Health. 2021, 19, 149. [Google Scholar] [CrossRef]
  14. Abichou, T.; Clark, J.; Tan, S.; Chanton, J.; Hater, G.; Green, R.; Goldsmith, D.; Barlaz, M.A.; SWAN, N. Uncertainties Associated with the Use of Optical Remote Sensing Technique to Estimate Surface Emissions in Landfill Applications. J. Air Waste Manag. Assoc. 2010, 60, 460–470. [Google Scholar] [CrossRef]
  15. Meng, C.; Wang, X.L.; Li, Y. An Optimization Model for Water Management Based on Water Resources and Environmental Carrying Capacities: A Case Study of the Yinma River Basin, Northeast China. Water 2018, 10, 565. [Google Scholar] [CrossRef]
  16. Sun, Y.; Li, Y.P.; Huang, G.H. A queuing-theory-based interval-fuzzy robust two-stage programming model for environ-mental management under uncertainty. Eng. Optimiz. 2012, 44, 707–724. [Google Scholar] [CrossRef]
  17. Feng, X.X.; Zhang, Y.Q.; Wu, J.L. Interval analysis method based on Legendre polynomial approximation for uncertain multibody systems. Adv. Eng. Softw. 2018, 121, 223–234. [Google Scholar] [CrossRef]
  18. Fu, Q.; Zhao, K.; Liu, D.; Jiang, Q.X.; Li, T.X.; Zhu, C.H. Two-stage interval-parameter stochastic programming model based on adaptive water resource management. Water Resour. Manag. 2016, 30, 2097–2109. [Google Scholar] [CrossRef]
  19. Zhang, C.; Li, M.; Guo, P. An interval multistage joint-probabilistic chance-constrained programming model with left-hand-side randomness for crop area planning under uncertainty. J. Clean Prod. 2017, 167, 1276–1289. [Google Scholar] [CrossRef]
  20. Meng, C.; Li, W.; Cheng, R.H.; Zhou, S.Y. An Improved Inexact Two-Stage Stochastic with Downside Risk-Control Programming Model for Water Resource Allocation under the Dual Constraints of Water Pollution and Water Scarcity in Northern China. Water 2021, 13, 1318. [Google Scholar] [CrossRef]
  21. Wang, Y.; Fan, J.; Xu, Y.; Sun, W.; Chen, D. An inexact log-normal distribution-based stochastic chance-constrained model for agricultural water quality management. Eng. Optimiz. 2018, 50, 840–855. [Google Scholar] [CrossRef]
  22. Kon, M. A scalarization method for fuzzy set optimization problems. Fuzzy Optim. Decis. Mak. 2020, 19, 135–152. [Google Scholar] [CrossRef]
  23. Ni, J.N.; Xu, J.P.; Zhang, M.X. Constructed wetland modelling for watershed ecosystem protection under a certain economic load: A case study at the Chaohu Lake watershed, China. Ecol. Model. 2018, 368, 180–190. [Google Scholar] [CrossRef]
  24. Ranarahu, N.; Dash, J.K. Computation of multi-objective two-stage fuzzy probabilistic programming problem. Soft Comput. 2022, 26, 271–282. [Google Scholar] [CrossRef]
  25. Steinfeld, C.M.M.; Sharma, A.; Mehrotra, R.; Kingsford, R.T. The human dimension of water availability: Influence of management rules on water supply for irrigated agriculture and the environment. J. Hydrol. 2020, 588, 125009. [Google Scholar] [CrossRef]
  26. Vorosmarty, C.J.; Green, P.; Salisbury, J.; Lammers, R.B. Global water resources: Vulnerability from climate change and population growth. Science 2000, 289, 284–288. [Google Scholar] [CrossRef]
  27. Shi, H.H.; Weng, W.G.; Zhai, Z.G.; Li, Y.Y. The Relationship and Regression Analysis of Urban Water Supply and Temperature. Appl. Mech. Mater. 2012, 256, 2420–2423. [Google Scholar] [CrossRef]
  28. Hu, Z.H.; Zhang, Y.R.; Zhao, Y.C.; Xie, M.S.; Zhong, J.Z.; Tu, Z.G.; Liu, J.T. A Water Quality Prediction Method Based on the Deep LSTM Network Considering Correlation in Smart Mariculture. Sensors 2019, 19, 1420. [Google Scholar] [CrossRef]
  29. Ion, A.; Vladescu, L.; Badea, I.A.; Comanescu, L. Monitoring and evaluation of the water quality of Budeasa Reservoir-Arges River, Romania. Environ. Monit. Assess. 2016, 188, 535. [Google Scholar] [CrossRef]
  30. Rodriguez, F.M.; Garcia, S.G.; Corro, R.J.; Liesa, M.S.; Barón, F.R.; Martín, F.S.; Feu, O.A.; Rodríguez, R.M.; Mavrich, H.V. Spanish bottled and tap water analysis and their relation with urinary lithiasis. Actas Urol. Esp. 2009, 33, 778–793. [Google Scholar]
  31. Godeke, S.H.; Malik, O.A.; Lai, D.T.C.; Bretzler, A.; Schirmer, M.; Mansor, N.H. Water quality investigation in Brunei Darussalam: Investigation of the influence of climate change. Environ. Earth Sci. 2020, 79, 419. [Google Scholar] [CrossRef]
  32. Lin, W.; Yang, F.; Zhou, L.; Xu, J.G.; Zhang, X.Q. Using modified Soil Conservation Service curve number method to simulate the role of forest in flood control in the upper reach of the Tingjiang River in China. J. Mt. Sci. 2017, 14, 1–14. [Google Scholar] [CrossRef]
  33. Zhang, L.L.; Lv, J.G. Ecological risk assessment of the metallic pollution in the soil and sediment in Tingjiang basin. Environ. Earth Sci. 2015, 73, 1799–1803. [Google Scholar] [CrossRef]
  34. Zhang, J.; Zhang, Z.D.; Wan, L.W.; Yang, C.X.; Ye, C. The Contributions of Climate Change and Human Activities on Runoff of the Tingjiang River. J. South China Norm. Univ. 2017, 49, 84–91. [Google Scholar]
  35. Qiu, Y. Study on Optimization of Water Resource Allocation and Eco-Compensation in Tingjiang Basin under Uncertainty. Ph.D. Thesis, Jilin University, Jilin, China, 2020. [Google Scholar]
  36. Li, H.Q.; Lv, C.M.; Ling, M.H.; Gu, C.K.; Li, Y.; Wu, Z.N.; Yan, D.H. Emergy Analysis and Ecological Spillover as Tools to Quantify Ecological Compensation in Xuchang City, Qingyi River Basin, China. Water 2021, 13, 414. [Google Scholar] [CrossRef]
  37. Chang, L.J. Research on the Eco-Compensation Patterns between the Upstream and Downstream in Tingjiang River Basin. Master’s Thesis, Xiamen University, Xiamen, China, 2017. [Google Scholar]
  38. Chen, D.X. Practice and Innovation of Eco-compensation Mechanism Pilot in Tingjiang-Hanjiang River Basin. Environ. Prot. 2017, 45, 31–33. [Google Scholar]
  39. Ji, Y. Research on Improvement of Interval Double-Hand-Side Chance-Constrained Programming and the Application in Water Quality Management. Ph.D. Thesis, North China Electric Power University, Beijing, China, 2016. [Google Scholar]
  40. Chinchilli, V.M.; Phillips, B.R.; Manger, D.T.; Szefler, S.J. A general class of correlation coefficients for the 2 × 2 crossover design. Biom. J. 2005, 47, 644–653. [Google Scholar] [CrossRef]
  41. Feng, W.L.; Zhu, Q.Y.; Zhuang, J.; Yu, S.M. An expert recommendation algorithm based on Pearson correlation coefficient and FP-growth. Cluster Comput. 2019, 22, 7401–7412. [Google Scholar] [CrossRef]
  42. Edelmann, D.; Mori, T.F.; Szekely, G.J. On relationships between the Pearson and the distance correlation coefficients. Stat. Probab. Lett. 2021, 169, 108960. [Google Scholar] [CrossRef]
  43. Li, Y.; Xie, J.C.; Jiang, R.G.; Yan, D.F. Application of edge computing and GIS in ecological water requirement prediction and optimal allocation of water resources in irrigation area. PLoS ONE 2021, 16, e0254547. [Google Scholar] [CrossRef]
  44. Shen, X.; Wu, X.; Xie, X.; Wei, C.; Li, L.Q.; Zhang, J.J. Synergetic Theory-Based Water Resource Allocation Model. Water Resour. Manag. 2021, 35, 2053–2078. [Google Scholar] [CrossRef]
  45. Chen, Y.B.; Yin, G.W.; Liu, K. Regional differences in the industrial water use efficiency of China: The spatial spillover effect and relevant factors. Resour. Conserv. Recycl. 2021, 167, 105239. [Google Scholar] [CrossRef]
  46. Amoah, A.; Asiama, R.K.; Korle, K.; Kwablah, E. Domestic water improvement behaviour: The probability determinants and policy implications(dagger). Water Policy 2021, 23, 880–896. [Google Scholar] [CrossRef]
  47. Xu, H.; Yang, R.; Song, J.F. Agricultural Water Use Efficiency and Rebound Effect: A Study for China. Int. J. Environ. Res. Public Health. 2021, 18, 7151. [Google Scholar] [CrossRef] [PubMed]
  48. Lu, C.; Feng, J.; Liu, W.; Yan, S. Tensor robust principal component analysis with a new tensor nuclear norm. IEEE Trans. Pattern Anal. Mach. Intell. 2019, 45, 1–22. [Google Scholar] [CrossRef]
  49. Kosolapova, N.A.; Matveeva, L.G.; Nikitaeva, A.Y.; Molapisi, L. Modeling resource basis for social and economic development strategies: Water resource case. J. Hydrol. 2017, 553, 438–446. [Google Scholar] [CrossRef]
  50. Dai, X.L.; Zhu, P.Y.; Zhuang, Y.; Wang, Y. Correlation study of tai lake conventional water quality. Oxid. Commun. 2015, 38, 1364–1372. [Google Scholar]
  51. Liao, N.D.; Song, Y.Q.; Su, S.; Huang, X.S.; Ma, H.L. Detection of probe flow anomalies using information entropy and random forest method. J. Intell. Fuzzy Syst. 2020, 39, 433–447. [Google Scholar]
Figure 1. The natural situation of the Tingjiang River basin.
Water 14 02928 g001
Figure 2. Results of the water allocation in various industries in Liancheng County at the first stage (×104 t). (As cement and thermal power industries are not the leading industries of Liancheng County, the value is given as 0 in the industrial sectors).
Water 14 02928 g002
Figure 3. Penalty value of water resources in Liancheng County at the second stage (×104 t): (a) paper industry; (b) steel industry; (c) urban water; (d) domestic water; (e) water for farming; (f) water for planting (the second-stage penalty value is absent for cement, thermal power, and ecology).
Water 14 02928 g003
Figure 4. Optimization of economic benefits under the five hydrological scenarios in the Tingjiang River basin (×108 CNY).
Water 14 02928 g004
Figure 5. Difference between the lower bound of economic benefits for each administrative unit of the IFTSC and IFTS models (×108 CNY).
Water 14 02928 g005
Figure 6. Correlation of variables in the industrial sector IFTSC model.
Water 14 02928 g006
Figure 7. Correlation between variables and economic benefits in the IFTSC model.
Water 14 02928 g007
Table 1. Pearson correlation coefficient intervals and correlation sizes.
Value RangeRelevance
0–0.2Very strong correlation
0.2–0.4Strong correlation
0.4–0.6Moderate correlation
0.6–0.8Weak correlation
0.8–1.0Very weak correlation or no correlation
Table 2. The first-stage optimal water resources allocation scheme of different regions, industries, and sectors in the Tingjiang River basin based on the IFTSC model (×104 t).
ProvinceSectionBusinessLianchengShanghangWupingXinluoYongdingPingheChangting
FujianIndustryPaper321.65226.17616.05701.21529.15564.41354.76
Steel15,074.6714,569.4614,778.340.0013,062.220.000.00
Cement0.00596.030.00437.931802.5813,320.0112,737.94
Thermal power0.000.000.0014,260.860.001508.072263.49
MunicipalTown4092.934027.14290.855112.152217.804309.743131.46
Resident2929.583108.986797.561229.554809.932690.862308.33
AgricultureBreeding2.131.381.721.882.681.862.66
Planting8.249.729.6027.0422.6825.225.25
EcologyEcology25.324.3713.5532.8853.7733.0222.69
Guangdong ZijinDapuFengshunMeixianWuhuaXingningChenghai
IndustryPaper255.24220.66209.29419.66314.71463.06211.66
Steel19,759.3718,894.8719,806.310.00200.440.000.00
Cement0.00897.310.0019,323.8819,489.3219,319.52214.85
Thermal power0.000.000.00249.180.00217.3819,579.52
MunicipalTown4393.673979.433776.063403.443164.004155.353938.43
Resident3717.654062.764337.994623.534871.073901.094115.70
AgricultureBreeding2.881.862.332.654.012.523.63
Planting12.1912.3014.2411.4387.8234.327.88
EcologyEcology32.8337.0139.5244.0025.1253.82107.52
Table 3. Economic benefits of each district and county under five hydrological scenarios simulated by IFTSC (lower limit).
NumberRegionLower Limit (×108 CNY)Economic Benefits of Each District and County under Five Hydrological Scenarios of IFTSC Model (×108 CNY)Change
Interval (%)
p (1)p (2)p (3)p (4)p (5)
1Liancheng165.47201.26215.37204.79211.84208.32[21.63, 30.16]
2Shanghang313.07375.71381.68377.20380.18378.69[20.01, 21.92]
3Wuping111.80186.78222.86195.80213.84204.82[67.07, 99.34]
4Xinluo767.60907.11946.29916.91936.50926.70[18.17, 23.28]
5Yongding184.43244.79274.75252.28267.26259.77[32.73, 48.97]
6Pinghe219.29243.19258.39247.33254.79251.15[10.90, 17.83]
7Changting207.96244.52257.76248.02254.61251.38[17.58, 23.95]
8Zijin89.8592.48128.54101.50119.52110.51[2.93, 43.06]
9Dapu61.3759.6989.0167.0381.6374.35[−2.74, 45.04]
10Fengshun67.2968.4598.3375.9290.8683.39[1.72, 46.13]
11Meixian164.19169.49230.89184.84215.54200.19[3.23, 40.62]
12Wuhua127.47133.45178.54144.73167.27156.00[4.69, 40.06]
13Xingning149.59147.86215.74164.81198.87181.76[−1.16, 44.22]
14Chenghai439.93517.53539.64523.06534.12528.59[17.64, 22.66]
Total3069.323592.314037.793704.223926.833815.62[17.04, 31.55]
Table 4. Economic benefits of each district and county under five hydrological scenarios simulated by IFTSC (upper limit).
NumberRegionUpper Limit (×108 CNY)Economic Benefits of Each District and County under Five Hydrological Scenarios of IFTSC Model (×108 CNY)Change
Interval (%)
p (1)p (2)p (3)p (4)p (5)
1Liancheng315.99314.42313.61314.21313.81313.99[−0.75, −0.50]
2Shanghang504.58503.16501.92502.85502.23502.55[−0.53, −0.28]
3Wuping337.78336.69335.48336.38335.77336.10[−0.68, −0.32]
4Xinluo1160.541159.931159.431159.811159.551159.67[−0.10, −0.05]
5Yongding390.41389.22388.26388.98388.52388.91[−0.55, −0.30]
6Pinghe376.92375.54374.87375.30375.01375.15[−0.54, −0.37]
7Changting333.62344.81349.26345.94348.14347.04[3.35, 4.69]
8Zijin278.99282.85283.44283.00283.34283.18[1.38, 1.60]
9Dapu198.00201.40201.95201.52201.85201.68[1.72, 1.99]
10Fengshun236.99240.47240.97240.58240.88240.73[1.47, 1.68]
11Meixian341.22345.53345.92345.68345.91345.83[1.26, 1.38]
12Wuhua268.50272.58273.32272.79273.18272.99[1.52, 1.79]
13Xingning329.36333.89334.38334.05334.34334.24[1.37, 1.53]
14Chenghai683.90686.66686.21686.54686.34686.39[0.34, 0.40]
Total5756.795787.155789.025787.645788.885788.45[0.53, 0.56]
Publisher’s Note: MDPI stays neutral with regard to jurisdictional claims in published maps and institutional affiliations.

