
Water Efficiency Households Retrofit Proposal Based on Rainwater Quality in Acapulco, Mexico
 ,
,  , ,
, ,  and
and
Abstract
:
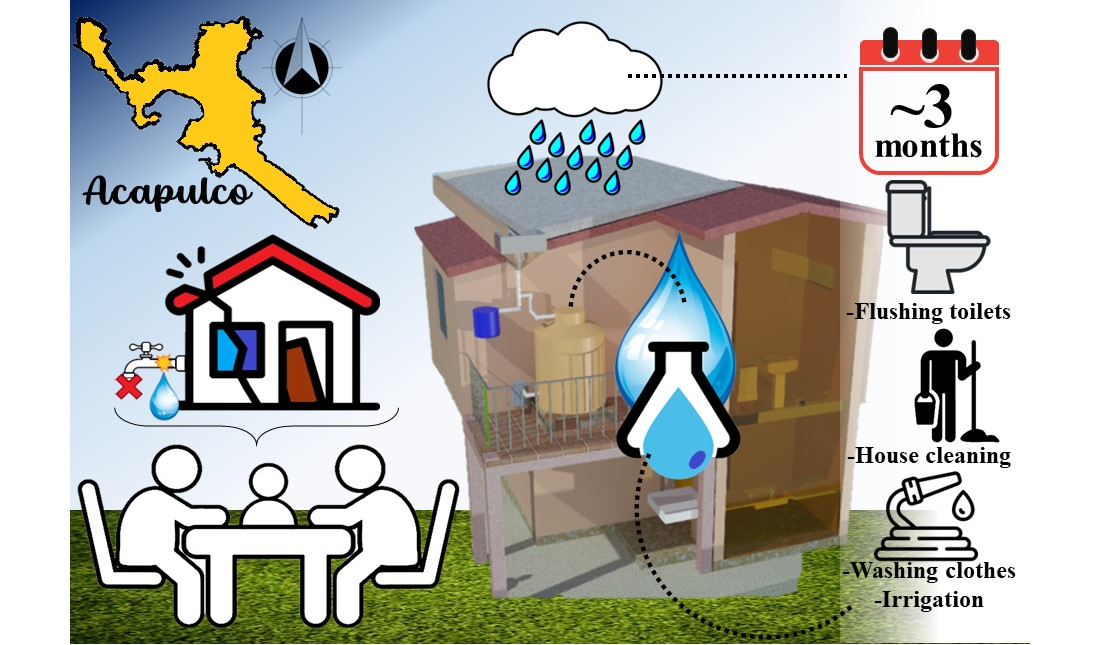
1. Introduction
2. Materials and Methods
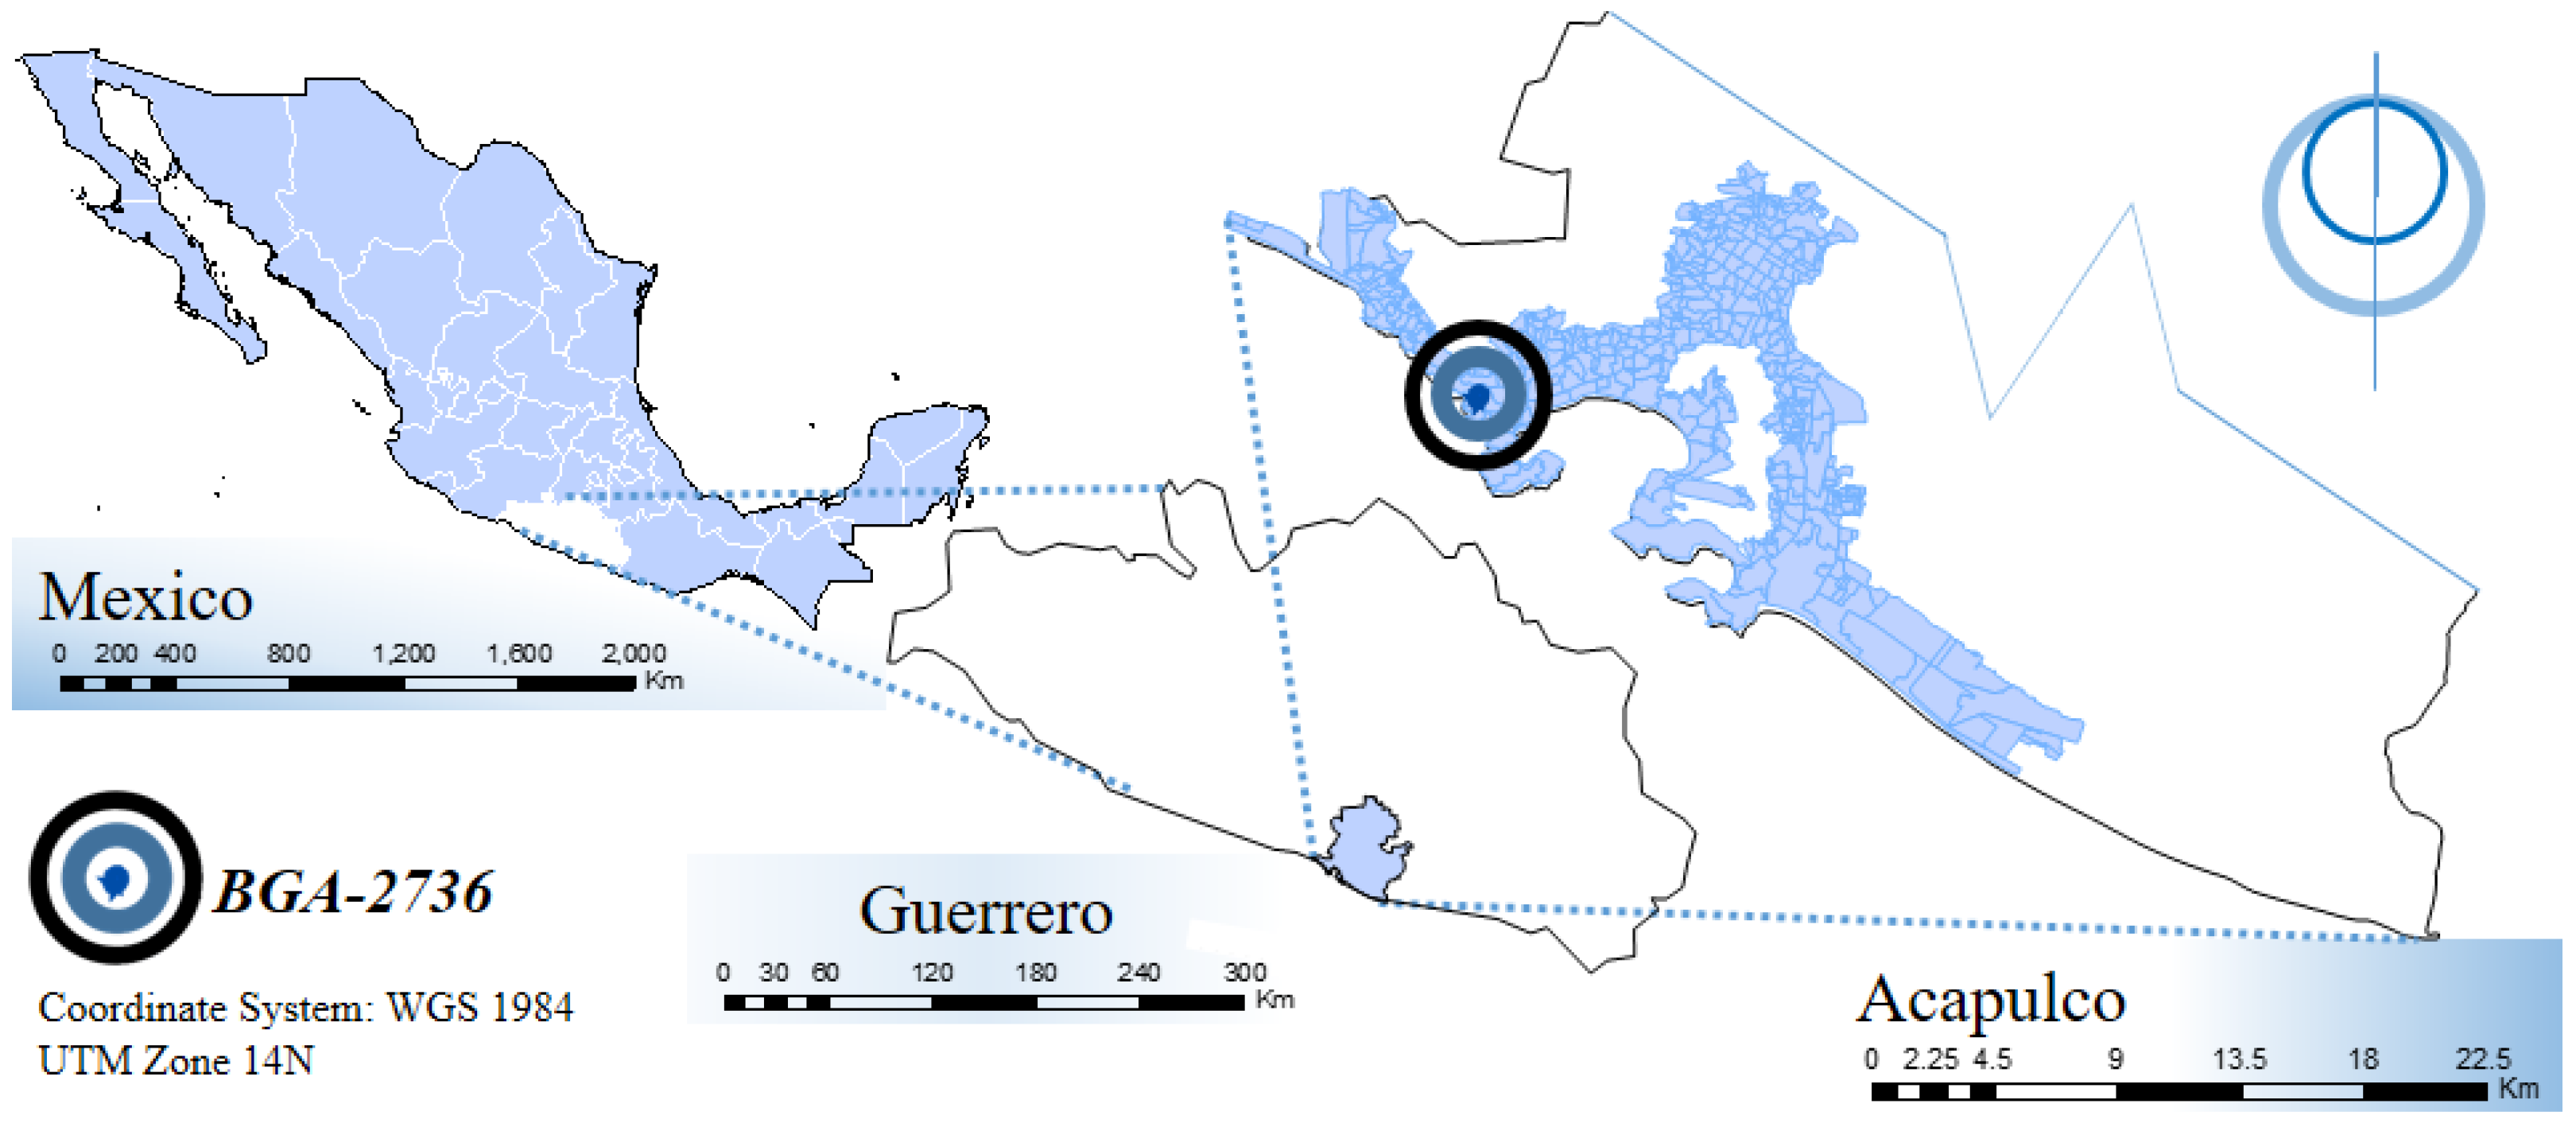
2.1. Sampling Location
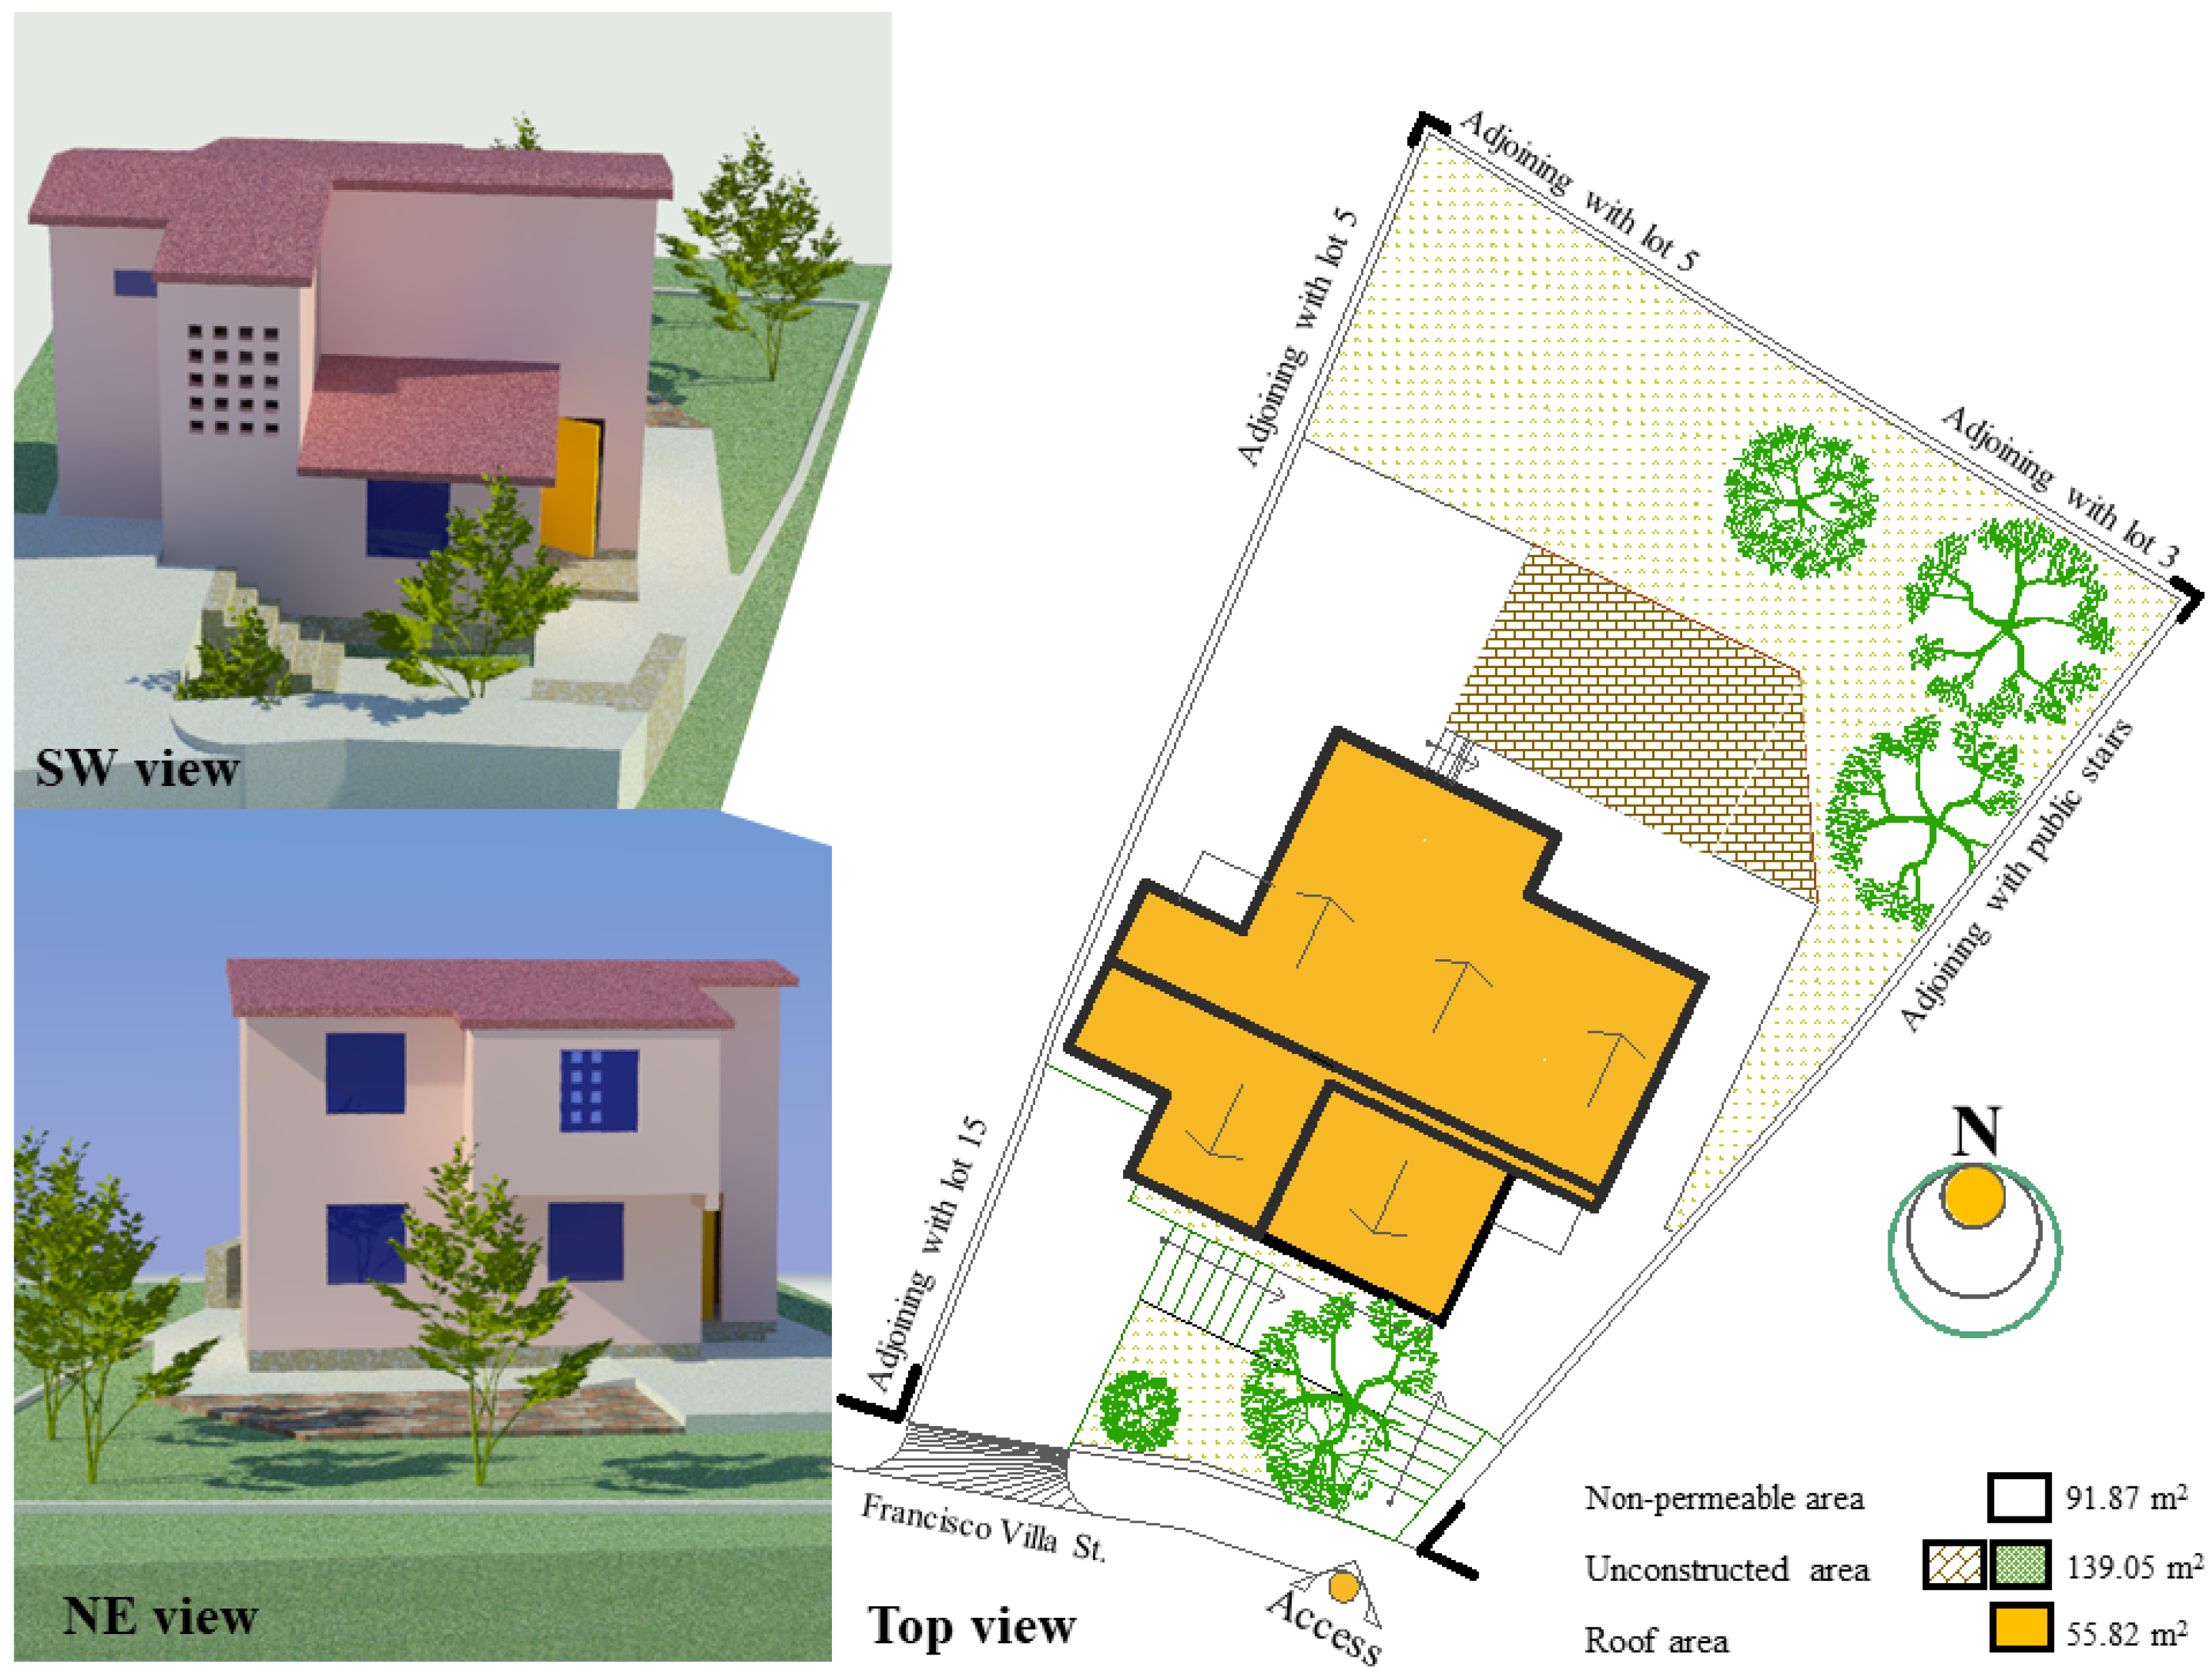
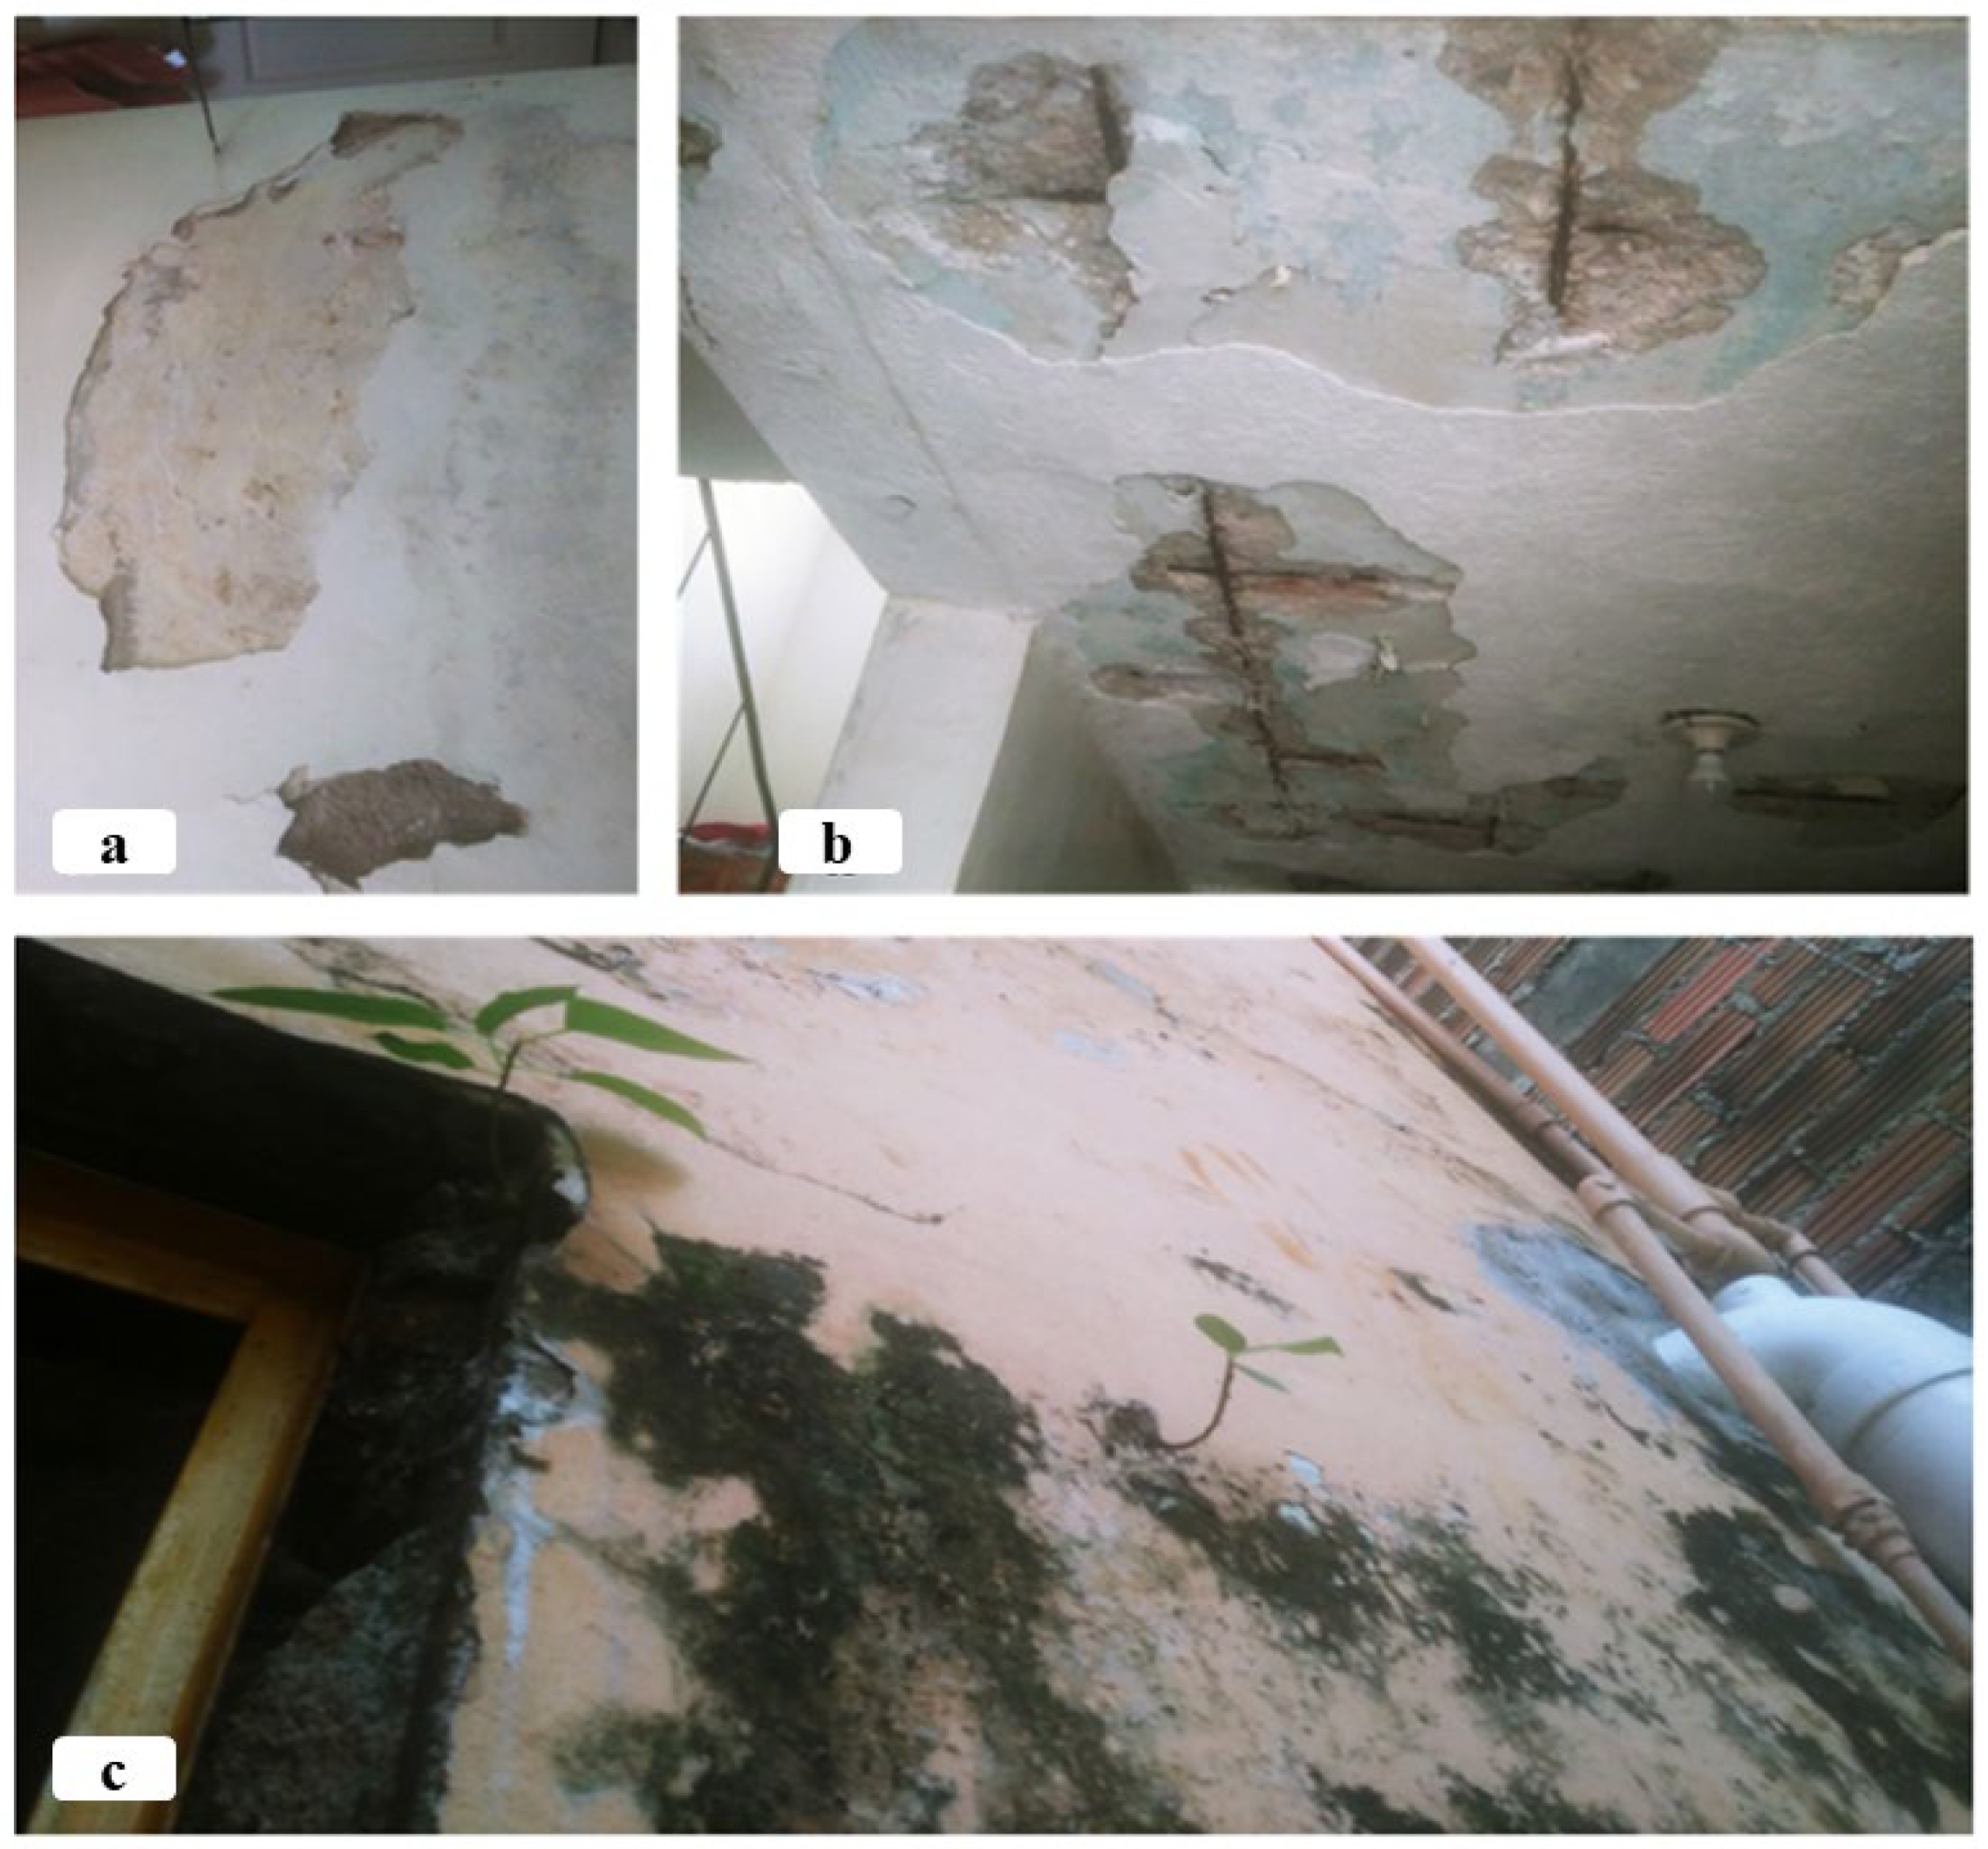
2.1.1. Characteristics of a Pattern Single-Family Household
2.1.2. Basic Geostatistical Area 2736 Socioeconomic and Urban Characterization
Water Sources and Management
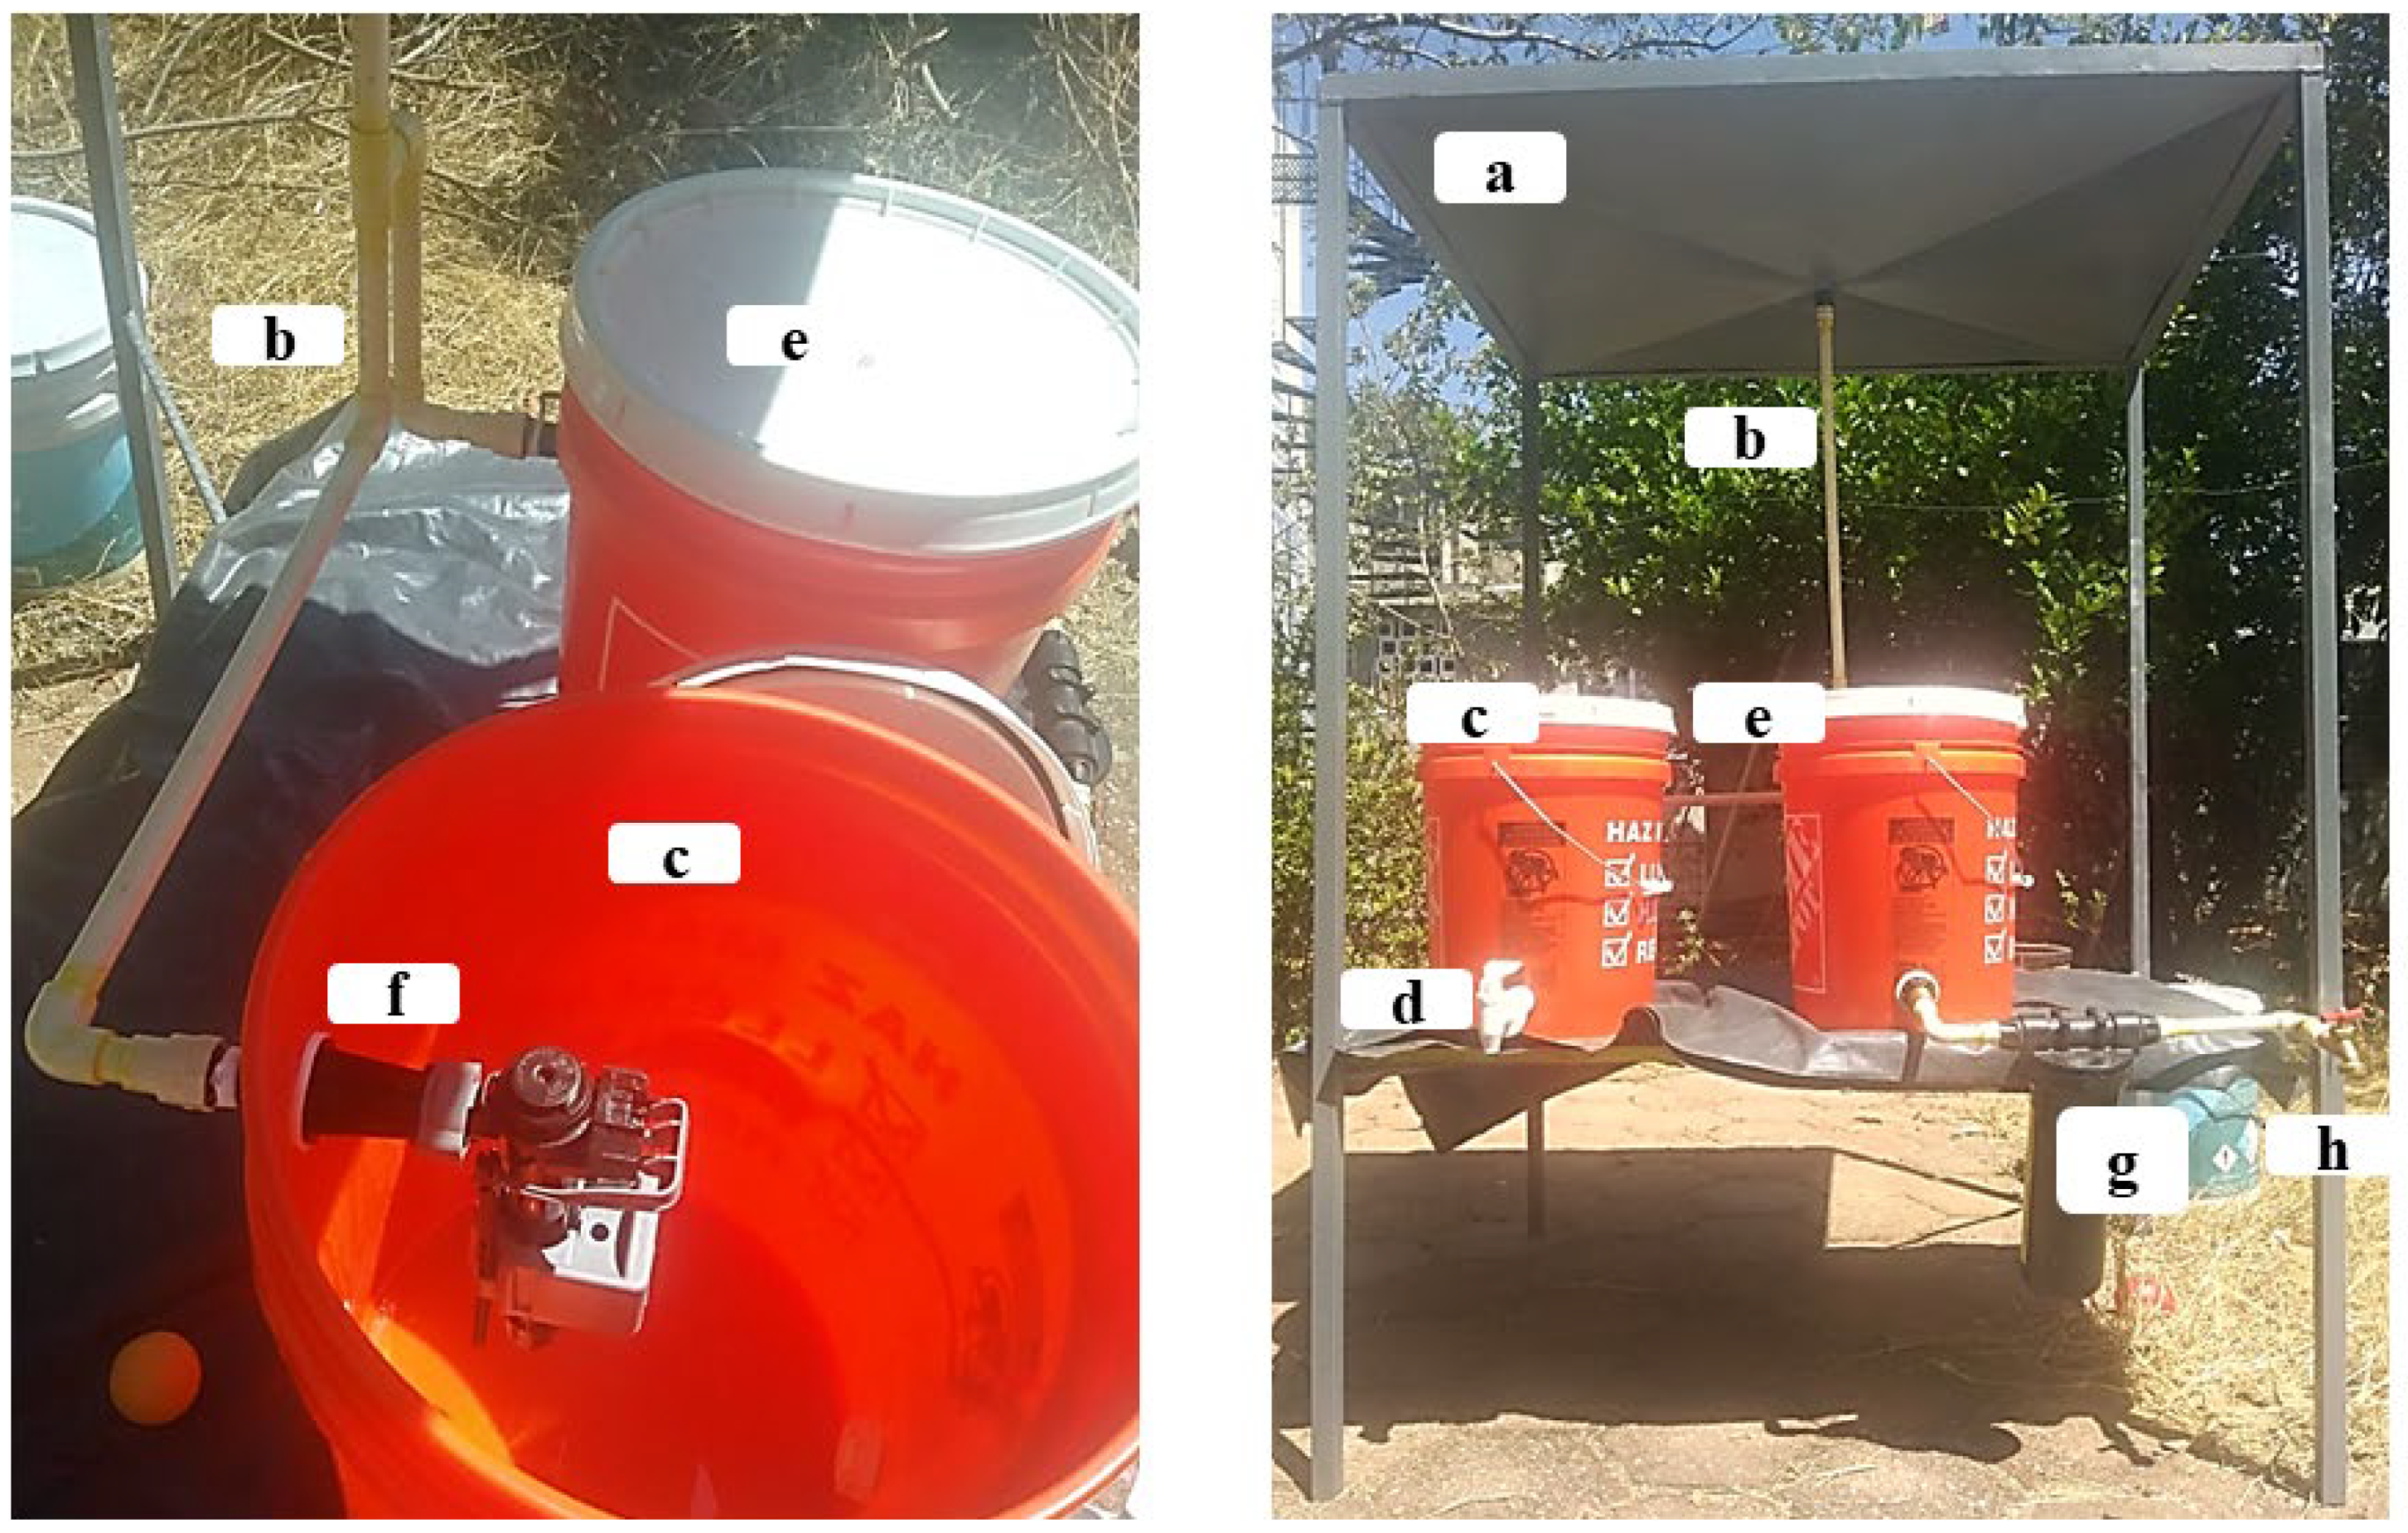
2.2. Design of the Rainwater Harvesting Sampling System
2.3. Rainwater Harvesting System Performance
2.3.1. Calculation of Rainwater Harvesting Potential
2.3.2. Water Saving and System Harvesting Efficiency
2.3.3. Rainwater Chemical Analysis
2.4. Water Efficiency Retrofit in a Single-Family Household for the Harvesting and Use of Rainwater: Social Acceptance Evaluation
3. Results and Discussion
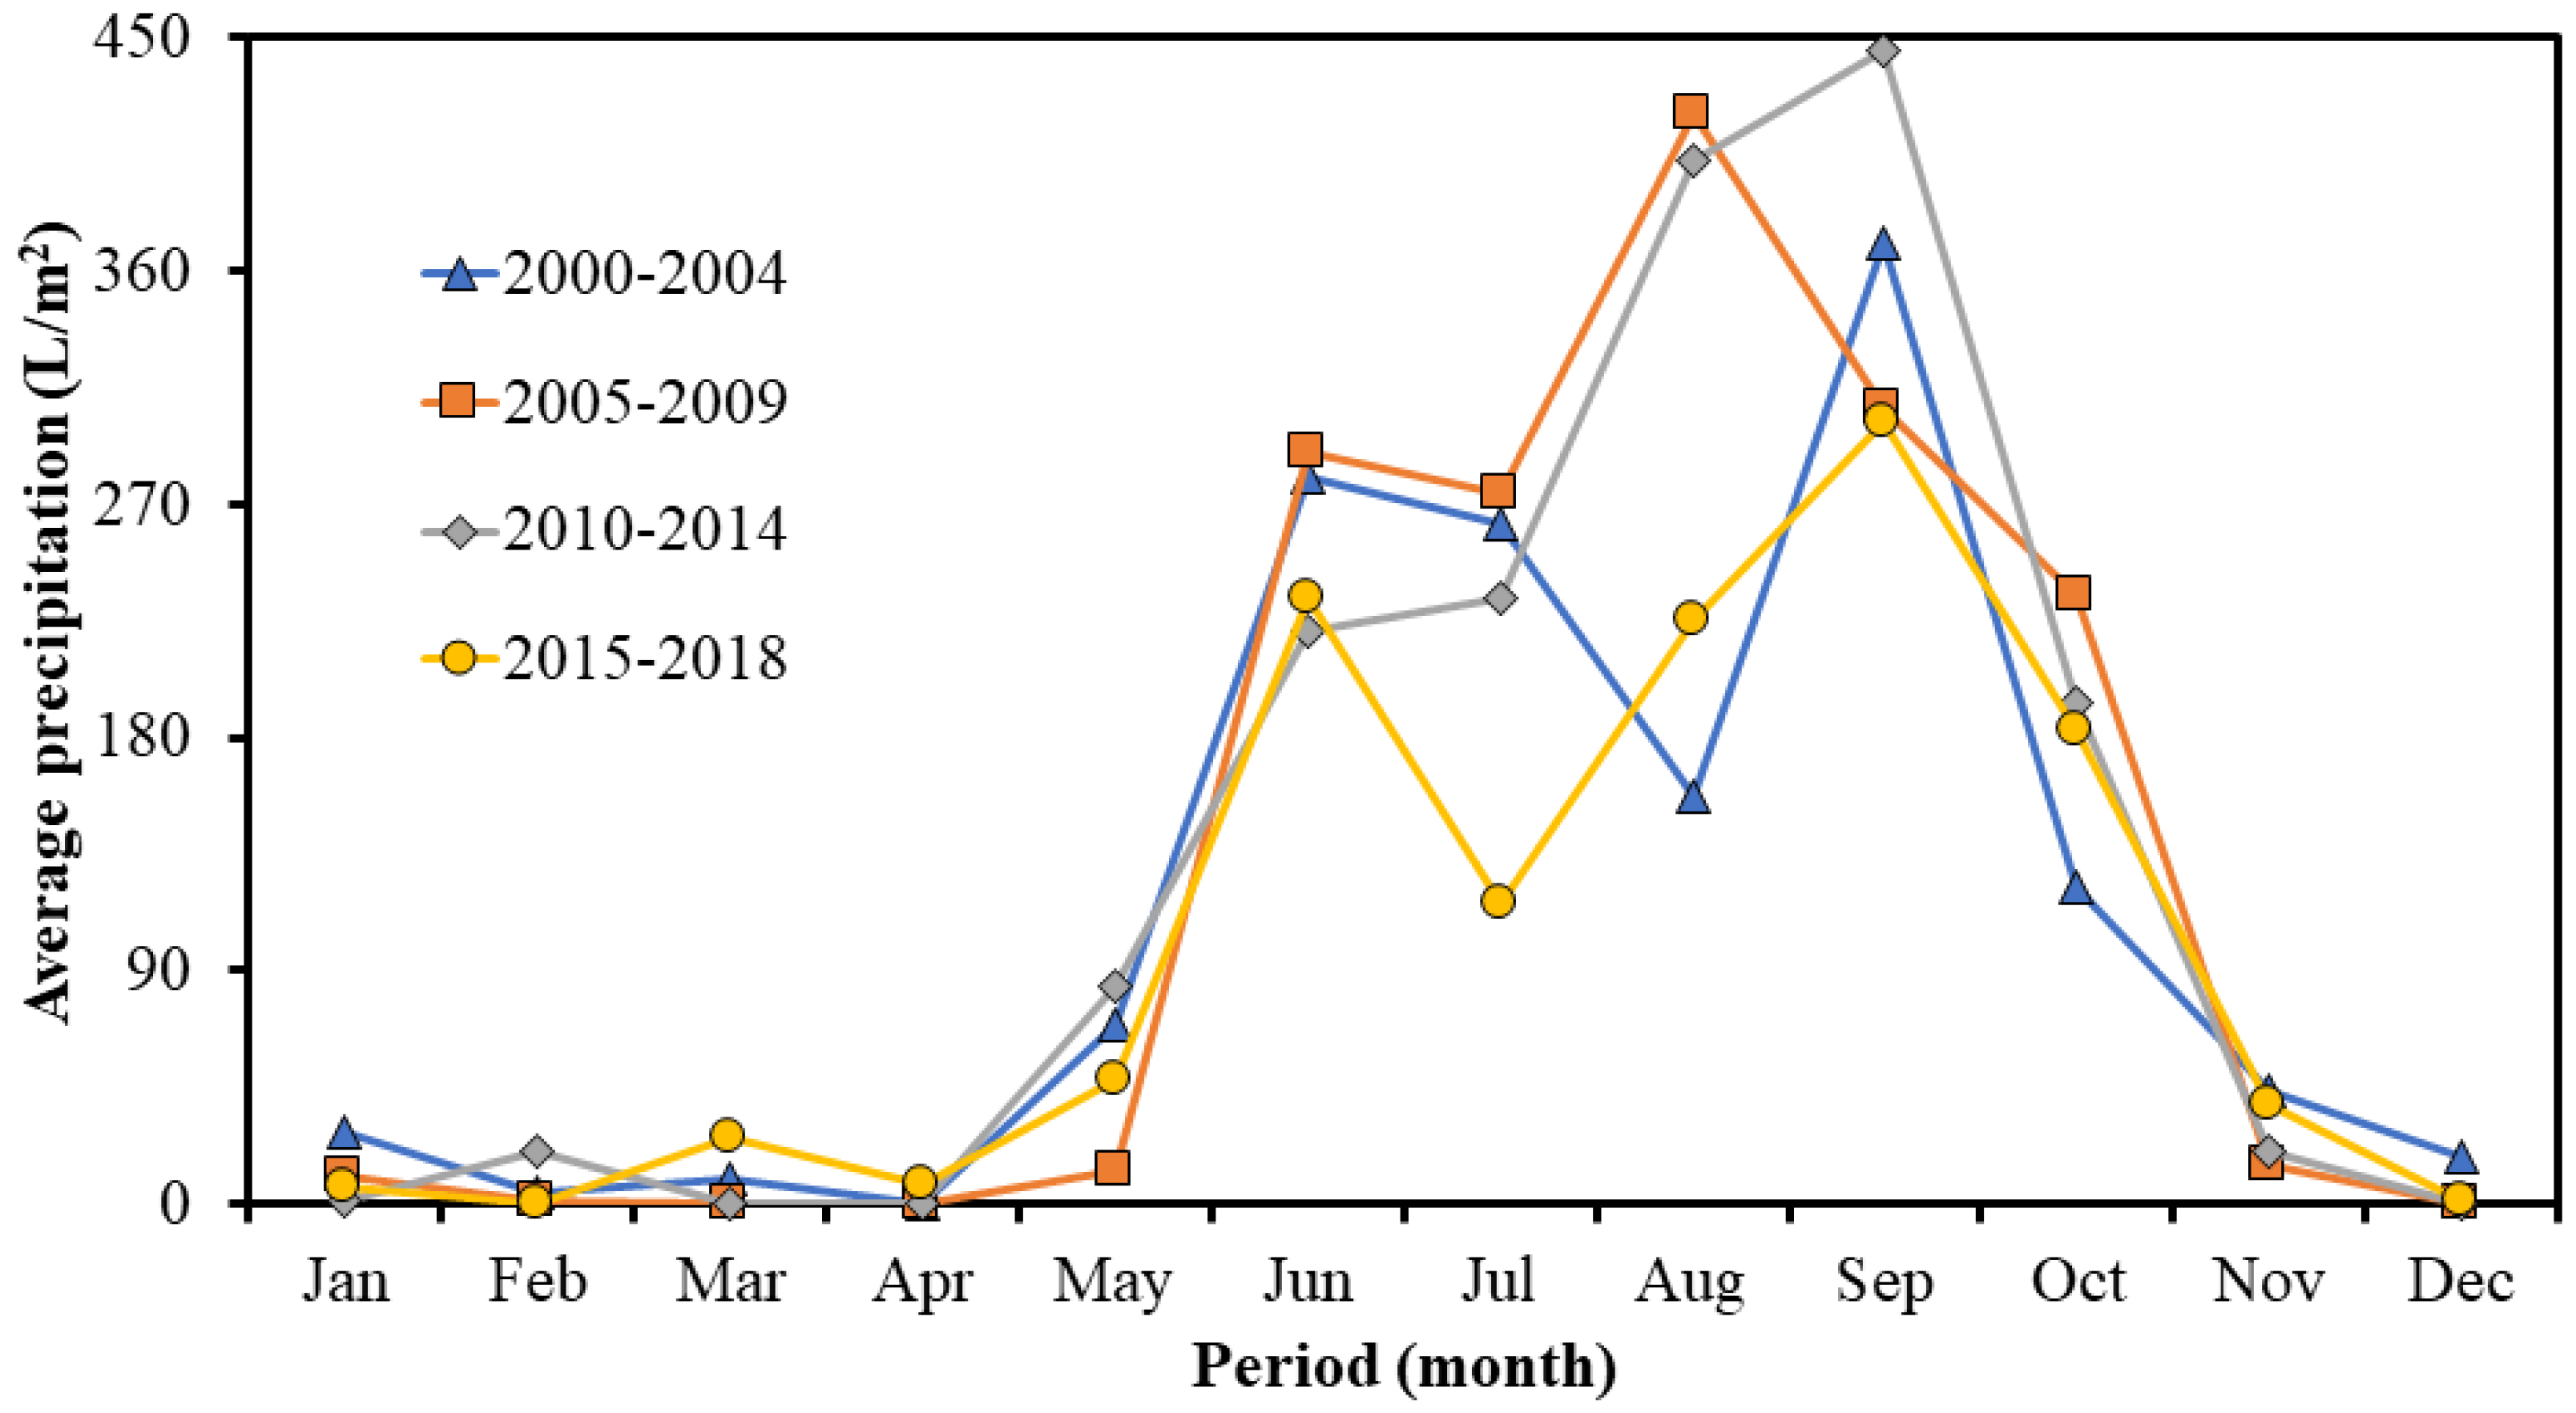
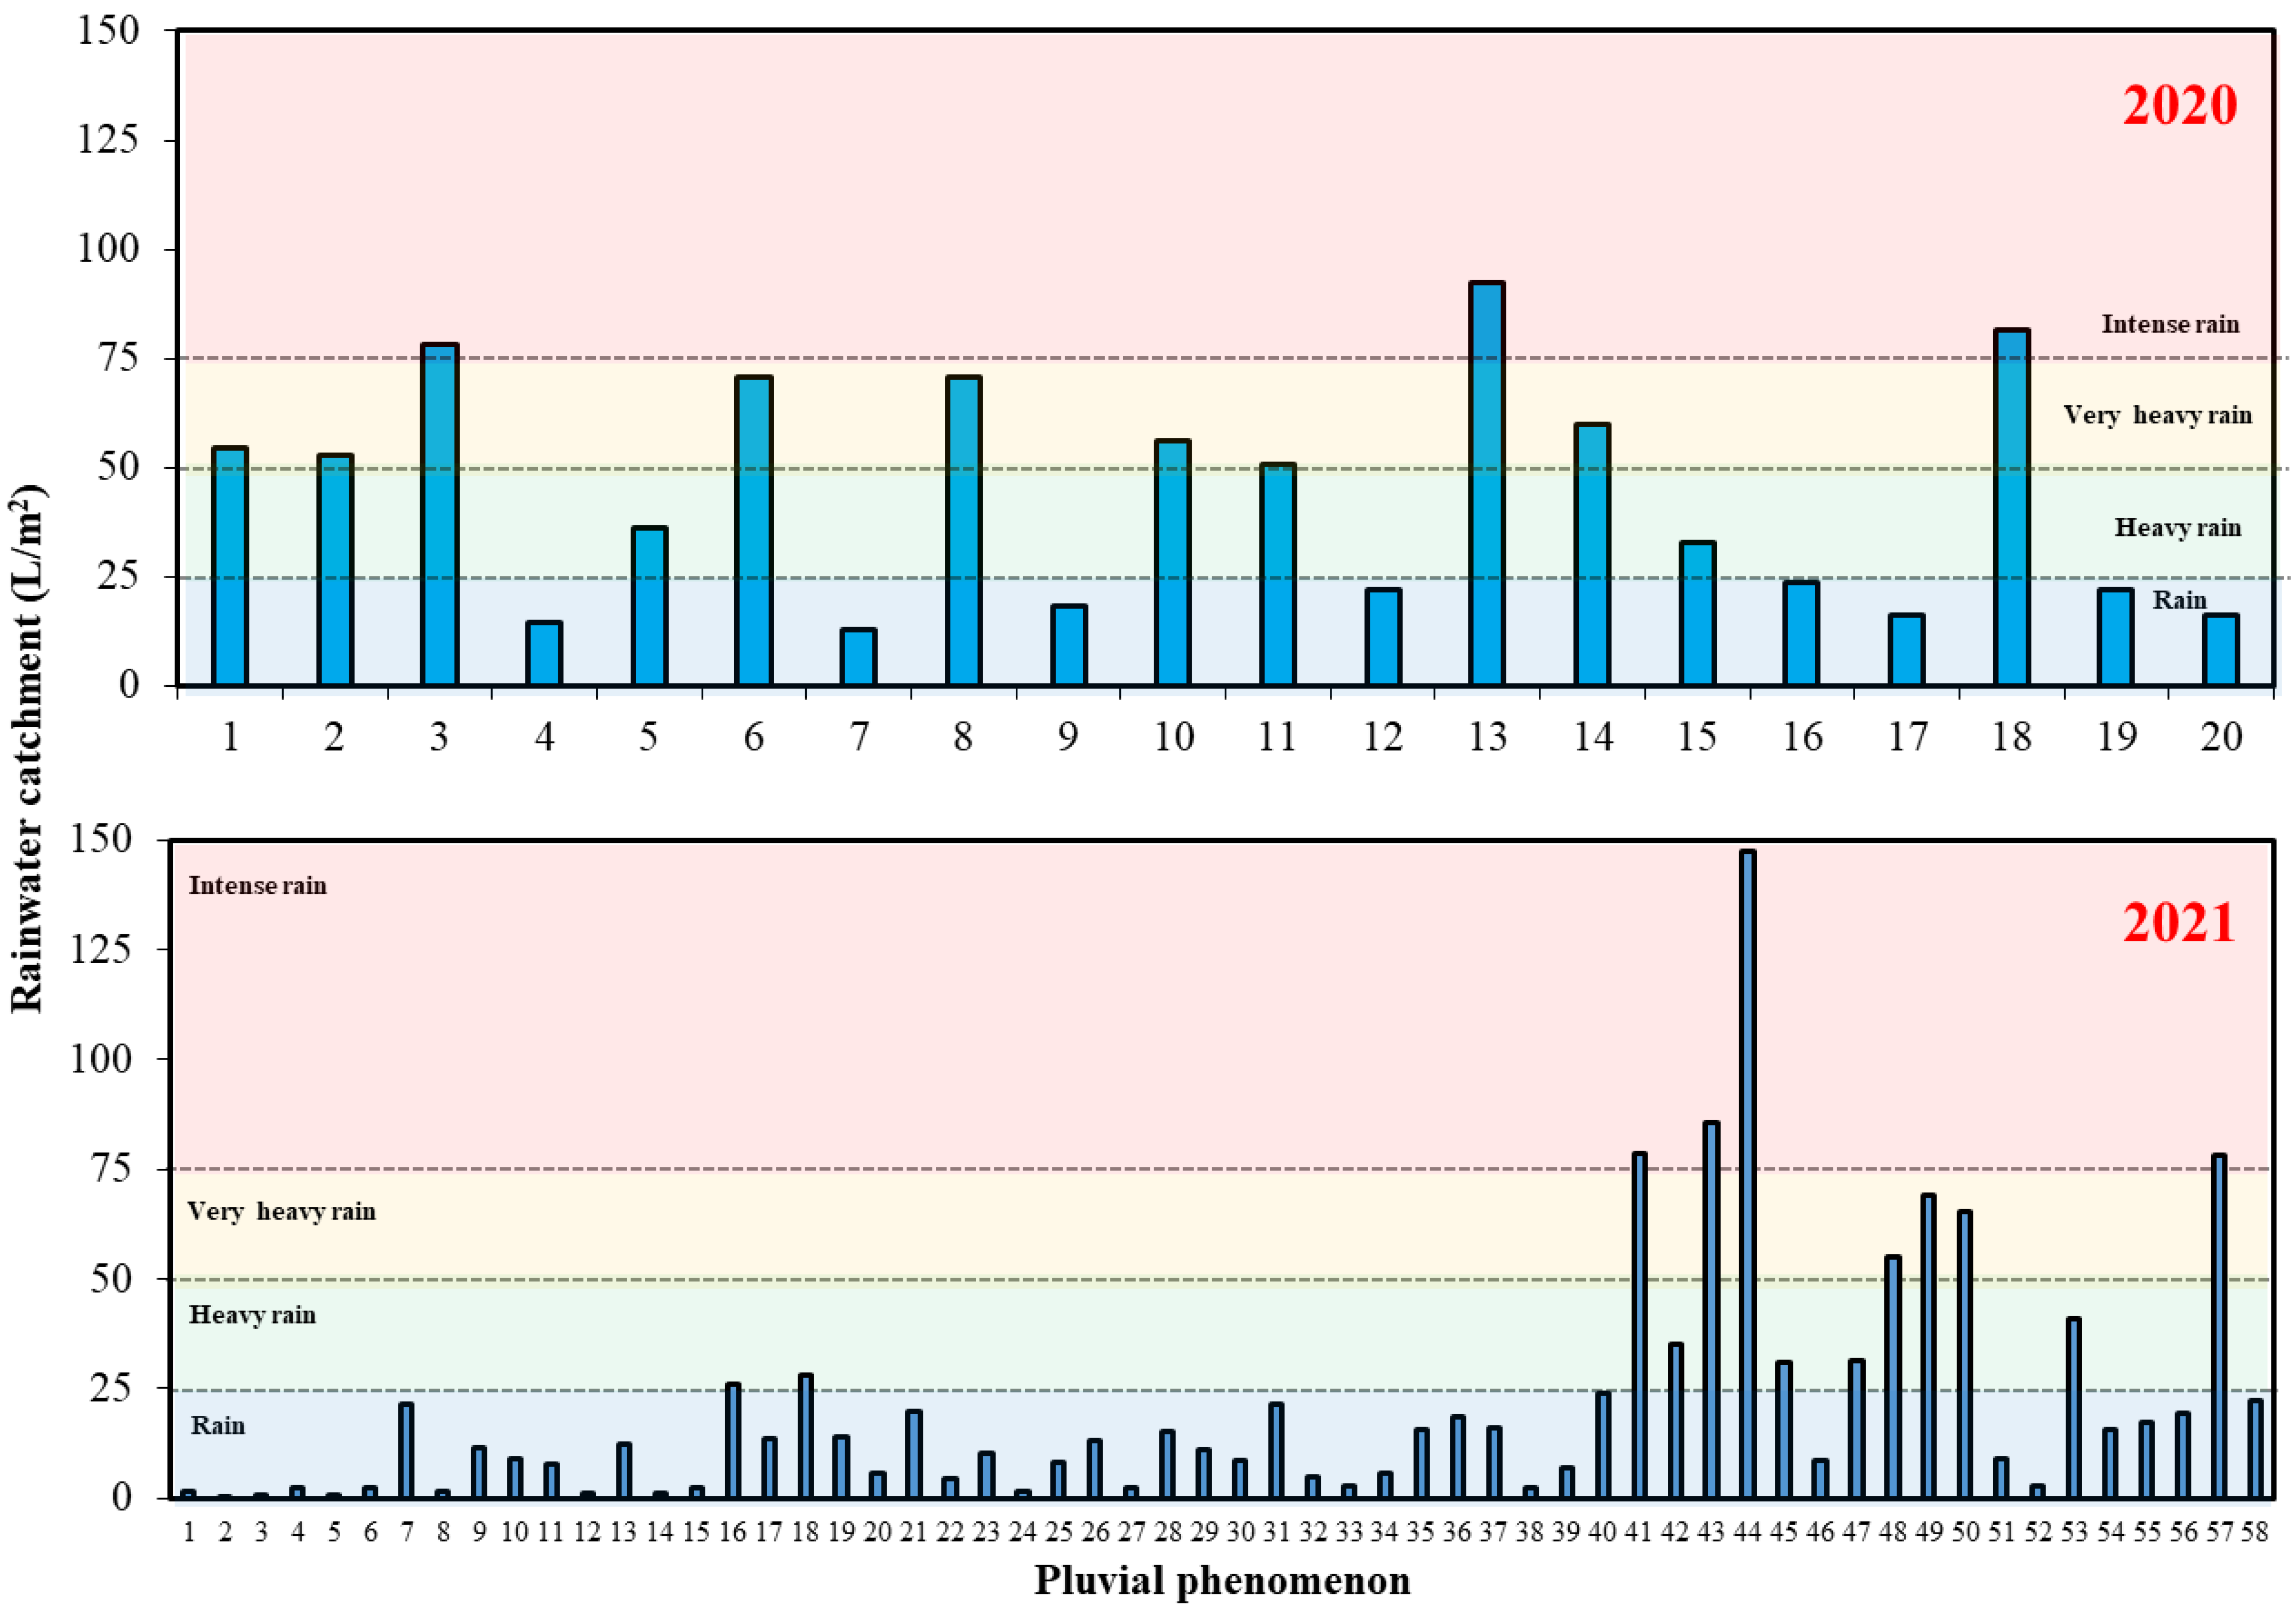
3.1. Average Precipitation in Basic Geostatistical Area 2736
3.2. Rainwater Quality
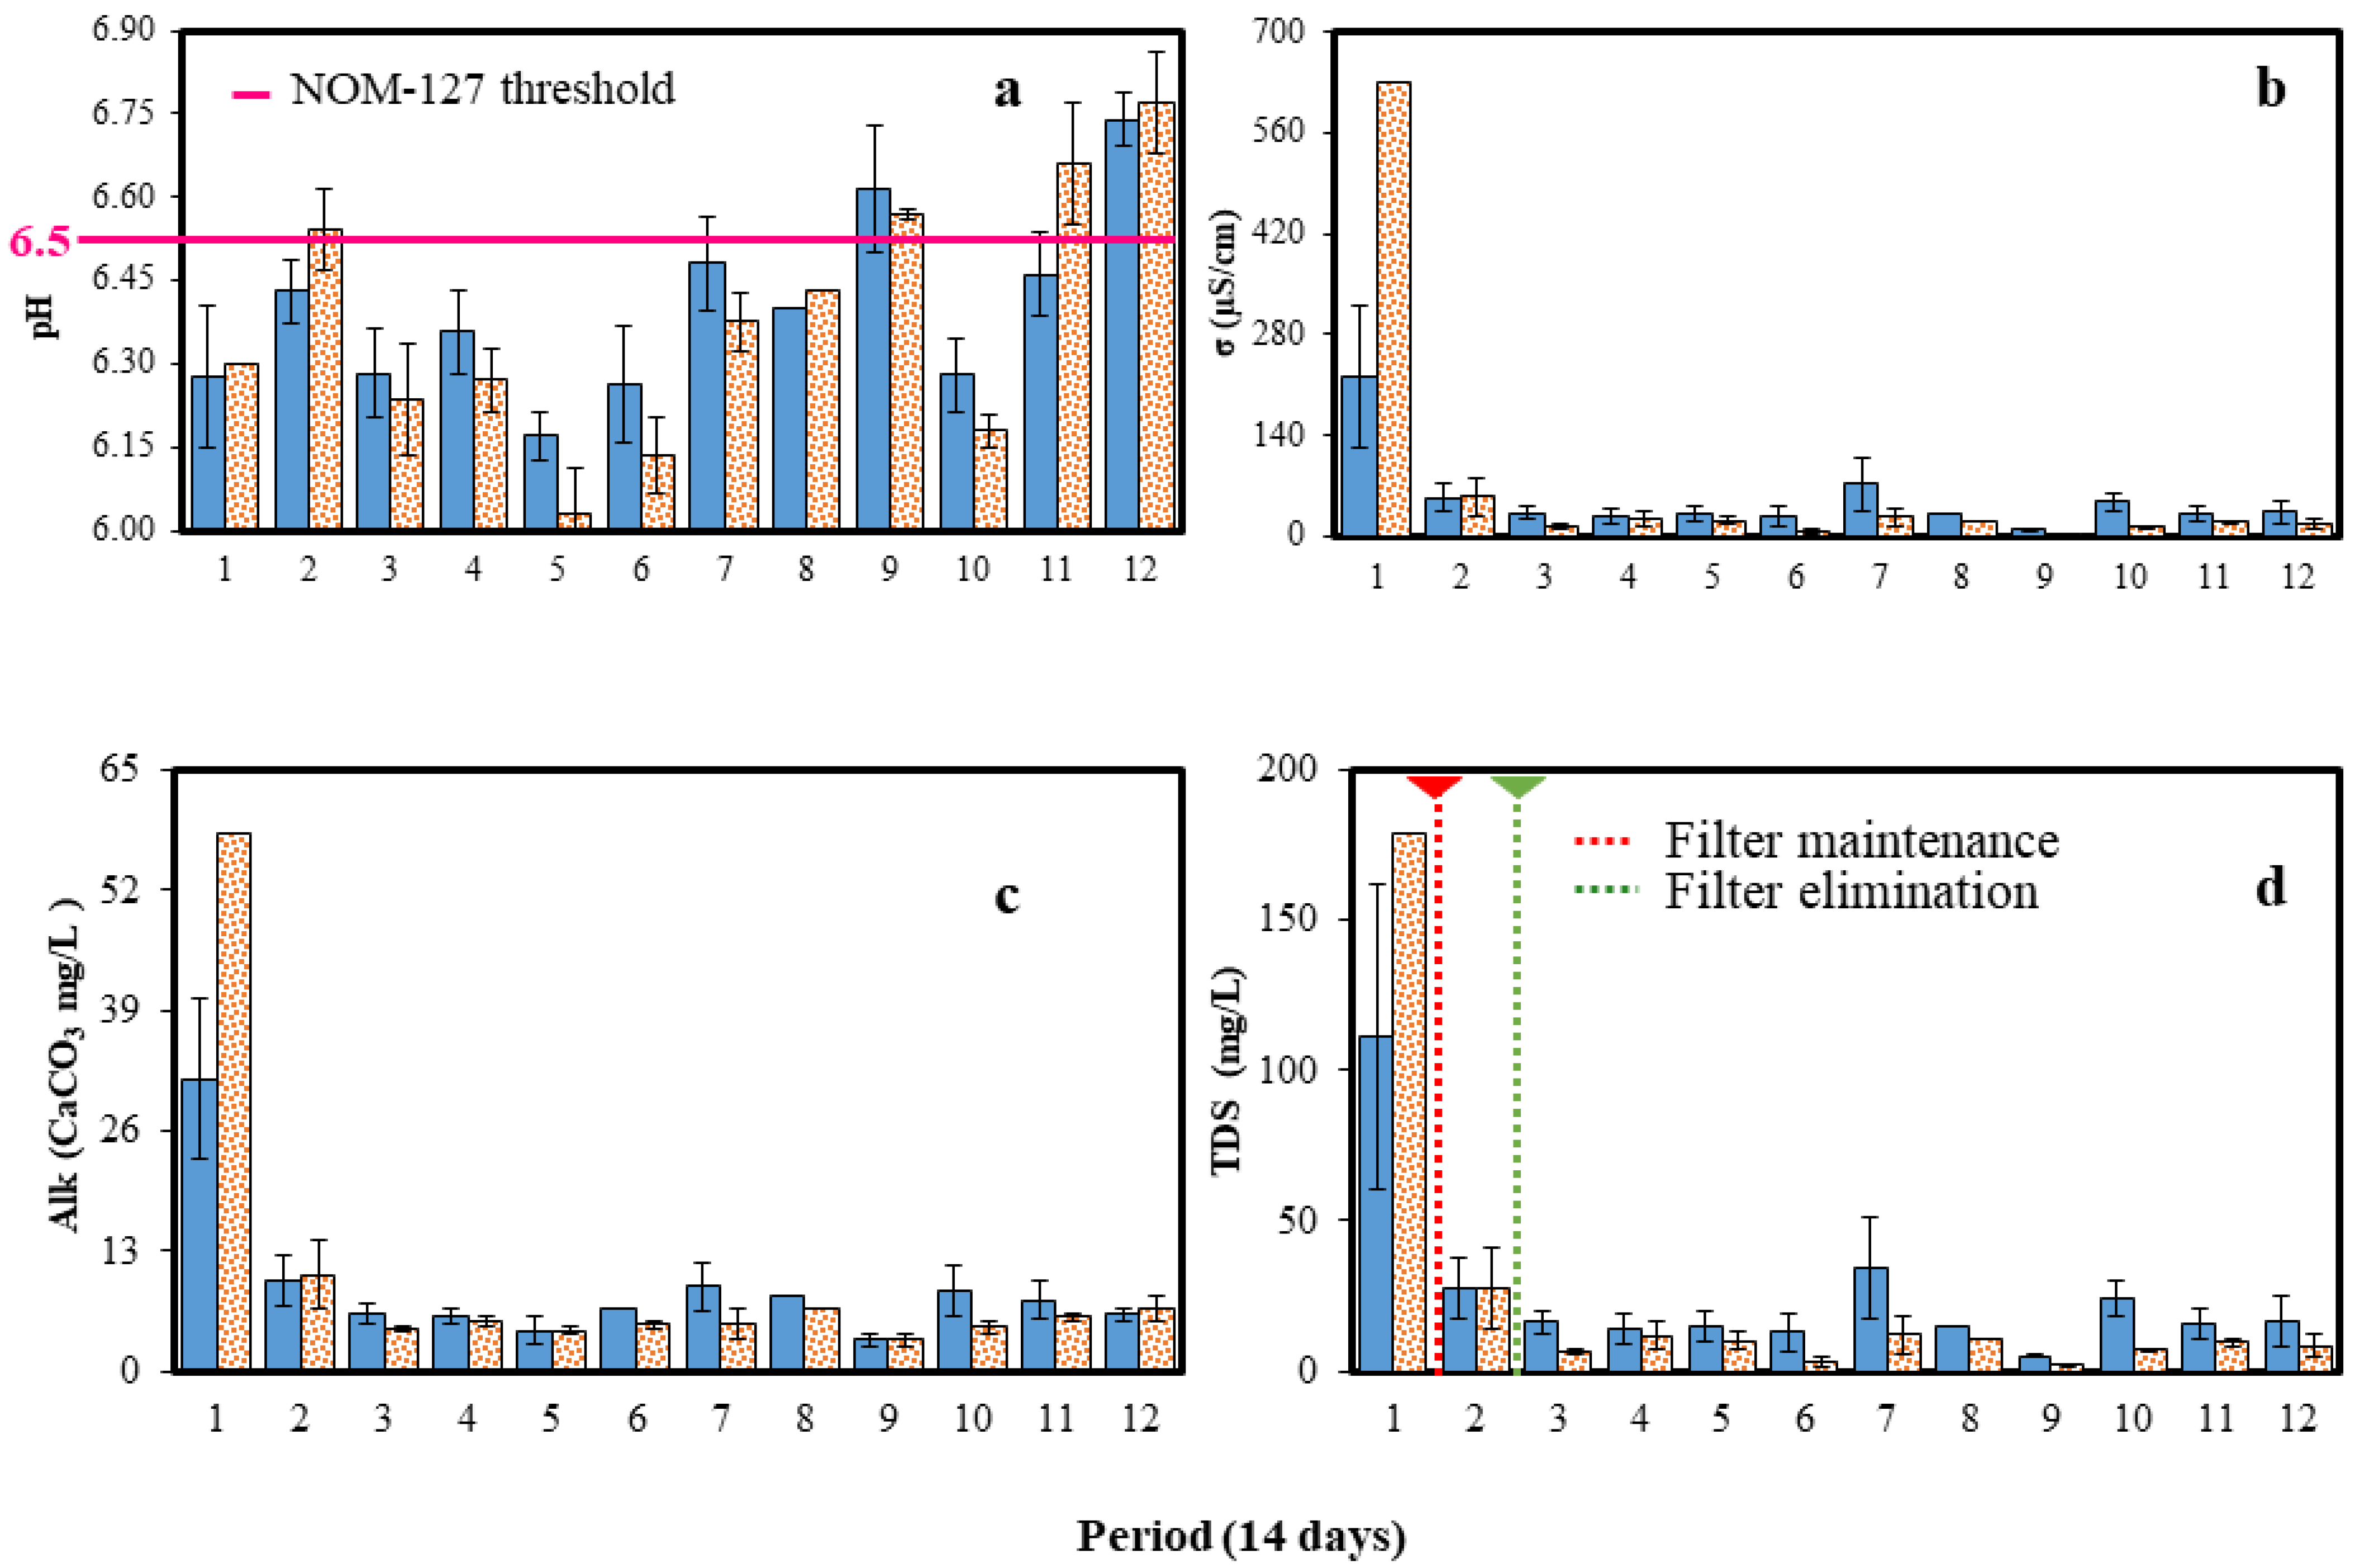
3.2.1. pH
3.2.2. Electrical Conductivity
3.2.3. Alkalinity
3.2.4. Total Dissolved Solids

| Parameter | Secretary of Health | WHO | This Study | |||||
|---|---|---|---|---|---|---|---|---|
| NOM-127 | NOM-201 | Human Consumption | Second-Necessity | FRS | ST | |||
| pH | 6.5–8.5 | NCS | NCS | 6.44 ± 0.52 | 6.38 ± 0.08 | |||
| σ (µS/cm) | NCS | 46.21 ± 17.39 | 86.70 ± 54.51 | |||||
| mg/L) | 9.71 ± 2.96 | 12.08 ± 5.16 | ||||||
| TDS | (mg/L) | 1000 | NCS | 22.99 ± 8.73 | 32.00 ± 17.72 | |||
| NCS | NCS | 9.61 ± 2.63 | 7.30 ± 1.62 | |||||
| 11 | 10 | 2.06 ± 0.54 | 1.81 ± 0.34 | |||||
| 400 | NCS | 2.08 ± 1.07 | 6.75 ± 4.58 | |||||
| Aluminum | 0.20 | NCS | 0.90 | 18.00 | 0.016 ± 0.018 | <DL | ||
| Arsenic | 0.025 | 0.01 | 0.01 | 0.20 | 0.006 ± 0.001 | 0.013 ± 0.005 | ||
| Barium | 1.3 | 0.70 | NCS | NCS | 0.028 ± 0.02 | 0.053 ± 0.04 | ||
| Cadmium | 0.005 | 0.003 | 0.003 | 0.06 | 0.02 ± 0.015 | 0.016 ± 0.005 | ||
| Chromium | 0.05 | 0.05 | 0.05 | 1.00 | 0.007 ± 0.00 | 0.007 ± 0.00 | ||
| Iron | 0.30 | NCS | NCS | NCS | 0.024 ± 0.018 | 0.019 ± 0.008 | ||
| Manganese | 0.15 | 0.40 | 0.40 | 8.00 | 0.006 ± 0.003 | 0.007 ± 0.002 | ||
| Nickel | 0.07 | 0.02 | 0.07 | 1.40 | 0.010 ± 0.00 | 0.009 ± 0.00 | ||
| Lead | 0.01 | 0.01 | 0.01 | 0.20 | 0.006 ± 0.001 | 0.010 ± 0.003 | ||
| Copper | NCS | 2 | 40.00 | 0.013 ± 0.002 | 0.019 ± 0.005 | |||
| Calcium | NCS | 1.820 ± 1.138 | 11.479 ± 7.332 | |||||
| Cobalt | 0.026 ± 0.012 | 0.015 ± 0.005 | ||||||
| Potassium | 5.303 ± 3.256 | 2.206 ± 0.637 | ||||||
| Magnesium | 0.478 ± 0.309 | 2.37 ± 1.513 | ||||||
| Silicium | <DL | 0.629 ± 0.506 | ||||||
| Strontium | 0.007 ± 0.005 | 0.059 ± 0.063 | ||||||
| Vanadium | <DL | |||||||
| Zinc | ||||||||
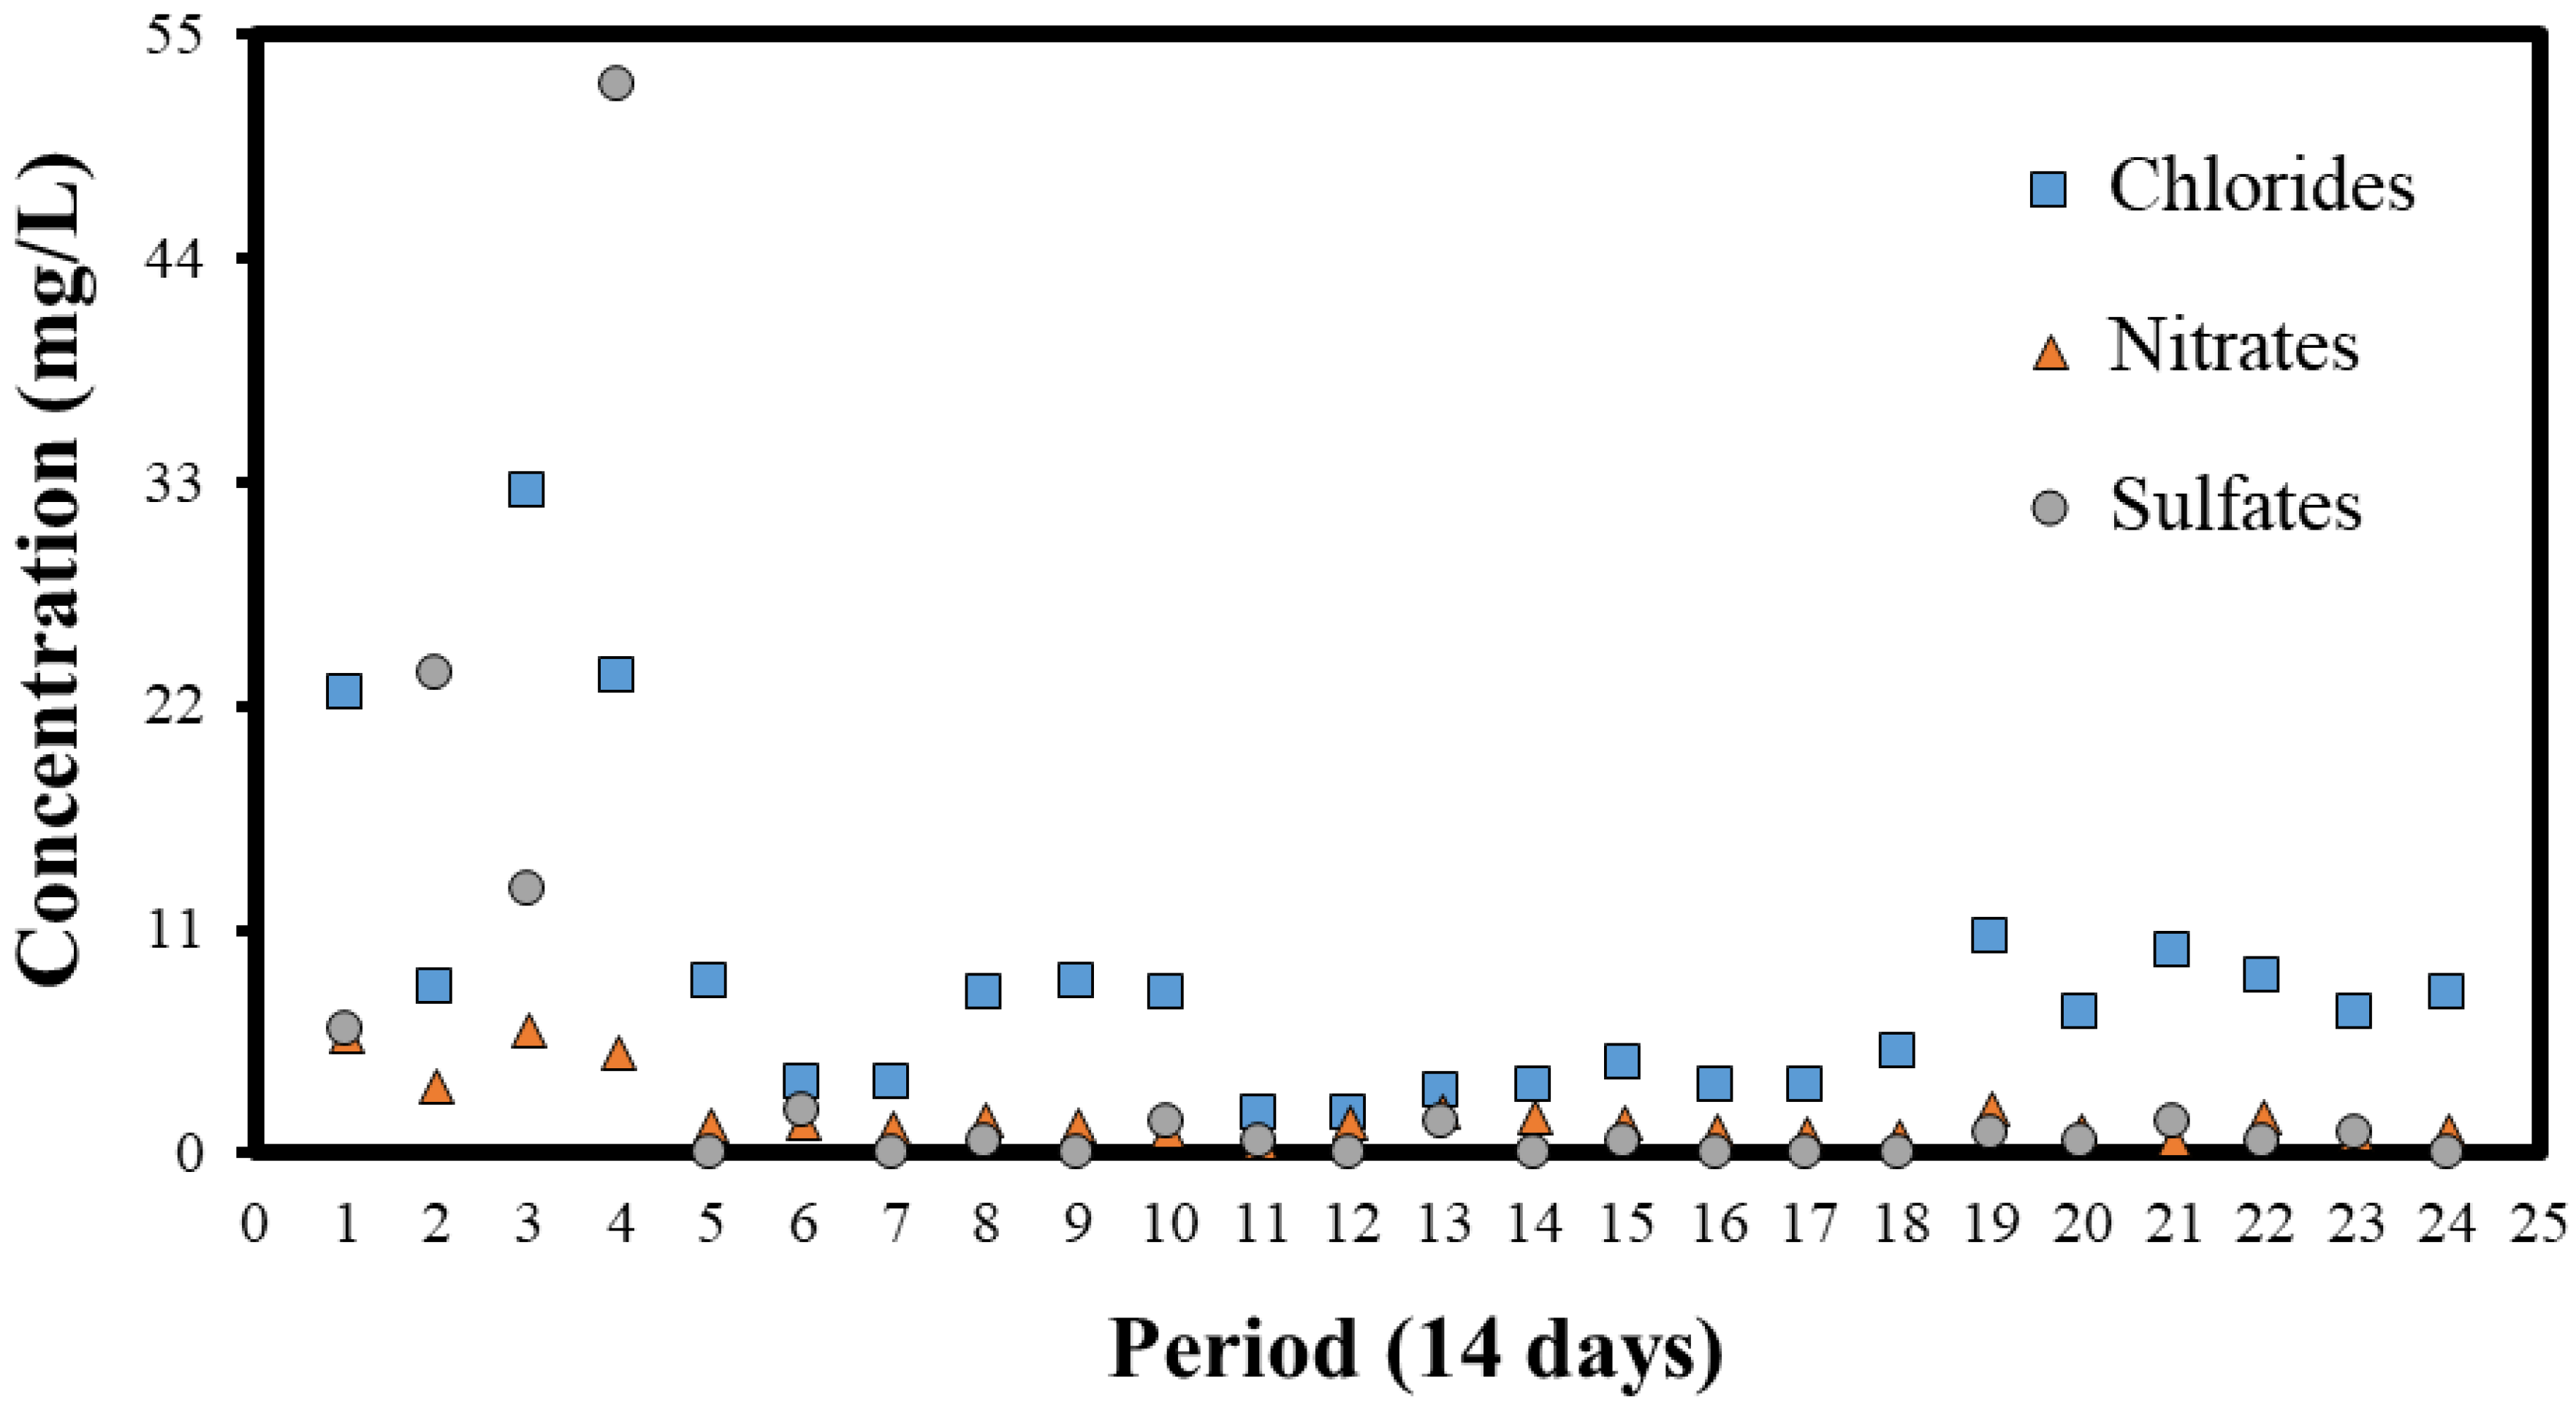
3.2.5. Major Anions
3.2.6. Major Cations
3.2.7. Comparative Study of Rainwater Quality in Different Cities
| Parameter | Study Site | ||||||||||||||
|---|---|---|---|---|---|---|---|---|---|---|---|---|---|---|---|
| Mexico City * | Industrial Area | Rural Area | Coastal Area | ||||||||||||
| CU-UNAM | Gustavo A. Madero | Nuevo León, MTY | Hidalgo | Morelos, Tlalnepantla | Puebla, San José Xacxamayo | Hidalgo | Veracruz | Guerrero, Acapulco | |||||||
| Tula | Tulancingo | Pachuca | Agua Blanca | Molango | El Tajín | ||||||||||
| Study period | |||||||||||||||
| 2006–2009 | 2007 | 2014–2015 | 2016–2017 | 2007 | 2016–2017 | 2006–2009 | 2014 | 2016–2017 | 2002–2003 | 2021 | |||||
| pH | 5.44 | 5.8 | 6.32 | NR | 6.58 | NR | NR | NR | 5.01 | 7.70–10.42 | NR | NR | 4.4 | 6.38 | |
| σ (µS/cm) | 34.65 | NR | 79.14 | NR | NR | NR | NR | NR | 14.25 | 33–176 | NR | NR | NR | 86.70 | |
| Alk ( mg/L) | 44.79 | NR | 6.14 | NR | NR | NR | NR | NR | 36.03 | NR | NR | NR | NR | 12.08 | |
| TDS | (mg/L) | NR | NR | 52.71 | NR | NR | NR | NR | NR | NR | 23–123 | NR | NR | NR | 32.00 |
| 0.324 | 0.34 | 11.34 | NR | 0.625 | NR | NR | NR | 0.308 | NR | NR | NR | 0.49 | 7.30 | ||
| 3.242 | 2.64 | 1.90 | NR | 1.20 | NR | NR | NR | 1.30 | NR | NR | NR | 0.72 | 1.81 | ||
| 6.72 | 5.95 | 16.75 | NR | 4.29 | NR | NR | NR | 3.37 | NR | NR | NR | 0.66 | 6.75 | ||
| Al | NR | 0.91 | 0.042 | NR | NR | NR | NR | NR | NR | NR | NR | NR | NR | <LD | |
| As | NR | NR | 0.003 | 0.003 | NR | 0.004 | 0.003 | 0.003 | NR | NR | 0.003 | 0.002 | NR | 0.01 | |
| Ba | NR | NR | NR | NR | NR | NR | NR | NR | NR | NR | NR | NR | NR | 0.05 | |
| Cd | NR | 0.02 | NR | 0.004 | NR | 0.002 | 0.002 | 0.001 | NR | NR | 0.002 | 0.001 | NR | 0.02 | |
| Cr | NR | 0.008 | NR | 0.035 | NR | 0.036 | 0.038 | 0.030 | NR | NR | 0.058 | 0.055 | NR | 0.01 | |
| Fe | NR | NR | 0.089 | 0.371 | NR | 0.472 | 0.406 | 0.292 | NR | NR | 0.379 | 0.448 | NR | 0.02 | |
| Mn | NR | 0.121 | NR | NR | NR | 0.074 | 0.098 | 0.075 | NR | NR | 0.053 | 0.148 | NR | 0.01 | |
| Ni | NR | 0.047 | NR | 0.019 | NR | 0.033 | 0.014 | 0.012 | NR | NR | 0.029 | 0.012 | NR | 0.01 | |
| Pb | NR | 0.109 | 0.002 | 0.033 | NR | 0.028 | 0.031 | 0.020 | NR | NR | 0.045 | 0.031 | NR | 0.01 | |
| Ca | 1.70 | 1.06 | 8.47 | NR | 9.73 | NR | NR | NR | 0.51 | NR | NR | NR | 0.24 | 11.48 | |
| Co | NR | NR | NR | 0.009 | NR | 0.015 | 0.017 | 0.013 | NR | NR | 0.014 | 0.013 | NR | 0.02 | |
| Cu | NR | NR | 0.106 | 0.037 | NR | NR | 0.046 | 0.041 | NR | NR | 0.032 | 0.047 | NR | 0.02 | |
| K | 0.072 | 0.084 | 0.50 | NR | 1.12 | NR | NR | NR | 0.017 | NR | NR | NR | 0.12 | 2.21 | |
| Mg | 0.103 | 0.060 | 1.82 | 0.044 | 1.47 | NR | NR | NR | 0.019 | NR | NR | NR | 0.00096 | 2.37 | |
| Si | NR | NR | NR | NR | NR | NR | NR | NR | NR | NR | NR | NR | NR | 0.63 | |
| Sr | NR | NR | NR | NR | NR | NR | NR | NR | NR | NR | NR | NR | NR | 0.06 | |
| V | NR | 0.052 | NR | NR | NR | NR | NR | NR | NR | NR | NR | NR | NR | <LD | |
| Zn | NR | NR | 0.468 | 0.952 | NR | 0.137 | 1.892 | 1.174 | NR | NR | 0.799 | 0.282 | NR | <LD | |
| References | [14] | [66] | [60] | [67] | [68] | [67] | [14] | [69] | [67] | [59] | This study | ||||
| Parameter | Study Site | |||||||||
|---|---|---|---|---|---|---|---|---|---|---|
| Megacities | Rural Area | Coastal Area | ||||||||
| Shanghai | India | Bangladesh | France | Greece | United Kingdom | Iran * | China ** | Guerrero | ||
| pH | 4.69 | 6.8 | 6.72 | 6.5 | 7.63–8.8 | 7.6–10.4 | 7.2 | 4.56 | 6.38 | |
| σ (µS/cm) | NR | 55 | NR | 56.20 | 56–220 | 43.5–261 | 300 | NR | 86.70 | |
| Alk mg/L) | NR | NR | 50 | 0.10 | 6–48 | NR | NR | NR | 12.08 | |
| TDS | (mg/L) | NR | NR | 12 | NR | NR | 30.4–183 | 315 | NR | 32.00 |
| 0.772 | 2.41 | 6.50 | 1.9 | 3–16 | 3–28 | NR | 0.731 | 7.30 | ||
| 2.471 | 12.52 | 0.40 | 2.80 | 5.28–13.02 | 1.32–17.74 | NR | 1.36 | 1.81 | ||
| 6.95 | 6.24 | NR | 1.9 | 1–13 | <2.5–5.3 | NR | 6.21 | 6.75 | ||
| Al | NR | 0.43 | NR | NR | NR | 0.08–0.11 | NR | NR | <DL | |
| As | NR | NR | NR | NR | NR | NR | NR | NR | 0.01 | |
| Ba | NR | NR | NR | NR | NR | NR | NR | NR | 0.05 | |
| Cd | NR | 0.01 | NR | NR | <0.0001–0.0002 | <0.0004 | <0.001 | NR | 0.02 | |
| Cr | NR | 0.011 | NR | NR | <0.001–0.005 | <0.0005 | <0.001 | NR | 0.01 | |
| Fe | NR | 0.121 | 0.11 | NR | 0.006–0.04 | 0.009–0.027 | NR | NR | 0.02 | |
| Mn | NR | 0.09 | NR | NR | <0.0005–0.073 | <0.002–0.0032 | NR | NR | 0.01 | |
| Ni | NR | 0.067 | NR | NR | <0.01–0.012 | <0.0015–0.0017 | <0.001 | NR | 0.01 | |
| Pb | NR | 0.03 | NR | NR | <0.002–0.007 | 0.026–0.064 | <0.001 | NR | 0.01 | |
| Ca | 1.52 | 49.24 | NR | 4.4 | 10.6–19.2 | 5.7–10 | NR | 1.42 | 11.48 | |
| Co | NR | NR | NR | NR | NR | NR | NR | NR | 0.02 | |
| Cu | NR | 0.054 | NR | NR | <0.003–0.013 | 0.22–0. 29 | NR | NR | 0.02 | |
| K | 0.15 | NR | NR | 1.20 | 0.7–3.6 | 1–2.4 | NR | 0.07 | 2.21 | |
| Mg | 0.223 | 4.82 | NR | 0.27 | 0.4–2.4 | 0.36–0.58 | NR | 0.079 | 2.37 | |
| Si | NR | NR | NR | NR | NR | NR | NR | NR | 0.63 | |
| Sr | NR | NR | NR | NR | NR | NR | NR | NR | 0.06 | |
| V | NR | 0.005 | NR | NR | NR | NR | NR | NR | <DL | |
| Zn | NR | 0.85 | NR | NR | <0.01–0.08 | 0.19–0.480 | NR | NR | <DL | |
| References | [70] | [71] | [72] | [73] | [65] | [45] | [16] | [74] | This study | |
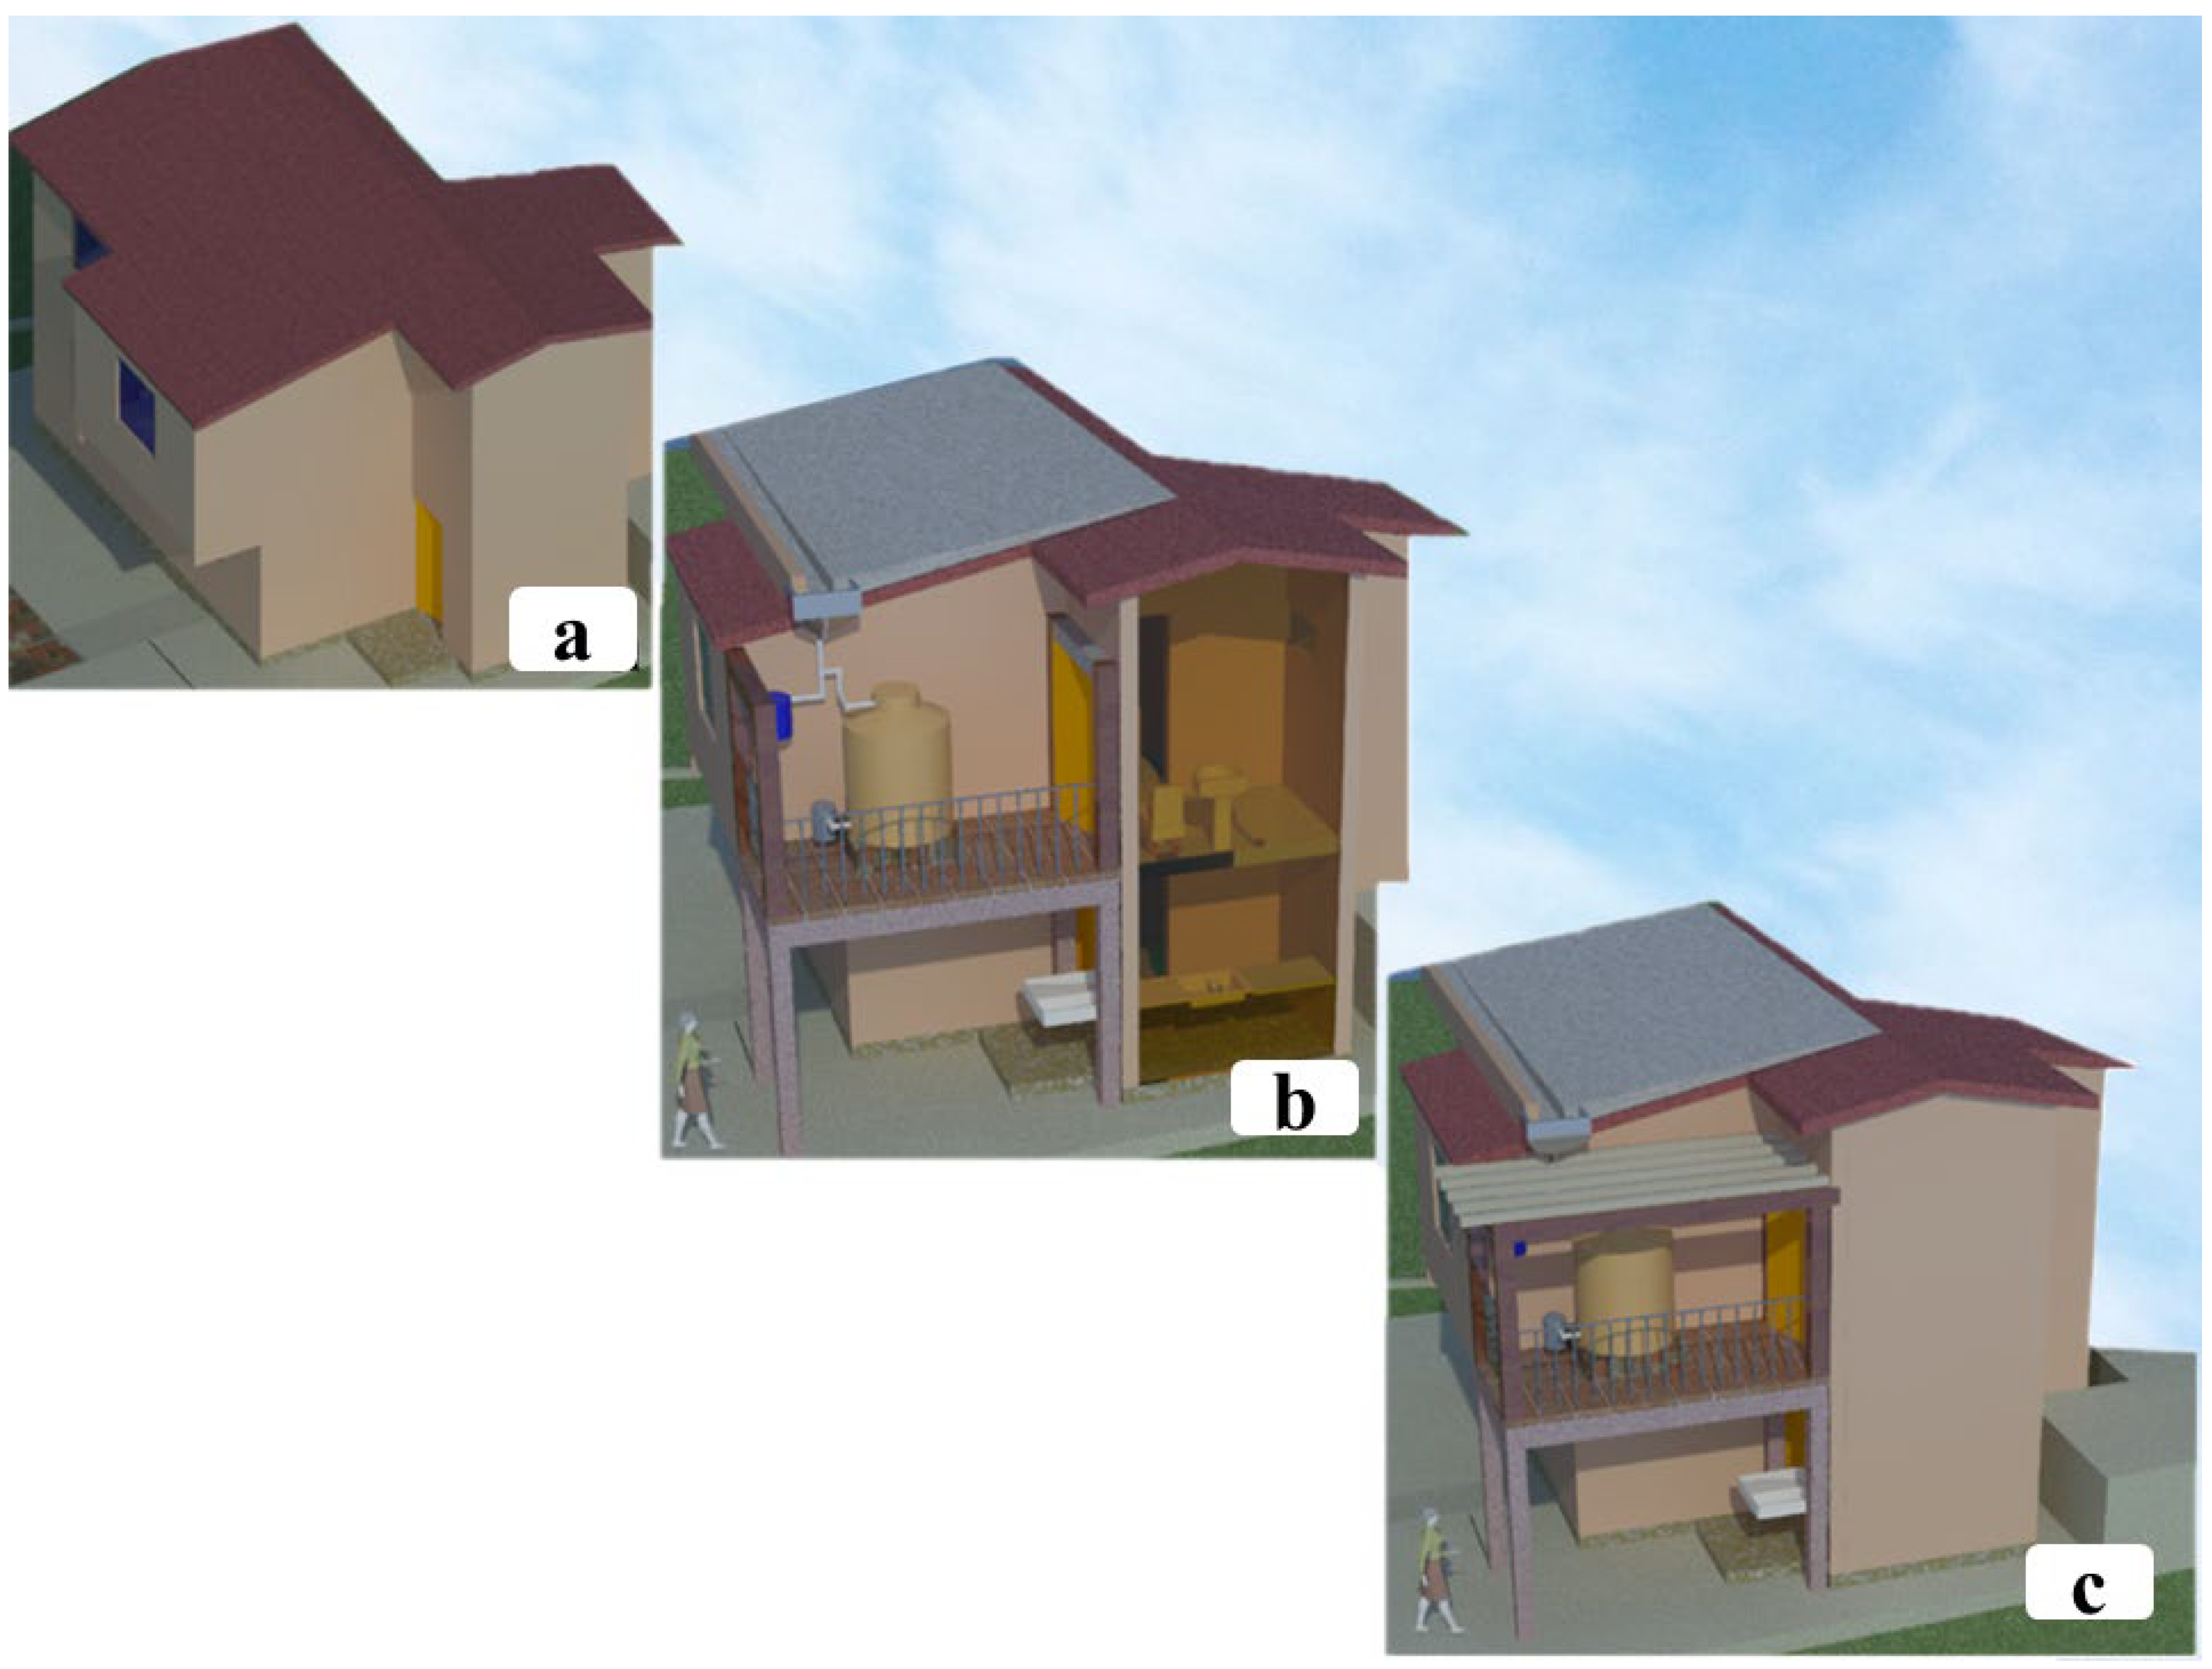
3.3. Description of the Proposals for Converting the Roof Slab of the Pattern Single-Family Household to a Rainwater Harvesting Surface
3.4. Rainwater Harvesting System Design
3.5. Rainwater Harvesting Potential in the Pattern Single-Family Household
First Rainwater Separator Capacity
3.6. Social Acceptance of Water Efficiency Retrofit Based on the Use of Rainwater as an Alternative Source for Consumptive Uses
4. Conclusions
Supplementary Materials
Author Contributions
Funding
Data Availability Statement
Acknowledgments
Conflicts of Interest
References
- Botkin, D.B.; Keller, E.A. Water Supply, Use, and Management. In Environmental Science, Earth as a Living Planet, 8th ed.; John Wiley & Sons, Inc.: Santa Barbara, CA, USA, 2011; Volume 2, pp. 368–427. [Google Scholar]
- Gleason, J.A.; Casiano Flores, C. Challenges of Water Sensitive Cities in Mexico: The Case of the Metropolitan Area of Guadalajara. Water 2021, 13, 601. [Google Scholar] [CrossRef]
- CONAGUA. Estadísticas del Agua en México 2018; Secretaría de Medio Ambiente y Recursos Naturales: Ciudad de México, México, 2018.
- Partzsch, L. Smart regulation for water innovation—The case of decentralized rainwater technology. J. Clean. Prod. 2009, 17, 985–991. [Google Scholar] [CrossRef]
- Abourached, C.; English, M.J.; Liu, H. Wastewater treatment by Microbial Fuel Cell (MFC) prior irrigation water reuse. J. Clean. Prod. 2016, 137, 144–149. [Google Scholar] [CrossRef]
- UNEP. Healthy Planet Healthy People. Global Environment Outlook GEO-6; UNEP & Cambridge University Press: New York, NY, USA, 2019. [Google Scholar] [CrossRef]
- Mukaromah, H. Rainwater Harvesting as an Alternative Water Source in Semarang, Indonesia: The Problems and Benefits. IOP Conf. Ser. Earth Environ. Sci. 2020, 447, 012059. [Google Scholar] [CrossRef]
- Reig, P.; Gassert, F.; Tianyi, L.; Maddoks, A.; World Resources Institute. Water Stress by Country. 2013. Available online: https://www.wri.org/data/water-stress-country (accessed on 15 September 2022).
- Willem-Hofste, R.; Reig, P.; Schleifer, L.; World Resources Institute. 17 Countries, Home to One-Quarter of the World’s Population, Face Extremely High Water Stress. 6 August 2019. Available online: https://www.wri.org/blog/2019/08/17-countries-home-one-quarter-world-population-face-extremely-high-water-stress (accessed on 15 September 2022).
- FAO. Water Report 38. Coping with Water Scarcity. An Action Framework for Agriculture and Food Security; Food and Agriculture Organization of the United Nations Water Reports: Rome, Italy, 2012. [Google Scholar]
- McDonald, R.L.; Weber, K.; Padowski, J.; Flörke, M.; Schneider, C.; Green, P.A.; Gleeson, T.; Eckman, S.; Lehner, B.; Balk, D.; et al. Water on an urban planet: Urbanization and the reach of urban water infrastructure. Glob. Environ. Chang. 2014, 27, 96–105. [Google Scholar] [CrossRef]
- Santos, C.; Taveira-Pinto, F. Analysis of different criteria to size rainwater storage tanks using detailed methods. Resour. Conserv. Recycl. 2013, 71, 1–6. [Google Scholar] [CrossRef]
- Gleason-Espíndola, J.A.; Corona-Sánchez, J.; Casiano-Flores, C.A. Mexican rainwater harvesting movement in recent years. In International Rainwater Catchment Systems Experiences: Towards Water Security, 1st ed.; Gleason-Espíndola, J.A., Casiano-Flores, C.A., Pacheco-Vega, R., Pacheco-Montes, M.R., Eds.; IWA Publishing: London, UK, 2020; pp. 73–82. [Google Scholar]
- García-Martínez, R.; Carrillo-Chavez, A.; Torres-Jardón, R.; Ramirez-Guzmán, A.; López-Carrasco, M. Chemical composition of rainwater collected from 2006 to 2009 in Mexico City and at a rural site at Morelos State, south central Mexico. Rev. Mex. Cienc. Geol. 2020, 37, 1–8. [Google Scholar] [CrossRef]
- Farreny, R.; Morales-Pinzón, T.; Guisasola, A.; Tayà, C.; Rieradevall, J.; Gabarrell, X. Roof selection for rainwater harvesting: Quantity and quality assessments in Spain. Water Res. 2011, 45, 3245–3254. [Google Scholar] [CrossRef]
- Ranaee, E.; Abbasi, A.A.; Tabatabaee Yazdi, J.; Ziyaee, M. Feasibility of Rainwater Harvesting and Consumption in a Middle Eastern Semiarid Urban Area. Water 2021, 13, 2130. [Google Scholar] [CrossRef]
- Campisano, A.; Butler, D.; Ward, S.; Burns, M.J.; Friedler, E.; DeBusk, K.; Fisher-Jeffes, L.N.; Ghisi, E.; Rahman, A.; Furumai, H.; et al. Urban rainwater harvesting systems: Research, implementation and future perspectives. Water Res. 2017, 115, 195–209. [Google Scholar] [CrossRef]
- Ward, S.; Memon, F.A.; Butler, D. Performance of a large building rainwater harvesting system. Water Res. 2012, 46, 5127–5134. [Google Scholar] [CrossRef] [PubMed]
- Abdulla, F.A.; Al-Shareef, A.W. Roof rainwater harvesting systems for household water supply in Jordan. Desalination 2009, 243, 195–207. [Google Scholar] [CrossRef]
- GhaffarianHoseini, A.; Tookey, J.; GhaffarianHoseini, A.; Yusoff, S.M.; Hassan, N.B. State of the art of rainwater harvesting systems towards promoting green built environments: A review. Desalin. Water Treat. 2015, 57, 95–104. [Google Scholar] [CrossRef]
- García-Monforte, G.; Cantú-Martínez, P.C. Escenario del agua en México. Cult. Cient. Tecnol. 2015, 6, 30. [Google Scholar]
- Salazar-Adams, A. Ineficiencia, escasez y el uso político del agua en Acapulco. In Fugas de Agua y Dinero: Factores Político-Institucionales que Inciden en el Desempeño de Organismos Operadores del Agua en México; Salazar-Adams, A., Ed.; El Colegio de Sonora: Hermosillo, México, 2016; ISBN 978-607-8480-15-9. [Google Scholar]
- SEDUOP. Actualización del Plan Director de Desarrollo Urbano de Acapulco de Juárez, Guerrero. Acapulco, Guerrero; Secretaría de Desarrollo Urbano y Obras Públicas: Acapulco, México, 2015. [Google Scholar]
- SMN. Servicio Meteorológico Nacional. 2018. Available online: https://smn.conagua.gob.mx/es/climatologia/informacion-climatologica/normales-climatologicas-por-estado?estado=gro (accessed on 12 September 2022).
- Televisa. Acapulco se Queda sin Agua Potable por Quiebra de CAPAMA y Colapso de Tuberías. 2020. Available online: https://noticieros.televisa.com/ultimas-noticias/acapulco-se-queda-sin-agua-potable-por-quiebra-de-capama-y-colapso-de-tuberias/ (accessed on 9 September 2022).
- El Sol de Acapulco. “Blas” Deja sin Agua a Más del 90% de Acapulco. 2022. Available online: https://www.elsoldeacapulco.com.mx/local/blas-deja-sin-agua-a-mas-del-90-de-acapulco-8446100.html (accessed on 9 September 2022).
- INEGI. Censo de Población y Vivienda 2020; Instituto Nacional de Estadística Geografía e Informática: Mexico City, Mexico, 2020. Available online: https://www.inegi.org.mx/programas/ccpv/2020/ (accessed on 10 March 2022).
- CONEVAL. Consejo Nacional de Evaluación de la Política de Desarrollo Social. 2020. Available online: https://www.coneval.org.mx/Medicion/Paginas/Criterios-ZAP.aspx (accessed on 15 March 2022).
- Google Earth; Intrinsic Graphics: Palo Alto, CA, USA, 2022.
- CAPAMA. Boletín de Prensa 714. 2022. Available online: https://www.capama.gob.mx/noticia/714 (accessed on 27 August 2022).
- CONAGUA. Lineamientos Técnicos: Sistema de Captación de Agua de Lluvia con Fines de Abasto de Agua Potable a Nivel Vivienda; Programa Nacional para Captación de Agua de Lluvia y Ecotecnias en Zonas Rurales (PROCAPTAR); Comisión Nacional del Agua: Mexico City, Mexico, 2016. [Google Scholar]
- NMX-AA-164-SCFI-2013; Edificación Sustentable—Criterios y Requerimientos Ambientales Mínimos. Secretaría de Economía, Subsecretaría de Comercio y Fomento Industrial, Diario Oficial de la Federación: Ciudad de México, México, 2013.
- NMX-AA-036-SCFI-2001; Análisis de Agua-Determinación de Acidez y Alcalinidad en Agua Naturales, Residuales y Residuales Tratadas. Secretaría de Economía, Subsecretaría de Comercio y Fomento Industrial, Diario Oficial de la Federación: Ciudad de México, Mexico, 2001.
- NMX-AA-073-SCFI-2001; Análisis de Agua—Determinación de Cloruros Totales en Aguas Naturales, Residuales y Residuales Tratadas. Secretaría de Economía, Subsecretaría de Comercio y Fomento Industrial, Diario Oficial de la Federación: Ciudad de México, Mexico, 2001.
- Vélez-Pérez, L.S.; Ramirez-Nava, J.; Hernández-Flores, G.; Talavera-Mendoza, O.; Escamilla-Alvarado, C.; Poggi-Varaldo, H.M.; Solorza-Feria, O.; López-Díaz, J.A. Industrial acid mine drainage and municipal wastewater co-treatment by dual-chamber microbial fuel cells. Int. J. Hydrogen Energy 2020, 45, 13757–13766. [Google Scholar] [CrossRef]
- Hernández-Sampieri, R.; Mendoza, C. Metodología de la Investigación. Las Rutas Cuantitativa, Cualitativa y Mixta; Editorial Mc Graw Hill Education: Ciudad de México, México, 2018; ISBN 978-1-4562-6096-5. [Google Scholar]
- Geertz, C. La Interpretación de las Culturas; Editorial Gedisa: Barcelona, Spain, 2003; ISBN 84-7432-090-9. [Google Scholar]
- SMN. Servicio Meteorológico Nacional. Análisis del Estado del Arte Sobre el Depósito Atmosférico en México y su Relación con el Cambio Climático. 2017. Available online: https://www.gob.mx/cms/uploads/attachment/file/410254/INFORME_FINAL_EADAM_V3_INECC.pdf (accessed on 27 August 2021).
- CONAGUA. Temporada de Ciclones Tropicales 2020, la Más Activa de la Historia. Comunicado de Prensa No. 993-20; Comisión Nacional del Agua: Mexico City, Mexico, 2020; Available online: https://smn.conagua.gob.mx/files/pdfs/comunicados-de-prensa/Comunicado993-20.pdf (accessed on 7 January 2021).
- Servicio Meteorológico Nacional. Información Histórica. 2020. Available online: https://smn.conagua.gob.mx/es/ciclones-tropicales/informacion-historica (accessed on 7 January 2021).
- NOM-127-SSA1-2021; Agua para uso y Consumo Humano. Límites Permisibles de la Calidad del Agua. Secretaría de Salud, Diario Oficial de la Federación: México City, México, 2022.
- WHO. Guidelines for Drinking-Water Quality; World Health Organization: Geneva, Switzerland, 2022; ISBN 978-92-4-004506-4. [Google Scholar]
- Singh, A.; Agrawal, M. Acid rain and its ecological consequences. J. Environ. Biol. 2008, 29, 15–24. [Google Scholar]
- Ospina-Zúñiga, Ó.E.; Ramírez-Arcila, H. Evaluación de la calidad del agua de lluvia para su aprovechamiento y uso doméstico en Ibagué, Tolima, Colombia. Ing. Solidar. 2014, 10, 125–138. [Google Scholar]
- Ward, S.; Memon, F.A.; Butler, D. Harvested rainwater quality: The importance of appropriate design. Water Sci. Technol. 2010, 61, 1707–1714. [Google Scholar] [CrossRef]
- Krauskopf, K.B.; Bird, D.K. Solution-Mineral Equilibria. Part 1: Carbonates. In Introduction to Geochemistry, 3rd ed.; Mc Graw-Hill, Inc.: Mexico City, Mexico, 1995; pp. 61–85. [Google Scholar]
- Wurst, W.A.; Durborow, R.M. Interactions of pH, Carbon Dioxide, Alkalinity and Hardness in Fishponds; No. 464; SRAC: Stoneville, MS, USA, 1992. [Google Scholar]
- Trivedi, P.; Patel, K.; Yasobant, S.; Kalpana, P.; Bhavsar, P.; Raval, D.; Saxena, D. Visually clean is not necessarily microbiologically safe: Learnings from WASH assessment of maternity units of Gujarat, India. J. Fam. Med. Prim. Care 2020, 9, 788. [Google Scholar] [CrossRef]
- NOM-201-SSA1-2015; Productos y Servicios. Agua y Hielo para Consumo Humano, Envasados y a Granel. Especificaciones Sanitarias. Secretaría de Salud, Diario Oficial de la Federación: Ciudad de México, México, 2015.
- Rosenthal, E. Thermomineral waters of Ca-chloride composition: Review of diagnostics and of brine evolution. Environ. Geol. 1997, 32, 245–250. [Google Scholar] [CrossRef]
- Ayers, R.S.; Wescot, D.W. Water Quality for Agricultural; Irrigation and Drainage Paper 29 Rev. 1; Food and Agriculture Organization of the United Nations: Rome, Italy, 1985. [Google Scholar]
- Sawyer, C.N.; McCarty, P.L.; Parkin, G.F. Chemistry for Environmental and Engineering Science, 5th ed.; McGraw Hill Inc.: New York, NY, USA, 2003; pp. 587–590. [Google Scholar]
- Powlson, D.S.; Addiscott, T.M.; Benjamin, N.; Cassman, K.G.; de Kok, T.M.; van Grinsven, H.; L’hirondel, J.-L.; Avery, A.A.; van Kessel, C. When Does Nitrate Become a Risk for Humans? J. Environ. Qual. 2008, 37, 291–295. [Google Scholar] [CrossRef] [PubMed]
- Hastings, M.G.; Sigman, D.M.; Lipschultz, F. Isotopic evidence for source changes of nitrate in rain at Bermuda. J. Geophys. Res. Atmos. 2003, 108, 790. [Google Scholar] [CrossRef] [Green Version]
- Elliott, E.M.; Kendall, C.; Wankel, S.D.; Burns, D.A.; Boyer, E.W.; Harlin, K.; Bain, D.J.; Butler, T.J. Nitrogen Isotopes as Indicators of NOx Source Contributions to Atmospheric Nitrate Deposition across the Midwestern and Northeastern United States. Environ. Sci. Technol. 2007, 41, 7661–7667. [Google Scholar] [CrossRef] [PubMed]
- Genchi, G.; Sinicropi, M.S.; Lauria, G.; Carocci, A.; Catalano, A. The Effects of Cadmium Toxicity. Int J. Environ. Res. Public Health 2020, 17, 3782. [Google Scholar] [CrossRef] [PubMed]
- Chubaka, C.; Whiley, H.; Edwards, J.; Ross, K. Lead, Zinc, Copper, and Cadmium Content of Water from South Australian Rainwater Tanks. Int. J. Environ. Res. Public Health 2018, 15, 1551. [Google Scholar] [CrossRef] [PubMed]
- Tengan, B.M.; Akaoto, O. Comprehensive evaluation of the possible impact of roofing materials on the quality of harvested rainwater for human consumption. Sci. Total Environ. 2022, 819, 152966. [Google Scholar] [CrossRef]
- Bravo, A.H.; Soto, A.R.; Sosa, E.R.; Sánchez, A.P.; Alarcón, A.; Kahl, J.; Ruíz, B.J. Effect of acid rain on building material of the El Tajín archaeological zone in Veracruz, Mexico. Environ. Pollut. 2006, 144, 655–660. [Google Scholar] [CrossRef]
- Gispert, M.; Hernández, M.; Climent, E.; Flores, M. Rainwater Harvesting as a Drinking Water Option for Mexico City. Sustainability 2018, 10, 3890. [Google Scholar] [CrossRef]
- Chung, Y.S. Durable press and antimicrobial finishing of cotton fabrics with a citric acid and chitosan treatment. In Proceedings of the 1st International Conference on Fog and Fog Collection, Vancouver, BC, Canada, 19–24 July 1998. [Google Scholar]
- Kulshrestha, U.C.; Sarkar, A.K.; Srivastava, S.S.; Parashar, D.C. Wet-only and bulk deposition studies at New Delhi (India). Water Air Soil Pollut. 1995, 85, 2137–2142. [Google Scholar] [CrossRef]
- Akubuenyi, F.C.; Uttah, E.C.; Enyi-Idoh, K.H. Microbiological and physicochemical assessment of major sources of water for domestic uses in Calabar Metropolis Cross River state, Nigeria. Transnatl. J. Sci. Technol. 2013, 3, 31–44. [Google Scholar]
- Parungo, F.; Nagamoto, C.; Hoyt, S.; Humberto Bravo, A. The investigation of air quality and acid rain over the Gulf of Mexico. Atmos. Environ. Part A Gen. Top. 1990, 24, 109–123. [Google Scholar] [CrossRef]
- Sazakli, E.; Alexopoulos, A.; Leotsinidis, M. Rainwater harvesting, quality assessment and utilization in Kefalonia Island, Greece. Water Res. 2007, 41, 2039–2047. [Google Scholar] [CrossRef] [PubMed]
- Báez, A.; Belmont, R.; García, R.; Padilla, H.; Torres, M.C. Chemical composition of rainwater collected at a southwest site of Mexico City, Mexico. Atmos. Res. 2007, 86, 61–65. [Google Scholar] [CrossRef]
- Rivera-Rivera, D.M.; Escobedo-Urías, D.C.; Jonathan, M.P.; Sujitha, S.B.; Chidambaram, S. Evidence of Natural and Anthropogenic Impacts on Rainwater Trace Metal Geochemistry in Central Mexico: A Statistical Approach. Water 2020, 12, 192. [Google Scholar] [CrossRef]
- Ramírez-Lara, E.; Guardiola, R.; Vásquez, Y.; Balderas-Rentería, I.; Torres, H.; Sosa-Echeverría, R.; Alvarez-Sanchez, P.; Alarcón, A.; Kahl, J. Chemical composition of rainwater in northeastern México. Atmósfera 2010, 23, 3. [Google Scholar]
- Neibaur, E.E.; Anderson, E.P. An examination of factors affecting sustainability of domestic rainwater harvesting systems in a rural, semi-arid region of Mexico. Water Sci. Technol. Water Supply 2016, 16, 1388–1397. [Google Scholar] [CrossRef]
- Meng, Y.; Zhao, Y.; Li, R.; Li, J.; Cui, L.; Kong, L.; Fu, H. Characterization of inorganic ions in rainwater in the megacity of Shanghai: Spatiotemporal variations and source apportionment. Atmos. Res. 2019, 222, 12–24. [Google Scholar] [CrossRef]
- Majumdar, A.; Satpathy, J.; Kayee, J.; Das, R. Trace metal composition of rainwater and aerosol from Kolkata, a megacity in eastern India. SN Appl. Sci. 2020, 2, 2122. [Google Scholar] [CrossRef]
- Biswas, B.K.; Mandal, B.H. Construction and Evaluation of Rainwater Harvesting System for Domestic Use in a Remote and Rural Area of Khulna, Bangladesh. Int. Sch. Res. Not. 2014, 2014, 751952. [Google Scholar] [CrossRef]
- Vialle, C.; Sablayrolles, C.; Lovera, M.; Jacob, S.; Huau, M.-C.; Montrejaud-Vignoles, M. Monitoring of water quality from roof runoff: Interpretation using multivariate analysis. Water Res. 2011, 45, 3765–3775. [Google Scholar] [CrossRef]
- Huang, X.-F.; Li, X.; He, L.-Y.; Feng, N.; Hu, M.; Niu, Y.-W.; Zeng, L.-W. 5-Year study of rainwater chemistry in a coastal mega-city in South China. Atmos. Res. 2010, 97, 185–193. [Google Scholar] [CrossRef]
- SEDUOP. Reglamento de Construcciones para el Municipio de Acapulco de Juárez, Guerrero; Secretaría de Desarrollo Urbano y Obras Públicas: Acapulco, México, 2015. [Google Scholar]
- Fewkes, A. A review of rainwater harvesting in the UK. Struct. Surv. 2012, 30, 174–194. [Google Scholar] [CrossRef]
- Ghisi, E.; Bressan, D.L.; Martini, M. Rainwater tank capacity and potential for potable water savings by using rainwater in the residential sector of southeastern Brazil. Build. Environ. 2007, 42, 1654–1666. [Google Scholar] [CrossRef]
- Coombes, P.J.; Barry, M.E. The effect of selection of time steps and average assumptions on the continuous simulation of rainwater harvesting strategies. Water Sci. Technol. 2007, 55, 125–133. [Google Scholar] [CrossRef]
- Rodrigues-de Sá Silva, A.C.; Mendonça-Bimbato, A.; Perrella-Balestieri, J.A.; Nogueira-Vilanova, M.R. Exploring environmental, economic and social aspects of rainwater harvesting systems: A review. Sustain. Cities Soc. 2022, 76, 103475. [Google Scholar] [CrossRef]
- CAPAMA. Boletín de Prensa 100. 2019. Available online: https://www.capama.gob.mx/noticia/100 (accessed on 27 August 2022).
- Nazer, S.; Van der Zaag, M.; Gijzen, H.J. A financial, environmental and social evaluation of domestic water management options in the west bank, Palestine. Water Resour. 2010, 24, 4445–4467. [Google Scholar] [CrossRef]
- Oviedo-Ocaña, E.R.; Dominguez, I.; Ward, S.; Rivera-Sanchez, M.L.; Zaraza-Peña, J.M. Financial feasibility of end-user designed rainwater harvesting and greywater reuse systems for high water use households. Environ. Sci. Pollut. Res. 2017, 25, 19200–19216. [Google Scholar] [CrossRef]
- Domínguez, I.; Ward, S.; Mendoza, J.; Rincón, C.; Oviedo-Ocaña, E. End-User Cost-Benefit Prioritization for Selecting Rainwater Harvesting and Greywater Reuse in Social Housing. Water 2017, 9, 516. [Google Scholar] [CrossRef]
- Ward, S.; Barr, S.; Memon, F.; Butler, D. Rainwater harvesting in the UK: Exploring water-user perceptions. Urban Water J. 2013, 10, 112–126. [Google Scholar] [CrossRef]
- Howard, G.; Bartram, J. Domestic Water Quantity, Service Level and Health; World Health Organization: Ginebra, Suiza, 2003; Available online: https://apps.who.int/iris/handle/10665/67884 (accessed on 26 July 2022).
- Domènech, L.; Saurí, D. A comparative appraisal of the use of rainwater harvesting in single and multi-family buildings of the Metropolitan Area of Barcelona (Spain): Social experience, drinking water savings and economic costs. J. Clean. Prod. 2011, 19, 598–608. [Google Scholar] [CrossRef]


| Year | Rainfall Events | Cumulative Annual Rainfall (L/m2) | Average Rainfall (L/m2) |
|---|---|---|---|
| 2000–2018 | 68 a | 1449 | 21.31 b |
| 2020 | 20 | 881.16 | 44.06 |
| 2021 | 58 | 1189.79 | 20.51 |
| Week | Pluvial Phenomena | Period | Anions (mg/L) | |||||
|---|---|---|---|---|---|---|---|---|
| Chlorides | Nitrates | Sulfates | ||||||
| FRS | ST | FRS | ST | FRS | ST | |||
| 1 | 1 | 1 | 22.65 | 8.17 | 5.72 ± 0.22 | 3.25 ± 0.37 | 6.00 ± 1.00 | 23.5 ± 0.50 |
| 2 | 2 | |||||||
| 3 | 7 | 2 | 32.51 | 23.44 | 6.03 ± 0.73 | 4.97 ± 0.18 | 13 ± 0.00 | 52.5 ± 1.50 |
| 4 | 6 | |||||||
| 5 | 3 | 3 | 8.37 | 3.45 | 1.32 ± 0.39 | 1.47 ± 0.30 | 0 ± 0.00 | 2 ± 0.00 |
| 6 | 3 | |||||||
| 7 | 2 | 4 | 3.45 | 7.88 | 1.29 ± 0.36 | 1.68 ± 0.09 | 0 ± 0.00 | 0.5 ± 0.50 |
| 8 | 4 | |||||||
| 9 | 2 | 5 | 8.37 | 7.88 | 1.34 ± 0.26 | 1.14 ± 0.11 | 0 ± 0.00 | 1.5 ± 0.50 |
| 10 | 2 | |||||||
| 11 | 3 | 6 | 1.97 | 1.97 | 0.57 ± 0.39 | 1.51 ± 0.35 | 0.5 ± 0.50 | 0 ± 0.00 |
| 12 | 0 | |||||||
| 13 | 1 | 7 | 2.95 | 3.25 | 2.07 ± 0.16 | 1.83 ± 0.11 | 1.5 ± 0.50 | 0 ± 0.00 |
| 14 | 3 | |||||||
| 15 | 1 | 8 | 4.43 | 3.25 | 1.53 ± 0.68 | 1.06 ± 0.33 | 0.5 ± 0.50 | 0 ± 0.00 |
| 16 | 2 | |||||||
| 17 | 3 | 9 | 3.25 | 4.92 | 1.01 ± 0.47 | 0.85 ± 0.19 | 0.00 ± 0.00 | 0.00 ± 0.00 |
| 18 | 0 | |||||||
| 19 | 2 | 10 | 10.64 | 6.89 | 2.17 ± 0.20 | 1.12 ± 0.36 | 1.00 ± 0.00 | 0.50 ± 0.50 |
| 20 | 1 | |||||||
| 21 | 3 | 11 | 9.85 | 8.67 | 0.72 ± 0.37 | 1.73 ± 0.03 | 1.50 ± 1.50 | 0.50 ± 0.50 |
| 22 | 2 | |||||||
| 23 | 2 | 12 | 6.89 | 7.88 | 0.95 ± 0.09 | 1.09 ± 0.08 | 1.00 ± 0.00 | 0.00 ± 0.00 |
| 24 | 0 | |||||||
| Proposal | Roof Slab Retrofit Material | Cost (USD $) | Advantages | Disadvantages |
|---|---|---|---|---|
| 1 A | Thermoinsulating (Foamular®) | 1369.57 | -High resistance against wind -Quick installation-High thermal insulation -High runoff coefficient (0.9) -90% harvesting efficiency | High cost |
| 2 B | Bank material (tezontle or tepetate) | 856.80 | -Cost -High resistance against wind -High runoff coefficient (0.9) -90% harvesting efficiency | Medium thermal insulation |
| 3 C | NP * | 388.13 | -Cost -High resistance against wind -High runoff coefficient (0.9) -90% harvesting efficiency | -No thermal insulation -Low resistance against wind -Requires constant maintenance -Possible RW pollution by HMPTM |
Publisher’s Note: MDPI stays neutral with regard to jurisdictional claims in published maps and institutional affiliations. |
© 2022 by the authors. Licensee MDPI, Basel, Switzerland. This article is an open access article distributed under the terms and conditions of the Creative Commons Attribution (CC BY) license (https://creativecommons.org/licenses/by/4.0/).
Share and Cite
Martínez-Castrejón, M.; Flores-Munguía, E.J.; Talavera-Mendoza, O.; Rodríguez-Herrera, A.L.; Solorza-Feria, O.; Alcaraz-Morales, O.; López-Díaz, J.A.; Hernández-Flores, G. Water Efficiency Households Retrofit Proposal Based on Rainwater Quality in Acapulco, Mexico. Water 2022, 14, 2927. https://doi.org/10.3390/w14182927
Martínez-Castrejón M, Flores-Munguía EJ, Talavera-Mendoza O, Rodríguez-Herrera AL, Solorza-Feria O, Alcaraz-Morales O, López-Díaz JA, Hernández-Flores G. Water Efficiency Households Retrofit Proposal Based on Rainwater Quality in Acapulco, Mexico. Water. 2022; 14(18):2927. https://doi.org/10.3390/w14182927
Chicago/Turabian StyleMartínez-Castrejón, Mariana, Enrique J. Flores-Munguía, Oscar Talavera-Mendoza, América L. Rodríguez-Herrera, Omar Solorza-Feria, Osbelia Alcaraz-Morales, Jazmin A. López-Díaz, and Giovanni Hernández-Flores. 2022. "Water Efficiency Households Retrofit Proposal Based on Rainwater Quality in Acapulco, Mexico" Water 14, no. 18: 2927. https://doi.org/10.3390/w14182927