

The University of West Florida Campus Ecosystem Study: Spatial and Temporal Variation in Water Quality at Thompson Bayou


Department of Biology, University of West Florida, Pensacola, FL 32514, USA
*
Author to whom correspondence should be addressed.
Water 2022, 14(18), 2916; https://doi.org/10.3390/w14182916
Submission received: 6 July 2022
/
Revised: 9 September 2022
/
Accepted: 15 September 2022
/
Published: 17 September 2022
(This article belongs to the Special Issue Water Quality Modeling and Monitoring)
Abstract
:Much of our understanding of factors influencing stream chemistry comes from studies of montane forests, whereas far less work has focused on streams of coastal areas that integrate a homogeneous, flat topography and interactions with the bodies of water into which they drain, especially involving tidal fluxes. Fewer still do so in the context of an urban interface, especially that of a college campus. This study assessed the water quality of Thompson Bayou, a freshwater stream entering the University of West Florida campus in a wetland after flowing through the urban property with impacted water quality. We measured temperature, pH, dissolved O2 (DO), and specific conductivity (SC) for one year at eight sites along Thompson Bayou from campus to the Escambia River. All variables, except temperature, varied spatially, with consistent increases in DO and SC toward the river of 10% and 75%, respectively. Variables exhibited temporal patterns of significant seasonal variation, especially temperature, increasing from a January minimum of 14 °C to a summer maximum of 28 °C. These results suggest that, in general, the biogeochemistry of coastal streams such as Thompson Bayou can be influenced by numerous factors, including (1) wetland processes, (2) interactions of the stream channel with forested uplands, and (3) tidal fluxes.
1. Introduction
Stream chemistry has long been known to effectively integrate watershed ecosystem processes on both spatial and temporal scales [1,2]. The earlier of such studies were primarily at montane forested sites, notably experimental forests (e.g., Hubbard Brook, Fernow, and H.J. Andrews) and hydrologic laboratories (e.g., Coweeta) [2,3,4,5]. Much has been learned from these studies to demonstrate how a stream’s chemical parameters can reflect the dynamics of the forested watersheds in which the stream is embedded. More recent studies carried out around the world have added to our understanding of the spatial and temporal dimensions of stream dynamics [6,7,8,9,10].
Far less work has focused on streams of coastal areas that integrate a homogeneous, flat topography and interactions with the bodies of water into which they drain—whether a river, bay, or ocean—especially involving tidal fluxes. Fewer still do so in the context of urban areas, especially on a college campus. Indeed, such streams are often in regions of high human population density, such that there is a distinct urban interface, greatly decreasing water quality from several anthropogenic sources, such as storm runoff from parking lots and lawn treatments, intentional dumping, and litter [11,12,13,14,15].
Thompson Bayou in Pensacola, Florida, USA, is an example of such a stream, extending ~4 km through a combination of commercial and residential properties, including a golf course, all prior to reaching the campus of the University of West Florida (UWF). Unpublished data from occasional monitoring stream by the Florida Department of Environmental Protection at various points through the urban interface suggest that it is indeed impacted, as indicated by low dissolved O2, shallow photic depths, and clearly detectable levels of a variety of pesticides and pharmaceuticals.
Thompson Bayou initially reaches the UWF campus at a small wetland, eventually extending through a fully vegetated landscape to where it joins with the Escambia River (Figure 1). Although anecdotal observation of several species of aquatic vertebrates, including slider turtles (Trachemys spp.), alligators (Alligator mississippiensis), and numerous fish species in Thompson Bayou, suggests that water quality is vastly improved once it has passed through the on-campus wetland [16], to date there have been no quantitative measurements of basic water quality parameters. Certainly, among the many essential ecosystem services provided by wetlands is a marked improvement in water quality [17,18].
The UWF Campus Ecosystem Study (UWF CES) was established in the summer of 2019 to examine various ecological facets of the campus, construction of which was conceived in 1963 by John Jarvis using a “design with nature” approach toward minimizing physical alterations of vegetation and topography. Included in the initial plan was the establishment of low-impact trails through undeveloped natural areas. Prior to campus construction, this region of northwest Florida was predominantly longleaf pine stands of varying ages following the cessation of widespread timber harvesting. To date, the UWF CES has comprised three connected studies: (1) assessing the longleaf pines of the main campus along with gopher tortoise populations in one of the natural areas [19], (2) determining of stand structure and composition of chronically-unburned longleaf stands of two natural areas [20], and (3) the creation of a stem age/diameter model for campus longleaf pines using windthrown stems that were blown down by Hurricane Sally in September 2020 [21].
The present study extends the scope of the UWF CES to include aquatic ecosystems, with a major impetus being to provide an assessment of water quality parameters of Thompson Bayou, especially as they vary both spatially and temporally. Additionally, this region experiences high and increasing frequencies of tropical cyclones, e.g., Hurricane Michael in 2018 and Hurricane Sally in 2020, which can greatly alter stream ecosystems [22]. Thus, an additional purpose for this study was to provide a baseline for such disturbance events.
2. Materials and Methods
2.1. Study Site
This study was carried out on the campus and property of the University of West Florida (UWF), Pensacola, Florida. More specifically, sampling was done on Thompson Bayou, which enters the UWF campus at a wetland and flows to the Escambia River (Figure 1).
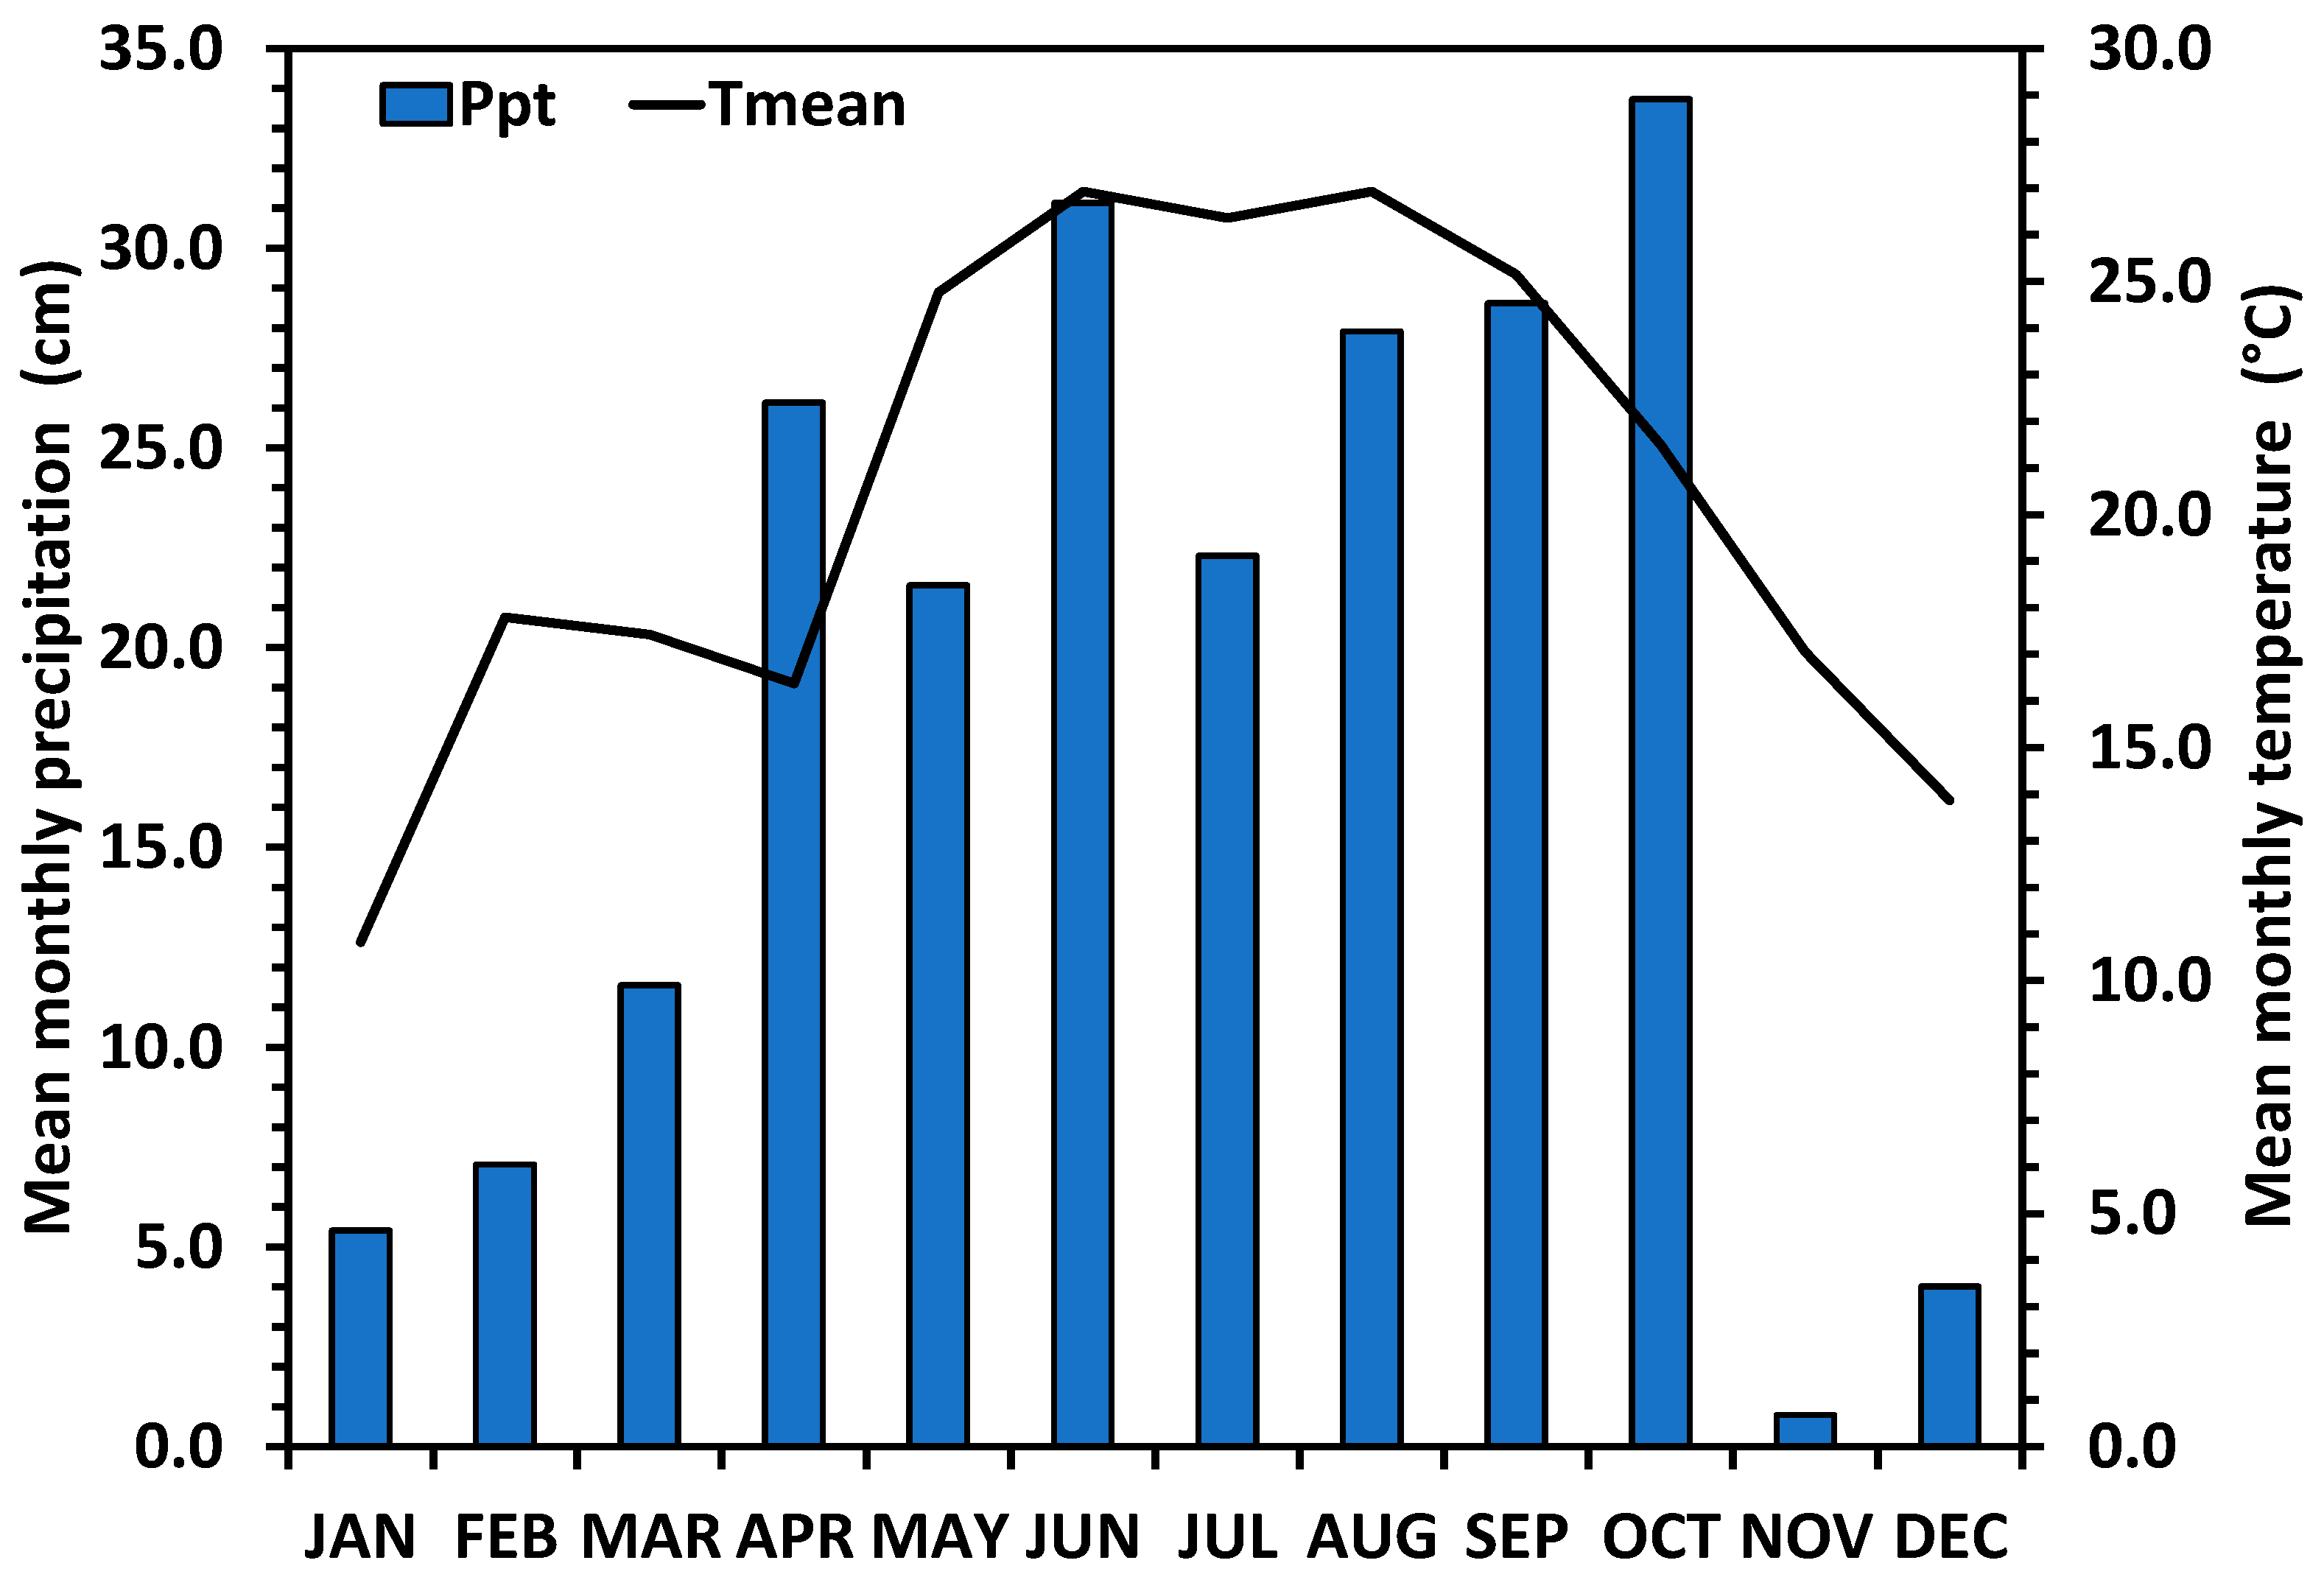
The Köppen climate classification for this region is Cwa (humid subtropical). There is a distinct seasonality of temperature, with an annual mean of 20.8 °C, hot summers, and cool/cold winters. Precipitation for Pensacola is among the highest in the United States, averaging 173.5 cm/year, also exhibiting a distinct seasonality, with the highest precipitation from June to September corresponding to the northern seasonal shift in the Intertropical Convergence Zone; ~43% of annual precipitation occurs during that period. The study period experienced a cool, wet April and wet October relative to long-term means (Figure 2).
We sampled the surface water of Thompson Bayou, a stream that comes to campus property after flowing through 4.0 km of both urban areas, commercial areas, and residential neighborhoods of that part of Escambia County. Thompson Bayou initially reaches the UWF campus at a small wetland dominated by native plant species, including swamp titi (Cyrilla racemifolia), giant cutgrass (Zizaniopsis miliacea), golden club (Orontium aquaticum), Carolina jessamine (Gelsemium sempervirens), floating yellow water-lily (Nuphar lutea), and common water-crowfoot (Ranunculus aquatilis). It continues adjacent to one of the UWF natural areas—the Edward Ball Nature Trails (30°33′11.3″ N, 87°13′18.9″ W)—that has been studied previously regarding soil fertility and composition and structure of second-growth longleaf pine stands [20], extending ~1.5 km through a fully vegetated landscape to where it joins with the Escambia River (30°33′44.8″ N, 87°13′4.9″ W) (Figure 1).
2.2. Field Sampling
To characterize the spatial and temporal patterns in water quality, we used a YSI Pro DSS meter to measure surface water at eight discrete locations over a one-year period. The following water quality variables were determined during each sampling event: temperature, pH, dissolved O2 (DO), and specific conductivity (SC). Although salinity was also measured, those data are not reported herein, as they essentially confirm that Thompson Bayou is decidedly freshwater, with an overall mean salinity of 0.06 ppt and maximum recorded salinity of 0.56 ppt. The YSI Pro DSS was recalibrated on a regular basis throughout the duration of this study.
A separate study measured the photic zone via Secchi disk at six random times using the same eight sample sites (Nicholas Wagner, unpublished honors thesis). We employed these data to assess the spatial pattern of the photic zone for Thompson Bayou.
Distance between sample sites varied only slightly, with a mean distance (±1 SE) between sites of 189 ± 15 m and a total distance of 1.32 km from Site 1 to Site 8 (Figure 1). On each sample date, measurements were taken at three locations per sample site along a transect across Thompson Bayou (i.e., one toward each bank and one in the middle). Thus, each sample date comprised 24 in situ analyses for a total of 840 for the study. Because some of the measured variables (e.g., DO and temperature) exhibit a strong diel signal, care was taken to initiate sampling at the same time (~1330) on each date.
The initial strategy to sample for the duration of calendar year 2021 from early January to end of December was altered by Hurricane Sally, a Category 2 tropical cyclone with an eyewall that directly impacted the UWF campus on 16 September 2020 [22]. This caused extensive damage to forest stands of the natural areas around Thompson Bayou [21], resulting in unsafe conditions for navigation from numerous windthrown tree stems in the water until March 2021. Sampling commenced 5 March 2021 and was repeated as close to a weekly basis as possible, pending weather conditions and availability of personnel, until 24 February 2022.
Finally, we assessed the seasonal patterns of tides in Escambia Bay, into which flows the Escambia River ~4 km from where Thompson Bayou reaches the river, by accessing tidal data from the National Oceanic and Atmospheric Administration (NOAA) tide station 8729816, Lora Point, Escambia Bay, FL. This station is <7 km from Site 8 (Figure 1). Twice daily tidal fluxes were calculated as high tide level minus low tide level to generate daily means averaged for each month of the study.
2.3. Data Analysis
Spatial and temporal variation in water quality parameters was assessed via analysis of variance, followed by least-significance difference tests [23]. For spatial variation, data were averaged across all sample dates for each of the eight sample sites. For temporal variation, data were averaged for each month both for each site separately and compared statistically across monthly means for all sites combined. Significant differences were accepted at p < 0.05. In addition, Pearson product-moment correlations were performed between monthly means of measured variables with monthly means of gage height of the Escambia River and air temperature and monthly precipitation, with significant correlations accepted at p < 0.05.
3. Results
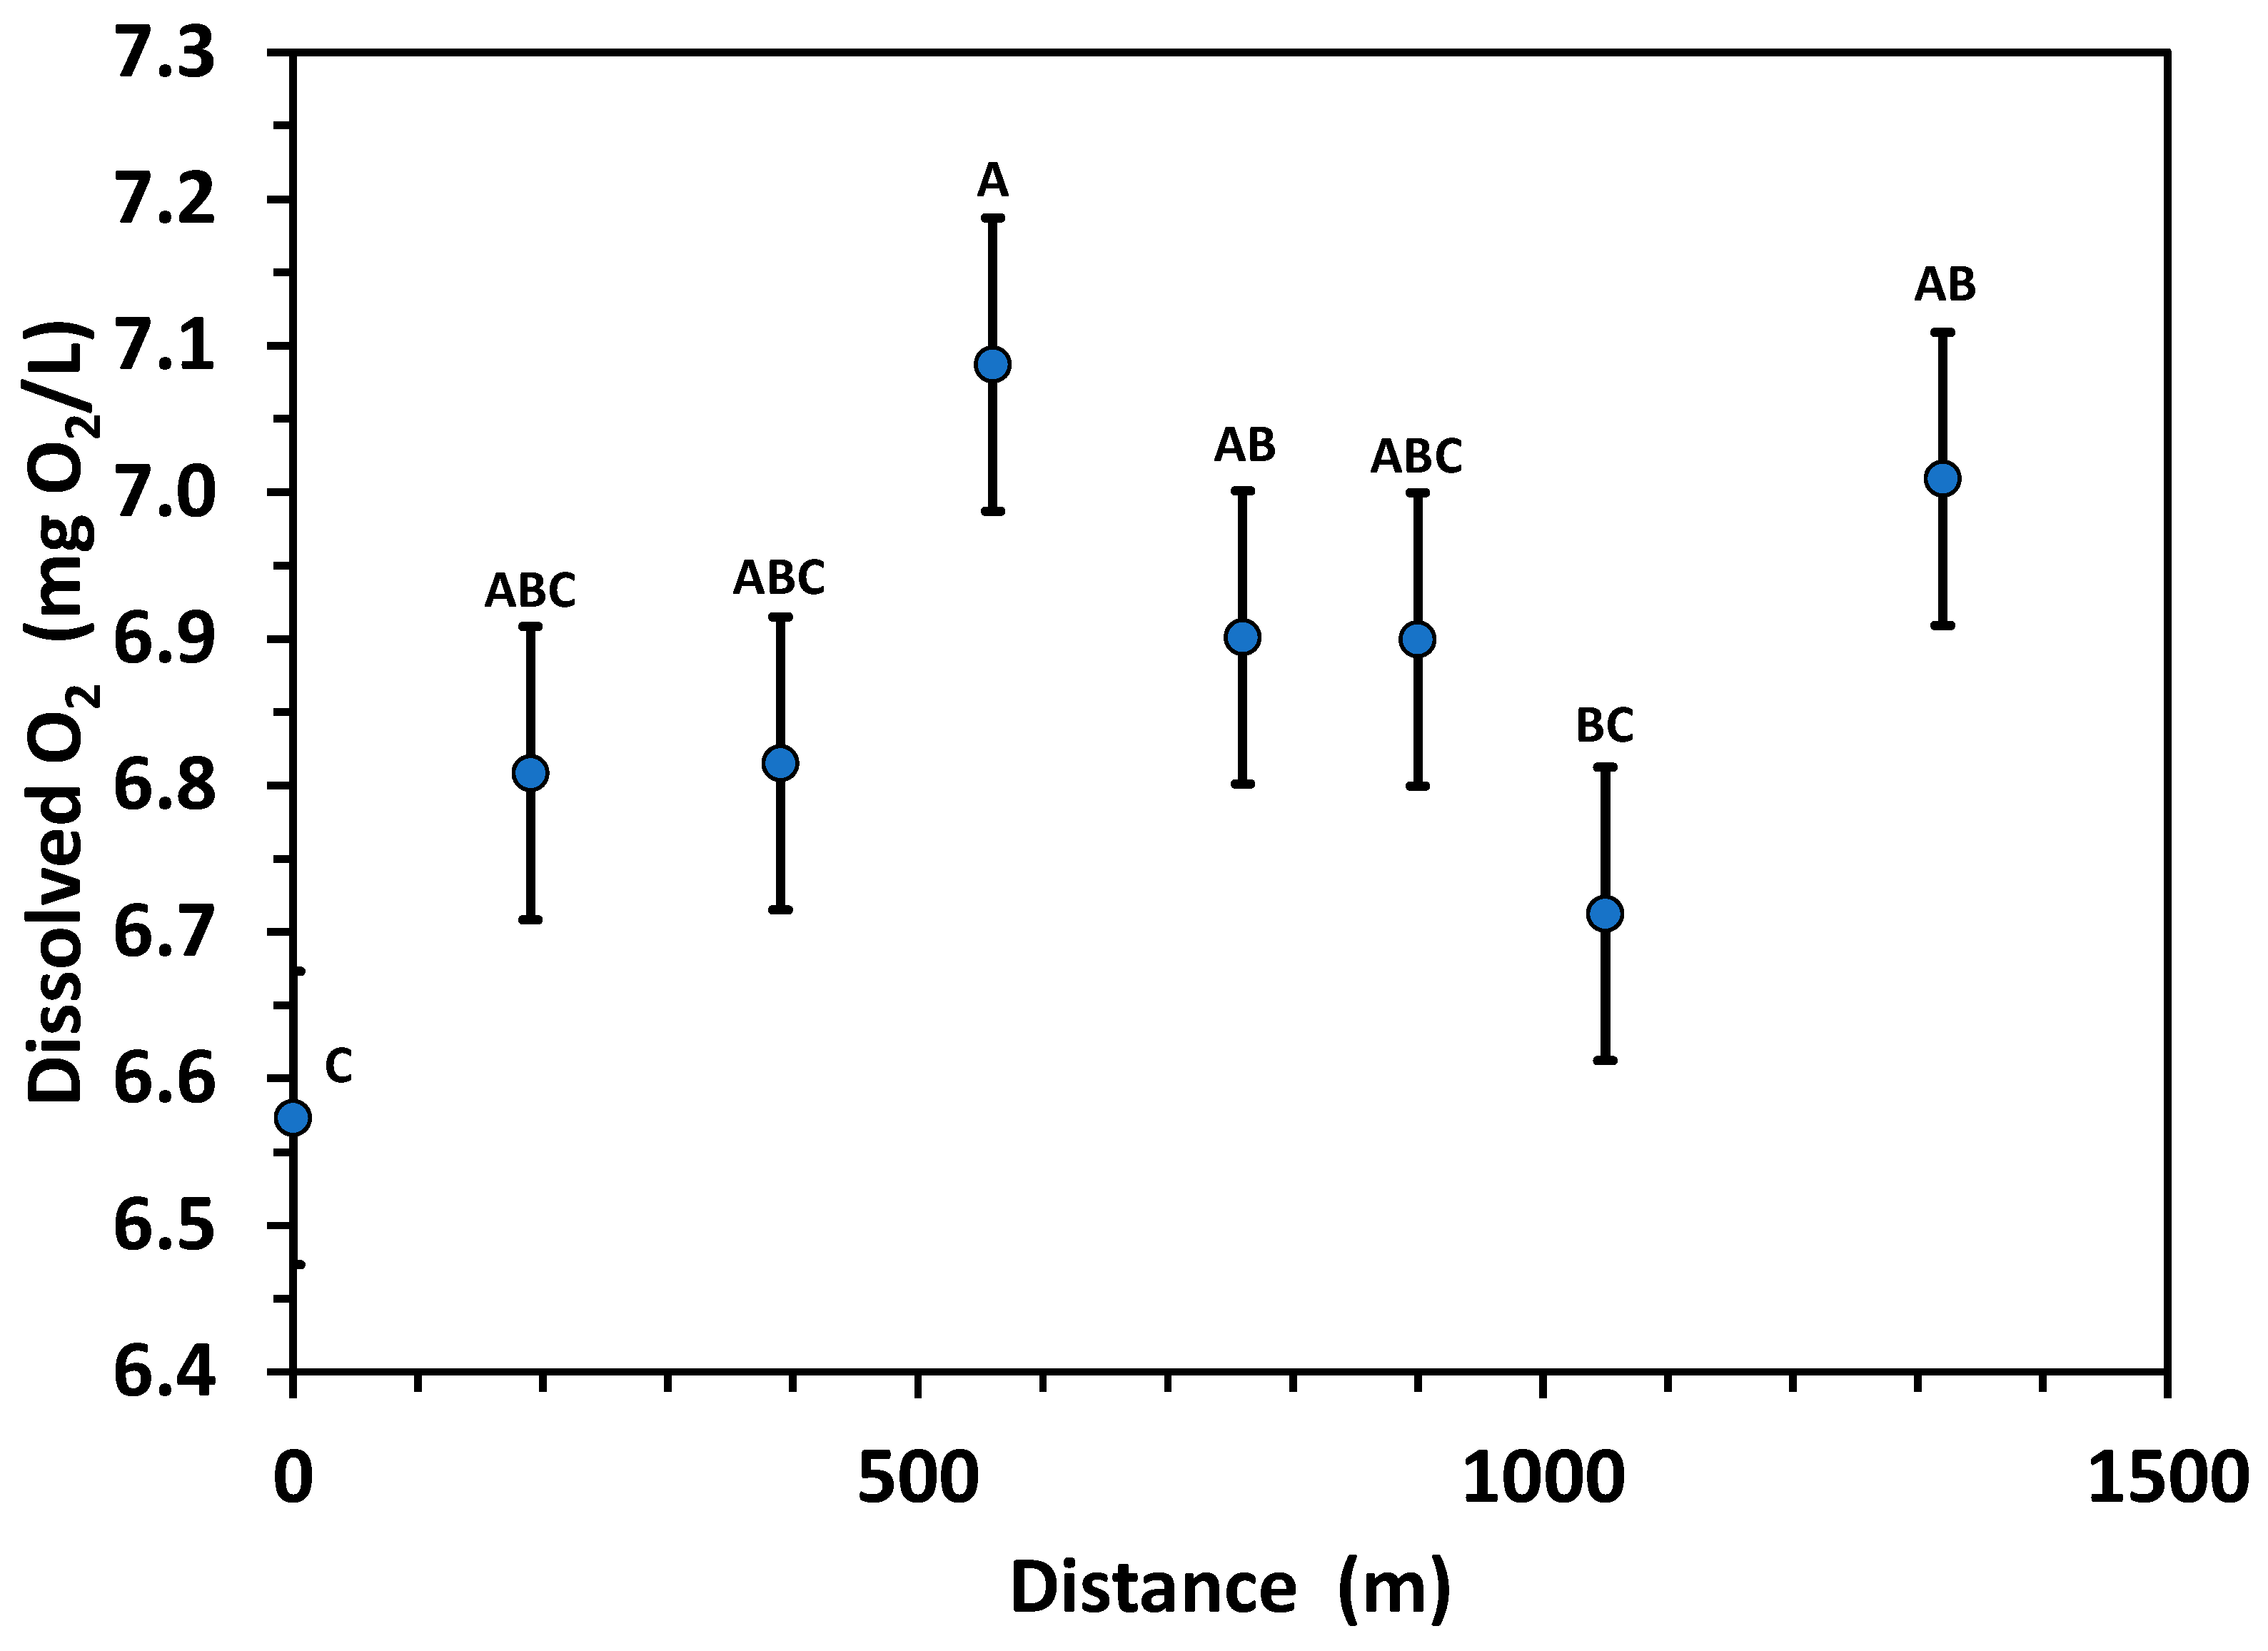
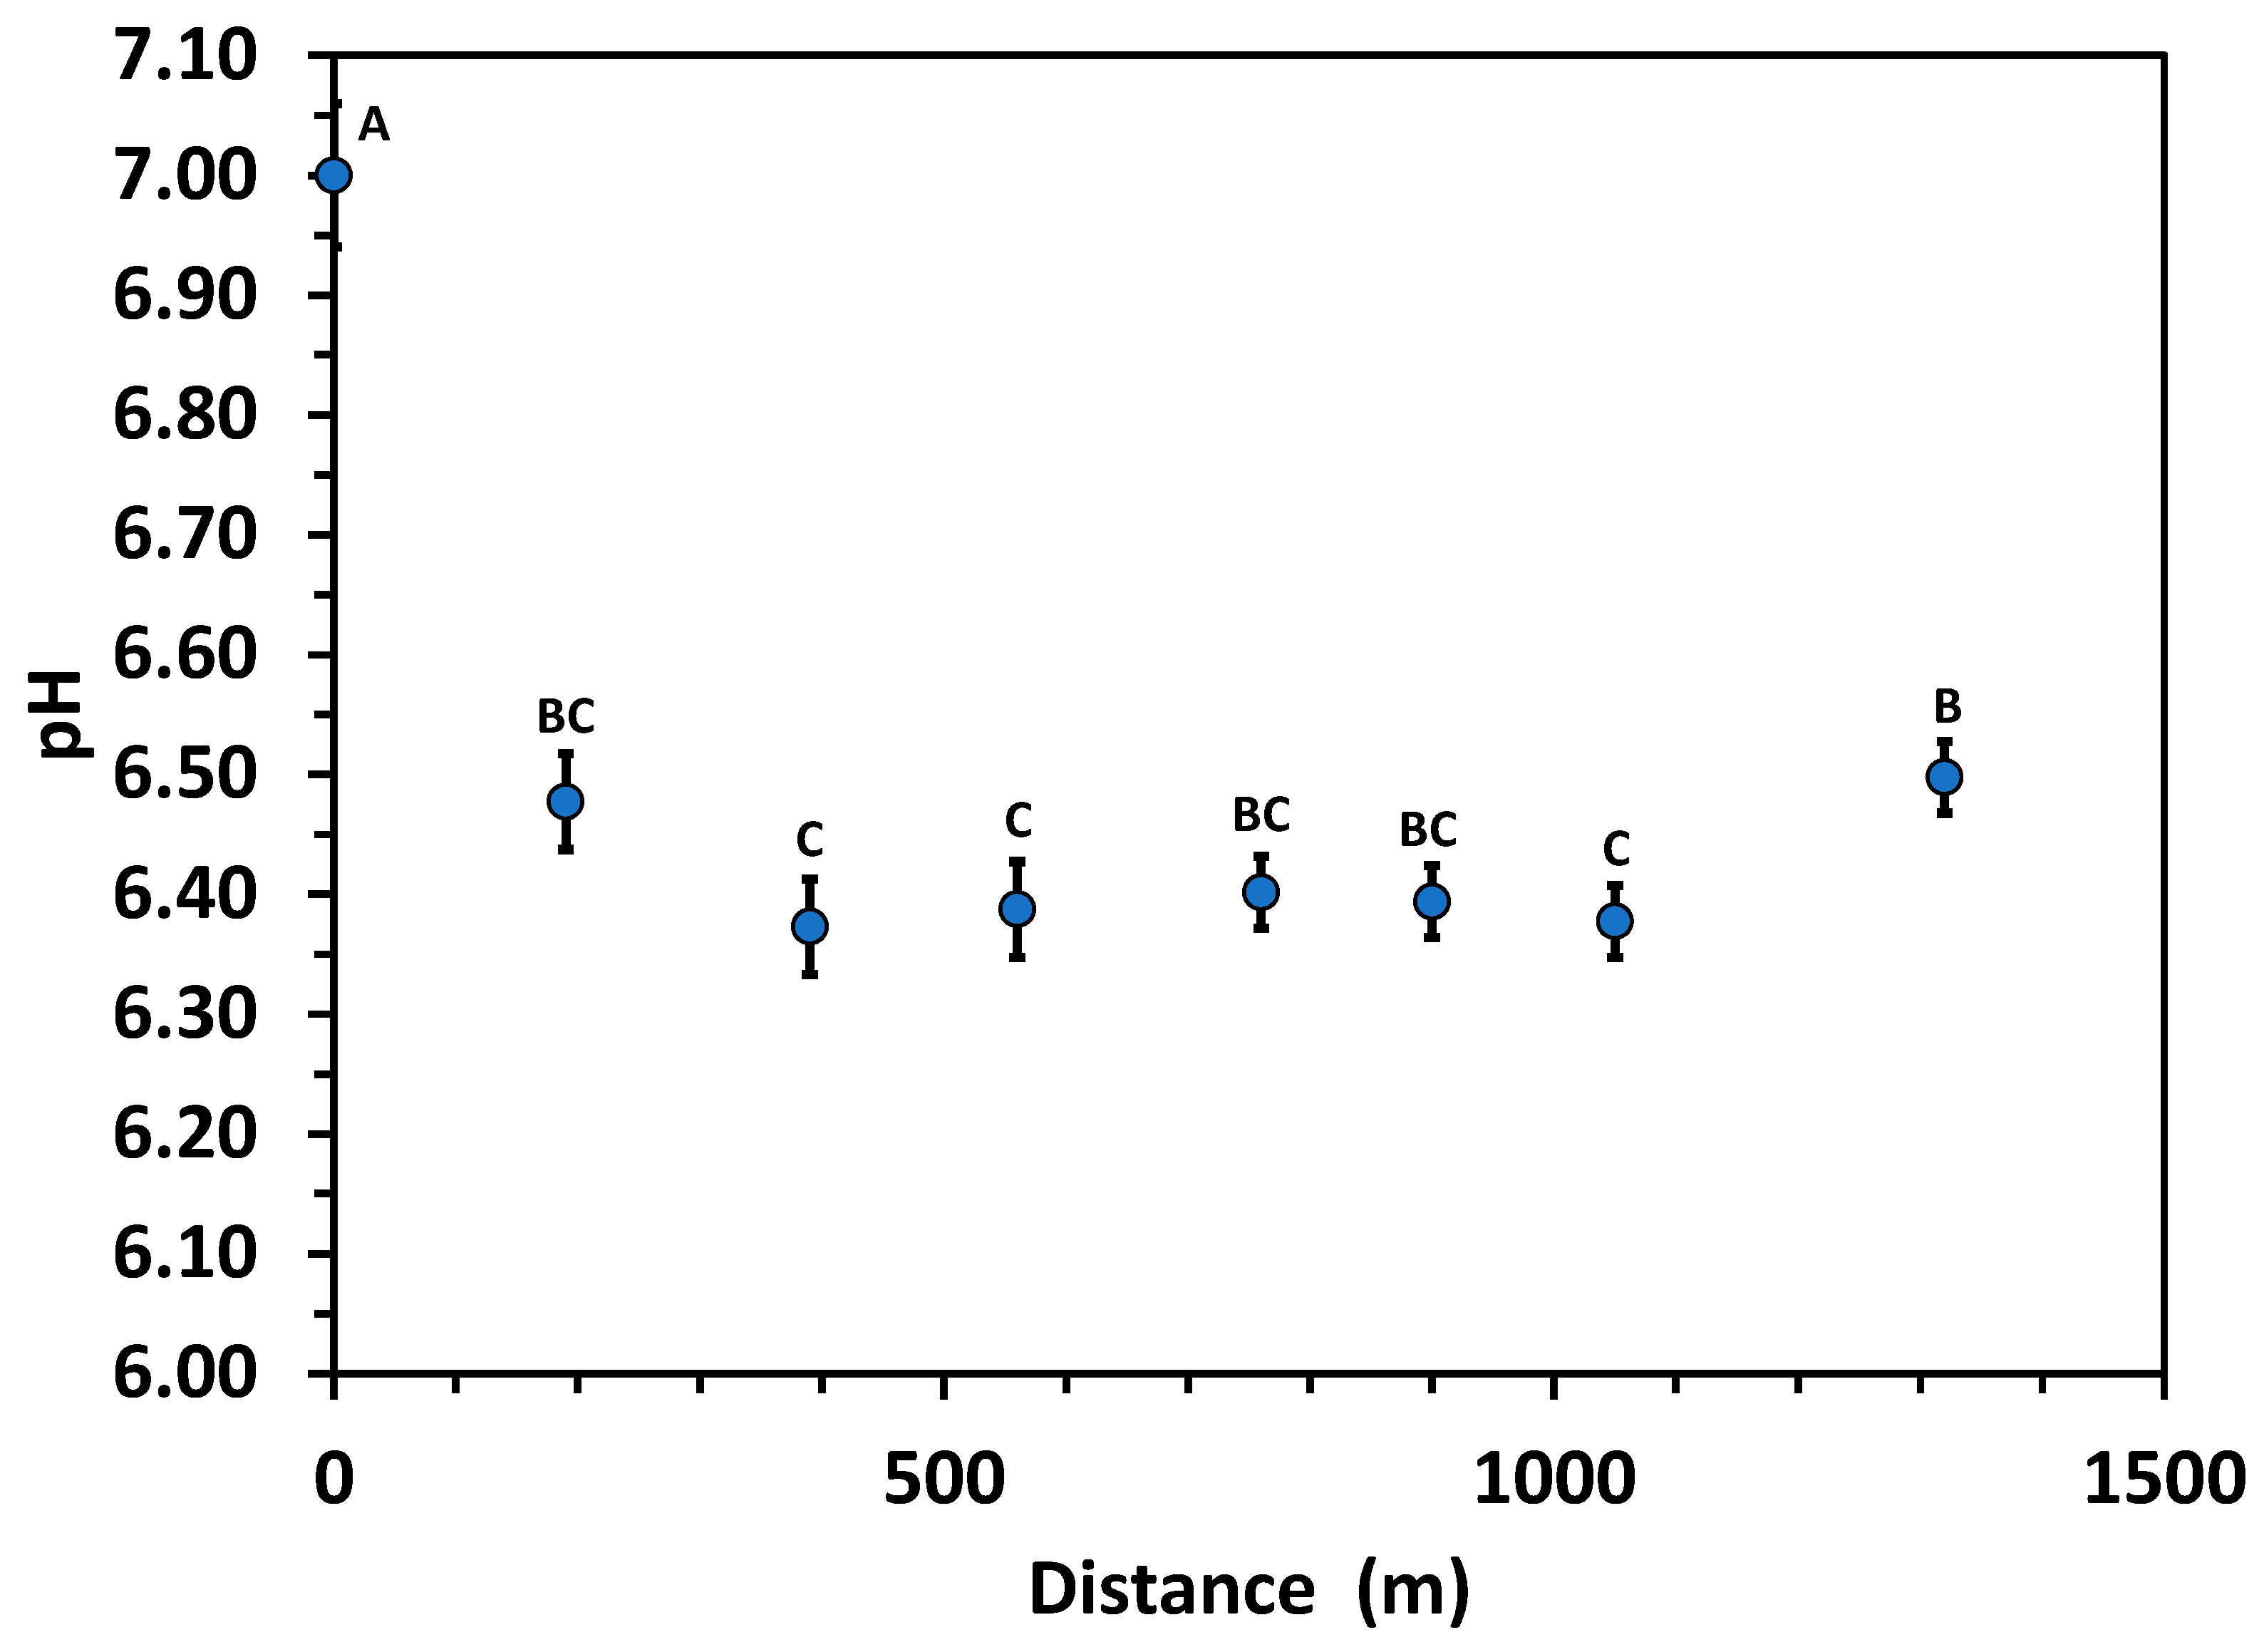
All measured parameters exhibited a spatial pattern of significant variation with distance, except for temperature (Figure 3). Photic zone depth was significantly lowest at Site 1, with intermediate values among middle sites, and was highest just before the Thompson Bayou enters the Escambia River at Site 8 (Figure 4). Dissolved O2 (DO) displayed a similar pattern to photic depth, with lowest mean at Site 1, except that the highest DO occurred at Site 4 (Figure 5). Specific conductivity (SC) showed an essentially linear pattern of variation with distance, significantly lowest at Site 1 and highest at Site 8 (Figure 6). Finally, in sharp contrast to all other parameters, pH was significantly highest at Site 1, but varied minimally among the other sites (Figure 7).
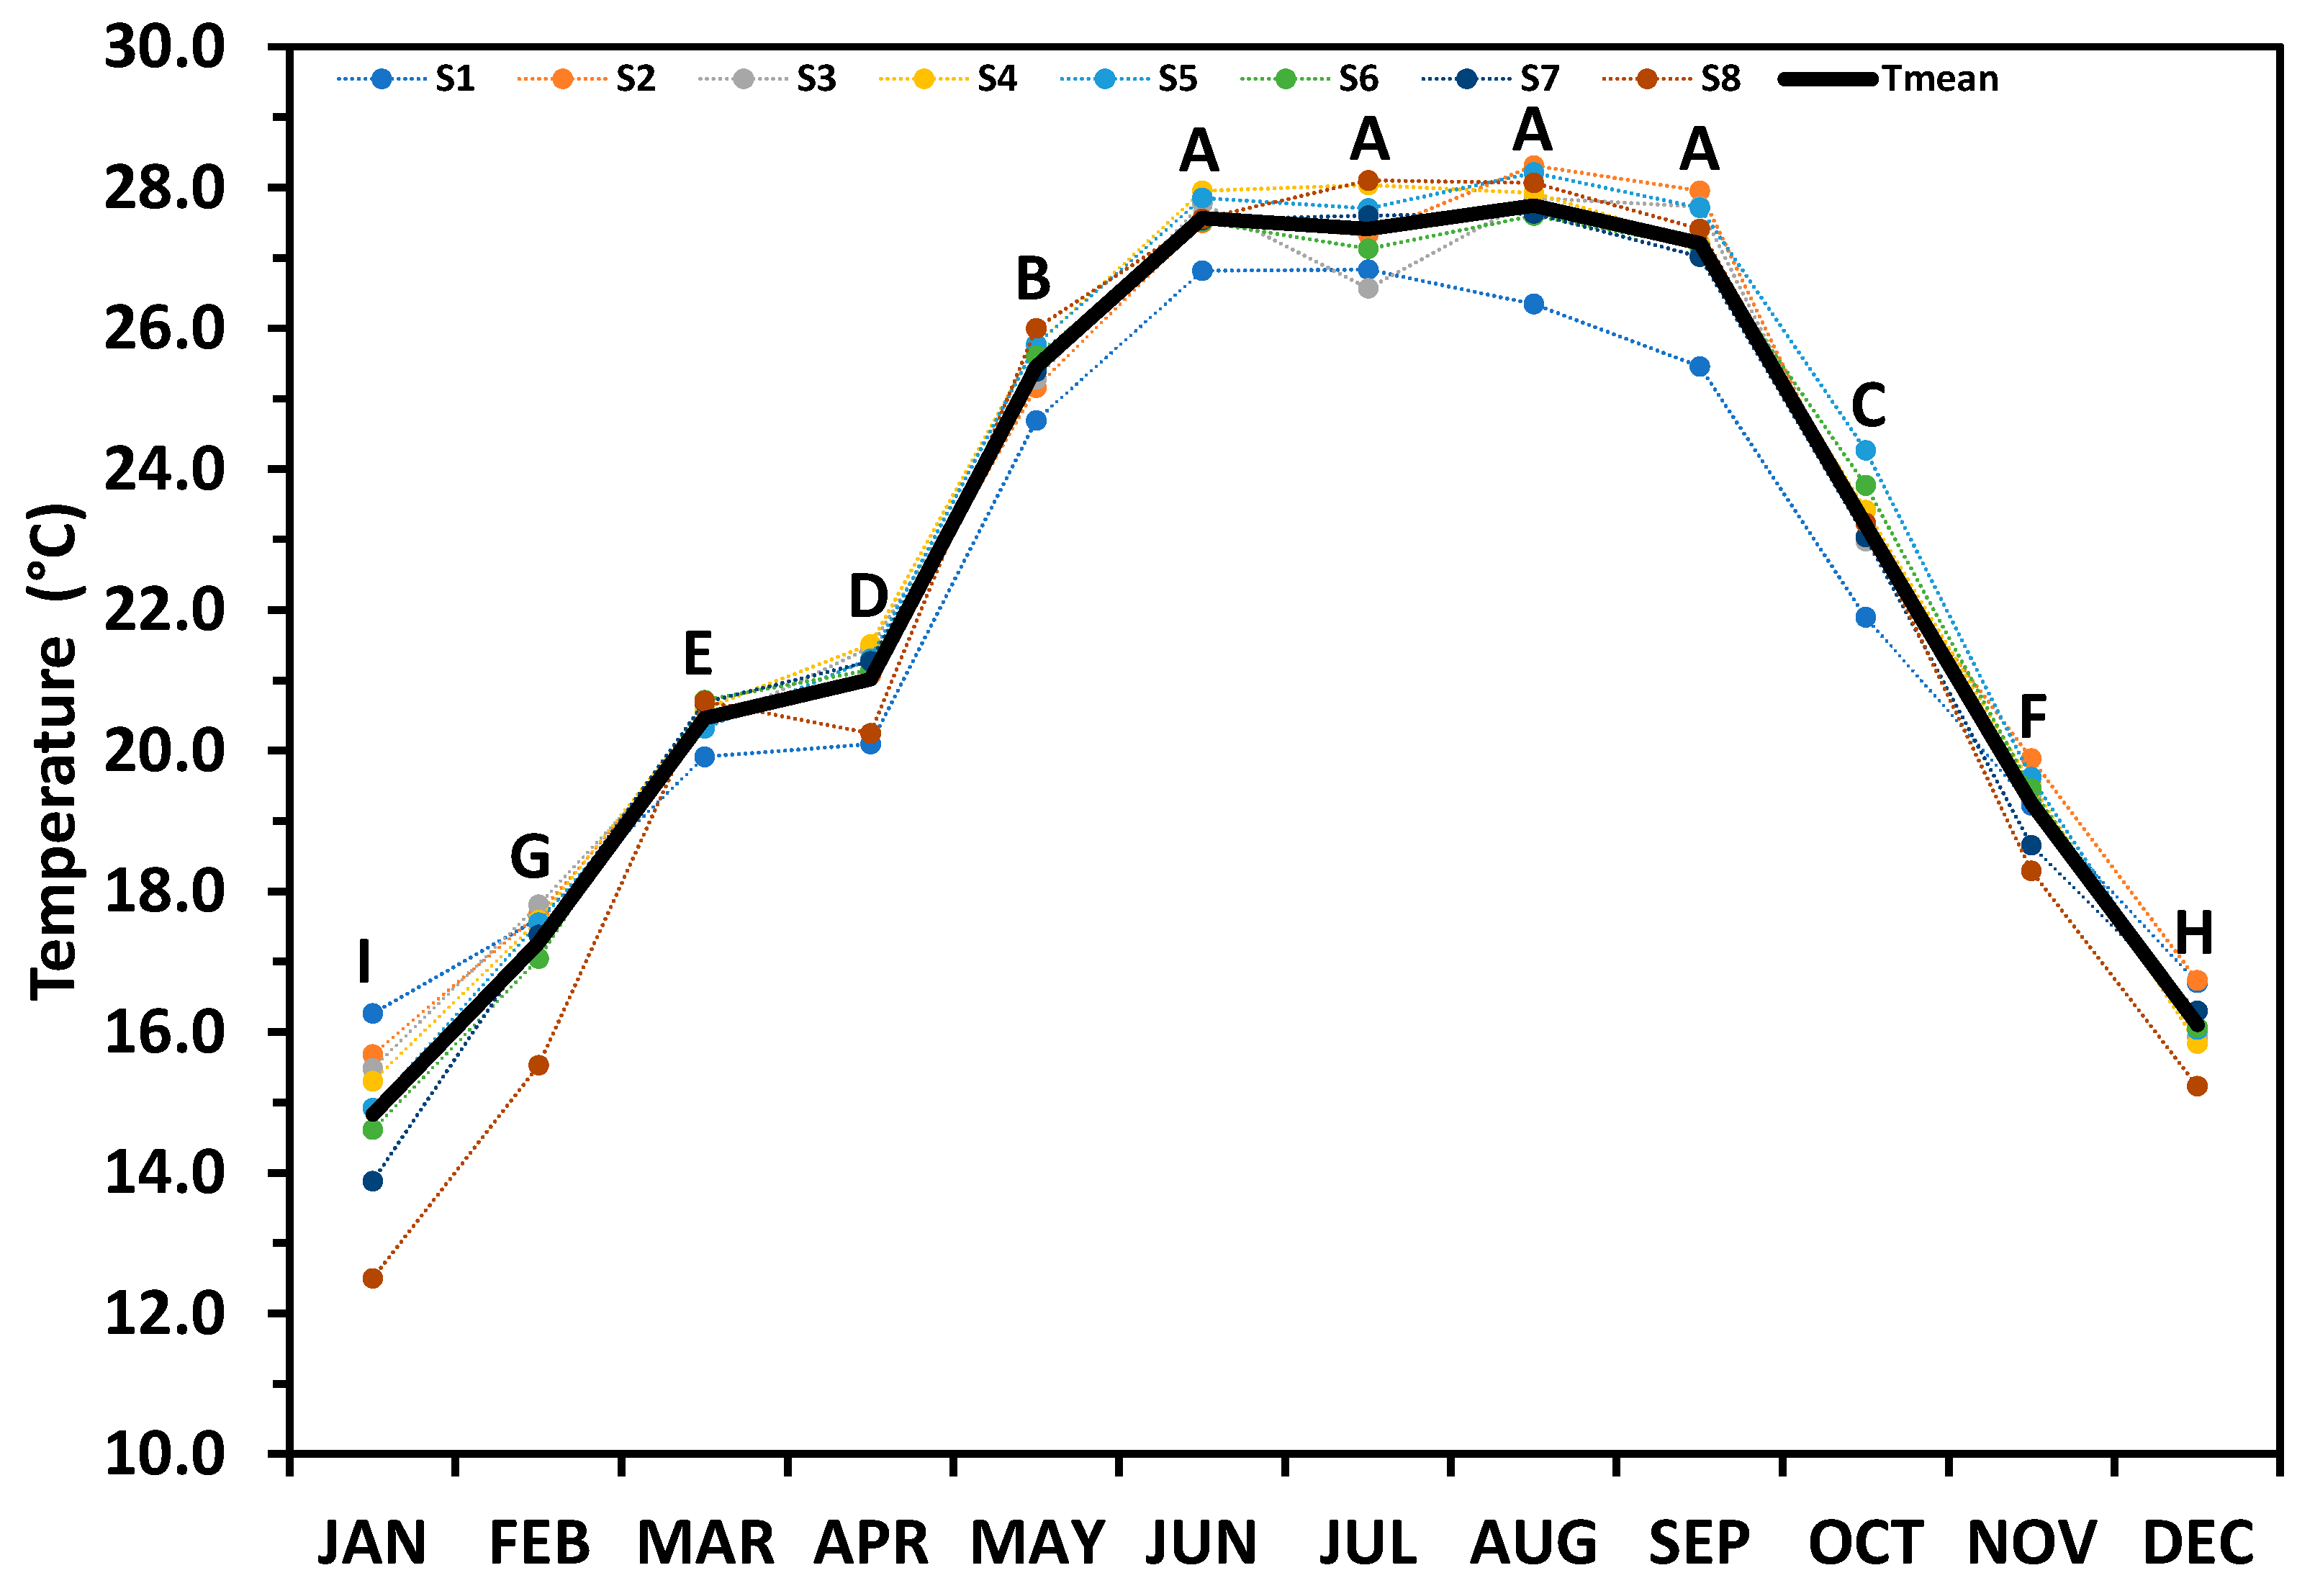
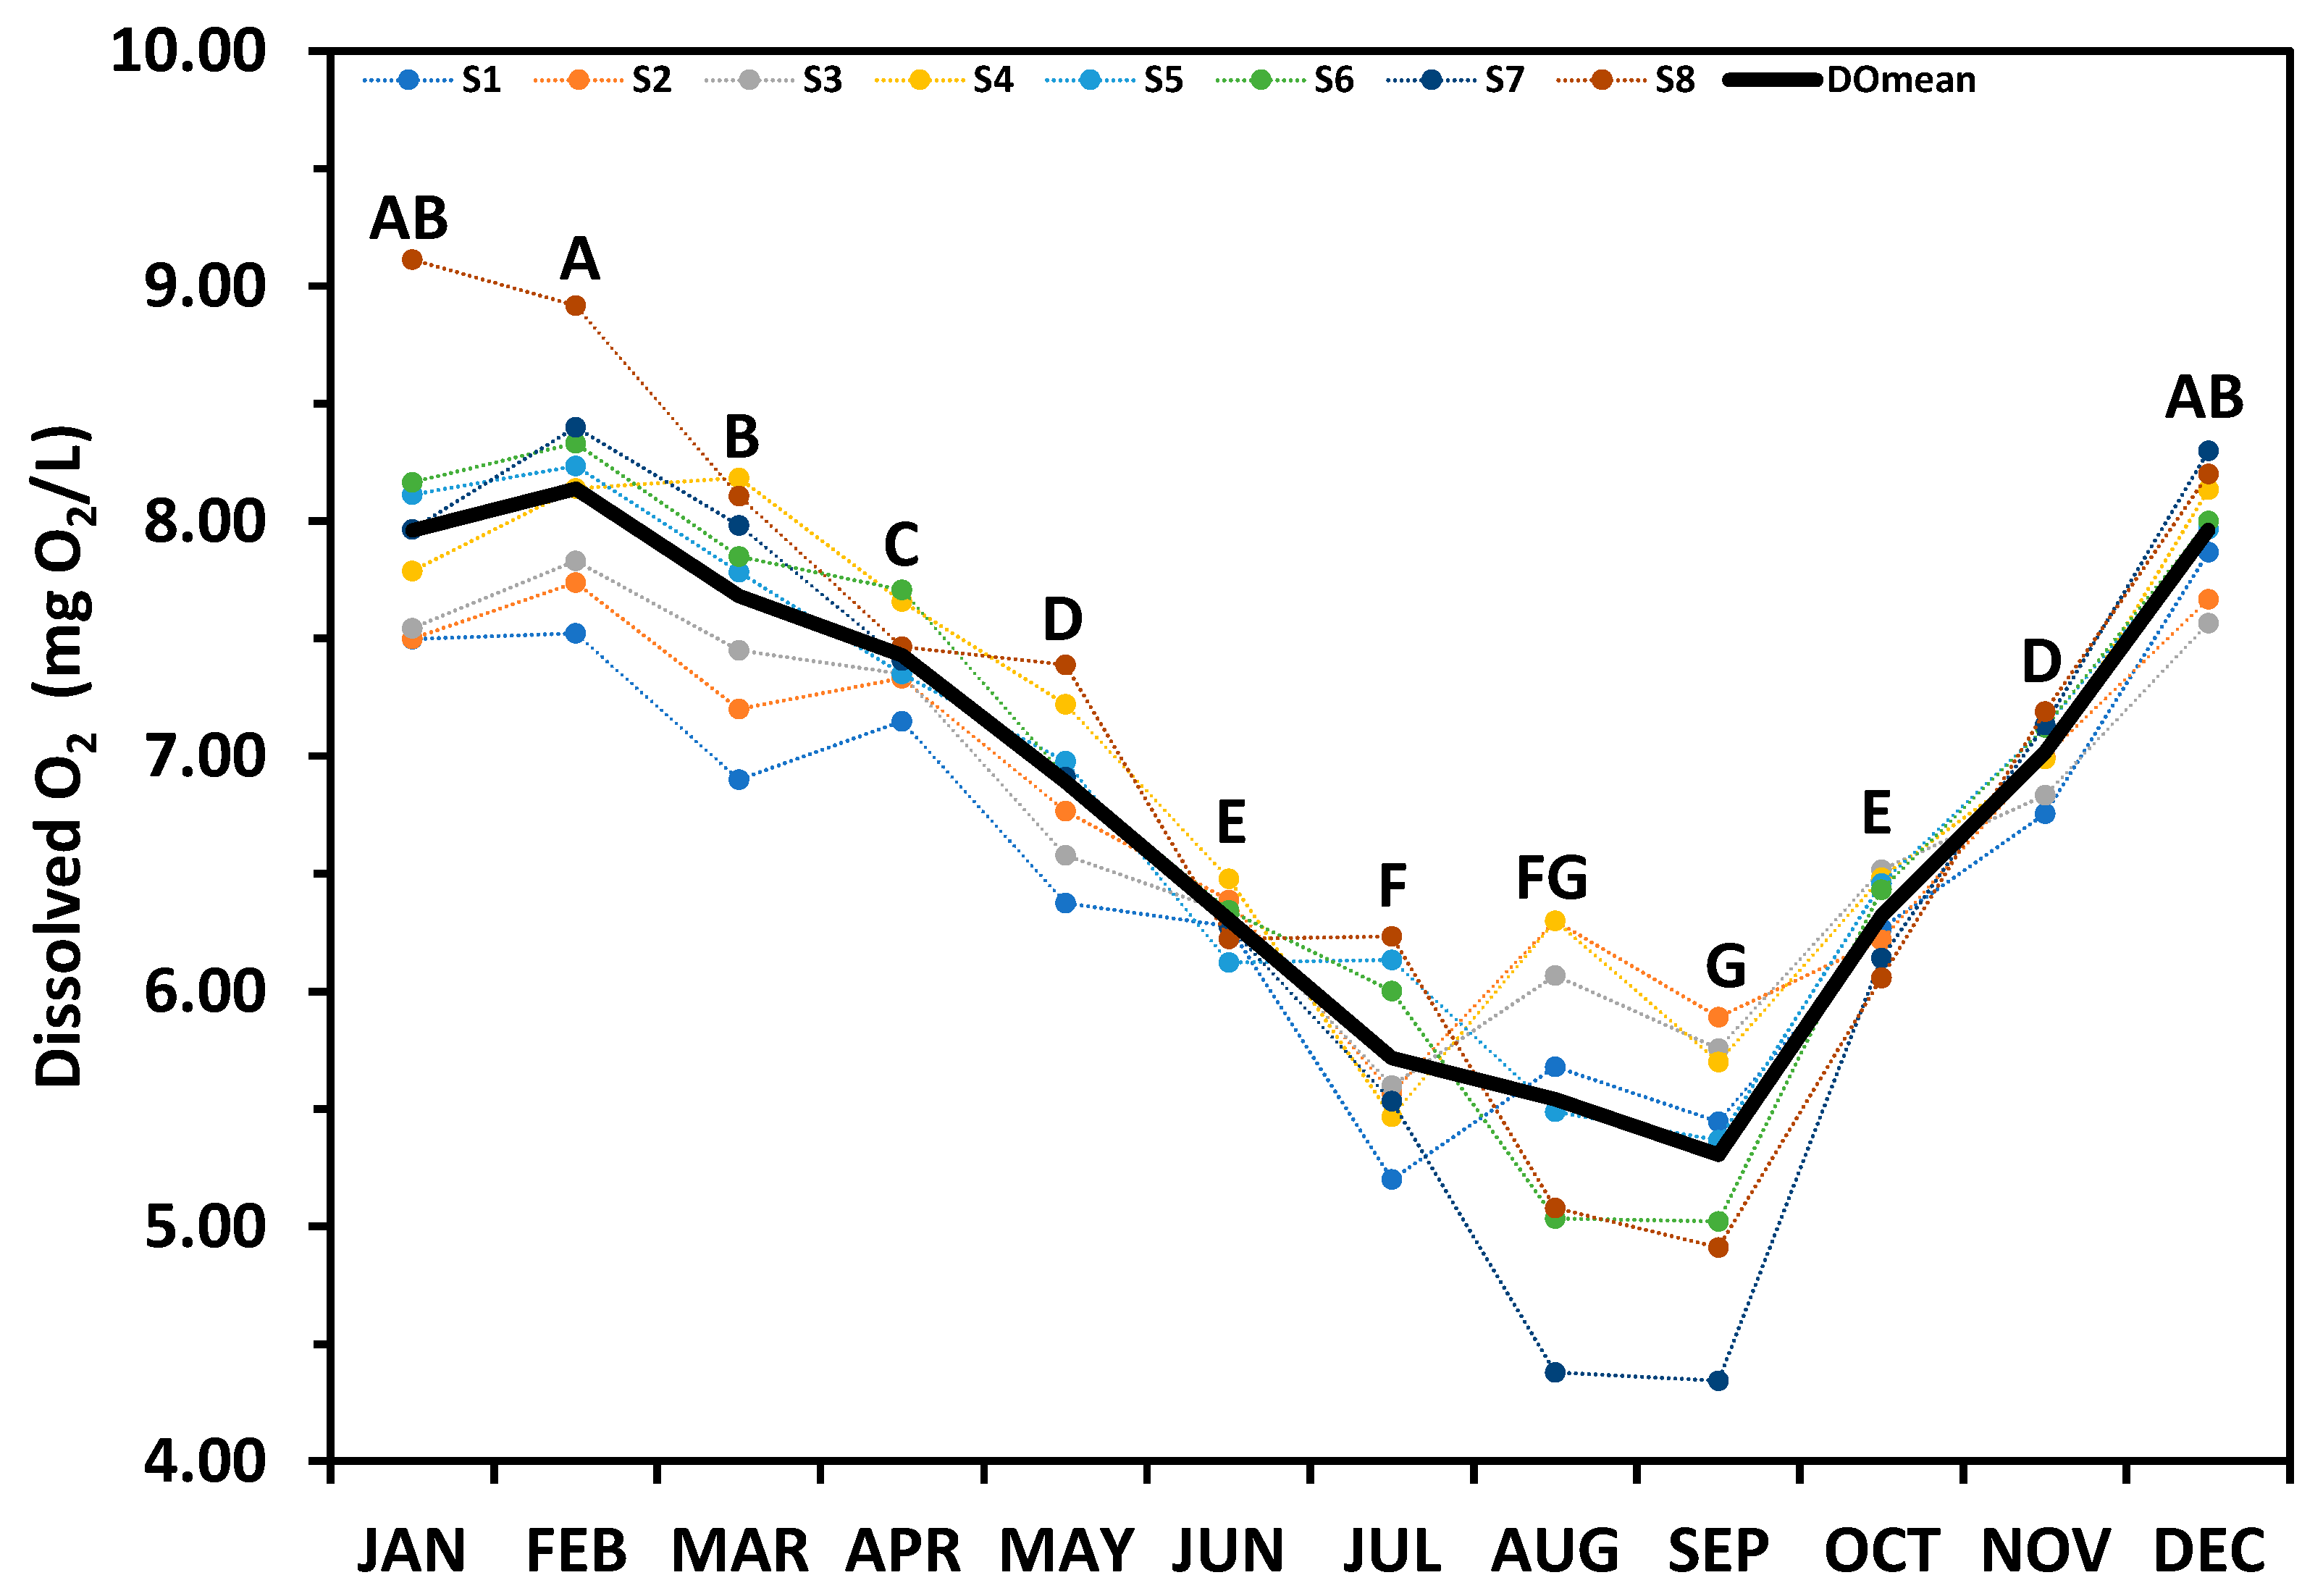
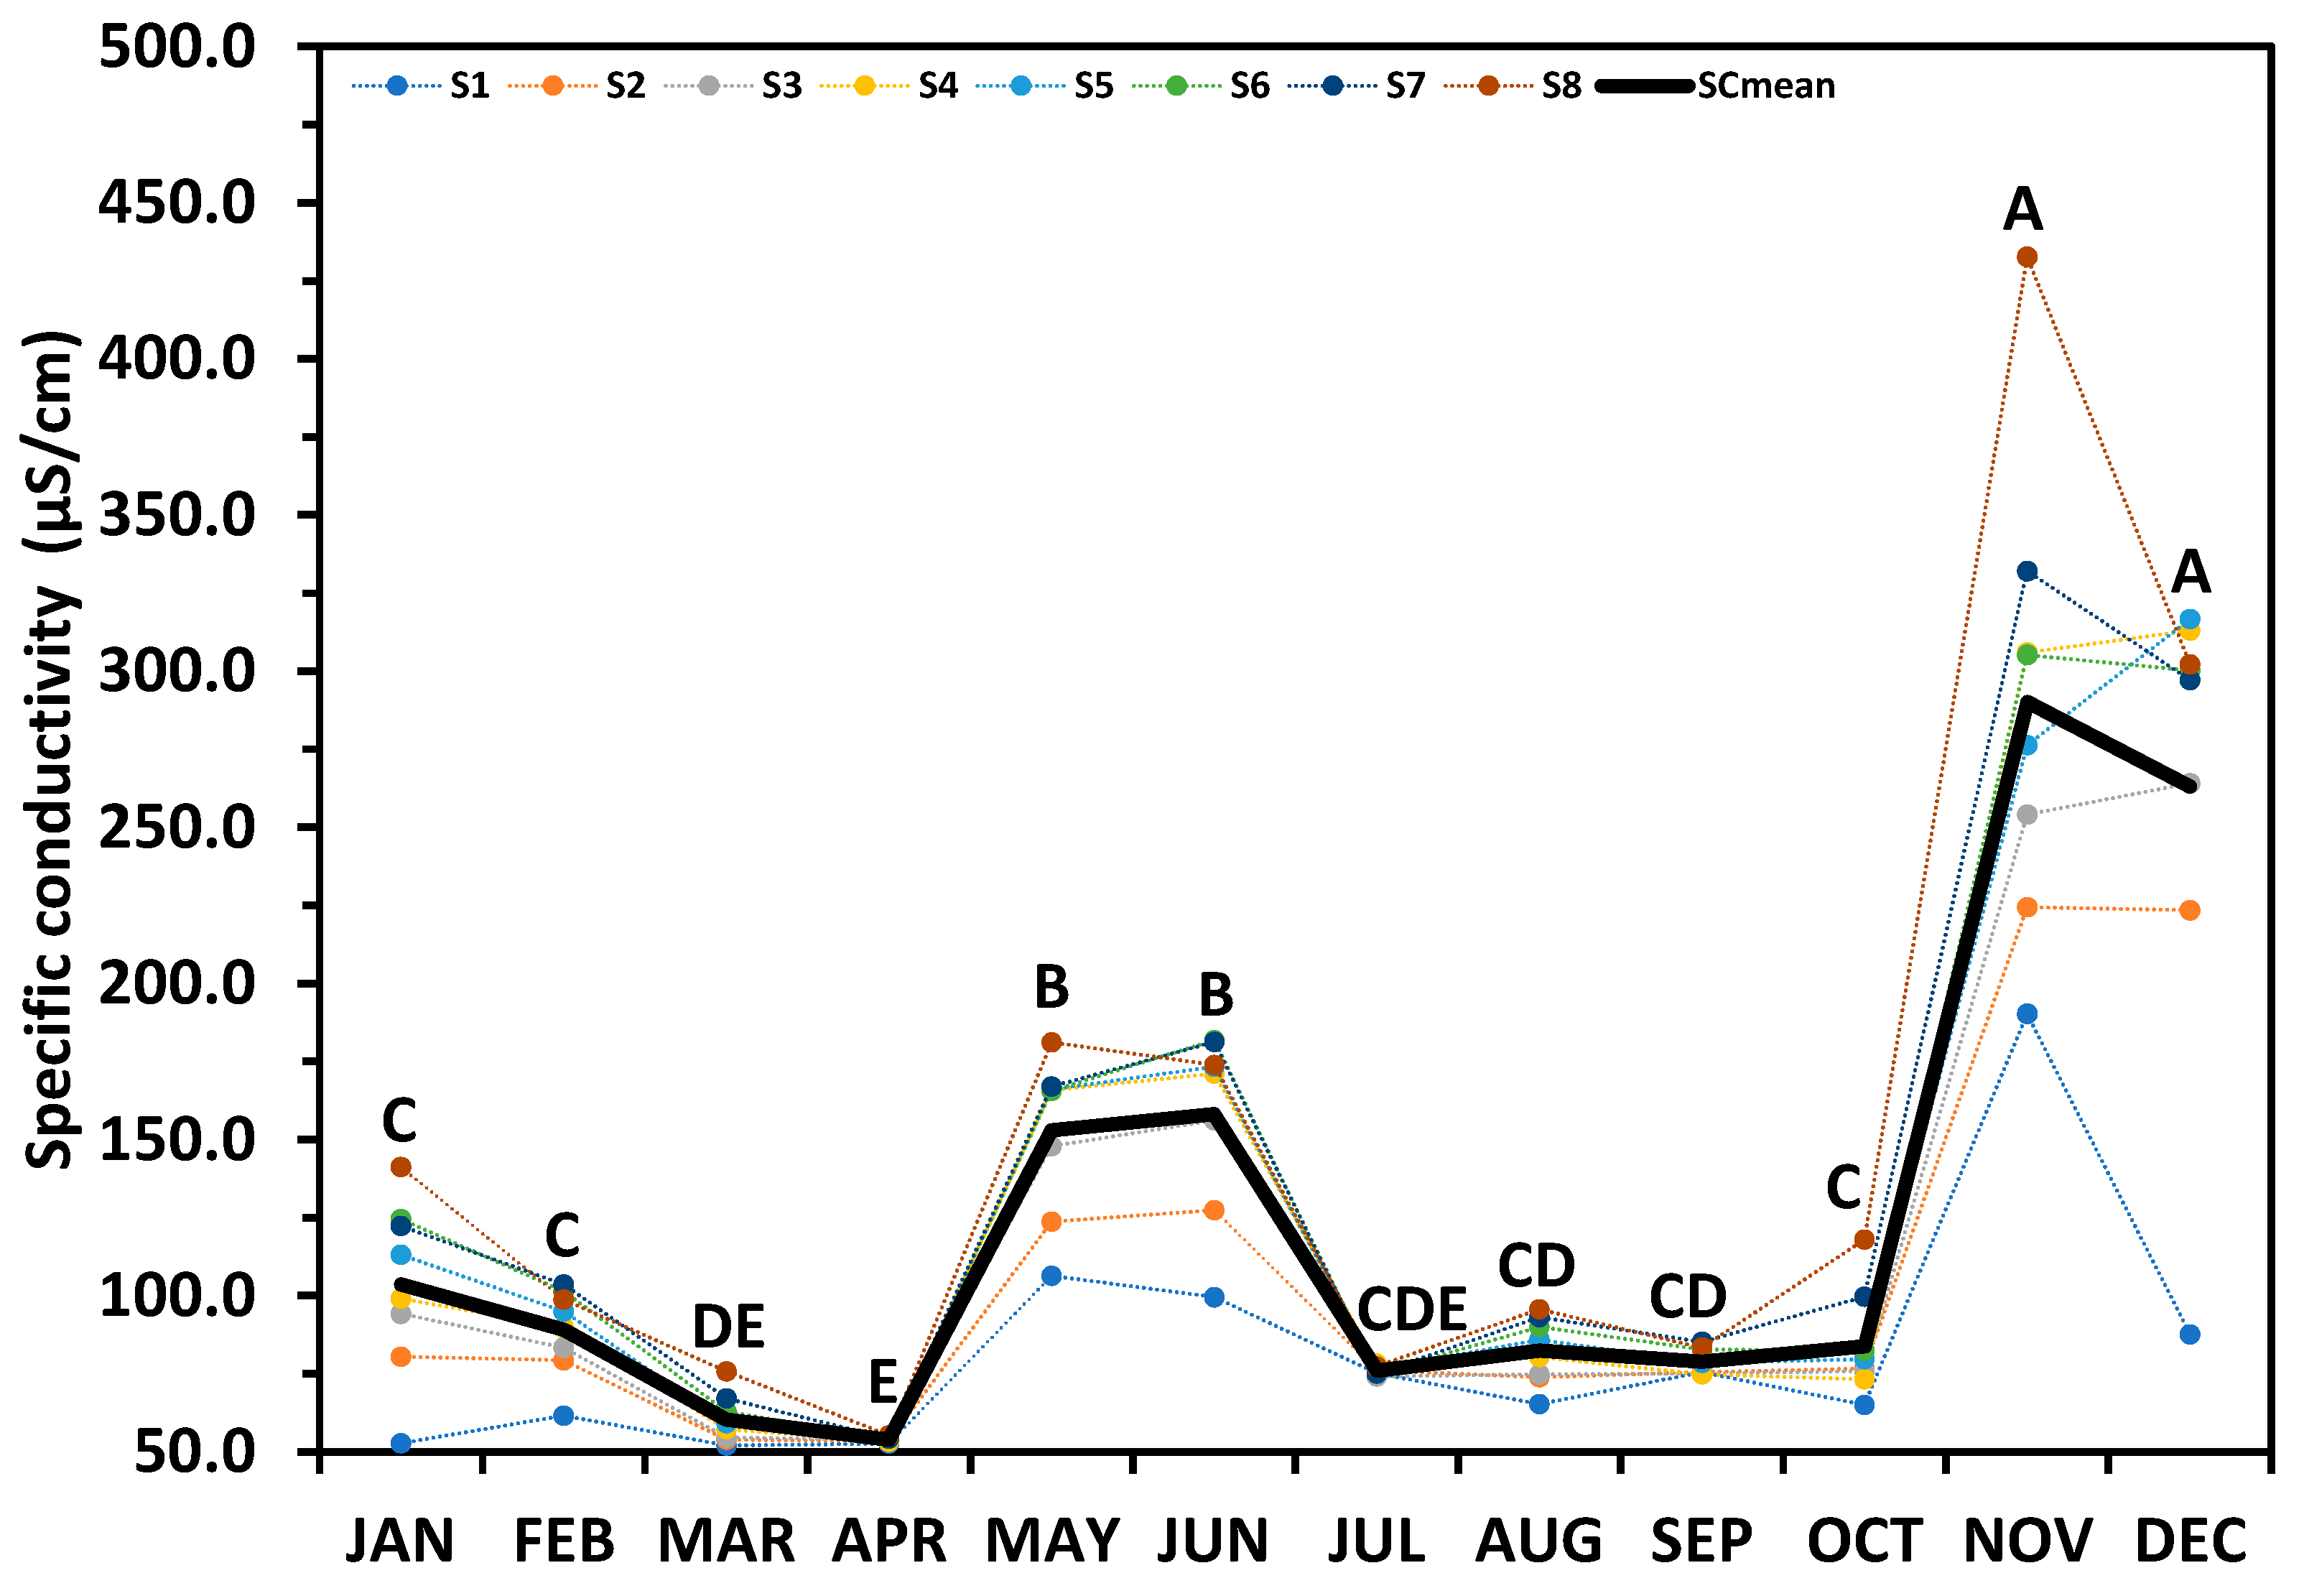
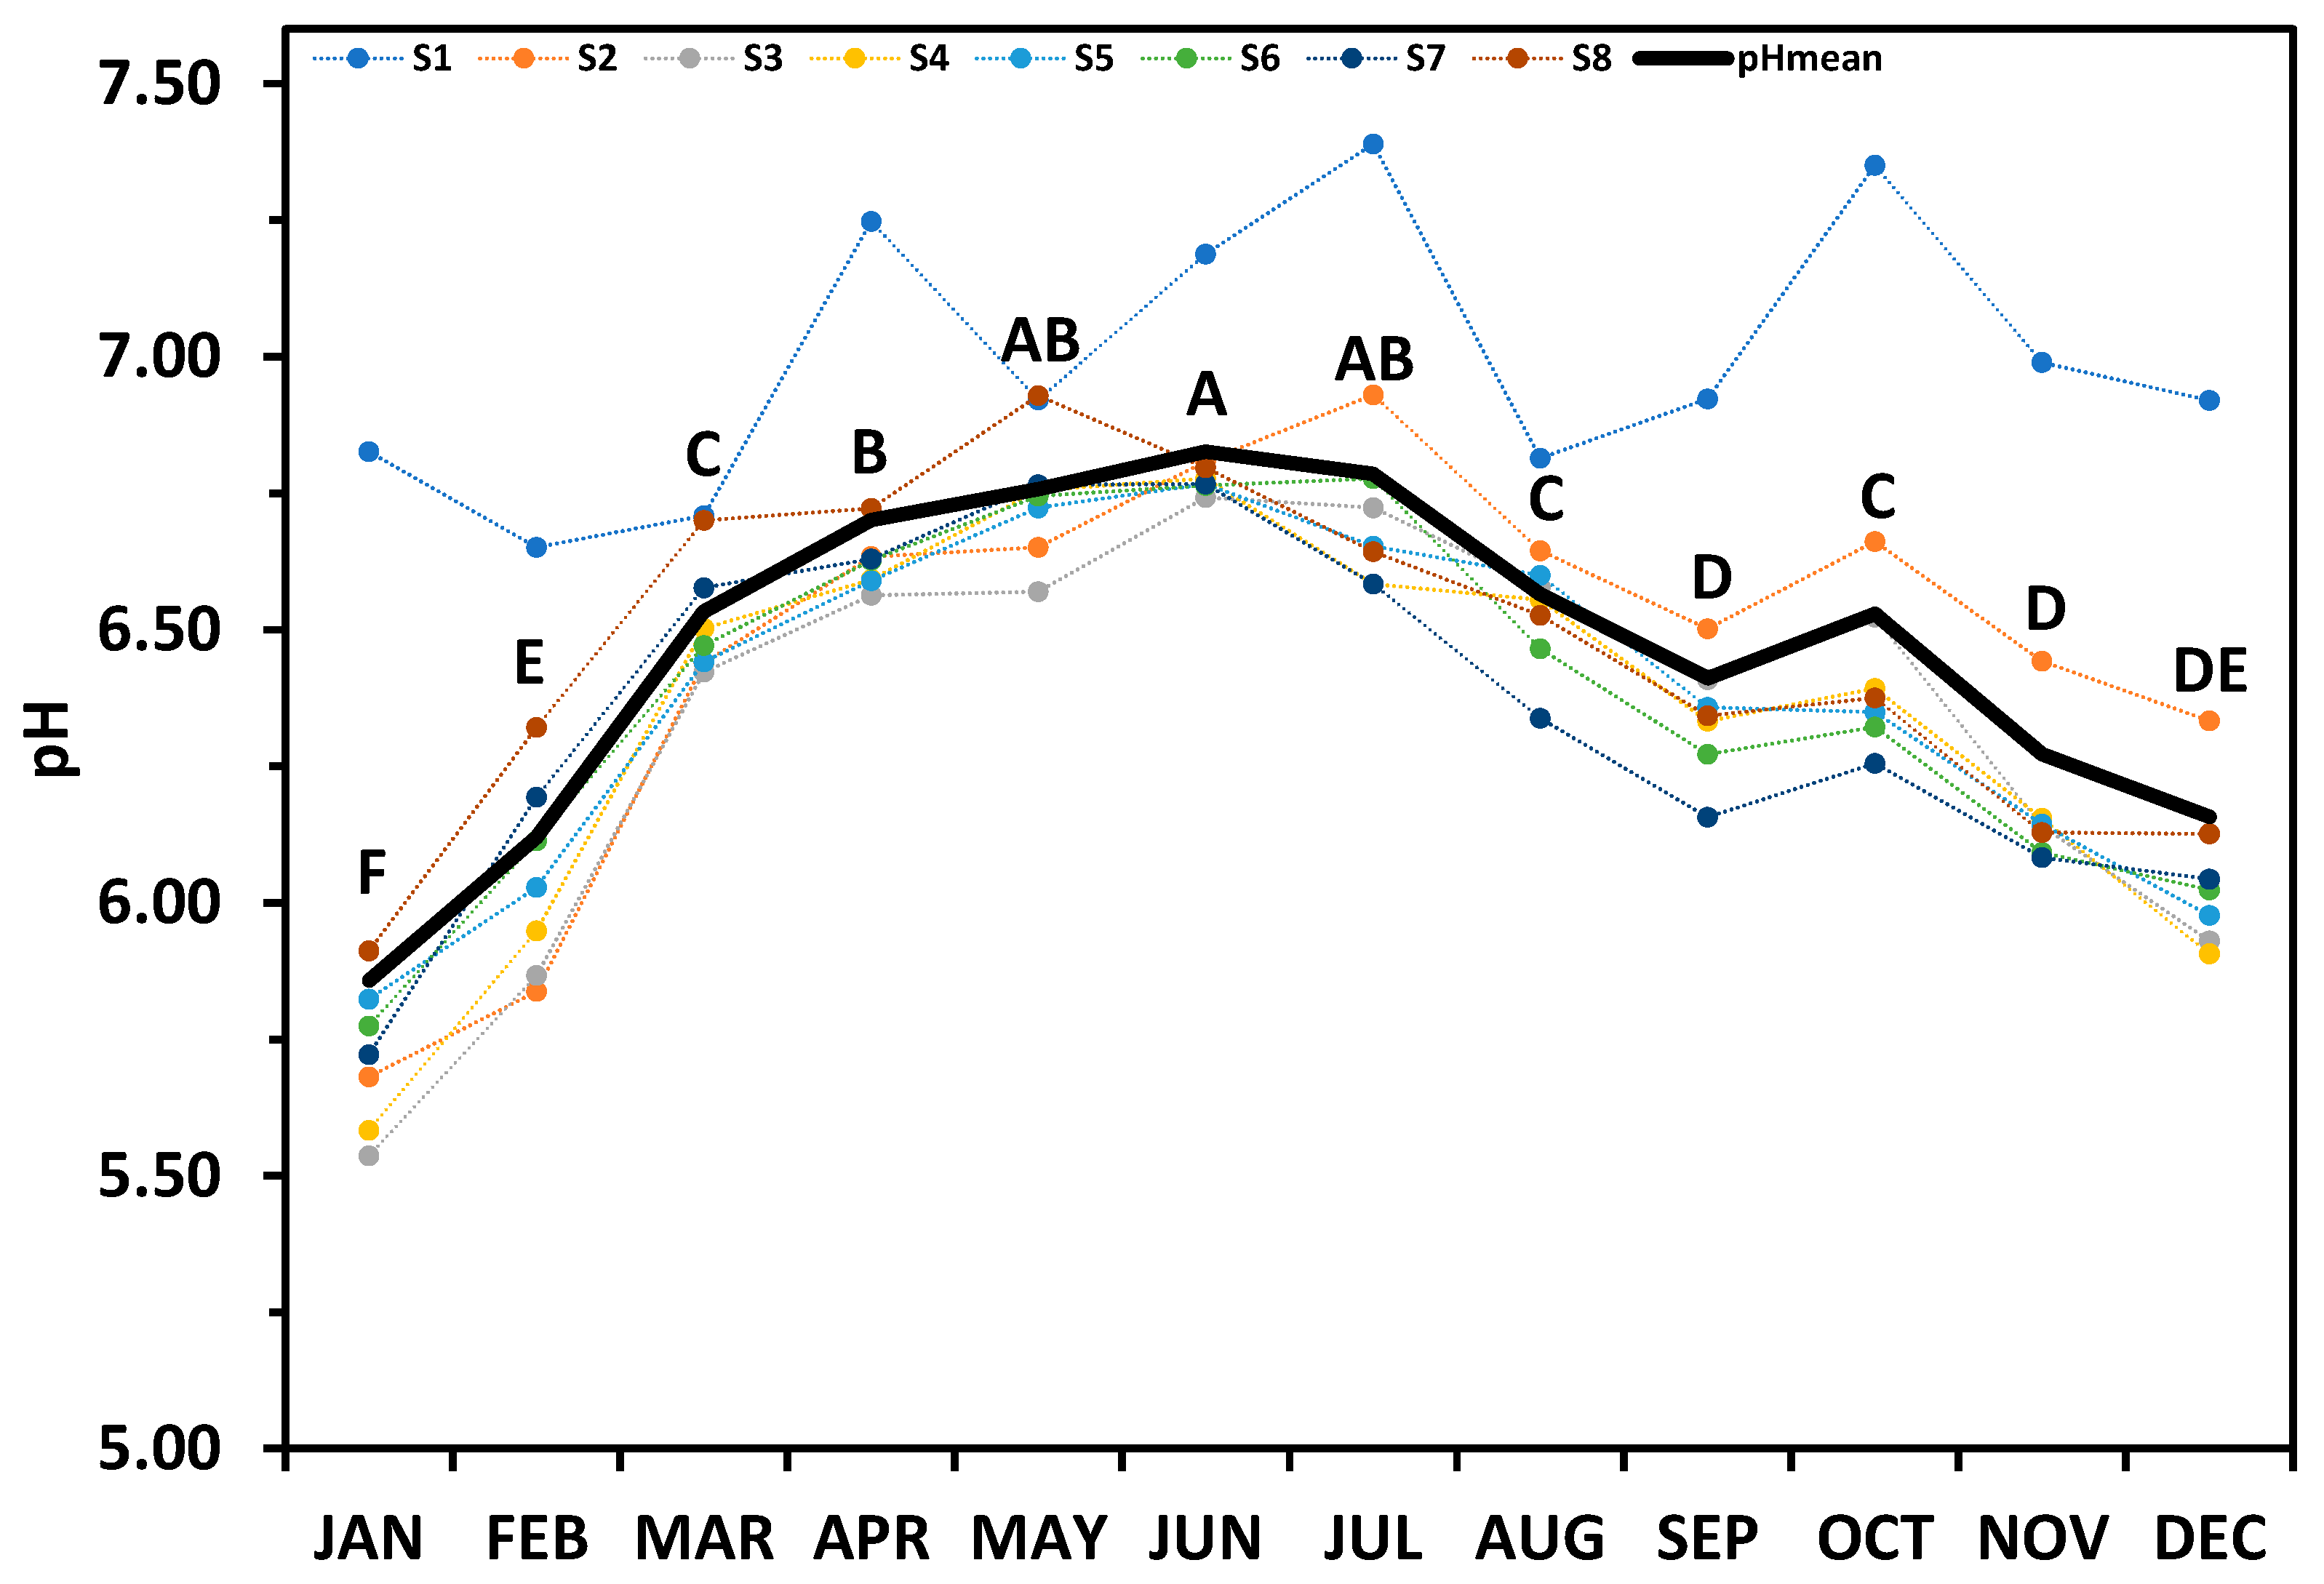
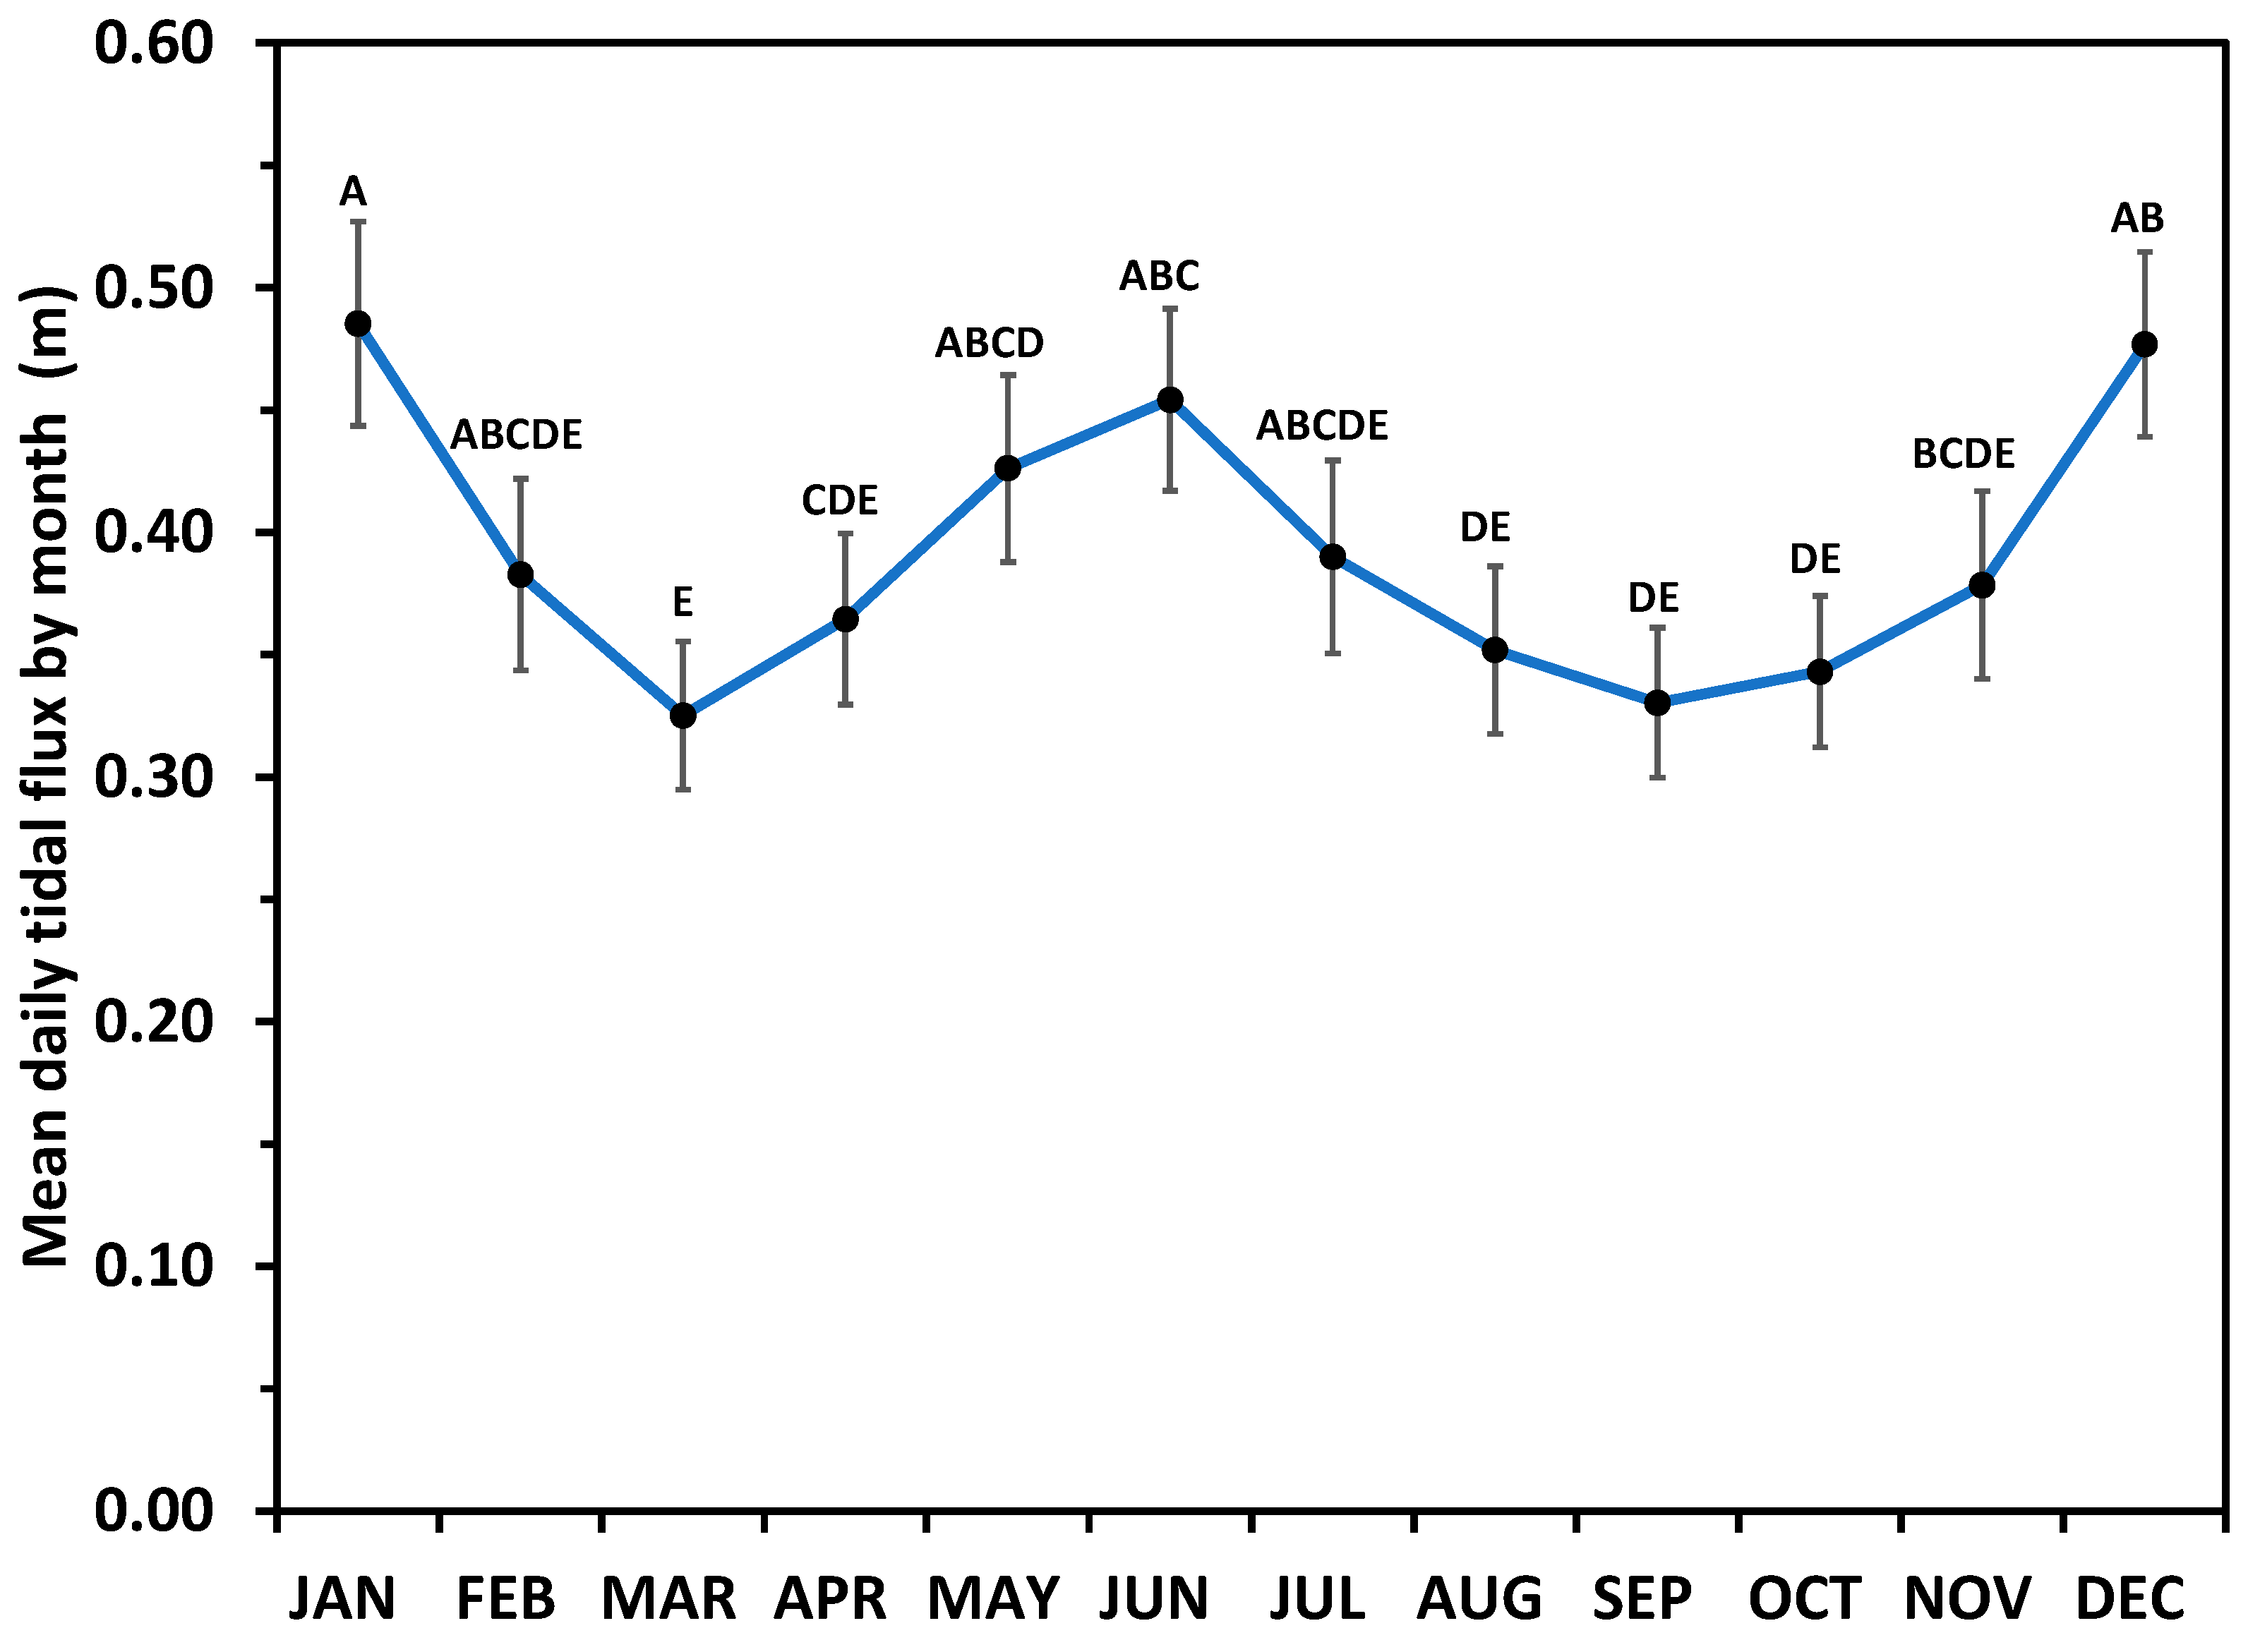
In addition, all measured parameters exhibited a temporal pattern of significant variation among monthly means, including—and especially—temperature, which was predictably highest during summer months and lowest during winter months (Figure 8). Although DO also had a seasonal pattern, it was opposite of that of temperature, being lowest in July through September and highest in January/February and December (Figure 9). Specific conductivity displayed a bimodal pattern that was intermediately higher in May/June and highest in November/December (Figure 10). The temporal pattern for pH was similar to temperature, with the lowest means in January/February and December and highest in June (Figure 11). Tidal flux exhibited a seasonal pattern similar to SC, with bimodal maxima in summer and winter (Figure 12).
Mean monthly water temperature was positively correlated with mean monthly temperature and total monthly precipitation. By contrast, DO was negatively correlated with those variables (Table 1).
4. Discussion
4.1. Spatial Patterns
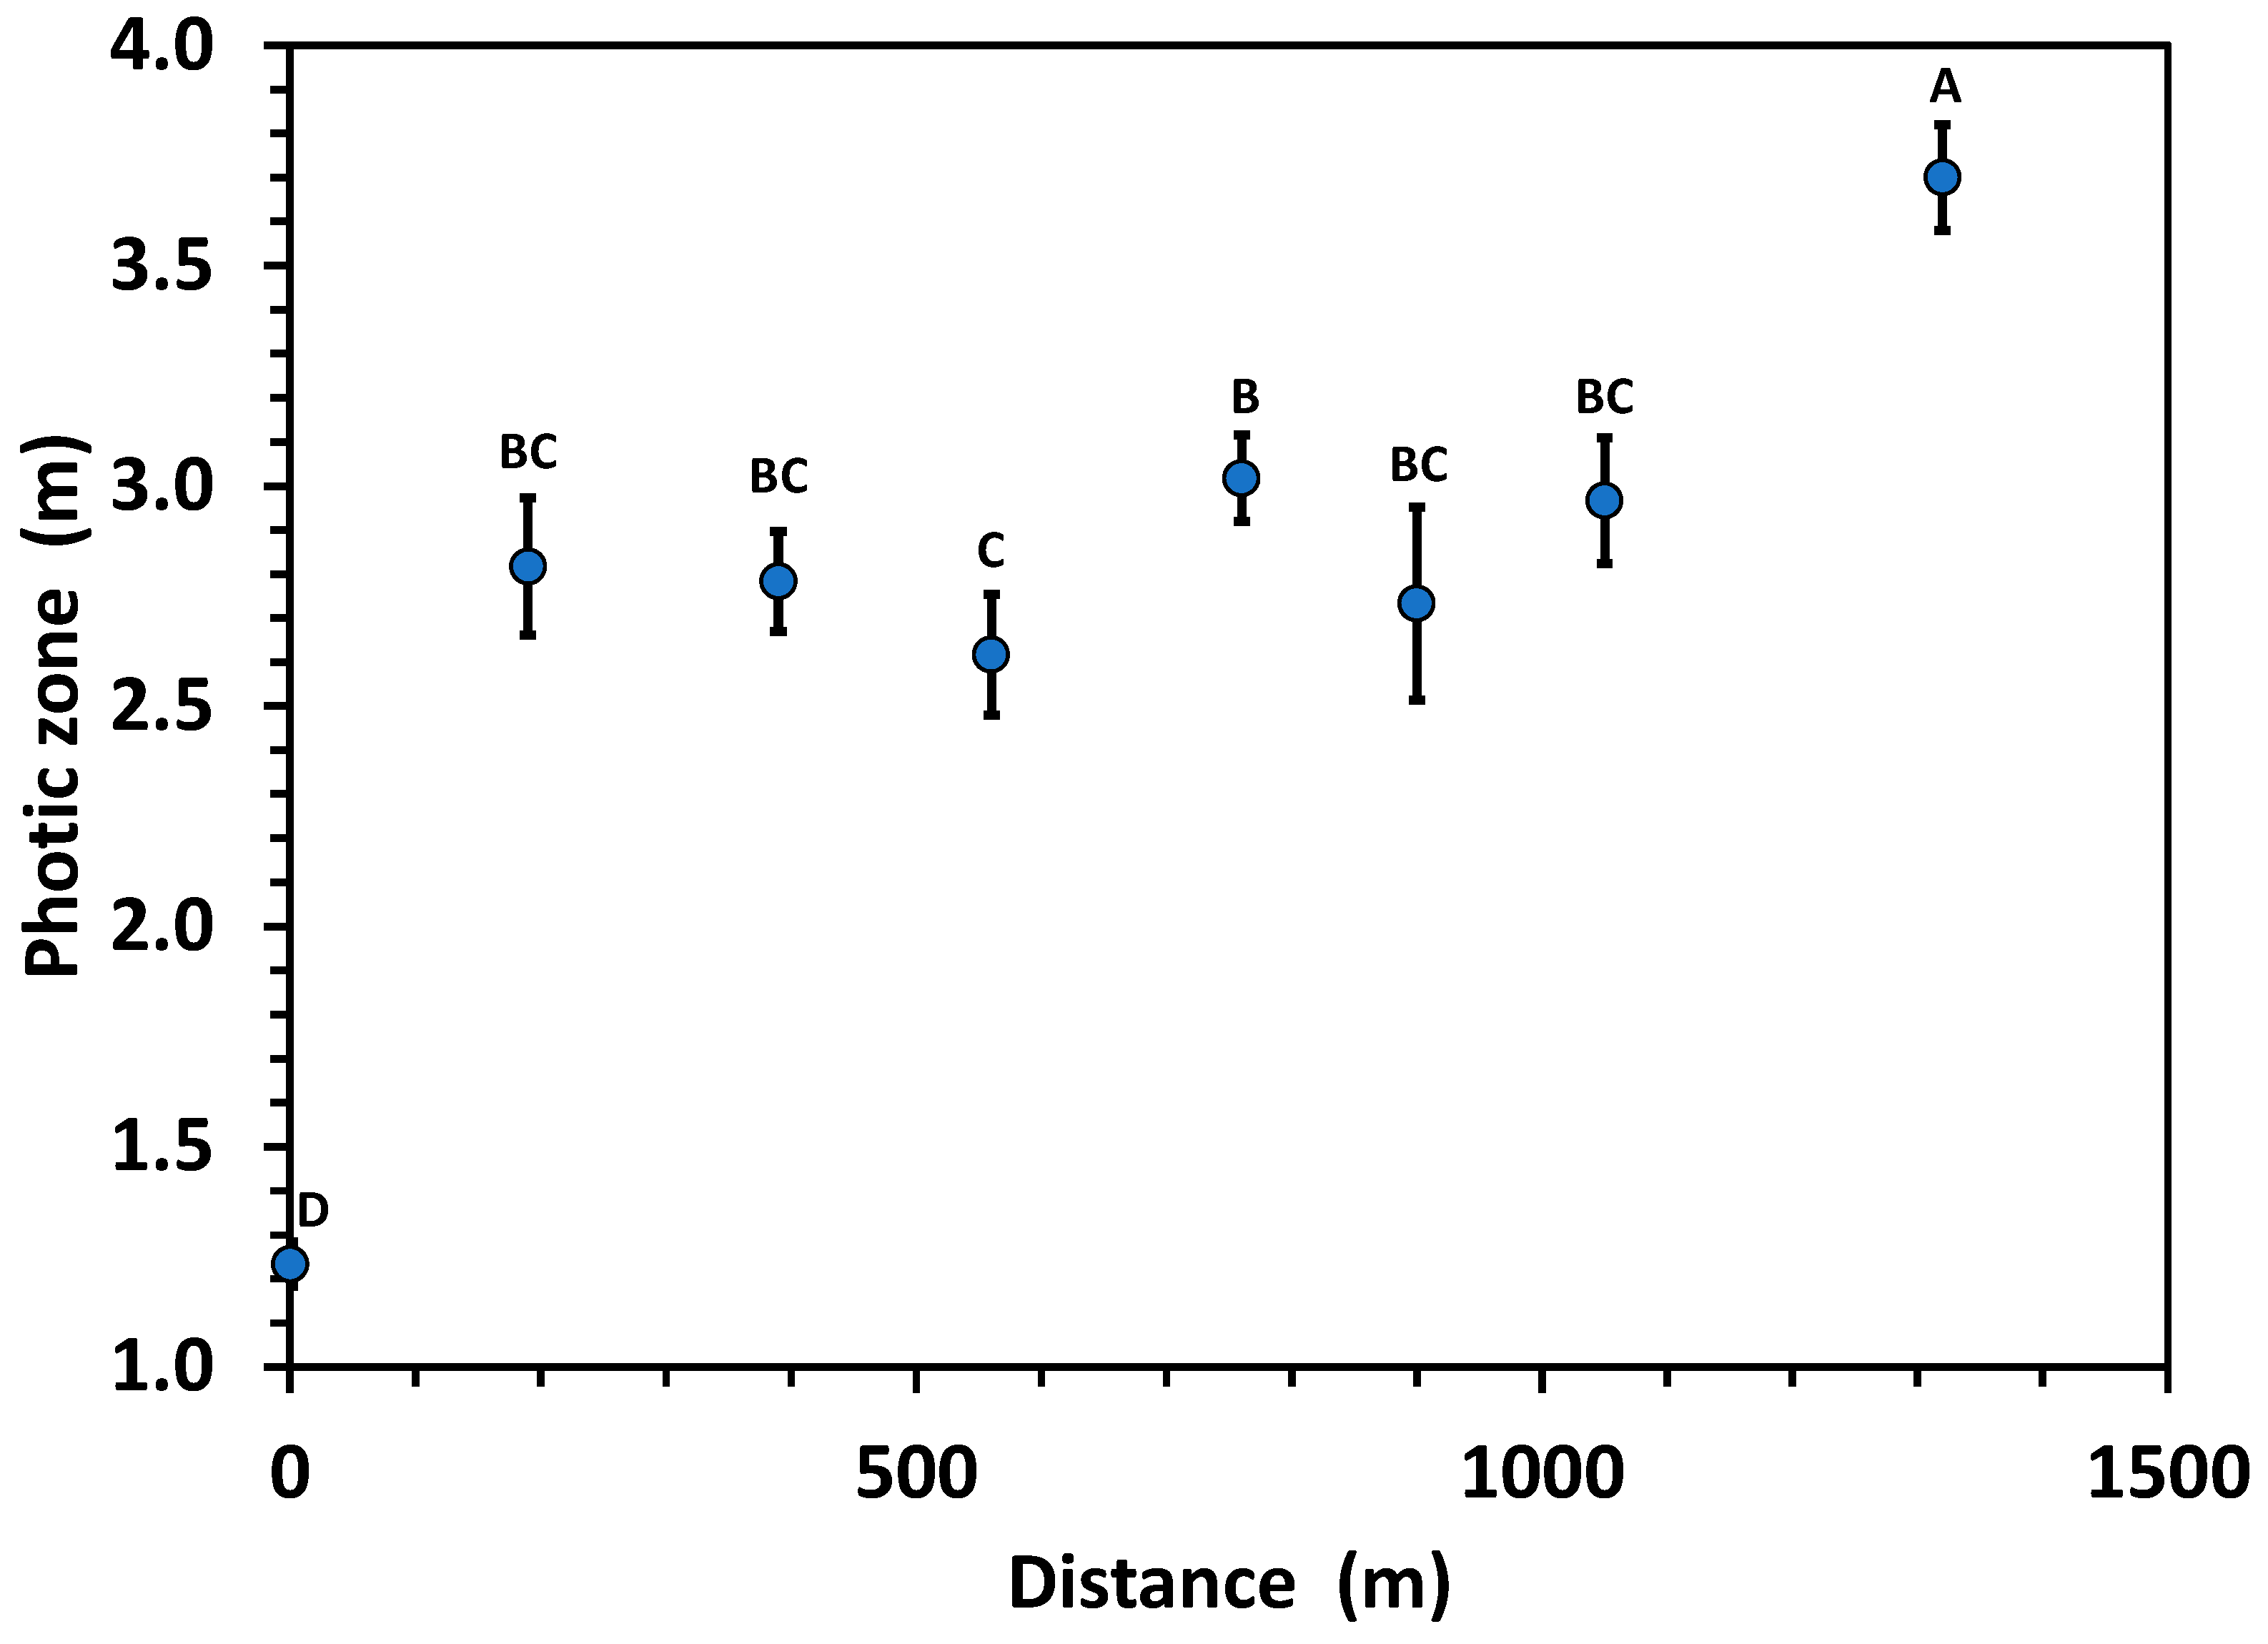
The results of this study reveal distinct patterns in the water quality of Thompson Bayou on both spatial and temporal scales. Regarding spatial patterns of measured parameters, there are three dominant influences on the water quality of Thompson Bayou. The first of these is the processing of water by the wetland, wherein the stream first reaches the UWF campus. Data at Site 1 underscore the essential ecosystem service of wetlands in improving water quality [17,18]. According to data collected by the Florida Department of Environmental Protection, the water from Thompson Bayou that reaches the UWF campus is greatly impacted by anthropogenic activity, with low pH (~5.4), low DO (~5 ppm), a shallow (<0.5 m) photic zone, and clearly detectable levels of synthetic compounds, including herbicides and dietary sweeteners. Most notably, pH of 5.4 is 10-fold more acidic than the minimum acceptable level (i.e., 6.5–8.5) for the State of Florida surface water criteria (USEPA 2004). At Site 1, just after the water had passed through the campus wetland, the photic zone was ~1.3 m, DO was ~7 ppm, and pH was ~7.0, the latter well within the acceptable range for surface water in Florida. The means for both the photic zone and DO continued to increase with distance, indicating a further improvement in water quality as Thompson Bayou drains toward the Escambia River (Figure 4 and Figure 5).
The second influence on spatial patterns of water quality comprises interactions of the stream channel with upland forest stands. For example, changes in pH from Site 2 and beyond likely reflect the importance of the longleaf pine-dominated uplands on stream chemistry. Gilliam et al. [20] found that upland soils had a mean pH of 4.67 ± 0.04. Furthermore, these soils are coarse-textured sands of the Troup series [21] consisting of very deep, excessively drained soils that formed in sandy and loamy marine sediments. Their well-drained nature, along with seasonally high water tables below a depth of 2 m throughout the year [21], suggest an intimate link between upland hydrology and Thompson Bayou.
Beyond this, the significant increase in pH from Sites 7 to 8 suggests the final influence on the general water quality of Thompson Bayou—the hydrology of the Escambia River (Figure 6). Escambia River-mediated effects on Thompson Bayou are even more pronounced for DO and, especially, SC. Both variables increased significantly with distance, with a notable increase in DO at Site 4 likely caused by dense macrophytes at that location (Figure 4). On the other hand, SC displayed a nearly linear pattern of increase from Site 1 to Site 8 (Figure 5). The Escambia River empties into Escambia Bay ~4 km from where Thompson Bayou joins the river.
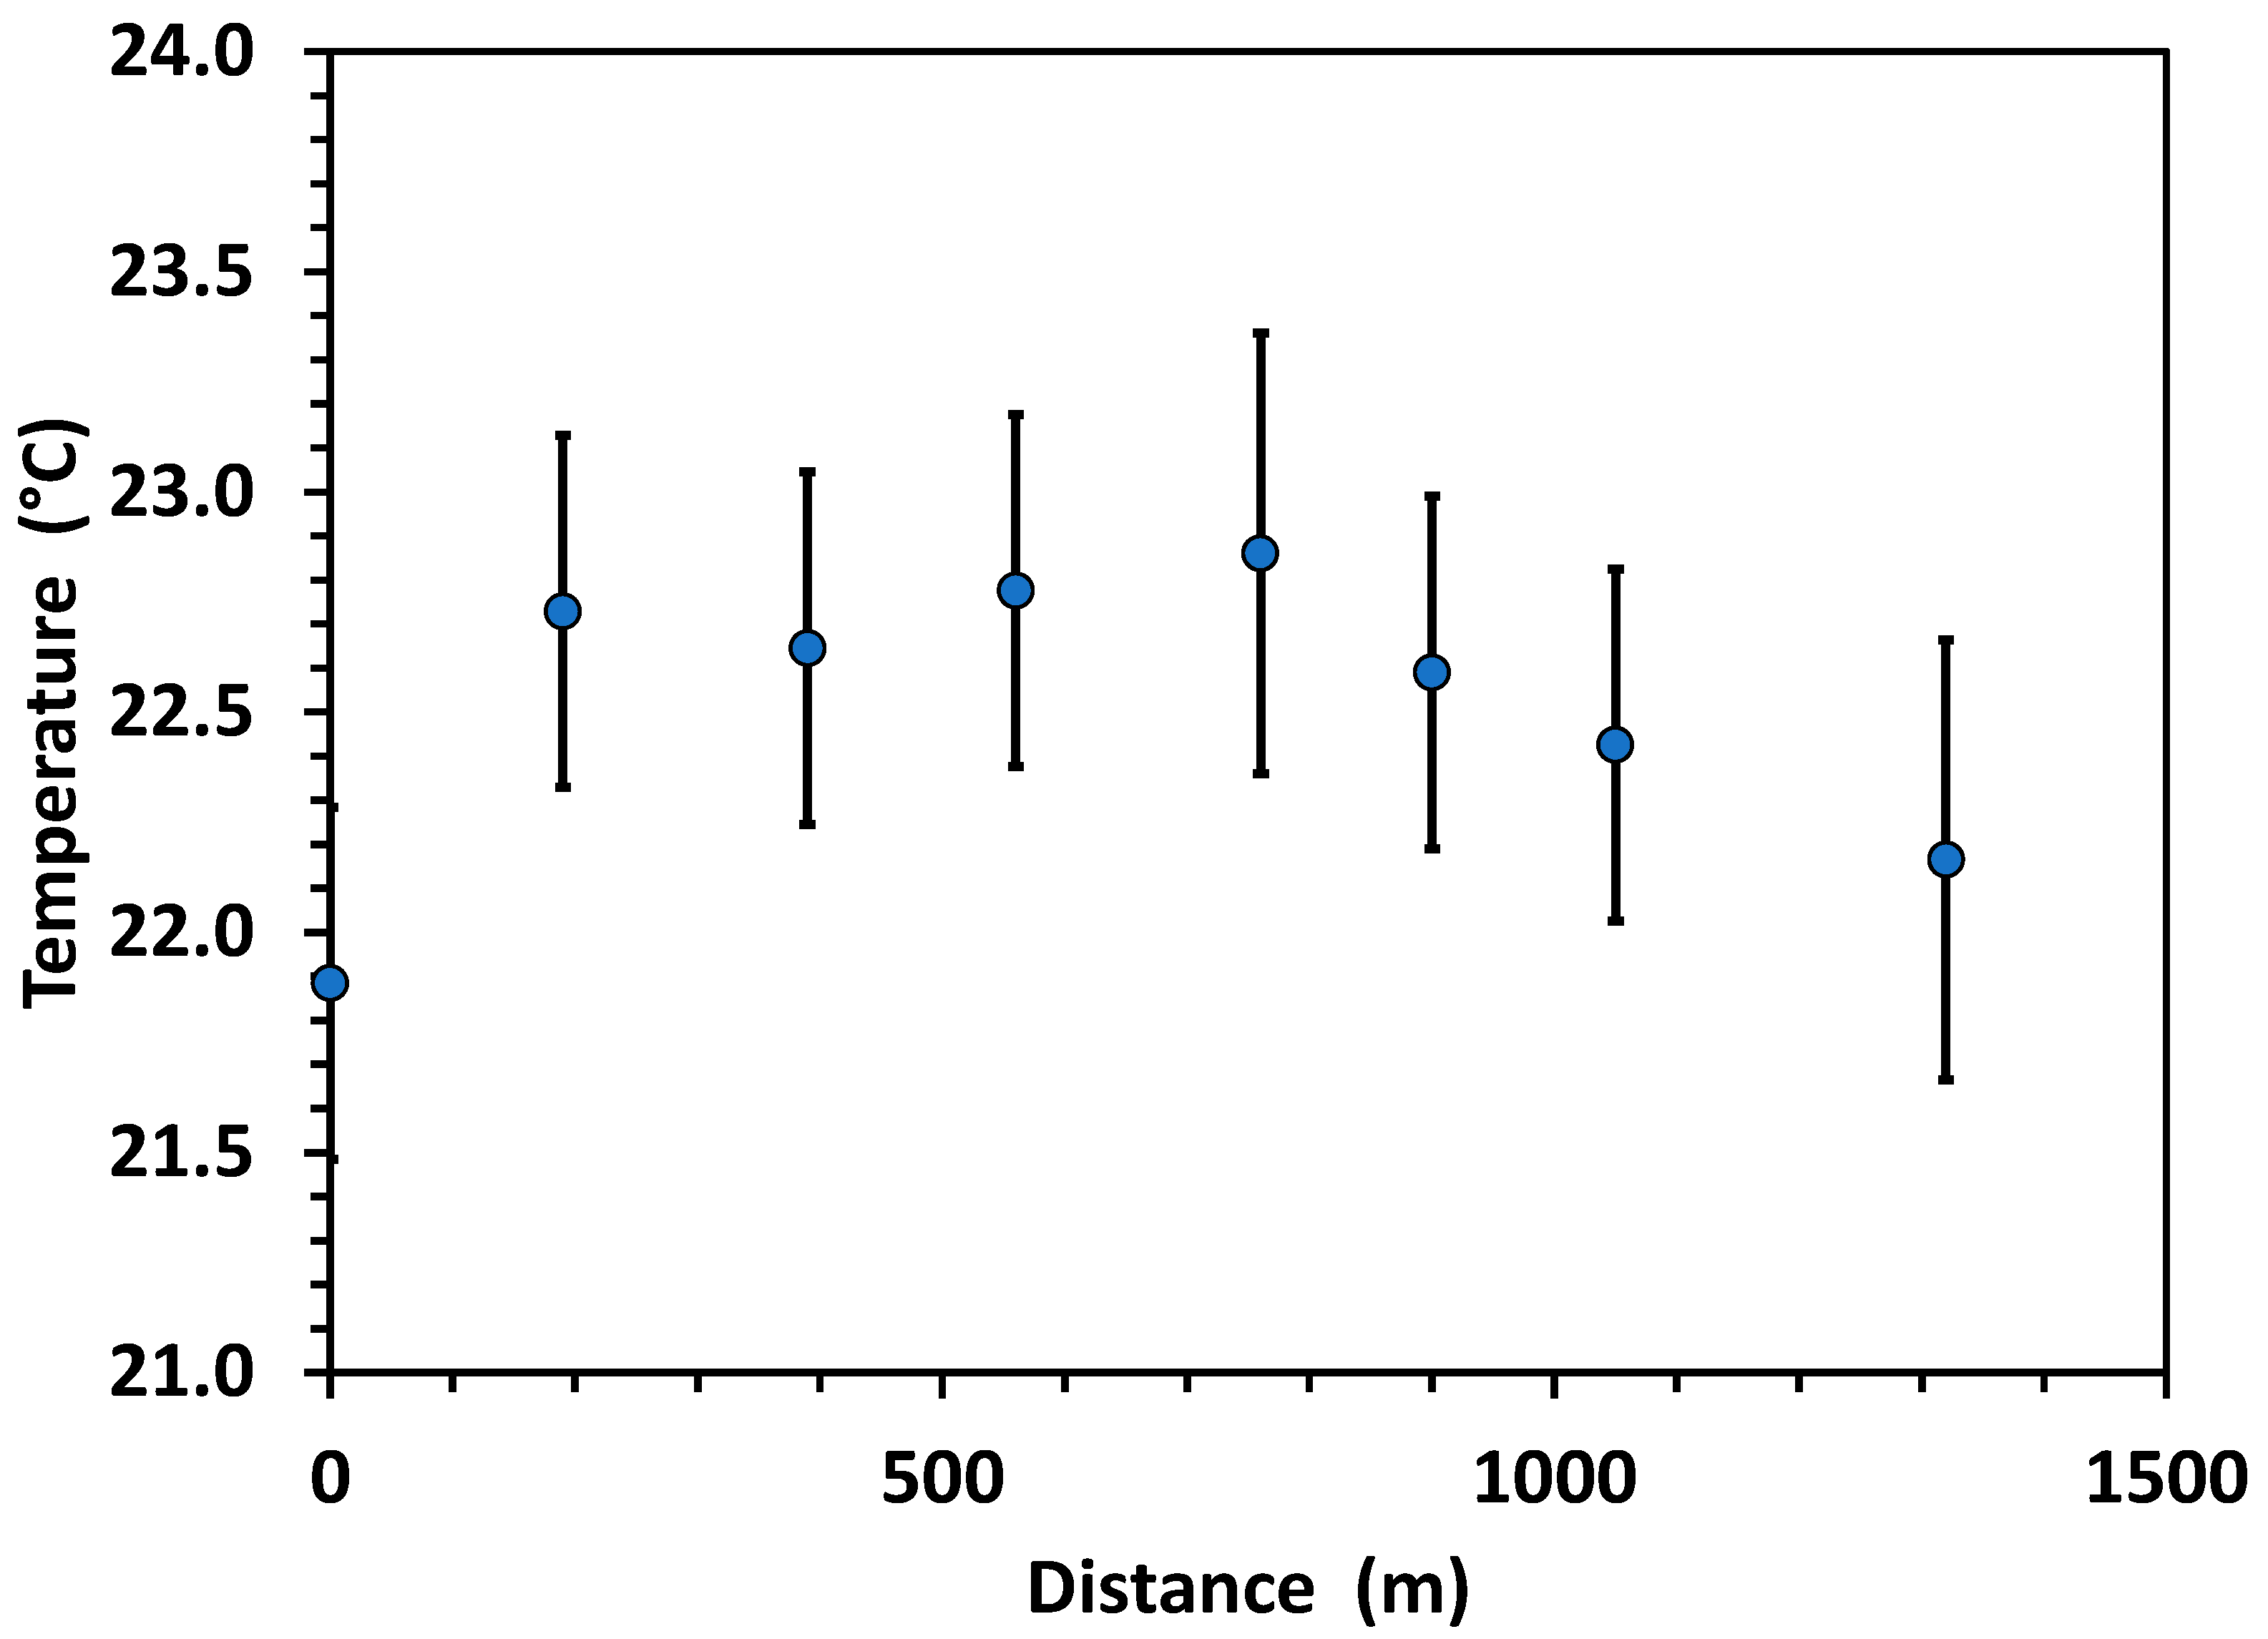
Finally, the lack of significant variation in temperature among sites confirms that the sampling was done quickly enough to avoid confounding time of day with true spatial variation (Figure 3). In fact, the site means varied only ~1 °C.
4.2. Temporal Patterns
Significant temporal patterns were apparent for all water quality variables. Unsurprisingly, this was most pronounced for temperature (Figure 8), which was significantly correlated with the measured ambient air temperature at the UWF meteorological station (r = 0.96, p < 0.0001; Table 1). That water temperature was also significantly correlated with precipitation (r = 0.89, p < 0.0001; Table 1) arose from the closely similar seasonal pattern of ambient air temperature and precipitation at this site. This arises from the northward shift of the Intertropical Convergence Zone in the summer that brings greater rainfall at a time of increasing air temperature [24].
The temporal pattern for DO was clearly the opposite of that for water temperature (Figure 8 and Figure 9) and was significantly and negatively correlated with ambient air temperature (Table 1). The solubility of O2 in water has long been known to be sensitive to temperature [25]. Indeed, although numerous factors potentially interact to influence DO concentrations of aquatic ecosystems, the temperature is often predominant [25]. A study of sharply contrasting rivers in Poland found a similar negative relationship between DO and temperature, including one river with fully vegetated banks and another unvegetated [26].
As with DO, numerous factors can influence the pH of the aquatic ecosystem. Among these, the more seasonally dynamic would be the autotrophic metabolism of phytoplankton as it is related to carbonation reactions of water:
CO2 + H2O ⇌ H2CO3 ⇌ H+ + HCO3−
As phytoplankton photosynthesize, they decrease the concentration of CO2, which in turn decreases the production of H+, resulting in higher pH. Furthermore, autotrophic metabolic rates increase with temperature [27,28]. Thus, we suggest that water temperature, as controlled by ambient air temperature (Table 1), is the principal driver of temporal patterns for pH (Figure 11).
Unique among measured parameters, SC displayed a distinctly bimodal pattern. In addition to an intermediate peak in May and June, there was a significantly higher peak in November and December (Figure 10). We suggest that this arises from the tidal flux (i.e., the height difference between high and low tides) of Escambia Bay, which can, at times, approach 1 m. The NOAA tidal station from which we obtained our flux data is <4 km from where Escambia River enters the Bay, which is <3 km from Site 8 (Figure 1). There is considerable inter-diel variability, with minimal flux (e.g., ~0.1 m) for periods of 2–3 days. There is, however, an even greater degree of seasonal variation, with higher fluxes in winter and summer months (Figure 12), consistent with seasonal and nodal variations of predominant tidal constituents in oceans on a global scale [29]. Superimposed on the seasonality of tidal flux is the seasonality of salinity of the Pensacola Bay system which includes Escambia Bay [30,31,32]. Juhl and Murrell [30] found that salinity within this system nearly doubled from spring/fall minima of ~15 ppt to summer/winter maxima of nearly 30 ppt. Thus, the higher tidal fluxes of the summer and winter periods are directly associated with water of higher salinity.
5. Conclusions
Our study arose from the unique circumstance of a highly impacted stream coming to a university campus at a wetland and continuing through a natural landscape en route to a river displaying tidal dynamics. These results confirm the innate value of monitoring studies to understand the spatial and temporal dynamics of aquatic ecosystems [33]. Furthermore, because of the unique setting of Thompson Bayou as part of the greater UWF campus, this study also demonstrates the heuristic value of monitoring as a component of research by students, which, in this case, adds to previous work on the ecology of the UWF campus [19,20,21]. Our results show that quite common analytes in assessing water quality—depth of photic zone, temperature, pH, DO, and SC [9,10,11]—exhibit distinct spatial and temporal patterns. Among the factors influencing these patterns are (1) processing of water by a wetland, (2) interactions of the stream channel with upland forest stands, and (3) the hydrology of the Escambia River. This work also provides an important baseline for use in assessing the effects of disturbances, e.g., tropical cyclones, that occur in this region.
Author Contributions
Conceptualization, F.S.G. and J.W.H.; methodology, F.S.G.; software, F.S.G.; validation, F.S.G.; formal analysis, F.S.G.; investigation, J.W.H., J.A.W. and R.L.L.; data curation, R.L.L.; writing—original draft preparation, F.S.G.; writing—review and editing, J.W.H., J.A.W. and R.L.L.; visualization, F.S.G.; supervision, F.S.G.; project administration, F.S.G. All authors have read and agreed to the published version of the manuscript.
Funding
This research received no external funding.
Data Availability Statement
Data are available upon request to the corresponding author.
Acknowledgments
We acknowledge the essential contribution of Jane Caffrey for the use of her laboratory and, especially, her analytical equipment. We also thank Mackenzie Rothfus for her assistance in maintaining the calibration of the equipment, and Jim Hammond and Jaromy Kuhl for logistical support.
Conflicts of Interest
The authors declare no conflict of interest.
References
- Likens, G.E.; Bormann, F.H. Linkages between terrestrial and aquatic ecosystems. BioScience 1974, 24, 447–456. [Google Scholar] [CrossRef]
- Likens, G.E.; Bormann, F.H. Biogeochemistry of a Forested Ecosystem, 2nd ed.; Springer: New York, NY, USA, 1995. [Google Scholar]
- Adams, M.B.; DeWalle, D.R.; Hom, J. The Fernow Watershed Acidification Study; Environmental Pollution Series 11; Springer: New York, NY, USA, 2006. [Google Scholar]
- Johnson, S.L.; Henshaw, D.; Downing, G.; Wondzell, S.; Schulze, M.; Kennedy, A.; Cohn, G.; Schmidt, S.A.; Jones, J.A. Long-term hydrology and aquatic biogeochemistry data from H. J. Andrews Experimental Forest, Cascade Mountains, Oregon. Hydrol. Process. 2021, 35, e14187. [Google Scholar] [CrossRef]
- Miniat, C.F.; Oishi, A.C.; Bolstad, P.V.; Jackson, C.R.; Liu, N.; Love, J.P.; Pringle, C.M.; Solomon, K.J.; Wurzburger, N. The Coweeta Hydrologic Laboratory and the Coweeta Long-Term Ecological Project. Hydrol. Process. 2021, 35, e14302. [Google Scholar] [CrossRef]
- Eneji, I.S.; Onuche, A.P.; Sha’Ato, R. Spatial and temporal variation in water quality of River Benue, Nigeria. J. Environ. Prot. 2012, 3, 915–921. [Google Scholar] [CrossRef]
- Wunderlin, D.A.; Díaz, M.D.; Amé, M.V.; Pesce, S.F.; Hued, A.C.; Bistroni, M.D. Pattern recognition techniques for the evaluation of spatial and temporal variations in water quality. A case study: Suquía River Basin (Córdoba-Argentina). Water Res. 2001, 35, 2881–2894. [Google Scholar]
- Pant, R.R.; Zhang, F.; Rehman, F.U.; Wang, G.; Ye, M.; Zeng, C.; Tang, H. Spatiotemporal variations of hydrogeochemistry and its controlling factors in the Gandaki River Basin, Central Himalaya Nepal. Sci. Total Environ. 2018, 622–623, 770–782. [Google Scholar] [CrossRef]
- Varol, M.; Gökot, B.; Bekleyen, A.; Şen, B. Spatial and temporal variations in surface water quality of the dam reservoirs in the Tigris River basin, Turkey. Catena 2012, 92, 11–21. [Google Scholar] [CrossRef]
- Singh, K.P.; Malik, A.; Mohan, D.; Sinha, S. Multivariate statistical techniques for the evaluation of spatial and temporal variations in water quality of Gomti River (India)—A case study. Water Res. 2004, 38, 3980–3992. [Google Scholar] [CrossRef]
- Gold, A.C.; Thompson, S.P.; Magel, C.L.; Piehler, M.F. Urbanization alters coastal plain stream carbon export and dissolved oxygen dynamics. Sci. Total Environ. 2020, 747, 141132. [Google Scholar] [CrossRef]
- Mei, K.; Liao, L.; Zhu, Y.; Lu, P.; Wang, Z.; Dahlgren, R.A.; Zhang, M. Evaluation of spatial-temporal variations and trends in surface water quality across a rural-suburban-urban interface. Environ. Sci. Pollut. Res. 2014, 21, 8036–8051. [Google Scholar] [CrossRef]
- Ignatius, A.R.; Rasmussen, T.C. Small reservoir effects on headwater water quality in the rural-urban fringe, Georgia Piedmont, USA. J. Hydrol. Reg. Stud. 2016, 8, 145–161. [Google Scholar] [CrossRef] [Green Version]
- Seeboonruang, U. A statistical assessment of the impact of land uses on surface water quality indexes. J. Environ. Manag. 2012, 101, 134–142. [Google Scholar] [CrossRef] [PubMed]
- Simeonov, V.; Stratis, J.A.; Samara, C.; Zachariadis, G.; Voutsa, D.; Anthemidis, A.; Sofoniou, M.; Kouimtzis, T. Assessment of the surface water quality in Northern Greece. Water Res. 2003, 37, 4119–4124. [Google Scholar] [CrossRef]
- Cardinale, B.J. Biodiversity improves water quality through niche partitioning. Nature 2011, 472, 86–91. [Google Scholar] [CrossRef] [PubMed]
- Mitsch, W.J.; Gosselink, J.G. The value of wetlands: Importance of scale and landscape setting. Ecol. Econ. 2000, 35, 25–33. [Google Scholar] [CrossRef]
- Xu, X.; Chen, M.; Yang, G.; Jiang, B.; Zhang, J. Wetland ecosystem services research: A critical review. Glob. Ecol. Conserv. 2020, 22, e01027. [Google Scholar] [CrossRef]
- Gilliam, F.S.; Harmon, E.E.; Boyles, S.C. The University of West Florida campus ecosystem study: Gopher tortoise and longleaf pine populations in an urban interface. Urban Ecosyst. 2000, 23, 355–362. [Google Scholar] [CrossRef]
- Gilliam, F.S.; Detzel, S.J.; Bray, K.D.; Major, E.A. The University of West Florida campus ecosystem study: The college/university campus as a unit for study of the ecology of longleaf pine. Urban Ecosyst. 2021, 24, 1073–1082. [Google Scholar] [CrossRef]
- Gilliam, F.S.; Patten, H.N.; Rabinowitz, S.K. The University of West Florida campus ecosystem study: Age-diameter and growth relationships of longleaf pine using hurricane-induced windthrows. Urban Ecosyst. 2022, 25, 839–848. [Google Scholar] [CrossRef]
- Gilliam, F.S. Impacts of tropical cyclones on longleaf pine ecosystems of Florida: Tropical cyclogenesis, landfall frequencies, and climate change. Front. Ecol. Evol. 2021, 9, 595791. [Google Scholar] [CrossRef]
- Zar, J.H. Biostatistical Analysis, 5th ed.; Prentice-Hall: Upper Saddle River, NJ, USA, 2009. [Google Scholar]
- McGee, D.; Moreno-Chamarro, E.; Green, B.; Marshall, J.; Galbraith, E.; Bradtmiller, L. Hemispherically asymmetric trade wind changes as signatures of past ITCZ shifts. Quat. Sci. Rev. 2018, 180, 214–228. [Google Scholar] [CrossRef]
- Demars, B.O.L.; Manson, J.R.; Olafsson, J.S.; Gislason, G.M.; Gudmundsdottir, R.; Woodward, G.; Reiss, J.; Pichler, D.; Rasmussen, J.J.; Friberg, N. Temperature and the metabolic balance of streams. Freshw. Biol. 2011, 56, 1106–1121. [Google Scholar] [CrossRef]
- Rajwa-Kuligiewicz, A.; Bialik, R.J.; Rowiński, P.M. Dissolved oxygen and water temperature dynamics in lowland rivers over various time scales. J. Hydrol. Hydromech. 2015, 63, 353–363. [Google Scholar] [CrossRef]
- Proum, S.; Santos, J.H.; Lim, L.H.; Marshall, D.J. Tidal and seasonal variation in carbonate chemistry, pH, and salinity for a mineral-acidified tropical estuarine system. Reg. Stud. Mar. Sci. 2018, 17, 17–27. [Google Scholar] [CrossRef]
- Regoudie-de-Gioux, A.; Duarte, C.M. Temperature dependence of planktonic metabolism in the ocean. Glob. Biogeochem. Cycles 2012, 26, GB1015. [Google Scholar] [CrossRef]
- Cao, A.; Guo, Z.; Qi, X.; Li, P.; He, H. Seasonal and nodal variations of predominant tidal constituents in the global ocean. Cont. Shelf Res. 2021, 217, 104372. [Google Scholar] [CrossRef]
- Juhl, A.R.; Murrell, M.C. Nutrient limitation of phytoplankton growth and physiology in a subtropical estuary (Pensacola Bay, Florida. Bull. Mar. Sci. 2008, 82, 59–82. [Google Scholar]
- Murrell, M.C.; Stanley, R.S.; Lores, E.M.; DiDonato, G.T.; Smith, L.M.; Flemer, D.A. Evidence that phosphorus limits phytoplankton growth in a Gulf of Mexico estuary: Pensacola Bay, Florida, USA. Bull. Mar. Sci. 2002, 70, 155–167. [Google Scholar]
- United States Environmental Protection Agency (USEPA). The ecological condition of the Pensacola Bay System, Northwest Florida (1994–2001); EPA620-R-05-002; U.S. Environmental Protection Agency: Washington, DC, USA, 2004. [Google Scholar]
- Beard, G.R.; Scott, W.A.; Adamson, J.K. The value of consistent methodology in long-term environmental monitoring. Environ. Monit. Assess. 1999, 54, 239–258. [Google Scholar] [CrossRef]
Figure 1.
Google Earth image of Thompson Bayou as it extends through the natural areas of the campus of the University of West Florida, along with locations of the eight sample sites, and to the Escambia River. Part of the main campus is shown bottom center. For scale, the distance between sites 1 and 2 is 190 m.

Figure 2.
Mean monthly temperature (Tmean) and precipitation (Ppt) for the study site during the sample period that extended from March 2020 to February 2021 (see Materials and Methods).
Figure 2.
Mean monthly temperature (Tmean) and precipitation (Ppt) for the study site during the sample period that extended from March 2020 to February 2021 (see Materials and Methods).

Figure 3.
Mean temperature (±1 SE) as a function of distance along the sample transect (see Figure 1). The mean temperature did not vary significantly at p < 0.05.
Figure 3.
Mean temperature (±1 SE) as a function of distance along the sample transect (see Figure 1). The mean temperature did not vary significantly at p < 0.05.

Figure 4.
Mean photic zone depth (±1 SE) as a function of distance along the sample transect (see Figure 1). Means with the same letter are not significantly different at p < 0.05.
Figure 4.
Mean photic zone depth (±1 SE) as a function of distance along the sample transect (see Figure 1). Means with the same letter are not significantly different at p < 0.05.

Figure 5.
Mean dissolved O2 (±1 SE) as a function of distance along the sample transect (see Figure 1). Means with the same letter are not significantly different at p < 0.05.
Figure 5.
Mean dissolved O2 (±1 SE) as a function of distance along the sample transect (see Figure 1). Means with the same letter are not significantly different at p < 0.05.

Figure 6.
Mean specific conductivity (±1 SE) as a function of distance along the sample transect (see Figure 1). Means with the same letter are not significantly different at p < 0.05.
Figure 6.
Mean specific conductivity (±1 SE) as a function of distance along the sample transect (see Figure 1). Means with the same letter are not significantly different at p < 0.05.

Figure 7.
Mean pH (±1 SE) as a function of distance along the sample transect (see Figure 1). Means with the same letter are not significantly different at p < 0.05.
Figure 7.
Mean pH (±1 SE) as a function of distance along the sample transect (see Figure 1). Means with the same letter are not significantly different at p < 0.05.

Figure 8.
Monthly mean water temperature for all sites combined (heavy black line). Means with the same letter are not significantly different at p < 0.05. Shown also are monthly means for individual sites (S1–S8).
Figure 8.
Monthly mean water temperature for all sites combined (heavy black line). Means with the same letter are not significantly different at p < 0.05. Shown also are monthly means for individual sites (S1–S8).

Figure 9.
Monthly mean dissolved O2 for all sites combined (heavy black line). Means with the same letter are not significantly different at p < 0.05. Shown also are monthly means for individual sites (S1–S8).
Figure 9.
Monthly mean dissolved O2 for all sites combined (heavy black line). Means with the same letter are not significantly different at p < 0.05. Shown also are monthly means for individual sites (S1–S8).

Figure 10.
Monthly mean specific conductivity for all sites combined (heavy black line). Means with the same letter are not significantly different at p < 0.05. Shown also are monthly means for individual sites (S1–S8).
Figure 10.
Monthly mean specific conductivity for all sites combined (heavy black line). Means with the same letter are not significantly different at p < 0.05. Shown also are monthly means for individual sites (S1–S8).

Figure 11.
Monthly mean pH for all sites combined (heavy black line). Means with the same letter are not significantly different at p < 0.05. Shown also are monthly means for individual sites (S1–S8).
Figure 11.
Monthly mean pH for all sites combined (heavy black line). Means with the same letter are not significantly different at p < 0.05. Shown also are monthly means for individual sites (S1–S8).

Figure 12.
Mean daily tidal flux (±1 SE) by month during the study period. Means with the same letter are not significantly different at p < 0.05.
Figure 12.
Mean daily tidal flux (±1 SE) by month during the study period. Means with the same letter are not significantly different at p < 0.05.


Table 1.
Pearson product-moment correlation matrix of water temperature (Twater), dissolved oxygen (DO), specific conductivity (SC), and pH of Thompson Bayou with ambient temperature and total monthly precipitation. Values shown are correlation coefficients with p values in parentheses. Significant correlations (p < 0.05) are indicated in bold.
| Analyte | Temperature | Precipitation |
|---|---|---|
| Twater | 0.959 | 0.891 |
| (0.000) | (0.000) | |
| DO | −0.875 | −0.828 |
| (0.000) | (0.001) | |
| SC | −0.251 | −0.432 |
| (0.432) | (0.161) | |
| pH | −0.372 | −0.582 |
| (0.233) | (0.047) |
Publisher’s Note: MDPI stays neutral with regard to jurisdictional claims in published maps and institutional affiliations. |
© 2022 by the authors. Licensee MDPI, Basel, Switzerland. This article is an open access article distributed under the terms and conditions of the Creative Commons Attribution (CC BY) license (https://creativecommons.org/licenses/by/4.0/).
Share and Cite
MDPI and ACS Style
Gilliam, F.S.; Hardin, J.W.; Williams, J.A.; Lackaye, R.L. The University of West Florida Campus Ecosystem Study: Spatial and Temporal Variation in Water Quality at Thompson Bayou. Water 2022, 14, 2916. https://doi.org/10.3390/w14182916
AMA Style
Gilliam FS, Hardin JW, Williams JA, Lackaye RL. The University of West Florida Campus Ecosystem Study: Spatial and Temporal Variation in Water Quality at Thompson Bayou. Water. 2022; 14(18):2916. https://doi.org/10.3390/w14182916
Chicago/Turabian StyleGilliam, Frank S., Jacob W. Hardin, Jacob A. Williams, and Rachel L. Lackaye. 2022. "The University of West Florida Campus Ecosystem Study: Spatial and Temporal Variation in Water Quality at Thompson Bayou" Water 14, no. 18: 2916. https://doi.org/10.3390/w14182916
Note that from the first issue of 2016, this journal uses article numbers instead of page numbers. See further details here.