
Contamination Assessment and Source Analysis of Urban Waterways Based on Bayesian and Principal Component Analysis—A Case Study of Fenjiang River

Abstract
:1. Introduction
2. Study Area
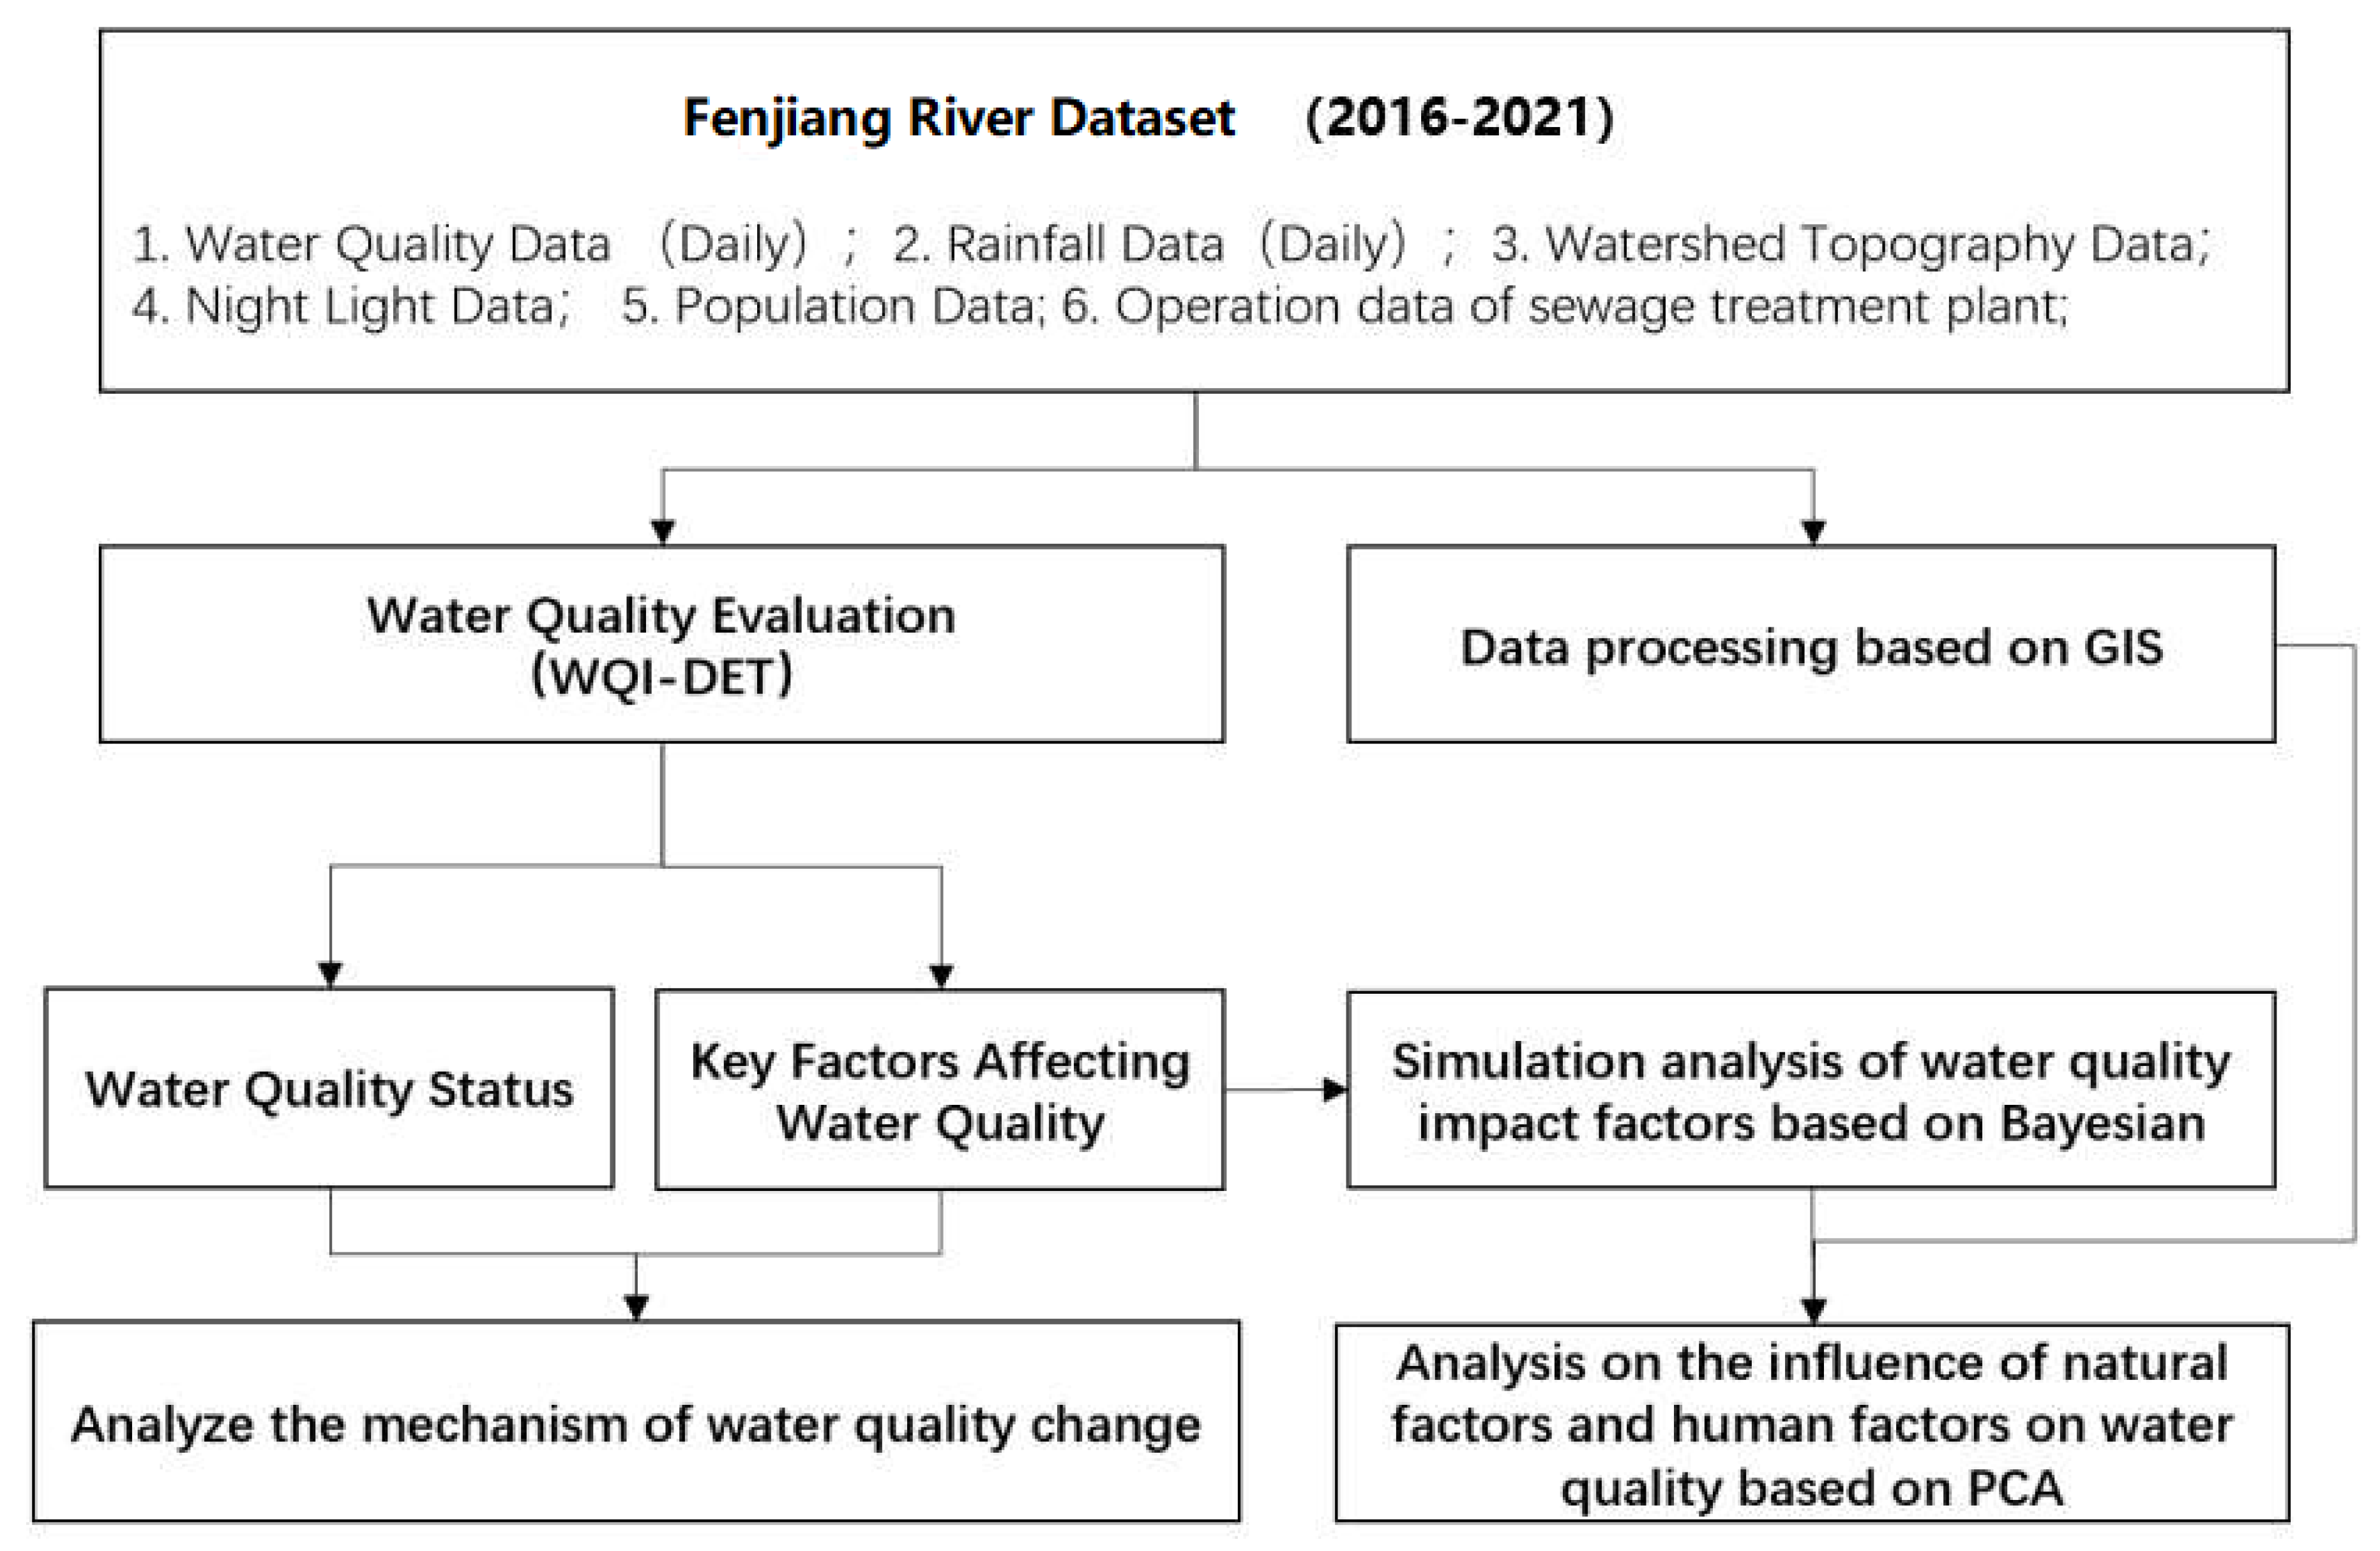
3. Methods and Data
3.1. Methods
3.2. Water Quality Monitoring Data
3.3. Human Social Activity Data
3.3.1. Selection of Human Social Activity Data
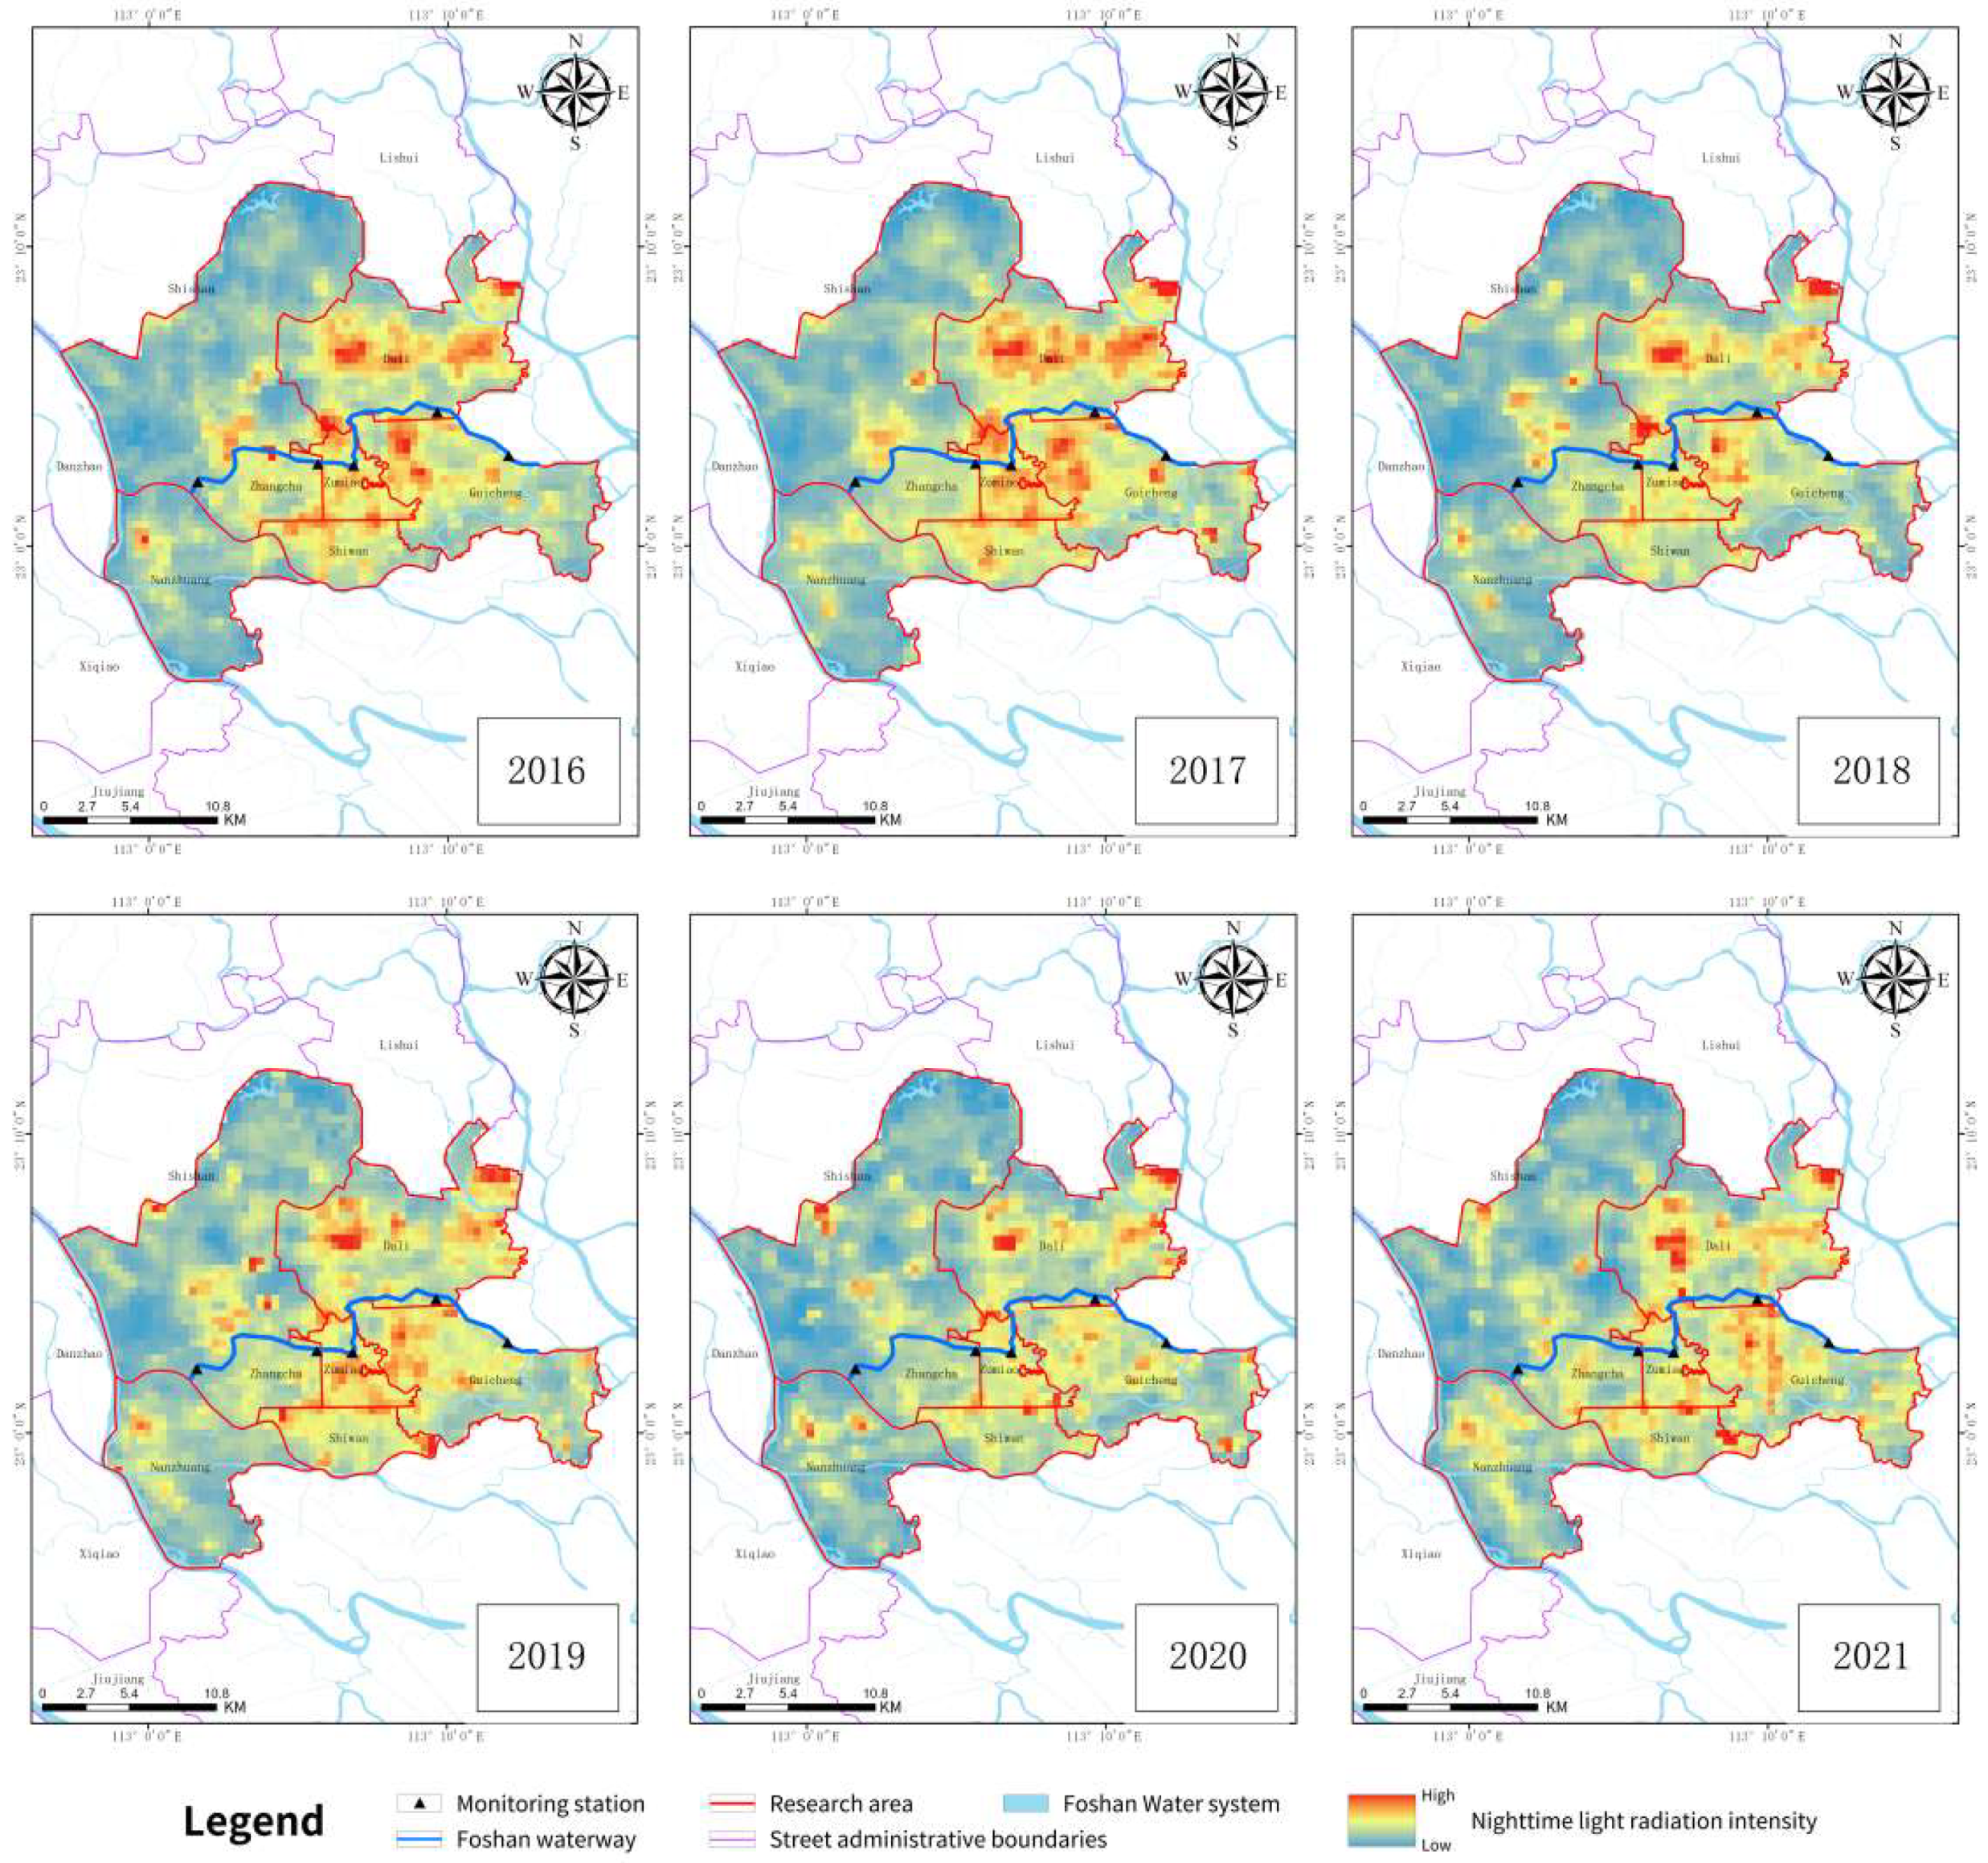
3.3.2. Night Light Intensity
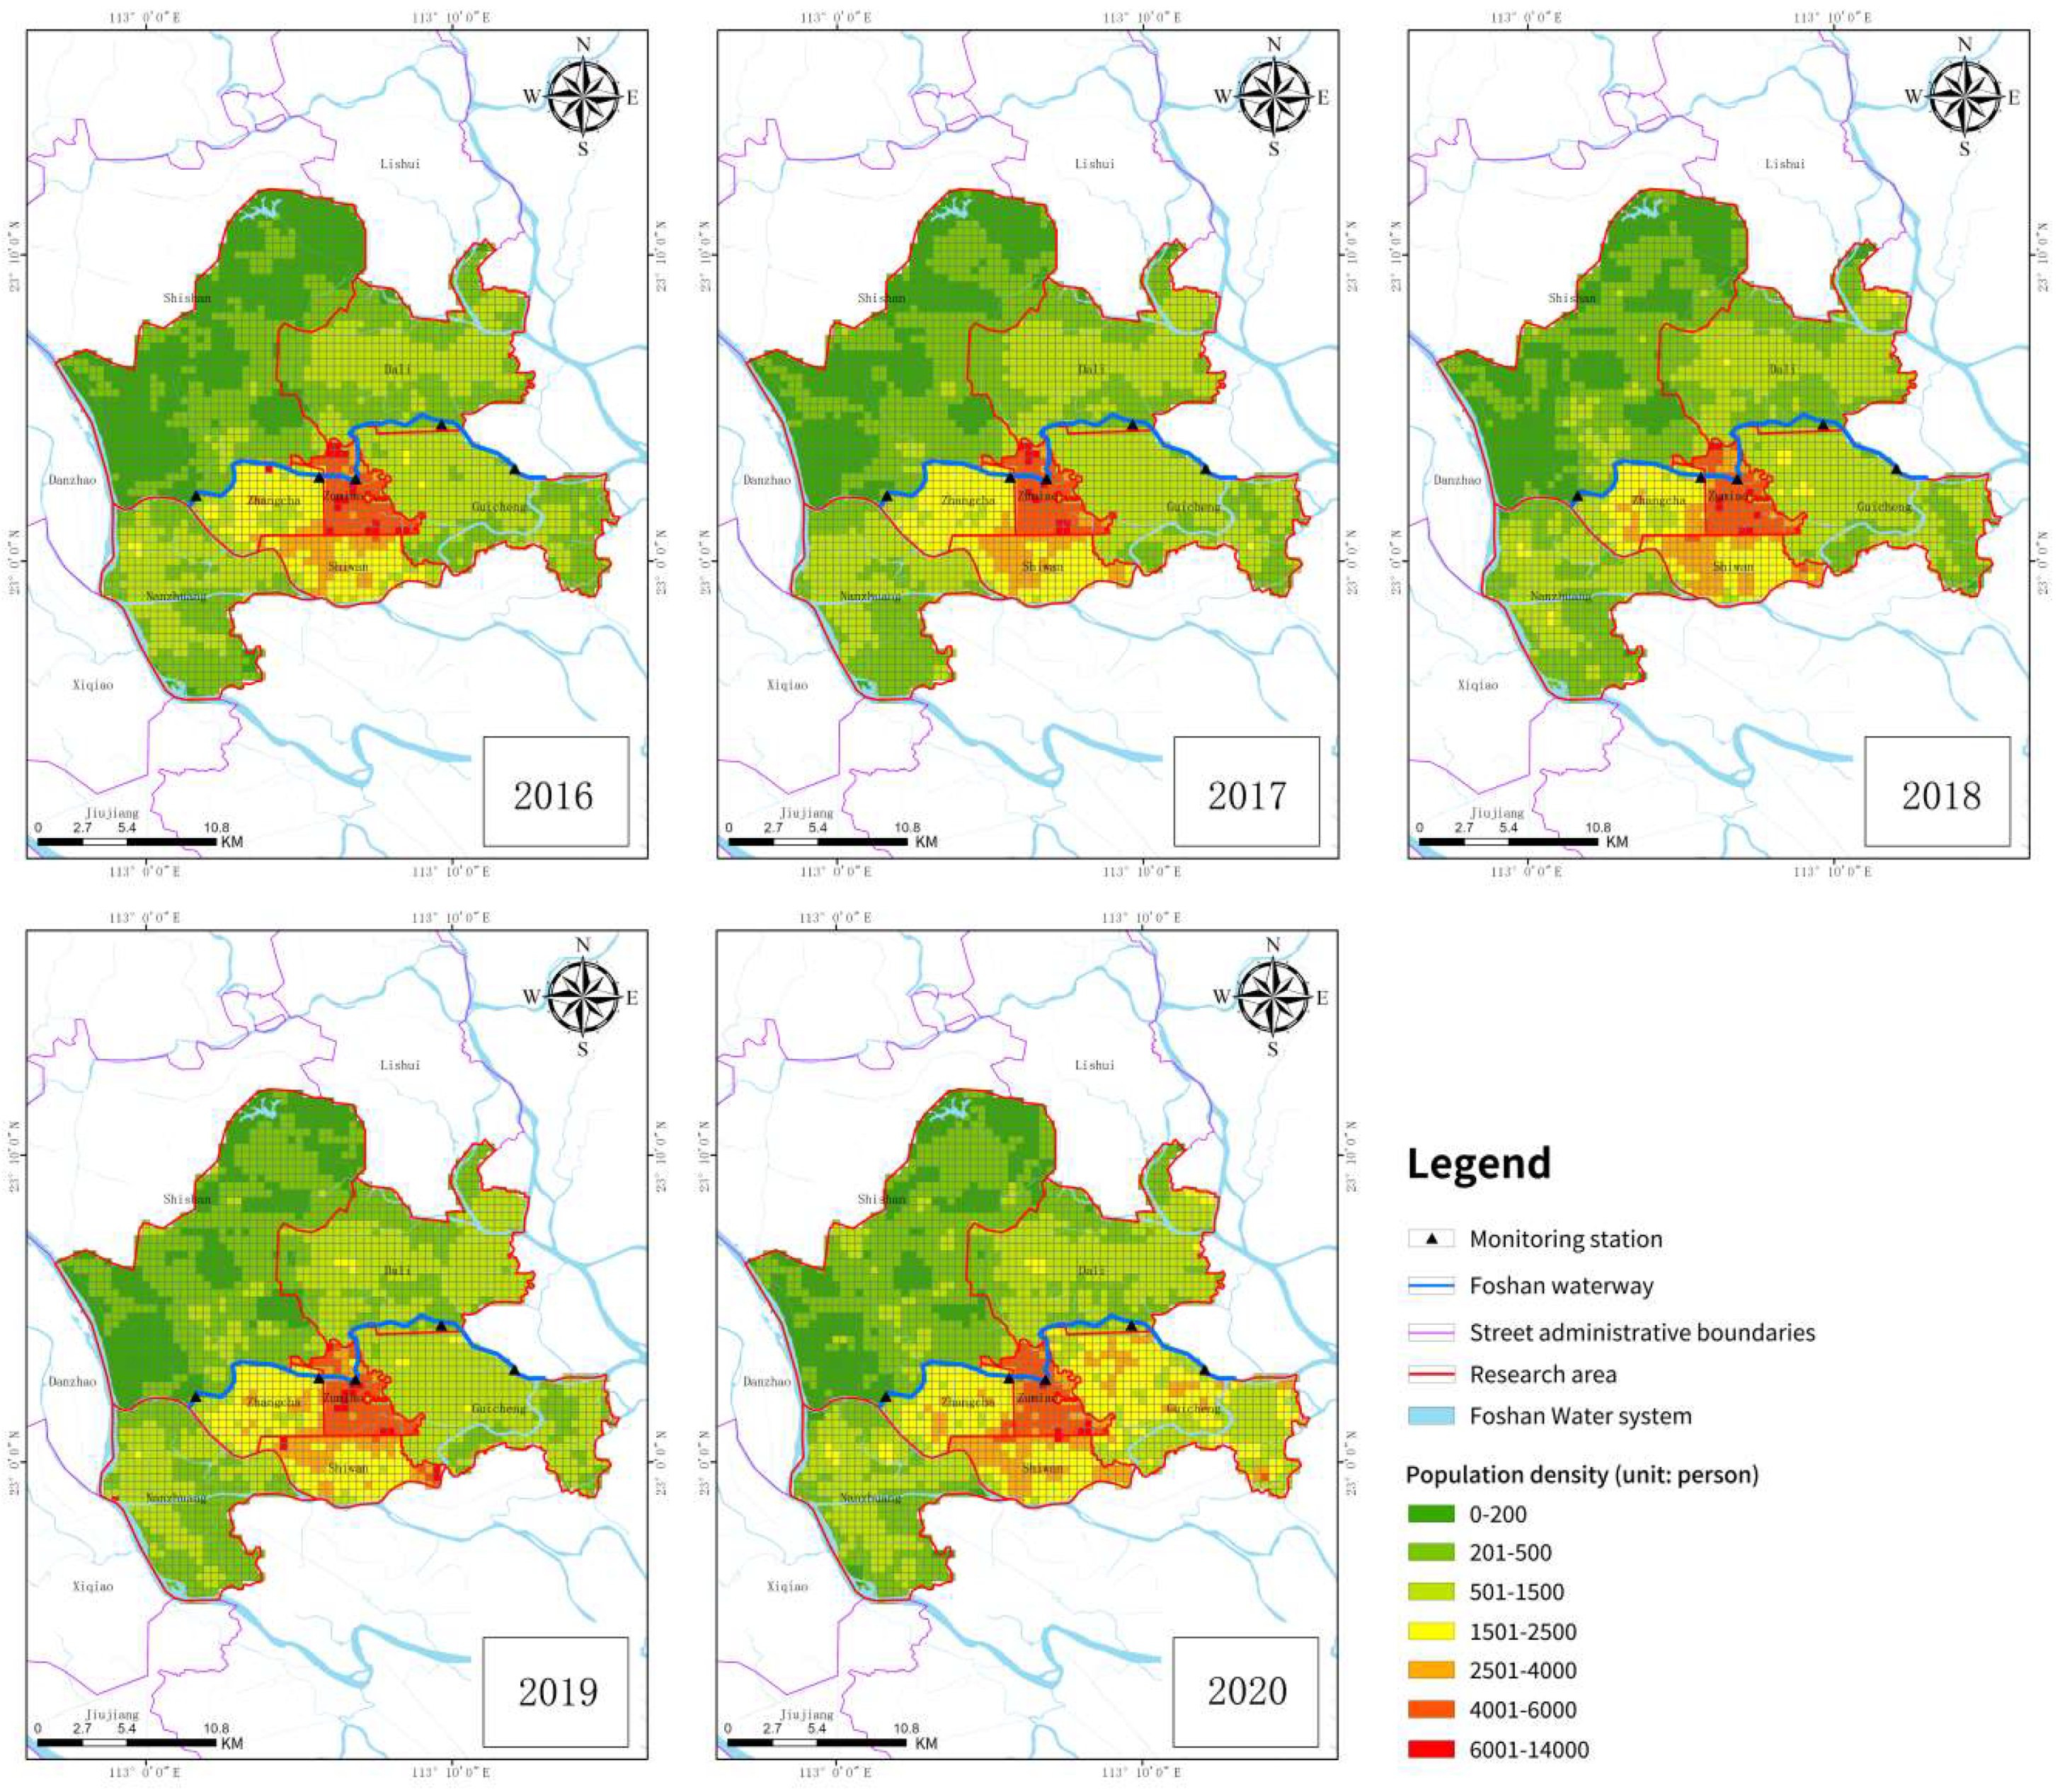
3.3.3. Population
3.3.4. Operation Data of Sewage Treatment Plant
4. Results
4.1. Overall Water Quality Based on the WQI-DET
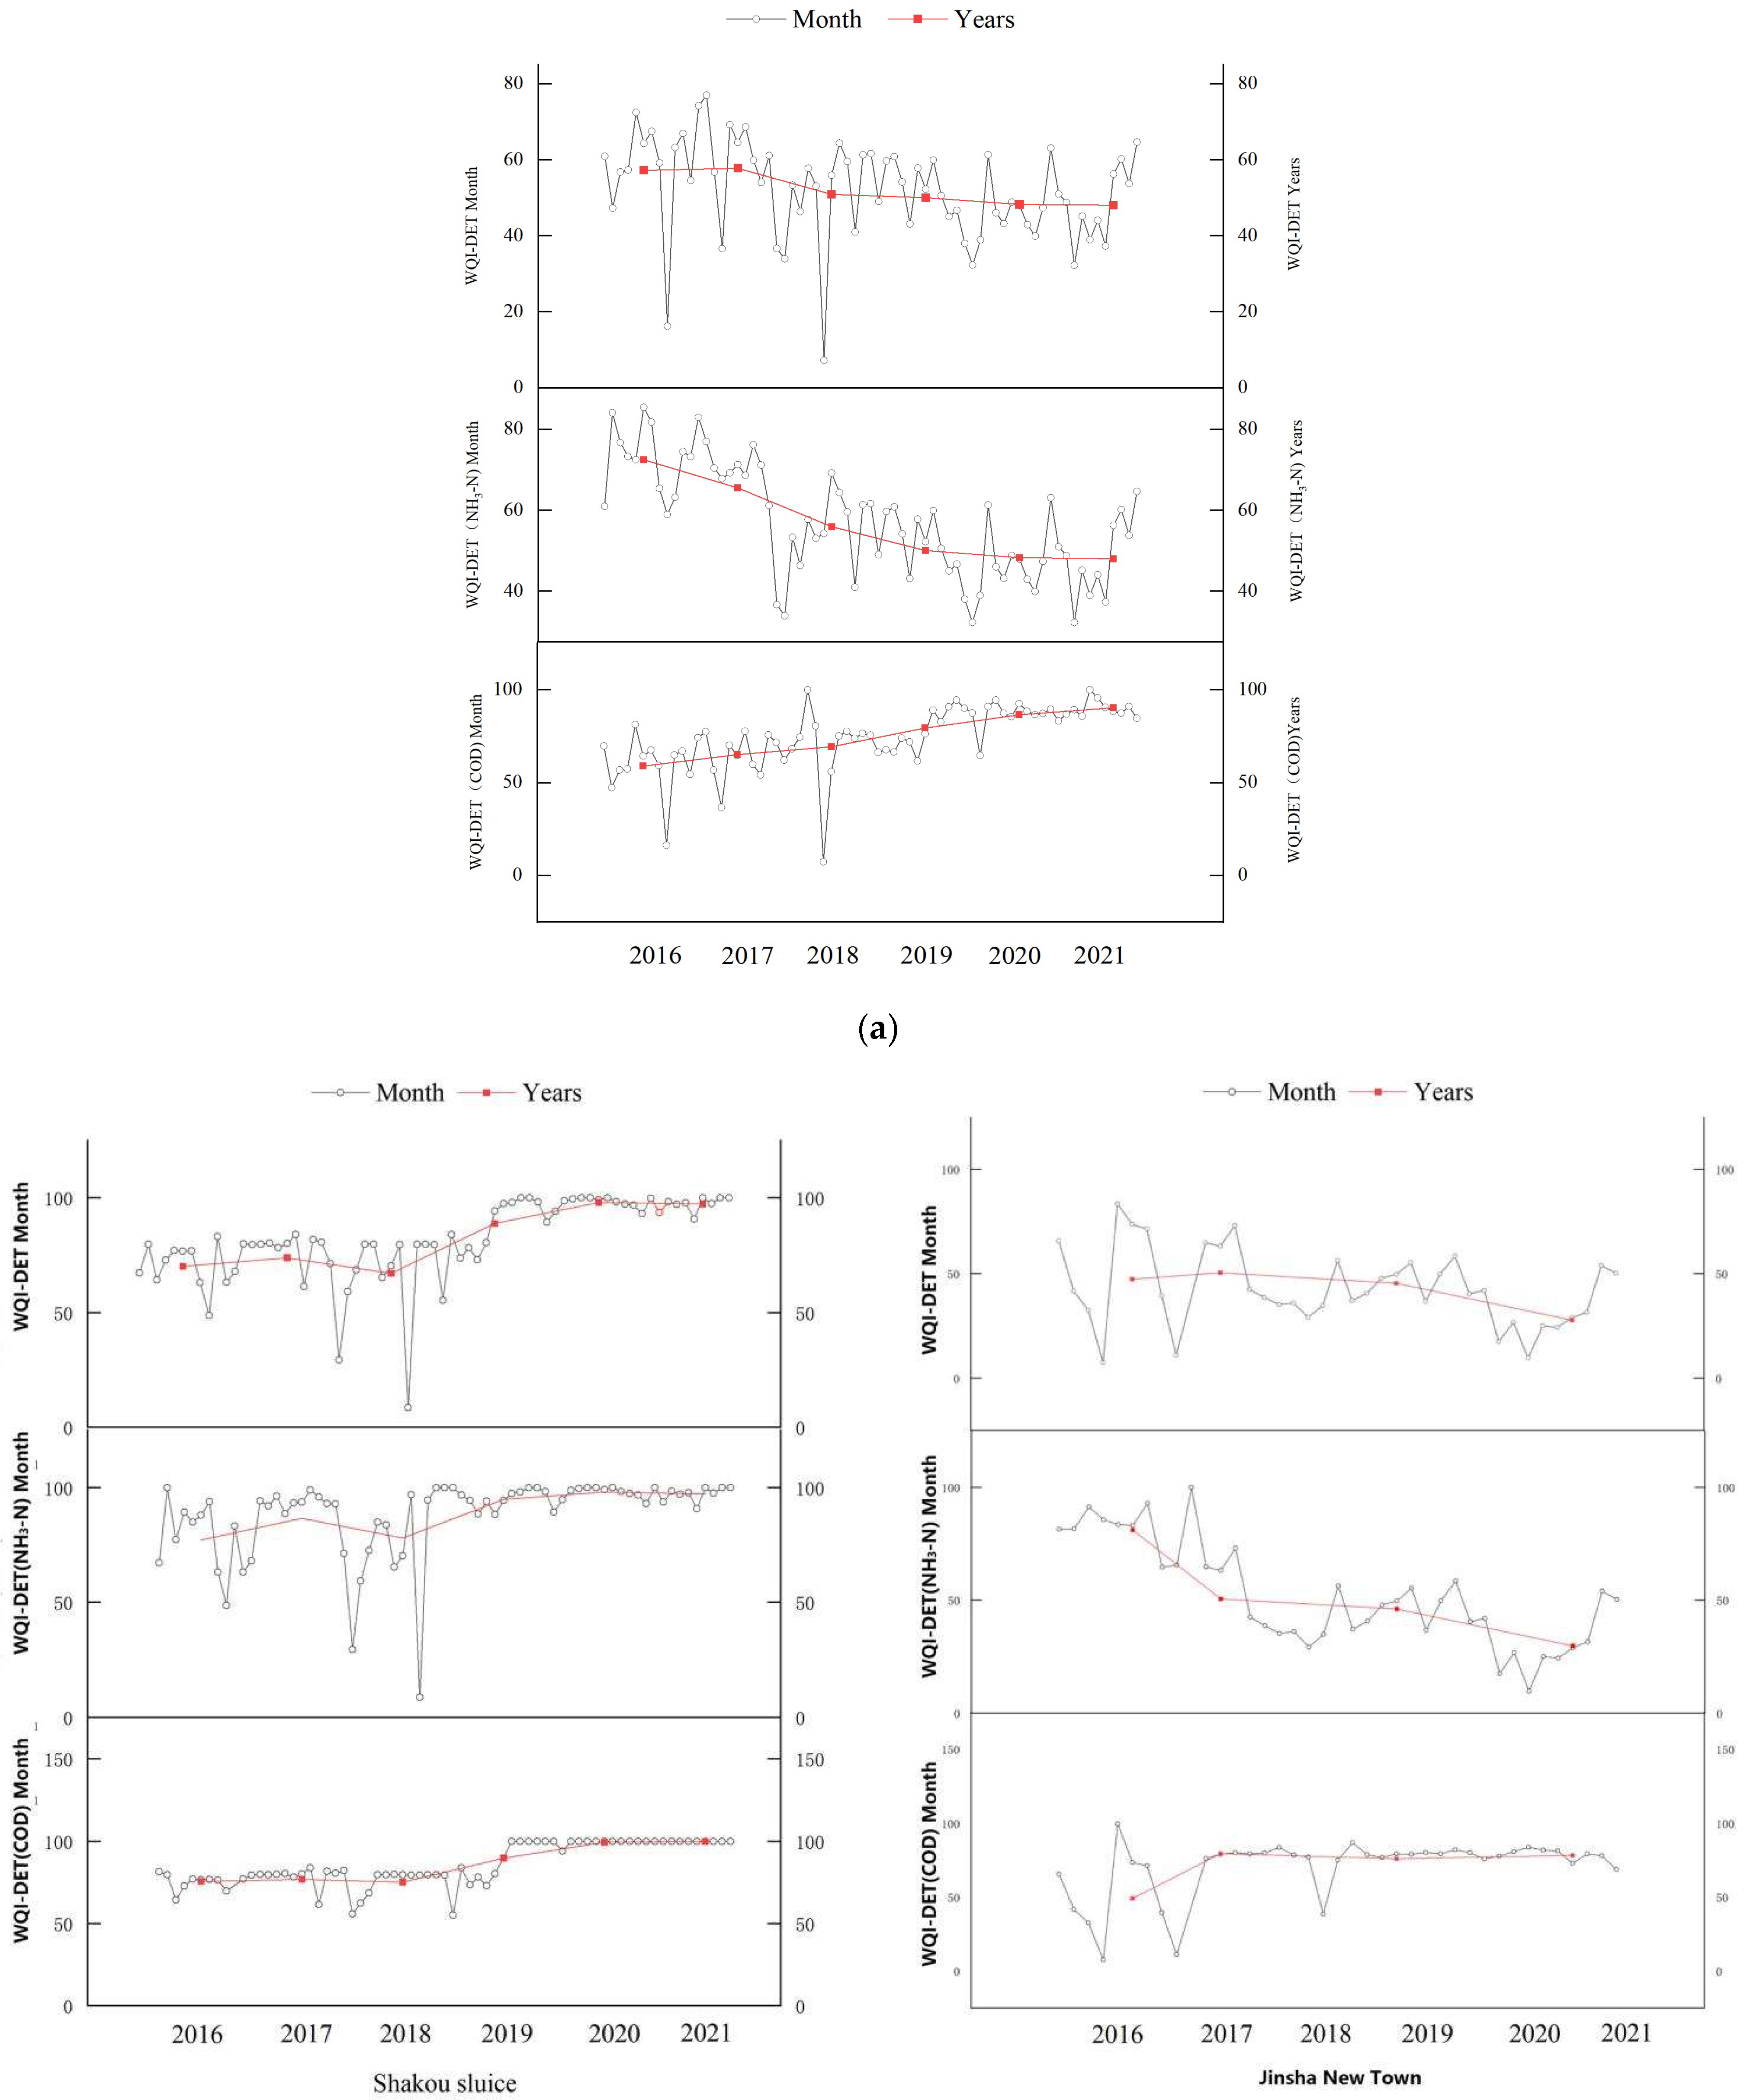
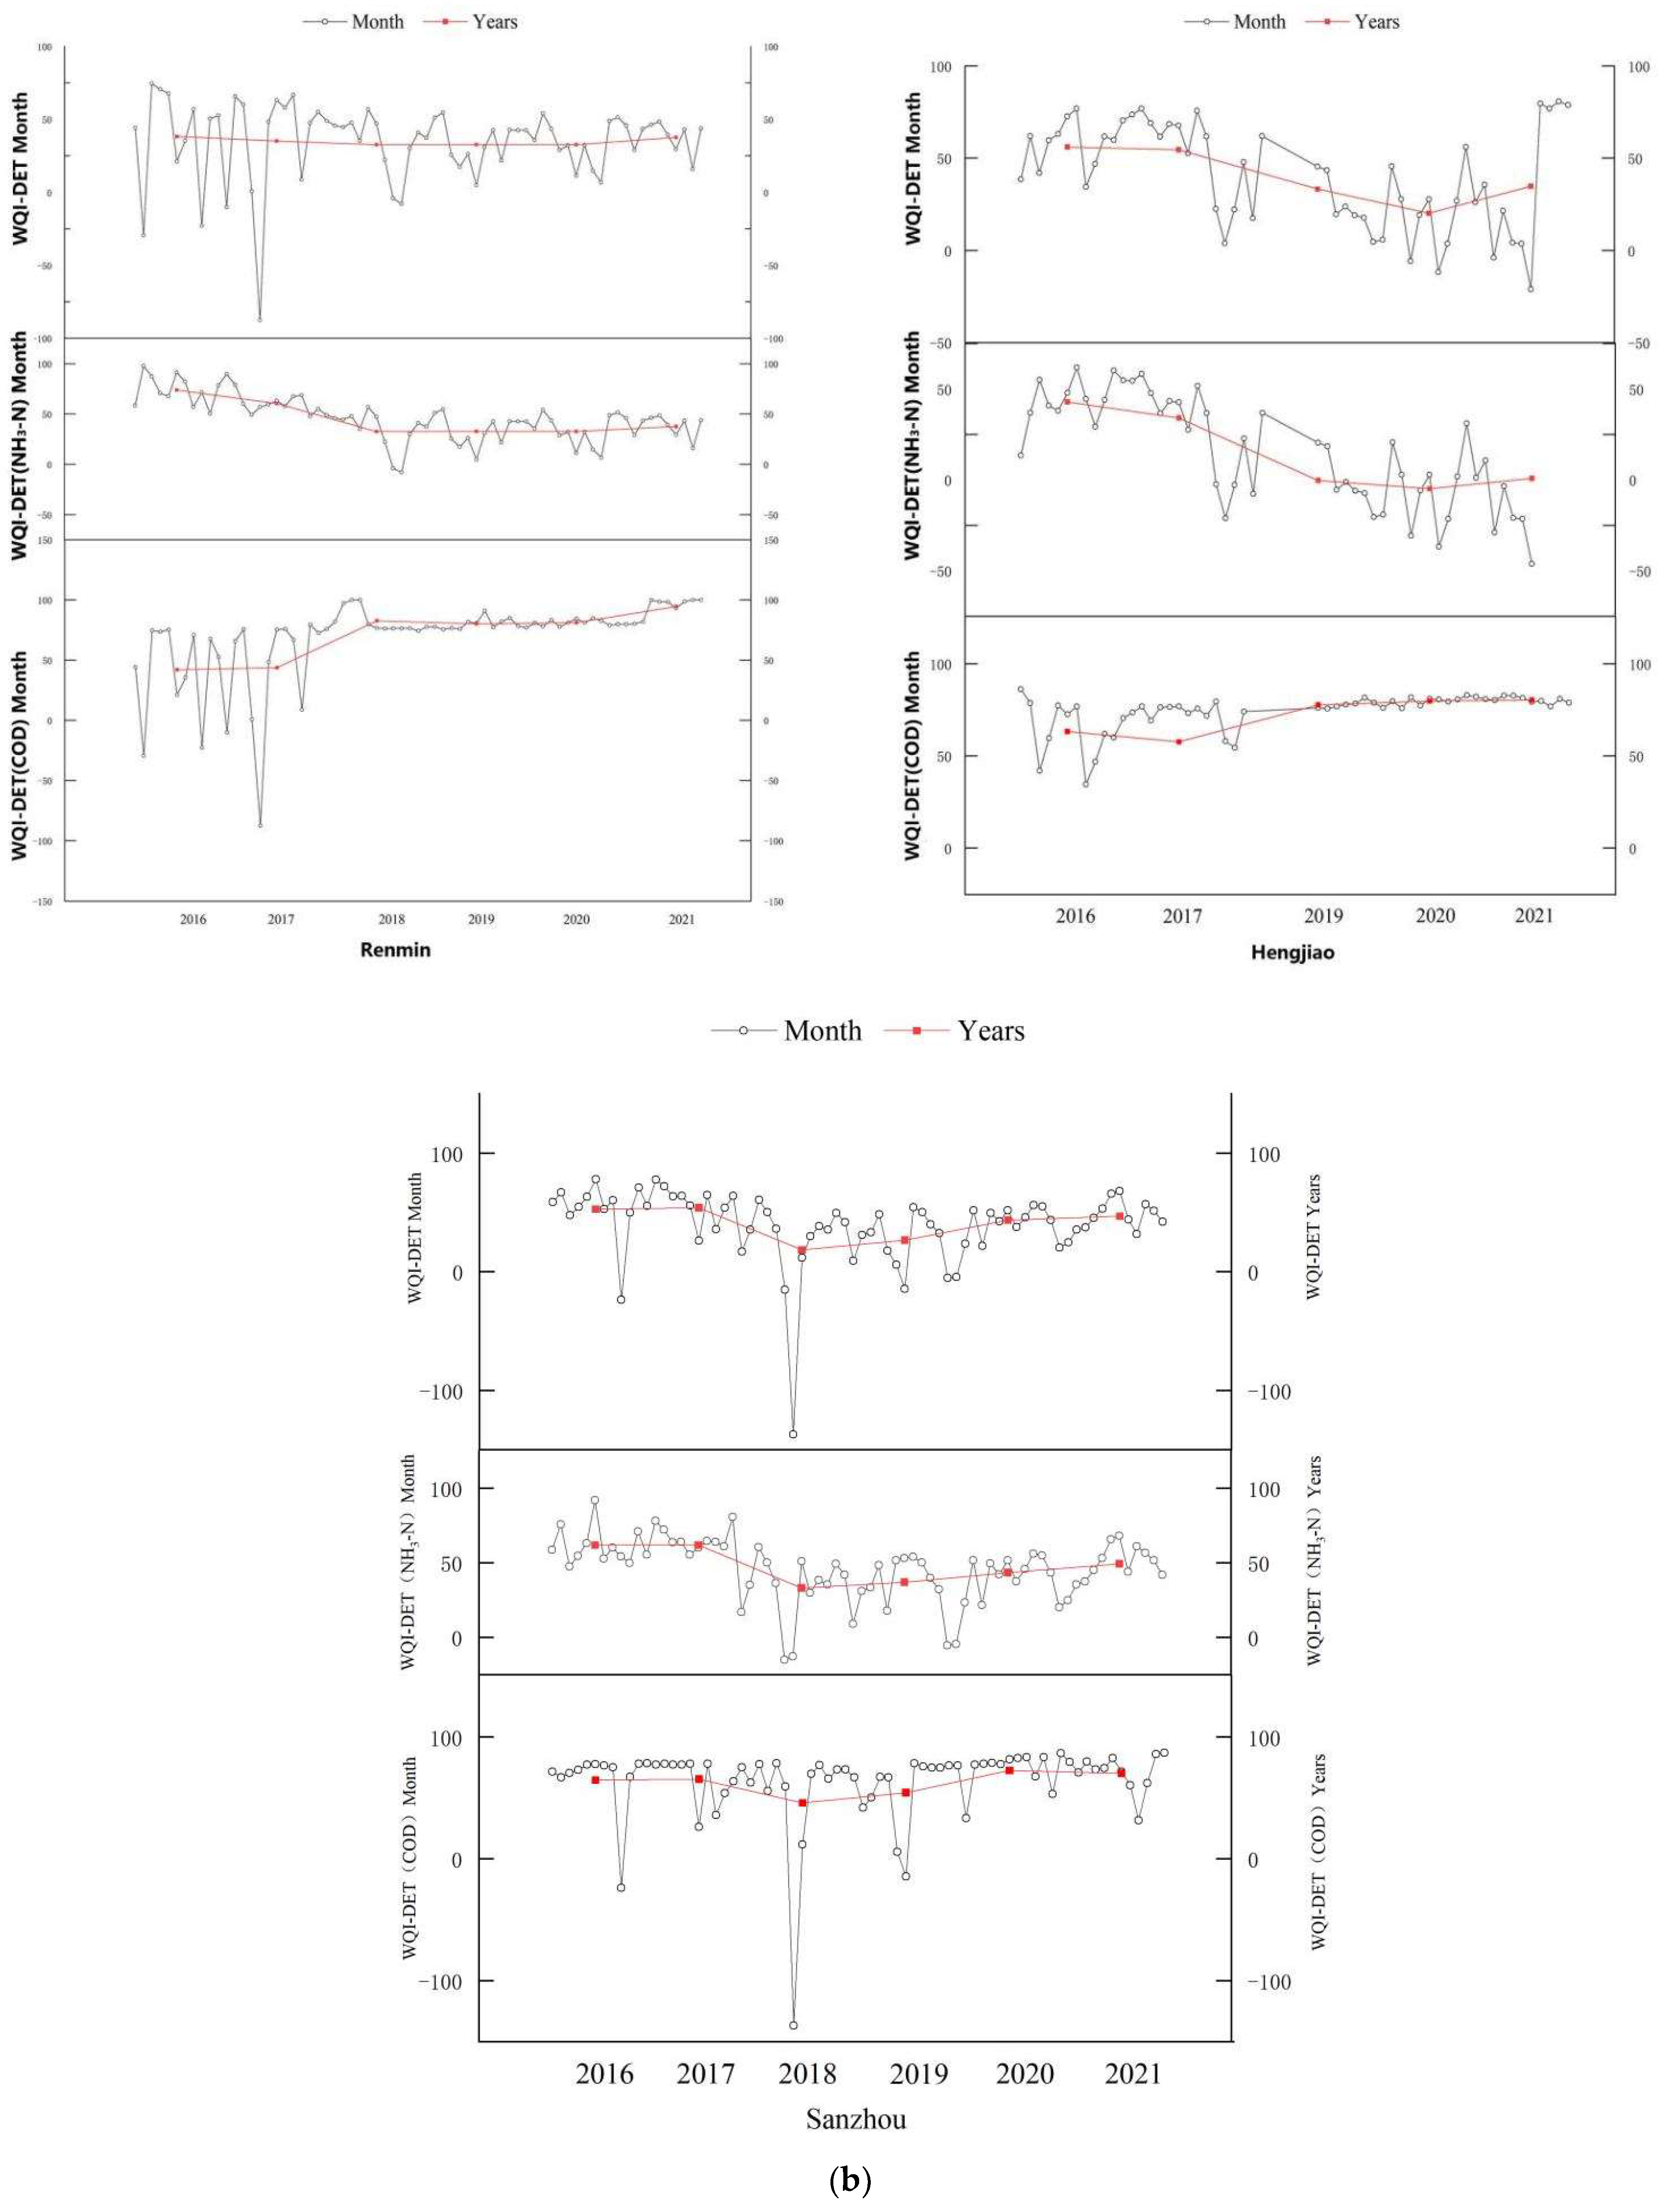
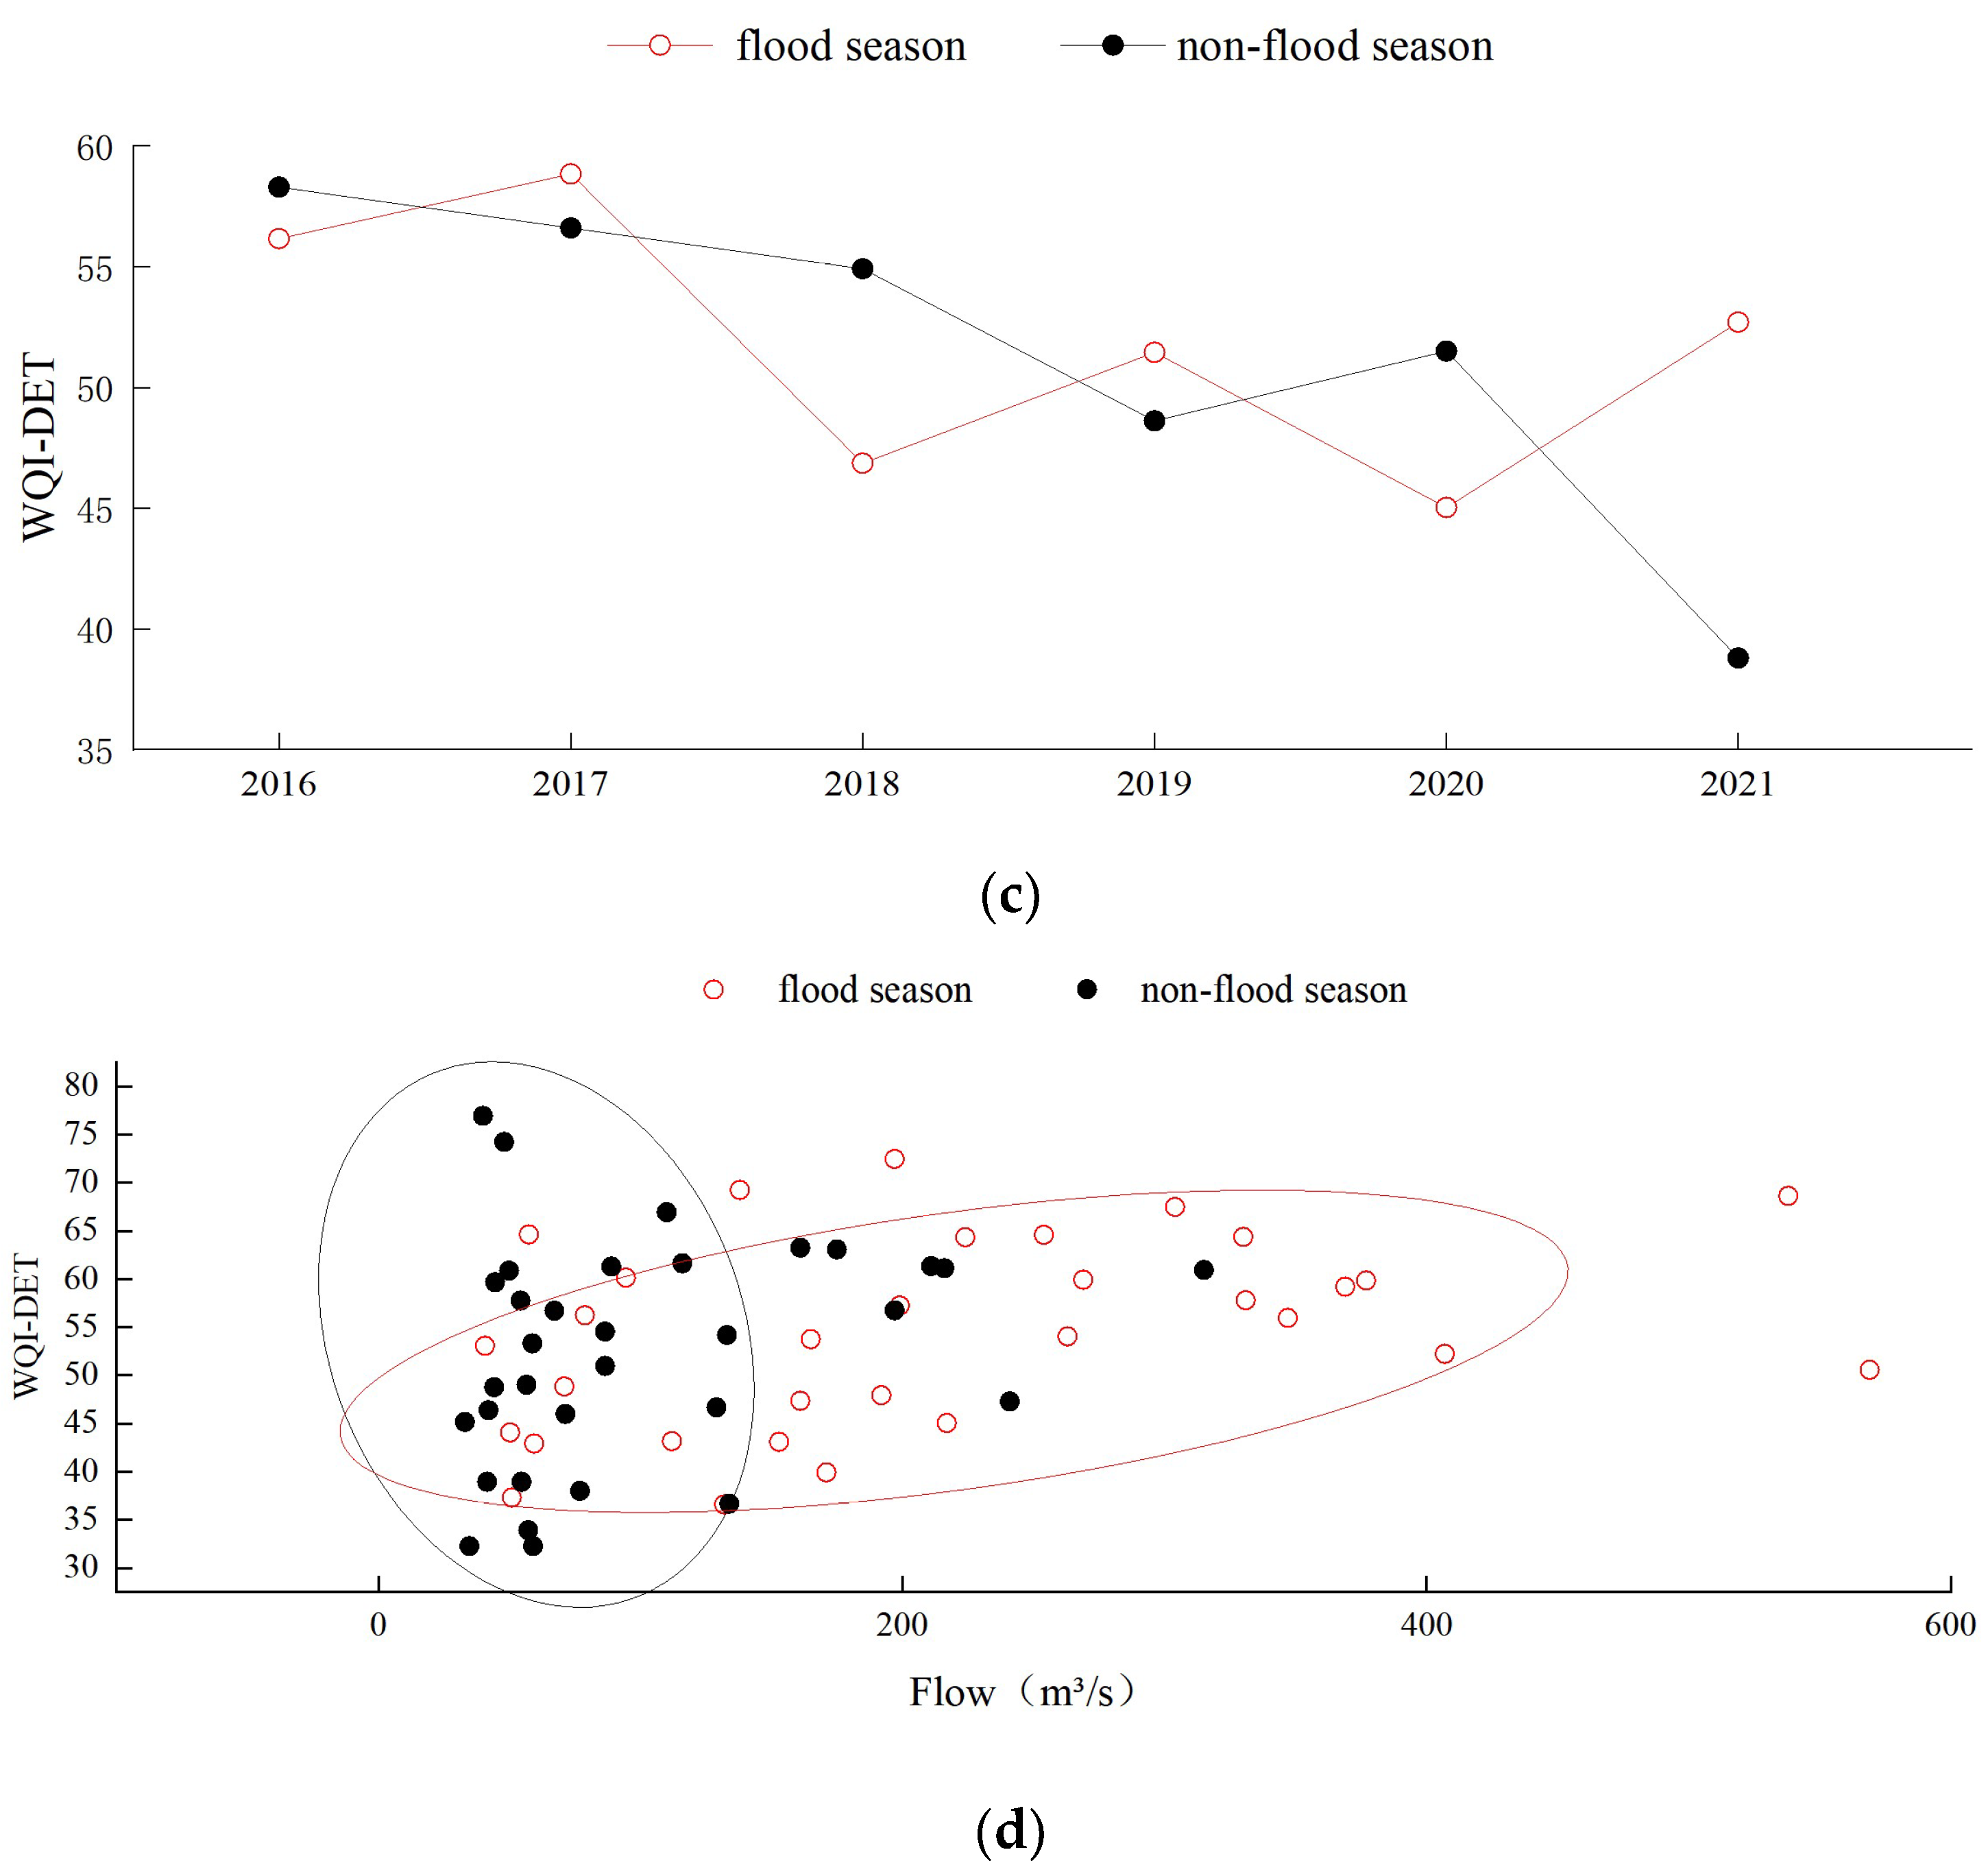
4.2. Interannual Evolution of Water Quality
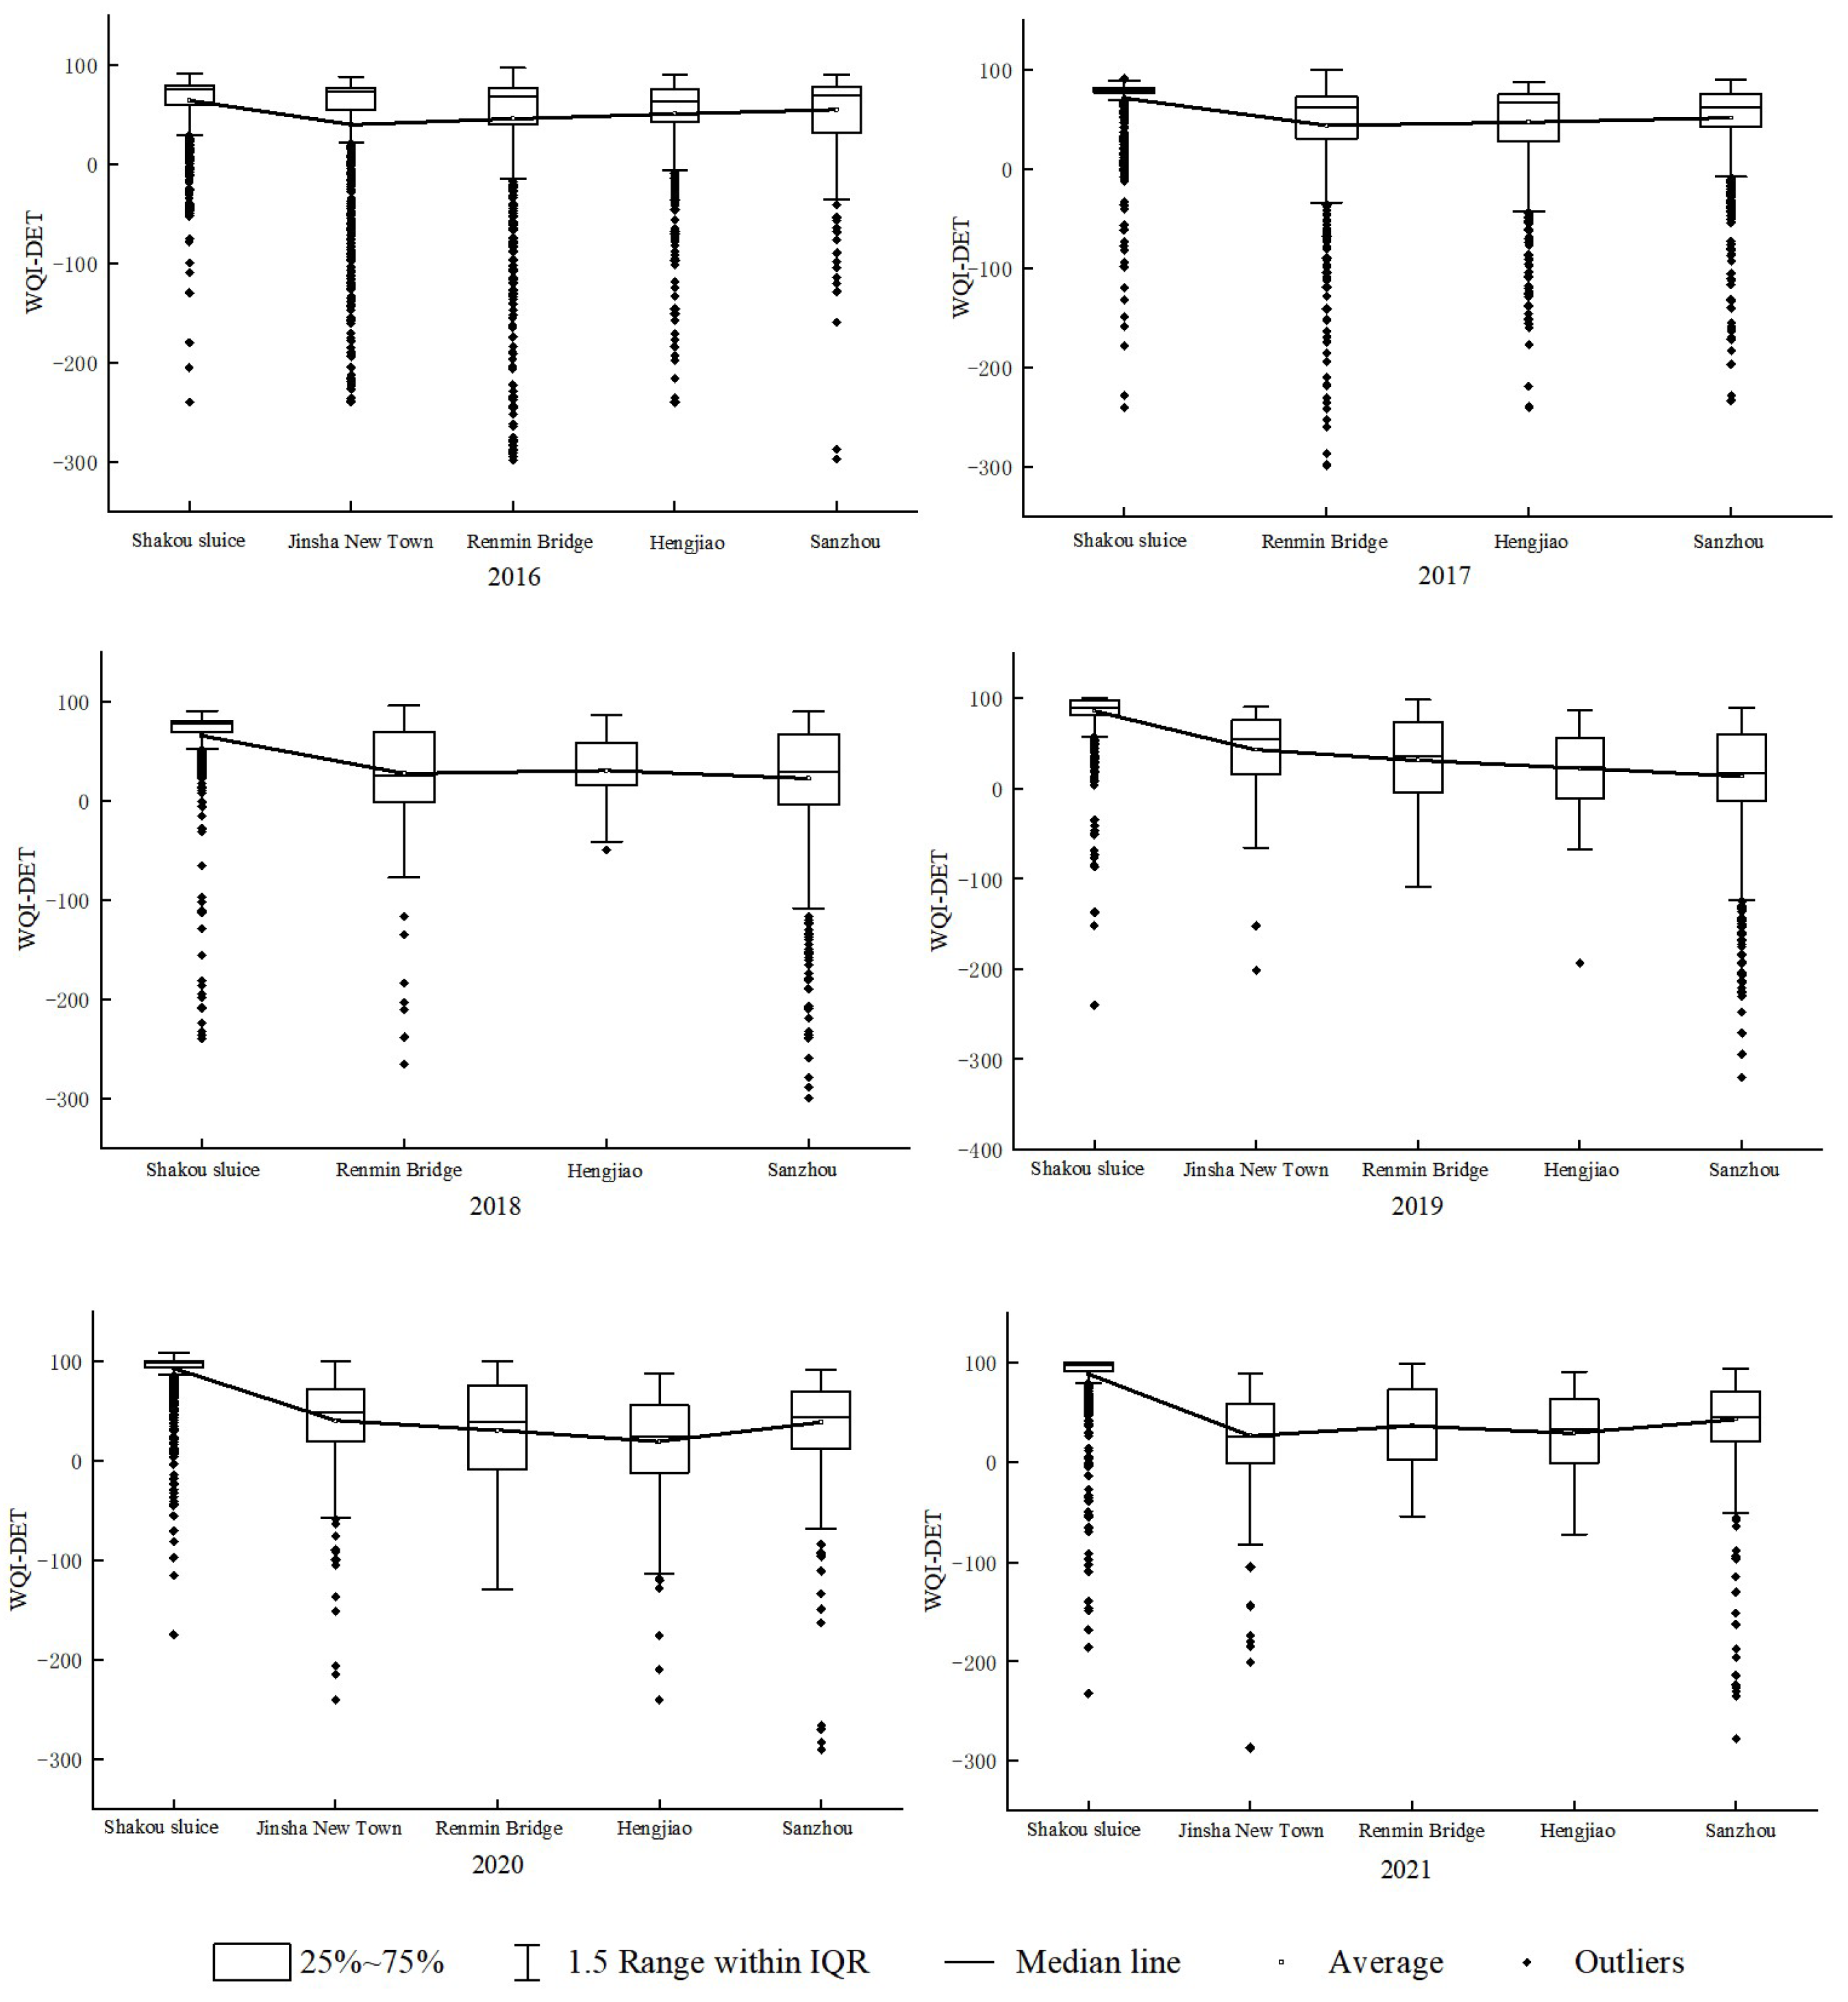
4.3. Spatial Differences and Evolution of Water Quality
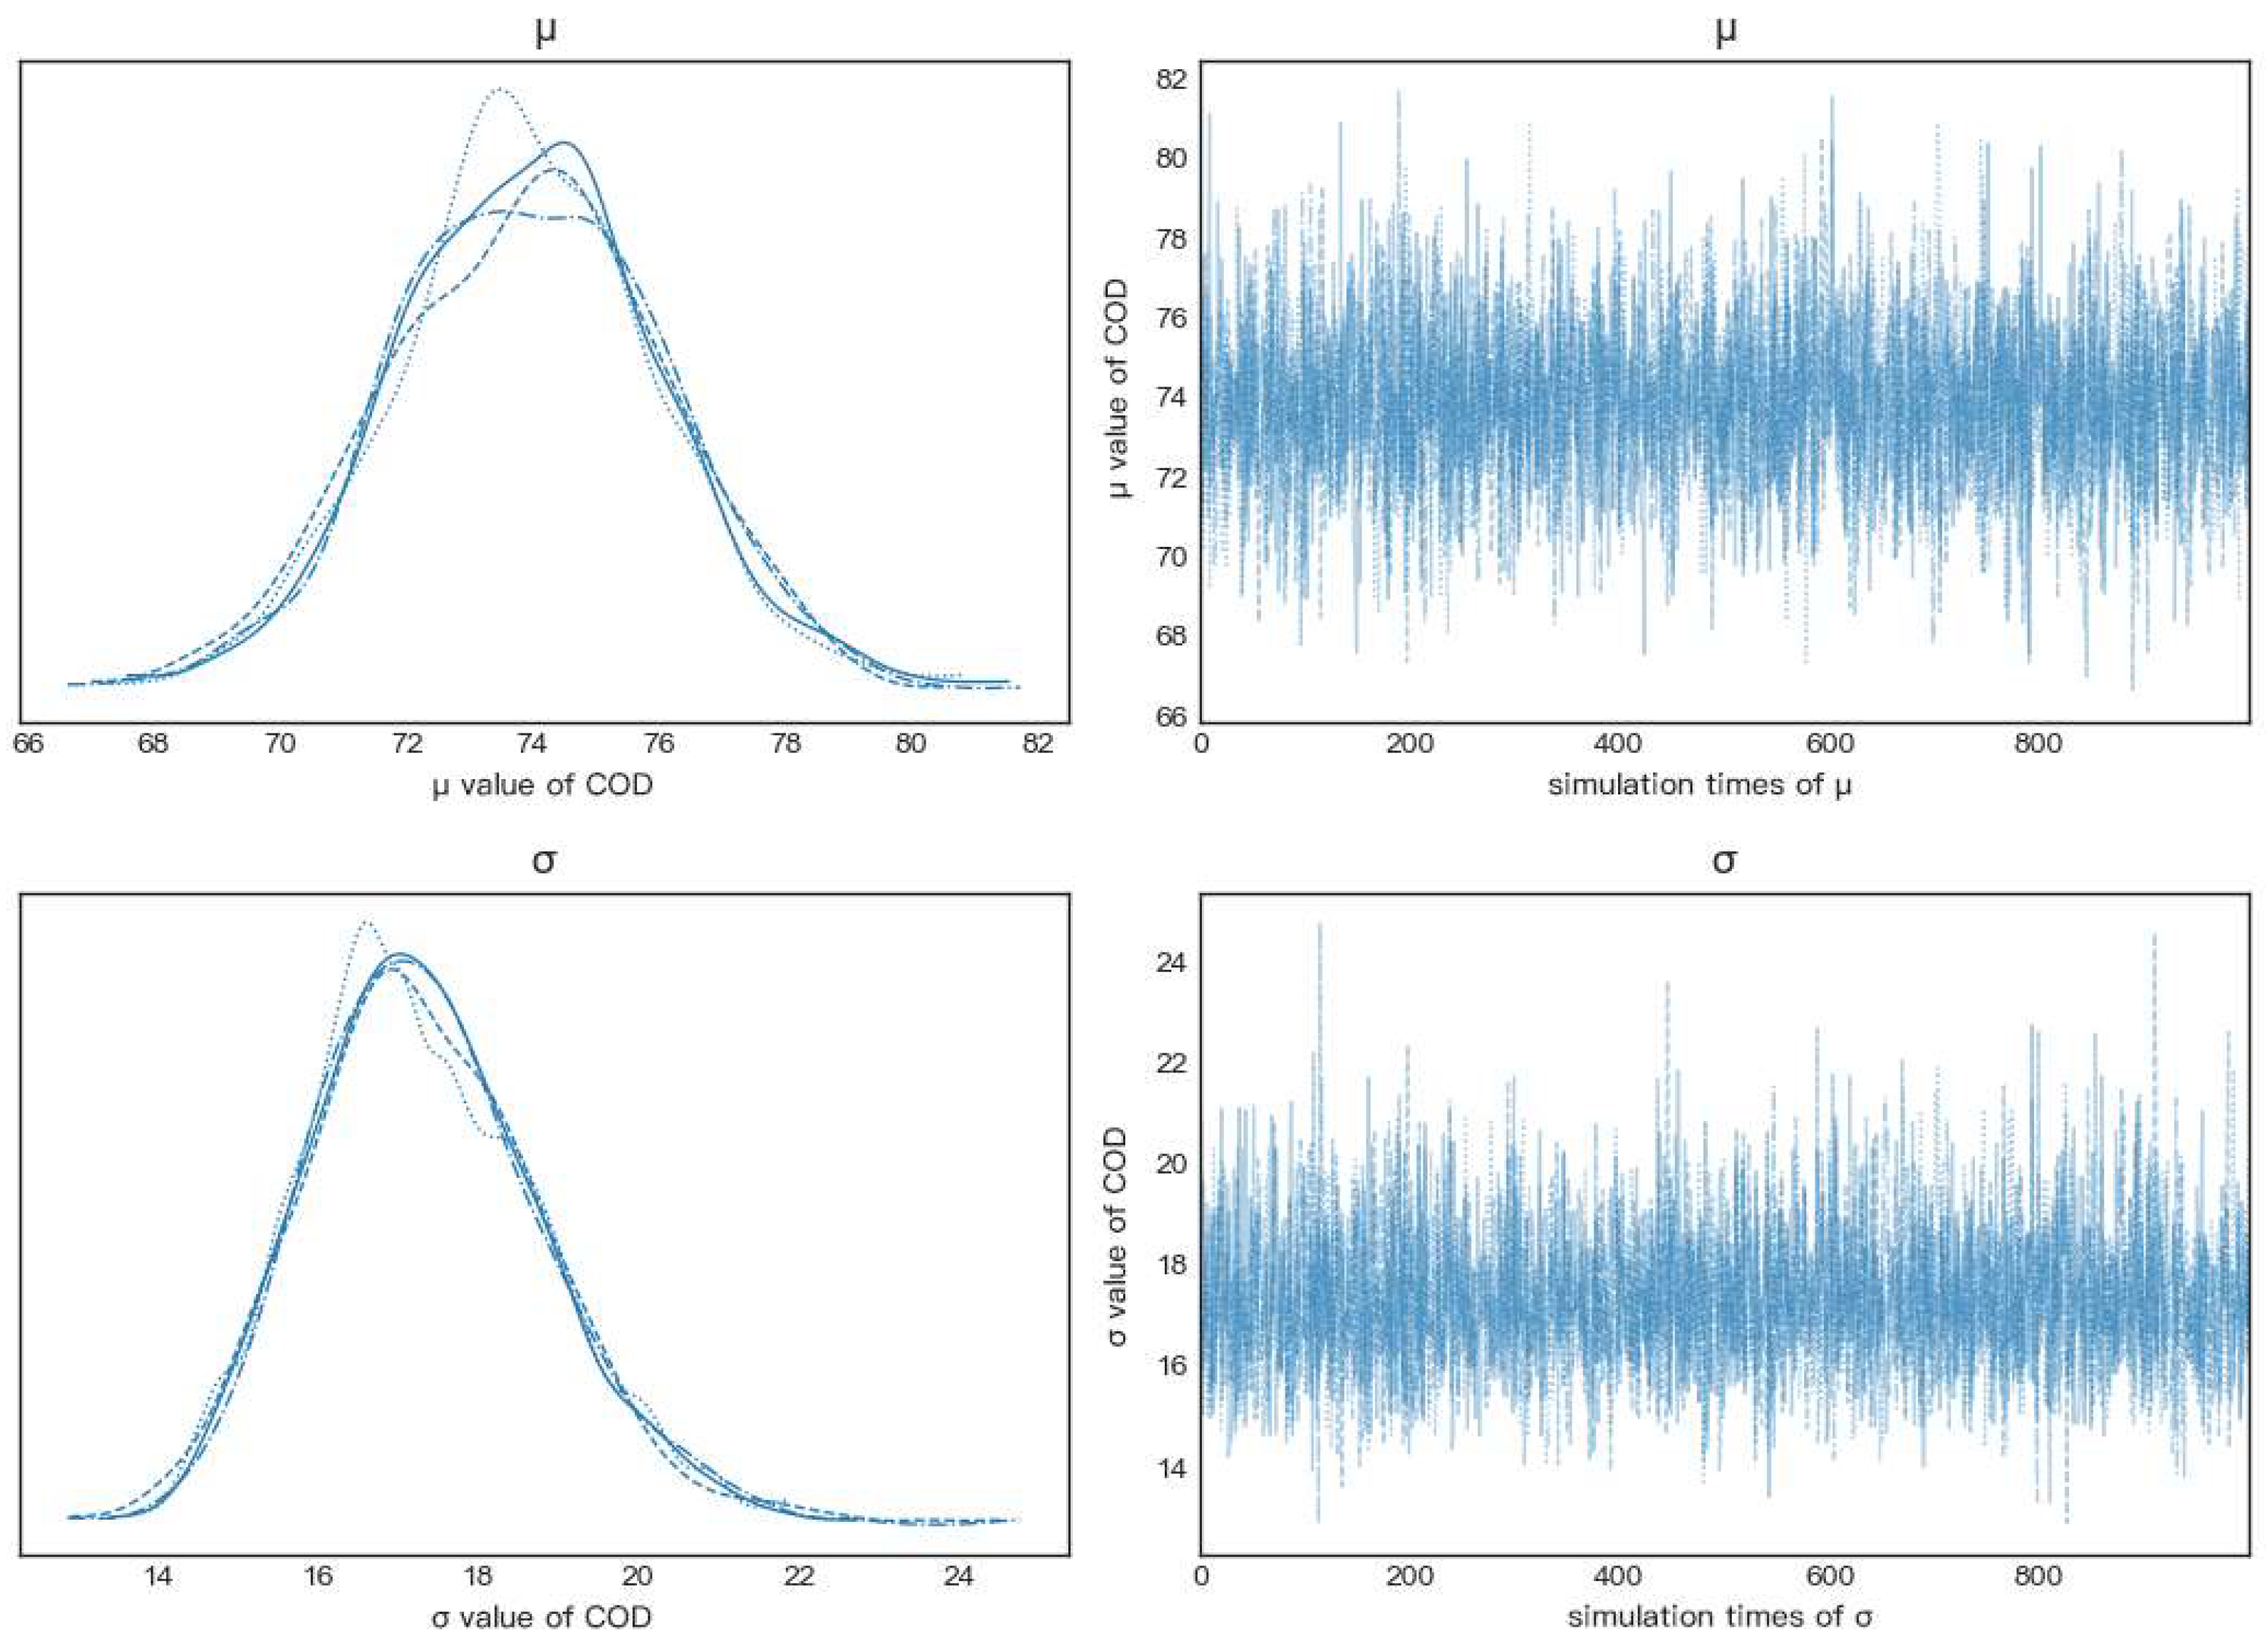
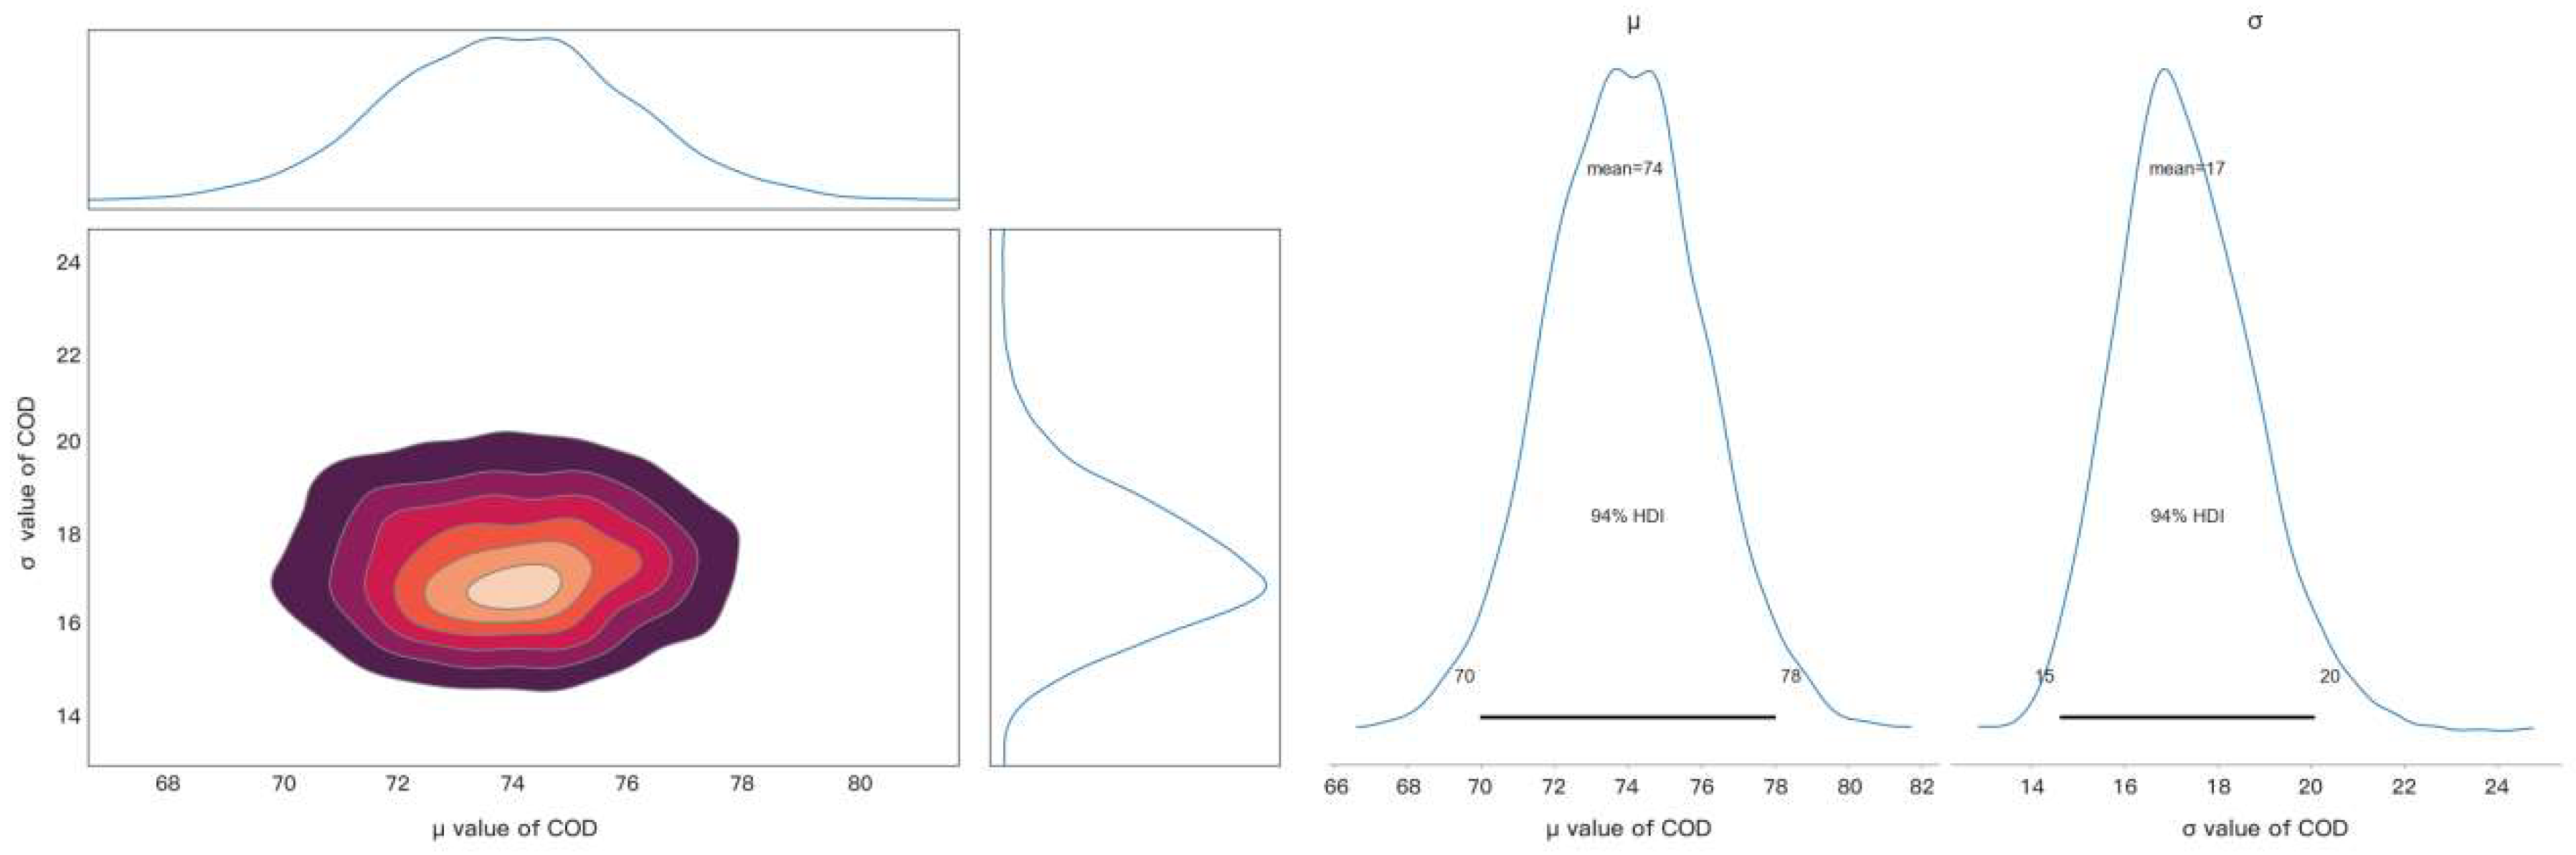
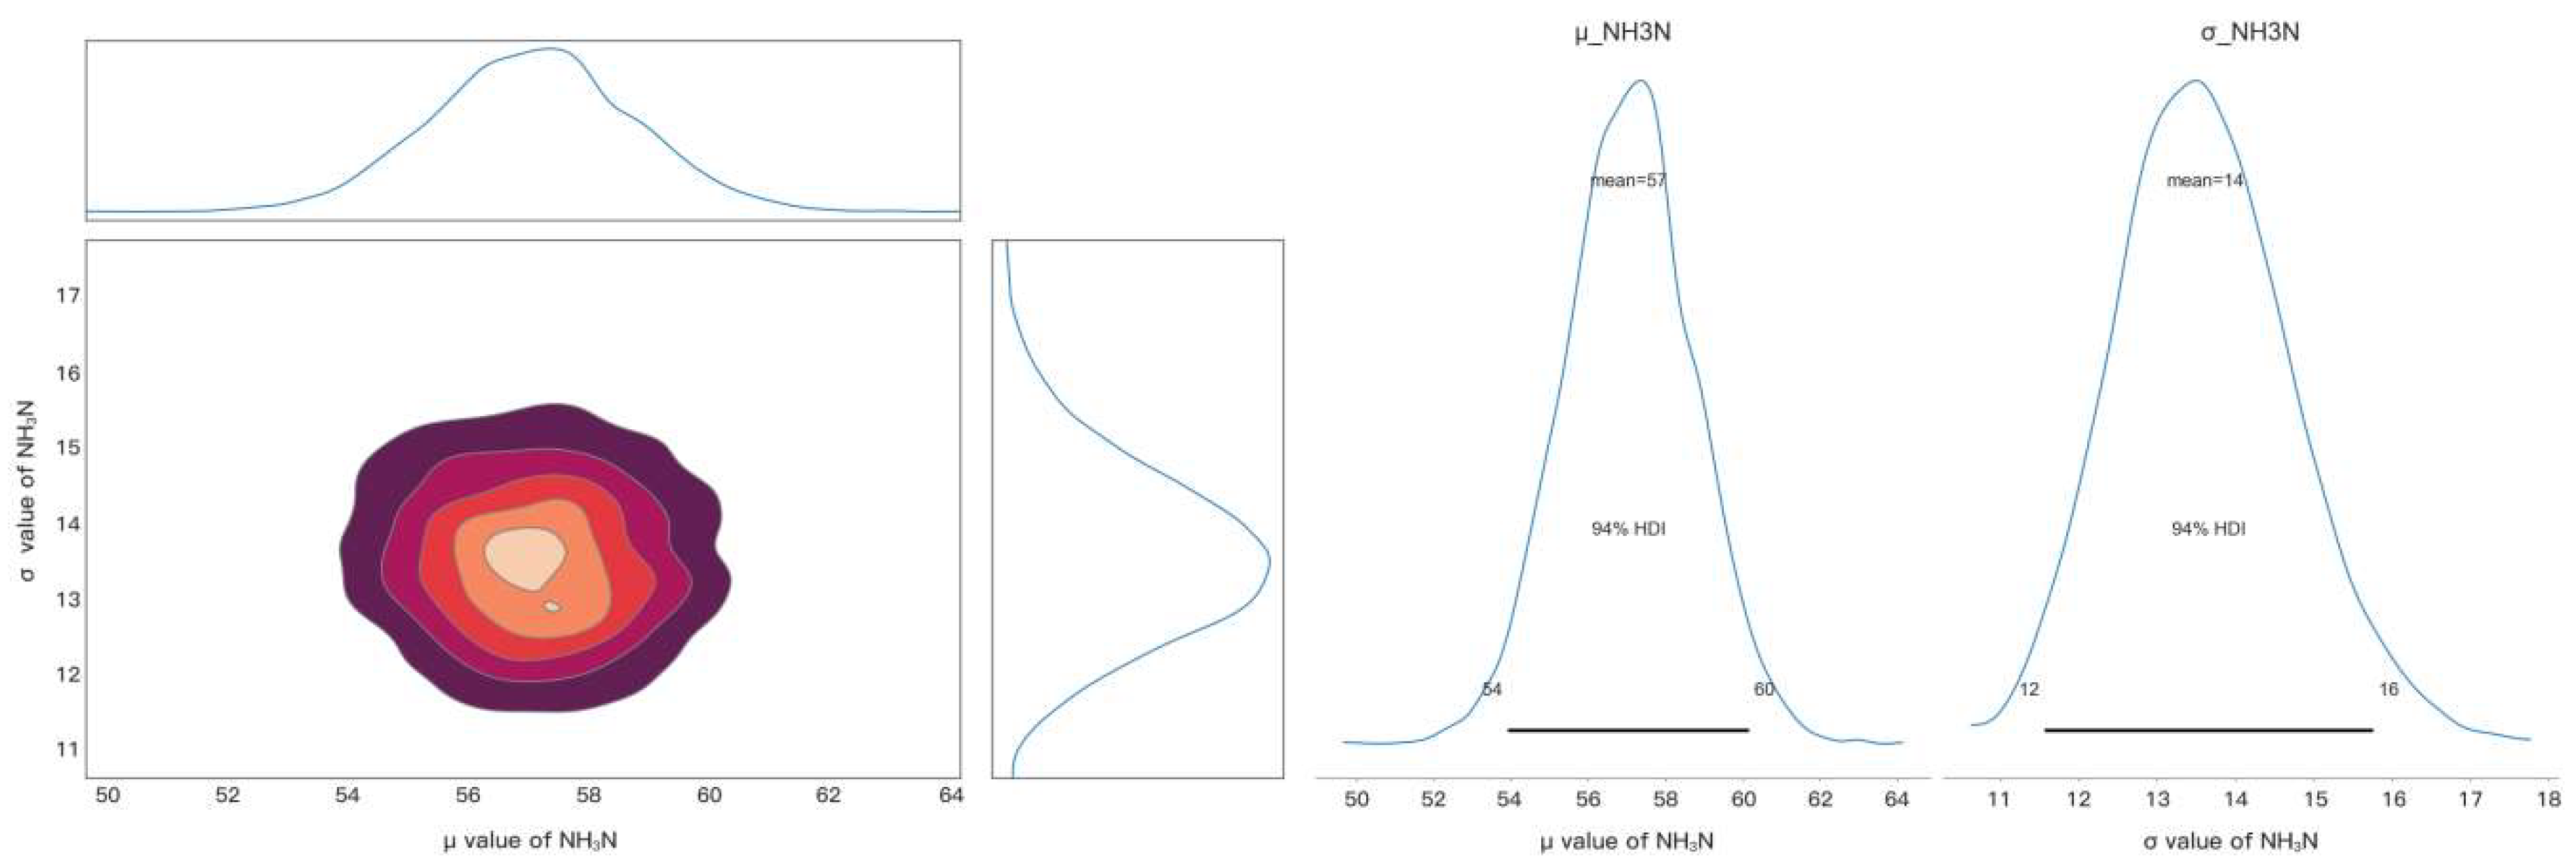
4.4. Bayesian Analysis of COD and NH3-N Contamination Levels
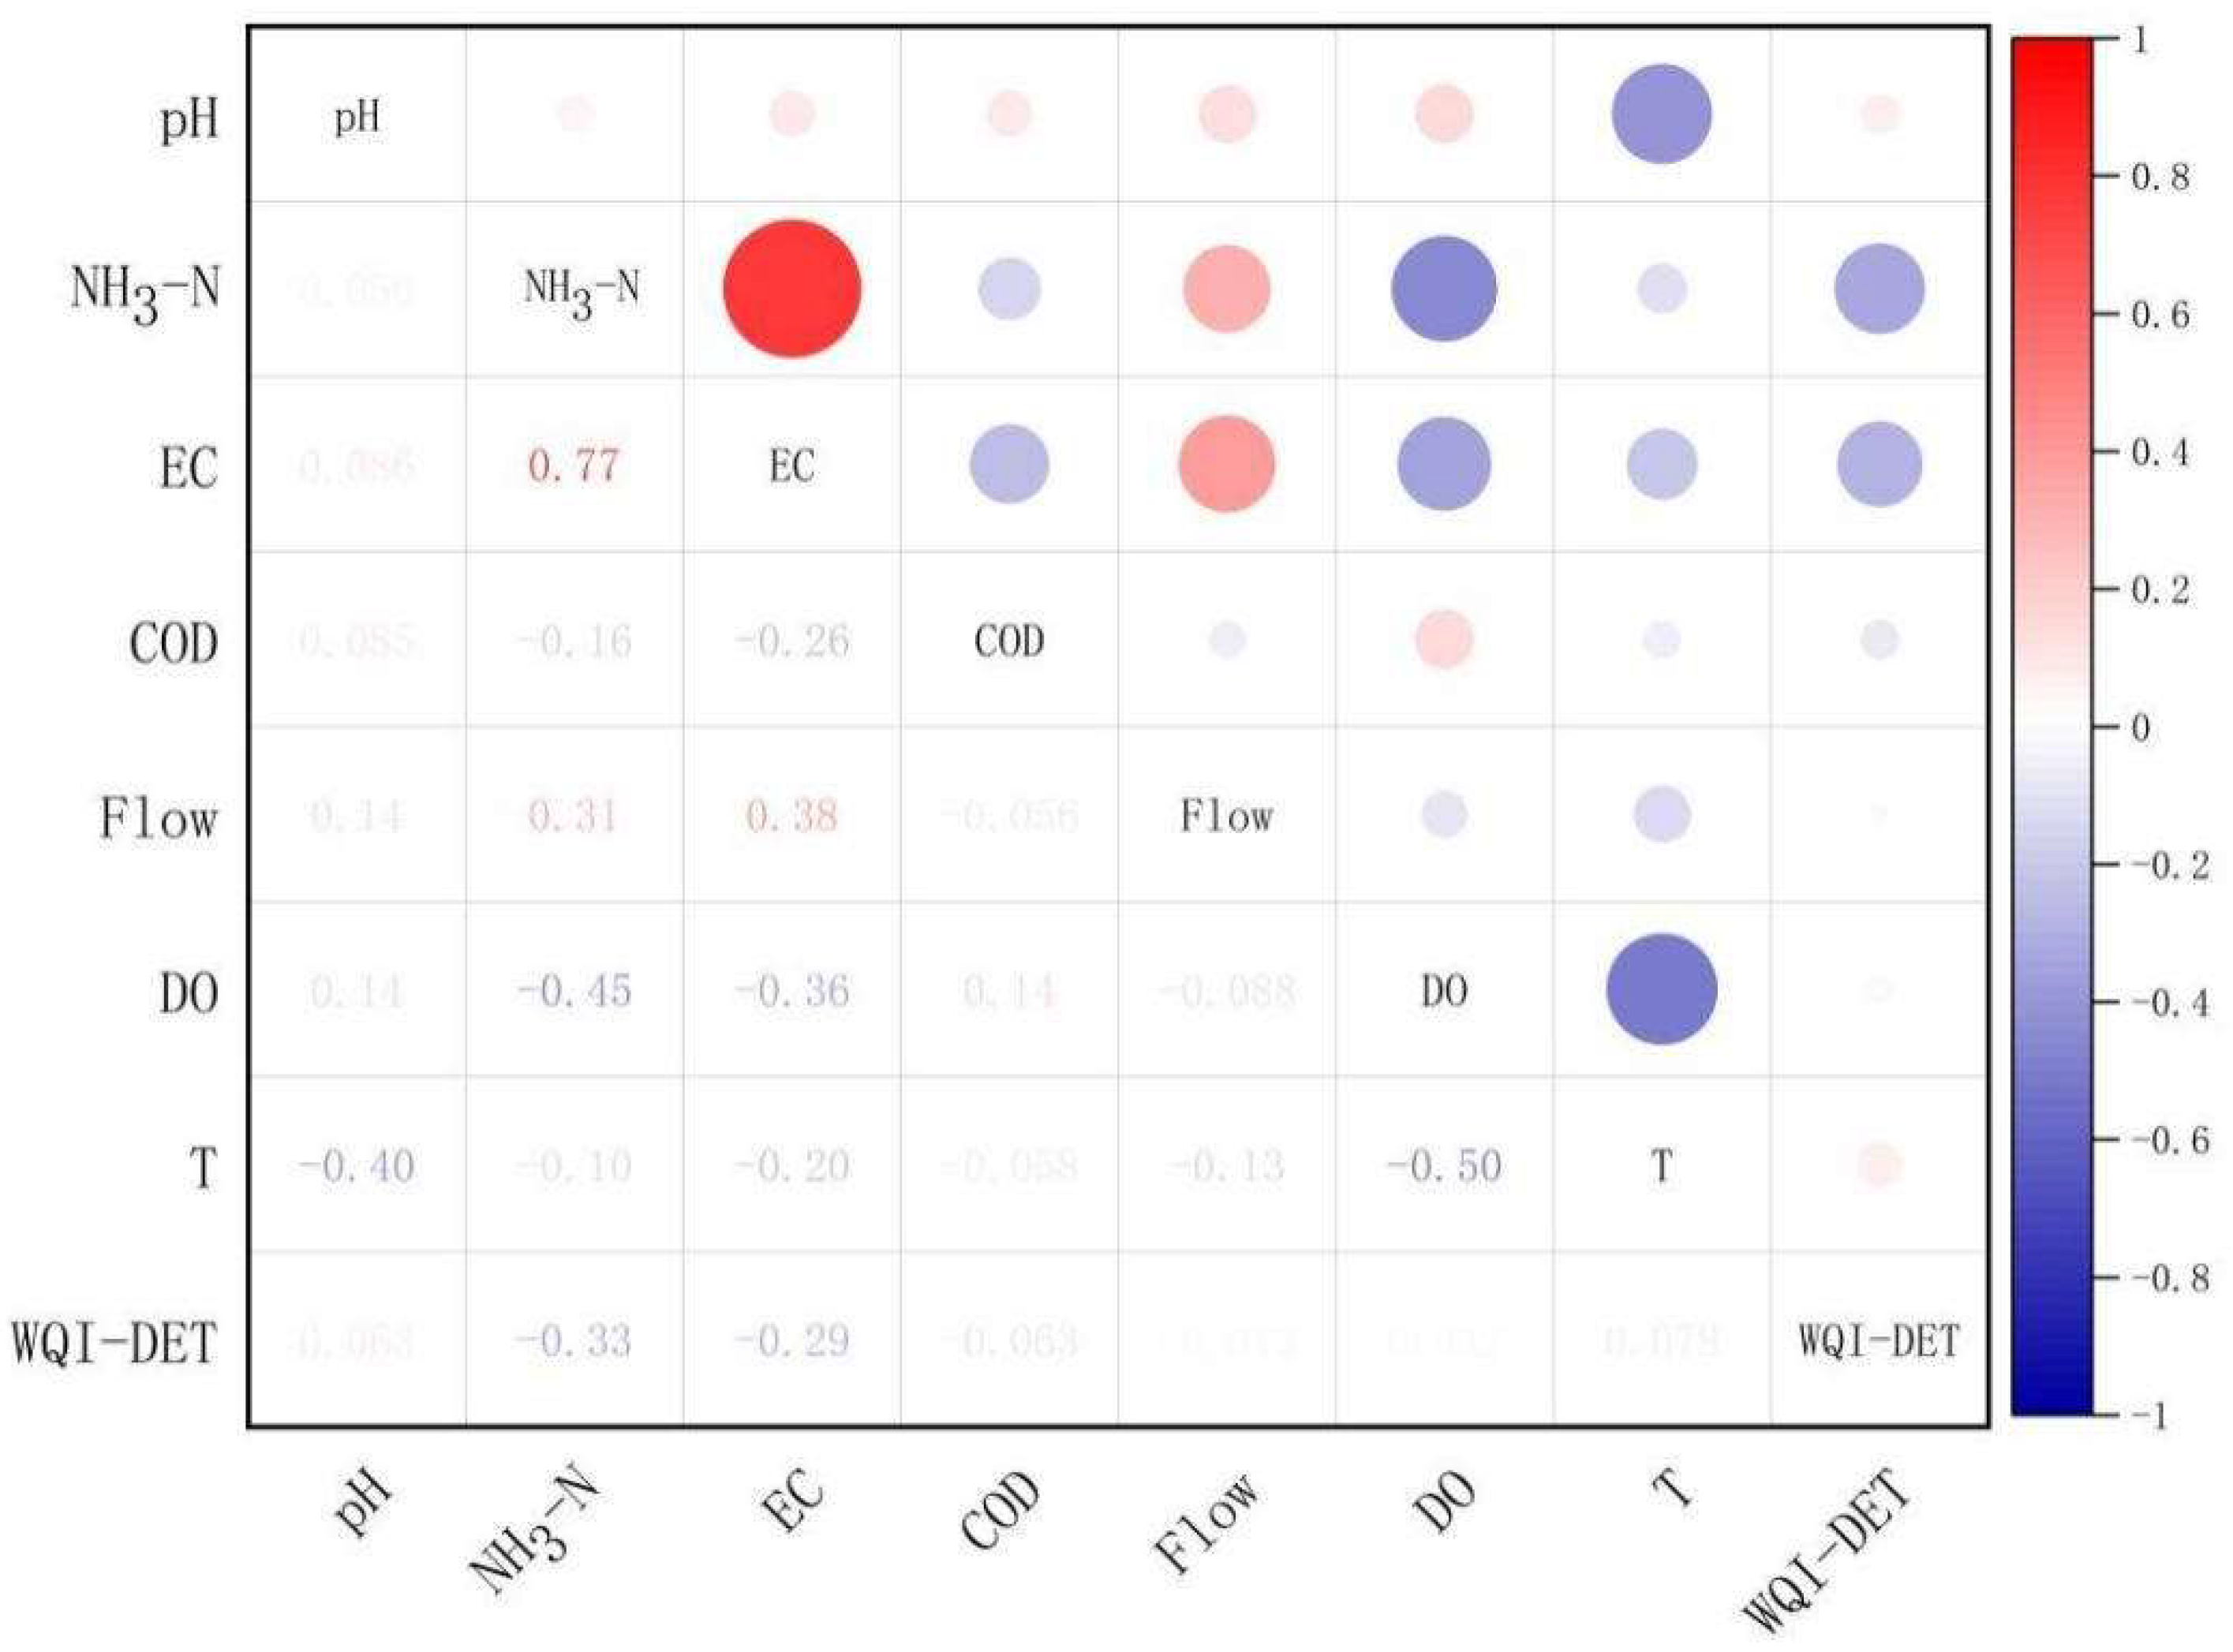
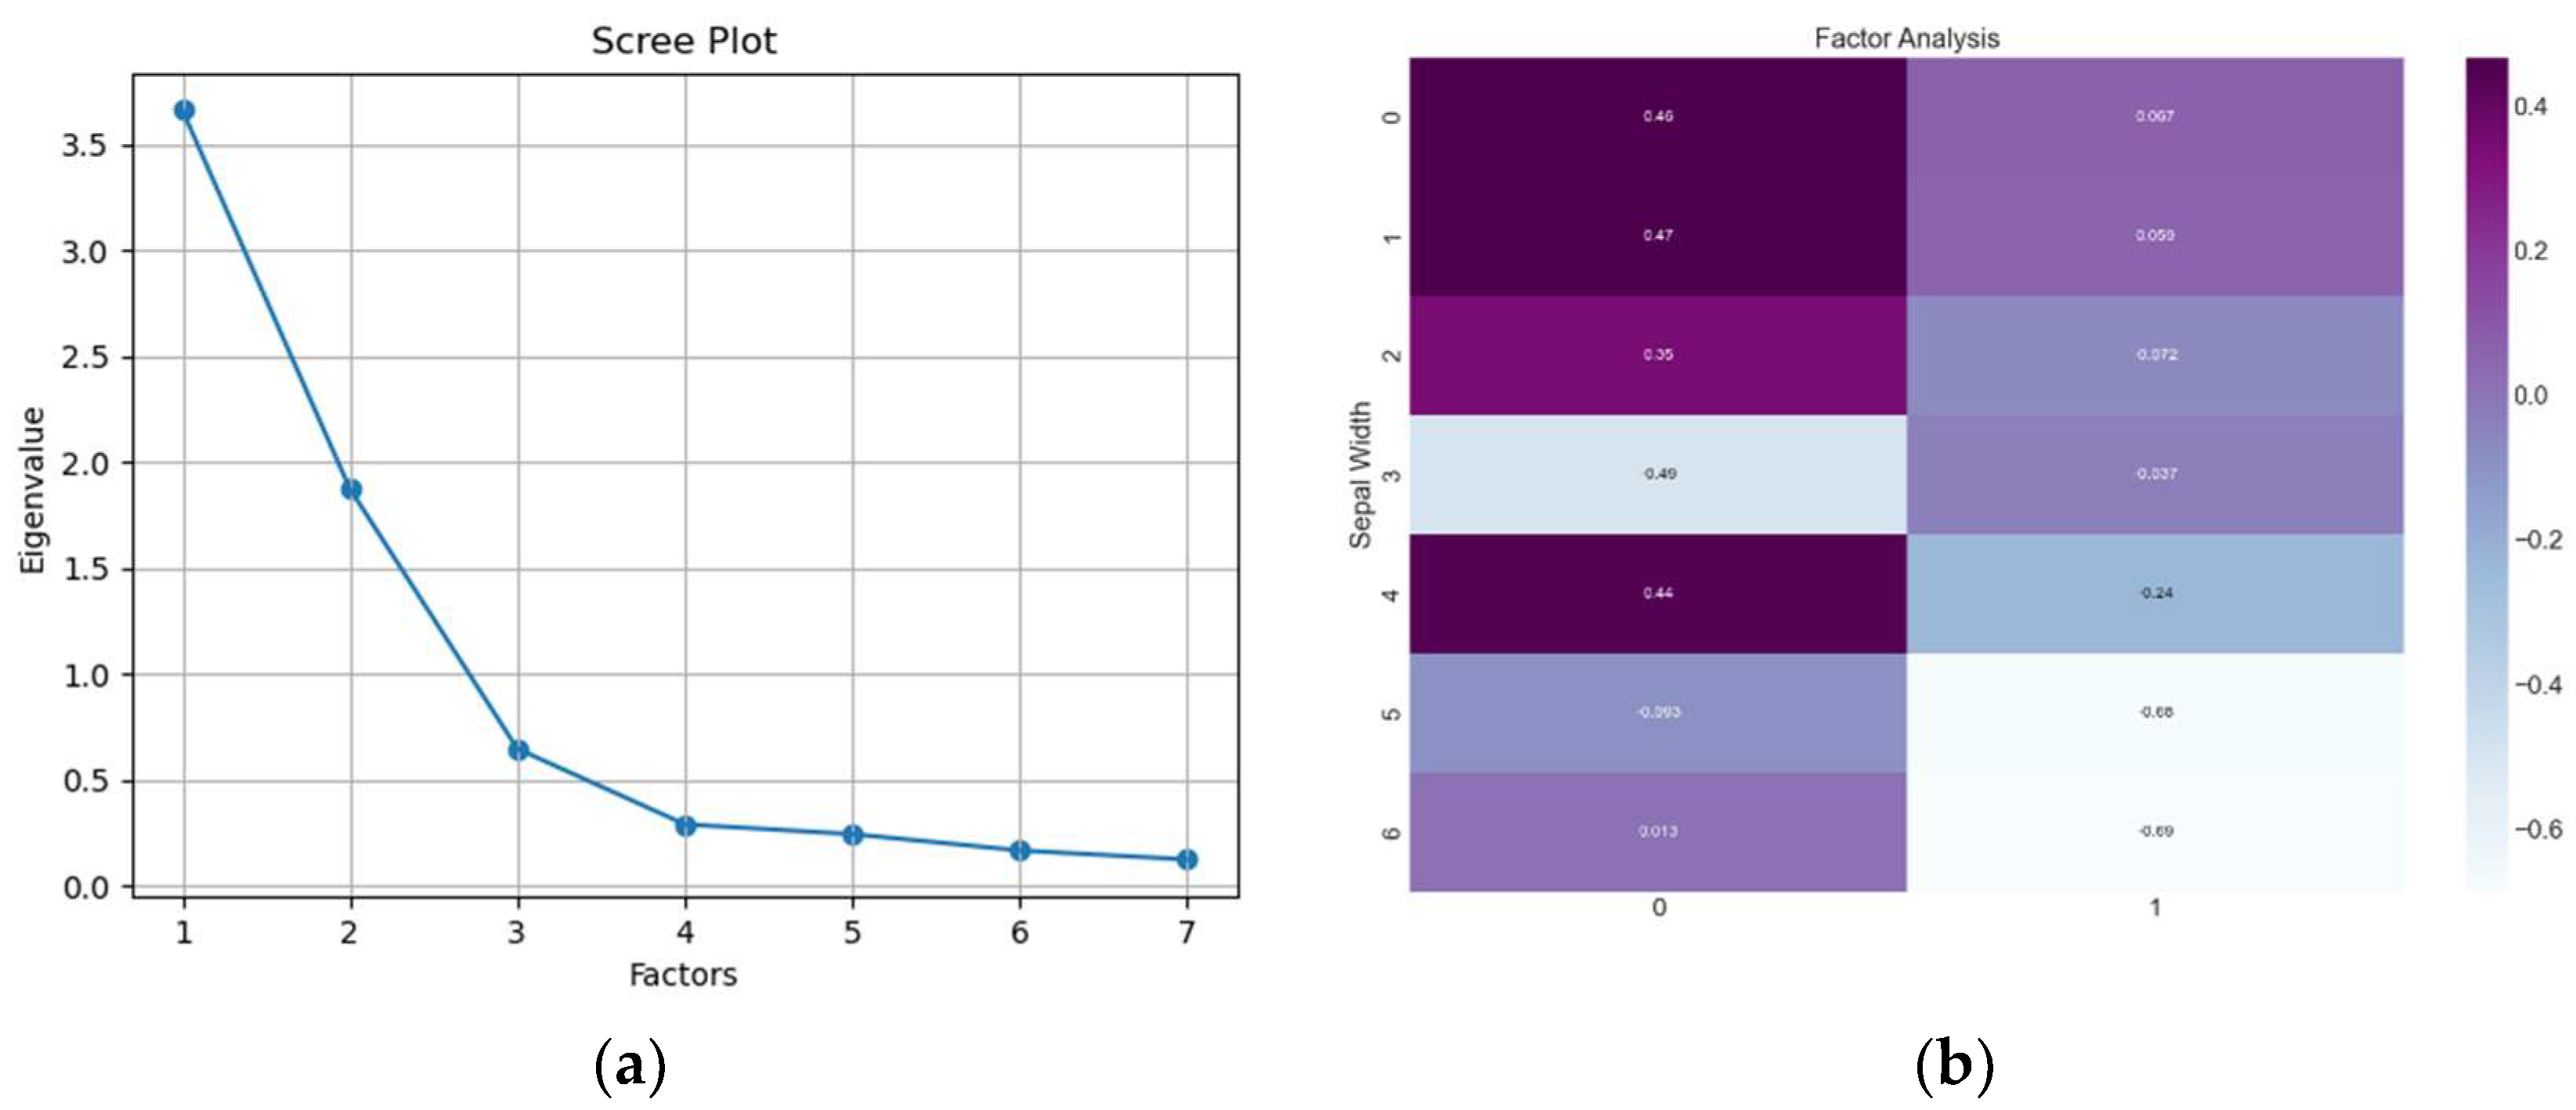
4.5. COD and NH3-N Source Analysis Based on the Principal Component Analysis (PCA)
5. Discussion
5.1. Why Is NH3-N the Main Factor Affecting Water Quality Recently?
5.2. Is the Water Quality of the Fenjiang River Getting Better or Worse?
5.3. What Can Be Done to Help Improve the Water Quality of Fenjiang River?
6. Conclusions
Author Contributions
Funding
Institutional Review Board Statement
Informed Consent Statement
Data Availability Statement
Acknowledgments
Conflicts of Interest
References
- Wang, H.; Mei, C.; Liu, J.; Wang, J. Current status and prospects of the treatment of urban water-related problems in China. China Water Resourc. 2021, 14, 4–7. [Google Scholar]
- Bu, H.; Liu, W.; Zhang, Q. Application of Multiple Statistical Analysis to Spatial-Temporal Variations of Water Quality of the Jinshui River. Resourc. Sci. 2009, 31, 429–434. [Google Scholar]
- Wang, H.; Mei, C.; Liu, J.; Wang, J. Spatiotemporal Variation Analysis and Identification of Water Pollution Sources in the Zhangweinan River Basin. Environ. Sci. 2012, 33, 359–369. [Google Scholar] [CrossRef]
- Teng, Z.; Ding, A.; Li, Y.; Jing, R.; Liu, Y. Sources of water pollution and their spatiotemporal variations in the upper reach of the Chishui River. J. Beijing Norm. Univ. (Natl. Sci.) 2016, 03, 322–327. [Google Scholar] [CrossRef]
- Yu, X.; Liang, J.; Zeng, G. An integrated fuzzy-Bayesian water quality assessment model based on triangular fuzzy numbers. Acta Sci. Circumst. 2013, 33, 904–909. [Google Scholar]
- Zhang, X.; Liang, C. Application of fuzzy matter-element model based on coefficients of entropy in comprehensive evaluation of water quality. J. Hydraul. Eng. 2005, 36, 1057–1061. [Google Scholar] [CrossRef]
- Zhang, X.; Liang, C. Study and Application on the Entropy method for Determination of Weight of evaluating indicators in Fuzzy Synthetic Evaluation for Water Quality Assessment. Acta Sci. Circumst. 2005, 04, 552–556. [Google Scholar] [CrossRef]
- Croft, M.; Chow, P. Use and development of the wetland macrophyte index to detect water quality impairment in fish habitat of Great Lakes Coastal Marshes. J. Great Lakes Res. 2007, 33, 172–197. [Google Scholar] [CrossRef]
- Lermontov, A.; Yokoyama, L.; Lermontov, M. River quality analysis using fuzzy water quality index: Ribeira do lguape river watershed. Ecol. Indic. 2009, 9, 1188–1197. [Google Scholar] [CrossRef]
- Seilheimer, T.; Chow, P. Application of the Wetland Fish Index to Northern Great Lakes Marshes with emphasis on Georgian Bay Coastal Wetlands. J. Great Lakes Res. 2007, 33, 154–171. [Google Scholar] [CrossRef]
- Simeonov, V.; Stratis, J.; Samara, C. Assessment of the surface water quality in Northern Greece. Water Res. 2003, 37, 4119–4124. [Google Scholar] [CrossRef]
- Zhang, Y.; Guo, F.; Meng, W. Water quality assessment and source identification of Daliao river basin using multivariate statistical methods. Environ. Monit. Assess 2009, 152, 105–121. [Google Scholar] [CrossRef]
- Marsili-Libelli, S.; Giusti, E. Water quality modelling for small river basins. Environ. Model. Softw. 2008, 23, 451–463. [Google Scholar] [CrossRef] [Green Version]
- Argent, R.; Perraud, J.; Rahman, J.M.; Grayson, R.B.; Podger, G.M. A new approach to water quality modelling and environmental decision support systems. Environ. Model. Softw. 2009, 24, 809–818. [Google Scholar] [CrossRef]
- Hui, Y. A framework for assessing the adequacy of Water Quality Index—Quantifying parameter sensitivity and uncertainties in missing values distribution. Sci. Total Environ. 2021, 751, 141982. [Google Scholar]
- Wu, Z. Assessing river water quality using water quality index in Lake Taihu Basin, China. Sci. Total Environ. 2018, 612, 914–922. [Google Scholar] [CrossRef]
- Nong, X. Evaluation of water quality in the South-to-North Water Diversion Project of China using the water quality index (WQI) method. Water Res. 2020, 178, 115781. [Google Scholar] [CrossRef]
- Wei, S. Application of modified water quality indices as indicators to assess the spatial and temporal trends of water quality in the Dongjiang River. Ecol. Indic. 2016, 66, 306–312. [Google Scholar]
- Koçer, M.A.T.; Sevgili, H. Parameters selection for water quality index in the assessment of the environmental impacts of land-based trout farms. Ecol. Indic. 2014, 36, 672–681. [Google Scholar] [CrossRef]
- Yang, L. Analyzing Spatio-temporal Characteristics of Water Quality in Jinyin Lake Using Water Quality Crucial Index(WQImin). J. Yangtze River Sci. Res. Inst. 2022, 4, 49–55+62. [Google Scholar]
- Franceschini, S.; Tsai, C. Assessment of uncertainty sources in water quality modeling in the Niagara River. Adv. Water Resourc. 2010, 33, 493–503. [Google Scholar] [CrossRef]
- Vandenberghe, V.; Bauwens, W.; Vanrolleghem, P. Evaluation of uncertainty propagation into river water quality predictions to guide future monitoring campaigns. Environ. Model. Softw. 2007, 22, 725–732. [Google Scholar] [CrossRef]
- Ronald, E.; Robert, E. Analysis of the error in the standard approximation used for multiplication of triangular and trapezoidal fuzzy numbers and the development of a new approximation. Fuzzy Sets Syst. 1997, 91, 1–13. [Google Scholar]
- Freni, G.; Mannina, G.; Viviani, G. Uncertainty in urban stormwater quality modelling: The effect of acceptability threshold in the GLUE methodology. Water Res. 2008, 42, 2061–2072. [Google Scholar] [CrossRef] [PubMed]
- Liu, Y.; Yang, P.; Hu, C. Water quality modeling for load reduction under uncertainty: A Bayesian approach. Water Res. 2008, 42, 3305–3314. [Google Scholar] [CrossRef]
- Liao, J.; Wang, W.; Ding, J. Comprehensive Assessment of Water Quality on Main Rivers in Sichuan by Bayes Method. J. Sichuan Norm. Univ. (Natl. Sci.) 2007, 04, 519–522. [Google Scholar]
- Huang, J.; Zhang, Y.; Arhonditsis, G. How successful are the restoration efforts of China’s lakes and reservoirs? Environ. Int. 2019, 123, 96–103. [Google Scholar] [CrossRef]
- Zhuo, L.; Chen, J.; Shi, P. Modeling PopulationDensity of China in 1998 Base on DMSP/OLS Nighttime Light Image. Acta Geogr. Sin. 2005, 60, 266–276. [Google Scholar]
- Huang, X. Discussion on Population Issue in Sustainable Development of Social-economy in the Pearl River Delta. Geogr. Geo-Inf. Sci. 2003, 19, 109–112. [Google Scholar]
- Xiao, D.; Yang, S. A review of population spatial distribution based on nighttime light data. Remote Sens. Natl. Resourc. 2019, 31, 10–19. [Google Scholar]
- Li, F.; Zhang, X.; Liao, S. Capability assessment of DMSP-OLS and NPP-VIIRS nighttime light data estimating statistical indicators: A case of county-level GDP, population and energy consumption in Beijing-Tianjin-Hebei region. Bull. Surv. Map. 2020, 118, 89–93. [Google Scholar]
- Song, J.; Tong, X.; Wang, L. Monitoring finer-scale population density in urban functional zones: A remote sensing data fusion approach. Landsc. Urban Plan. 2019, 190, 103580. [Google Scholar] [CrossRef]
- Li, X.; Zhou, W. Dasymetric mapping of urban population in China based on radiance corrected DMSP-OLS nighttime light and land cover data. Sci. Total Environ. 2018, 643, 1248–1256. [Google Scholar] [CrossRef]
- Wang, Y.; Huang, C.; Zhao, M. Mapping the population density in mainland China using NPP/VIIRS and points-of-interest data based on a random forests model. Remote Sens. 2020, 12, 3645. [Google Scholar] [CrossRef]
- Li, X.; Han, S.; Shao, G. Multiple analyses on time-temporal change of water quality in major rivers of Tongzhou, Beijing. Environ. Chem. 2022, 41, 2896–2907. [Google Scholar]
- Wei, J.; Wan, J. Research on the Characteristic and the Source of Ammonia Nitrogen in Inner-river. Environ. Monit. China 2006, 2, 62–65. [Google Scholar]


| Water Quality Class | NH3-N/mg·L−1 | COD/mg·L−1 | DO/mg·L−1 | NTU/FTU |
|---|---|---|---|---|
| I | 0.15 | 15 | 7.5 | 15 |
| II | 0.5 | 15 | 6 | 20 |
| II | 1 | 20 | 5 | 25 |
| IV | 1.5 | 30 | 3 | 35 |
| V | 2 | 40 | 2 | 50 |
| Section | Shakou Sluice | Jinsha New Town | Renmin Bridge | Hengjiao | Sanzhou |
|---|---|---|---|---|---|
| 2016 | −278.89 | 17.39 | −60.01 | −26.26 | −69.55 |
| 2017 | 40.38 | / | −60.01 | −20.78 | −122.09 |
| 2018 | 30.43 | / | 1.56 | −322.50 | −66.92 |
| 2019 | −5.68 | −64.76 | −11.16 | −64.21 | −24.62 |
| 2020 | 38.19 | 6.20 | −28.43 | −16.62 | 0.33 |
| 2021 | 58.06 | −88.82 | −33.06 | −30.52 | −10.77 |
| Average | −19.59 | −32.50 | −31.85 | −80.15 | −48.94 |
| Maximum | 58.06 | 17.39 | 1.56 | −16.62 | 0.33 |
| Minimum | −278.89 | −88.82 | −60.01 | −322.50 | −122.09 |
| Section | Shakou Sluice | Jinsha New Town | Renmin Bridge | Hengjiao | Sanzhou |
|---|---|---|---|---|---|
| Maximum | 100 | 100 | 100 | 91.18 | 94.21 |
| Minimum | −198.6 | −82.92 | −298.4 | −239.2 | −203.65 |
| Average | 82.5 | 40.04 | 36.04 | 37.54 | 36.88 |
| Principal Component | Variance Contribution (%) | Cumulative Variance Contribution (%) | Upstream Water Quality | Population Density | Economic Situation | Effluent Concentration of Sewage Plants | Treatment Capacity of Sewage Plants | Flow Rate | Precipitation |
|---|---|---|---|---|---|---|---|---|---|
| 1 | 0.523 | 0.523 | 0.464 | 0.467 | 0.346 | −0.494 | 0.441 | −0.093 | −0.675 |
| 2 | 0.268 | 0.791 | 0.067 | 0.059 | −0.072 | −0.037 | −0.239 | 0.013 | −0.687 |
| 3 | 0.092 | 0.883 | |||||||
| 4 | 0.041 | 0.924 | |||||||
| 5 | 0.035 | 0.959 | |||||||
| 6 | 0.024 | 0.983 | |||||||
| 7 | 0.017 | 1.000 |
Publisher’s Note: MDPI stays neutral with regard to jurisdictional claims in published maps and institutional affiliations. |
© 2022 by the authors. Licensee MDPI, Basel, Switzerland. This article is an open access article distributed under the terms and conditions of the Creative Commons Attribution (CC BY) license (https://creativecommons.org/licenses/by/4.0/).
Share and Cite
Pang, J.; Lin, K.; Gan, W.; Hu, S.; Luo, W. Contamination Assessment and Source Analysis of Urban Waterways Based on Bayesian and Principal Component Analysis—A Case Study of Fenjiang River. Water 2022, 14, 2912. https://doi.org/10.3390/w14182912
Pang J, Lin K, Gan W, Hu S, Luo W. Contamination Assessment and Source Analysis of Urban Waterways Based on Bayesian and Principal Component Analysis—A Case Study of Fenjiang River. Water. 2022; 14(18):2912. https://doi.org/10.3390/w14182912
Chicago/Turabian StylePang, Jiafeng, Kairong Lin, Wenhui Gan, Sike Hu, and Wei Luo. 2022. "Contamination Assessment and Source Analysis of Urban Waterways Based on Bayesian and Principal Component Analysis—A Case Study of Fenjiang River" Water 14, no. 18: 2912. https://doi.org/10.3390/w14182912