
A Framework for Water Security Data Gathering Strategies

 , ,
, ,  , ,
, ,  ,
,  ,
,
Abstract
:1. Introduction
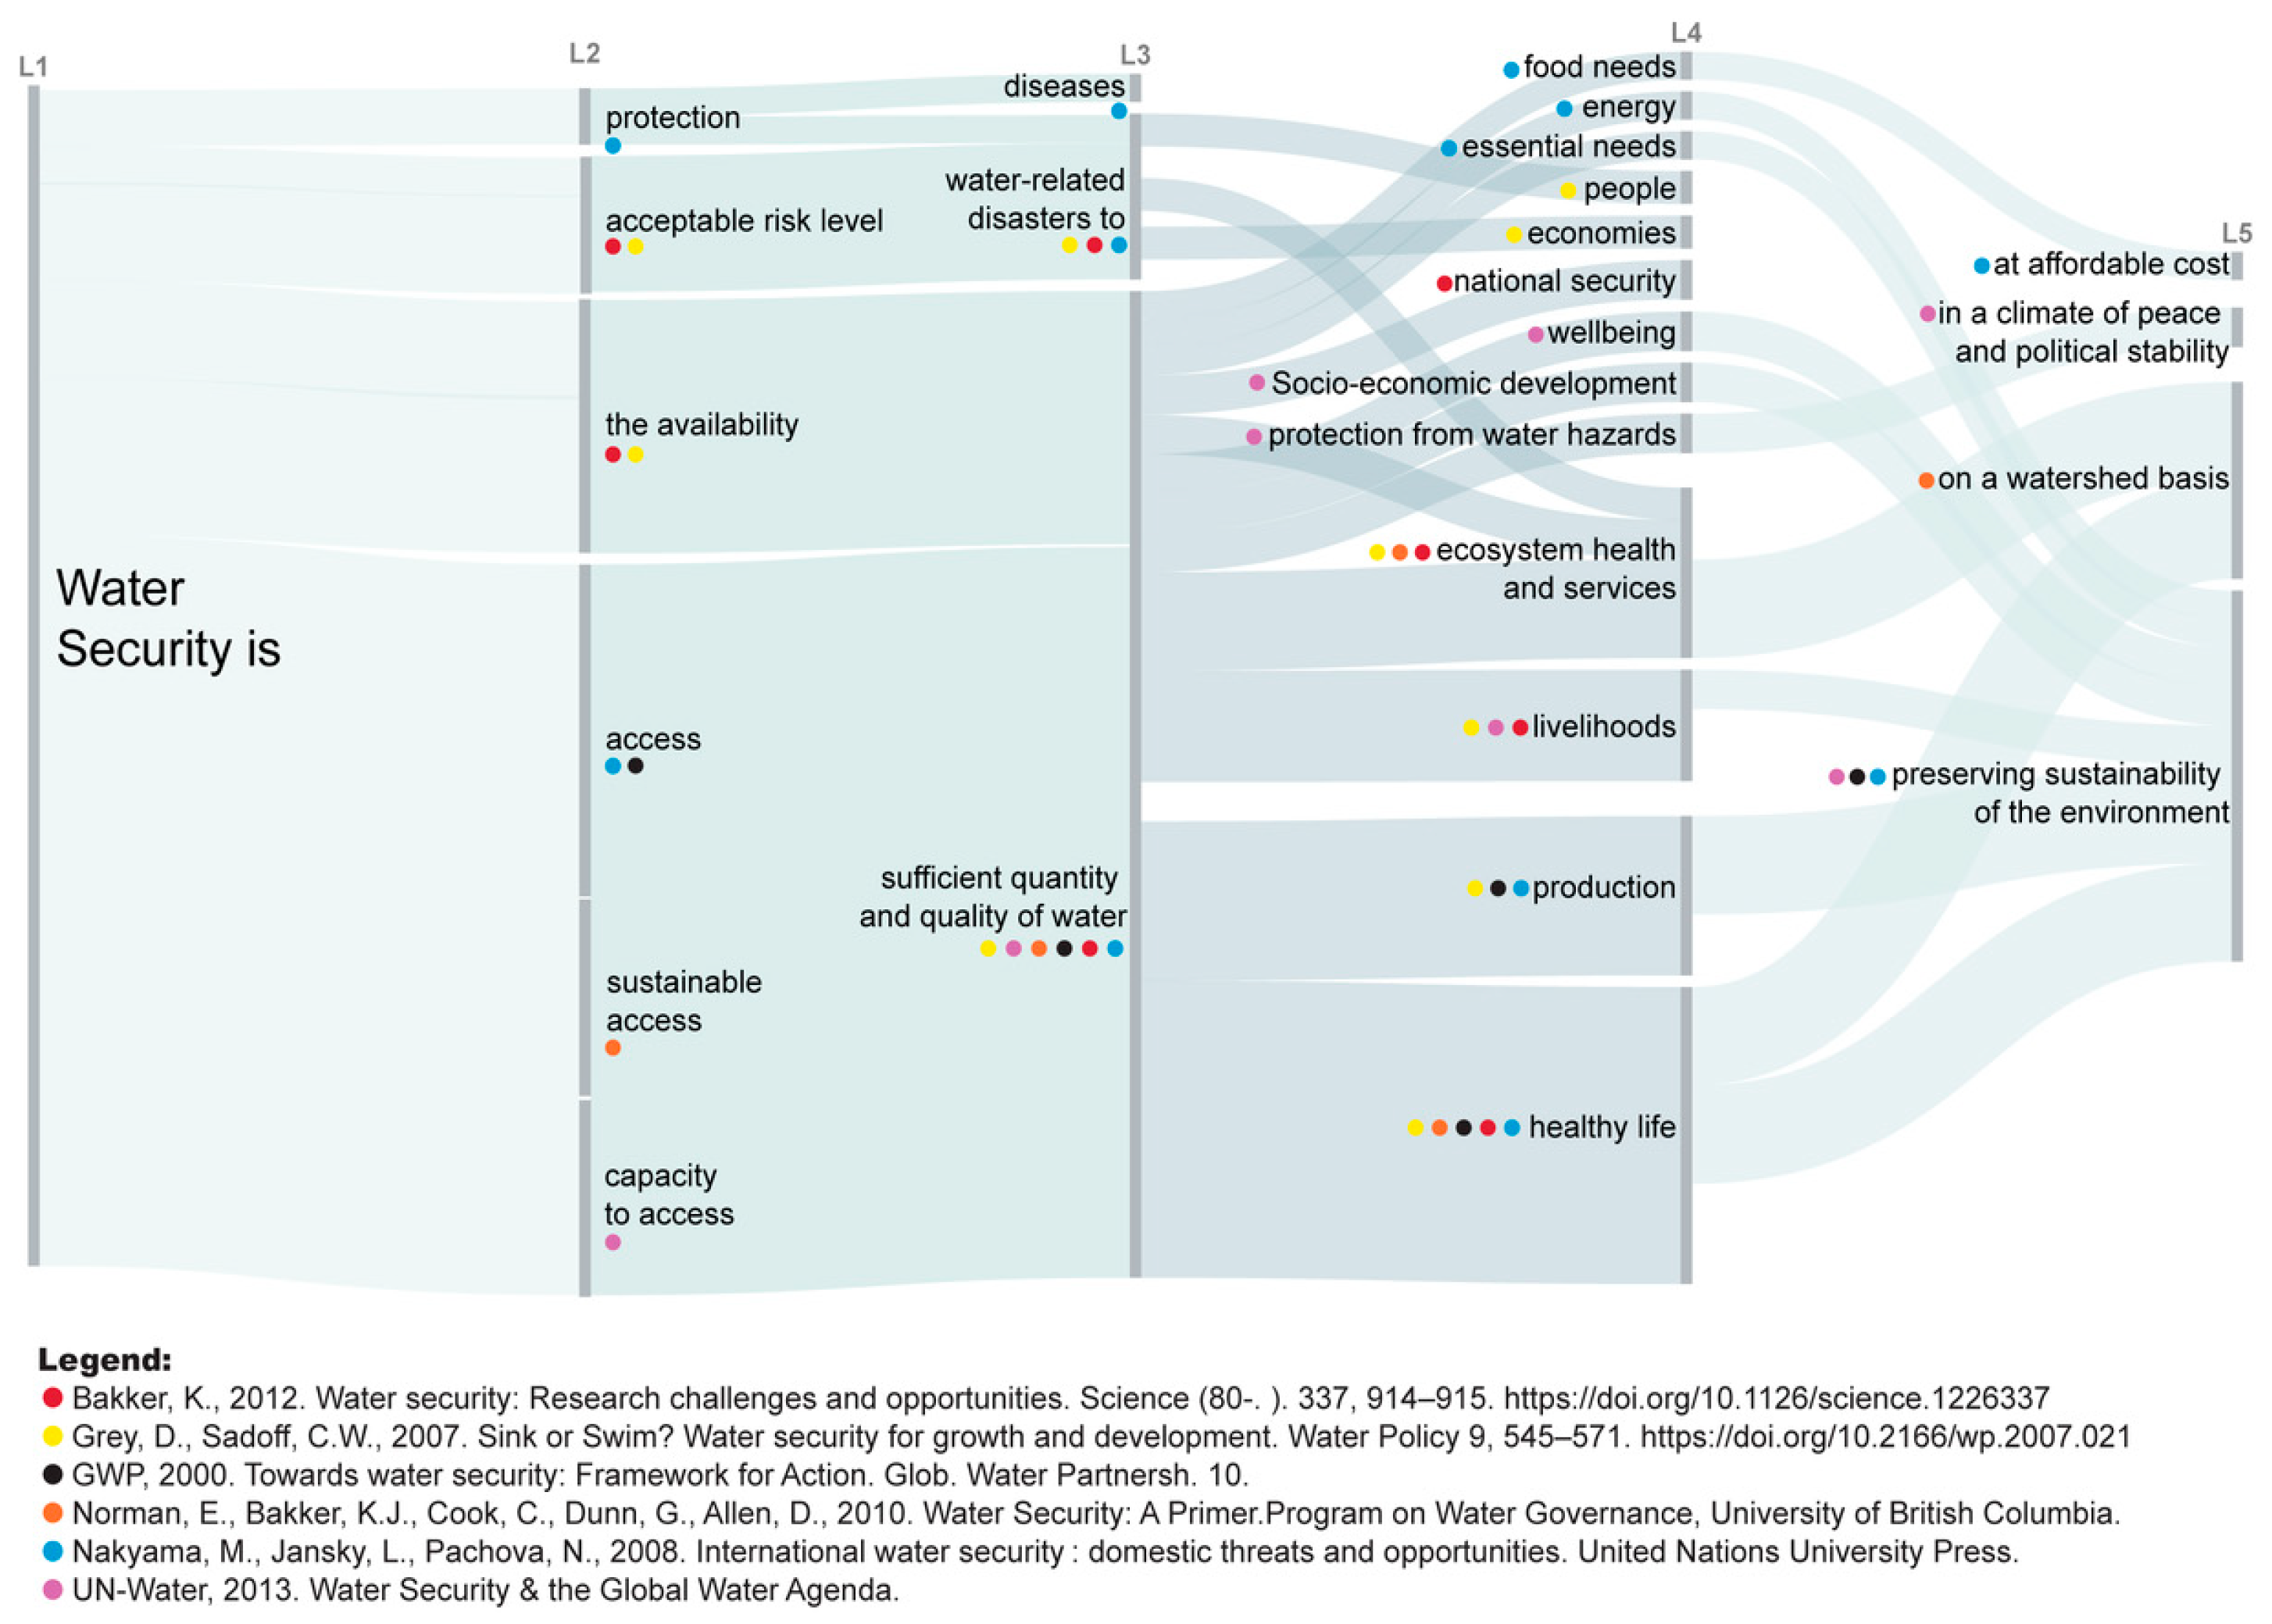
Water Security: A Complex Concept
- Identify the key issues that a Data Gathering Strategy for Water Security (DGSxWS) must address.
- Document the key challenges and opportunities for each issue.
- Help researchers and practitioners in WS to itemise and categorise those challenges and opportunities for better planning and monitoring.
- Suggest activities, approaches, and references that can support the operationalization of the framework.
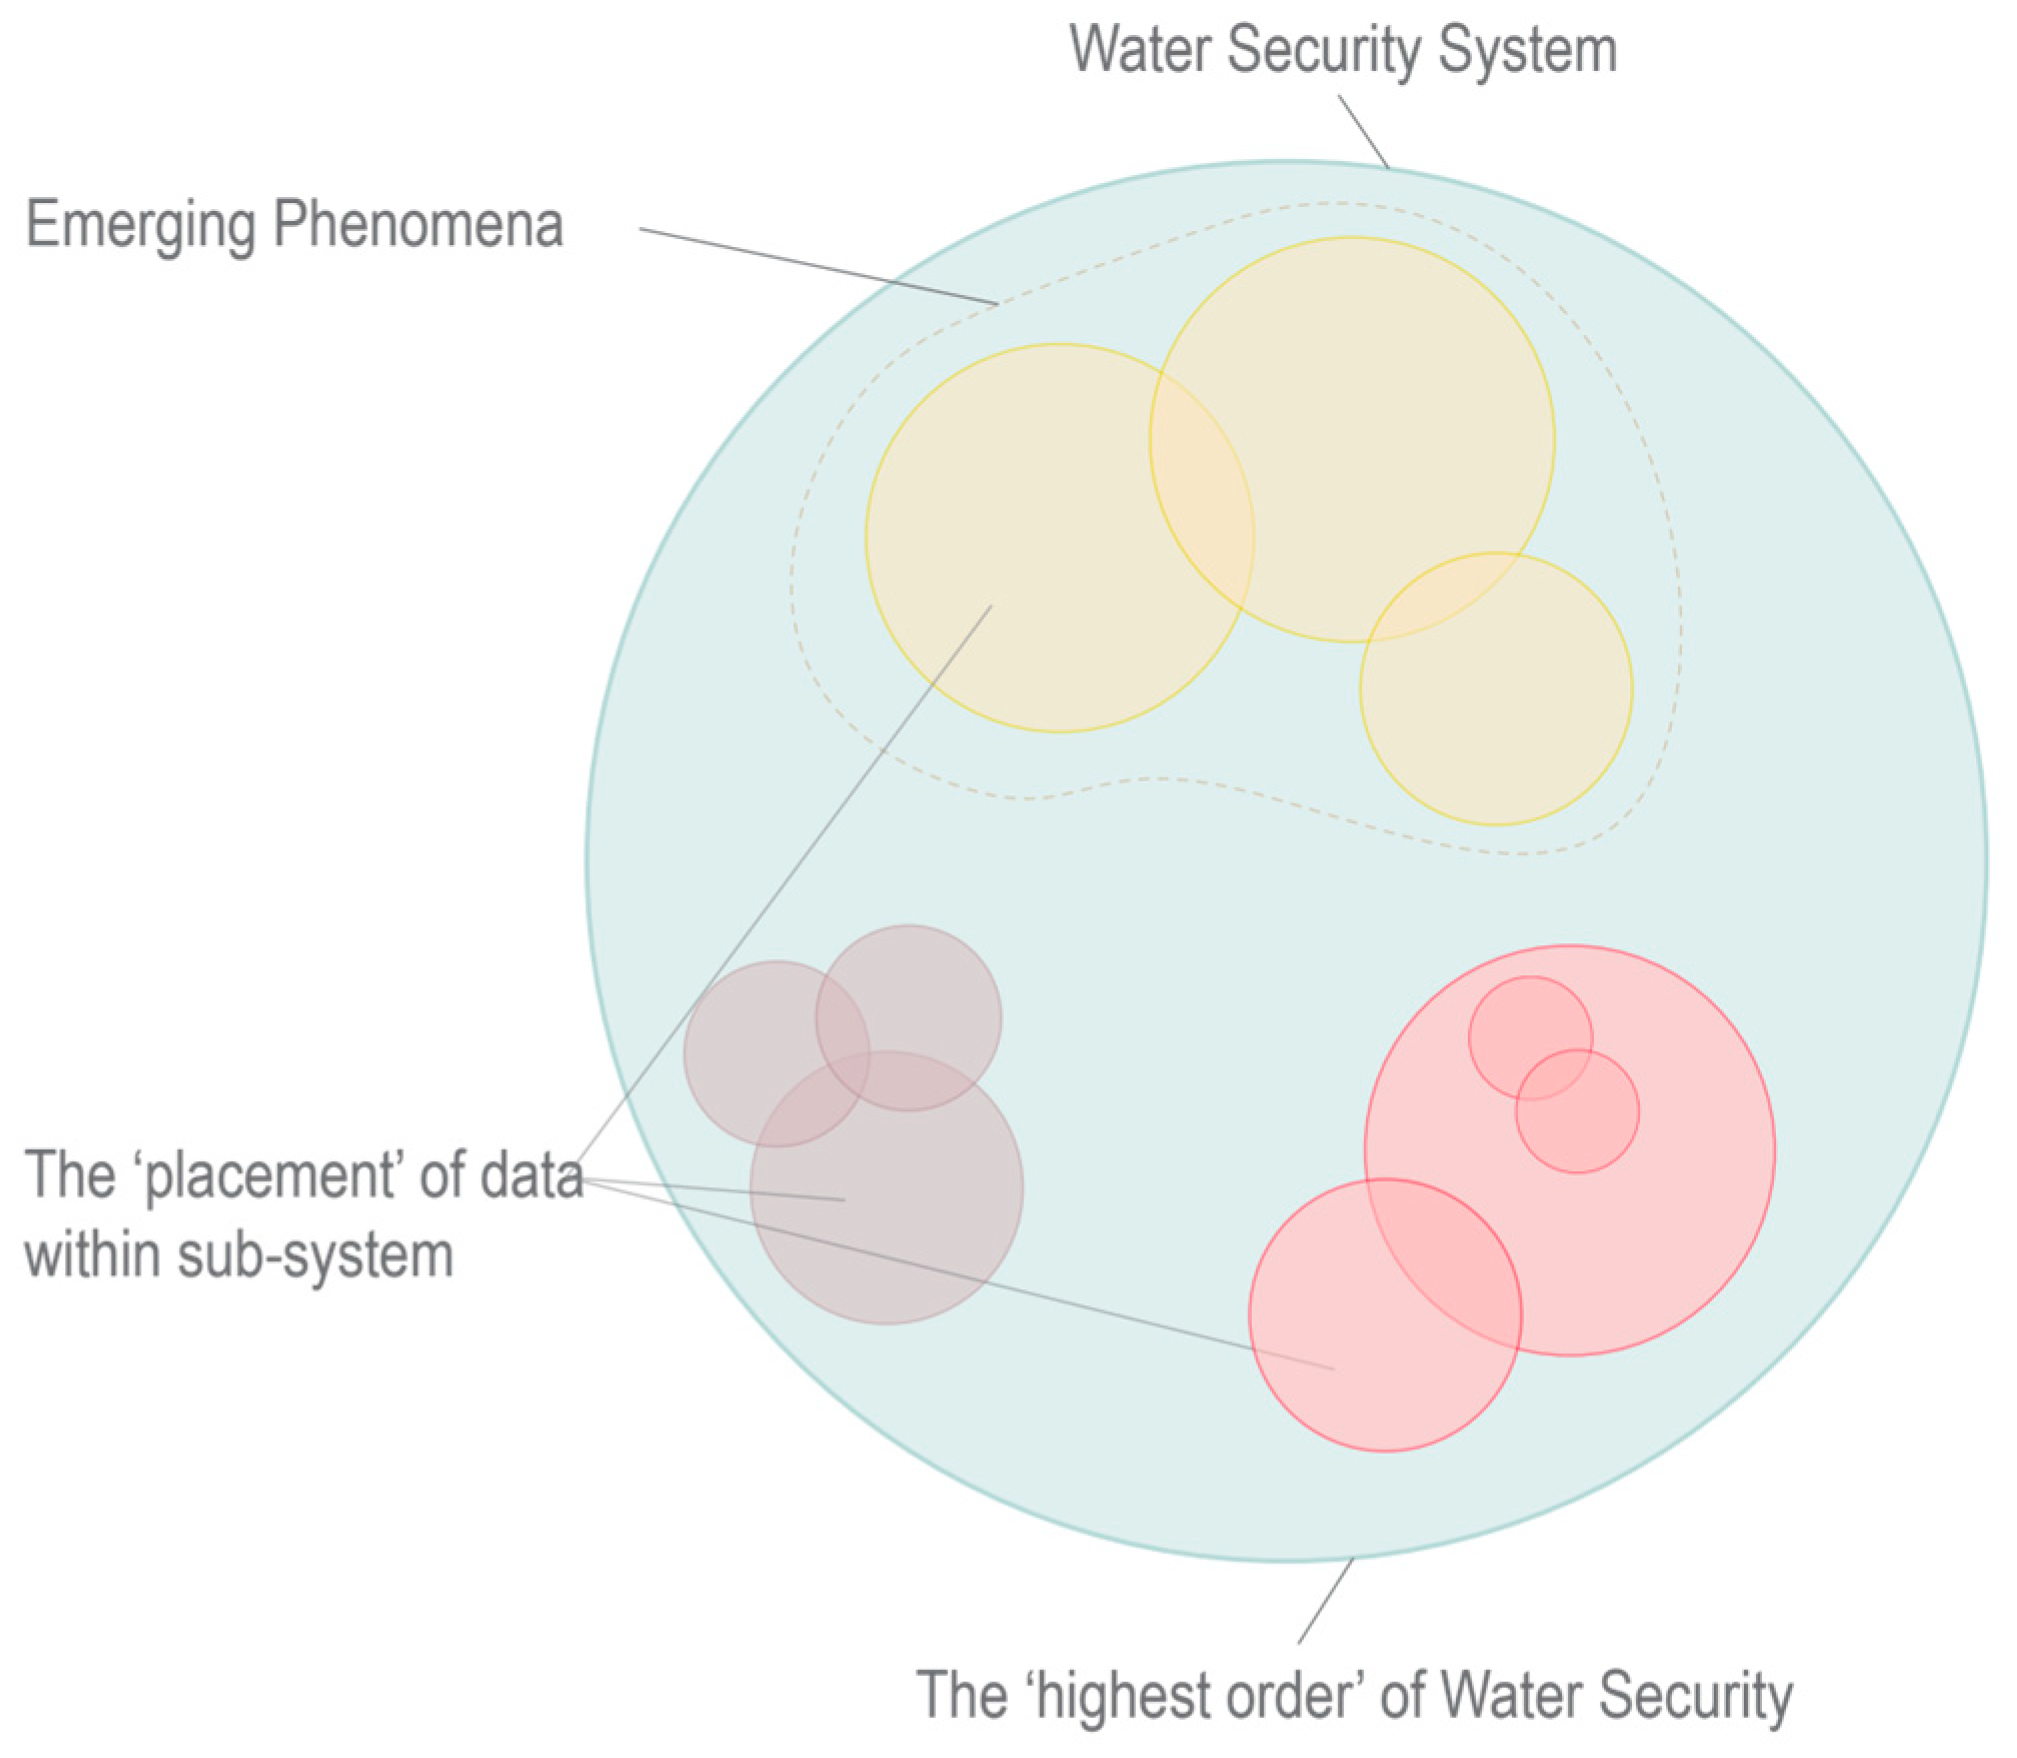
2. Conceptual and Operational Systems
3. Data Bases and Systems
4. Proposed Interfaces of the DGSxWS
- Credibility is the creation of authoritative, believable, and trusted information;
- Legitimacy is how “fair” an information-producing process is and whether it considers appropriate values, concerns, and perspectives of different actors;
- Salience is how relevant it is to decision making bodies or the public.
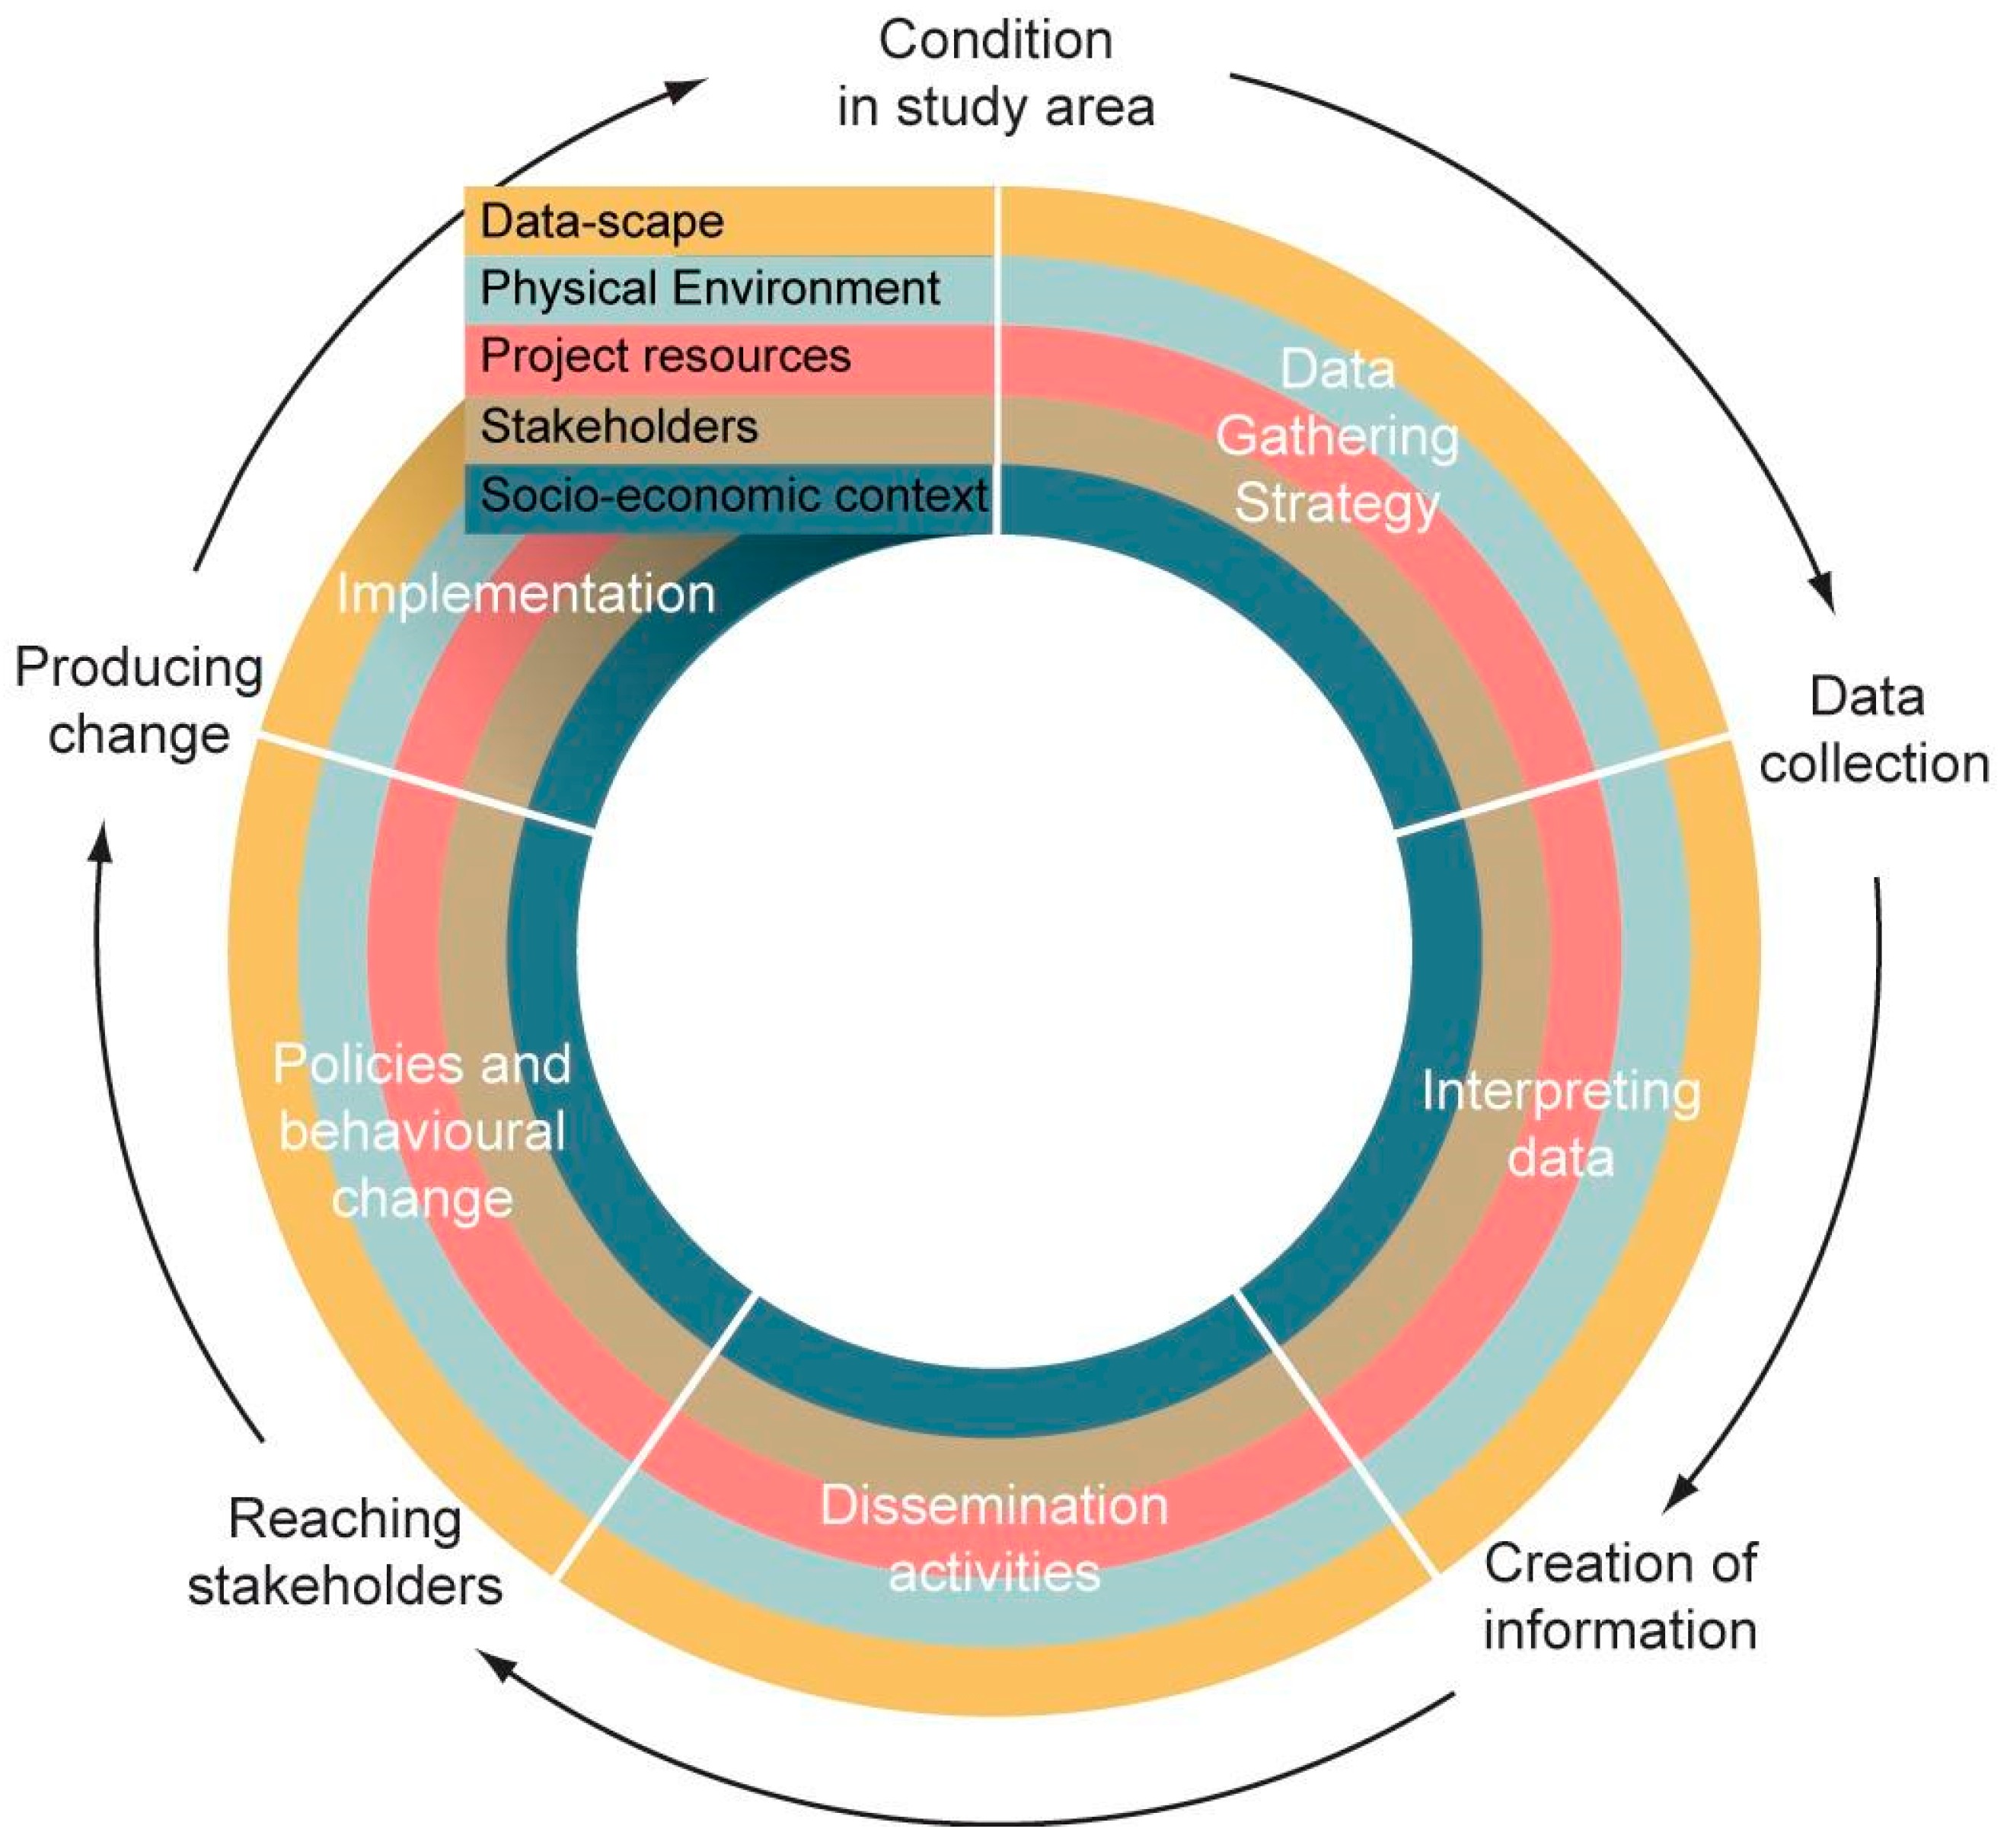
4.1. Interface with the Existing Data-Scape
4.2. Interface with the Physical Environment
4.3. Interface with the Available Project Resources
4.4. Interface with Stakeholders
4.5. Interface with the Socio-Economic Context
5. Minimisation of Uncertainty and Ambiguity
5.1. Minimisation of Uncertainty
5.2. Minimisation of Ambiguity
6. Water Security and Data Collection Strategy
6.1. Challenges
6.2. Suggested Steps

| Goal | Activity | References |
|---|---|---|
| A. Data-scape (data collected are harmonised and comparable with existing data) | ||
| A.1 Determine data requirements | Review of data requirements based on legislation, existing datasets, donors | [156,157,158,159,160] |
| A.2 Harmonise data with existing ones to fill gaps and avoid duplication | Review existing secondary data for the WS dimension addressed in the DGS | [38,59,161] |
| A.3 Set data management plan | Understand how to deal with data along the whole process (collect, edit, store, process, communicate) | [13,36,41,162] |
| Complement the plan if risk analysis was considered in the aims of the project | [125] | |
| A.4 Collect and preserve data following the FAIR guiding principles | Guarantee the collection and reuse of data in the future by considering open-access approaches and FAIR principles | [40,163] |
| B. Physical Environment (data are able to capture variability with acceptable level of statistical power and uncertainty) | ||
| B.1 Basic characterisation of study area | Definition of basin boundaries and basic characterisation, including places of local amenities related to water | [164,165] |
| B.2 Define scope and aim of investigation to ensure that data will translate into valuable information | Identify WS dimension(s) for primary data collection | [12,13,101,144] |
| Identify hypothesis to be testedIdentify possible interactions between dimensions, indicators, variables | ||
| B.4 Collect secondary data | Build own dataset from existing open sources | [166,167,168,169,170] |
| B.4 Primary data: sampling design and data collection | Draft sampling location based on project resources, hypothesis, and considering the places where hazards are created and risk manifest | [130,135,139,140,141,146,171] |
| Draft sampling parameters based on hypothesis to be tested, existing data, project resources | [2,11,131,146,147,156,172,173,174] | |
| Draft sampling frequency and times based on project resources and hypothesis to be tested (e.g., drinking water quality may deteriorate due to low velocities and high water age, i.e., low or null water demand during night times in residential areas; illegal wastewater discharges may occur during night times, etc.) | [78,136,137,156,172] | |
| Choose sampling methods | [149,152,153,156,172] | |
| Choose appropriate laboratories according to analytical methods, certifications, and proximity to sampling locations to deliver samples at the right time | [138] | |
| Verify that sampling plan has enough statistical power to test the chosen hypothesis | [175] | |
| Create a team for sample collection and train them accordingly | [176] | |
| B.5 Ensure data quality control | Data quality control is in place | [149,152] |
| B.6 Analyse risks I | Identify hazards and location | [125,177,178,179] |
| Identify vulnerabilities of people and assets | [125] | |
| Specify temporal considerations: period when hazardous events were observed and period when consequences were defined | [180] | |
| Report qualitative and quantitative uncertainties: probabilities and surprises (unknown unknowns, known unknowns, ignored events due to low probability of occurrence) | [125] | |
| Judge the strength of the knowledge | [125] | |
| C. Project resources (data strategies optimise project resources) | ||
| C.1 Understand project constraints (time, cost, and quality) and the feasibility of sampling strategy for these constraints | Assess project resources in the planning phase in terms of budget, time, scope, and quality of deliverables | [87,181] |
| Verify that the sampling strategy is feasible within these constraints | [87] | |
| C.2 Optimise the drafted sampling strategy in relation to available resources | Revise sampling strategy | [182] |
| C.3 Plan for data while you plan the project | Prepare a knowledge management plan (for enterprise) or a data management plan (for research) during the planning phase of a project and keep them updated while monitoring and controlling the project’s implementation | [93,94] |
| C.4 Maintain agility and ensure a continuous cycle of feedback | Continuously evaluate any discrepancies between what is planned and what is implemented | [183] |
| Adjust sampling strategy accordingly (in case of deficit or surplus in any of the project’s constraints) | ||
| C.5 Avoid the failure of either project or data strategy through maintaining the right balance of resource allocation | Avoid letting the sampling strategy exploit more resources than planned or letting the other components of the project expand on the expense of sampling strategy | [184,185] |
| C.6 Invest in training and capacity development | Building capacity, on the institutional and individual levels, by providing tailored training to achieve a proper implementation of all strategies and actions | [186,187,188] |
| D. Stakeholder (information produced by data reaches relevant stakeholders (policy makers, community, private sector)) | ||
| D.1 Understand role of stakeholders and their possible engagement | Stakeholder mapping and analysis | [189] |
| D.2 Understand from key stakeholder, their information needs related to the study topic | Participatory Needs Assessment | [133] |
| D.3 Analyse risks II | Map the stakeholder landscape to identify for whom and how assessments could be useful and to help identify opportunities for managing particular risks | [190,191,192,193] |
| Determine actors and their mutual influences such as their capabilities for actions or effects, their goals and incentives, their use of communication channels and the nature of those channels, their knowledge, vulnerabilities, and values | [194] | |
| Carry out a conceptual model to identify power relationships and their direction and conflicts | [28] | |
| Involve river basin stakeholders and experts during the whole process | [195,196,197,198] | |
| Set clear ways of how stakeholders will participate and how their inputs will be included in the analysis | [98,199,200,201] | |
| Contact stakeholders and socialise the project with them, explaining objectives, potential impacts, and the importance of their participation | ||
| Manage clear expectations | ||
| Identify stakeholders’ water values and risk perceptions | ||
| D.4 Plan how to reach stakeholder with new information produced | Participatory workshops | |
| D.5 Involve key stakeholders in the dissemination and process | Plan for participation | |
| D.6 Incorporate local knowledge from informal pathways | Local knowledge mining activities such as community mapping and participatory GIS | [202,203] |
| D.7 Ethical considerations | Define an ethical protocol for the exchange of information Signing of informed consent Document the process of interaction with stakeholders, especially when conflicts arise | Ethics Forms and Processes (https://www.ncl.ac.uk/research/researchgovernance/ethics/process/, accessed on 1st March 2022) |
| D.8 Co-production of information on local scales | Citizen science | [56,57,110] |
| E. Socio-economic context (data strategy takes into consideration specific characteristics) | ||
| E.1 Identify elements that characterise the context | Place-based definition of WS | |
| Map existence and location of ethnic communities in the river basin | [204] | |
| E.2 Assess external context identifying key factors that could promote water insecurity | Conduct a Rapid Assessment of WS system from secondary data and existing tools. | [144,177,205] |
| E.3 Analyse risks III | Identify individuals, populations, or assets exposed to hazards | [125,206] |
| Characterise exposed people according to gender, ethnicity, age, socio-economic status, etc. | [125,206] | |
| Determine exposure paths to hazards | [125,206] | |
| Quantify, exposure, or describe it qualitatively if uncertainty is high | [125,206] | |
| Identify vulnerabilities of individuals, populations, or assets exposed to hazards | [125,206] | |
| Include resilience as part of the vulnerability identification | [125] | |
| E.4 Understand causal relations, synergies, and trade-offs between system components | Social metabolism analysis | [207] |
7. Conclusions
Author Contributions
Funding
Acknowledgments
Conflicts of Interest
References
- World Economic Forum. The Global Risk Report. 2019. Available online: https://www.weforum.org/reports/the-global-risks-report-2019 (accessed on 1 June 2022).
- GWP. Assessing Water Security with Appropriate Indicators. Glob. Water Partnersh. 2014. Available online: https://www.gwp.org/globalassets/global/toolbox/publications/p763_gwp_proceedings_paper.pdf (accessed on 1 June 2022).
- Gain, A.K.; Giupponi, C.; Wada, Y. Measuring Global Water Security towards Sustainable Development Goals. Environ. Res. Lett. 2016, 11, 124015. [Google Scholar] [CrossRef]
- Garrick, D.; Hall, J.W. Water Security and Society: Risks, Metrics, and Pathways. Annu. Rev. Environ. Resour. 2014, 39, 611–639. [Google Scholar] [CrossRef]
- Lautze, J.; Manthrithilake, H. Water Security: Old Concepts, New Package, What Value? Nat. Resour. Forum 2012, 36, 76–87. [Google Scholar] [CrossRef]
- Staddon, C.; James, N. Water Security: A Genealogy of Emerging Discourses. In Globalized Water: A Question of Governance; Schneier-Madanes, G., Ed.; Springer: Dordrecht, The Netherlands, 2014; pp. 261–276. [Google Scholar] [CrossRef]
- Tarlock, D.; Wouters, P. Reframing the Water Security Dialogue. J. Water Law 2009, 20, 53–60. [Google Scholar]
- Cook, C.; Bakker, K. Water Security: Debating an Emerging Paradigm. Glob. Environ. Change 2012, 22, 94–102. [Google Scholar] [CrossRef]
- Gerlak, A.K.; House-Peters, L.; Varady, R.G.; Albrecht, T.; Zúñiga-Terán, A.; Grenade, R.R.; Cook, C.; Scott, C.A. Water Security: A Review of Place-Based Research. Environ. Sci. Policy 2018, 82, 79–89. [Google Scholar] [CrossRef]
- Hoekstra, A.Y.; Buurman, J.; van Ginkel, K.C.H. Urban Water Security: A Review. Environ. Res. Lett. 2018, 13, 053002. [Google Scholar] [CrossRef]
- Mason, N.; Calow, R. Water Security: From Abstract Concept to Meaningful Metrics, An Initial Overview of Options; Overseas Development Institute: London, UK, 2012. [Google Scholar]
- Plummer, R.; Loë, R.; Armitage, D. A Systematic Review of Water Vulnerability Assessment Tools. Water Resour. Manag 2012, 26, 4327–4346. [Google Scholar] [CrossRef]
- Octavianti, T.; Staddon, C. A Review of 80 Assessment Tools Measuring Water Security; Wiley: Hoboken, NJ, USA, 2021. [Google Scholar]
- Brown, A. A Review of Water Scarcity Indices and Methodologies; University of Arkansas: Fayetteville, AR, USA, 2011. [Google Scholar]
- Lehtonen, M. Indicators: Tools for Informing, Monitoring or Controlling? In The Tools of Policy Formulation; Edward Elgar Publishing: Cheltenham, UK, 2015. [Google Scholar]
- Norman, E.S.; Dunn, G.; Bakker, K.; Allen, D.M.; de Albuquerque, R.C. Water Security Assessment: Integrating Governance and Freshwater Indicators. Water Resour. Manag. 2013, 27, 535–551. [Google Scholar] [CrossRef]
- Holding, S.; Allen, D.M. Risk to Water Security for Small Islands: An Assessment Framework and Application. Reg. Environ. Chang. 2016, 16, 827–839. [Google Scholar] [CrossRef]
- Norman, E.S.; Bakker, K.; Dunn, G. Recent Developments in Canadian Water Policy: An Emerging Water Security Paradigm. Can. Water Resour. J. 2011, 36, 53–66. [Google Scholar] [CrossRef]
- Nations, U. Sustainable Development Goal 6: Synthesis Report on Water and Sanitation; United Nations: New York, NY, USA, 2018. [Google Scholar]
- UN-Water. Monitoring Water and Sanitation in the 2030 Agenda for Sustainable Development Water and Sanitation in the 2030 Agenda for Sustainable Development; UN-Water: Geneva, Switzerland, 2016. [Google Scholar]
- UN-Water. UN-Hlpw World Water Data Initiative; UN-Water: Geneva, Switzerland, 2017. [Google Scholar]
- UN-Water. Monitoring Progress in the Water Sector; UN-Water: Geneva, Switzerland, 2010. [Google Scholar]
- Schmidt-Traub, G.; Kroll, C.; Teksoz, K.; Durand-Delacre, D.; Sachs, J.D. National Baselines for the Sustainable Development Goals Assessed in the SDG Index and Dashboards. Nat. Geosci. 2017, 10, 547–555. [Google Scholar] [CrossRef]
- WHO. National Systems to Support Drinking-Water, Sanitation and Hygiene: Global Status Report 2019; WHO: Geneva, Switzerland, 2019.
- WHO; UNICEF. Progress on Household Drinking Water, Sanitation and Hygiene 2000–2017; UNICEF: New York, NY, USA; WHO: Geneva, Switzerland, 2019.
- Grey, A.D.; Garrick, D.; Blackmore, D.; Kelman, J.; Muller, M.; Sadoff, C. Water Security in a Blue Planet: Twenty First Century Policy Challenge for Science. Philos. Trans. R. Soc. A Math. Phys. Eng. Sci. 2013, 371, 1–10. [Google Scholar] [CrossRef] [PubMed]
- York, P.; Bamberger, M. Measuring Results and Impact in the Age of Big Data: The Nexus of Evaluation, Analytics, and Digital Technology; The Rockefeller Foundation: New York, NY, USA, 2020. [Google Scholar]
- Checkland, P.; Poulter, J. Learning for Action: A Short Definitive Account of Soft Systems Methodology, and Its Use for Practitioners, Teachers and Students; Wiley: Hoboken, NJ, USA, 2006. [Google Scholar]
- Dickson, S.E.; Schuster-Wallace, C.J.; Newton, J.J. Water Security Assessment Indicators: The Rural Context. Water Resour. Manag. 2016, 30, 1567–1604. [Google Scholar] [CrossRef]
- Hipel, K.W.; Fang, L.; Ouarda, T.B.M.J.; Bristow, M. An Introduction to the Special Issue on Tackling Challenging Water Resources Problems in Canada: A Systems Approach. Can. Water Resour. J. 2013, 38, 3–11. [Google Scholar] [CrossRef]
- World Bank. World Development Report 2003: Sustainable Development in a Dynamic World--Transforming Institutions, Growth, and Quality of Life; World Bank: Washington, DC, USA, 2003. [Google Scholar]
- Bogardi, J.J.; Dudgeon, D.; Lawford, R.; Flinkerbusch, E.; Meyn, A.; Pahl-Wostl, C.; Vielhauer, K.; Vörösmarty, C. Water Security for a Planet under Pressure: Interconnected Challenges of a Changing World Call for Sustainable Solutions. Curr. Opin. Environ. Sustain. 2012, 4, 35–43. [Google Scholar] [CrossRef]
- Briscoe, J. Water Security Why It Matters and What to Do about It, Hydrology. Innov. Technol. Gov. Glob. 2009, 4, 3–28. [Google Scholar] [CrossRef]
- Ward, R.C.; Loftis, J.C.; McBride, G.B. The “Data-Rich but Information-Poor” Syndrome in Water Quality Monitoring. Environ. Manag. 1986, 10, 291–297. [Google Scholar] [CrossRef]
- Cash, D.; Clark, W.C.; Alcock, F.; Dickson, N.; Eckley, N.; Jager, J. Salience, Credibility, Legitimacy and Boundaries: Linking Research. Assess. Decis. Mak. SSRN Electron. J. 2002. [Google Scholar] [CrossRef]
- Hox, J.J.; Boeije, H.R. Data Collection, Primary vs Secondary. Encycl. Soc. Meas. 2005, 1, 593–599. [Google Scholar] [CrossRef]
- NERC. Data Tree: A Free Online Course Related to Research Data Management by the Natural Environment Research Council (NERC). Available online: https://datatree.org.uk/ (accessed on 15 October 2021).
- Jensen, O.; Wu, H. Urban Water Security Indicators: Development and Pilot. Environ. Sci. Policy 2018, 83, 33–45. [Google Scholar] [CrossRef]
- Hering, D.; Borja, A.; Carstensen, J.; Carvalho, L.; Elliott, M.; Feld, C.K.; Heiskanen, A.-S.; Johnson, R.K.; Moe, J.; Pont, D.; et al. The European Water Framework Directive at the Age of 10: A Critical Review of the Achievements with Recommendations for the Future. Sci. Total Environ. 2010, 408, 4007–4019. [Google Scholar] [CrossRef] [PubMed]
- Wilkinson, M.D.; Dumontier, M.; Aalbersberg, I.J.; Appleton, G.; Axton, M.; Baak, A.; Blomberg, N.; Boiten, J.-W.; da Silva Santos, L.B.; Bourne, P.E.; et al. The FAIR Guiding Principles for Scientific Data Management and Stewardship. Sci. Data 2016, 3, 160018. [Google Scholar] [CrossRef] [PubMed]
- Read, E.K.; Carr, L.; De Cicco, L.; Dugan, H.A.; Hanson, P.C.; Hart, J.A.; Kreft, J.; Read, J.S.; Winslow, L.A. Water Quality Data for National-Scale Aquatic Research: The Water Quality Portal. Water Resour. Res. 2017, 53, 1735–1745. [Google Scholar] [CrossRef]
- OneGeology. Available online: https://onegeology.org (accessed on 1 September 2022).
- US-GIN. U.S. Geoscience Information Network. Available online: https://usgin.org/ (accessed on 1 September 2022).
- OOI. Ocean Observatories Initiative. Available online: https://oceanobservatories.org/ (accessed on 1 September 2022).
- Farnaghi, M.; Mansourian, A. Blockchain an Enabling Technology for Transparent and Accountable Decentralized Public Participatory GIS. Cities 2020, 105, 102850. [Google Scholar] [CrossRef]
- Pincheira, M.; Donini, E.; Giaffreda, R.; Vecchio, M. A blockchain-based approach to enable remote sensing trusted data. ISPRS Ann. Photogramm. Remote Sens. Spat. Inf. Sci. 2020, IV-3/W2-2020, 35–40. [Google Scholar] [CrossRef]
- Ren, Y.; Leng, Y.; Cheng, Y.; Wang, J. Secure Data Storage Based on Blockchain and Coding in Edge Computing. Math. Biosci. Eng. 2019, 16, 1874–1892. [Google Scholar] [CrossRef] [PubMed]
- Zhang, L.; Gao, Y.; Chen, J.; Wang, X.; Huang, Z.; Wei, D. Research on Remote Sensing Data Sharing Model Based on Blockchain Technology. In Proceedings of the 2019 2nd International Conference on Blockchain Technology and Applications, Guangzhou, China, 12–15 November; ACM: New York, NY, USA, 2019. [Google Scholar]
- Teillet, P.M.; Gauthier, R.P.; Chichagov, A.; Fedosejevs, G. Towards Integrated Earth Sensing: Advanced Technologies for in Situ Sensing in the Context of Earth Observation. Can. J. Remote Sens. 2002, 28, 713–718. [Google Scholar] [CrossRef]
- Acharya, K.; Blackburn, A.; Mohammed, J.; Haile, A.T.; Hiruy, A.M.; Werner, D. Metagenomic Water Quality Monitoring with a Portable Laboratory. Water Res. 2020, 184, 116112. [Google Scholar] [CrossRef] [PubMed]
- Glasgow, H.B.; Burkholder, J.M.; Reed, R.E.; Lewitus, A.J.; Kleinman, J.E. Real-Time Remote Monitoring of Water Quality: A Review of Current Applications, and Advancements in Sensor, Telemetry, and Computing Technologies. J. Exp. Mar. Biol. Ecol. 2004, 300, 409–448. [Google Scholar] [CrossRef]
- Soares, L.M.V.; Calijuri, M. do C. Deterministic Modelling of Freshwater Lakes and Reservoirs: Current Trends and Recent Progress. Environ. Model. Softw. 2021, 144, 105143. [Google Scholar] [CrossRef]
- Lally, H.T.; O’Connor, I.; Jensen, O.P.; Graham, C.T. Can Drones Be Used to Conduct Water Sampling in Aquatic Environments? A Review. Sci. Total Environ. 2019, 670, 569–575. [Google Scholar] [CrossRef] [PubMed]
- Chawla, I.; Karthikeyan, L.; Mishra, A.K. A Review of Remote Sensing Applications for Water Security: Quantity, Quality, and Extremes. J. Hydrol. 2020, 585, 124826. [Google Scholar] [CrossRef]
- Bonney, R.; Shirk, J.L.; Phillips, T.B.; Wiggins, A.; Ballard, H.L.; Miller-Rushing, A.J.; Parrish, J.K. Next Steps for Citizen Science. Science 2014, 343, 1436–1437. [Google Scholar] [CrossRef] [PubMed]
- Starkey, E.; Parkin, G.; Birkinshaw, S.; Large, A.; Quinn, P.; Gibson, C. Demonstrating the Value of Community-Based (‘Citizen Science’) Observations for Catchment Modelling and Characterisation. J. Hydrol. 2017, 548, 801–817. [Google Scholar] [CrossRef]
- Walker, D.W.; Smigaj, M.; Tani, M. The Benefits and Negative Impacts of Citizen Science Applications to Water as Experienced by Participants and Communities. WIREs Water 2020, 8, e1488. [Google Scholar] [CrossRef]
- Sagan, V.; Peterson, K.T.; Maimaitijiang, M.; Sidike, P.; Sloan, J.; Greeling, B.A.; Maalouf, S.; Adams, C. Monitoring Inland Water Quality Using Remote Sensing: Potential and Limitations of Spectral Indices, Bio-Optical Simulations, Machine Learning, and Cloud Computing. Earth Sci. Rev. 2020, 205, 103187. [Google Scholar] [CrossRef]
- Gorelick, N.; Hancher, M.; Dixon, M.; Ilyushchenko, S.; Thau, D.; Moore, R. Google Earth Engine: Planetary-Scale Geospatial Analysis for Everyone. Remote Sens. Environ. 2017, 202, 18–27. [Google Scholar] [CrossRef]
- Dhu, T.; Dunn, B.; Lewis, B.; Lymburner, L.; Mueller, N.; Telfer, E.; Lewis, A.; McIntyre, A.; Minchin, S.; Phillips, C. Digital Earth Australia—Unlocking New Value from Earth Observation Data. Big Earth Data 2017, 1, 64–74. [Google Scholar] [CrossRef]
- Dwyer, J.L.; Roy, D.P.; Sauer, B.; Jenkerson, C.B.; Zhang, H.K.; Lymburner, L. Analysis Ready Data: Enabling Analysis of the Landsat Archive. Remote Sens. 2018, 10, 1363. [Google Scholar] [CrossRef]
- Hoeser, T.; Bachofer, F.; Kuenzer, C. Object Detection and Image Segmentation with Deep Learning on Earth Observation Data: A Review—Part II: Applications. Remote Sens. 2020, 12, 3053. [Google Scholar] [CrossRef]
- Krause, C.E.; Newey, V.; Alger, M.J.; Lymburner, L. Mapping and Monitoring the Multi-Decadal Dynamics of Australia’s Open Waterbodies Using Landsat. Remote Sens. 2021, 13, 1437. [Google Scholar] [CrossRef]
- Malthus, T.J.; Lehmann, E.; Ho, X.; Botha, E.; Anstee, J. Implementation of a Satellite Based Inland Water Algal Bloom Alerting System Using Analysis Ready Data. Remote Sens. 2019, 11, 2954. [Google Scholar] [CrossRef]
- DEA. Digital Earth Australia (DEA)—Geoscience Australian Sources of Information in Collaboration with the Australian Government; DEA: Springfield, VA, USA, 2018.
- Tiwari, V.; Kumar, V.; Matin, M.A.; Thapa, A.; Ellenburg, W.L.; Gupta, N.; Thapa, S. Flood Inundation Mapping-Kerala 2018; Harnessing the Power of SAR, Automatic Threshold Detection Method and Google Earth Engine. PLoS ONE 2020, 15, e0237324. [Google Scholar] [CrossRef] [PubMed]
- CEOS. CEOS Data Cube User Interface GitHub Repository by the Committee on Earth Observation Satellites (CEOS) System Engineering Office (SEO); CEOS: Washington, DC, USA, 2021. [Google Scholar]
- Mubea, K.; Killough, B.; Seidu, O.; Kimani, J.; Mugambi, B.; Kamara, S. Africa Regional Data Cube (ARDC) Is Helping Countries in Africa Report on the Sustainable Development Goals (SDGS). In Proceedings of the IGARSS 2020–2020 IEEE International Geoscience and Remote Sensing Symposium, Waikoloa, HI, USA, 26 September–2 October 2020; pp. 3379–3382. [Google Scholar]
- Rizvi, S.R.; Killough, B.; Cherry, A.; Rattz, J.; Lubawy, A.; Gowda, S. Data Cube Application Algorithms for the United Nation Sustainable Development Goals (UN-SDGS). In Proceedings of the IGARSS 2020–2020 IEEE International Geoscience and Remote Sensing Symposium, Waikoloa, HI, USA, 26 September–2 October 2020; pp. 3399–3402. [Google Scholar]
- Liu, H.; Gong, P.; Wang, J.; Wang, X.; Ning, G.; Xu, B. Production of Global Daily Seamless Data Cubes and Quantification of Global Land Cover Change from 1985 to 2020—IMap World 1.0. Remote Sens. Environ. 2021, 258, 112364. [Google Scholar] [CrossRef]
- Hall, J.; Borgomeo, E. Risk-Based Principles for Defining and Managing Water Security. Philos. Trans. R. Soc. A Math. Phys. Eng. Sci. 2013, 371, 1–22. [Google Scholar] [CrossRef]
- W.E.F. Global Risks Report 2019; World Economic Forum: Geneva, Switzerland, 2019. [Google Scholar]
- World Bank. Risk and Opportunity: Managing Risk for Development|World Bank Group. Available online: https://olc.worldbank.org/content/risk-and-opportunity-managing-risk-development-1 (accessed on 1 September 2022).
- Ekambaram, A.; Sørensen, A.Ø.; Bull-Berg, H.; Olsson, N.O.E. The Role of Big Data and Knowledge Management in Improving Projects and Project-Based Organizations. Procedia Comput. Sci. 2018, 138, 851–858. [Google Scholar] [CrossRef]
- Corti, L.; Van den Eynden, V.; Bishop, L.; Woollard, M. Managing and Sharing Research Data: A Guide to Good Practice; SAGE Publications: New York, NY, USA, 2019; ISBN 978-1-5264-8240-2. [Google Scholar]
- Dobson, M.S. The Triple Constraints in Project Management; Berrett-Koehler Publishers: Oakland, CA, USA, 2004; ISBN 978-1-56726-453-1. [Google Scholar]
- Allan, I.; Vrana, B.; Greenwood, R.; Mills, G.; Roig, B.; Gonzalez, C. A “Toolbox” for Biological and Chemical Monitoring Requirements for the European Union’s Water Framework Directive. Talanta 2006, 69, 302–322. [Google Scholar] [CrossRef] [PubMed]
- Braunisch, V.; Suchant, R. Predicting Species Distributions Based on Incomplete Survey Data: The Trade-off between Precision and Scale. Ecography 2010, 5, 826–840. [Google Scholar] [CrossRef]
- Valipour, M. Calibration of Mass Transfer-Based Models to Predict Reference Crop Evapotranspiration. Appl. Water Sci. 2017, 7, 625–635. [Google Scholar] [CrossRef] [Green Version]
- Behmel, S.; Damour, M.; Ludwig, R.; Rodriguez, M.J. Water Quality Monitoring Strategies—A Review and Future Perspectives. Sci. Total Environ. 2016, 571, 1312–1329. [Google Scholar] [CrossRef] [PubMed]
- Chowdhury, R.K.; Rahman, R. Multicriteria Decision Analysis in Water Resources Management: The Malnichara Channel Improvement. Int. J. Environ. Sci. Technol. 2008, 5, 195–204. [Google Scholar] [CrossRef]
- Xu, F.; Zhao, Y.; Yang, Z.; Zhang, Y. Multi-Scale Evaluation of River Health in Liao River Basin, China. Front. Environ. Sci. Eng. China 2011, 5, 227–235. [Google Scholar] [CrossRef]
- Karnib, A. An Approach to Elaborate Priority Preorders of Water Resources Projects Based on Multi-Criteria Evaluation and Fuzzy Sets Analysis. Water Resour. Manag. 2004, 18, 13–33. [Google Scholar] [CrossRef]
- Almaaofi, H.; Etemad-Shahidi, A.; Stewart, R. Strategic Evaluation Tool for Surface Water Quality Management Remedies in Drinking Water Catchments. Water 2017, 9, 738. [Google Scholar] [CrossRef]
- Langhans, S.D.; Hermoso, V.; Linke, S.; Bunn, S.E.; Possingham, H.P. Cost-Effective River Rehabilitation Planning: Optimizing for Morphological Benefits at Large Spatial Scales. J. Environ. Manag. 2014, 132, 296–303. [Google Scholar] [CrossRef]
- Shrestha, S.; Kazama, F. Assessment of Surface Water Quality Using Multivariate Statistical Techniques: A Case Study of the Fuji River Basin, Japan. Environ. Model. Softw. 2007, 22, 464–475. [Google Scholar] [CrossRef]
- Singh, K.P.; Malik, A.; Mohan, D.; Sinha, S. Multivariate Statistical Techniques for the Evaluation of Spatial and Temporal Variations in Water Quality of Gomti River (India)—A Case Study. Water Res. 2004, 38, 3980–3992. [Google Scholar] [CrossRef]
- Walker, D.; Jakovljević, D.; Savić, D.; Radovanović, M. Multi-Criterion Water Quality Analysis of the Danube River in Serbia: A Visualisation Approach. Water Res. 2015, 79, 158–172. [Google Scholar] [CrossRef]
- Sholarin, E.A.; Awange, J.L. Project Management Toolbox. In Environmental Project Management: Principles, Methodology, and Processes; Sholarin, E.A., Awange, J.L., Eds.; Springer International Publishing: Cham, Switzerland, 2015; pp. 295–334. ISBN 978-3-319-27651-9. [Google Scholar]
- Docherty, J.M.; Mao, F.; Buytaert, W.; Clark, J.R.; Hannah, D.M. A Framework for Understanding Water-Related Multi-Hazards in a Sustainable Development Context. Prog. Phys. Geogr. Earth Environ. 2020, 44, 267–284. [Google Scholar] [CrossRef]
- Kirschke, S.; Avellán, T.; Bärlund, I.; Bogardi, J.J.; Carvalho, L.; Chapman, D.; Dickens, C.W.S.; Irvine, K.; Lee, S.B.; Mehner, T.; et al. Capacity Challenges in Water Quality Monitoring: Understanding the Role of Human Development. Environ. Monit. Assess. 2020, 192, 298. [Google Scholar] [CrossRef] [PubMed]
- Strong, C.; Kuzma, S.; Vionnet, S.; Reig, P. Achieving Abundance: Understanding the Cost of a Sustainable Water Future; World Resources Institute: Washington, DC, USA, 2020. [Google Scholar]
- Espey, J.; Swanson, E.; Badiee, S.; Christensen, Z.; Fischer, A.; Levy, M.; Yetman, G.; Sherbinin, A.; Chen, R.; you, Q.; et al. Data for Development: A Needs Assessment for SDG Monitoring and Statistical Capacity Development, Sustainable Development Solutions Network. 2015. Available online: https://sdgs.un.org/sites/default/files/publications/2017Data-for-Development-Full-Report.pdf (accessed on 1 September 2022).
- Roel, L.; Herroelen, W. Stability and Resource Allocation in Project Planning. IIE Trans. 2004, 36, 667–682. [Google Scholar] [CrossRef]
- Pasher, E.; Ronen, T. The Complete Guide to Knowledge Management: A Strategic Plan to Leverage Your Company’s Intellectual Capital; Wiley: Hoboken, NJ, USA, 2011; ISBN 978-1-118-00140-0. [Google Scholar]
- Burnette, M.; Williams, S.; Imker, H. From Plan to Action: Successful Data Management Plan Implementation in a Multidisciplinary Project. J. Escience Librariansh. 2016, 5, e1101. [Google Scholar] [CrossRef]
- Peletz, R.; Kisiangani, J.; Bonham, M.; Ronoh, P.; Delaire, C.; Kumpel, E.; Marks, S.; Khush, R. Why Do Water Quality Monitoring Programs Succeed or Fail? A Qualitative Comparative Analysis of Regulated Testing Systems in Sub-Saharan Africa. Int. J. Hyg. Environ. Health 2018, 221, 907–920. [Google Scholar] [CrossRef]
- Zhongming, Z.; Linong, L.; Wangqiang, Z.; Wei, L. UN World Water Development Report 2021 ‘Valuing Water’; 2021. Available online: https://www.unwater.org/news/un-world-water-development-report-2021-%E2%80%98valuing-water%E2%80%99 (accessed on 1 September 2022).
- Braden, J.B.; Brown, D.G.; Dozier, J.; Gober, P.; Hughes, S.M.; Maidment, D.R.; Schneider, S.L.; Schultz, P.W.; Shortle, J.S.; Swallow, S.K.; et al. Social Science in a Water Observing System. Water Resour. Res. 2009, 45. [Google Scholar] [CrossRef]
- Gielczewski, M.; Stelmaszczyk, M.; Piniewski, M.; Okruszko, T. How Can We Involve Stakeholders in the Development of Water Scenarios? Narew River Basin Case Study. J. Water Clim. Change 2011, 2, 166–179. [Google Scholar] [CrossRef]
- Sullivan, C.A.; Meigh, J. Integration of the Biophysical and Social Sciences Using an Indicator Approach: Addressing Water Problems at Different Scales. Water Resour. Manag. 2006, 21, 111–128. [Google Scholar] [CrossRef]
- UN-Water. WWDR2: Water, a Shared Responsibility; UN-Water: Geneva, Switzerland, 2006. [Google Scholar]
- Kumpel, E.; MacLeod, C.; Stuart, K.; Cock-Esteb, A.; Khush, R.; Peletz, R. From Data to Decisions: Understanding Information Flows within Regulatory Water Quality Monitoring Programs. Npj Clean Water 2020, 3, 1–11. [Google Scholar] [CrossRef]
- Timmerman, J.G. The Need for Participatory Processes and Its Implications for Water Management Information. Reg. Environ. Chang. 2005, 5, 162–163. [Google Scholar] [CrossRef]
- Timmerman, J.G.; Beinat, E.; Termeer, K.; Cofino, W. Analyzing the Data-Rich-but-Information-Poor Syndrome in Dutch Water Management in Historical Perspective. Environ. Manag. 2010, 45, 1231–1242. [Google Scholar] [CrossRef] [Green Version]
- McNie, E.C. Reconciling the Supply of Scientific Information with User Demands: An Analysis of the Problem and Review of the Literature. Environ. Sci. Policy 2007, 10, 17–38. [Google Scholar] [CrossRef]
- Srinivasan, V.; Konar, M.; Sivapalan, M. A Dynamic Framework for Water Security. Water Secur. 2017, 1, 12–20. [Google Scholar] [CrossRef]
- Padowski, J.C.; Gorelick, S.M.; Thompson, B.H.; Rozelle, S.; Fendorf, S. Assessment of Human-Natural System Characteristics Influencing Global Freshwater Supply Vulnerability. Environ. Res. Lett 2015, 10, 104014. [Google Scholar] [CrossRef]
- Wutich, A.; Budds, J.; Eichelberger, L.; Geere, J.; Harris, L.M.; Horney, J.A.; Jepson, W.; Norman, E.; O’Reilly, K.; Pearson, A.L.; et al. Advancing Methods for Research on Household Water Insecurity: Studying Entitlements and Capabilities, Socio-Cultural Dynamics, and Political Processes, Institutions and Governance. Water Secur. 2017, 2, 1–10. [Google Scholar] [CrossRef]
- Wheater, H. Water in a Changing World. In Series on Environmental Science and Management; Imperial College Press and Distributed by World Scientific Publishing Co.: Singapore, 2000; pp. 17–65. [Google Scholar]
- Ostrom, V.; Tiebout, C.M.; Warren, R. The Organization of Government in Metropolitan Areas: A Theoretical Inquiry. Am. Political Sci. Rev. 1961, 55, 831–842. [Google Scholar] [CrossRef]
- De Filippo, D.; Sanz Casado, E.; Berteni, F.; Barisani, F.; Bautista Puig, N.; Grossi, G. Assessing Citizen Science Methods in IWRM for a New Science Shop: A Bibliometric Approach. Null 2021, 66, 179–192. [Google Scholar] [CrossRef]
- Hotlos, H.A. Quantity and Availability of Freshwater Resources: The World-Europe-Poland. Environ. Prot. Eng. 2008, 34, 67–77. [Google Scholar]
- Xenarios, S.; Assubayeva, A.; Xie, L.; Sehring, J.; Amirkhanov, D.; Sultanov, A.; Fazli, S. A Bibliometric Review of the Water Security Concept in Central Asia. Environ. Res. Lett 2020, 16, 013001. [Google Scholar] [CrossRef]
- Crocker, J.; Bartram, J. Comparison and Cost Analysis of Drinking Water Quality Monitoring Requirements versus Practice in Seven Developing Countries. Int. J. Environ. Res. Public Health 2014, 11, 7333–7346. [Google Scholar] [CrossRef]
- Delaire, C.; Peletz, R.; Kumpel, E.; Kisiangani, J.; Bain, R.; Khush, R. How Much Will It Cost to Monitor Microbial Drinking Water Quality in Sub-Saharan Africa? Environ. Sci. Technol 2017, 51, 5869–5878. [Google Scholar] [CrossRef]
- Peletz, R.; Kumpel, E.; Bonham, M.; Rahman, Z.; Khush, R. To What Extent Is Drinking Water Tested in Sub-Saharan Africa? A Comparative Analysis of Regulated Water Quality Monitoring. Int. J. Environ. Res. 2016, 13, 275. [Google Scholar] [CrossRef] [Green Version]
- Hoff, H.; Döll, P.; Fader, M.; Gerten, D.; Hauser, S.; Siebert, S. Water Footprints of Cities—Indicators for Sustainable Consumption and Production, Hydrol. Earth Syst. Sci 2014, 18, 213–226. [Google Scholar] [CrossRef]
- Giné, R.; Pérez-Foguet, A. Improved Method to Calculate a Water Poverty Index at Local Scale. J. Environ. Eng 2010, 136, 1287–1298. [Google Scholar]
- Jepson, W. Measuring ‘No-Win’ Waterscapes: Experience-Based Scales and Classification Approaches to Assess Household Water Security in Colonias on the US–Mexico Border. Geoforum 2014, 51, 107–120. [Google Scholar] [CrossRef]
- Sullivan, C.A.; Meigh, J.R.; Giacomello, A.M. The Water Poverty Index: Development and Application at the Community Scale. Nat. Res. Forum 2003, 27, 189–199. [Google Scholar] [CrossRef]
- Ghosh, R.; Kansal, A.; Venkatesh, G. Urban Water Security Assessment Using an Integrated Metabolism Approach—Case Study of the National Capital Territory of Delhi in India. Resources 2019, 8, 62. [Google Scholar] [CrossRef]
- Maniates, M. Sustainable Consumption—Three Paradoxes. GAIA Ecol. Perspect. Sci. Soc. 2014, 23, 201–208. [Google Scholar] [CrossRef]
- Spash, C.; Dobernig, K. Theories of (Un)Sustainable Consumption. In Handbook of Ecological Economics: Nature and Society; Spash, C., Ed.; Routledge: New York, NY, USA, 2017; pp. 227–236. [Google Scholar]
- Fischer-Kowalski, M.; Haberl, H. Sustainable Development, Long Term Changes in Socio-Economic Metabolism, and Colonization of Nature. Int. Soc. Sci. J. 1998, 50, 573–587. [Google Scholar] [CrossRef]
- Madrid-López, M.; Giampietro, C. The Water Metabolism of Socio-Ecological Systems: Reflections and a Conceptual Framework. J. Ind. Ecol. 2015, 19, 853–865. [Google Scholar] [CrossRef]
- Aven, T. The Science of Risk Analysis; Routledge: London, UK, 2019. [Google Scholar]
- Van Asselt, M.B.A. Perspectives on Uncertainty and Risk; Springer: Berlin/Heidelberg, Germany, 2000. [Google Scholar]
- Renn, O.; Laubichler, M.; Lucas, K.; Kröger, W.; Schanze, J.; Scholz, R.W.; Schweizer, P.-J. Systemic Risks from Different Perspectives. Risk Anal. 2020. [Google Scholar] [CrossRef]
- Renn, O.; Klinke, A.; Asselt, M. van Coping with Complexity Uncertainty and Ambiguity in Risk Governance: A Synthesis. Ambio 2011, 40, 231–246. [Google Scholar] [CrossRef]
- Rose, K.A.; Smith, E.P. Experimental design: The neglected aspect of environmental monitoring. Environ. Manag. 1992, 16, 691–700. [Google Scholar] [CrossRef]
- Zhang, J.; Zhang, C. Sampling and sampling strategies for environmental analysis. Int. J. Environ. Anal. Chem 2012, 92, 466–478. [Google Scholar] [CrossRef]
- Abbatangelo, J.; Byrne, A.; Butler, J.F.; Wilson, J.M. Application of Multi-Criteria Decision Analysis to Assess Sampling Strategies in Eutrophic Urbanized Waterbodies. Environ. Monit. Assess. 2019, 191, 1. [Google Scholar] [CrossRef]
- Olsen, R.L.; Chappell, R.W.; Loftis, J.C. Water Quality Sample Collection, Data Treatment and Results Presentation for Principal Components Analysis—Literature Review and Illinois River Watershed Case Study. Water Res. 2012, 46, 3110–3122. [Google Scholar] [CrossRef]
- Wang, Y.; Wilson, J.M.; VanBriesen, J.M. The Effect of Sampling Strategies on Assessment of Water Quality Criteria Attainment. J. Environ. Manag. 2015, 154, 33–39. [Google Scholar] [CrossRef]
- Milliman, J.D.; Farnsworth, K.L.L. River Discharge to the Coastal Ocean.: A Global Synthesis, Oceanography; Cambridge University Press: Cambridge, UK, 2011. [Google Scholar]
- Alilou, H.; Moghaddam Nia, A.; Saravi, M.M.; Salajegheh, A.; Han, D.; Bakhtiari Enayat, B. A Novel Approach for Selecting Sampling Points Locations to River Water Quality Monitoring in Data-Scarce Regions. J. Hydrol. 2019, 573, 109–122. [Google Scholar] [CrossRef]
- Merrington, G.; Sprang, P.V. Deriving Environmental Quality Standards in European Surface Waters: When Are There Too Few Data? Environ. Sci. Pollut. Res. 2013, 21, 67–76. [Google Scholar] [CrossRef]
- Anttila, S.; Ketola, M.; Vakkilainen, K.; Kairesalo, T. Assessing temporal representativeness of water quality monitoring data. J. Environ. Monit. 2012, 14, 589–595. [Google Scholar] [CrossRef]
- Wright, J.; Liu, J.; Bain, R.; Perez, A.; Crocker, J.; Bartram, J.; Gundry, S. Water Quality Laboratories in Colombia: A GIS-Based Study of Urban and Rural Accessibility. Sci. Total Environ. 2014, 485–486, 643–652. [Google Scholar] [CrossRef]
- Sanders, T.G.; Ward, R.C.; Loftis, J.C.; Steele, T.D.; Adrian, D.D.; Yevjevich, V. Design of Networks for Monitoring Water Quality; Water Resources Publications LLC: Lone Tree, CO, USA, 1983. [Google Scholar]
- Strobl, R.O.; Robillard, P.D. Network Design for Water Quality Monitoring of Surface Freshwaters: A Review. J. Environ. Manag. 2008, 87, 639–648. [Google Scholar] [CrossRef]
- Ward, R.C.; Loftis, J.C.; McBride, G.B. Design of Water Quality Monitoring Systems; John Wiley & Sons: Hoboken, NJ, USA, 1990. [Google Scholar]
- Taylor, D.D.J.J.; Khush, R.; Peletz, R.; Kumpel, E. Efficacy of Microbial Sampling Recommendations and Practices in Sub-Saharan Africa. Water Res. 2018, 134, 115–125. [Google Scholar] [CrossRef]
- Wagener, T.; Sivapalan, M.; Troch, P.A.; McGlynn, B.L.; Harman, C.J.; Gupta, V.H.; Kumar, P.; Rao, P.S.C.; Basu, N.B.; Wilson, J.S.; et al. The Future of Hydrology: An Evolving Science for a Changing World. Water Resour. Res. 2010, 46, 1–10. [Google Scholar] [CrossRef]
- Doeffinger, T.; Borgomeo, E.; Young, W.J.; Sadoff, C.; Hall, J.W. A Diagnostic Dashboard to Evaluate Country Water Security. Water Policy 2020, 22, 825–849. [Google Scholar] [CrossRef]
- Srinivasan, V.; Lambin, E.F.; Gorelick, S.M.; Thompson, B.H.; Rozelle, S. The Nature and Causes of the Global Water Crisis: Syndromes from a Meta-Analysis of Coupled Human-Water Studies. Water Resour. Res. 2012, 48, 1–16. [Google Scholar] [CrossRef]
- Bartram, J.; Ballance, R. (Eds.) WHO. Water Quality Monitoring: A Practical Guide to the Design and Implementation of Freshwater Quality Studies and Monitoring Programmes; CRC Press: Boca Raton, FL, USA, 1996; pp. 1–348.
- Chapman, D. Water Quality Assessments—A Guide to Use of Biota, Sediments and Water in Environmental Monitoring, 2nd ed.; E&FN Spon: London, UK, 1996; Available online: https://wedocs.unep.org/bitstream/handle/20.500.11822/8342/-Water%20Quality%20Assessments_%20A%20guide%20to%20the%20use%20of%20Biota,%20Sediments%20and%20water%20in%20Ecosystems-19923184.pdf?sequence=3&%3BisAllowed= (accessed on 1 September 2022).
- IISD. Water Quality Monitoring System Design; International Institute for Sustainable Development: Winnipeg, Canada, 2015; Volume 49. [Google Scholar]
- WMO. Good Practice Guidelines for Water Data Management Policy; World Water Data Initiative; 2018; Available online: https://public.wmo.int/en/resources/library/good-practice-guidelines-water-data-management-policy (accessed on 1 September 2022).
- Timmerman, J.G.; Ottens, J.J.; Ward, R.C. The Information Cycle as a Framework for Defining Information Goals for Water-Quality Monitoring. Environ. Manag. 2000, 25, 229–239. [Google Scholar] [CrossRef]
- UN-Environment. A Framework for Freshwater Ecosystem Management. 2017. Available online: https://www.unep.org/resources/publication/framework-freshwater-ecosystem-management (accessed on 1 September 2022).
- USEPA. Guidelines for the Preparation of the Comprehensive State Water Quality Assessments; USEPA: Washington, DC, USA, 1997.
- WMO. Planning of Water Quality Monitoring Systems; WMO: Washington, DC, USA, 2013. [Google Scholar]
- Khalil, B.; Ouarda, T.B.M.J.; St-Hilaire, A. A Statistical Approach for the Assessment and Redesign of the Nile Delta Drainage System Water-Quality-Monitoring Locations. J. Environ. Monit 2011, 13, 2190–2205. [Google Scholar] [CrossRef]
- Conrad, C.C.; Hilchey, K.G. A review of citizen science and community-based environmental monitoring: Issues and opportunities. Environ. Monit. Assess. 2011, 176, 273–291. [Google Scholar] [CrossRef]
- Sousa, J.C.G.; Ribeiro, A.R.; Barbosa, M.O.; Pereira, M.F.R.; Silva, A.M.T. A Review on Environmental Monitoring of Water Organic Pollutants Identified by EU Guidelines. J. Hazard. Mater. 2018, 344, 146–162. [Google Scholar] [CrossRef]
- World Bank. Readiness Assessment Tool. 2021. Available online: http://opendatatoolkit.worldbank.org/en/odra.html (accessed on 10 September 2022).
- CPD. Water Security 2020 Reporting Guidance. Available online: https://guidance.cdp.net/en/guidance?cid=15&ctype=theme&idtype=ThemeID&incchild=1µsite=0&otype=Guidance&tags=TAG-646%252CTAG-607%252CTAG-600 (accessed on 22 January 2022).
- WHO. Guidelines for Drinking-Water Quality, 4th Edition, Incorporating the 1st Addendum; WHO: Geneva, Switzerland, 2017.
- WHO. Guidelines for the Safe Use of Wastewater, Excreta and Greywater in Agriculture and Aquaculture; WHO: Geneva, Switzerland, 2006.
- OGC. Open Geospatial Consortium WaterML Standards. 2022. Available online: https://www.ogc.org/projects/groups/waterml2.0swg (accessed on 22 January 2022).
- Holloway, J.; Mengersen, K. Statistical Machine Learning Methods and Remote Sensing for Sustainable Development Goals: A Review. Remote Sens. 2018, 10, 1365. [Google Scholar] [CrossRef]
- Degbelo, A. FAIR Geovisualizations: Definitions, Challenges, and the Road Ahead. Int. J. Geogr. Inf. Sci. 2021, 36, 1059–1099. [Google Scholar] [CrossRef]
- OSM. Open Street Map. 2022. Available online: https://www.openstreetmap.org (accessed on 1 September 2022).
- UN-CEO-Water-Mandate. Interactive Database of the World’s River Basins. Available online: http://riverbasins.wateractionhub.org (accessed on 1 September 2022).
- EC. Global Surface Water Explorer. Available online: https://wbwaterdata.org/dataset/global-surface-water-explorer (accessed on 1 September 2022).
- EO. Research Bluedot—Water Observatory. Available online: https://www.blue-dot-observatory.com (accessed on 1 September 2022).
- ESA. Copernicus Open Access Hub. Available online: https://scihub.copernicus.eu (accessed on 1 September 2022).
- ESA. ESA World Cover 2020. Available online: https://esa-worldcover.org/en (accessed on 1 September 2022).
- Google-Developers, Google Earth Engine Catalog. Available online: https://developers.google.com/earth-engine/datasets/ (accessed on 1 September 2022).
- Rajagopal, R. Optimal Sampling Strategies for Source Identification in Environmental Episodes. Environ. Monit. Assess. 1984, 4, 1–14. [Google Scholar] [CrossRef] [PubMed]
- Birk, S.; Bonne, W.; Borja, A.; Brucet, S.; Courrat, A.; Poikane, S.; Solimini, A.; Van De Bund, W.; Zampoukas, N.; Hering, D. Three Hundred Ways to Assess Europe’s Surface Waters: An Almost Complete Overview of Biological Methods to Implement the Water Framework Directive. Ecol. Indic. 2012, 18, 31–41. [Google Scholar] [CrossRef]
- van Griensven, A.; Meixner, T.; Grunwald, S.; Bishop, T.; Diluzio, M.; Srinivasan, R. A Global Sensitivity Analysis Tool for the Parameters of Multi-Variable Catchment Models. J. Hydrol. 2006, 324, 10–23. [Google Scholar] [CrossRef]
- Vrana, B.; Allan, I.J.; Greenwood, R.; Mills, G.A.; Dominiak, E.; Svensson, K.; Knutsson, J.; Morrison, G. Passive Sampling Techniques for Monitoring Pollutants in Water. TrAC Trends Anal. Chem. 2005, 24, 845–868. [Google Scholar] [CrossRef]
- PNNL Visual Sample Plan. Available online: https://www.pnnl.gov/projects/visual-sample-plan (accessed on 1 September 2022).
- Wolfson, L.; Lewandowski, A.; Bonnell, J.; Frankenberger, J.; Sleeper, F.; Latimore, J. Developing Capacity for Local Watershed Management: Essential Leadership Skills and Training Approaches. J. Contemp. Water Res. Educ. 2015, 156, 86–97. [Google Scholar] [CrossRef]
- UNEP Global Risk Data Platform. Available online: https://wesr.unepgrid.ch/?project=MX-XVK-HPH-OGN-HVE-GGN&language=en (accessed on 1 September 2022).
- WRI. Aqueduct. Available online: https://www.wri.org/aqueduct (accessed on 1 September 2022).
- WWF. Water Risk Filter. Available online: https://waterriskfilter.org (accessed on 1 September 2022).
- Logan, T.M.; Aven, T.; Guikema, S.; Flage, R. The Role of Time in Risk and Risk Analysis: Implications for Resilience, Sustainability, and Management. Risk Anal. 2021, 41, 1959–1970. [Google Scholar] [CrossRef]
- Westland, J. The Project Management Life Cycle: A Complete Step-By-Step Methodology for Initiating, Planning, Executing & Closing a Project Successf; Kogan Page Publishers: London, UK, 2007. [Google Scholar]
- Whitfield, P.H. Goals and data collection designs for water quality monitoring. JAWRA J. Am. Water Resour. Assoc. 1988, 24, 775–780. [Google Scholar] [CrossRef]
- Hidalgo, E.S. Adapting the Scrum Framework for Agile Project Management in Science: Case Study of a Distributed Research Initiative. Heliyon 2019, 5, e01447. [Google Scholar] [CrossRef]
- Kendrick, T. Identifying and Managing Project Risk: Essential Tools for Failure-Proofing Your Project; AMACOM: New York, NY, USA, 2015; ISBN 978-0-8144-3609-7. [Google Scholar]
- Phillips, C.A.; Stawarski, P.P. Data Collection: Planning for and Collecting All Types of Data; Wiley: Hoboken, NJ, USA, 2008. [Google Scholar]
- Ferrero, G. Capacity Building and Training Approaches for Water Safety Plans: A Comprehensive Literature Review. Int. J. Hyg. Environ. Health 2019, 222, 615–627. [Google Scholar] [CrossRef]
- McIntosh, B.S.; Taylor, A. Developing T-Shaped Water Professionals: Building Capacity in Collaboration, Learning, and Leadership to Drive Innovation. J. Contemp. Water Res. Educ. 2013, 150, 6–17. [Google Scholar] [CrossRef]
- Alaerts, G.; Dickinson, N. Water for a Changing World—Developing Local Knowledge and Capacity. In Proceedings of the International Symposium “Water for a Changing World Developing Local Knowledge and Capacity”, Delft, The Netherlands, 13–15 June 2007; Alaerts, G., Dickinson, N., Eds.; CRC Press: London, UK, 2008. ISBN 978-0-429-20688-7. [Google Scholar]
- Chinyio, E.; Olomolaiye, P. Construction Stakeholder Management 2009; Wiley: Hoboken, NJ, USA, 2009. [Google Scholar]
- Grimble, R.; Wellard, K. Stakeholder Methodologies in Natural Resource Management: A Review of Principles, Contexts, Experiences and Opportunities. Agric. Syst. 1997, 55, 173–193. [Google Scholar] [CrossRef]
- Mutekanga, F.P.; Kessler, A.; Leber, K.; Visser, S. The Use of Stakeholder Analysis in Integrated Watershed Management. Mred 2013, 33, 122–131. [Google Scholar] [CrossRef]
- Chambers, R. Participatory Workshops: A Sourcebook of 21 Sets of Ideas and Activities; Routledge: London, UK, 2002. [Google Scholar]
- IAP. IAP2 Public Participation Toolbox. Available online: https://icma.org/documents/iap2-public-participation-toolbox (accessed on 1 September 2022).
- Schweizer, P.-J.; Goble, R.; Renn, O. Social Perception of Systemic Risks. Risk Anal. 2021, 42, 1455–1471. [Google Scholar] [CrossRef]
- Dong, C.; Schoups, G.; van de Giesen, N. Scenario Development for Water Resource Planning and Management: A Review. Technol. Forecast. Soc. Change 2013, 80, 749–761. [Google Scholar] [CrossRef]
- Reynaud, A.; Markantonis, V.; Carmona Moreno, C.; N’Tcha M’Po, Y.; Sambienou, G.W.; Adandedji, F.M.; Afouda, A.; Agbossou, E.K.; Mama, D. Combining Expert and Stakeholder Knowledge to Define Water Management Priorities in the Mékrou River Basin. Water 2015, 7, 7078–7094. [Google Scholar] [CrossRef]
- Spruijt, P. Roles of Scientists as Policy Advisers on Complex Issues: A Literature Review. Environ. Sci. 2014, 10, 16–25. [Google Scholar]
- Edelenbos, J. Co-Producing Knowledge: Joint Knowledge Production between Experts, Bureaucrats and Stakeholders in Dutch Water Management Projects. Environ. Sci. 2011, 10, 675–684. [Google Scholar] [CrossRef]
- Borda, O.F. Participatory (Action) Research in Social Theory: Origins and Challenges. In Handbook of Action Research: Participative Inquiry and Practice; SAGE: Thousand Oaks, CA, USA, 2001. [Google Scholar]
- Kellert, S.R. A Biocultural Basis for an Ethic toward the Natural Environment. In Foundations of Environmental Sustainability; Oxford University Press: New York, NY, USA, 2008; pp. 321–332. [Google Scholar]
- Kellert, S.R. The Value of Life: Biological Diversity and Human Society; Island Press: Washington, DC, USA, 1996. [Google Scholar]
- Olson, R.; Hackett, J.; DeRoy, S. Mapping the Digital Terrain: Towards Indigenous Geographic Information and Spatial Data Quality Indicators for Indigenous Knowledge and Traditional Land-Use Data Collection. Cartogr. J. 2016, 53, 348–355. [Google Scholar] [CrossRef]
- Villamor, G.B.; Palomo, I.; Santiago, C.A.L.; Oteros-Rozas, E.; Hill, J. Assessing Stakeholders’ Perceptions and Values towards Social-Ecological Systems Using Participatory Methods. Ecol. Processes 2014, 3, 1–2. [Google Scholar] [CrossRef]
- FAO. FAO Hand-in-Hand Initiative. Available online: https://www.fao.org/hand-in-hand/en/ (accessed on 1 September 2022).
- Ginkel, K.C.H.H.; Hoekstra, A.Y.; Buurman, J.; Hogeboom, R.J. Urban Water Security Dashboard: Systems Approach to Characterizing the Water Security of Cities. J. Water Resour. Plan. Manag 2018, 144, 1–11. [Google Scholar] [CrossRef] [Green Version]


Publisher’s Note: MDPI stays neutral with regard to jurisdictional claims in published maps and institutional affiliations. |
© 2022 by the authors. Licensee MDPI, Basel, Switzerland. This article is an open access article distributed under the terms and conditions of the Creative Commons Attribution (CC BY) license (https://creativecommons.org/licenses/by/4.0/).
Share and Cite
Butte, G.; Solano-Correa, Y.T.; Peppa, M.V.; Ruíz-Ordóñez, D.M.; Maysels, R.; Tuqan, N.; Polaine, X.; Montoya-Pachongo, C.; Walsh, C.; Curtis, T. A Framework for Water Security Data Gathering Strategies. Water 2022, 14, 2907. https://doi.org/10.3390/w14182907
Butte G, Solano-Correa YT, Peppa MV, Ruíz-Ordóñez DM, Maysels R, Tuqan N, Polaine X, Montoya-Pachongo C, Walsh C, Curtis T. A Framework for Water Security Data Gathering Strategies. Water. 2022; 14(18):2907. https://doi.org/10.3390/w14182907
Chicago/Turabian StyleButte, Giacomo, Yady Tatiana Solano-Correa, Maria Valasia Peppa, Diana Marcela Ruíz-Ordóñez, Rachael Maysels, Nasser Tuqan, Xanthe Polaine, Carolina Montoya-Pachongo, Claire Walsh, and Thomas Curtis. 2022. "A Framework for Water Security Data Gathering Strategies" Water 14, no. 18: 2907. https://doi.org/10.3390/w14182907