Article

Large-Scale Extraction and Mapping of Small Surface Water Bodies Based on Very High-Spatial-Resolution Satellite Images: A Case Study in Beijing, China

1
State Key Laboratory of Remote Sensing Science, Jointly Sponsored by Beijing Normal University and Aerospace Information Research Institute of Chinese Academy of Sciences, Beijing 100875, China
2
Institute of Remote Sensing Science and Engineering, Faculty of Geographical Sciences, Beijing Normal University, Beijing 100875, China
3
Academy of Plateau Science and Sustainability, Qinghai Normal University, Xining 810016, China
*
Author to whom correspondence should be addressed.
Water 2022, 14(18), 2889; https://doi.org/10.3390/w14182889
Submission received: 10 August 2022 / Revised: 4 September 2022 / Accepted: 13 September 2022 / Published: 16 September 2022

Abstract

:
Surface water is a crucial resource and environmental element for human survival and ecosystem stability; therefore, accurate information on the distribution of surface water bodies is essential. Extracting this information on a large scale is commonly implemented using moderate- and low-resolution satellite images. However, the detection and analysis of more detailed surface water structures and small water bodies necessitate the use of very high-resolution (VHR) satellite images. The large-scale application of VHR images for water extraction requires convenient and accurate methods. In this paper, a method combining a pixel-level water index and image object detection is proposed. The method was tested using 2018/2019 multispectral 4-m resolution images obtained from the Chinese satellite Gaofen-2 across Beijing, China. Results show that the automatic extraction of water body information over large areas using the proposed method and VHR images is feasible. Kappa coefficient and overall accuracy of 0.96 and 99.8% after post-classification improvement were obtained for testing images inside the Beijing area. The Beijing water body dataset obtained included a total of 489.53 km2 of surface water in 2018/2019, 108.01 km2 of which were ponds with an area smaller than 2 km2. This study can be applied for water body extraction and mapping in other large regions and provides a reference for other methods for using VHR images to extract water body information on a large scale.

1. Introduction

Water is an essential natural resource and has become a significant environmental and social issue today. Land surface water is an indispensable vital resource, and information on its availability and level is essential for climate change research, ecological environment assessment, and macro-economy analysis. Surface water bodies affect the exchange of heat, gas, and water vapor between the planet’s surface and atmosphere, as well as the activities of different organisms, including humans, animals, plants, microorganisms, etc.
Satellite remote sensing is an advanced method for monitoring and mapping large-scale surface water information efficiently and accurately through convenient data acquisition in a scalable manner. On a global scale, researchers often use Landsat and MODIS satellite data to determine water coverage, with resolutions ranging from 30 to 1000 m [1,2,3,4,5,6,7]. Landsat and Sentinel images are commonly used data for regional or national-scale analyses, with notable examples being Landsat images of the Ontonagon River Basin (Michigan) [8] and the Mongolian Plateau [9], Sentinel-1 synthetic aperture radar images of India and China [10,11], Sentinel-2 images of Germany and China [12,13], and Landsat images of China [14,15]. These high-, low-, and moderate-resolution images (Sentinel, MODIS, and Landsat) allow large-scale surface water body monitoring and mapping as: (a) they can meet the scale requirements of surface coverage types to a certain extent; (b) they are free and easy to obtain; (c) the number of images required is relatively small and the corresponding computational load is manageable. Further, the latest Google Earth Engine (GEE) provides a more effective method to monitor environmental elements of various types on a large scale and a large area using low-, moderate- and high-resolution images. Of the data used in the GEE, Landsat and MODIS constitute the more comprehensive open-access data archive and are suitable for long-term dynamic monitoring [16,17,18], while Sentinel-2 images have the highest spatial resolution [19,20].
Surface water body types include lakes, reservoirs, rivers, ditches, ponds, etc. When using satellite imagery to detect water bodies such as lakes and rivers, small water bodies such as ponds are ignored. However, these small bodies play a crucial role in the ecological environment, and awareness of their presence is important for the analysis of an area’s ecosystem. For example, ponds have slow water circulation rates, which results in delays in the purification of pollutants, susceptibility to eutrophication, and poor renewal ability; this condition also makes them suitable base camps for pathogenic microorganisms and parasites [21]. Moreover, there are far more ponds than large water bodies [22], and they are mainly distributed in rural areas and directly related to the daily life of farmers and their agricultural activities [23]. At the same time, it is necessary to obtain information on multiple types of surface water bodies in a region to fully grasp the situation of different water resource types, understand the quantity and spatial distribution, and perform more comprehensive top-level design and environmental planning.
The lump shape and fine-scale heterogeneity of pond water bodies, whose size ranges from 1 m2 to about 5 ha, are often not captured by moderate- and high-resolution sensors such as Landsat and Sentinel, and can be monitored using very high-resolution (VHR) images [24]. The identification of water bodies with VHR images has been studied extensively in recent years. Different methods have been proposed, and they can be generally divided into four types [25]: thematic classification, spectral unmixing, single band thresholding, and spectral water indices. These methods have achieved good results [26,27,28,29,30]; however, they focus on improving the accuracy of water information extraction over small areas [31,32,33,34,35], and few studies focus on using VHR images for the detection of surface water bodies in large-scale regions. Specifically, the limiting factors include five aspects: (1) Large-scale applications require massive amounts of VHR images; (2) VHR aerial photography and imagery is expensive to acquire and labor-intensive to process; (3) Each VHR image requires significant digital storage resources, and their processing requires substantial computational capabilities; (4) VHR images have fine surface information, and the surface water body types included in large areas are more abundant, so more samples and features are required to train the detection methods or models; (5) The high spatial heterogeneity can easily cause detection errors. With the rapid development of related technologies and methods, such as remote sensing, clustering, and parallel computing, the adoption of VHR images is becoming more and more popular [35]. For example, McCarthy et al. [30] used a decision tree diagram to map wetlands using WorldView-2 2 m VHR images of the Tampa Bay watershed, a subtropical climate zone in the west-central coast of the State of Florida. Therefore, it is necessary to expand the application of VHR images in water body detection at large scales and to study the corresponding extraction methods.
In this paper, a novel two-level pixel-object extraction method is proposed for water body detection at large scales based on multiple VHR optical satellite images. The method combines a pixel-based water index and image object recognition, and is suitable for automation of the labor-intensive process of water body extraction. The specific objectives are to analyze the convenience and accuracy of the method flow and map detailed land surface water body information, taking the region of Beijing, China, as a case study. Our research can provide a reference for the related research or applications of surface water extraction with VHR images at a large scale.

2. Materials and Methods
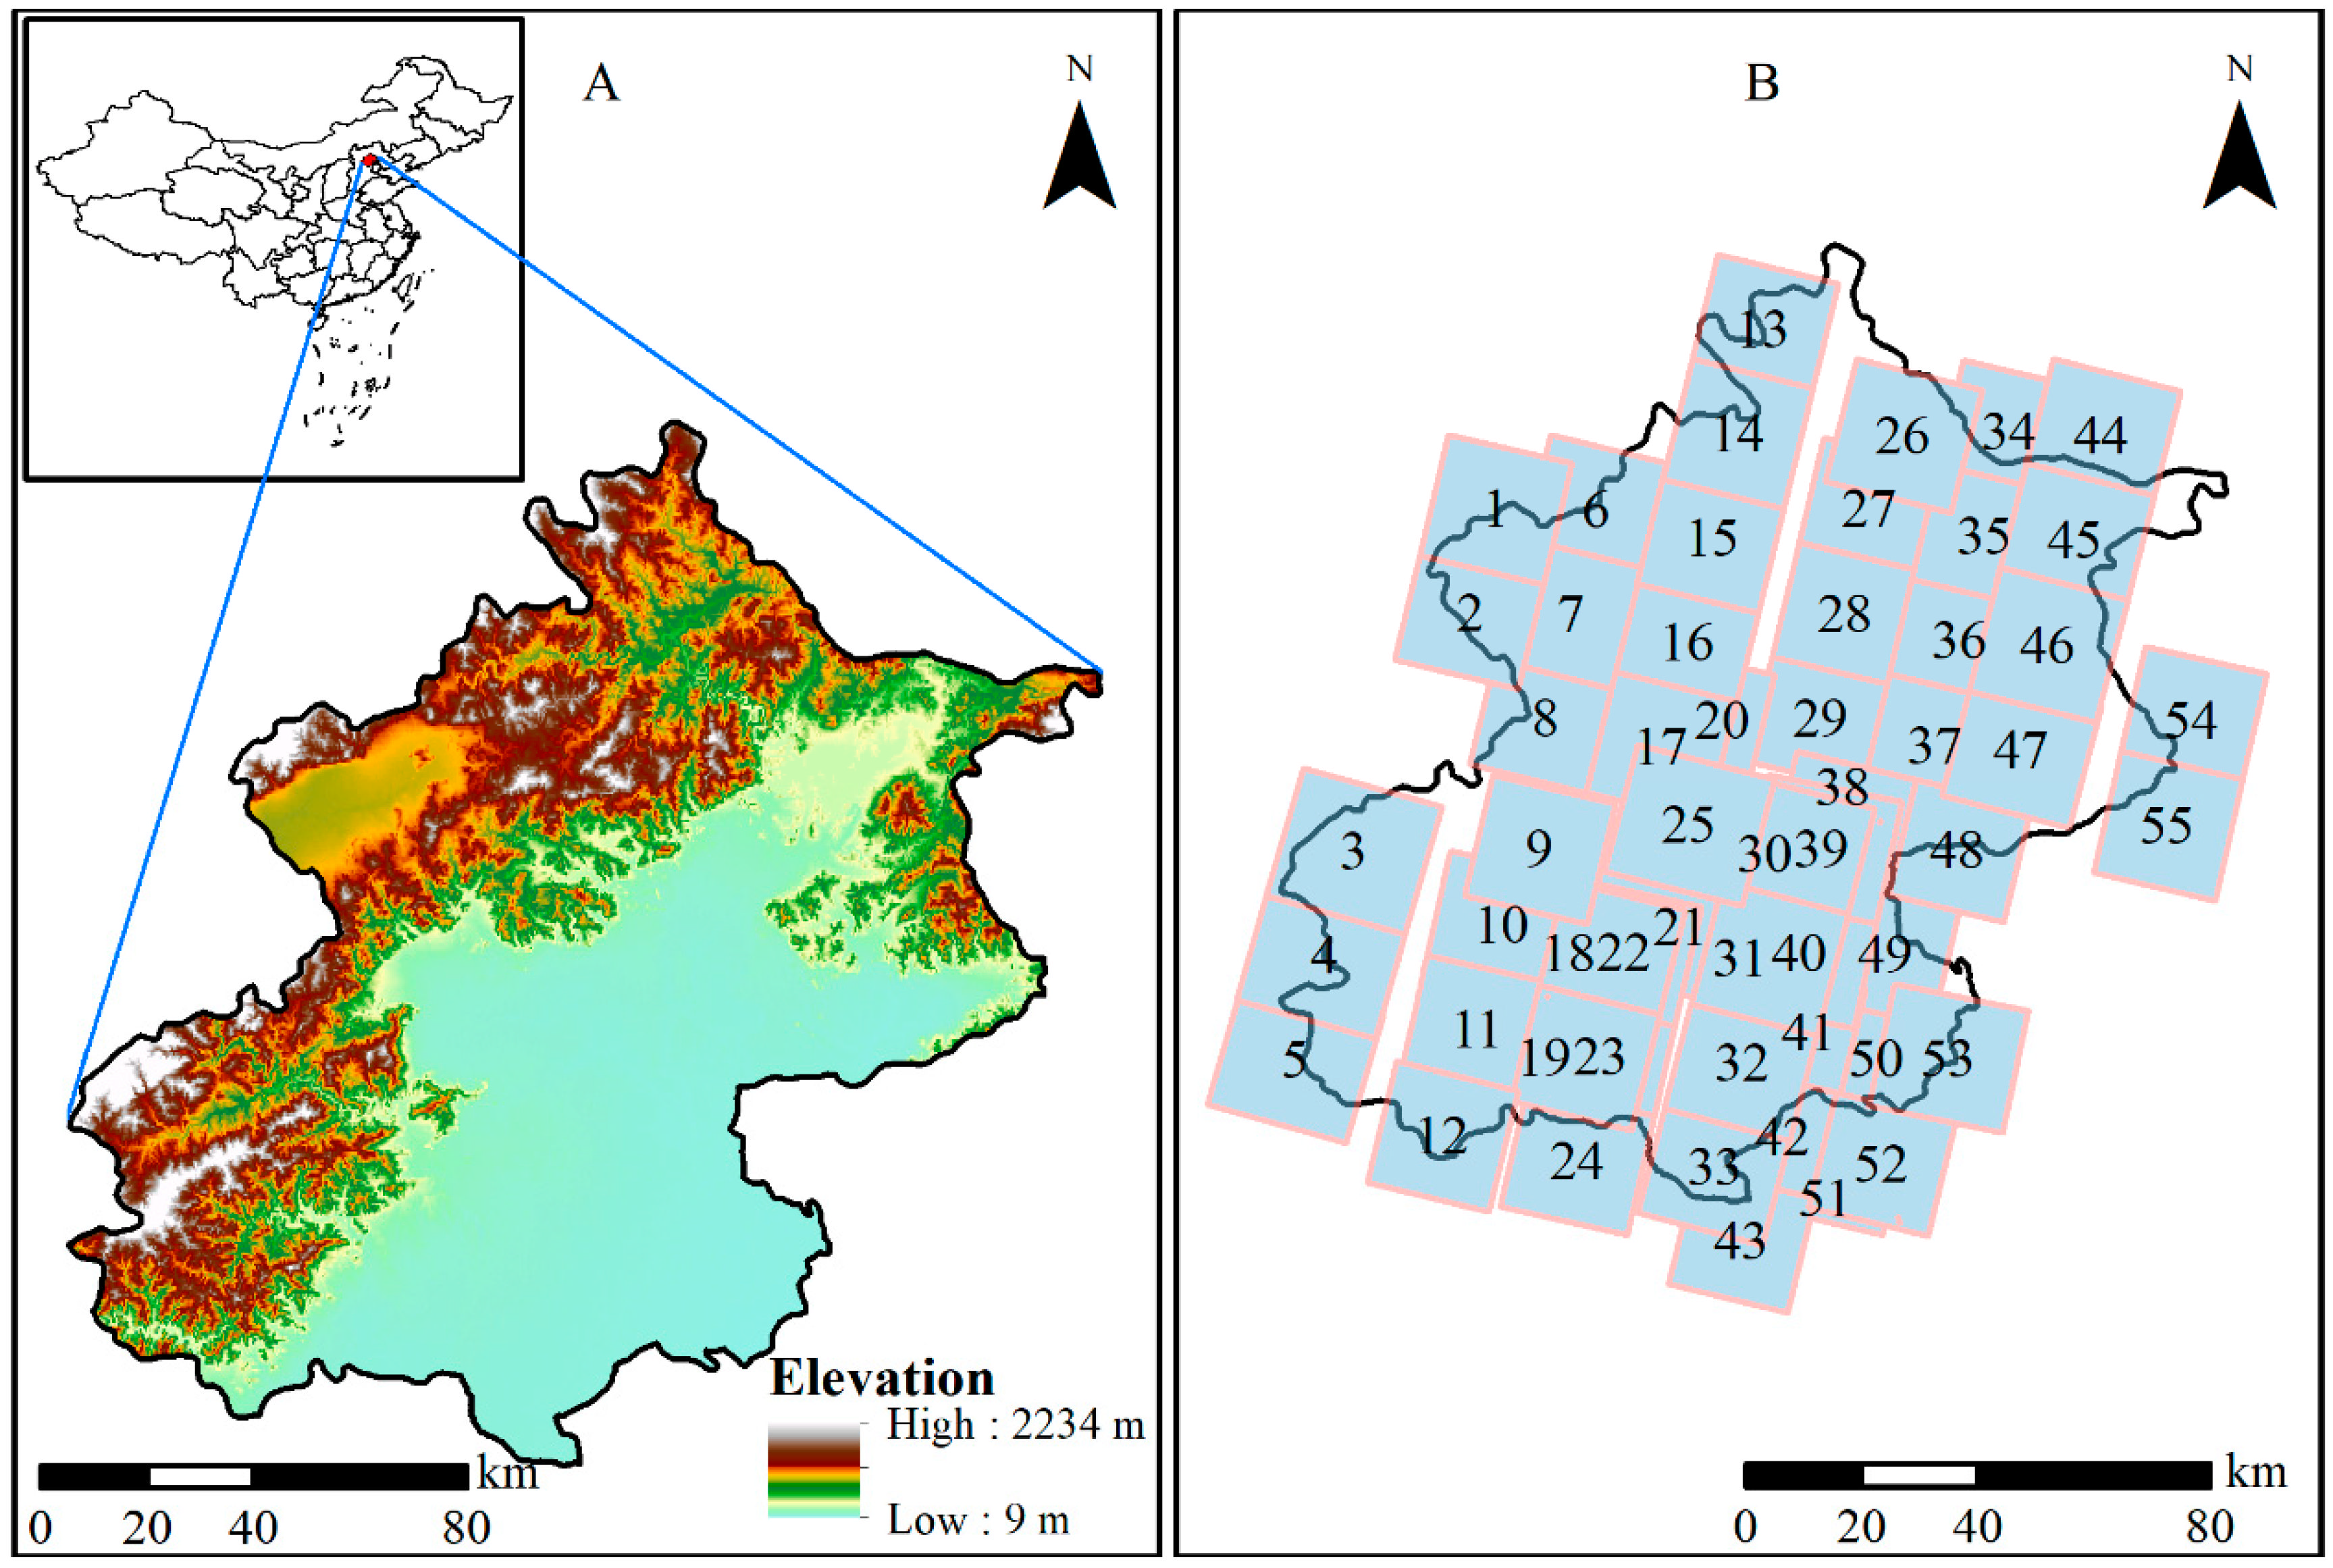
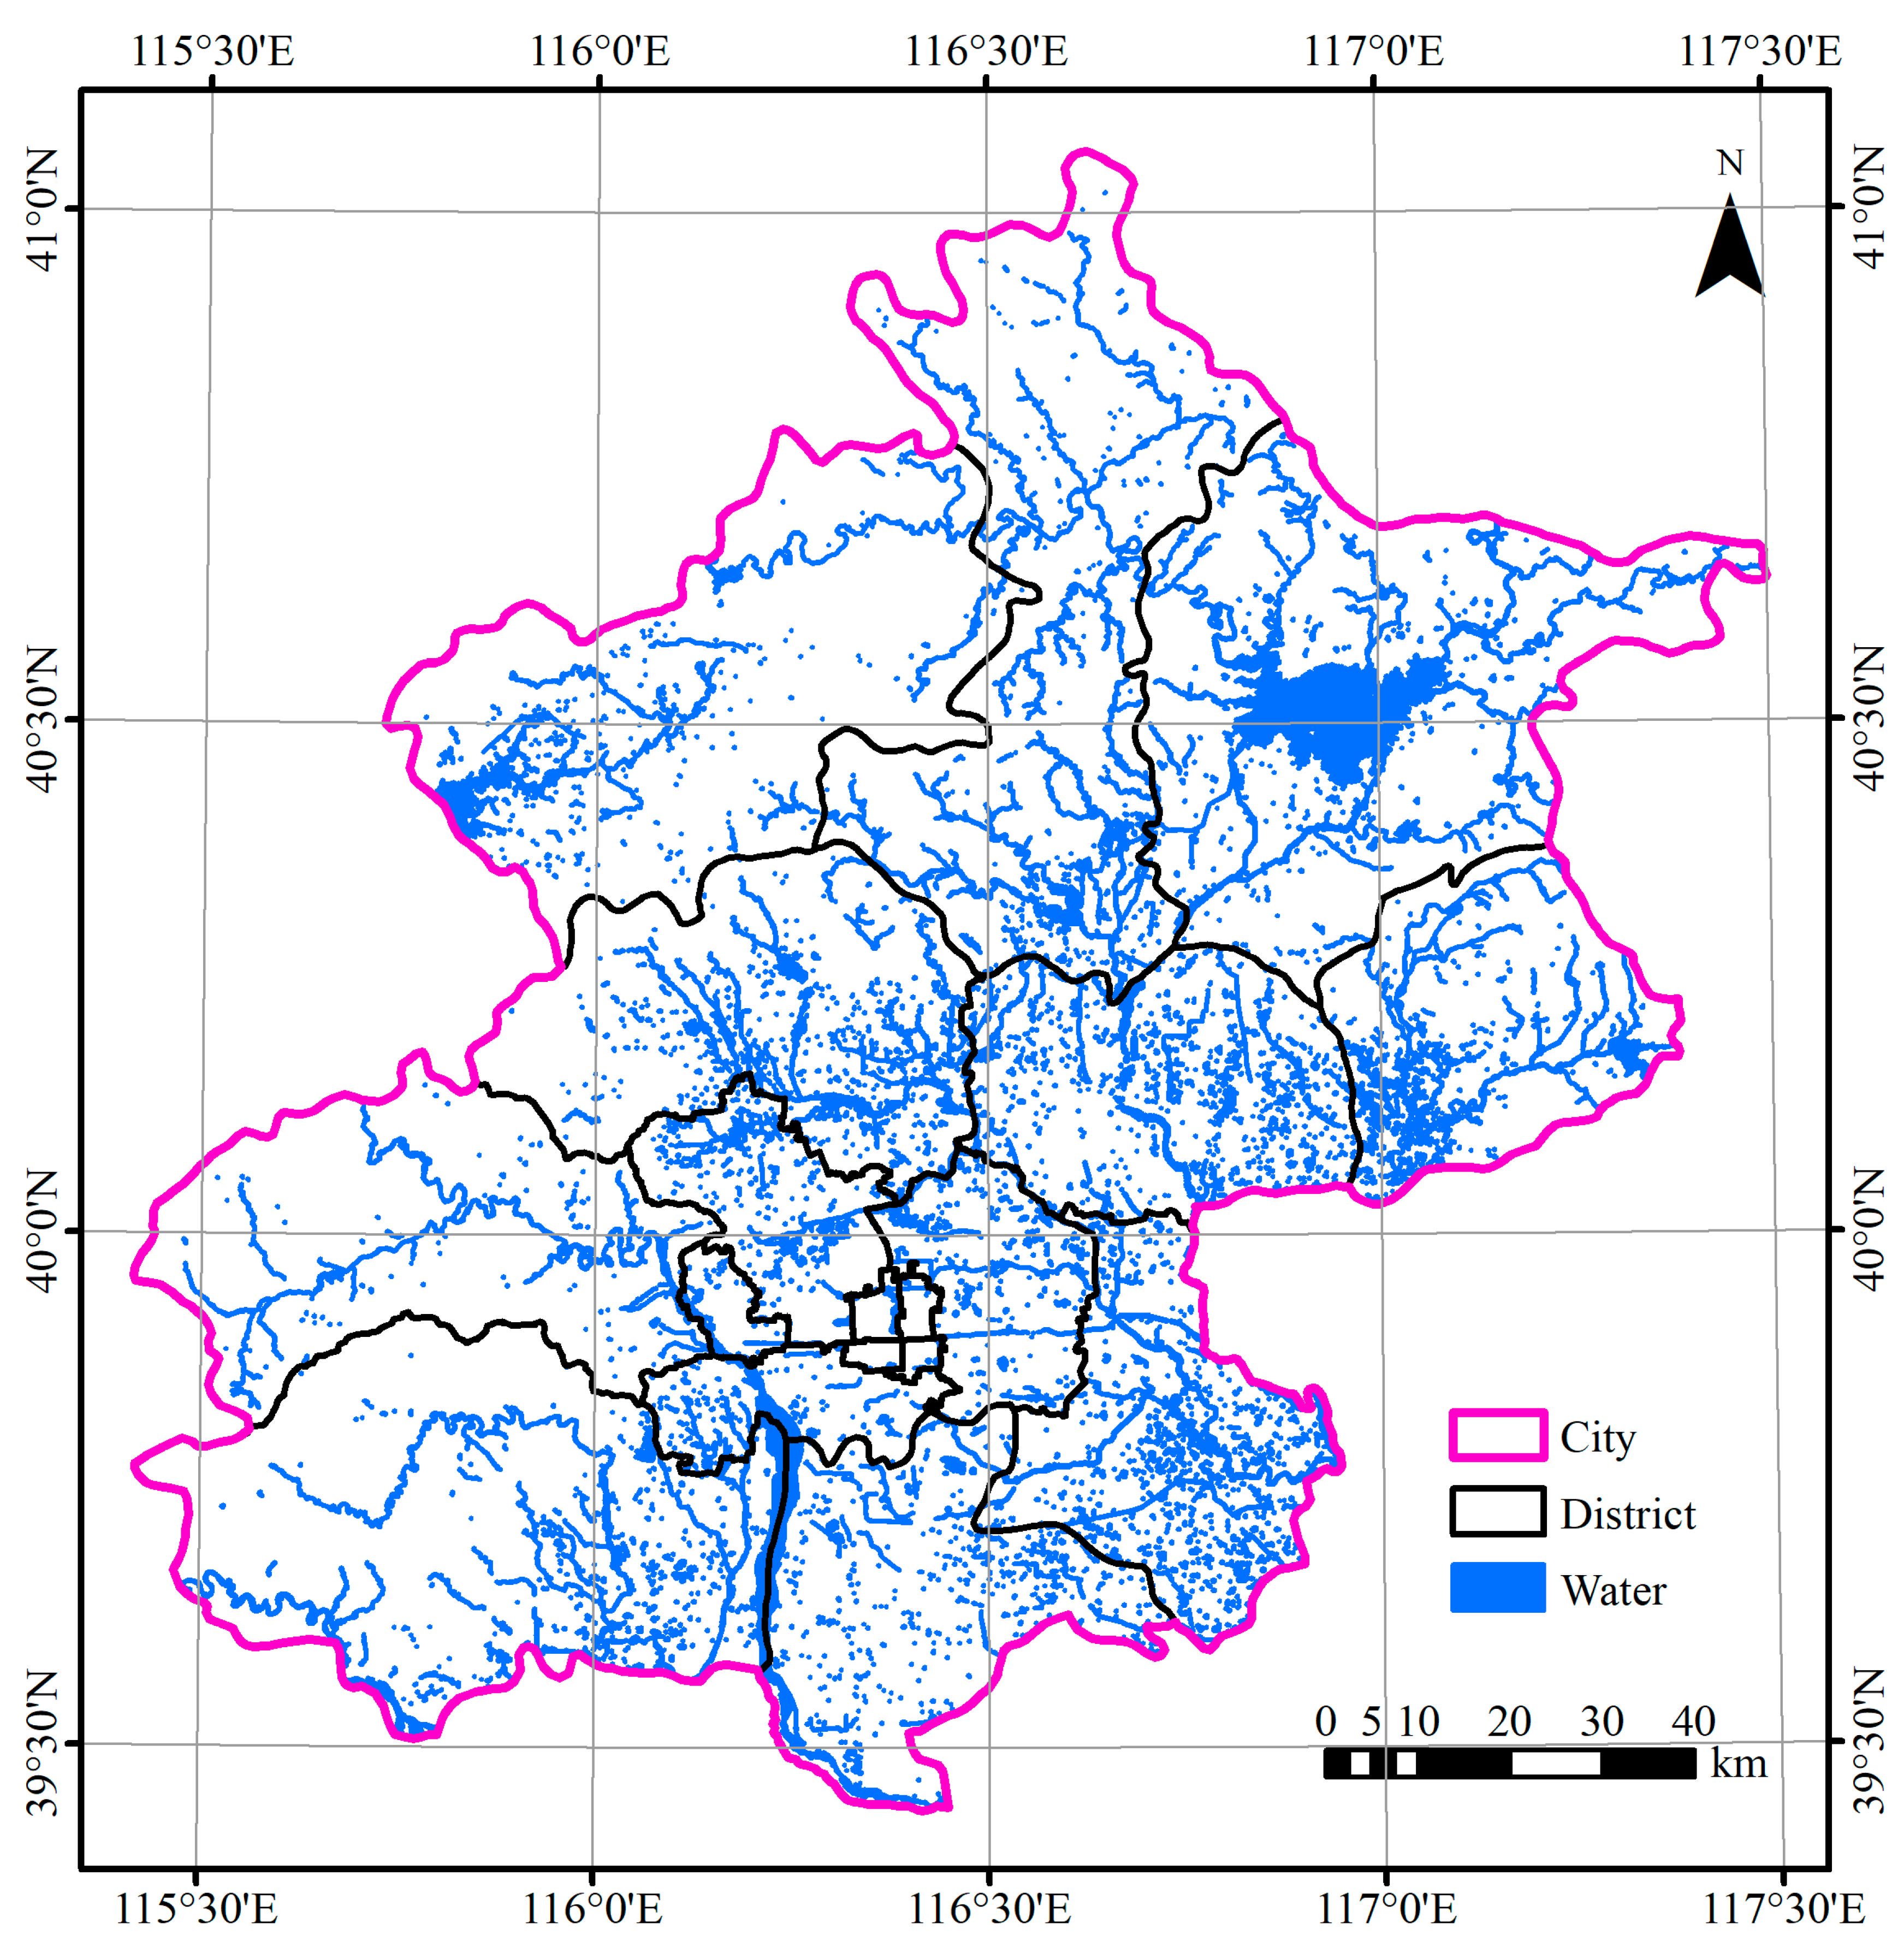
2.1. Study Site

In this paper, Beijing, the capital of China, is taken as the study area (Figure 1A). Beijing is the capital of China and the country’s political, economic, and cultural center. It is located in the Haihe River basin, in an area that suffers from a water resource shortage and a water quality problem [31]. Surface water accounts for about 1/3 of the total water resources in Beijing and is directly related to the economy, agriculture, life, and environment. Therefore, Beijing’s surface water situation needs to be studied to support water resource supply analysis and management. However, previous surveys or studies have not used VHR images to obtain water bodies information throughout the entire Beijing.
Beijing is situated at the northern tip of the North China Plain (39°28′–41°05′ N, 115°25′–117°30′ E) and covers a total area of 16,410.54 km2. The western, northern, and northeastern regions of Beijing are primarily mountainous, with altitudes ranging from 1000 to 1500 m. The southeastern part is a plain with altitudes that range from 20 to 60 m. The climate is hot and humid in the summer and cold and dry in the winter, with prominent warm temperate and semi-humid continental monsoon climate characteristics [36]. The topography and climate characteristics cause the region of Beijing to feature large water bodies such as lakes, reservoirs, rivers, and many small water bodies such as ponds and canals.

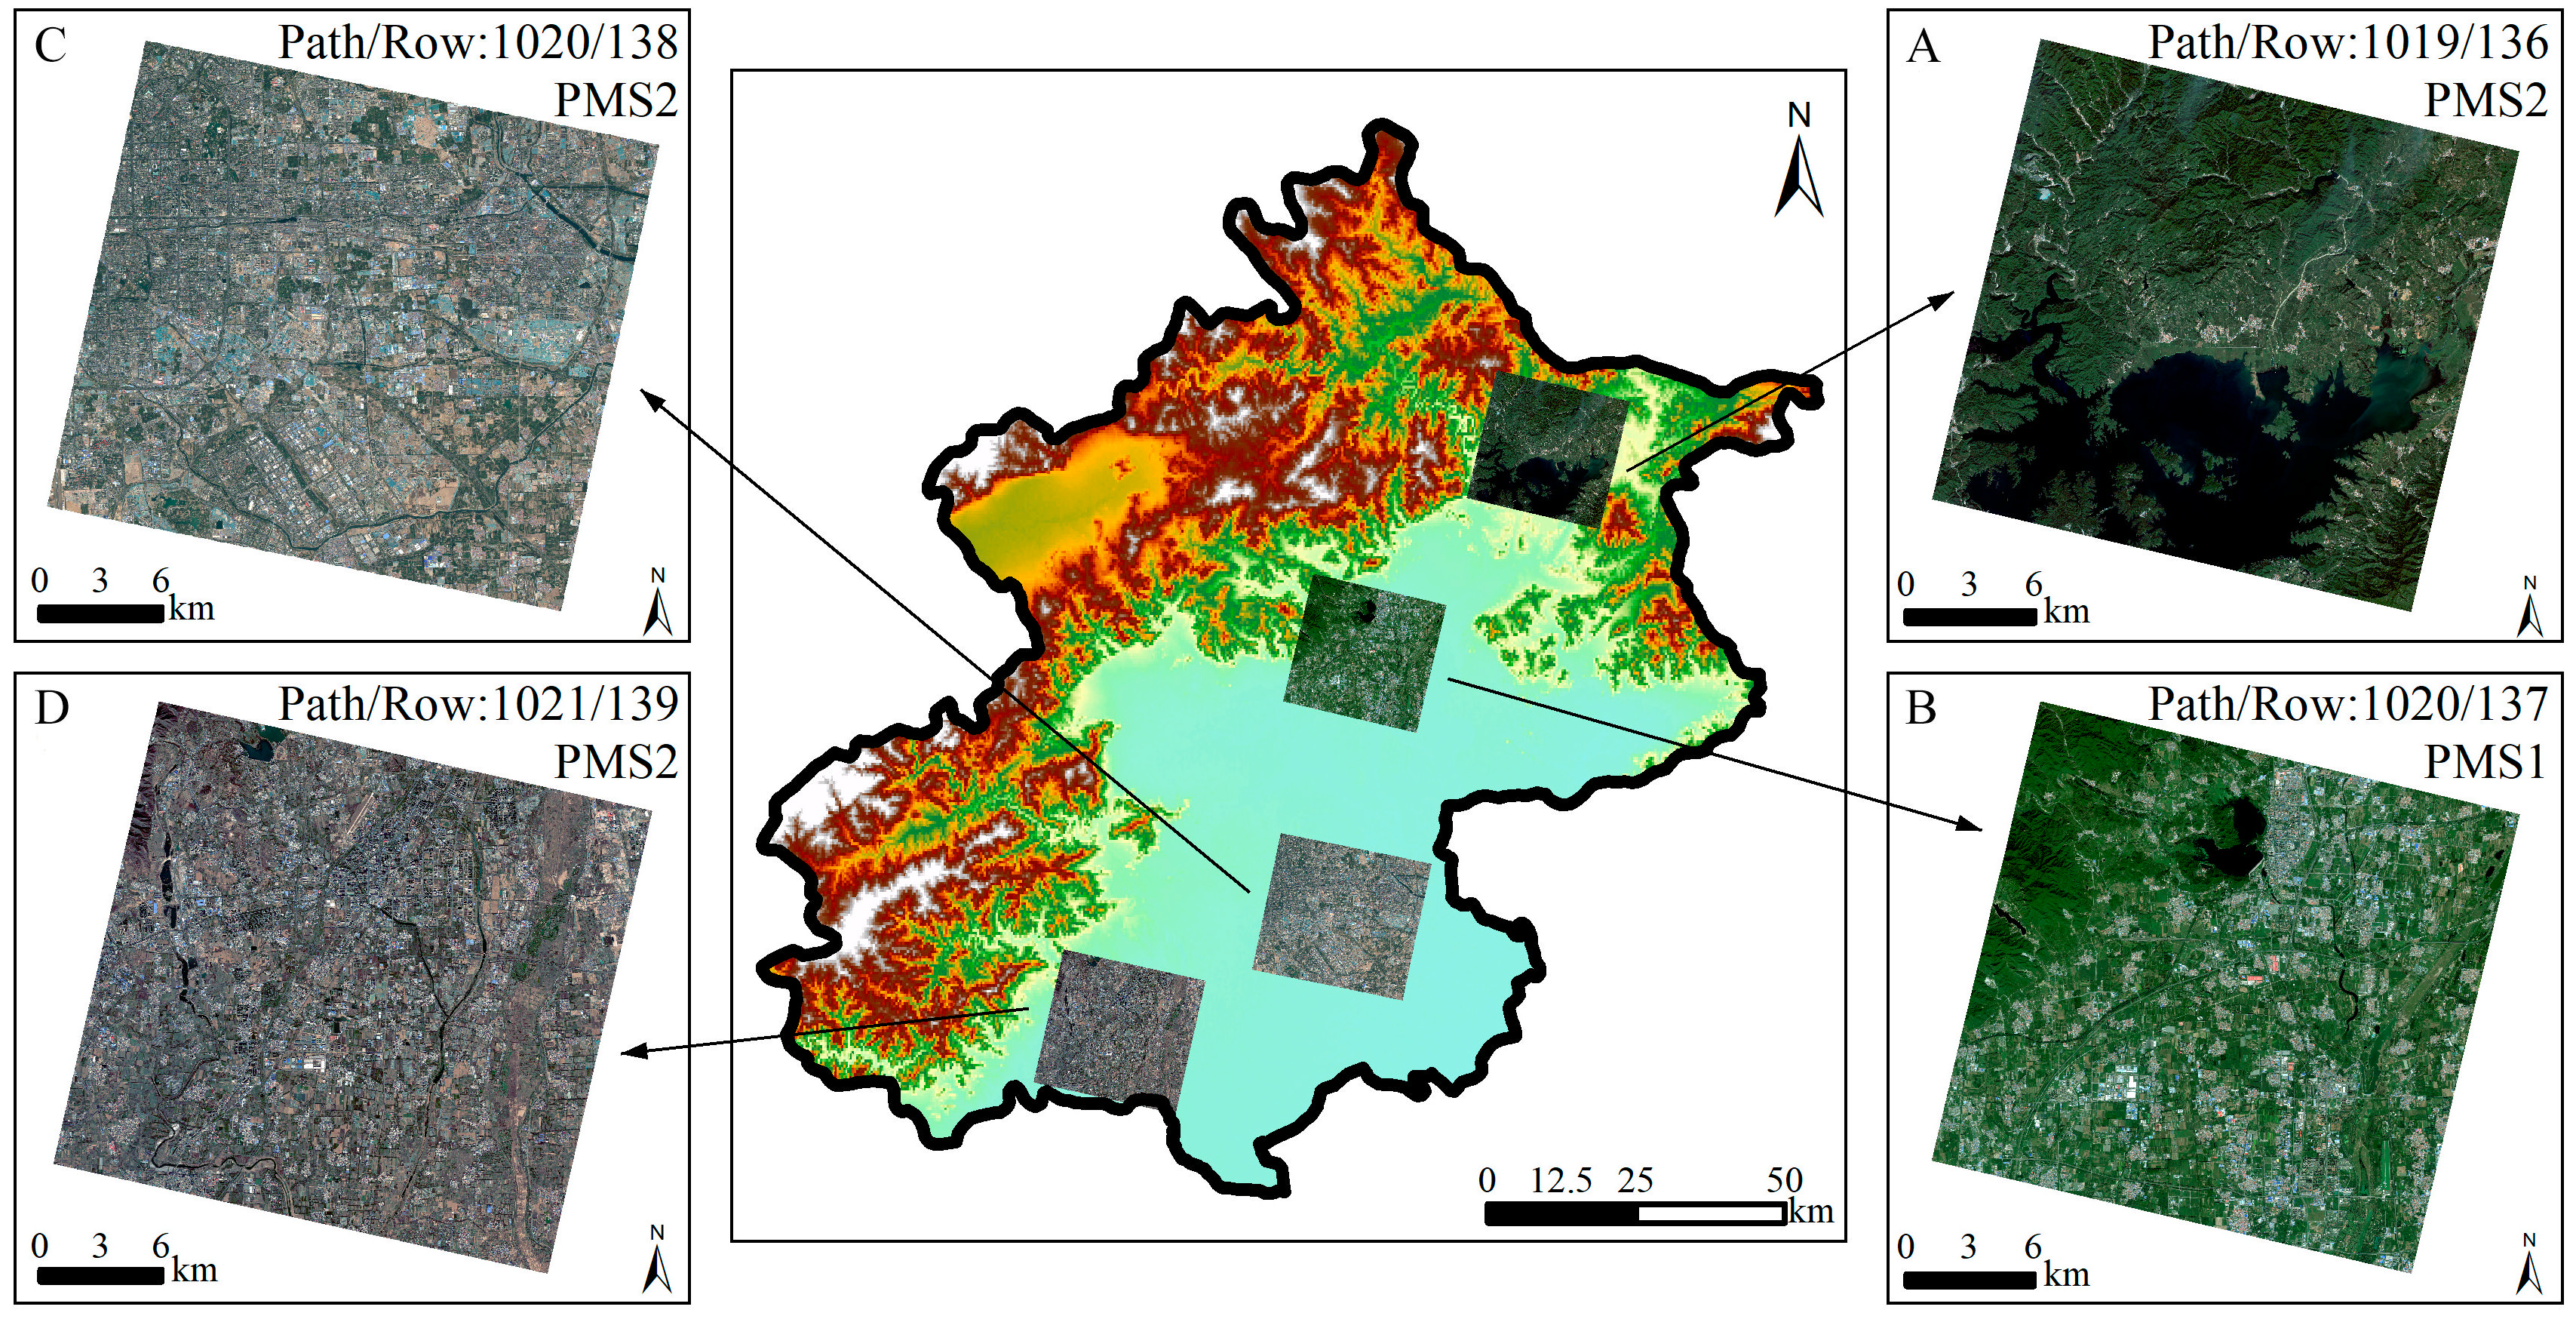
2.2. Very High-Resolution Image and Preprocessing

In this paper, Gaofen-2 (GF-2) image data are used for the analyses. GF-2 is an optical satellite with VHR images from a series of Chinese civilian remote sensing satellites. This satellite provides 1 m resolution panchromatic (0.45–0.90 μm) images and 4 m resolution images with multispectral bands (blue−B1 (0.45–0.52 μm), green−B2 (0.52–0.59 μm), red−B3 (0.63–0.69 μm), and near-infrared−B4 (0.77–0.89 μm)) on a swath of 45 km. Table 1 lists the main information of 55 images (shown in Figure 1B), including acquisition time, water body types depicted, and major shadow noise sources. The 55 images are derived from the China Center for Resources Satellite Data and Application (http://www.cresda.com). Since images obtained during the rainy season do not cover the entire area, we also used the images obtained during the non-rainy season. Thus, the 55 images obtained cover most of the Beijing area. The corresponding periods ranged from 1 March to 29 October in 2018 (37 images) and from 9 May to 11 November in 2019 (18 images). The major shadow noise sources include hills, buildings, street trees, and trees.
To use VHR images on a large scale conveniently, batch processing is the most appropriate and effective way. First, orthorectification was implemented for all images. Then, radiometric calibration and atmospheric correction were achieved using the Environment for Visualizing Images (ENVI) API (version 5.3) with Interactive Data Language (IDL) coding and processing for each image. For atmospheric correction, the Fast Line-of-Sight Atmospheric Analysis of Hypercubes (FLAASH) model in ENVI was used, with a requirement for appropriate value selection for the model parameters, such as ground elevation and atmospheric model, based on the actual condition of each image.

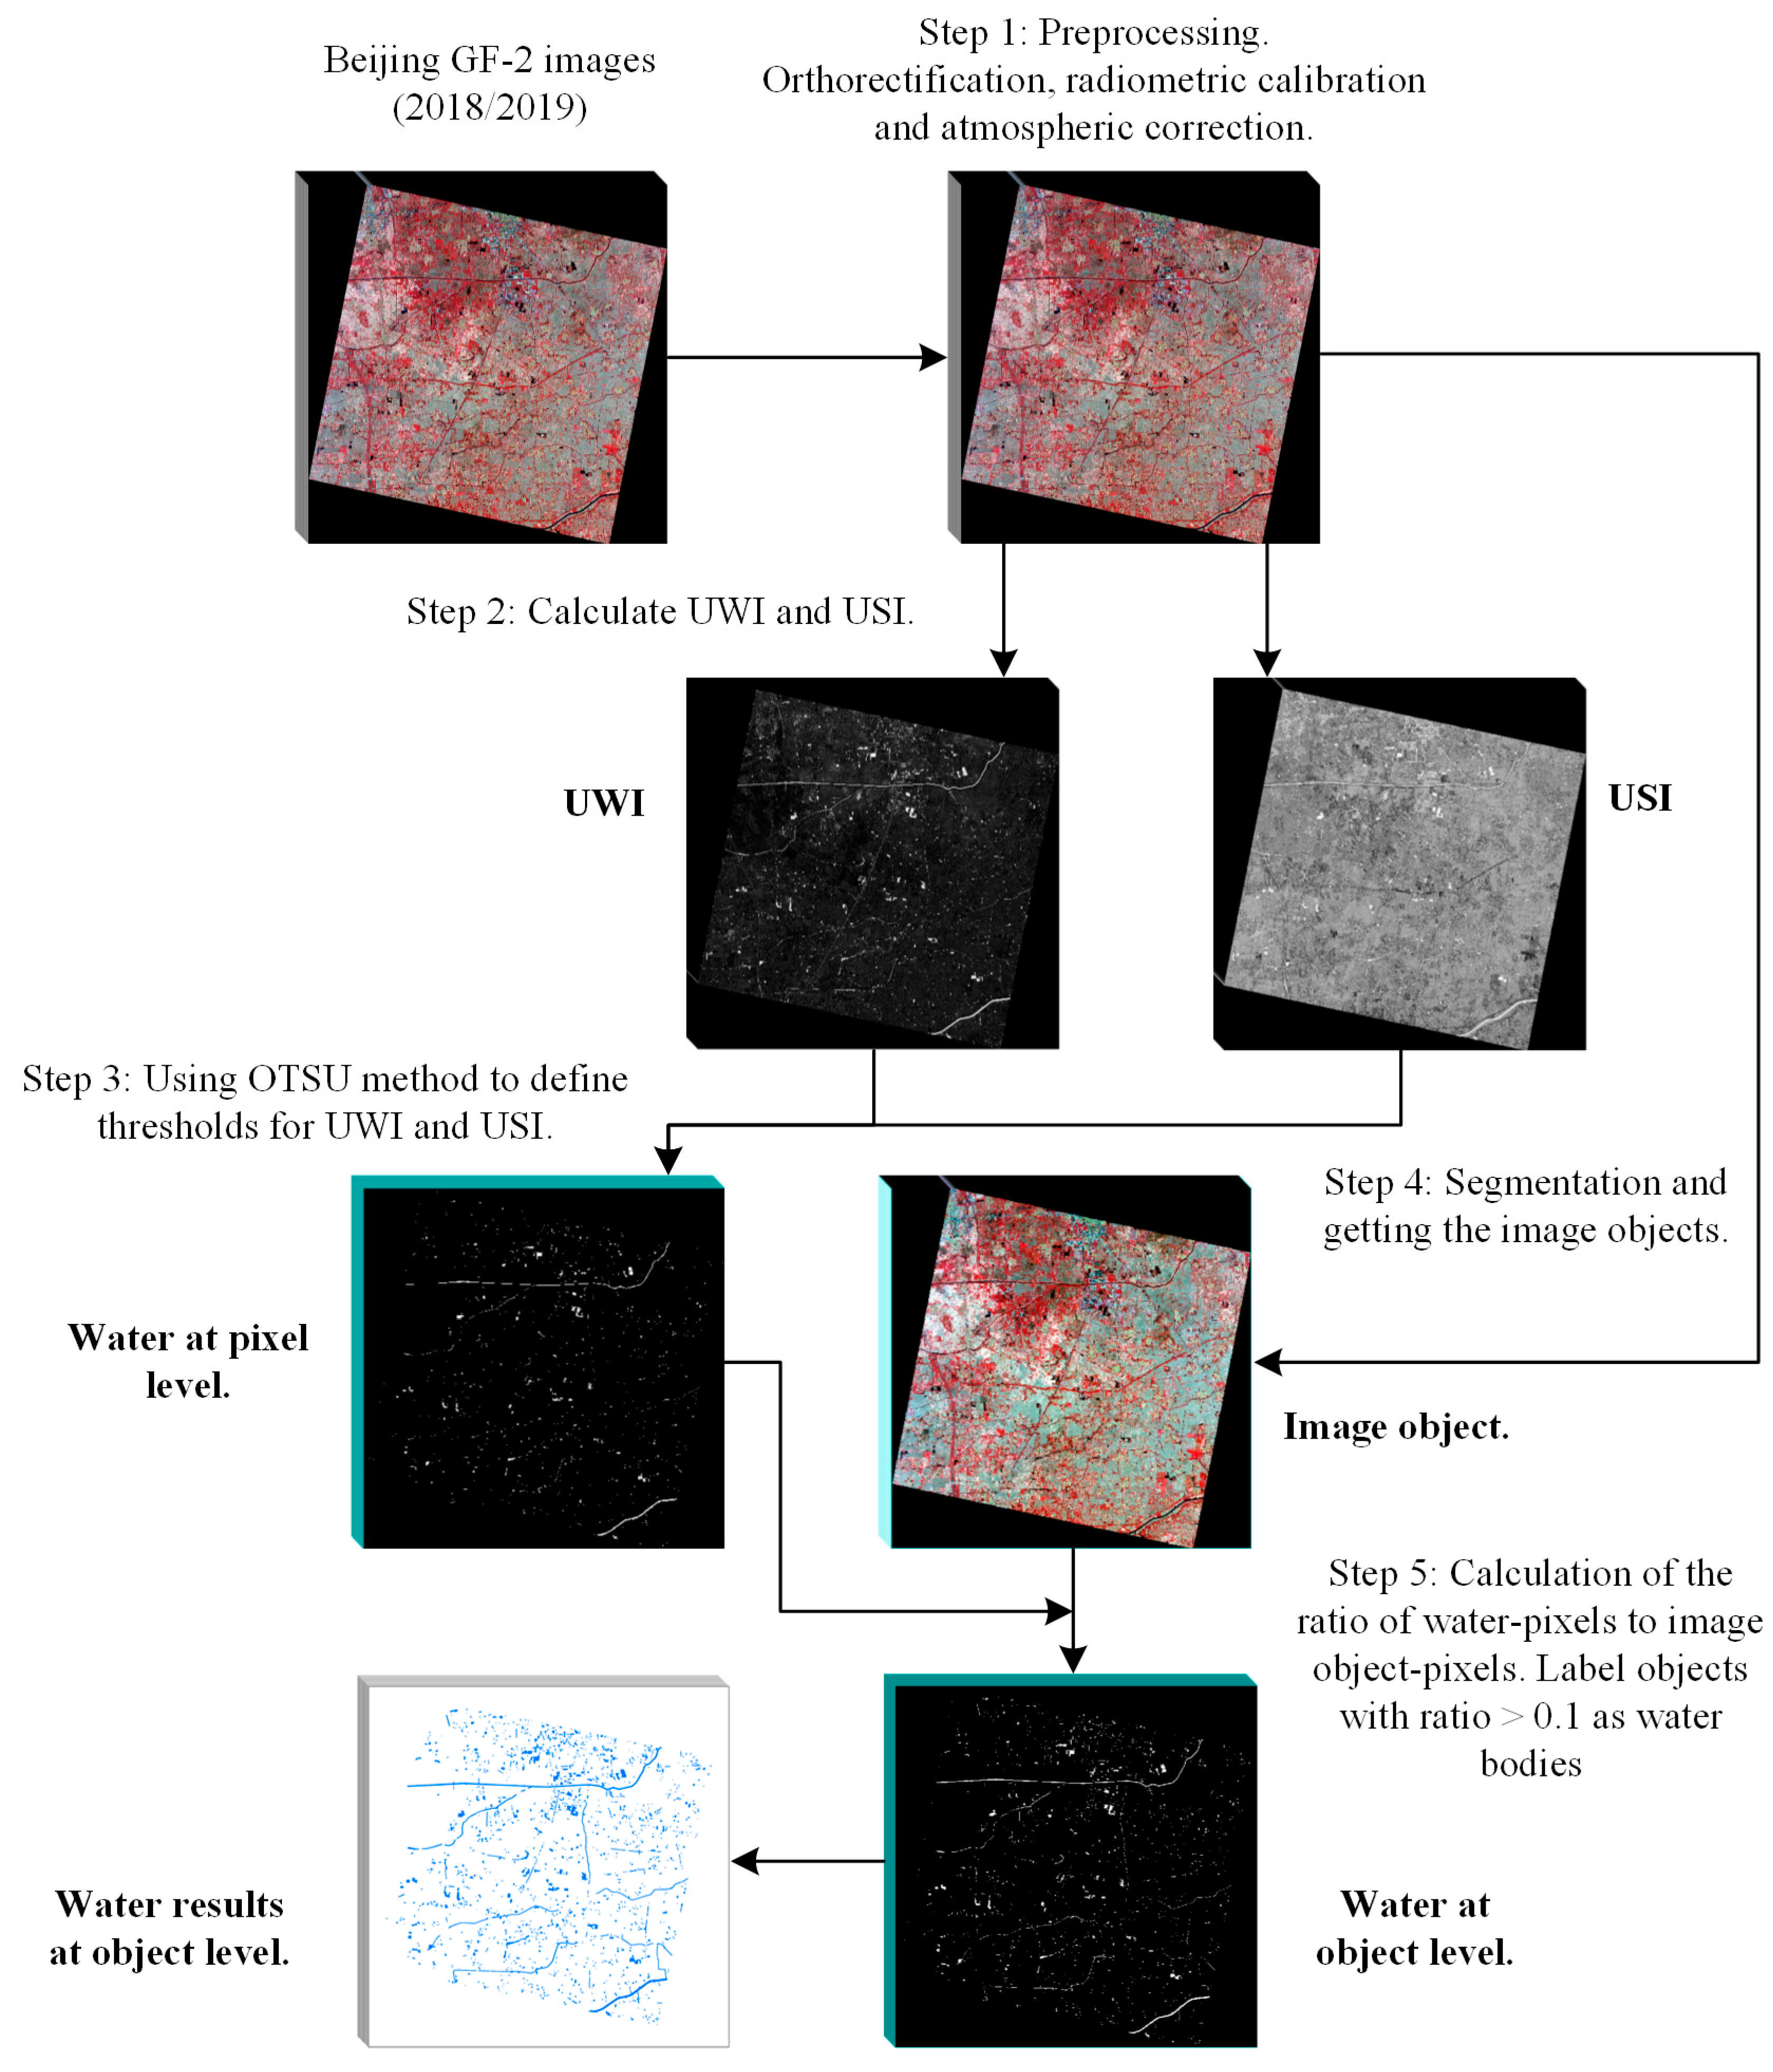
2.3. Water Extraction Workflow

The overall framework presented in Figure 2 shows the procedures used in this study to develop a convenient and accurate extraction process for water body information on a large scale using multiple VHR optical satellite images. The proposed method comprises five main steps: (1) Image preprocessing; (2) Water index (WI) calculation; (3) Pixel-level water body information extraction via WI thresholds definition; (4) Image segmentation and object extraction; (5) Calculation of the proportion of water pixels to the corresponding image object pixels and water body detection.
This paper’s focus is on a novel two-level pixel-object batch processing framework for water extraction. On the first level, a pixel-based WI is used to extract water body information. The spectral WI is widely used because of its high accuracy, easy implementation, and good results within commonly used water body information extraction methods [26,32,33,34]. For VHR image applications with ample storage resources and large numbers of images, the WI method is very suitable, as it only requires band calculations and determination of the water threshold. The method does not require multiple surface types to be extracted or substantial calculations and processing, which results in improved information extraction speed.
On the second level, pixel-level water body information and image objects are combined to obtain the object-level water body information. Batch processing is implemented for the entire acquisition process. Lakes, reservoirs, and ponds generally manifest with internal homogeneity, and each entity can be regarded as an independent and complete object. The WI extraction method–based pixels will appear as “salt and pepper” noise, reducing the integrity and comprehensiveness of the ground objects. If the misclassified pixels are located inside an object, this will affect the integrity of the object. Therefore, these three types of water bodies are more suitable for object-based extraction methods which ensure that each surface type object is extracted completely [37,38]. In this paper, object-oriented and WI methods are combined to extract water body information and the whole process is realized using IDL coding to achieve batch processing of multiple images.

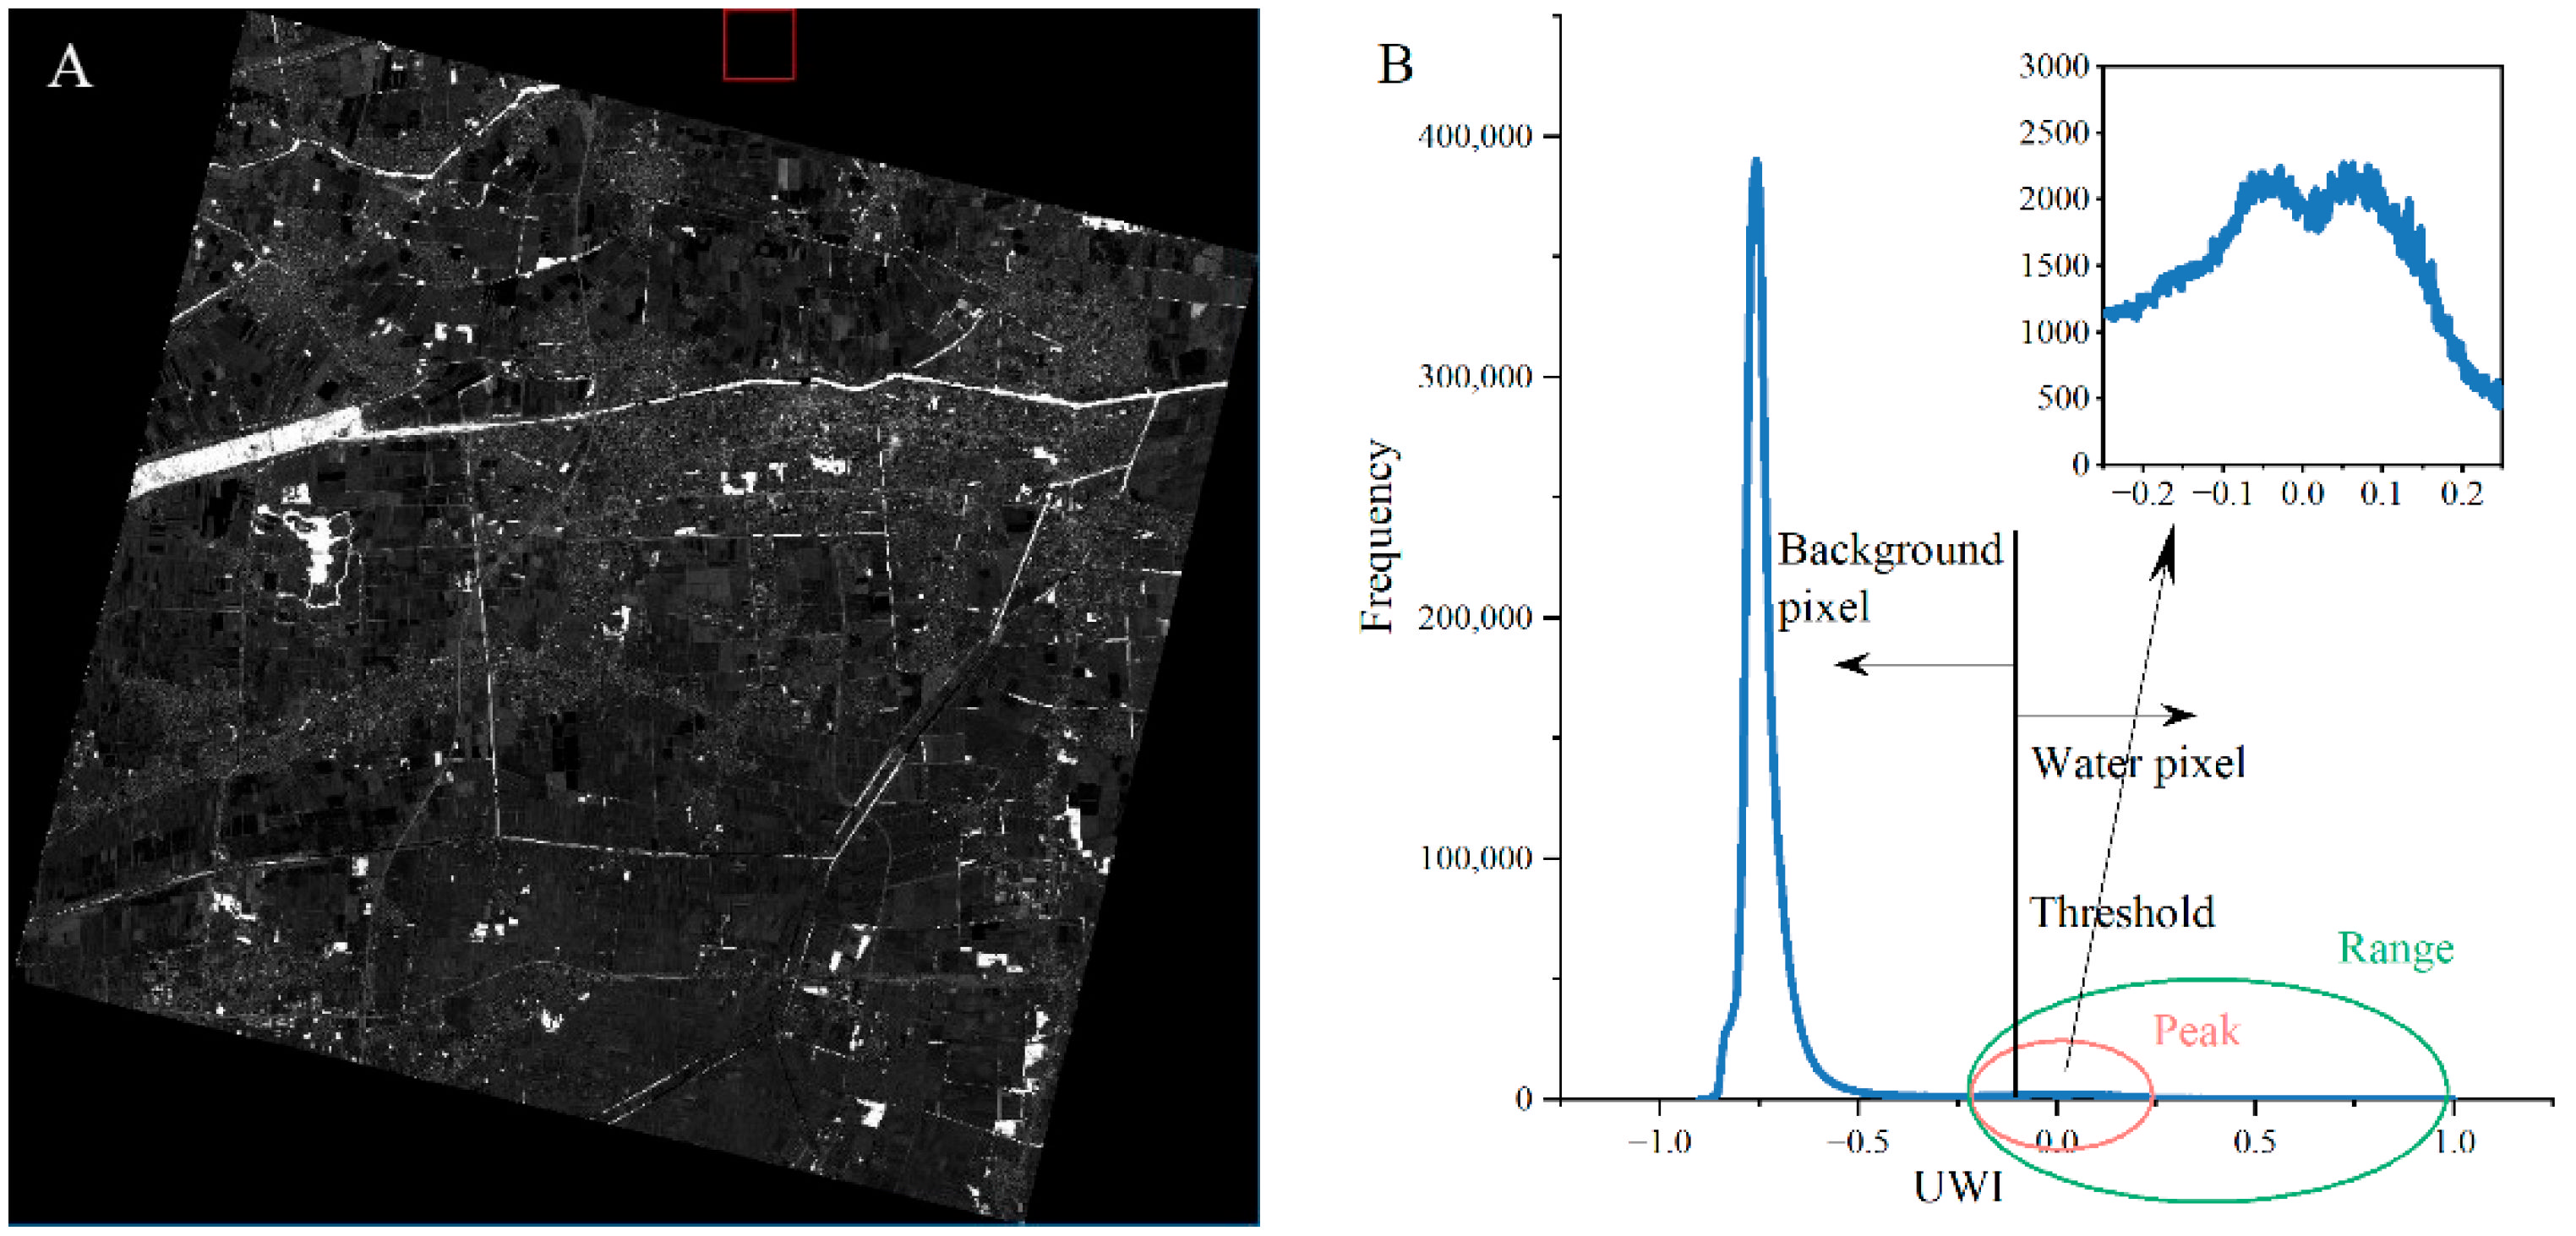
2.3.1. Spectral Water Index

When extracting water body information from VHR images, shadows are a common cause of algorithm confusion. Conventional WIs, such as the normalized difference water index and the High-Resolution Water Index [26], have limited ability to distinguish water bodies from shadows. The Two-Step Urban Water Index [25] (TSUWI), which was developed using GF-2 high-resolution images, can distinguish between urban building shadows and water bodies effectively without the need to determine the water thresholds for the images at the different locations and dates. The TSUWI is a combination of the urban water index (UWI) and the urban shadow index (USI). The UWI is used to distinguish water (classifying shadows as water) and non-water body types, and is based on binary classification using a linear support vector machine on some bands. The USI is used to distinguish between water and shadow types based on the UWI image, and works in a similar fashion to the UWI. The indices are calculated using the following equations:
UWI = G 1.1 × R 5.2 × NIR + 0.4 G 1.1 × R 5.2 × NIR ,
USI = 0 . 25 × G R 0 . 57 × NIR G 0.83 × B G + 1 . 0 ,
and
TSUWI = UWI > T 1 USI > T 2 ,
where G, R, NIR, and B represent the reflectance of green, red, near-infrared, and blue bands, respectively. The thresholds T1 and T2 are usually set at 0.
During practical applications, we found that due to the difference in scene brightness and scene contrast at different times and locations, the optimal thresholds of UWI and USI in each image were not necessarily 0, but some values close to 0 (Figure 3B). Thus, it is necessary to consider the spatial heterogeneity and determine the threshold according to the actual imaging conditions. In UWI and USI images, the contrast of target and background pixels is evident, and the frequency histogram follows a bimodal distribution, which is suitable for threshold-based segmentation methods.
Taking a typical UWI image as an example, the study area’s number of water pixels is usually much smaller than that of the background pixels (Figure 3). In Figure 3A, the spatial distribution range of the bright water and shadow pixels is much smaller than that of the dark background, as is the corresponding number of pixels in Figure 3B. Thus, the peak of the bright water and shadow pixels is not pronounced, and it is relatively tricky to determine the threshold between the bright water and shadow pixels and the dark background pixels.
Typical threshold segmentation methods include Otsu, maximum entropy, iteration, 2-Mode, etc. [39]. The 2-Mode method requires that the grayscale histogram of the target image has pronounced double peaks. The iterative method requires different thresholds for each water body and shadow object in the image. After experiments, the number of thresholds for each iteration was enormous and computationally expensive. We also conducted experiments using the Otsu and the maximum entropy methods, and the results showed that the Otsu method performed relatively well. Japanese scholar Otsu proposed the algorithm in 1979 as a method to determine an image binarization threshold [40] by maximizing the inter-class variance between two classes of pixels. The Otsu algorithm is a universal algorithm for selecting thresholds in image segmentation, and it is widely used in digital image processing due to its advantages of simple calculations and robustness to different image brightness and contrast levels.

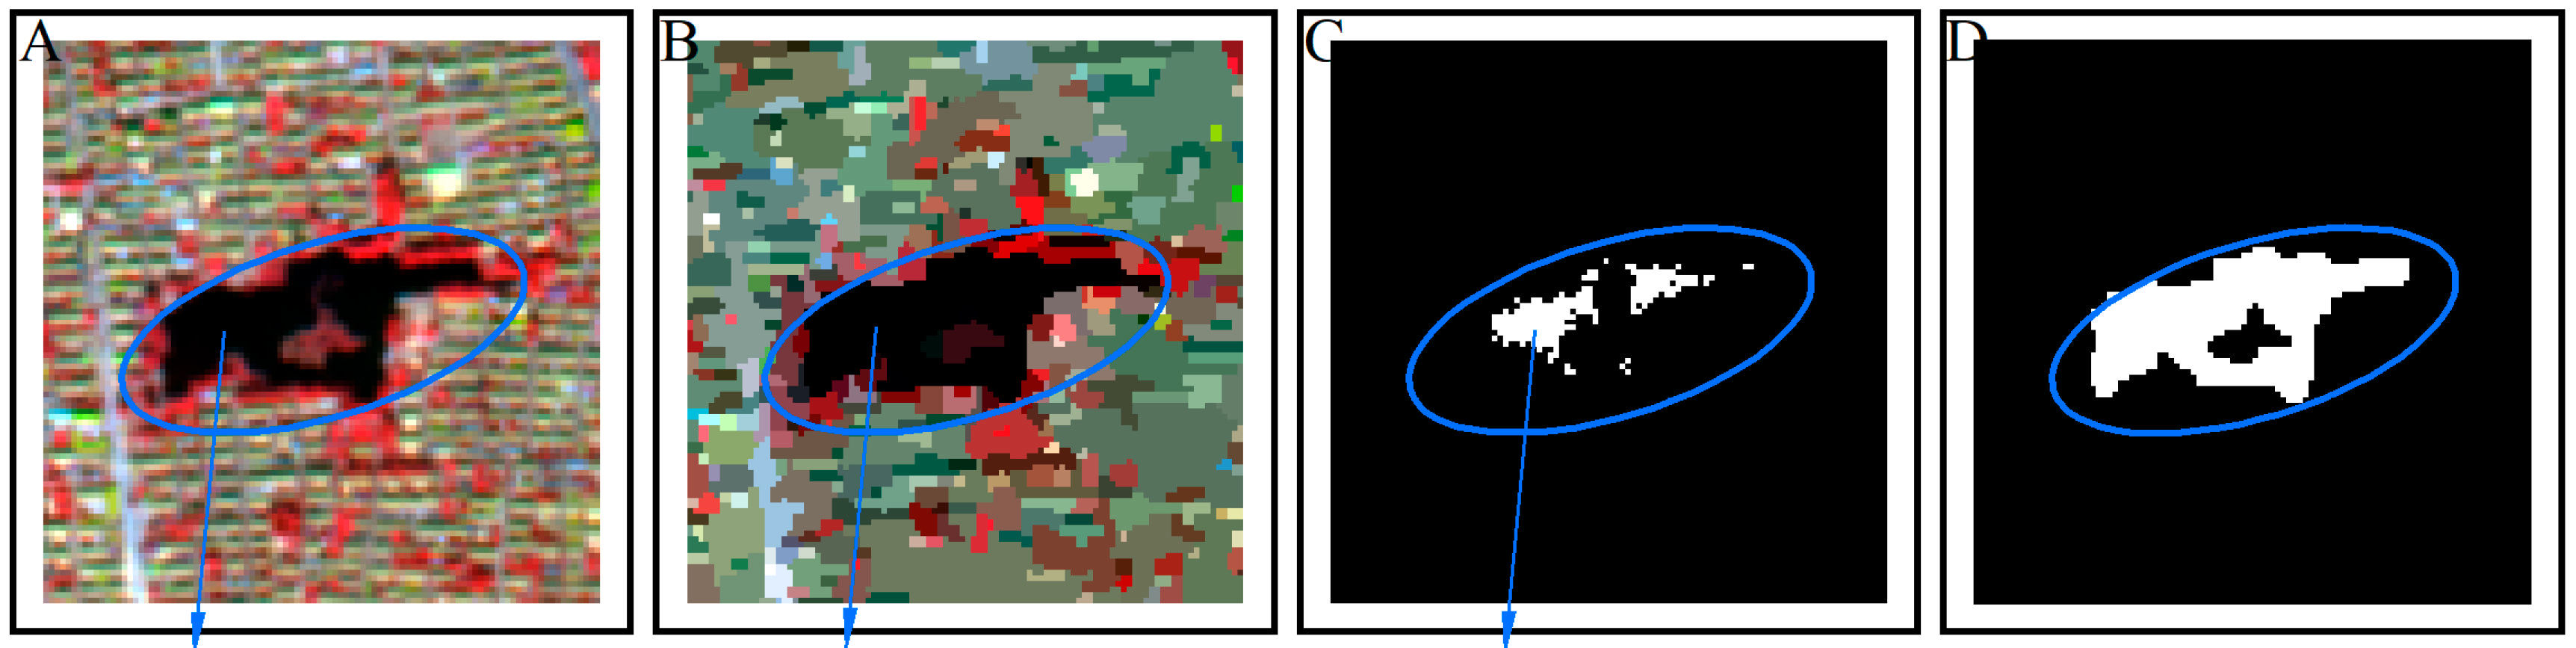
2.3.2. Object Detection

ENVI-IDL’s “envi_fx_segmentonly_doit” function was used to perform segmentation for all images to detect objects. The segmentation scale is a key factor of the segmentation function, and its value is related to the integrity of the detected objects. Beijing spans a wide coverage and has a varied topography and surface. Thus, different images have different optimal scales. At the same time, it is difficult to determine the optimal scale for each image automatically. Depending on the topography and surface characteristics, Beijing can be divided into two regions: mountains and plains. Five images in each region were selected as samples, and the optimal segmentation scale for each sample image was determined using trial and error. The optimal scale factor needs to be such that the segmented water body objects have the highest homogeneity, while other types have the highest heterogeneity. The average value of the five sample images’ optimal scales was taken as the optimal segmentation scale of all the images in each region.

2.3.3. Combination of Pixel-Based Water Index and Image Object

After the image segmentation step, the surface types are the form of image objects. The object-based water body information is obtained using the corresponding pixel proportion at the same spatial position (Figure 4), named the two-level pixel-object method.
First, each object is numbered, and the number of its pixels is counted (Figure 4B). Then, the number of water pixels in the corresponding space of the object is counted (Figure 4C). Finally, the ratio of the number of these pixels for the two types is calculated (Equation (4)), and image objects with a ratio above a threshold (>0.1) are identified as water objects. In addition, to further eliminate salt-and-pepper noise, water bodies with fewer pixels than a specific value (7 pixels) are defined as misidentified and are dismissed from the output.
R = p i x e l w a t e r p i x e l o b j e c t
where R is the ratio of the number of the two types of pixels at the same spatial position; P i x e l w a t e r is the number of water pixels (determined from applying Otsu’s method on the TSUWI image) contained in the land surface objects; p i x e l o b j e c t is the number of pixels contained in the land surface object as determined through the image segmentation process.

2.4. Post-Classification Improvement

Due to the complexity of surface cover types, in some areas, the TSUWI cannot distinguish some land surface types with spectra similar to water with complete precision. In addition, some images were in the non-rainy season, causing some seasonal water bodies to be in a dry state. These bodies did not have any water spectrum characteristics and cannot be extracted using the WI. These two factors caused errors in the water body detection. To map the water with higher accuracy, the object-based water results were revised through visual interpretation to correct the misclassifications. The final water results were exported as vector data layers using the ENVI API.
The visual interpretation includes three aspects:
(1) Dry water bodies. Visual interpretation was carried out based on the spectral characteristics and morphology of dry water bodies and referencing other images.
(2) Misclassified water bodies. Objects incorrectly classified as water bodies were deleted.
(3) Unclassified and misclassified water bodies. Visual interpretation was used to supplement the unclassified water bodies and revise the water bodies misclassified as background.

2.5. Accuracy Assessment

For each image, there were one thousand reference pixels (test samples) of two land surface types (water and non-water). The reference pixels were selected at random, and the actual surface type of the reference pixels was determined through visual interpretation. The reference images for the visual interpretation were the VHR images (GF-2) used in this paper. The accuracy assessment was assessed through the kappa coefficient (KC), overall accuracy (OA), producer’s accuracy (PA), and user’s accuracy (UA) derived from the confusion matrix [25]. The confusion matrix was produced via a pixel-by-pixel comparison between the extraction results and the reference pixels.

3. Results

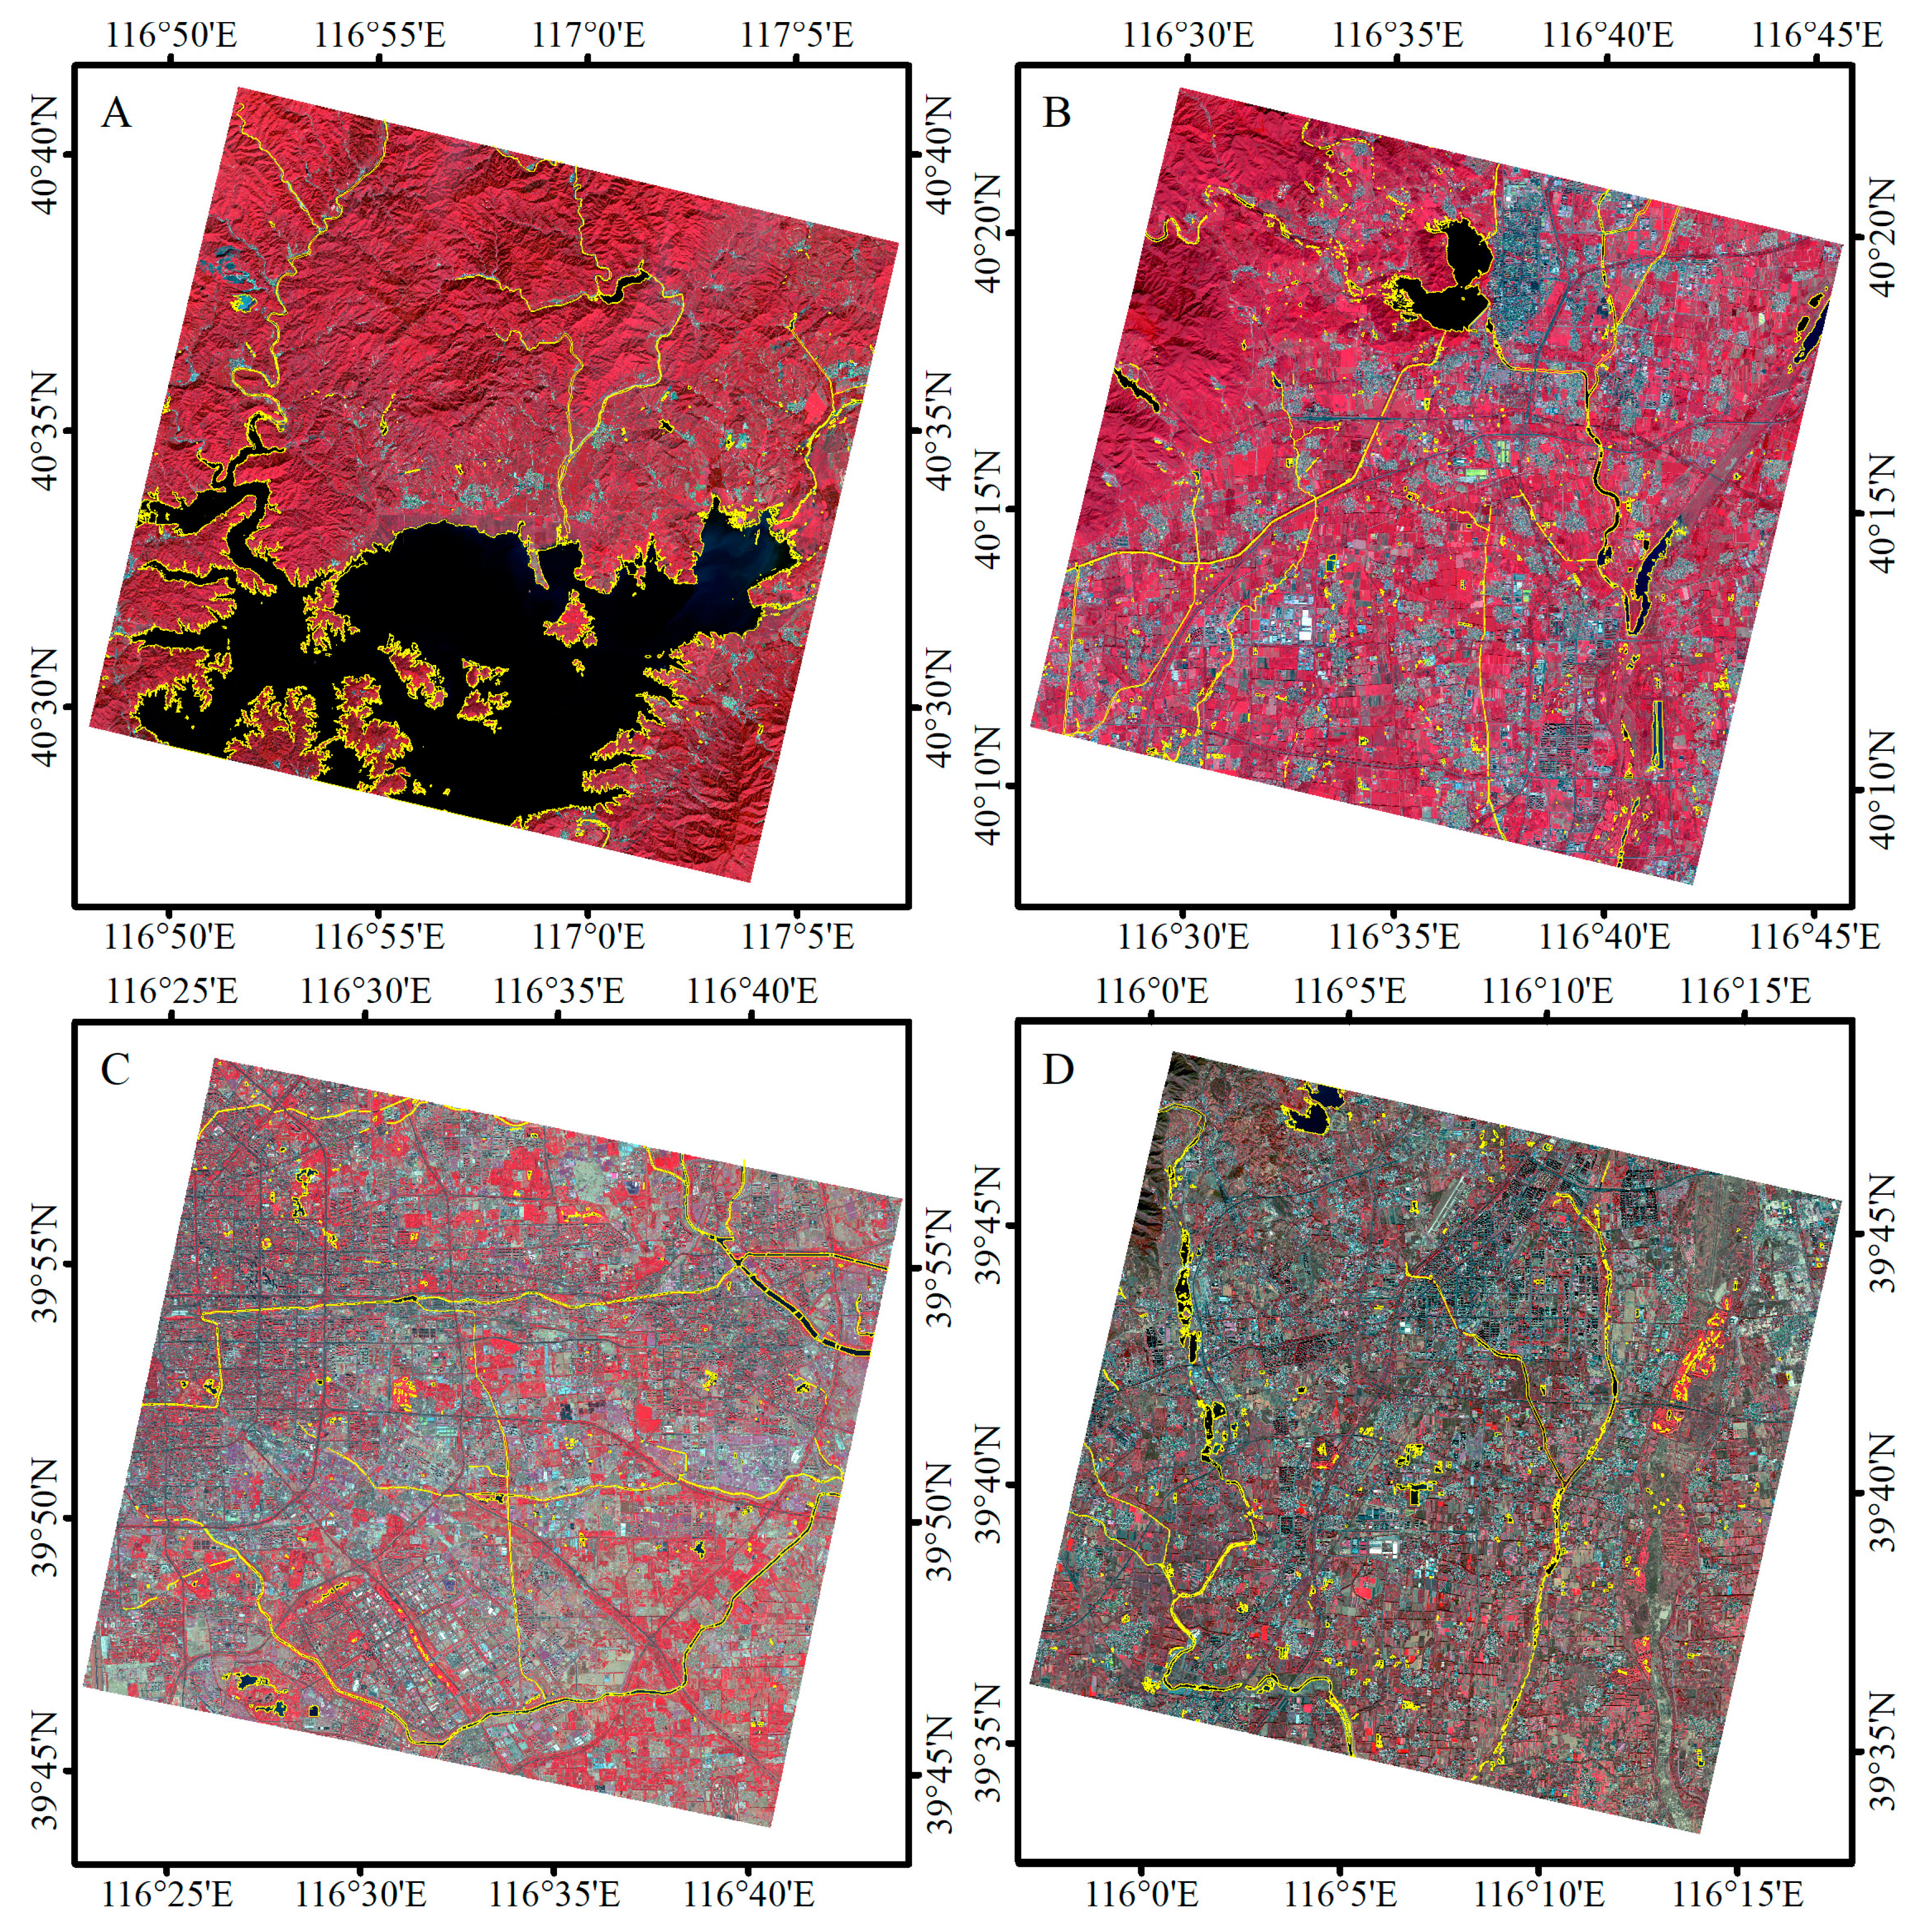
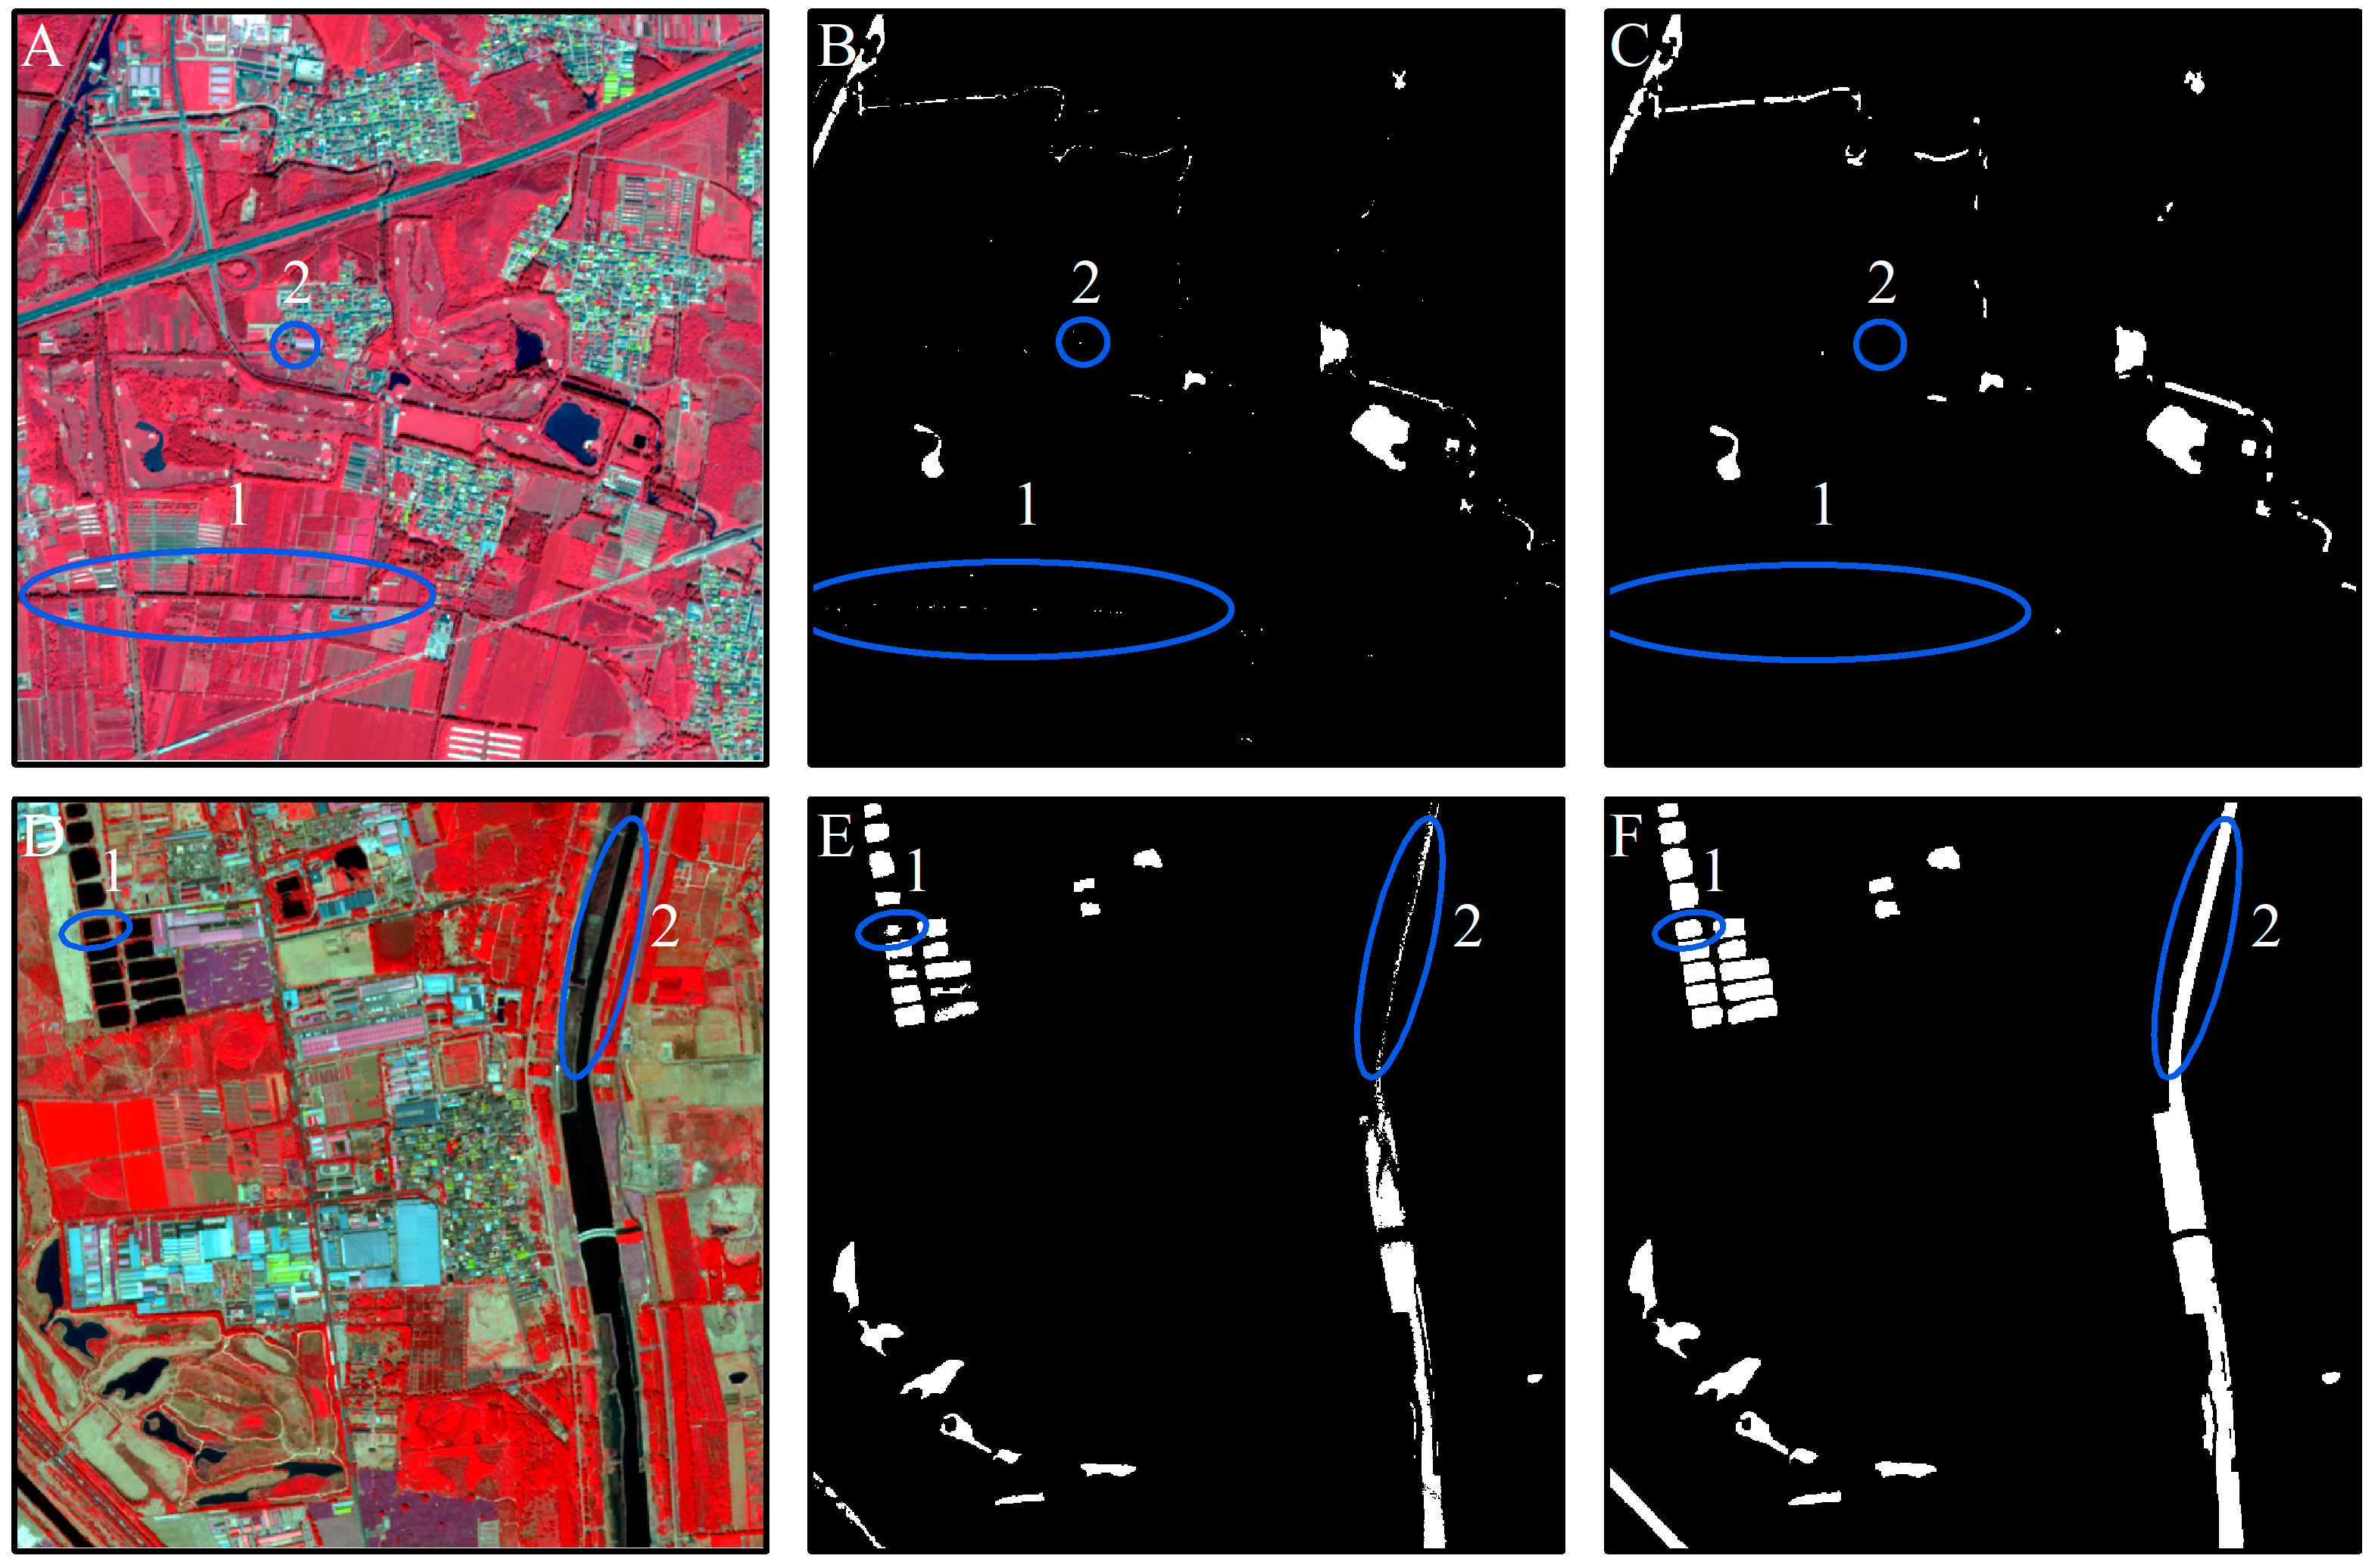
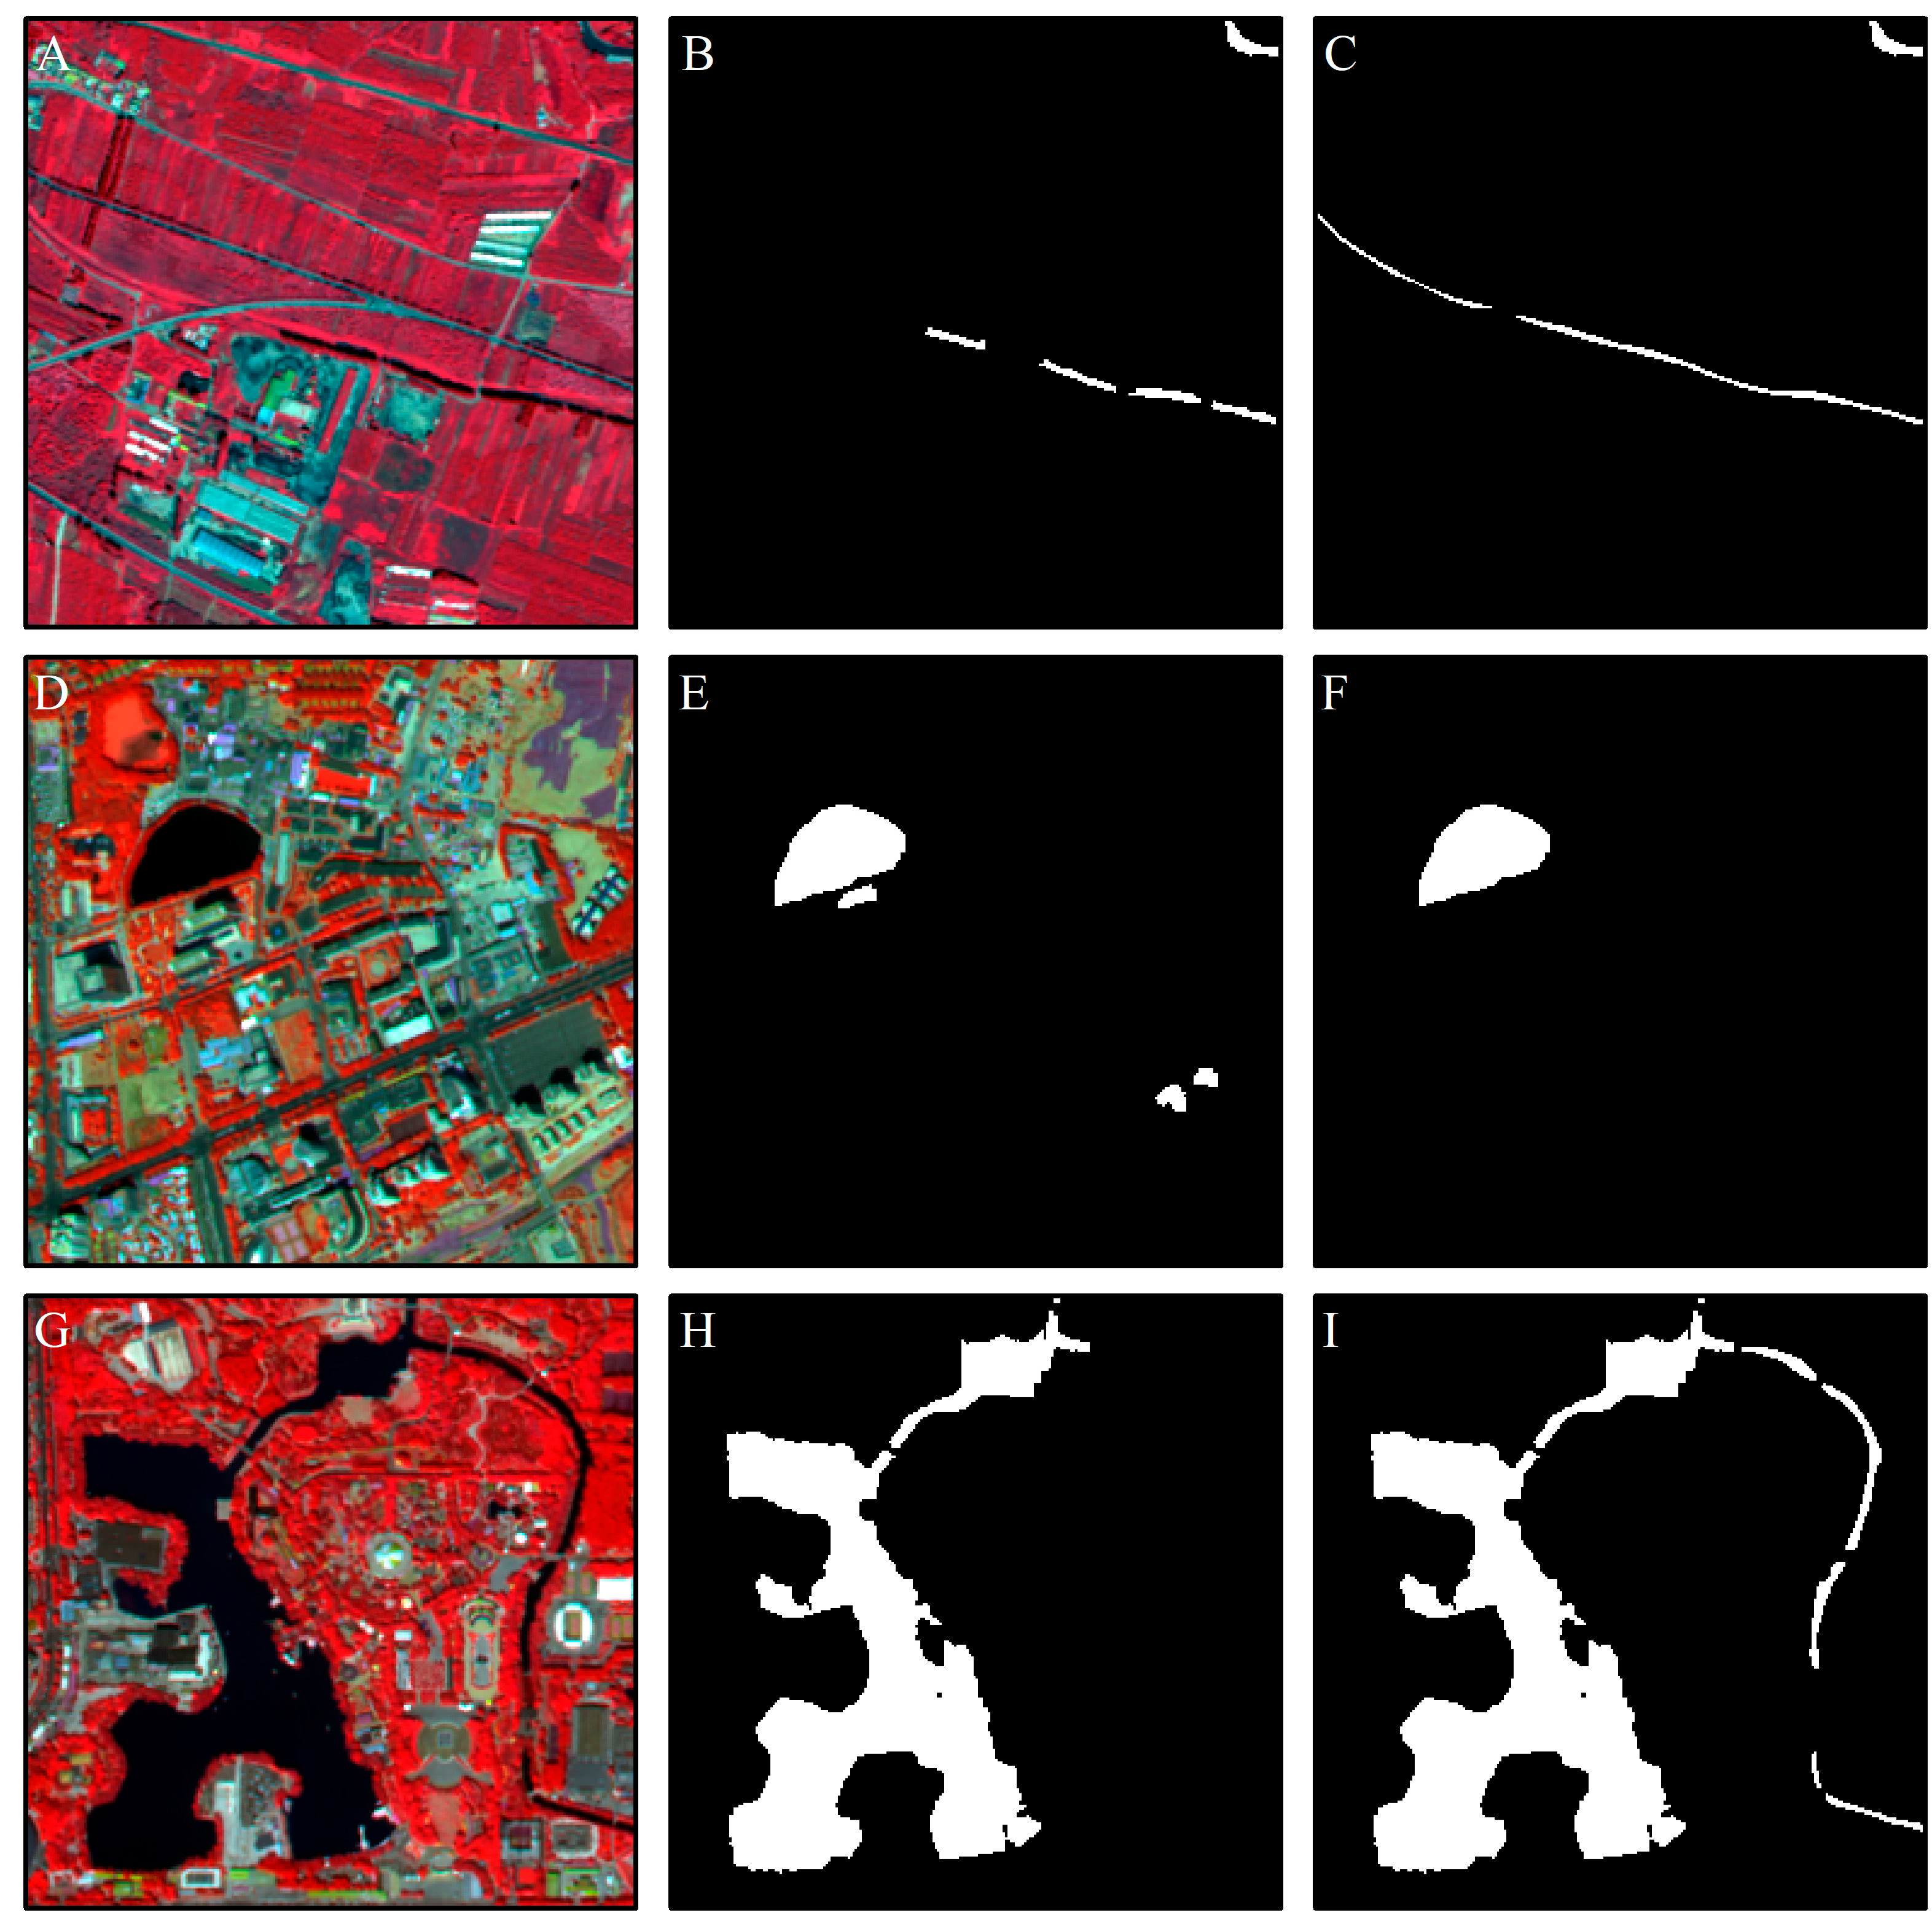
3.1. Water Mapping and Accuracy

Figure 5 shows the surface water distribution of Beijing in 2018/2019, which was abundant and widely distributed. The total water body area was 489.53 km2 (including the seasonally dried-up water bodies), and was in general distributed unevenly (Figure 6). Due to the Miyun Reservoir, which had the largest water body area of 141.42 km2 in 2018/2019, the Miyun District had the largest extent of surface water (177.44 km2, 36.57%), followed by Fangshan District (55.76 km2, 11.49%), Yanqing District (37.86 km2, 7.80%), Huairou District (36.54 km2, 7.53%) and Daxing District (32.32 km2, 6.66%).
Given the large number of images and the challenge of collecting test samples, four typical testing images were selected to assess the accuracy and display the corresponding water body information extraction results in detail. The four images were selected along a north–south direction: one in the mountain (Figure 7A), one in the transition zone between mountain and plain (Figure 7B), and two in the plain (Figure 7C,D). The shadow in Figure 7A–D images included mainly hill shadows, building shadows, buildings and hill shadows, and building and tree shadows, respectively.
The surface water body results after the post-classification improvement of the four typical testing images are presented in Figure 8, and the accuracies before and after the post-classification improvement of the four typical testing images are presented in Table 2. The results of Figure 8 show that water body information extracted based on VHR images describes the shape, area, and spatial distribution of surface water bodies accurately, especially the ponds in Figure 8B–D, which were distributed widely. Statistical analysis (Table 2) shows that the four images had a mean KC equal to 0.84, a mean OA of 99.2%, and a mean PA and UA of water of 83.1% and 86.6% before post-classification improvement, and corresponding values of 0.96, 99.8%, 94.8%, and 98.5% after post-classification improvement. This indicates that post-classification improved the water extraction accuracy significantly, especially for the image of Figure 8C, whose results before the post-classification had many building shadows and consequently a lower KC. The accuracy before and after post-classification improvement illustrated that the water body information extraction and mapping pipeline presented in this paper successfully achieved high accuracy in all testing images.

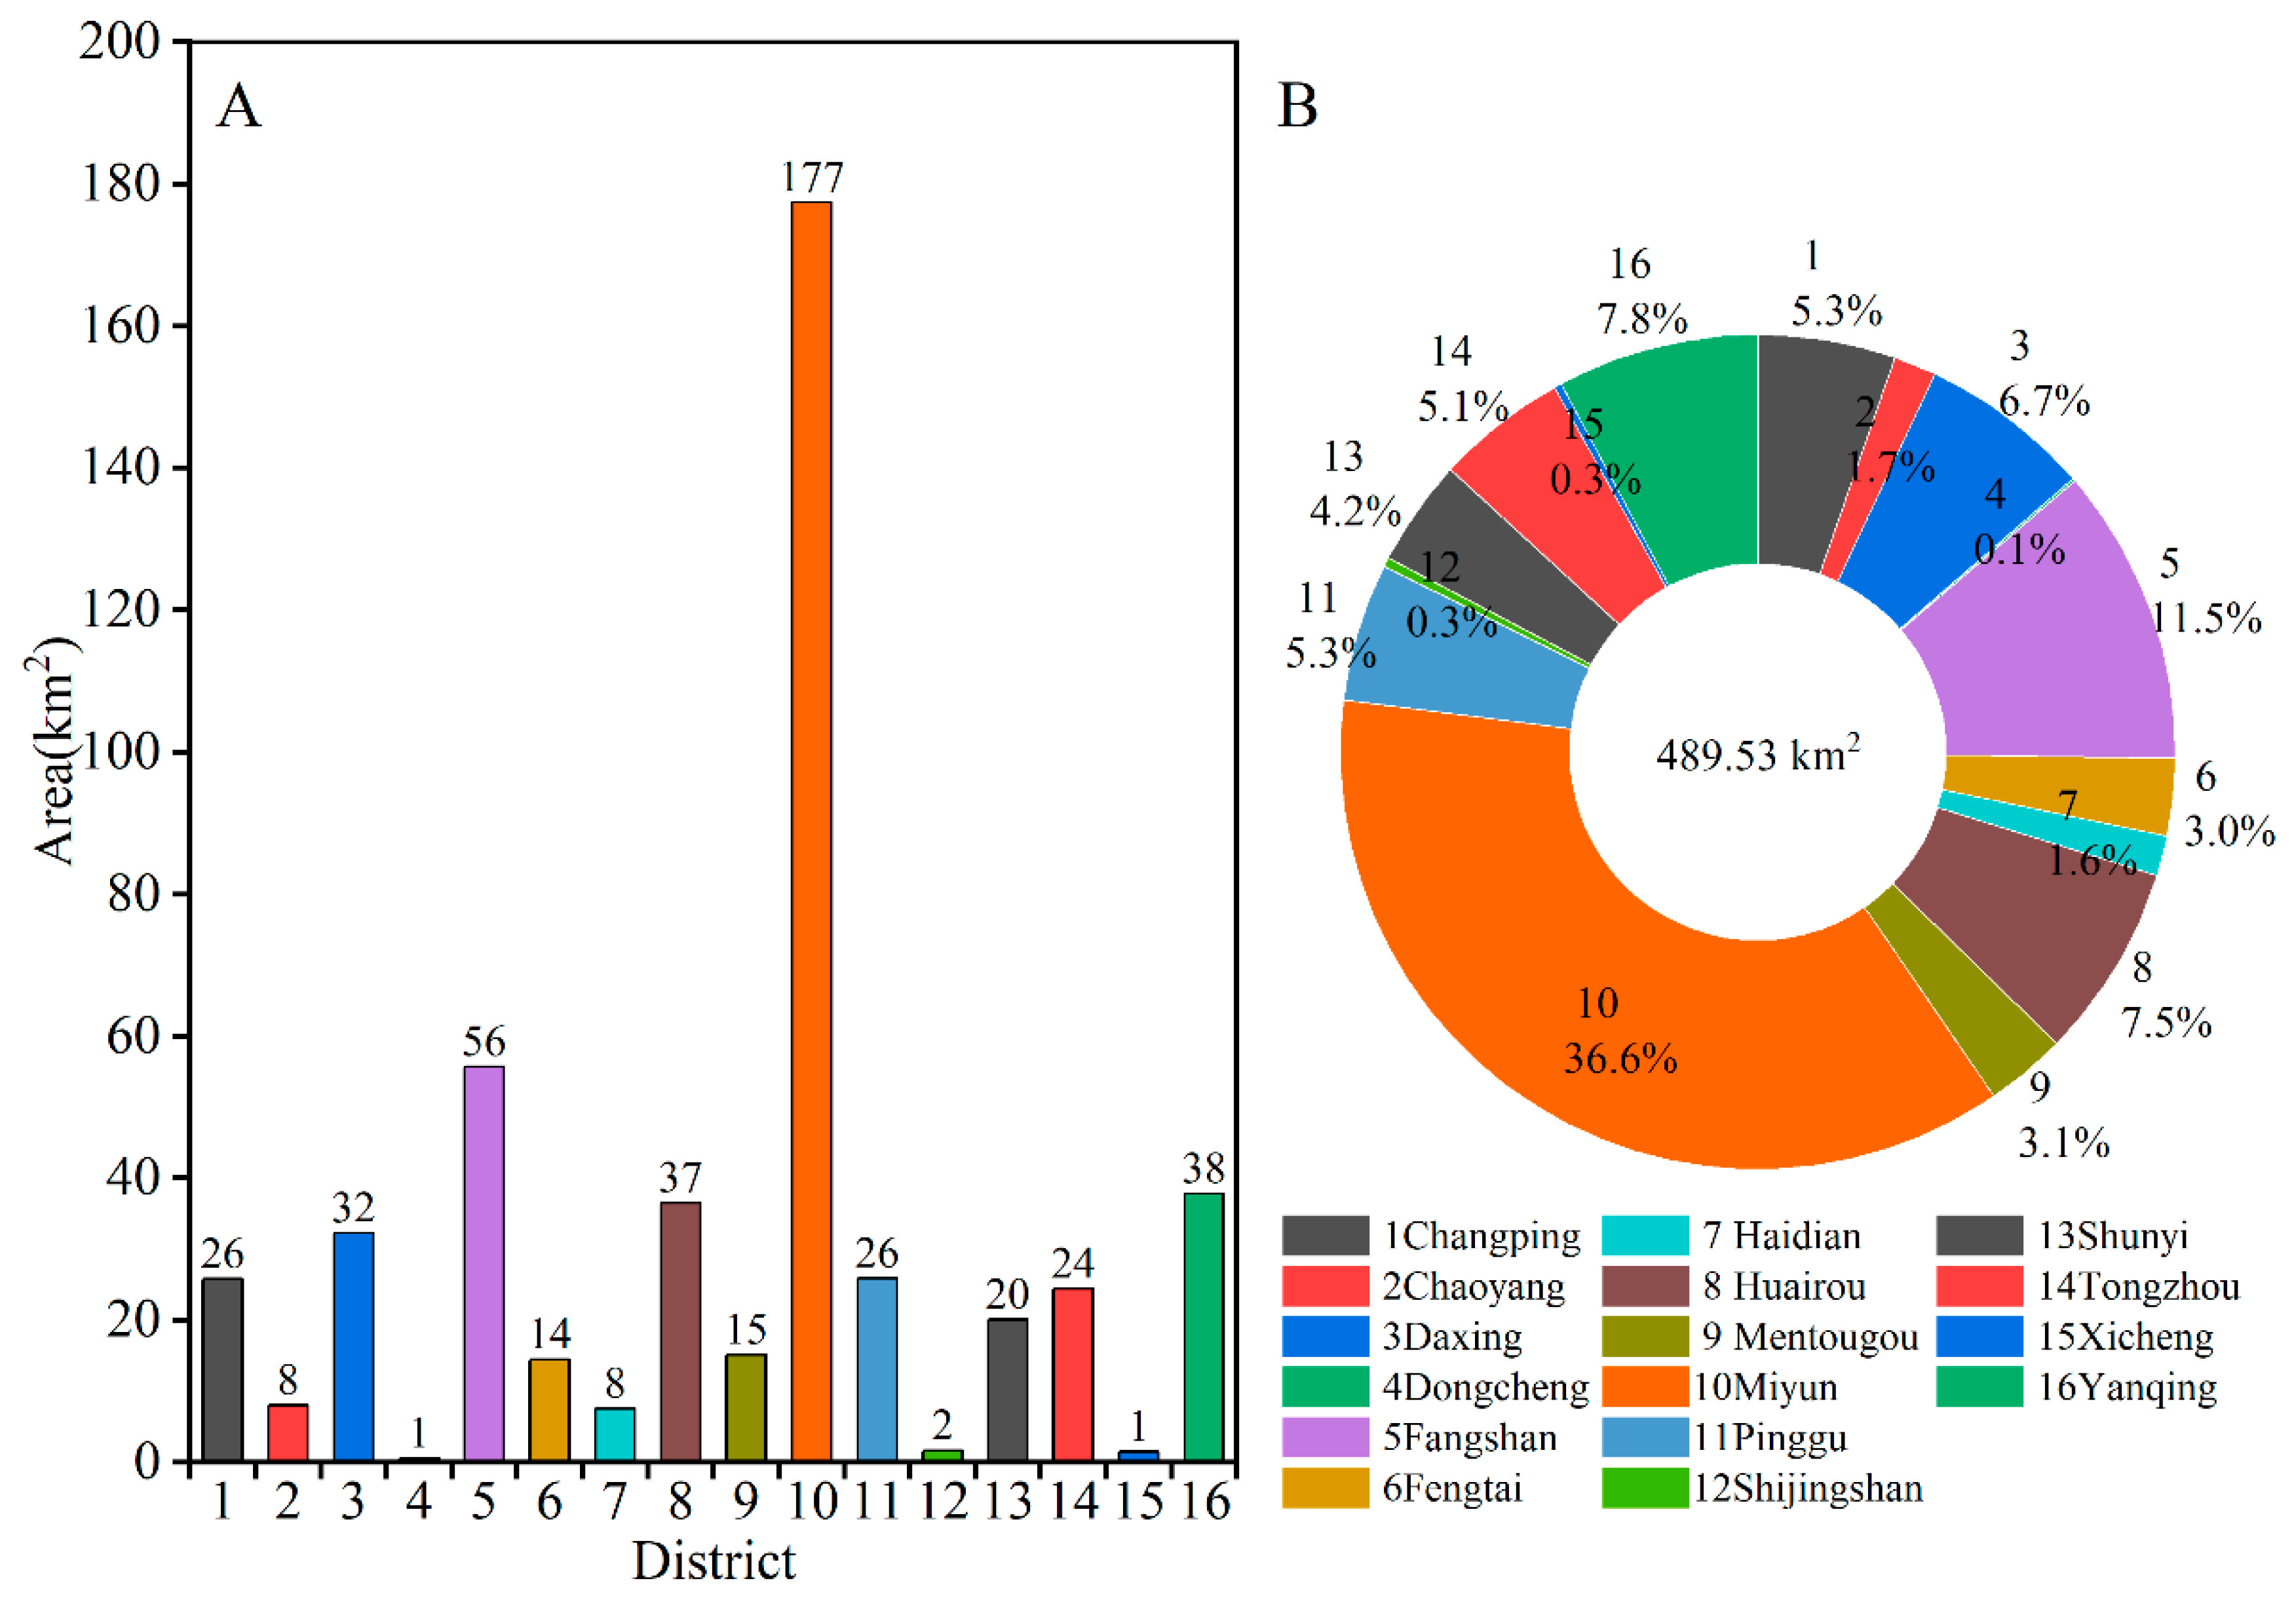
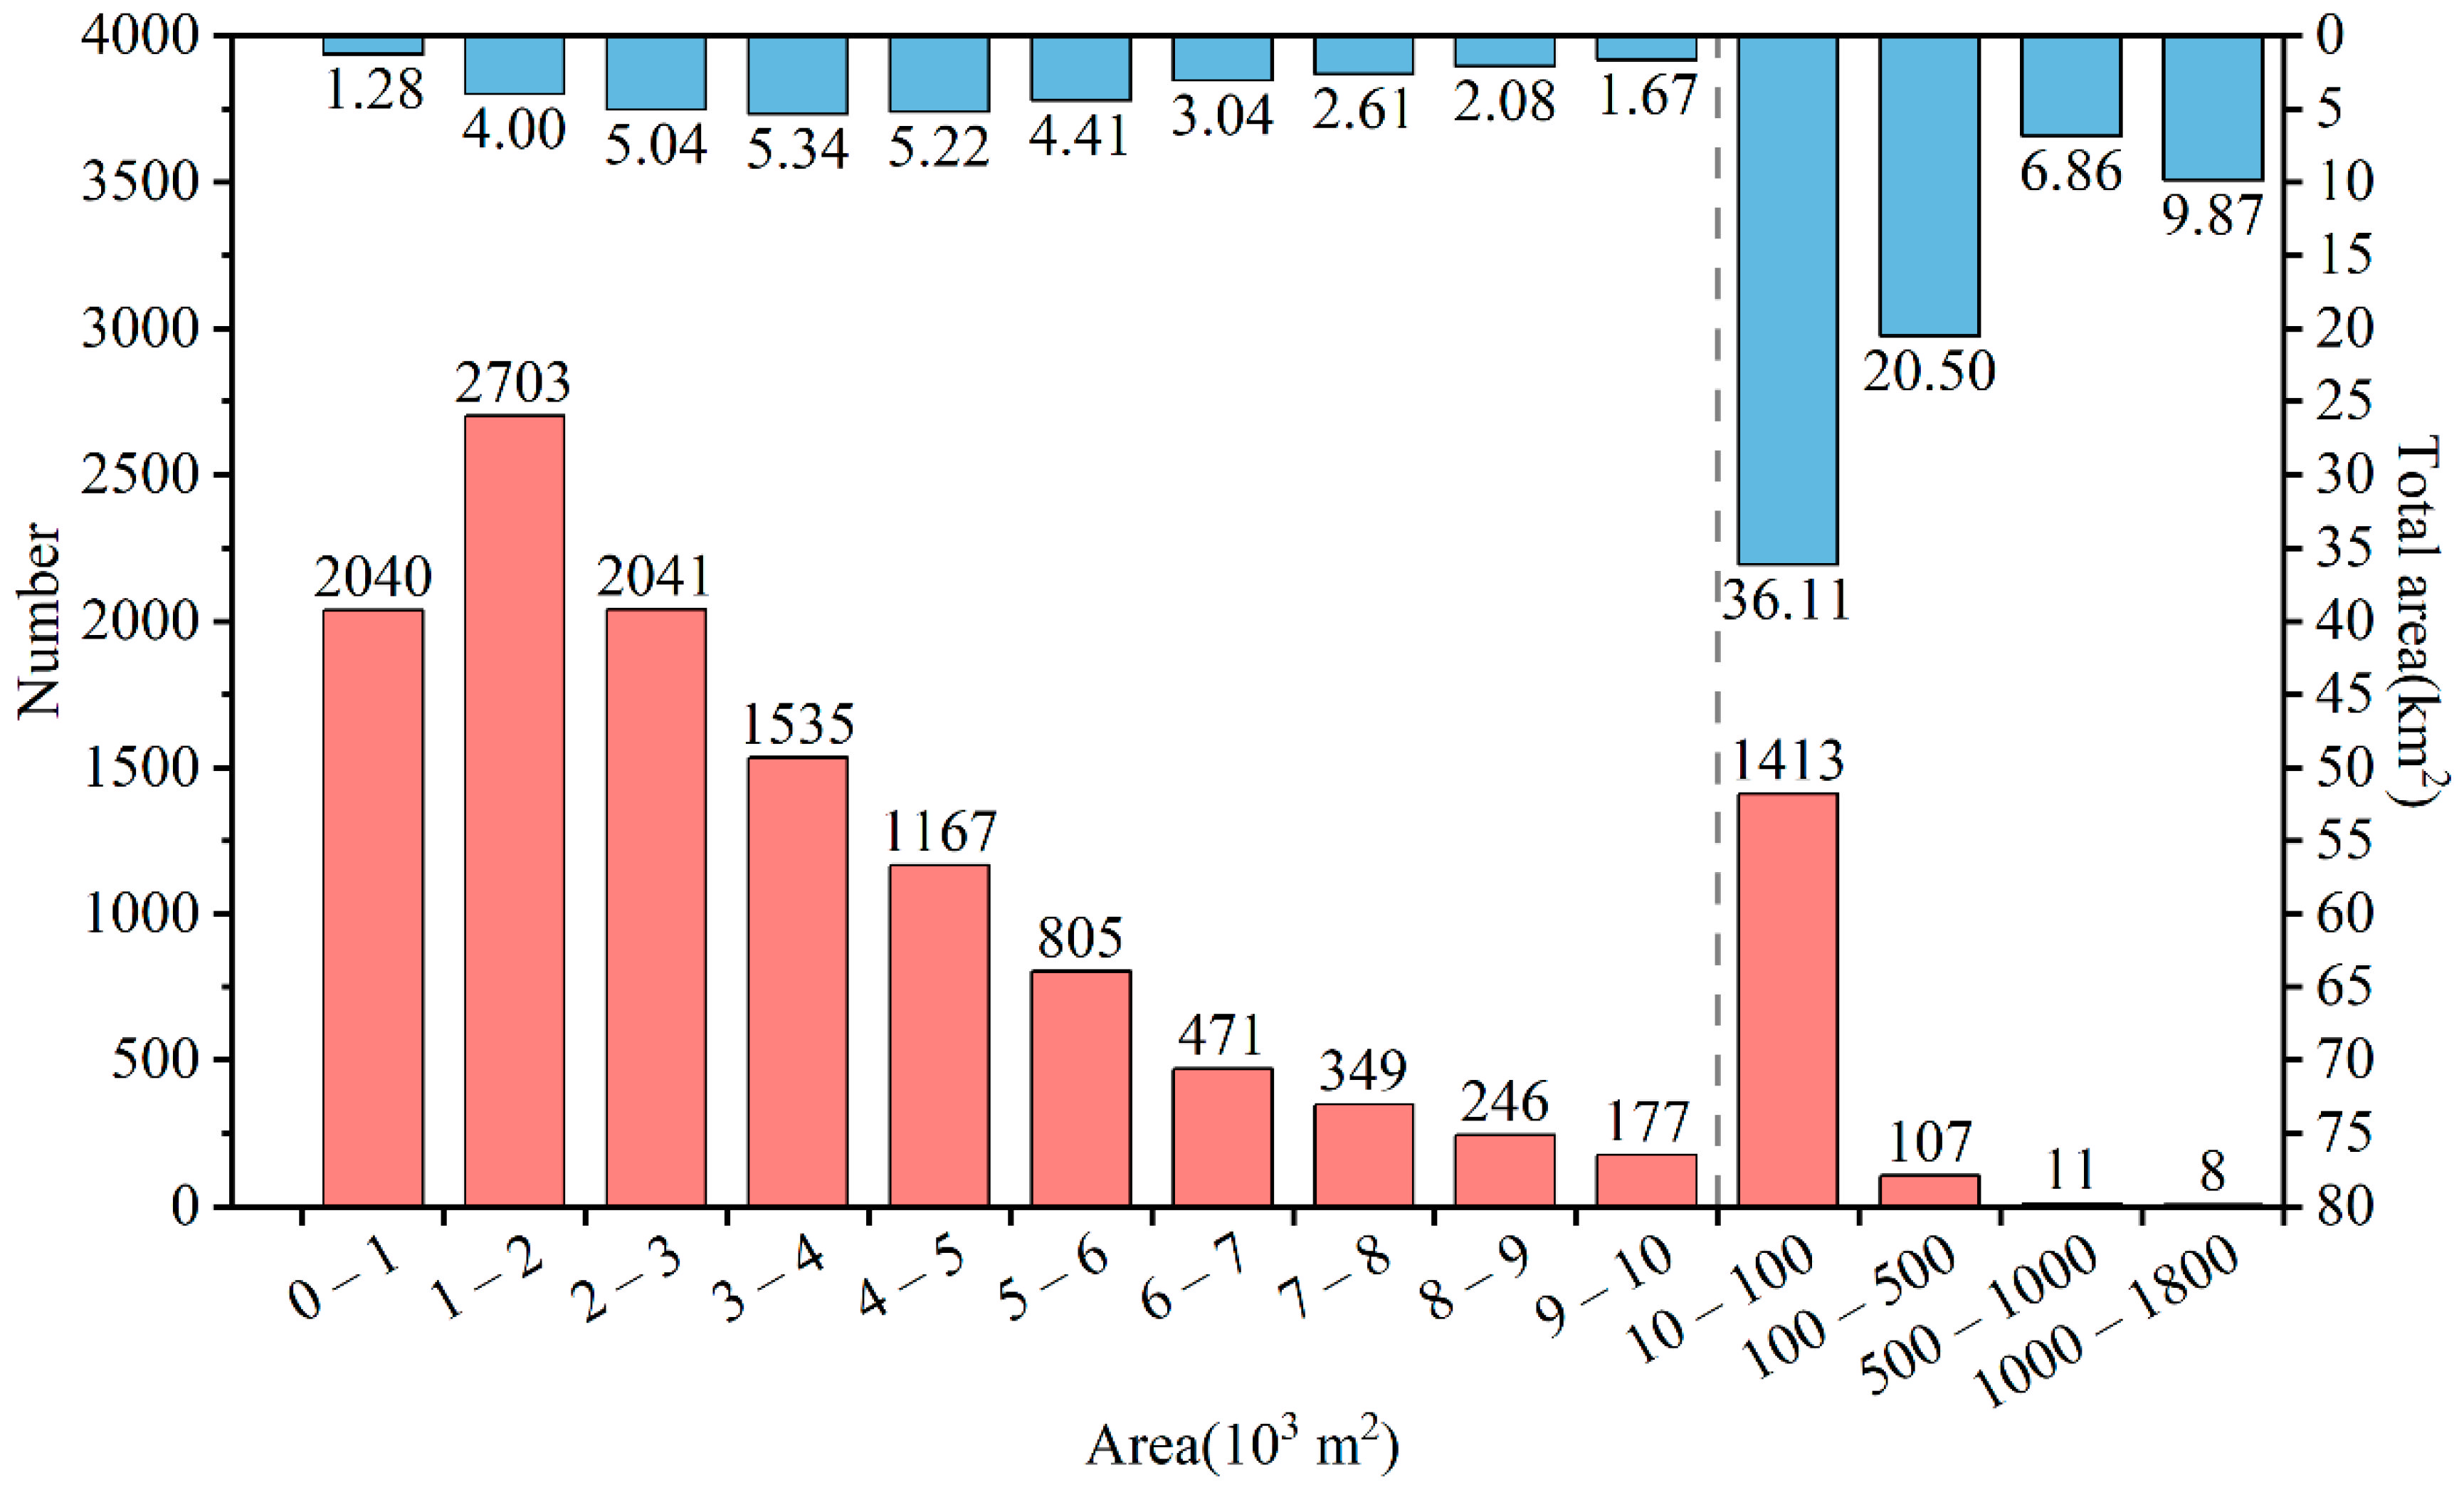
3.2. Pond Body Statistics

Small surface water bodies, like ponds, are widely abundant in nature, and understanding their quantity and distribution is very important for water environment monitoring and governance. The surface water bodies in Beijing named lakes are mostly wetland landscapes for environment and tourism purposes and have a small area. In this paper, they are considered as ponds. After consulting the relevant information of the Beijing reservoirs, 2 km2 was used as the threshold for reservoir classification, that is, water bodies (reservoirs and ponds) larger than 2 km2 were considered reservoirs, while those with an area smaller than 2 km2 were considered ponds.
According to statistics of the results, in 2018/2019, there were 13,073 ponds with a total area of 108.01 km2 in Beijing (Figure 9). We classified ponds with an area less than 10,000 m2 in bins of width 1000 m2. The ponds with areas of 1000–2000 m2 were the most abundant, with 2703 bodies covering a total area of 4.00 km2. They were followed by 2041 ponds with areas of 2000–3000 m2 spanning 5.04 km2. There were also 2040 ponds smaller than 1000 m2 and spanning a total of 1.28 km2. Beijing had 1413 ponds with areas in the range of 10,000–100,000 m2, covering 36.11 km2, and 107 ponds in the range of 100,000–500,000 m2 with a total area of 20.50 km2.

4. Discussion

4.1. Contributions of This Study

In this study, in order to satisfy the need for extracting large-scale water body information based on VHR images at a large scale, a convenient and accurate pipeline is explored and proposed. Rapid and accurate acquisition of large-scale surface water information based on VHR images is an important requirement for efficient environmental monitoring and constitutes one of the major foci of remote sensing application research. This study’s processing pipeline was constructed by combining WI, object detection, and batch processing, thus resulting in significant large-scale application efficiency in extracting land surface information from VHR images. The WI and object detection ensure the method’s convenience and the integrity of water objects, respectively. The batch processing through writing code automates the water body detection process. The average KC and OA before the post-classification of the four test images are 0.84 and 99.2% in this study. The KC and OA of the water body dataset in China extracted by Li et al. [11] based on Sentinel-1 data are 0.86 and 0.93. A surface water map of China produced by Jiang et al. [14] with Landsat 8 data has a KC and an OA of 0.78 and 0.90. Considering that the pipeline emphasizes the great potential of incorporating VHR satellite data in water detection at a large scale, and the fine surface information of VHR images has a greater impact on the error of water detection, the accuracy of this study is comparable or better compared to these studies.
Second, the method’s pipeline provides support and reference for large-scale VHR image applications, such as country-wide studies, for high-precision land surface information extraction, and especially for water body extraction. Most researchers have been interested in national and even global remote sensing applications. An automatic extraction approach is suitable for mapping surface types at large geographical scales [41]. Although most machine learning methods, such as random forest, can achieve better information extraction [42,43], they are supervised information extraction methods. Historically, preparing training datasets has often been a subjective and time-consuming step in many land surface information supervised extraction approaches over large areas. To sidestep the time-consuming task of preparing training datasets, when Huang et al. [41] used random forest to extract surface water, the surface water coverage was determined using training datasets automatically derived from prior classification masks. Particularly deep learning methods, such as when Cheng et al. [27] used U-Net, also have a complex mechanism and require hardware with very high computational performance. Some large-scale application methods also have some shortcomings. The multi-band thresholding method used by McCarthy et al. [30] can only be locally applied. Some WIs contain bands other than the usual near-infrared, red, green, and blue; for example, an automated water extraction index developed by Feyisa et al. [34] includes a short wave infrared band. This situation makes these WIs inapplicable to most VHR images. The remote sensing index used in this article is an unsupervised method and also does not require the preparation of training samples. It has the advantages of simplicity and practicality, and can be implemented automatically with only a threshold value. At the same time, the implementation of object detection was also achieved in an automatic manner.
Third, in this paper, a high-accuracy water map of Beijing is presented from the period 2018/2019. To our knowledge, no publicly available high-precision map of the surface water of this area has been previously presented. Previous studies mapping this area’s surface water [44,45] only considered parts of the area, such as the urban part, as the experimental object to evaluate water extraction methods, and did not extract the water body distribution of the wider area of Beijing. The high-precision water distribution in the entire Beijing area that we have obtained can be used as basic data and maps to provide support for Beijing’s ecosystem assessment, environmental protection, and water body change detection.

4.2. Assessment of the Method’s Pipeline

We evaluated the effectiveness of the method’s pipeline from two aspects, namely the combination of pixel-based WI and image objects and the batch processing capability.

4.2.1. Pixel-Object Combination

The extraction of water body information through the use of the WI in this study suffered from two shortcomings. First, the pixels extracted using the WI contained salt-and-pepper noise. Second, the Otsu threshold is equal to the mean value of the mean levels of the two classes partitioned by this threshold. When the two intra-class variances are substantially different, this threshold becomes biased toward the class with the larger variance. As a result, pixels belonging partially to this class will be misclassified into the other class due to its smaller variance [46]. As shown in Figure 10, the proposed pixel-object combination method helps overcome these two issues. In Figure 10B, marked areas 1 and 2, there are some misclassified water pixels (which were actually shadows). When combining the pixel-level result with the segmented image objects, as shown in Figure 10C, areas 1 and 2, these misclassified pixels are rejected, as their number was relatively small, and they had a lower ratio than the acceptable threshold (<0.1). In addition, the combined pixel-object method ensured the integrity of each water body when using VHR images to identify water bodies such as ponds and rivers Figure 10(D1,D2) in batches at a large scale. Thus, the water information accuracy was increased by excluding misclassified pixels and improving the integrity of the identified water bodies.

4.2.2. Batch Processing

Batch processing facilitated the processing of multiple images and information extraction. All steps were implemented in code, from image preprocessing to combining the pixel-based WI with the object detection results. Once the images have been acquired and organized appropriately, the workflow can be applied to process multiple high-resolution images.

4.3. Post-Classification Improvement

Figure 11 shows three samples after the post-classification improvement, including dried water bodies (Figure 11A–C), misclassified objects (Figure 11D–F), and unclassified and misclassified water bodies (Figure 11G–I).
The dried water basin (which is normally a river) exhibited a seasonal characteristic, that is, the seasonal rain has led to a river flow cut-off (Figure 11A). It is difficult to avoid misclassification in such situations. When analyzing high-resolution images, due to the limited swath width of the high-resolution satellite and the cloudy and rainy weather in the rainy season, it is very difficult to obtain images on the same date to cover the entire study area. Thus, a large number of images covering a longer time span is usually required. This condition causes some images to be acquired during the non-rainy season. At present, few studies focus on the identification of dried water bodies and there is also no corresponding mature application. In this case, the dry water body identification was augmented through visual interpretation, so that the river object maintained its integrity (Figure 11C).
Due to problems such as image resolution, classification features, and classification methods, the information extraction process based on remote sensing images will inevitably lead to misclassifications and omissions. Classifying shadows as water was the main misclassification phenomena; in addition, unclassified and misclassified water bodies also affected accuracy, as shown in Figure 11D,G, respectively. Through visual interpretation, the misclassifications and omissions were revised (Figure 11F,I).

4.4. Limitations and Improvements

One limitation of this study was data access. When using VHR images to classify a large land area, data availability is a key issue, especially for water bodies affected by the rainy season. In some areas, images can be obtained only during the non-rainy seasons. In this case, seasonal water may be in a dry state, which affects the classification results, while the visual interpretation of dry water bodies is more time-consuming. Therefore, a possible improvement in our approach is to research a method for the automatic identification of dried water bodies that can be applied in practical applications.
Another limitation was the river flow cut-off caused by the drying up. Water is unique compared to many other land cover types because it can be highly variable, ebbing and flowing over time, sometimes at regular annual rates and sometimes in long-term trends. The existing continuous extraction methods of linear water bodies are mostly aimed at specific regions and topographical conditions; they have poor applicability under different conditions and require manual interventions during the identification process. Although the interpretation accuracy of these methods is high, their computational cost is high, their efficiency is low, and they are not suitable for emergency applications. A vital issue to be considered next is therefore the continuous and automatic extraction of linear water bodies by combining various water body identification and morphological filtering methods.
In addition, this study only extracted the surface water body in 2018/2019. A future improvement can extract Beijing’s surface water distribution from more recent years to detect the spatial changes of surface water.
In the proposed pipeline for water extraction and mapping, one limitation was the misclassification caused mainly by the TSUWI. When the UWI and USI were used to extract the water bodies, the two thresholds obtained by Otsu could not separate water well, and some other objects were classified as water. We found that the two indices were not really suitable for this purpose by setting multiple thresholds manually. For example, several water body extraction experiments were carried out on the image in Figure 8C, and multiple values were used for the two thresholds, including 0. However, the water body extraction results of these experiments still contained many building shadows. Thus, it is necessary to research other water indices or improve the TSUWI. As surface landscapes over large areas have vast differences, the equations for the formulation of UWI and USI, which were established through the study of relatively few images, are not representative and require more high-resolution images to achieve good modeling of the image information. For example, the coverage of rural land was not considered during the development of the TSUWI. Thus, the applicability of the equations needs to be further explored.
Another limitation was the ratio (R) used when combining the pixel-based WI information with the extracted image objects. The R value was defined artificially and contained a certain degree of subjectivity, so some non-water pixels were not eliminated and were therefore misclassified as water objects. The last limitation is the post-classification improvement. Although it results in an improvement of the water bodies’ information accuracy, this visual interpretation method is time-consuming.

5. Conclusions

In this paper, a method is presented for VHR satellite image analysis with the aim of extracting surface water body information on a large scale. Beijing is taken as the research area, whose water body information from 2018/2019 was extracted using a combination of image object detection, the TSUWI spectral WI, and batch processing.
From the presented work, two main conclusions can be reached. First, the two-level pixel-object method used in this paper achieved relatively good results with regard to its effectiveness in water body information extraction. Based on the pixel-level water information, the identified image objects removed the salt-and-pepper noise and some misclassified water pixels effectively. Object detection also guaranteed the integrity of the extracted water bodies, especially in the case of ponds. Second, the proposed batch processing framework is suitable for large-scale water information extraction based on VHR images, as it allows the automatic extraction of water body information. After implementing the two-level pixel-object method, only the acquisition of the original images is required.
Water is an important environmental and ecological element, and small water bodies also play a key role in the balance of many ecosystems. The VHR remote sensing images can be used to extract fine surface water body information, including small water bodies. Based on the WI and the object detection method, the proposed method can be used to conveniently and accurately extract water on a large scale with VHR images, and is suitable for batch processing. At the same time, our method’s pipeline can also provide a basis for other similar studies. A limitation of the present study is that there will be water classification errors due to the defined TSUWI and R values. Moreover, the post-classification improvement is time-consuming. In the future, additional efforts will be devoted to dealing with these two aspects, thus improving the accuracy and broadening the applicability of the current method’s pipeline.

Author Contributions

Conceptualization, methodology, formal analysis and writing—original draft, Z.J.; methodology, software and resources, Y.Z.; writing—review and editing, supervision, and funding acquisition, Y.P.; writing—review and editing, X.Z. (Xiufang Zhu); investigation and validation, resources, X.Z. (Xuechang Zheng). All authors have read and agreed to the published version of the manuscript.

Funding

This research was funded by a sub-Project of the National Natural Science Foundation of China (Major Program) (No. 42192581) and the National High-Resolution Earth Observation System (The Civil Part) Technology Projects of China (No. 20-Y30F10-9001-20/22).

Institutional Review Board Statement

Not applicable.

Informed Consent Statement

Not applicable.

Data Availability Statement

The data presented in this study are available on request from the corresponding author.

Conflicts of Interest

The authors declare no conflict of interest.

References

  1. Loveland, T.R.; Reed, B.C.; Brown, J.F.; Ohlen, D.O.; Zhu, Z.; Yang, L.; Merchant, J.W. Development of a global land cover characteristics database and IGBP DISCover from 1 km AVHRR data. Int. J. Remote Sens. 2000, 21, 1303–1330. [Google Scholar] [CrossRef]
  2. Liao, A.P.; Chen, L.J.; Chen, J.; Chaoying, H.E.; Cao, X.; Chen, J.; Peng, S. High-resolution remote sensing mapping of global land water. Sci. China Earth Sci. 2014, 57, 2305–2316. [Google Scholar] [CrossRef]
  3. Fritz, S.; Bartholomé, E.; Belward, A.; Hartley, A.; Defourny, P. Harmonisation, Mosaicing and Production of the Global Land Cover 2000 Database (Beta Version); EC-JRC: Ispra, Italy, 2003. [Google Scholar]
  4. Friedl, M.A.; Mciver, D.K.; Hodges, J.C.F.; Zhang, X.Y.; Muchoney, D.; Strahler, A.H.; Woodcock, C.E.; Gopal, S.; Schneider, A.; Cooper, A.; et al. Global land cover mapping from MODIS: Algorithms and early results. Remote Sens. Environ. 2002, 83, 287–302. [Google Scholar] [CrossRef]
  5. Hansen, M.C.; Defries, R.S.; Townshend, J.R.G.; Sohlberg, R.A. Global land cover classification at 1 km spatial resolution using a classification tree approach. Int. J. Remote Sens. 2000, 21, 1331–1364. [Google Scholar] [CrossRef]
  6. Yao, F.; Wang, J.; Wang, C.; Cretaux, J. Constructing long-term high-frequency time series of global lake and reservoir areas using Landsat imagery. Remote Sens. Environ. 2019, 232, 111210. [Google Scholar] [CrossRef]
  7. Pekel, J.-F.; Cottam, A.; Gorelick, N.; Belward, A.S. High-resolution mapping of global surface water and its long-term changes. Nature 2016, 540, 418–422. [Google Scholar] [CrossRef]
  8. Chen, Y.; Niu, Z.; Johnston, C.A.; Hu, S. A Unifying Approach to Classifying Wetlands in the Ontonagon River Basin, Michigan, Using Multi-temporal Landsat-8 OLI Imagery. Can. J. Remote Sens. 2018, 44, 373–389. [Google Scholar] [CrossRef]
  9. Zhou, Y.; Dong, J.; Xiao, X.; Liu, R.; Zou, Z.; Zhao, G.; Ge, Q. Continuous monitoring of lake dynamics on the Mongolian Plateau using all available Landsat imagery and Google Earth Engine. Sci. Total Environ. 2019, 689, 366–380. [Google Scholar] [CrossRef] [PubMed]
  10. Prasad, K.A.; Ottinger, M.; Wei, C.; Leinenkugel, P. Assessment of Coastal Aquaculture for India from Sentinel-1 SAR Time Series. Remote Sens. 2019, 11, 357. [Google Scholar] [CrossRef]
  11. Li, Y.; Niu, Z.; Xu, Z.; Yan, X. Construction of High Spatial-Temporal Water Body Dataset in China Based on Sentinel-1 Archives and GEE. Remote Sens. 2020, 12, 2413. [Google Scholar] [CrossRef]
  12. Wieland, M.; Martinis, S. Large-scale surface water change observed by Sentinel-2 during the 2018 drought in Germany. Int. J. Remote Sens. 2020, 41, 4740–4754. [Google Scholar] [CrossRef]
  13. Jia, M.; Wang, Z.; Mao, D.; Ren, C.; Wang, C.; Wang, Y. Rapid, robust, and automated mapping of tidal flats in China using time series Sentinel-2 images and Google Earth Engine. Remote Sens. Environ. 2021, 255, 112285. [Google Scholar] [CrossRef]
  14. Jiang, W.; He, G.; Pang, Z.; Guo, H.; Long, T.; Ni, Y. Surface water map of China for 2015 (SWMC-2015) derived from Landsat 8 satellite imagery. Remote Sens. Lett. 2020, 11, 265–273. [Google Scholar] [CrossRef]
  15. Wang, X.; Xiao, X.; Zou, Z.; Hou, L.; Qin, Y.; Dong, J.; Doughty, R.B.; Chen, B.; Zhang, X.; Chen, Y.; et al. Mapping coastal wetlands of China using time series Landsat images in 2018 and Google Earth Engine. ISPRS J. Photogramm. Remote Sens. 2020, 163, 312–326. [Google Scholar] [CrossRef] [PubMed]
  16. Wang, Y.; Ma, J.; Xiao, X.; Wang, X.; Dai, S.; Zhao, B. Long-Term Dynamic of Poyang Lake Surface Water: A Mapping Work Based on the Google Earth Engine Cloud Platform. Remote Sens. 2019, 11, 313. [Google Scholar] [CrossRef]
  17. Xia, H.; Zhao, J.; Qin, Y.; Yang, J.; Cui, Y.; Song, H.; Ma, L.; Jin, N.; Meng, Q. Changes in Water Surface Area during 1989–2017 in the Huai River Basin using Landsat Data and Google Earth Engine. Remote Sens. 2019, 11, 1824. [Google Scholar] [CrossRef]
  18. Khandelwal, A.; Karpatne, A.; Marlier, M.E.; Kim, J.; Lettenmaier, D.P.; Kumar, V. An approach for global monitoring of surface water extent variations in reservoirs using MODIS data. Remote Sens. Environ. 2017, 202, 113–128. [Google Scholar] [CrossRef]
  19. Li, D.; Wu, B.; Chen, B.; Qin, C.; Wang, Y.; Zhang, Y.; Xue, Y. Open-Surface River Extraction Based on Sentinel-2 MSI Imagery and DEM Data: Case Study of the Upper Yellow River. Remote Sens. 2020, 12, 2737. [Google Scholar] [CrossRef]
  20. Mahdianpari, M.; Salehi, B.; Mohammadimanesh, F.; Homayouni, S.; Gill, E. The first wetland inventory map of newfoundland at a spatial resolution of 10 m using sentinel-1 and sentinel-2 data on the google earth engine cloud computing platform. Remote Sens. 2019, 11, 43. [Google Scholar] [CrossRef]
  21. Ren, H.; Xu, D.; Shi, X.; Xu, J.; Zhuang, D.; Yang, G. Characterisation of gastric cancer and its relation to environmental factors: A case study in Shenqiu County, China. Int. J. Environ. Health Res. 2016, 26, 1–10. [Google Scholar] [CrossRef]
  22. Oertli, B.; Biggs, J.; Cereghino, R.; Grillas, P.; Joly, P.; Lachavanne, J.B. Conservation and monitoring of pond biodiversity: Introduction. Aquat. Conserv. Mar. Freshw. Ecosyst. 2005, 15, 535–540. [Google Scholar] [CrossRef]
  23. Chen, W.; He, B.; Nover, D.; Lu, H.; Liu, J.; Sun, W.; Chen, W. Farm ponds in southern China: Challenges and solutions for conserving a neglected wetland ecosystem. Sci. Total Environ. 2019, 659, 1322–1334. [Google Scholar] [CrossRef]
  24. Verpoorter, C.; Kutser, T.; Tranvik, L. Automated Mapping of Water Bodies Using Landsat Multispectral Data. Limnol. Oceanogr. Methods 2012, 10, 1037–1050. [Google Scholar] [CrossRef]
  25. Wu, W.; Li, Q.; Zhang, Y.; Du, X.; Wang, H. Two-Step Urban Water Index (TSUWI): A New Technique for High-Resolution Mapping of Urban Surface Water. Remote Sens. 2018, 10, 1704. [Google Scholar] [CrossRef]
  26. Yao, F.; Wang, C.; Dong, D.; Luo, J.; Shen, Z.; Yang, K. High-Resolution Mapping of Urban Surface Water Using ZY-3 Multi-Spectral Imagery. Remote Sens. 2015, 7, 12336–12355. [Google Scholar] [CrossRef]
  27. Cheng, B.; Liang, C.; Liu, X.; Liu, Y.; Ma, X.; Wang, G. Research on a novel extraction method using Deep Learning based on GF-2 images for aquaculture areas. Int. J. Remote Sens. 2020, 41, 3575–3591. [Google Scholar] [CrossRef]
  28. Ludwig, C.; Walli, A.; Schleicher, C.; Weichselbaum, J.; Riffler, M. A highly automated algorithm for wetland detection using multi-temporal optical satellite data. Remote Sens. Environ. 2019, 224, 333–351. [Google Scholar] [CrossRef]
  29. Wang, L.; Li, Y.; Zhang, D.; Liu, Z. Extraction of Aquaculture Pond Region in Coastal Waters of Southeast China Based on Spectral Features and Spatial Convolution. Water 2022, 14, 2089. [Google Scholar] [CrossRef]
  30. McCarthy, M.J.; Radabaugh, K.R.; Moyer, R.P.; Muller-Karger, F.E. Enabling efficient, large-scale high-spatial resolution wetland mapping using satellites. Remote Sens. Environ. 2018, 208, 189–201. [Google Scholar] [CrossRef]
  31. Hong, S.; Wang, H.; Cheng, T. Circulation Characteristic Analysis of Implied Water Flow Based on a Complex Network: A Case Study for Beijing, China. Water 2018, 10, 834. [Google Scholar] [CrossRef] [Green Version]
  32. Jiang, H.; Feng, M.; Zhu, Y.; Lu, N.; Huang, J.; Xiao, T. An automated method for extracting rivers and lakes from Landsat imagery. Remote Sens. 2014, 6, 5067–5089. [Google Scholar] [CrossRef]
  33. Xie, H.; Xin, L.; Xiong, X.; Tong, X.; Zhou, B. New hyperspectral difference water index for the extraction of urban water bodies by the use of airborne hyperspectral images. J. Appl. Remote Sens. 2014, 8, 085098. [Google Scholar] [CrossRef]
  34. Feyisa, G.L.; Meilby, H.; Fensholt, R.; Proud, S.R. Automated Water Extraction Index: A new technique for surface water mapping using Landsat imagery. Remote Sens. Environ. 2014, 140, 23–35. [Google Scholar] [CrossRef]
  35. Dai, C.; Howat, I.M.; Larour, E.; Husby, E. Coastline extraction from repeat high resolution satellite imagery. Remote Sens. Environ. 2019, 229, 260–270. [Google Scholar] [CrossRef]
  36. Jiang, M.; Tian, S.; Zheng, Z.; Zhan, Q.; He, Y. Human activity influences on vegetation cover changes in Beijing, China, from 2000 to 2015. Remote Sens. 2017, 9, 271. [Google Scholar] [CrossRef]
  37. Virdis, S.G.P. An object-based image analysis approach for aquaculture ponds precise mapping and monitoring: A case study of Tam Giang-Cau Hai Lagoon, Vietnam. Environ. Monit. Assess. 2014, 186, 117–133. [Google Scholar] [CrossRef] [PubMed]
  38. Zhang, T.; Yang, X.; Hu, S.; Su, F. Extraction of Coastline in Aquaculture Coast from Multispectral Remote Sensing Images: Object-Based Region Growing Integrating Edge Detection. Remote Sens. 2013, 5, 4470–4487. [Google Scholar] [CrossRef]
  39. Wang, H.-F.; Zhai, L.; Huang, H.; Guan, L.-M.; Mu, K.-N.; Wang, G.-P. Measurement for cracks at the bottom of bridges based on tethered creeping unmanned aerial vehicle. Autom. Constr. 2020, 119, 103330. [Google Scholar] [CrossRef]
  40. Otsu, N. Threshold selection method from gray-level histograms. IEEE Trans. Syst. Man Cybern. 1979, 9, 62–66. [Google Scholar] [CrossRef]
  41. Huang, W.; DeVries, B.; Huang, C.; Lang, M.W.; Jones, J.W.; Creed, I.F.; Carroll, M.L. Automated Extraction of Surface Water Extent from Sentinel-1 Data. Remote Sens. 2018, 10, 797. [Google Scholar] [CrossRef] [Green Version]
  42. Huang, X.; Xie, C.; Fang, X.; Zhang, L. Combining pixel-and object-based machine learning for identification of water-body types from urban high-resolution remote-sensing imagery. IEEE J. Sel. Top. Appl. Earth Obs. Remote Sens. 2015, 8, 2097–2110. [Google Scholar] [CrossRef]
  43. Chen, Y.; Fan, R.; Yang, X.; Wang, J.; Aamir, L. Extraction of Urban Water Bodies from High-Resolution Remote-Sensing Imagery Using Deep Learning. Water 2018, 10, 585. [Google Scholar] [CrossRef]
  44. Yang, X.; Shanshan, Z.; Xuebin, Q.; Na, Z.; Ligang, L. Mapping of Urban Surface Water Bodies from Sentinel-2 MSI Imagery at 10 m Resolution via NDWI-Based Image Sharpening. Remote Sens. 2017, 9, 596. [Google Scholar] [CrossRef]
  45. Xie, H.; Luo, X.; Xu, X.; Pan, H.; Tong, X. Automated Subpixel Surface Water Mapping from Heterogeneous Urban Environments Using Landsat 8 OLI Imagery. Remote Sens. 2016, 8, 584. [Google Scholar] [CrossRef]
  46. Xu, X.; Xu, S.; Jin, L.; Song, E. Characteristic analysis of Otsu threshold and its applications. Pattern Recognit. Lett. 2011, 32, 956–961. [Google Scholar] [CrossRef]
Figure 1. Location of Beijing (A) and the coverage of GF-2 images (B).
Water 14 02889 g001
Figure 2. Workflow diagram of the proposed water body extraction method with VHR optical satellite images on a large scale.
Water 14 02889 g002
Figure 3. UWI image (A) and histogram of its pixels’ frequency distribution (B). In (A), bright colors are water bodies and shadows, while dark color is the background.
Water 14 02889 g003
Figure 4. Schematic diagram for the calculation process of the water pixel proportion. (A) A pond sample; (B) number of pixels of the pond sample object in sub-figure A after segmentation; (C) nu-mber of water pixels of the pond sample in sub-figure (A), and WI defines the water pixels; (D) pix-el ratio for the pond sample calculated by dividing the number of pixels obtained in (A) by the number of pixels obtained in (B).
Water 14 02889 g004
Figure 5. Surface water distribution of Beijing in 2018/2019.
Water 14 02889 g005
Figure 6. Area distributions of surface water in each district of Beijing in 2018/2019. (A) Area of the water in each district; (B) percentage of the water area in each district to the total water area.
Water 14 02889 g006
Figure 7. Four typical testing images (R: Band 3; G: Band 2; B: Band 1) (AD) from north to south were used to assess accuracy in this study. The four images included mountain, plain, urban, and rural areas.
Water 14 02889 g007
Figure 8. Surface water bodies (black) and extraction results (yellow) for the four testing images (AD) (false color composite, R: Band 4; G: Band 3; B: Band 2).
Water 14 02889 g008
Figure 9. Number (red) and total area (blue) of ponds after post-classification improvement under different area levels of Beijing in 2018/2019.
Water 14 02889 g009
Figure 10. Comparison of the surface water extraction results before and after applying the object detection module. Column 1: (A,D), two false color sample images; Column 2: Pixel-level water extraction results in (B,E); Column 3: Water extraction results with the two-level pixel-object method (C,F). 1 and 2 are surface water sample objects.
Water 14 02889 g010
Figure 11. Column 1: False color images; Column 2: Detected water bodies before post-classification improvement; Column 3: Detected water bodies after post-classification improvement. Illustrations are dried out (AC), misclassified (DF), and unclassified and misclassified (GI) water bodies.
Water 14 02889 g011
Table 1. Acquisition time, water body types, and primary shadow noise sources of the GF-2.
IDTimeWater TypesMajor ShadowIDTimeWater TypesMajor ShadowIDTimeWater TypesMajor Shadow
125 April 2018--2131 August 2018River
Pond
Building4110 September 2018River
Pond
Ditch
Building
Street Tree
225 April 2018ReservoirHill2229 October 2018River
Pond
Building4210 September 2018River
Pond
Street Tree
316 April 2018RiverHill2329 October 2018River
Pond
Building
Street Tree
4310 September 2018River
Pond
Building
Street Tree
416 April 2018RiverHill2429 October 2018RiverBuilding
Street Tree
4418 November 2019RiverHill
516 April 2018RiverHill2529 October 2018River
Pond
Building4518 November 2019Reservoir
River
Hill
61 March 2018ReservoirHill2622 March 2018RiverHill4618 November 2019--
71 March 2018RiverHill275 September 2018RiverHill4718 November 2019River
Pond
Building
Hill
81 March 2018RiverHill285 September 2018River
Pond
Hill4810 September 2018River
Pond
Building
Street Tree
925 April 2018RiverHill295 September 2018Reservoir
River
Pond
Building495 September 2018River
Pond
Ditch
Building
Tree
1029 October 2018RiverHill3022 March 2018River
Pond
Building505 September 2018River
Pond
Ditch
Building
Tree
1129 October 2018RiverHill3122 March 2018River
Pond
Building515 September 2018River
Pond
Ditch
Building
Tree
1218 June 2019River
Pond
-3222 March 2018River
Pond
Ditch
Building5210 September 2018River
Pond
Ditch
Building
Tree
1318 June 2019RiverHill3322 March 2018River
Pond
Ditch
Building539 October 2018River
Pond
Ditch
Building
Tree
1418 June 2019RiverHill345 September 2018RiverHill5429 May 2019Reservoir
River
Hill
1518 June 2019--355 September 2018Reservoir
River
Hill5529 May 2019Reservoir
River
Hill
1618 June 2019RiverHill365 September 2018Reservoir
River
Pond
Hill
Building
1718 June 2019River
Pond
Building375 September 2018River
Pond
Hill
Tree
1818 June 2019River
Pond
Building3810 September 2018River
Pond
Building
1918 June 2019River
Pond
Building399 May 2019River
Pond
Building
2016 August 2019River
Pond
Building409 May 2019River
Pond
Building
Tree
Table 2. Summary of classification accuracies of the method for the four testing images.
ProcessingTesting ImagesReference Points (Water)Accuracy
Ground TruthExtraction ResultsKCOA (%)PA (%)UA (%)
Before
post-classification
Image A2462380.97699.196.799.6
Image B43380.91299.388.495.0
Image C17120.70199.070.670.6
Image D17130.78499.376.581.3
After
post-classification
Image A2462440.99599.899.2100.0
Image B43420.98899.997.7100.0
Image C17150.93699.888.2100.0
Image D17160.94099.894.194.1
Publisher’s Note: MDPI stays neutral with regard to jurisdictional claims in published maps and institutional affiliations.

