
Preparation of Cu-Ce@γ-Al2O3 and Study on Catalytic Ozone Oxidation for the Treatment of RO Concentrate Water

College of Urban Construction, Nanjing Tech University, Nanjing 211816, China
*
Author to whom correspondence should be addressed.
Water 2022, 14(18), 2881; https://doi.org/10.3390/w14182881
Submission received: 21 July 2022
/
Revised: 2 September 2022
/
Accepted: 10 September 2022
/
Published: 15 September 2022
(This article belongs to the Section Wastewater Treatment and Reuse)
Abstract
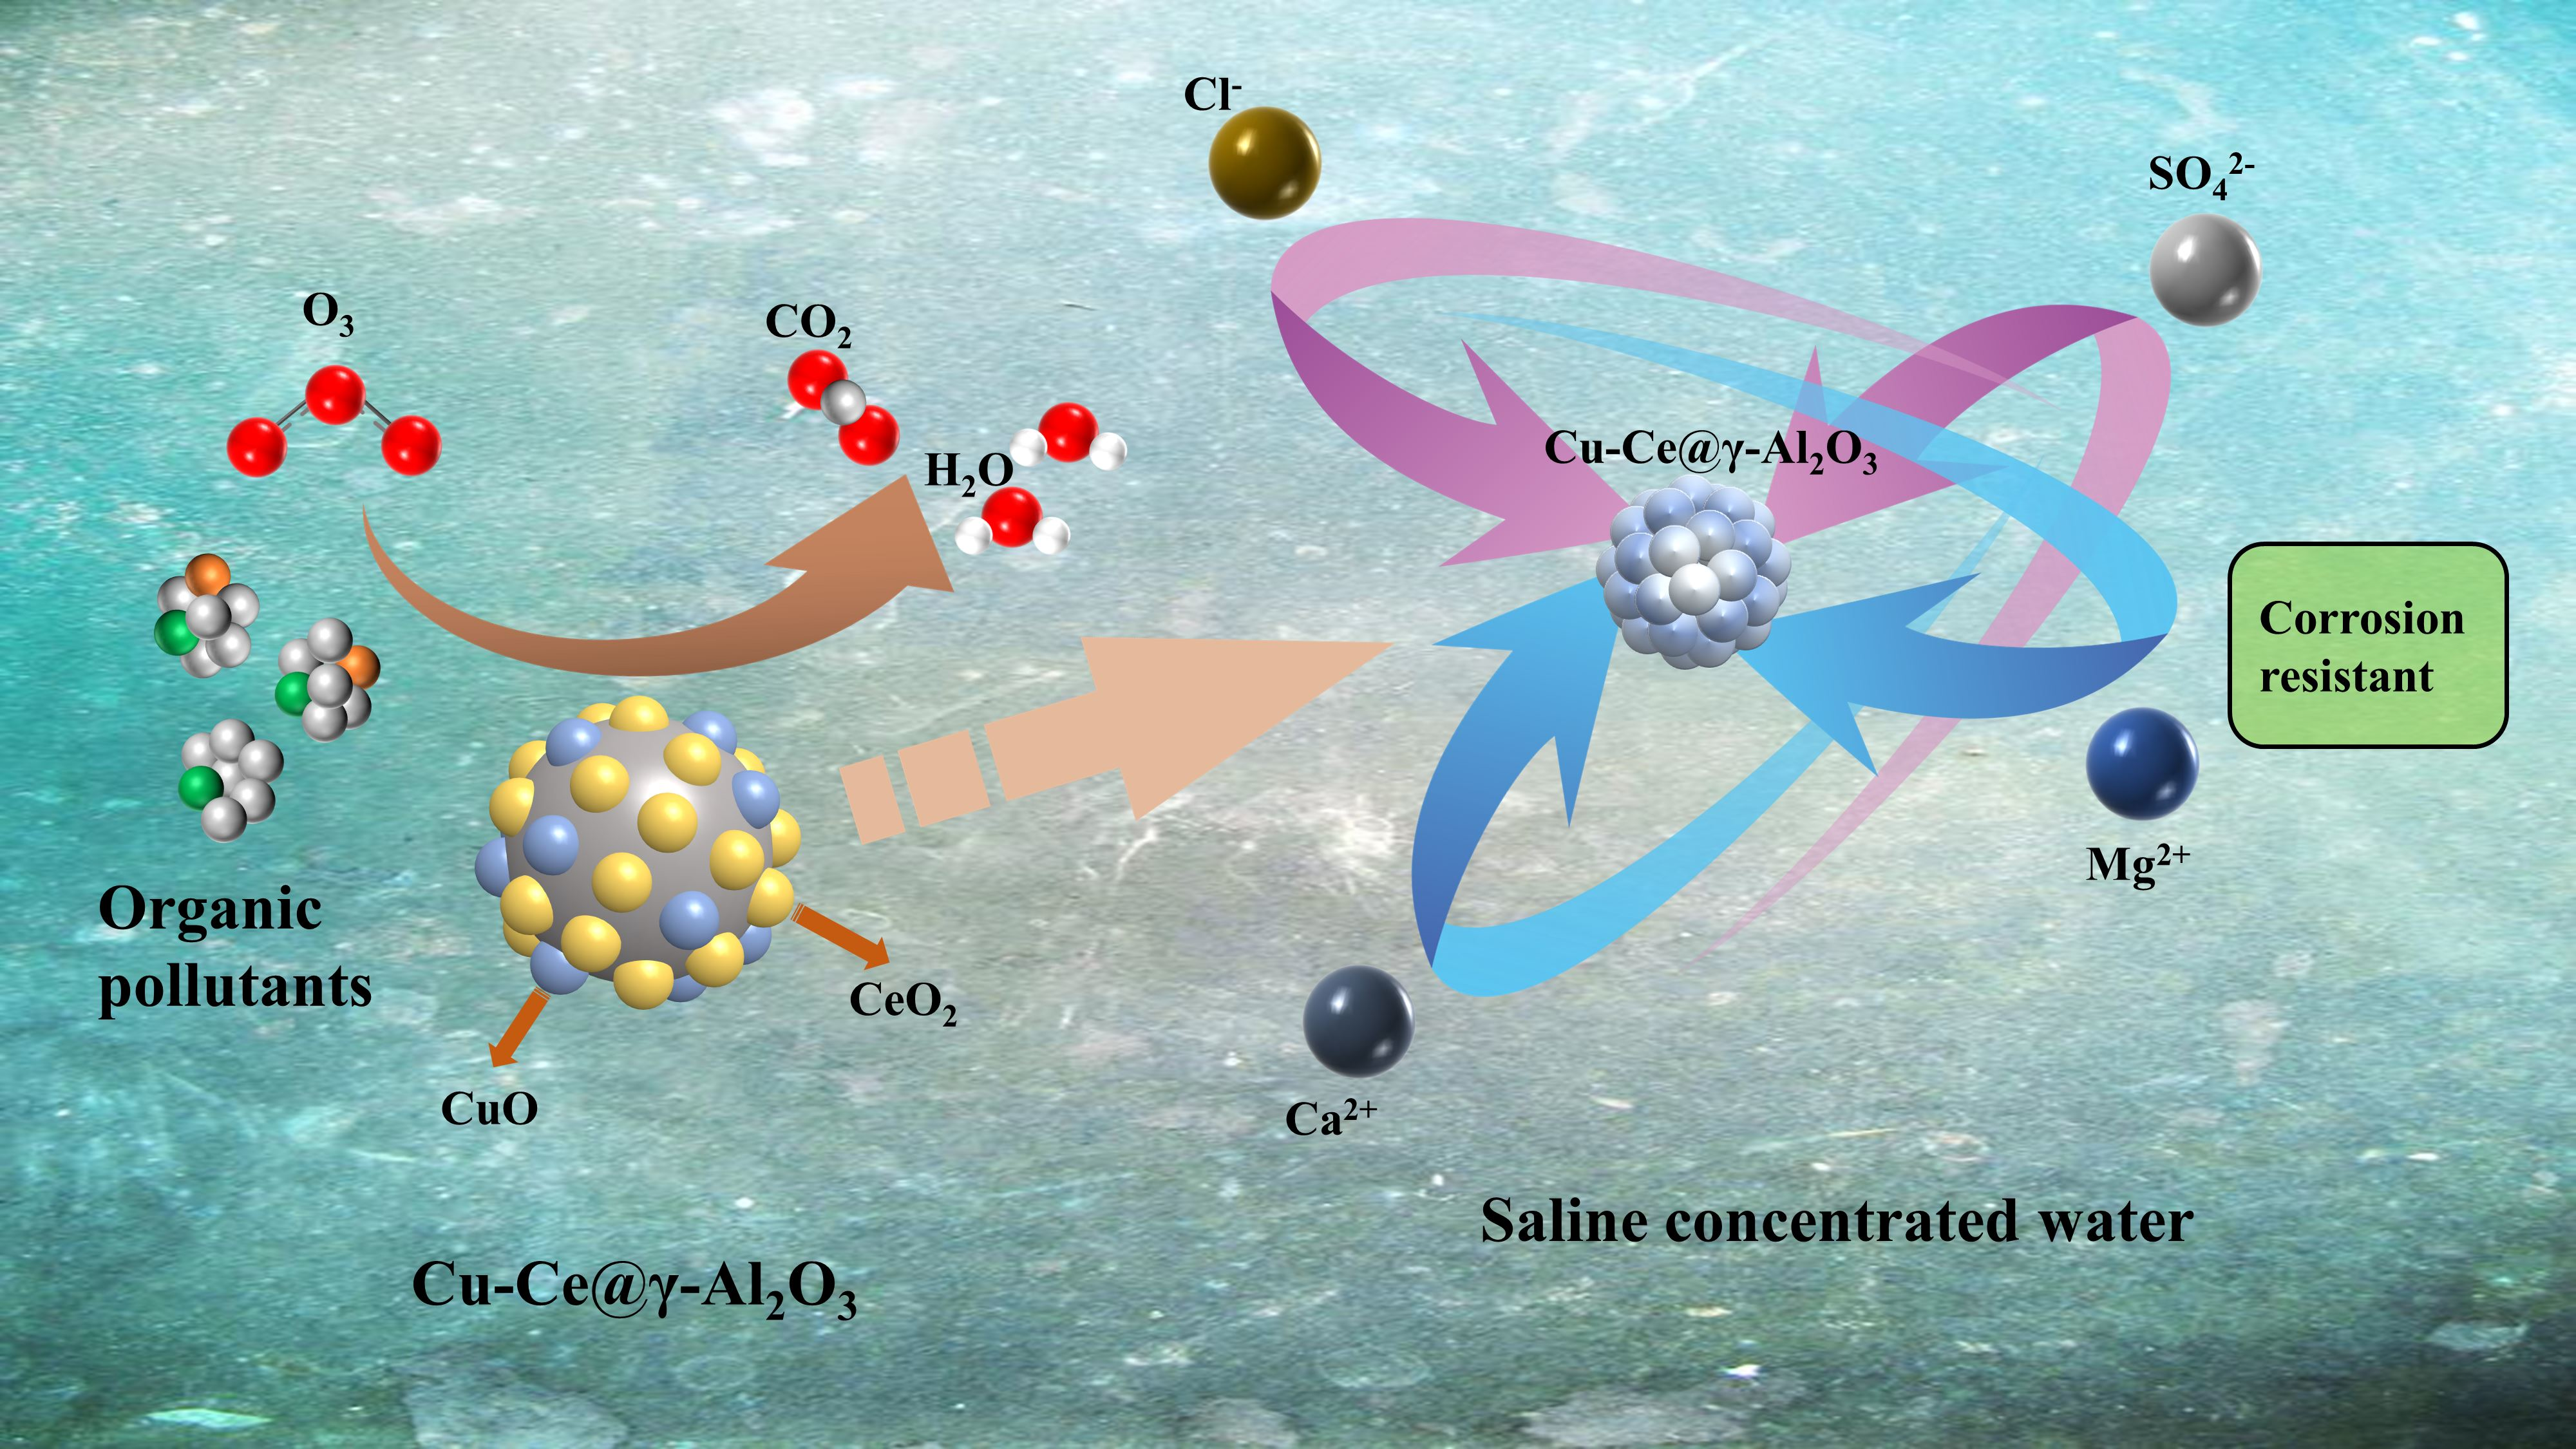
:In this paper, a high-efficiency and stable Cu-Ce@γ-Al2O3 catalyst was prepared by taking the reverse osmosis (RO) concentrated water of a sewage treatment plant as the treatment object and activated alumina as the carrier. The preparation factors that affected the catalytic activity of Cu-Ce@γ-Al2O3 were investigated. SEM, EDS, XRD, BET, XRF, and XPS techniques were applied to characterize the catalyst. Optimal working conditions, and degradation mechanism of RO concentrated water were researched. In comparison with the ozone oxidation alone, the Cu-Ce@γ-Al2O3 catalytic ozonation has more reactive groups, significantly improving the treatment effect. Characterization results show that Cu and Ce are successfully supported on the surface of the activated alumina support and mainly exist in the form of oxides (e.g., CuO and CeO2). The loading of metal led to a larger specific surface area and pore volume. The repeated use had an insignificant effect on the peaks of Cu2p and Ce3d energy spectra and caused a small loss of active components. Under these conditions, the removal rate of COD from RO concentrated water by Cu-Ce@γ-Al2O3 catalyst was 85.2%. The stability and salt tolerance of Cu-Ce@γ-Al2O3 catalysts were investigated by catalyst wear rate and repeated use times, respectively. The degradation of organic matter and residual tryptophan-like organic compounds were observed through UV absorption spectroscopy and 3D-EEM. Hydroxyl radicals participated in organic pollutants degradation. Finally, a multi-level-fuzzy analysis evaluation model was developed to quantitatively assess the catalytic ozone oxidation system of the Cu-Ce @γ-Al2O3 catalyst for the treatment of RO concentrated water.

1. Introduction
The amount of freshwater is decreasing worldwide due to population growth and accelerating industrialization. Industrial drainage policies are gradually being tightened, and the problem of water shortage is becoming increasingly serious. As more companies have begun to work on improving the reuse rate of water sources, the membrane concentration process has become more and more widely used [1]. Reverse osmosis (RO) has the advantages of simple operation, high degree of automation, and small footprint and has been widely used in seawater desalination, brackish water desalination, reclaimed water reuse, boiler make-up water preparation, and wastewater treatment [2]. The RO concentrate produced as its byproduct accounts for a third of the total water production and contains numerous pollutants, particularly toxic or bioaccumulative organic contaminants. Therefore, the treatment of RO concentrate has become an increasingly important issue [3]. The discharge of RO concentrated water has also caused a huge waste of water resources. It has brought huge challenges to wastewater treatment because it contains high concentrations of refractory dissolved organic matter (DOM), soluble minerals, and other total dissolved solids (TDS). Therefore, the development of new technology for its removal is very important [4].
In recent years, the commonly used RO concentrated water treatment methods at home and abroad have mainly included direct discharge (surface water or ocean), deep well injection, evaporation ponds, and treatment and reuse. The direct discharge method is easy to operate and inexpensive and is currently the most common method of treatment. However, the direct or indirect discharge of RO concentrated water has far exceeded the environmental carrying capacity, and the advanced treatment and reuse of concentrated water have become a general trend. At present, commonly used advanced treatment methods include the adsorption method [5], coagulation sedimentation method [6], advanced oxidation method, and biological method [7]. Among them, advanced oxidation technology (AOPs) has unique advantages in treating refractory industrial wastewater, including fast reaction speed, complete degradation of organic matter, no secondary pollution, a wide application range of water quality, and broad application in the treatment of RO concentrated water [8].
In recent years, AOPs, such as the Fenton method, electrocatalytic oxidation method, ozone oxidation method, wet oxidation method, and supercritical water oxidation method have been used at home and abroad to treat high-concentration refractory industrial wastewater [9]. Among them, ozone oxidation technology, which can degrade most of the refractory organic substances in wastewater, and has the advantages of green and no secondary pollution, is a very effective method for treating pollutants [10]. Compared with single ozone treatment, ozone-catalyzed oxidation generates reactive groups with higher active potentials during the reaction process, which can degrade pollutants in water with higher efficiency and can oxidize almost all organic matter [11]. Compared with homogeneous ozone catalytic oxidation, heterogeneous ozone catalytic oxidation technology avoids the problem of difficult recovery, waste of resources, and secondary pollution, which limits the application of homogeneous ozone catalytic oxidation technology in practical water treatment [12]. Activated alumina has the advantages of good thermal stability, high mechanical strength, wear resistance, large specific surface area, and abundant hydroxyl groups on the surface. Alumina and metal oxides supported on alumina have been widely applied as catalysts for the treatment of industrial wastewater due to their low cost and excellent catalytic effect. Alumina catalytic ozonation exhibited significantly more effective removal of organic pollutants than ozonation treatment [13]. Li et al. found that Mg-Ce ceramic membrane increased the TOC removal rate from less than 50% by ozonation to 85.1% by catalytic ozonation [14]. Cu and Ce are considered to be loaded on the catalyst for catalytic ozonation due to their high redox potential and environmental friendliness [15,16]. In this study, activated alumina was selected as the catalyst carrier, and Cu and Ce metal active components were supported on the carrier by the impregnation-calcination method to prepare a bimetallic Cu-Ce@γ-Al2O3 catalyst and used heterogeneous ozone catalysis. Oxidation technology treats RO concentrated water, which provides a theoretical basis for the actual treatment of RO concentrated water.
Catalytic ozonation is a complex process. In order to determine the optimal operation conditions, a comprehensive assessment of the influences of various factors on the environment, energy consumption, economic benefit, and other aspects is necessary and significant. The multilevel-fuzzy analysis evaluation model can be employed to evaluate the optimal operation conditions.
In this study, activated alumina was applied as the catalyst supporter, and RO concentrated water was taken as the research object. Impacts of pH, ozone dosage, catalyst dosage, and column height to diameter ratio on the treatment were investigated. Cu-Ce@γ-Al2O3 catalyst improves ozone utilization rate significantly. The application of X-ray diffraction (XRD), X-ray fluorescence spectroscopy (XRF), scanning electron microscopy (SEM), specific surface area analysis (BET), X-ray energy spectroscopy (EDS), and X-ray photoelectron spectroscopy (XPS) are means to analyze the physicochemical properties of Cu-Ce@γ-Al2O3 catalysts. The stability of the supported Cu-Ce@γ-Al2O3 catalyst was explored through the repeated use and wear resistance testing of the Cu-Ce@γ-Al2O3 catalyst. The mechanism of action of the Cu-Ce@γ-Al2O3 catalyst was explored by radical quencher, UV absorption spectroscopy, and three-dimensional fluorescence spectroscopy. The comprehensive evaluation model of the Ce-Cu@γ-Al2O3 catalyst was established by the multilevel-fuzzy analysis method, and the optimal operation model was determined by the comprehensive evaluation of the experimental operating conditions of each group.
2. Materials and Methods
2.1. Experimental Materials
Analytically pure Copper nitrate hexahydrate (Cu(NO3)2·6H2O), cerium nitrate hexahydrate (Ce(NO3)3·6H2O), and tert-butanol (TBA, C4H10O) were purchased from Sinopharm Group Chemical Reagent Co., Ltd (Shanghai, China). Analytical grade potassium bromate, potassium bromide, sodium thiosulfate, soluble starch, potassium iodide, potassium dichromate, silver sulfate, mercury sulfate, potassium sodium tartrate, Nessler’s reagent, and hydrochloric acid were purchased from Nanjing Chemical Reagent Co., Ltd (Nanjing, China). Activated alumina is an industrial-grade product and was purchased from Henan Jiechuanghao Clean Water Treatment Materials Co., Ltd (Zhengzhou, China). The RO concentrated water was taken from a water group in Jiangsu Province. The same batch of RO concentrated water was used throughout the study. Table 1 presents water quality.
2.2. Catalyst Preparation Process
First, pure water was used to rinse the activated alumina carrier repeatedly. When the washed solution was no longer turbid, the washed activated alumina carrier was washed into a beaker, and then 0.1 mol/L hydrochloric acid solution was added to soak for 6 h to destroy the alumina film on the surface for the next dipping. After soaking in hydrochloric acid, the washed activated alumina carrier was rinsed repeatedly with pure water until the eluted solution was no longer turbid and the eluate was neutral. The activated alumina particles were taken out and placed in an oven at 110 °C for 4 h to dry the water for later use. The catalyst was prepared by using the equal amount impregnation method. Cu(NO3)2-6H2O and Ce(NO3)3-6H2O were weighed on an electronic balance, and a 0.8 mol/L concentration of the metal element active component precursor solution was prepared, controlling the molar ratio of Ce:Cu from 3:1 to 1:3. The pretreated activated alumina was placed in a conical flask, and the precursor solution was poured in until it was submerged in the activated alumina. The conical flask was shaken in a water bath shaker for 12 h, and the water bath temperature was set at 25 °C. The supporter was dried at 110 °C for 12 h. The catalyst was roasted in a muffle furnace at a controlled roasting temperature of 300–700 °C for 2–6 h. The Cu-Ce@γ-Al2O3 catalyst was produced when the temperature cooled.
2.3. Methods for Catalyst Characterization
The surface morphology of the catalyst was characterized by SEM (ZEISS Merlin, Zeiss AG, Oberkochen, Germany). XRD (D8 Advance, Bruker, Berlin, Germany) was used to characterize the crystal morphology of transition metals in the catalyst. XRF (Axios Pw4400, PANalytical, Eindhoven, The Netherlands) was used to characterize the content of metal elements and metal oxides inside the catalyst. The pore volume, pore size, and adsorption performance of the catalysts were characterized by BET-specific surface area and pore distribution (ASAP-2020, Micromeritics, Norcross, GA, USA). Energy dispersive X-ray spectroscopy (EDS) (Kratos AXIS Ultra DLD, Shimadzu Corporation, Kyoto, Japan) was used to characterize the content of each element in the catalyst. The element species and valence distribution of the catalysts were characterized by XPS (250xi, Perkin Elmer, Waltham, MA, USA).
2.4. Ozone Catalytic Oxidation Experiment
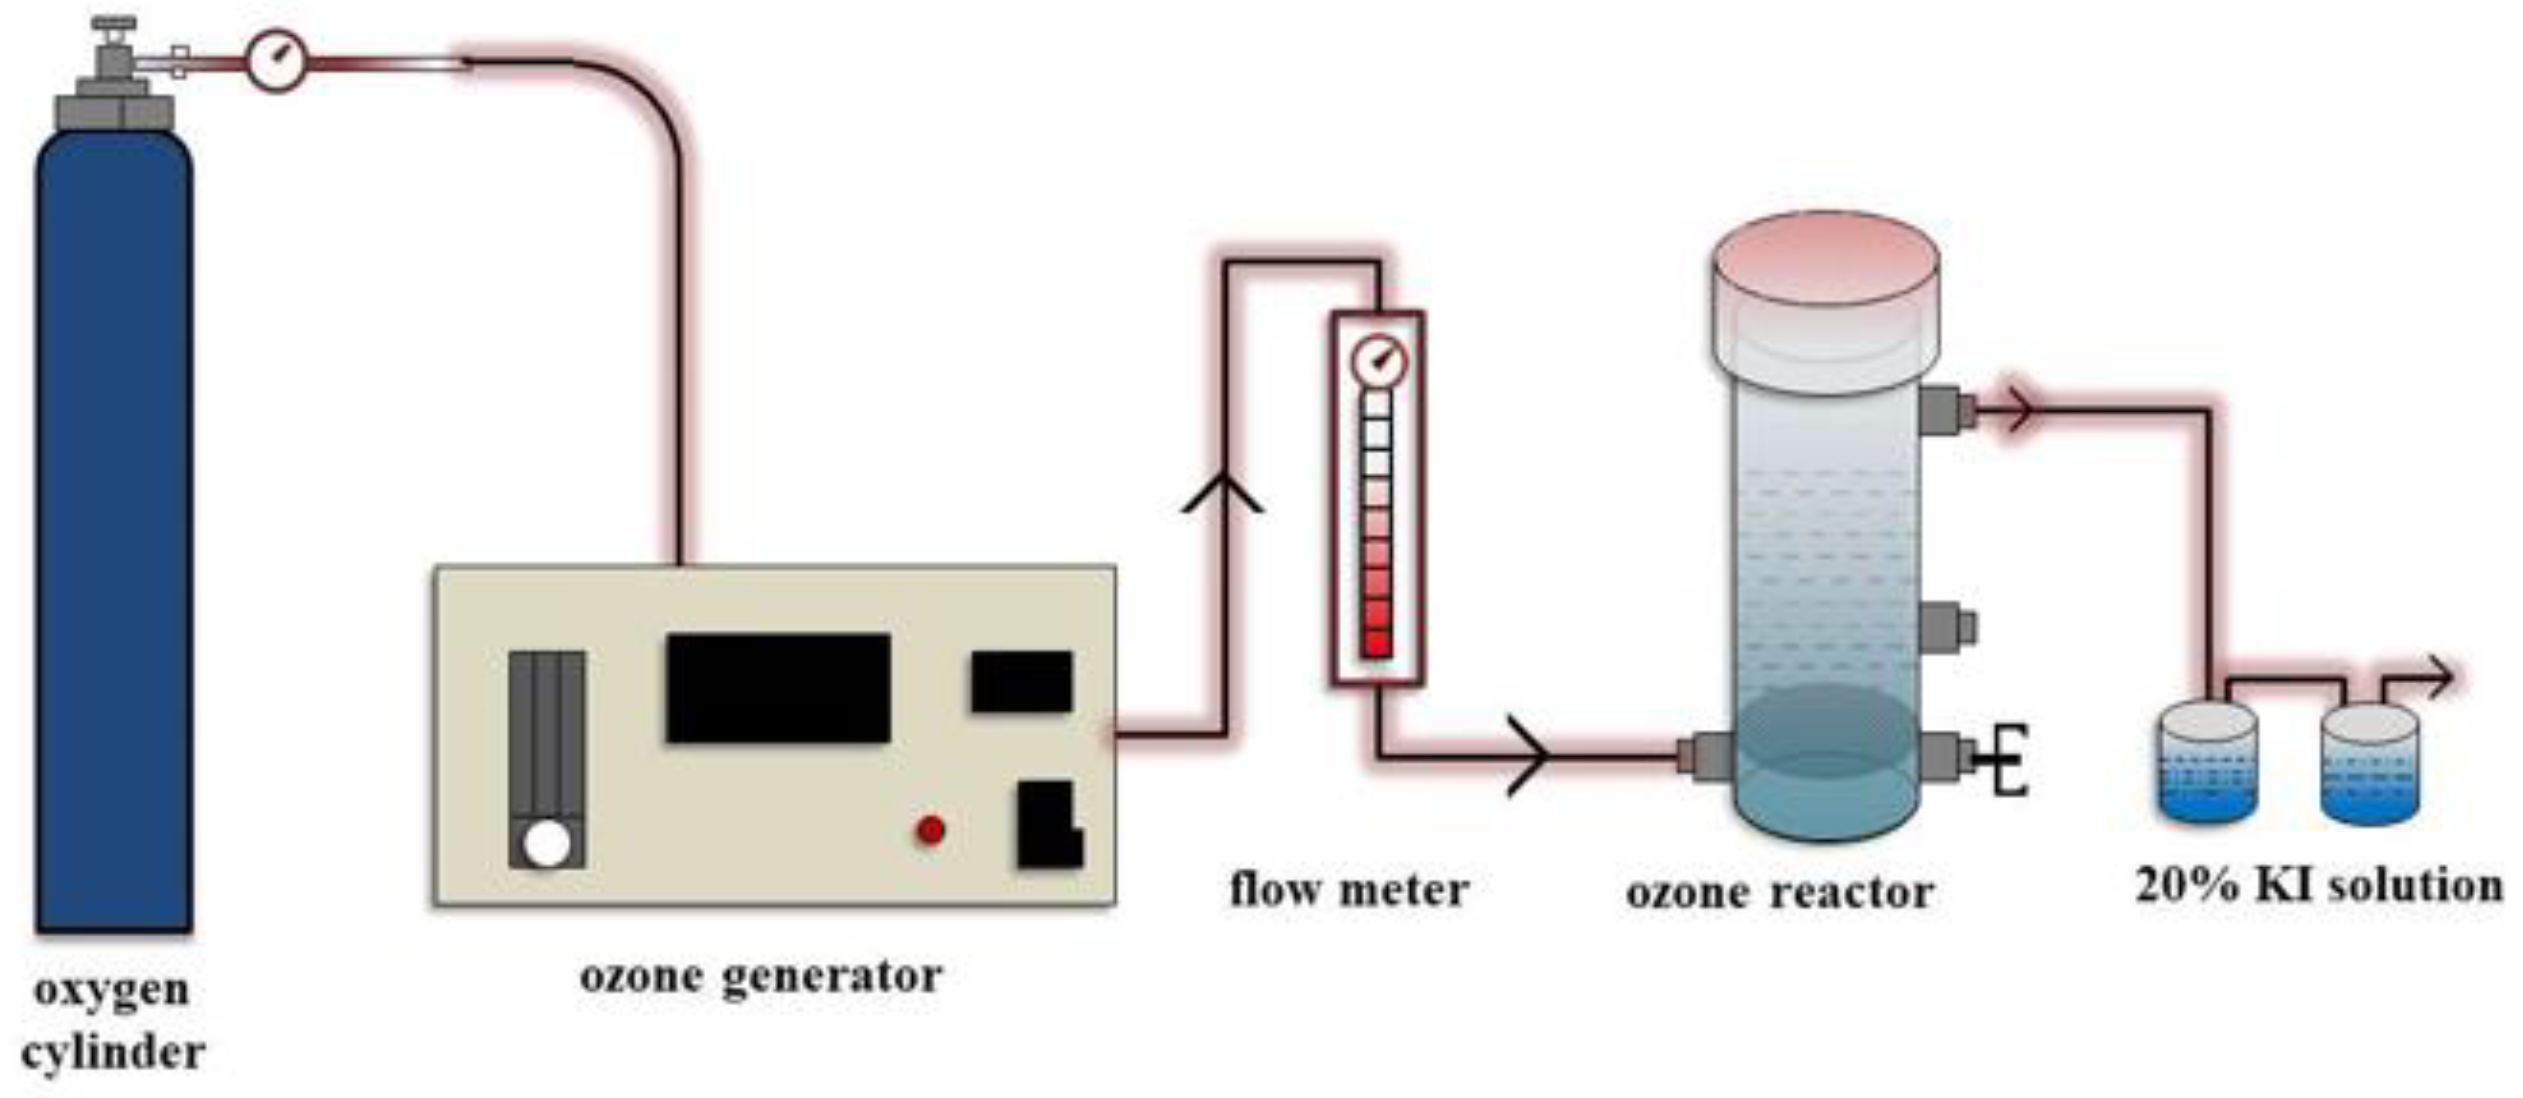
Figure 1 shows catalytic ozone oxidation reaction flow. First, open the oxygen cylinder and control the oxygen outlet pressure to 0.12 Mpa. Then, turn on the cooling water circulation system, then turn on the ozone generator and adjust the ozone output. Before the experiment, the ozone should be pre-blown for 10 min to discharge other impurity gases in the catalytic oxidation device. After pre-blowing, the filling rate of the reaction column catalyst is controlled to be 4%, 8%, 12%, 16%, 20%, and the amount of RO concentrated water in the column is controlled so that the ratio of the height of the water column to the inner diameter of the reaction column is 3:1, 5:1, 7:1, 9:1 and 11:1. The gas flow meter is adjusted to realize the control of the ozone dosage, and the remaining ozone is discharged to the outside through a two-stage 20% KI absorption unit. In order to investigate the adsorption of organics on activated alumina, the adsorption experiment process is performed as follows. A pretreated blank activated alumina carrier in the experimental device is added. Subsequently, a certain amount of RO-concentrated water is injected. Open the high-purity oxygen cylinder and control the oxygen discharge pressure by adjusting the pressure-reducing valve to 0.12 Mpa. A 25 mL water sample is taken every 10 min. All experiments were repeated three times.
The vibration of the water bath shaker was used to simulate the friction strength of the catalyst caused by the ozone aeration device and the combined flow friction strength of the gas and water caused by the aeration. The wear resistance of the catalyst was analyzed according to the wear rate of the Cu-Ce@γ-Al2O3 catalyst, which varied with the shaking speed of the shaker. Detailed experimental procedures are shown in Text S1. The prepared Cu-Ce@γ-Al2O3 catalyst was used 30 times to investigate its stability in long-term use and its degradation performance in RO concentrated water.
2.5. Water Quality Analysis Method
The iodometric method is commonly used to determine the gas-phase ozone concentration. This study uses the sodium indigo disulfonate method to measure the ozone concentration in the liquid phase. The calculation of the ozone utilization rate is shown in Text S2. The spectral analysis of the water quality conditions before and after treatment was conducted using a fluorescence spectrophotometer to investigate the consistency of the organic matter in water. The three-dimensional fluorescence spectrum testing parameters were presented as follows: the emission wavelength (EM) was 270–600 nm, the excitation wavelength (EX) was 250–450 nm, and the slit width was 5 nm. The water quality conditions before and after the treatment were scanned and analyzed by a mid-ultraviolet spectrophotometer, and the detection wavelength range was 190–1100 nm.
2.6. Multilevel-Fuzzy Analysis Evaluation Model
Various complex factors and indicators in the catalytic oxidation process often have certain levels and ambiguities. For the evaluation subject of the Cu-Ce@γ-Al2O3 catalyst, the evaluation indexes are selected from three aspects, namely, environmental impact, resource consumption, and energy consumption, which can reflect the environmental and economic benefits of the system. A comprehensive evaluation index system is established, that is, multilevel fuzzy analysis evaluation. The Cu-Ce@γ-Al2O3 catalyzed ozone oxidation degradation of COD in RO concentrated water was evaluated by the analytic hierarchy process (AHP), and the target layer was determined as the comprehensive evaluation system for Cu-Ce@γ-Al2O3 catalyzed ozone oxidation degradation of RO concentrated water called T. Environmental impact, T1, resource consumption, T2, and energy consumption, T3, which can reflect the environmental benefits and economic benefits of the system, are chosen as the criterion layer. COD removal efficiency, T11, catalyst filling rate, T21, ozone flow rate, T22, reaction pH value, T23, height-diameter ratio, T24, and reaction time, T31 are the plan layer, and the effect of individual reaction conditions on the COD removal efficiency in RO concentrated water is explored. The hierarchical structure is shown in Figure S1, and the detailed calculation is shown in Text S3.
3. Results and Discussion
3.1. Preparation and Optimization of Cu-Ce@γ-Al2O3 Catalyst
As shown in Figure S2, when no ozone was introduced, the adsorption rate of the blank activated alumina catalyst was faster within 0–60 min, the adsorption saturation state was reached at 80 min, and the COD removal efficiency was 5.9%. In the catalytic ozone oxidation system, the COD removal efficiency was basically stable at 80 min, at 35.3% compared with 27.2% in the single ozone oxidation, and the presence of the blank activated alumina catalyst improved the COD removal efficiency. The blank activated alumina catalyst showed good adsorption performance for organic matter in RO concentrated water. The reason is that the particle size of the activated alumina was small, and the specific surface area and pore structure were improved after calcination and activation (as shown in Table S11). With the increase in time, the treatment effect of the three reaction systems gradually reached saturation, when the COD removal efficiency was still low. This indicates that there are many hard-to-degrade organic pollutants remaining in the RO concentrated water. Hence, it is necessary to dope an active component into the γ-Al2O3 to improve the catalytic activity of the catalyst. Figure S3 illustrates that the catalytic activities of the multi-component activated alumina catalysts are quite different when the ratios of Ce and Cu vary. With the increase in Cu content, catalyst degradation efficiency for RO concentrated water increases then decreases. When the doping ratio of Ce and Cu was 1:2, the catalytic activity of the catalyst reached the maximum with COD removal efficiency of 68.6% at 70 min. With the increase in Cu element content, the catalyst active components Ce and Cu are present in a relatively better morphology and dispersion [17]. However, when the doping of Cu is too high, the excess Cu blocks the pore channels inside the catalyst, which is not conducive to sufficient contact between the active components and the ozone. Figure S4 shows that the Cu-Ce@γ-Al2O3 catalysts have great differences in the removal of COD by the catalytic oxidation of RO concentrated water at different calcination temperatures. When the calcination temperature was 600 °C, the catalytic degradation effect was the best, and the COD removal efficiency was 69.3% at 70 min. If the roasting temperature is too low, the high-temperature modification is not sufficient to convert Cu and Ce into the corresponding active oxides [18], and if the roasting temperature is too high, some of the crystal particles sinter and the surface activity decreases significantly. Figure S5 shows that with a calcination time of 3–5 h, the COD removal efficiency showed a significant and gradual upward trend. However, by continuing to extend the roasting time to 6.0 h, the COD removal efficiency decreased. When the roasting time was 5.0 h, the COD removal efficiency reached the highest of 80.6% at 70 min. The complete conversion of the active components to metal oxides requires a long roasting time. However, when the roasting time is too long, the Cu and Ce oxides tend to sinter, forming large areas of coverage and causing a certain degree of reduction in the specific surface area of the catalyst [19]. When Ce:Cu = 1:2, the roasting temperature is 600 °C, and the roasting time is 5 h, the elements Cu and Ce can be converted to the corresponding metal oxides better, and the catalytic activity of the catalyst is higher.
3.2. Characterization and Analysis of Cu-Ce@γ-Al2O3 Catalysts
Figure 2 shows the SEM of the catalysts. When the calcining temperature is lower than 600 °C, a great quantity of obvious crystal particles is not observed compared with the blank sample, indicating less generated active components. When the calcination temperature reached 600 °C, generous crystal particles were formed on the surface of Cu-Ce@γ-Al2O3, and the crystal particles were relatively dispersed. A lower calcination temperature is not conducive to the formation of crystal particles. The rise of calcining temperature properly increases the surface roughness and enhances the catalytic activity [20]. However, the crystal particles generated on the surface of the catalyst increase significantly at a calcination temperature of 700 °C, thereby causing certain crowding of the voids inside the catalyst and affecting the catalytic performance [21]. After 30 repetitions, the pore structure of the Cu-Ce@γ-Al2O3 catalyst was blocked by substances in the RO concentrated water, reducing the catalytic oxidation effect.
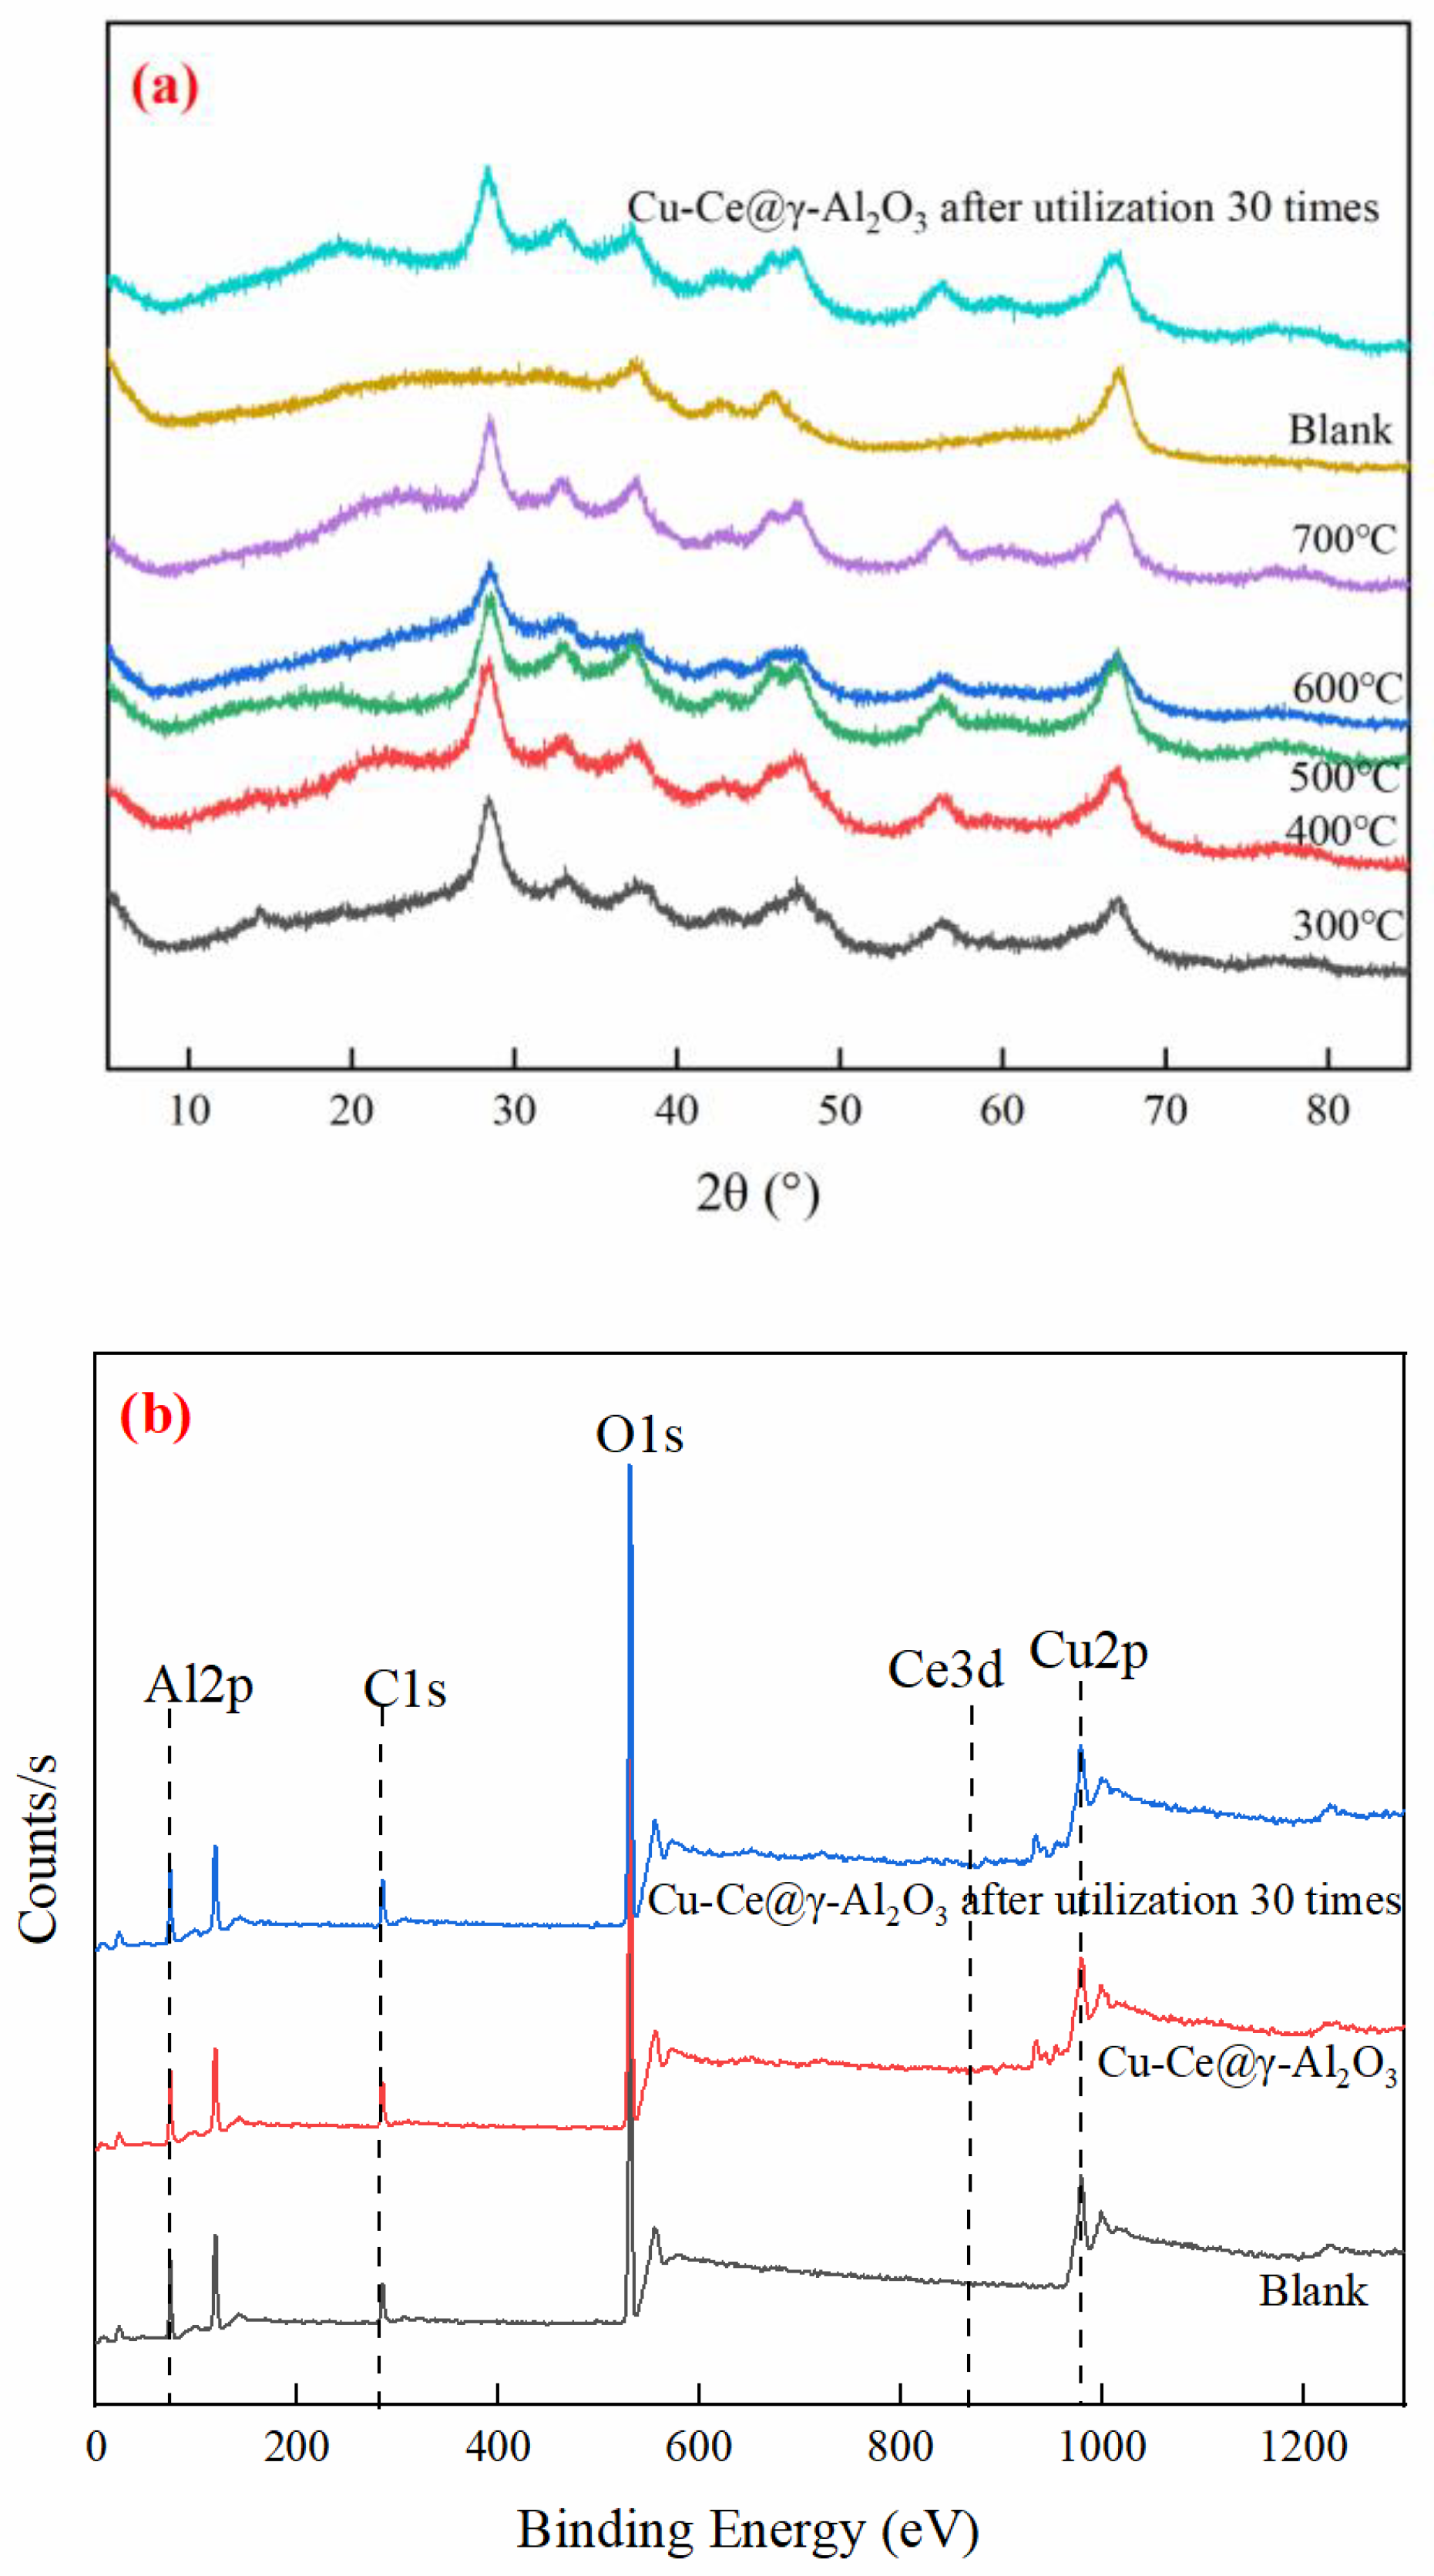
Figure 3a suggests that the catalyst has the typical diffraction peaks of Al2O3 at 2θ = 33.16°, 33.16°, 37.68°, 47.06°, 56.19°, and 66.52°and show the same strength. At 2θ = 29.15°, 28.75°, 33.22°, 48.35°, and 57.21°, obvious fluctuations are observed compared with the blank carrier, which are typical CeO2 and Ce2O3 diffraction peaks. Furthermore, at 2θ = 36.15°, 39.15° is the diffraction peak of CuO. When roasting temperature rises, the diffraction peak intensities of CeO2 at 2θ = 29.15°, 28.75°, 33.22°, 48.35°, 57.21°, and CuO at 2θ = 36.15°, 39.15° showed a trend of increasing gradually. The intensity of the corresponding diffraction peaks is highest when the roasting temperature reaches 600 °C. When the roasting temperature reaches 700 °C, the intensity of the diffraction peaks decreases to some extent. The reason is that the ratio of Ce3+/Ce4+ generated in Cu-Ce@γ-Al2O3 is the highest at 600 °C, the amount of Cu2+ is also the largest, and the electron transfer rate in the catalytic oxidation process is also the highest [22]. However, excessively high roasting temperatures can cause damage to the structure of Cu-Ce@γ-Al2O3, and the crystal forms of the generated Ce4+ and Cu2+ metal oxides will gradually disappear. Furthermore, repeated use will reduce the CuO and CeO2 crystal forms [23]. This phenomenon may be due to the loss of metal components caused by repeated use, which in turn affects the size of the diffraction peaks of CuO and CeO2.
Figure 3b depicts that the electronic binding energy of O1s is 531.1 eV, C1s is 284.8 eV, Al2p is 74.26 eV, Cu2p is 933.4 eV, and Ce3d is 883.8 eV. According to Figure S6, the electronic binding energies corresponding to the peaks of Cu2p3/2 and Cu2p1/2 are 933.68 eV and 953.5 eV. Meanwhile, the binding energies corresponding to the peaks of Ce3d5/2 and Ce3d3/2 are 882.85 eV and 905.10 eV. The valence state of Cu supported in the Cu-Ce@γ-Al2O3 catalyst is +2, and the valence of Ce is +4. In addition, compared with the full XPS spectrum of Cu-Ce@γ-Al2O3 catalyst after repeated use 30 times, there seems to be no significant decrease in the characteristic peaks of Cu and Ce. The loss of loading metal due to 30 repetitions did not have a significant effect on the magnitude of the peaks in the Cu2p and Ce3d energy spectra, indicating that the Cu-Ce@γ-Al2O3 catalysts still had high catalytic activity after repeated use.
Figure 4 shows that the three adsorption and desorption isotherms are all typical type IV isotherms compared with the adsorption-desorption isotherm of N2. When the relative pressure P/P0 was around 0.8, the three adsorption and desorption isotherm curves all showed obvious inflection points. According to Table S11, the specific surface area of Cu-Ce@γ-Al2O3 is 181.93 m2/g, the average pore volume is 0.44, and the average pore diameter is 9.73 nm. Compared to the blank carrier, the Cu-Ce@γ-Al2O3 has a larger surface area and average pore volume, with a small reduction in the average pore size. However, after repeated use for 30 times, Cu-Ce@γ-Al2O3 showed a slight decrease in various indexes. This result indicates that Cu and Ce form corresponding metal oxides through calcination activation, which are successfully loaded on the surface and inside of activated alumina. However, in the process of catalytic oxidation treatment of RO concentrated water, with the flow of liquid in the system, a small number of metal oxides of Cu and Ce will penetrate into the pores of the carrier, which will block the pores of the carrier and reduce the specific surface area, thereby affecting the catalytic performance of Cu-Ce@γ-Al2O3.
Table 2 presents that the weight percentages of active metal elements Cu and Ce supported in Cu-Ce@γ-Al2O3 are 3.42% and 3.92%, respectively, and their atomic percentages are 1.16% and 0.60%, respectively. Compared to the blank carrier, the metal active fraction content on the catalyst surface is substantially higher, indicating that two metal active fractions, Cu and Ce, have been successfully loaded onto the active alumina supporter. After repeated use of Cu-Ce@γ-Al2O3 for 30 times, the weight percentages of Cu and Ce are 3.23% and 3.59%, and their atomic percentages are 1.04% and 0.54%, respectively. Compared with Cu-Ce@γ-Al2O3, the weight percentages decreased by 0.19% and 0.33%, indicating that the Cu-Ce@γ-Al2 O3 catalyst will lose a small number of active components Cu and Ce in the process of treating RO concentrated water, and it also has good stability, which can be applied to the actual high-salt wastewater treatment [24].
Table 3 presents the main elements contained in the blank sample are Na, Al, and Ca, mainly in the form of Na2O, Al2O3, and CaO, and also contain trace elements, such as Si, Fe, S, and other elements, with the form of SiO2, Fe2O3, and SO3. Compared with the blank, the content of oxides contained in the Cu-Ce@γ-Al2O3 catalyst changed significantly, and the supported CuO and CeO2 contents were 6.25% and 6.44%, respectively. Thus, Cu and Ce in the immersion solution have been successfully loaded on the surface and inside of the activated alumina supporter and successfully converted into the active components of CuO and CeO2 after calcination. During the preparation process, the impregnation ratio of Cu and Ce was 1:2, whereas the content ratio of CuO and CeO2 was approximately 1:1, and the ratio of the generated metal oxides was basically the same as the actual feeding ratio. This finding indicates that the Cu and Ce metal oxides can stably exist in the interior and surface of Cu-Ce@γ-Al2O3, but a small amount of loss will occur during the preparation process. After repeated use for 30 times, the contents of CuO and CeO2 decreased by 6.41% and 1.24%, respectively, indicating that the surface and internal active components of the catalyst would be lost irreversibly. However, the loss of active metal components is small, and the loss of the Ce element is very small. The results show that the Cu-Ce@γ-Al2O3 catalyst has good stability and can meet the requirements of practical engineering wastewater treatment.
3.3. Optimization of Ozone Catalytic Oxidation Conditions
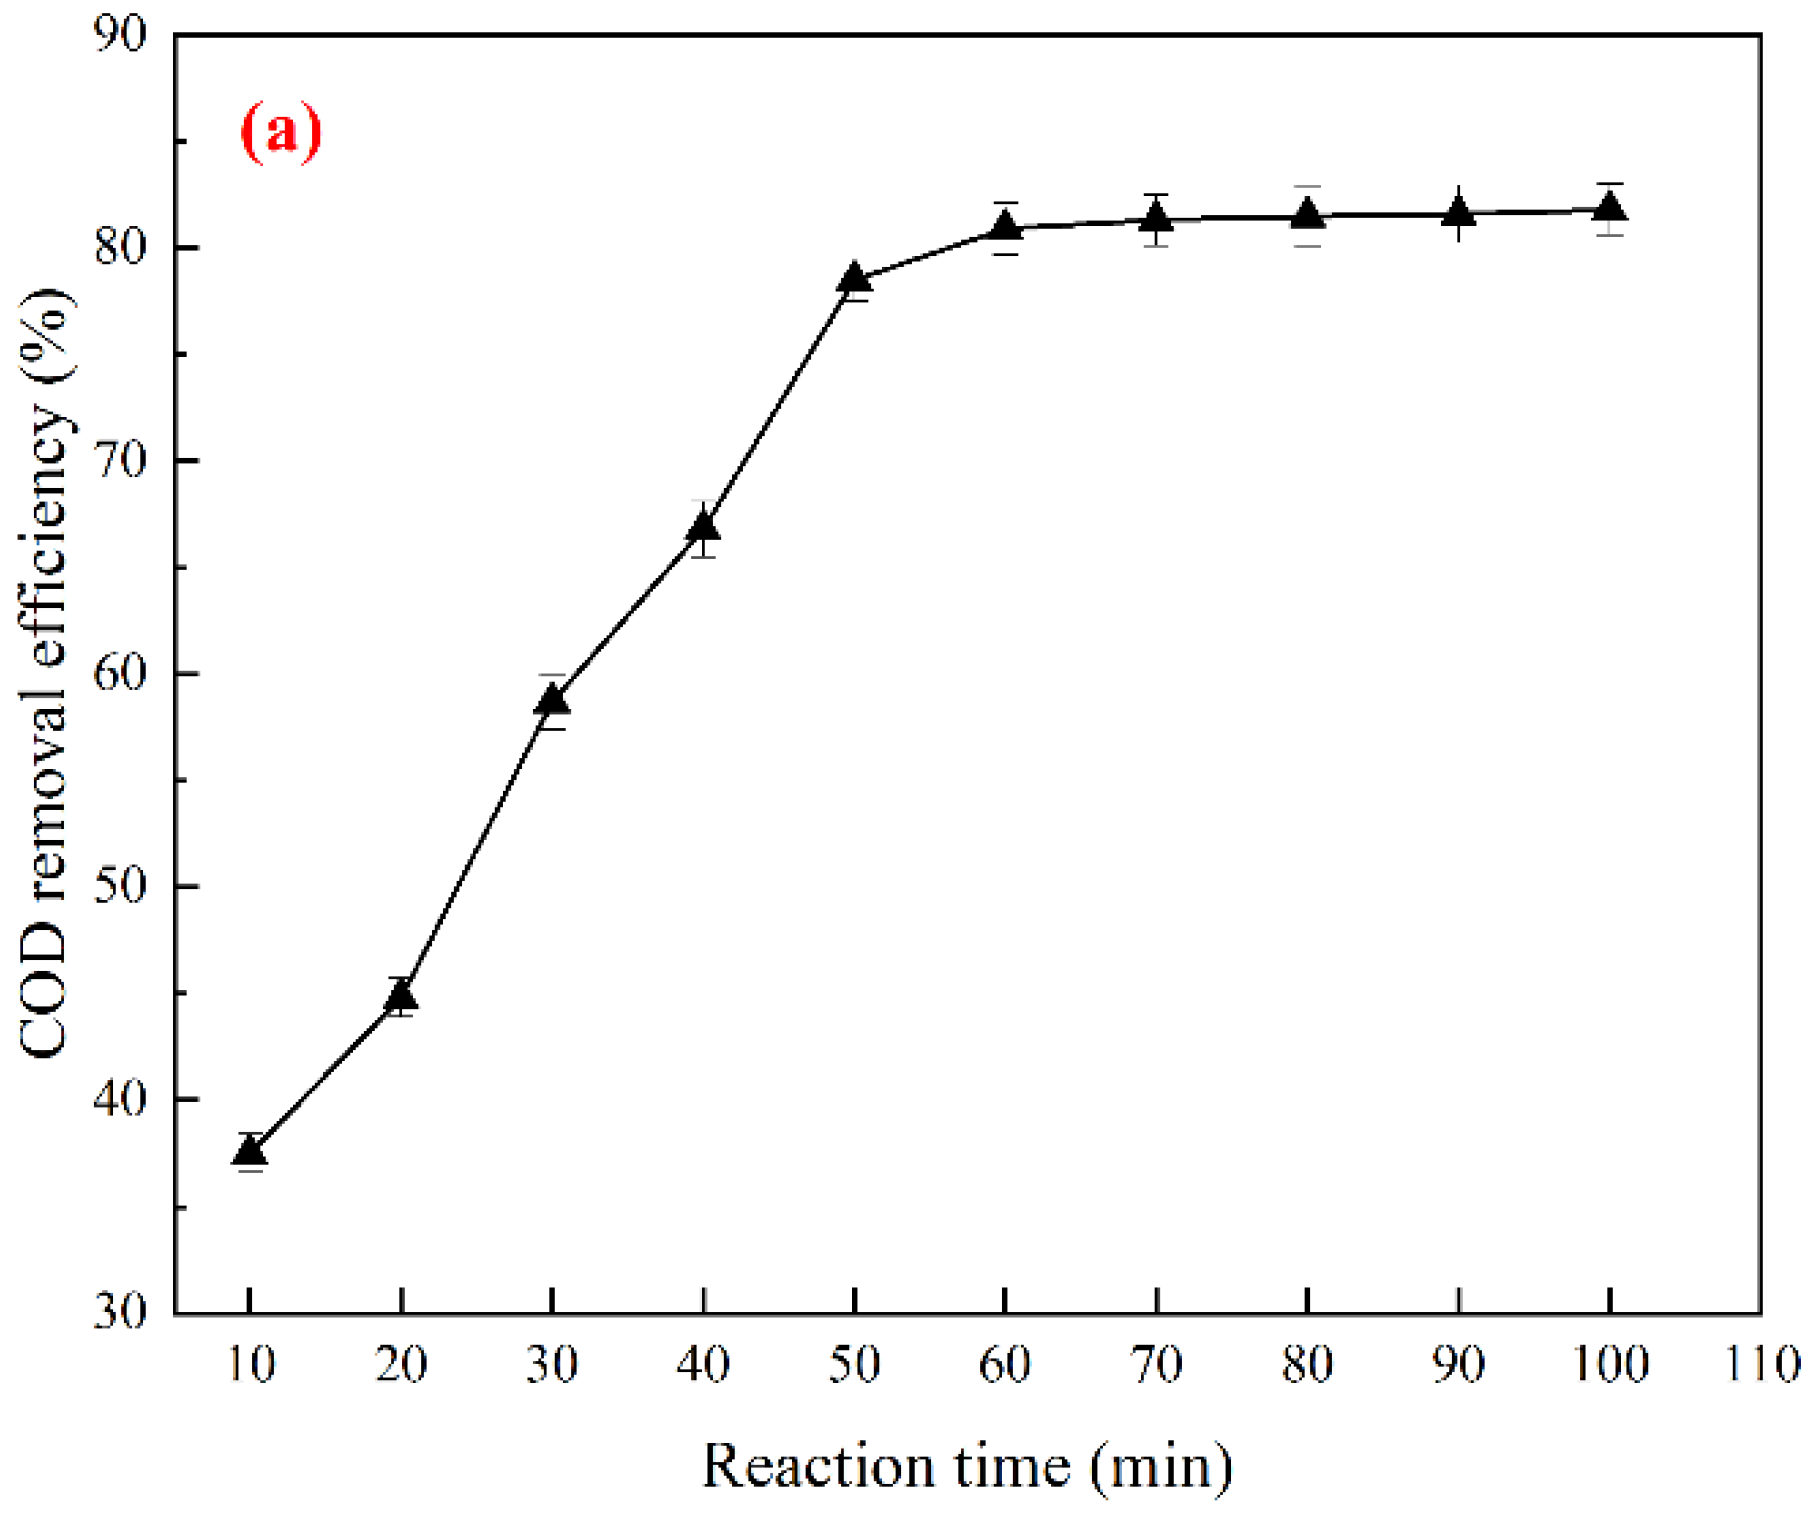
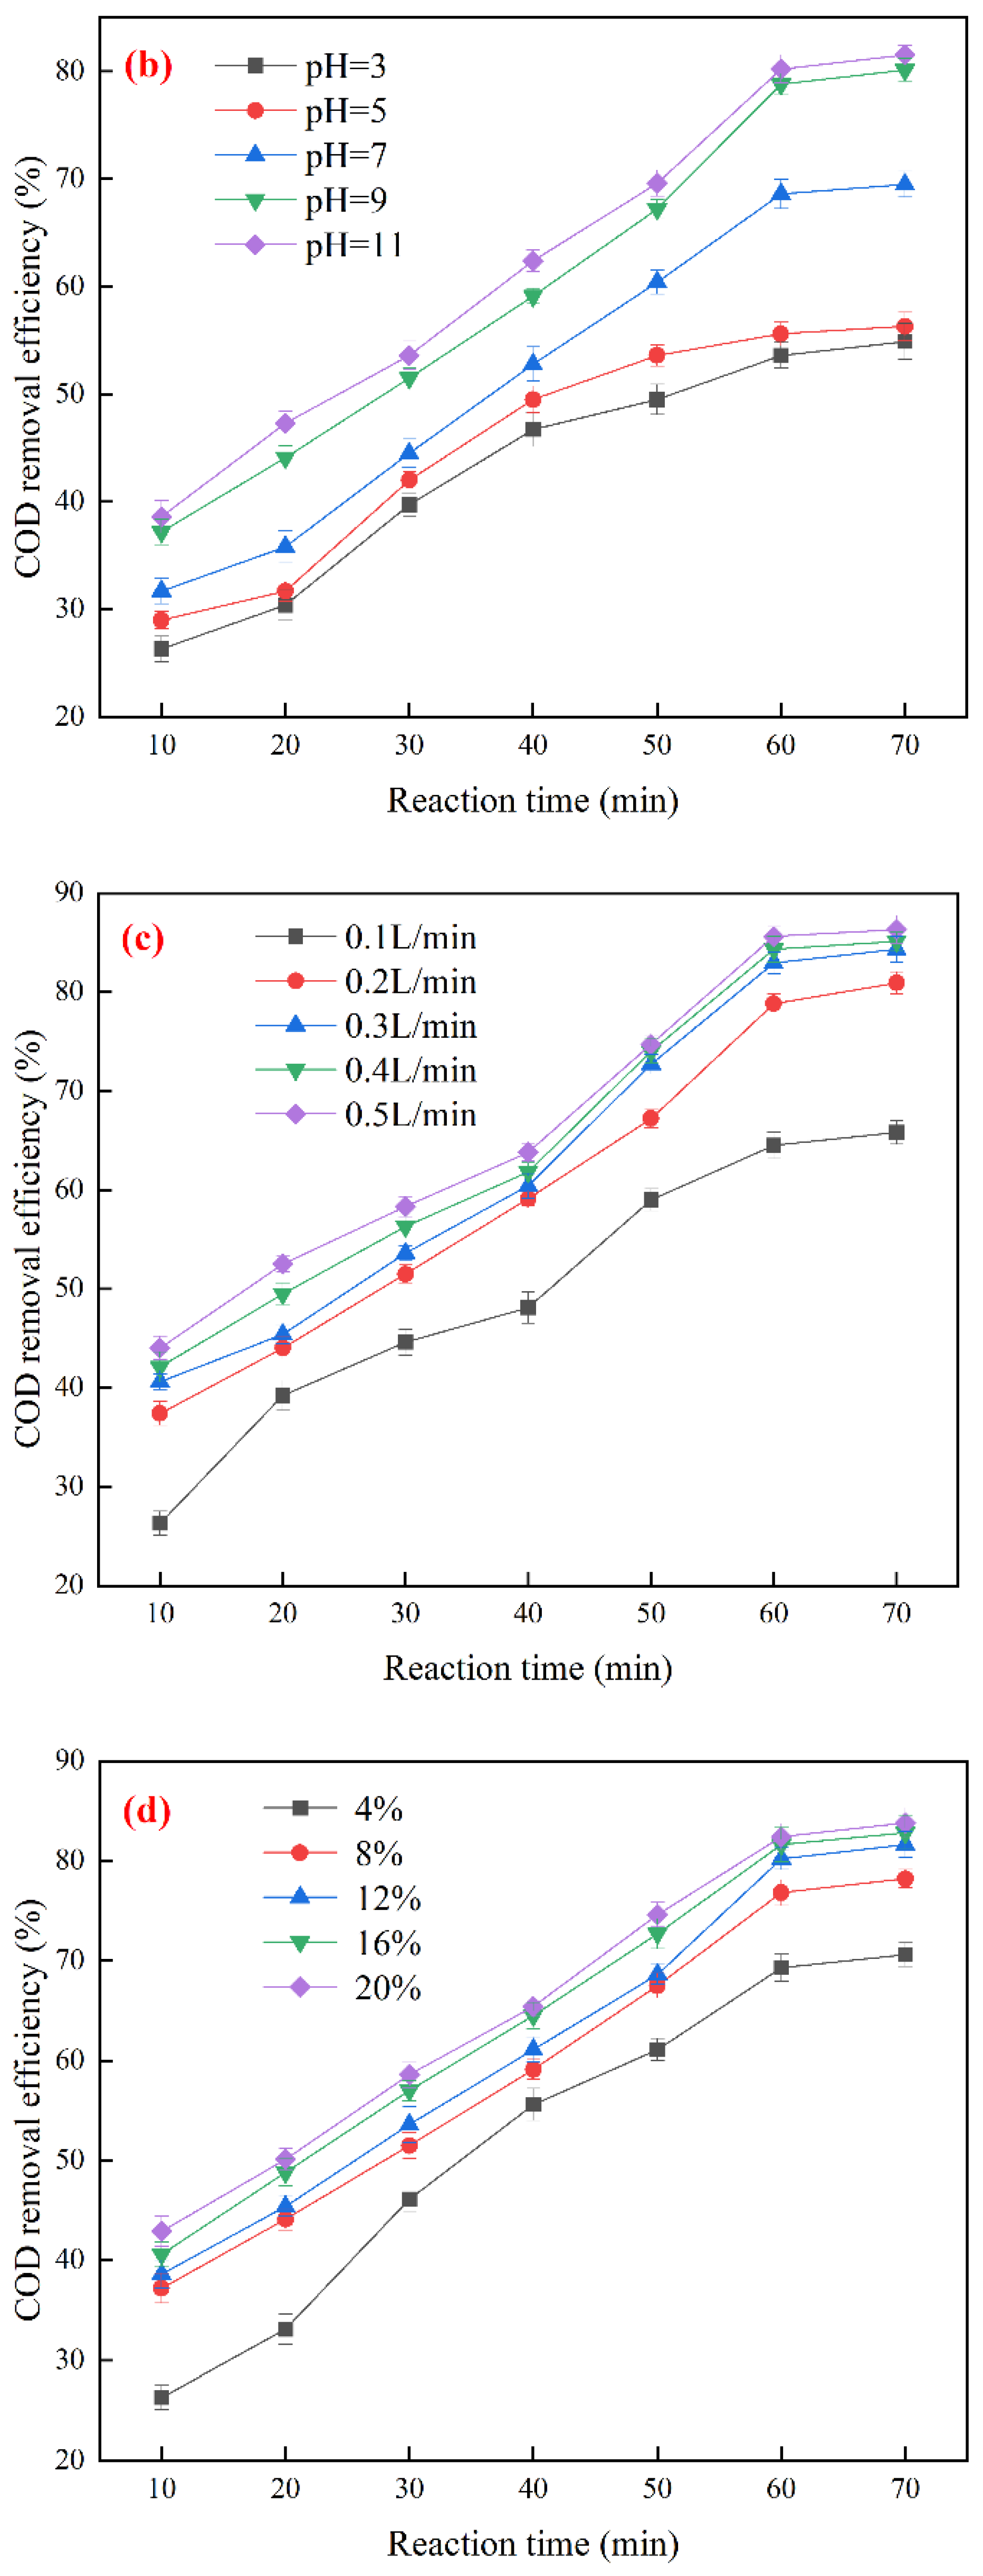
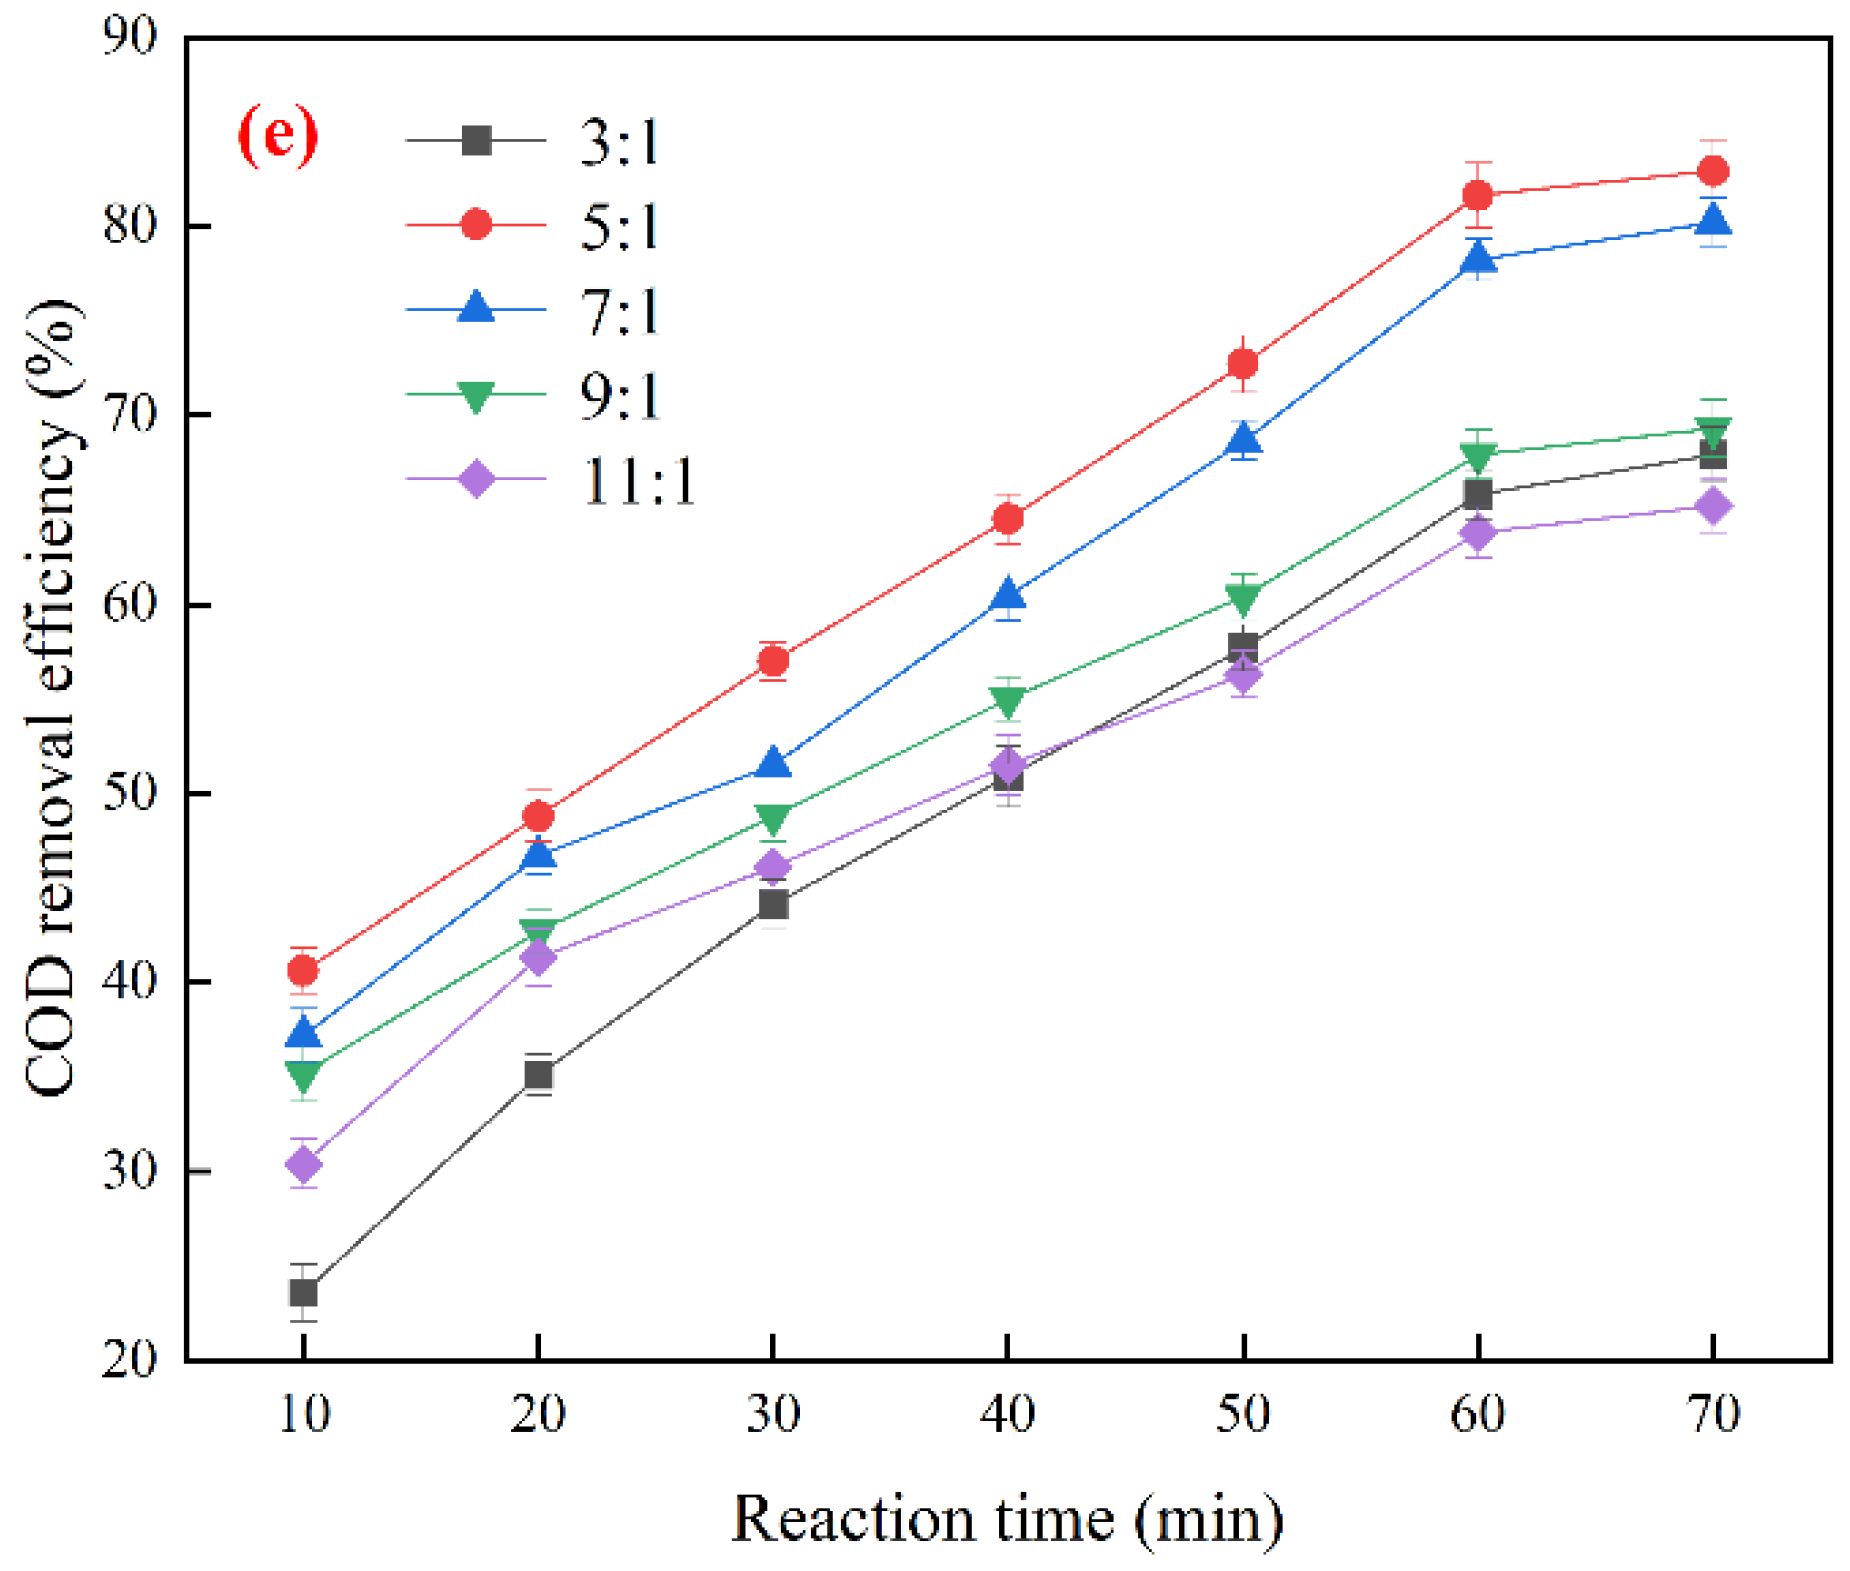
Figure 5a suggests that with prolonged catalytic reaction time, the content of COD in the RO concentrated water gradually decreased. When the reaction time was 10–50 min, the COD removal efficiency increased and reached the value of 80.9%. The COD removal efficiency increased slowly with reaction time proceeding and increased by 2.7% at 100 min. This result is due to the high concentration of organic matter in the RO concentrated water of the system in the first 60 min of the reaction. At this time, the Cu-Ce@γ-Al2O3 catalyst is in rapid and substantial effective contact with the organic pollutants in the system, degrading them at a fast reaction rate. After 60 min, with the prolongation of reaction time, the concentration of organic pollutants in the system gradually decreased, the effective contact efficiency between Cu-Ce@γ-Al2O3 and pollutants also decreased, and the removal efficiency of COD in wastewater increased gently. Figure 5b suggests that the COD removal efficiency has a positive correlation with pH. The COD removal efficiency reaches the highest value of 80.3% at pH 11. However, when pH = 9~11, the Cu-Ce@γ-Al2O3 catalyst only increased the COD removal efficiency of RO concentrated water by 0.5%. Under alkaline conditions, the COD removal efficiency of RO concentrated water was higher than that under acidic conditions. This phenomenon is due to the fact that many OH− exist in alkaline conditions, which can combine with ozone to generate more •OH, thereby improving the degradation effect [25]. Furthermore, the alkaline conditions can possibly destroy the structure of the organic matter in the wastewater, thereby causing it to be dissociated and oxidized faster. Figure 5c shows that when the ozone ventilation rate increases from 0.1 to 0.5 L/min, the COD removal efficiency in the RO concentrated water shows a trend of rapid increase first and then slow. When the ozone flow rate was 0.5 L/min, the highest removal efficiency was 86.3% at 70 min. The reason is that with the increase in ozone flow rate, the gas–liquid–solid three-phase contact is sufficient, thereby increasing the volume mass transfer coefficient, accelerating the generation of •OH in the system, and improving the COD removal efficiency [26]. Figure 5d shows that with the increase in the Cu-Ce@γ-Al2O3 catalyst filling rate, the COD removal efficiency also increased. When the catalyst filling rate was 4–12%, the COD removal efficiency of Cu-Ce@γ-Al2O3 catalyst to RO concentrated water was faster. The COD removal efficiency reached 82.2% at 70 min when the Cu-Ce@γ-Al2O3 catalyst filling rate was 12%. When the catalyst filling rate continued to increase to 20%, the COD removal efficiency only increased by 2.5% compared with the catalyst filling rate of 12%. The reason for this may be that an increase in catalyst fill rate provides more active sites and increases the effective contact area with ozone, enabling the reaction system to generate more •OH per unit of time, increasing the efficiency of catalytic degradation [27]. However, when the active sites provided by the Cu-Ce@γ-Al2O3 catalyst almost meet the demand of ozone, increasing the catalyst fill rate will not significantly improve the catalytic effect. Figure 5e depicts that with the increase in the height-diameter ratio of the reaction column, the COD removal efficiency showed a trend of first increasing and then decreasing. When the height-diameter ratio of the reaction column was 5:1, the removal efficiency of COD was the highest, which was 85.1%. The retention time of ozone in the reactor is shorter with the smaller height-diameter ratio of the reactor. Meanwhile, the ozone utilization rate is also low due to the limit of mass transfer of ozone and the content of •OH produced by catalysis. However, when the H/D of the reactor is too large, the catalyst cannot react with the water sample uniformly to a certain extent due to the constant aeration, which reduces the degradation efficiency.
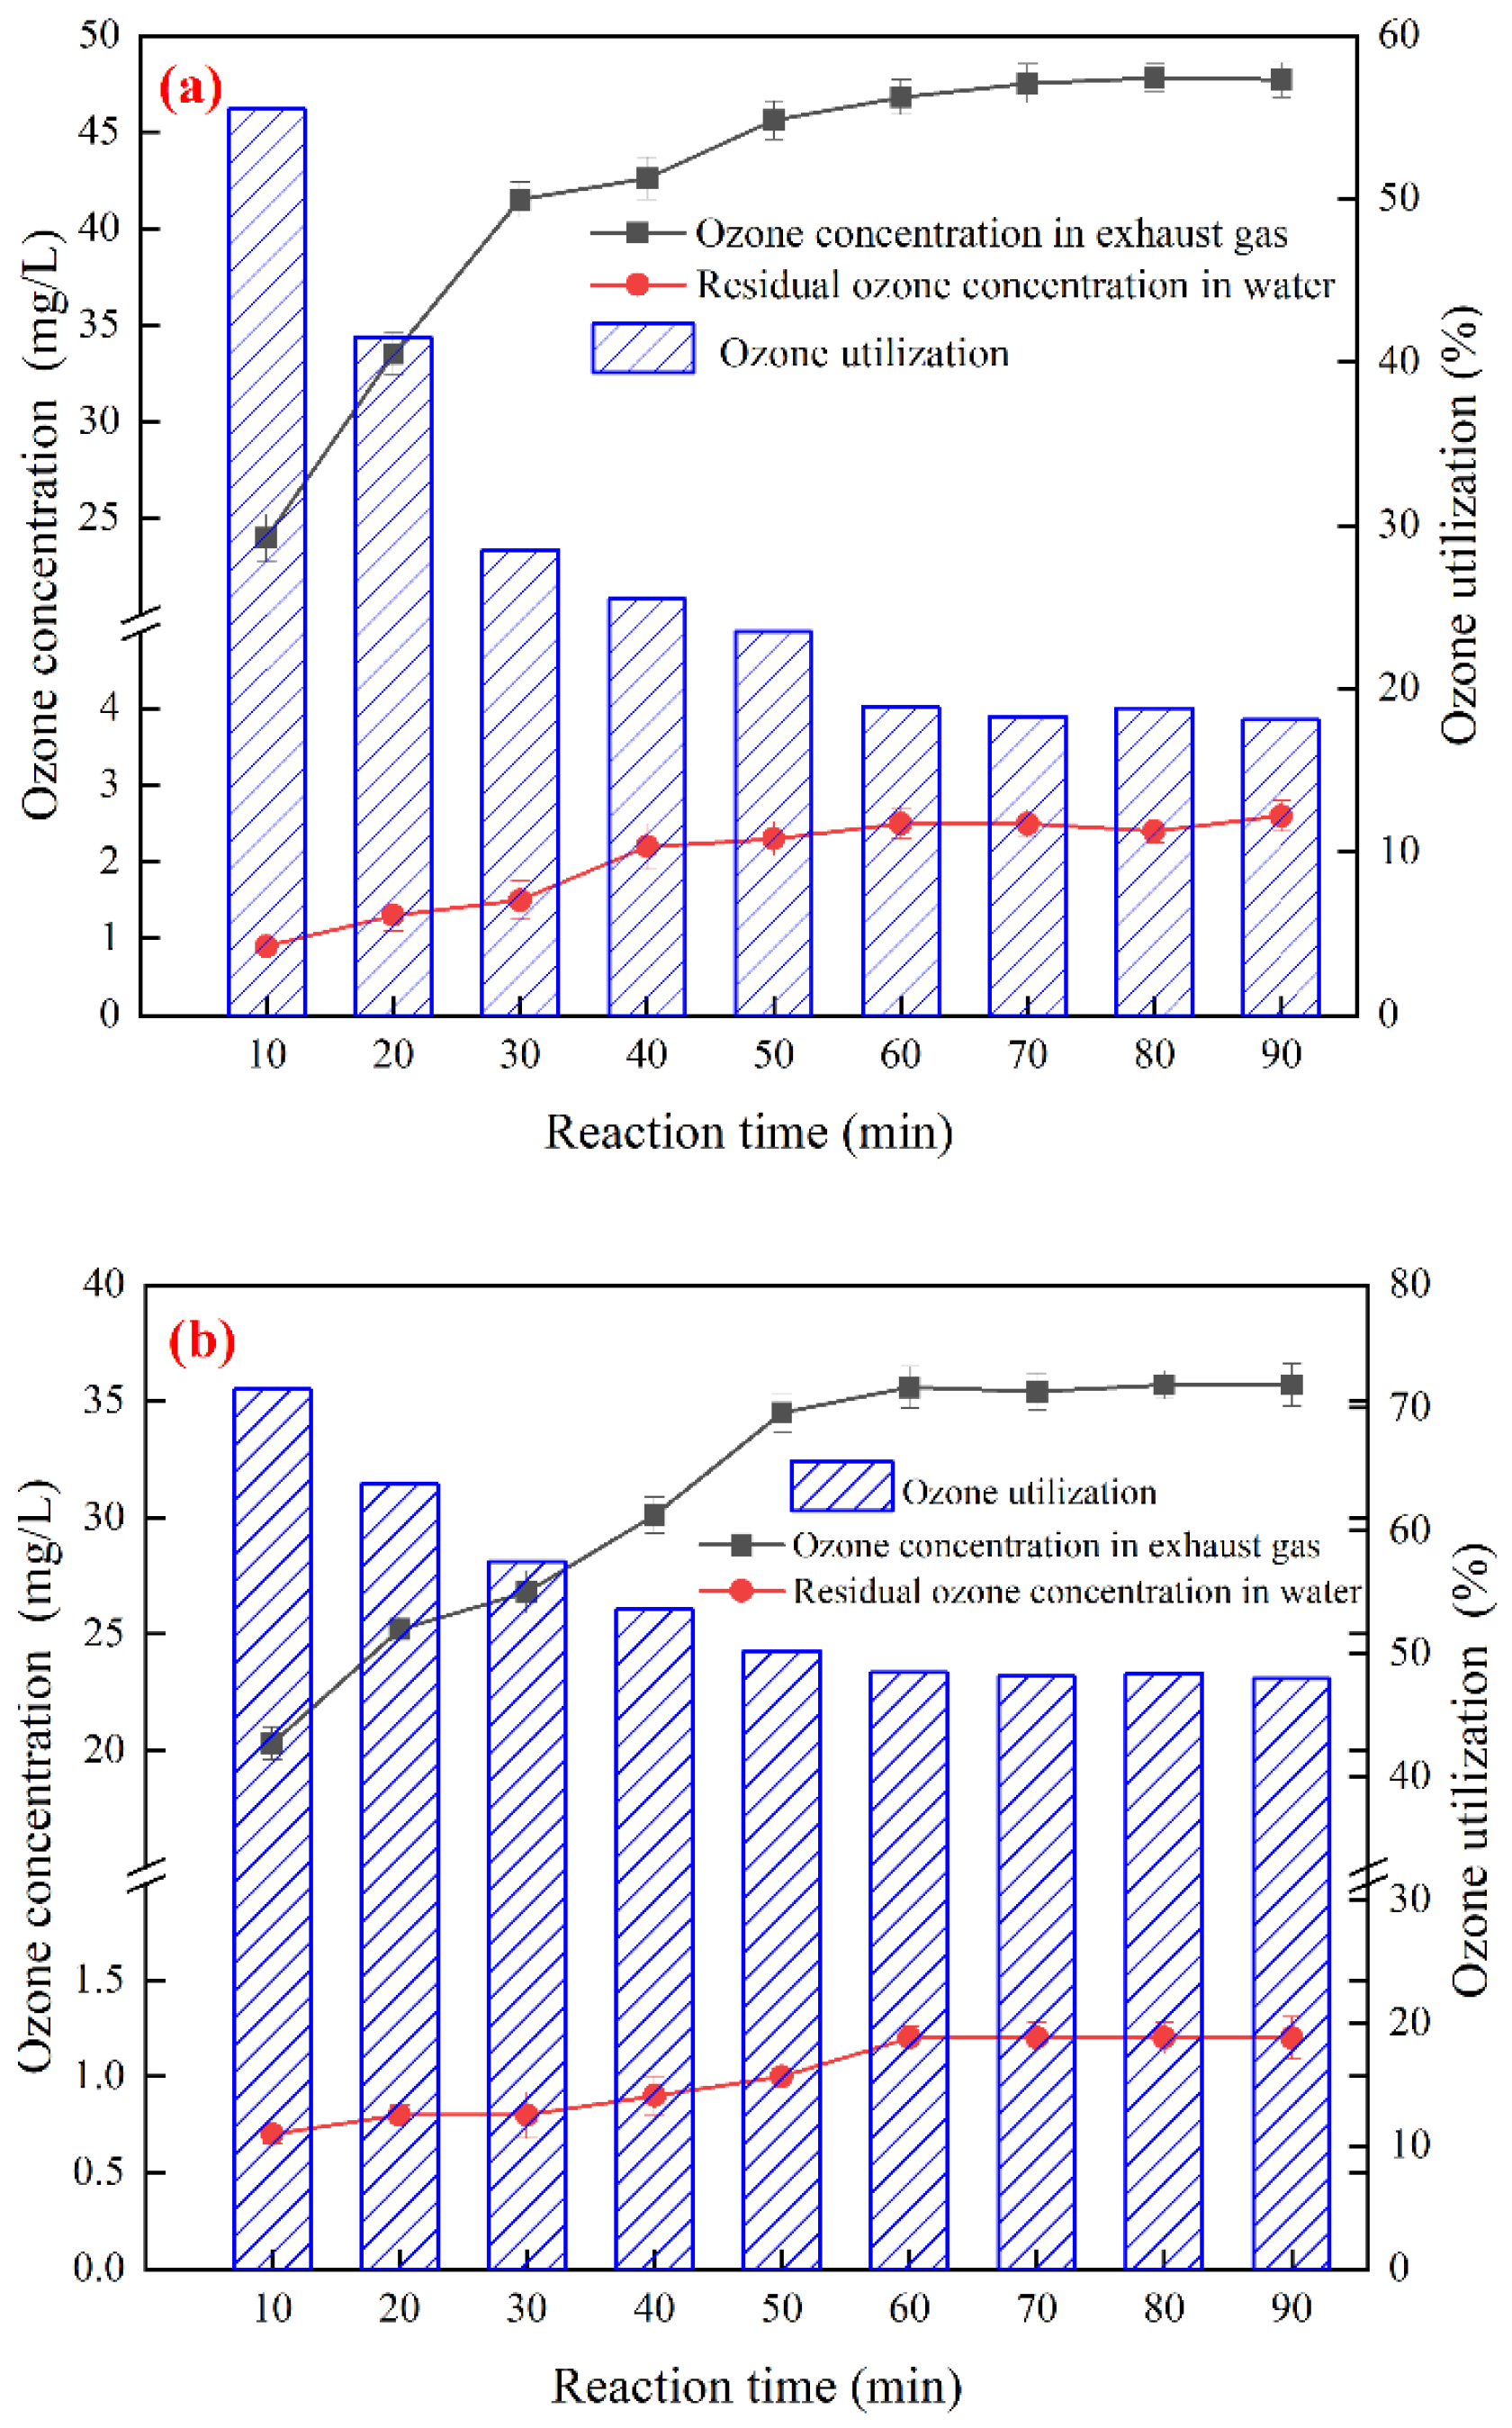
In Figure 6, before the reaction time reaches 60 min, the ozone concentration in the exhaust gas keeps rising because in the initial stage, ozone will cooperate with the Cu-Ce@γ-Al2O3 catalyst, or ozone itself will decompose to generate a large number of •OH to react with pollutants [28]. After the reaction time reached 60 min, the concentration of pollutants in the RO concentrated water continued to decrease due to the oxidation reaction. At this time, the ozone could not be used again. Therefore, the exhaust ozone concentration was high and did not fluctuate much. When the reaction reached the stable stage of 60 min, the ozone utilization rate of the single ozone catalytic oxidation system was 18.5%, and the ozone utilization rate of the Cu-Ce@γ-Al2O3 ozone catalytic oxidation system was 47.6%, which increased by 29.1% compared with the ozone system.
3.4. Effects of Free Radical Quenchers on Ozone Catalytic Oxidation
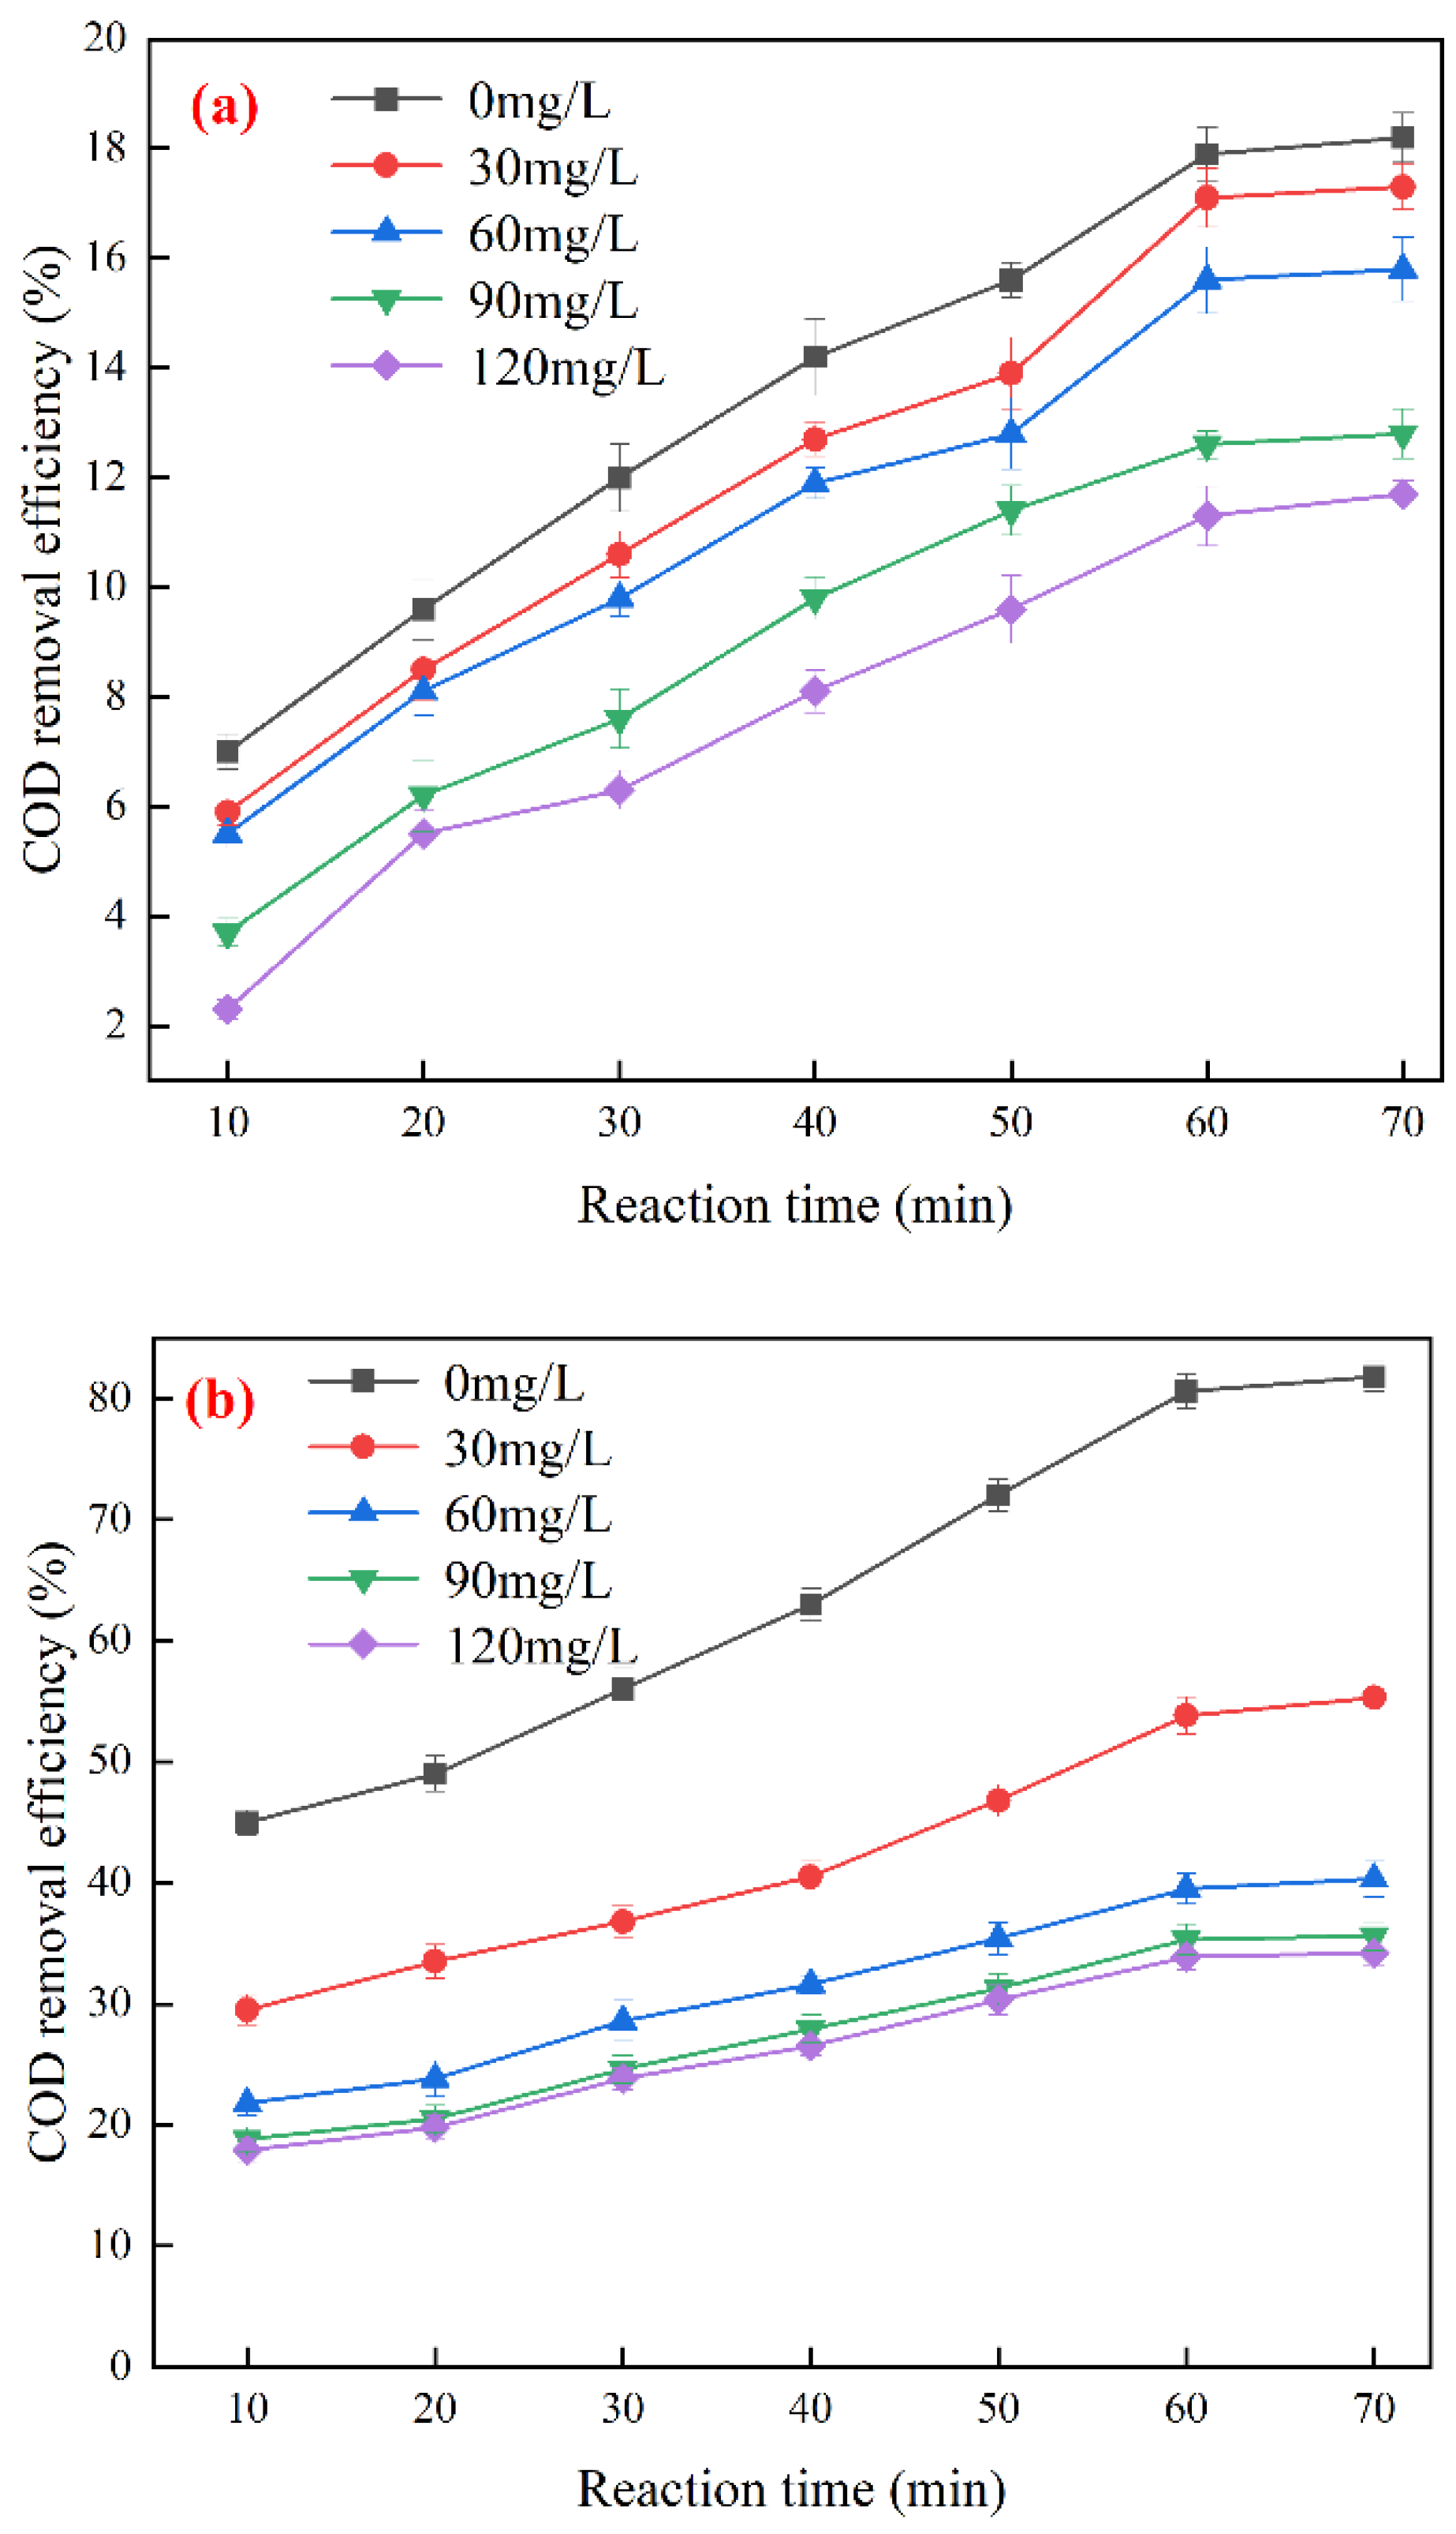
Figure 7 shows that when the concentration of TBA is 0 mg/L, the COD removal efficiencies in the ozonation system and the catalytic ozonation system are 18.2% and 80.7%, respectively. The COD removal efficiency in both systems decreased significantly with increasing TBA concentration, but the rate of decrease gradually became gentle. At a TBA concentration of 120 mg/L, the COD removal efficiencies for the two systems were 10.4% and 34.3%, respectively, which were 7.8% and 46.4% lower compared to the TBA concentration of 0 mg/L. The reason is that TBA, as an inhibitor of •OH, can shield the effect of free radicals in water on the degradation of COD. The COD removal efficiency of the ozone catalytic oxidation system is more affected by TBA, which indicates that •OH dominates in the Cu-Ce@γ-Al2O3 ozone-catalyzed oxidation reaction system to a certain extent. Therefore, the catalytic oxidation of ozone follows the action mechanism of •OH; that is, ozone is chemically adsorbed on the active site of the catalyst surface to generate •OH, thereby degrading organic pollutants in water.
3.5. UV Absorption Peak of Tail Water
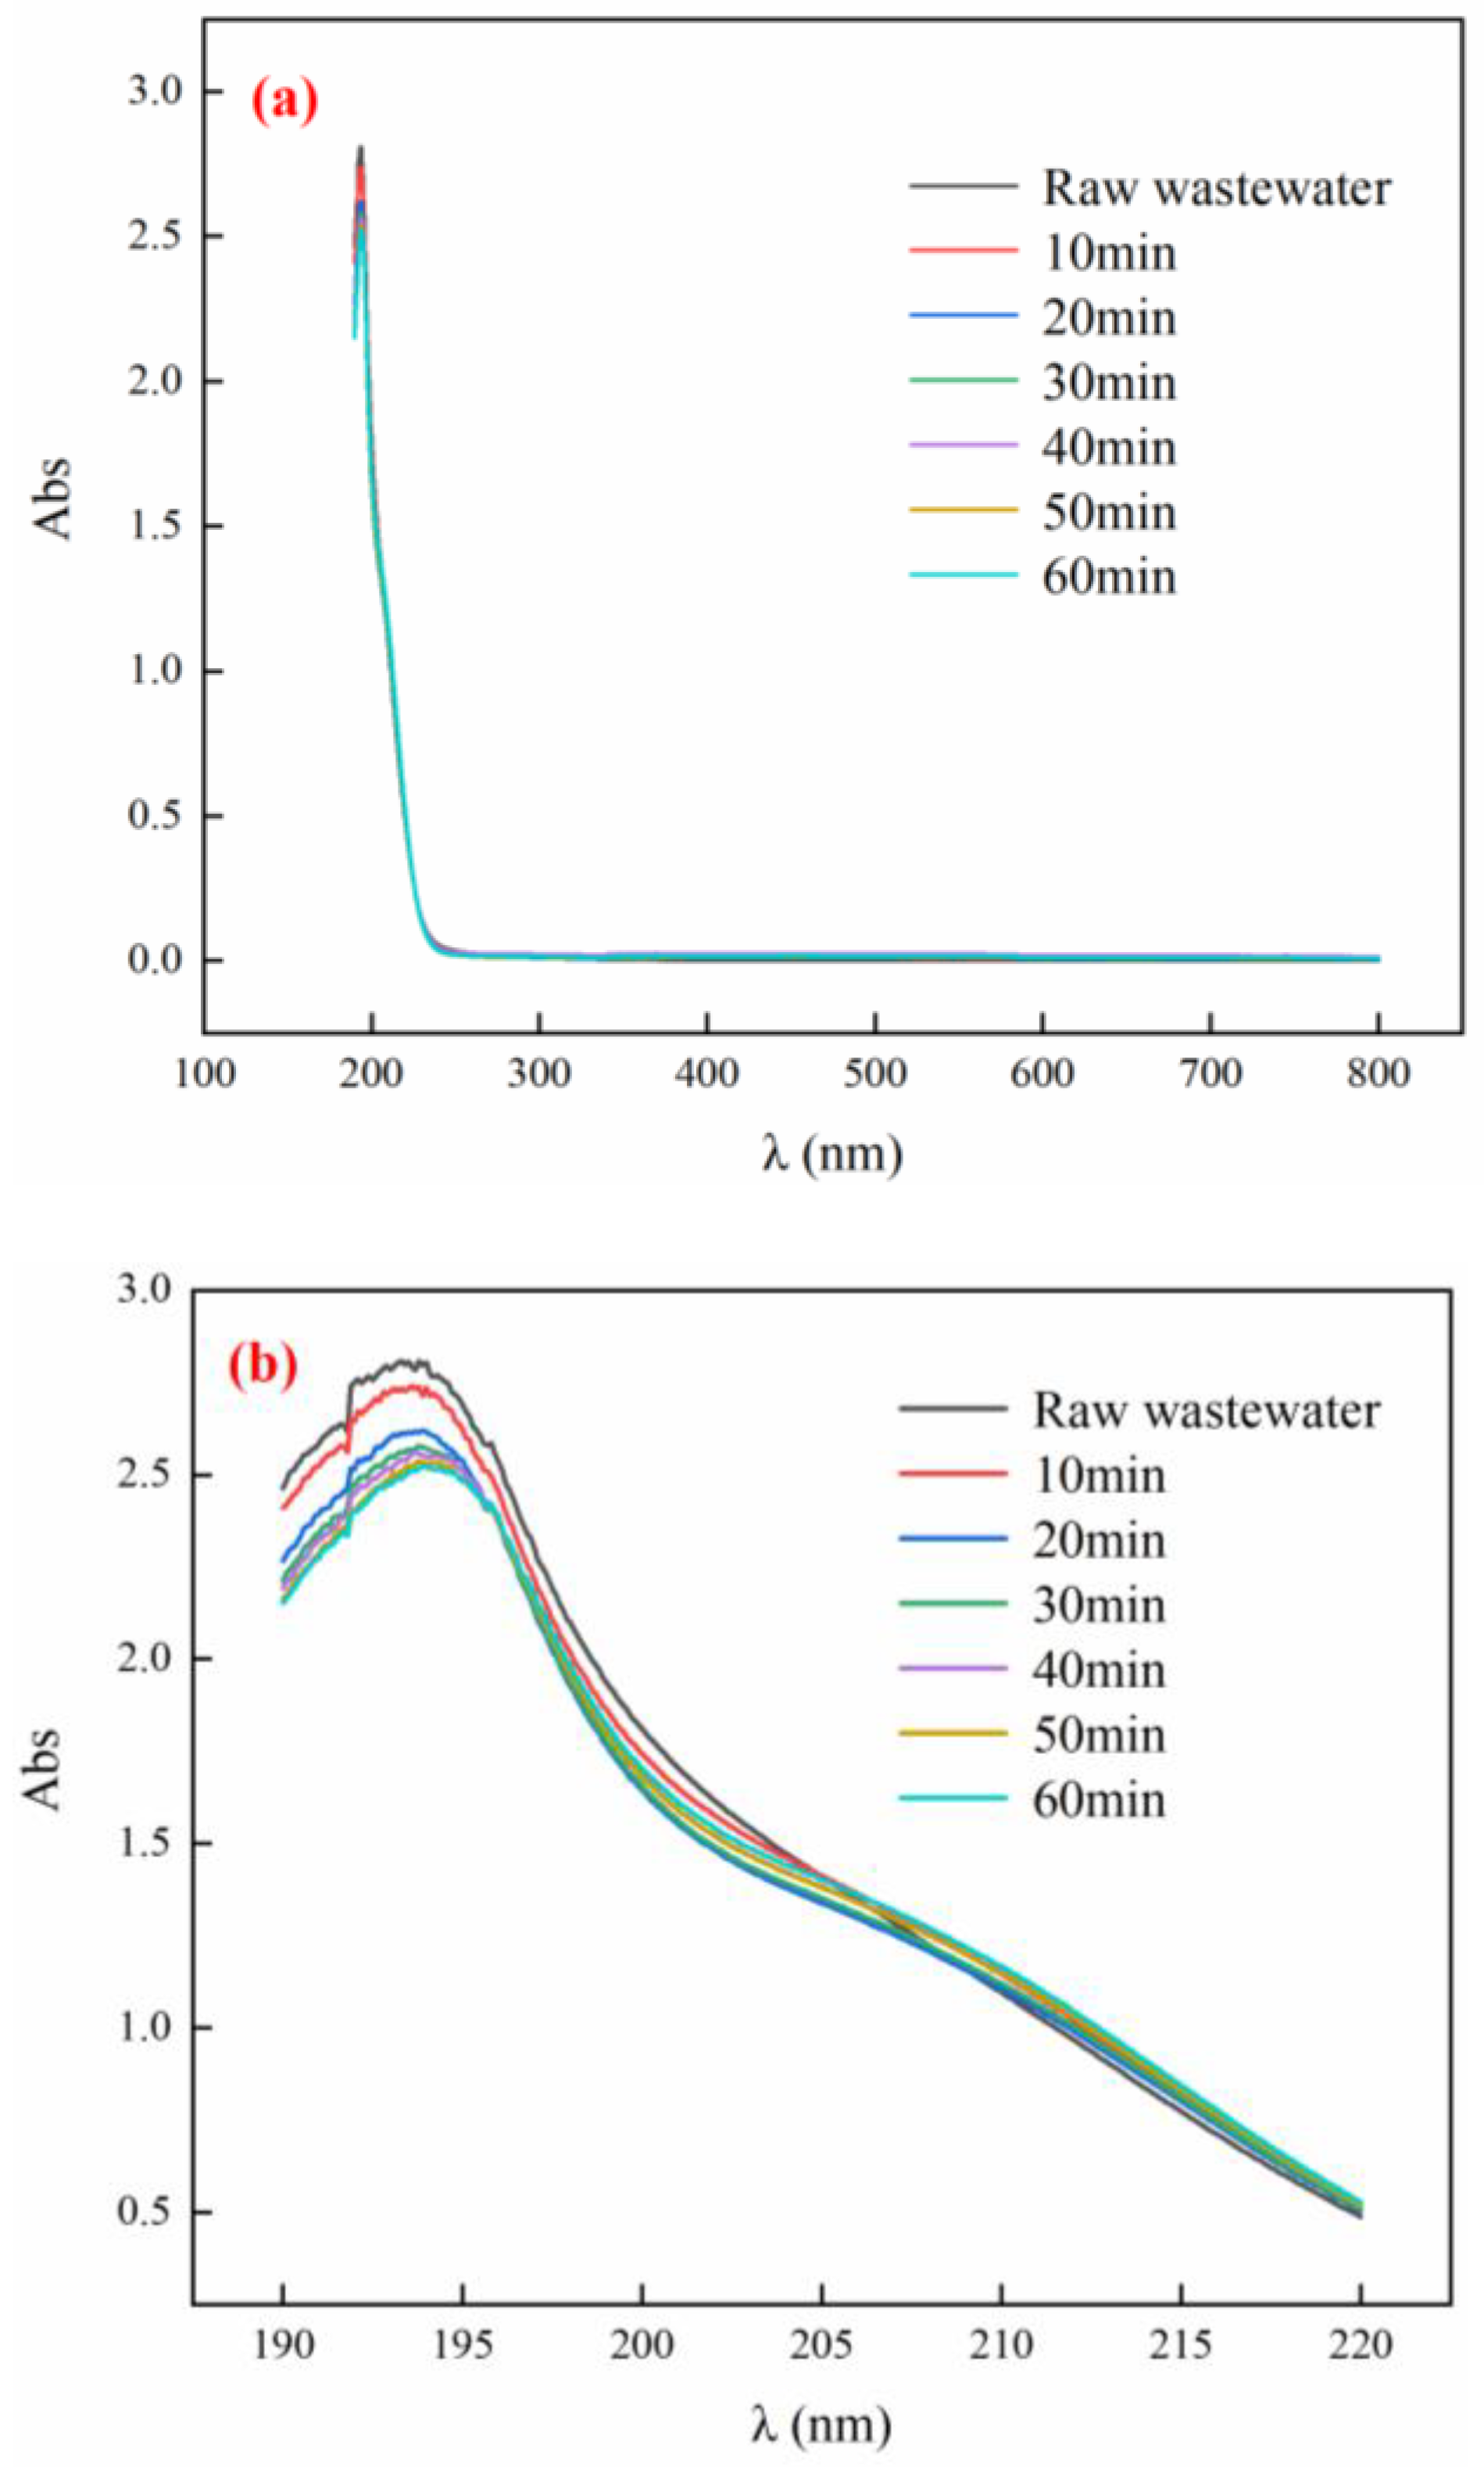
Figure 8 demonstrates that the UV absorption peak of the effluent sample treated with RO concentrated water has a significant decrease in the range of λ = 190–220 nm, indicating that the conjugated structure and unsaturated organic matter in the RO concentrated water are effectively degraded. In addition, after 60 min of reaction, the decrease in UV absorbance is small, indicating that most organic compounds have been degraded, the reaction rate of catalytic ozone oxidation has gradually become flat, and the number and peak of absorption peaks have also gradually stabilized. The reaction time was prolonged continuously, and the degradation effect was not large, which is consistent with the changing trend of COD removal efficiency. Therefore, UV absorbance can measure the catalytic performance of the Cu-Ce@γ-Al2O3 catalyst for the degradation of RO concentrated treated water.
3.6. 3D-EEM Spectrum Analysis of Tail Water
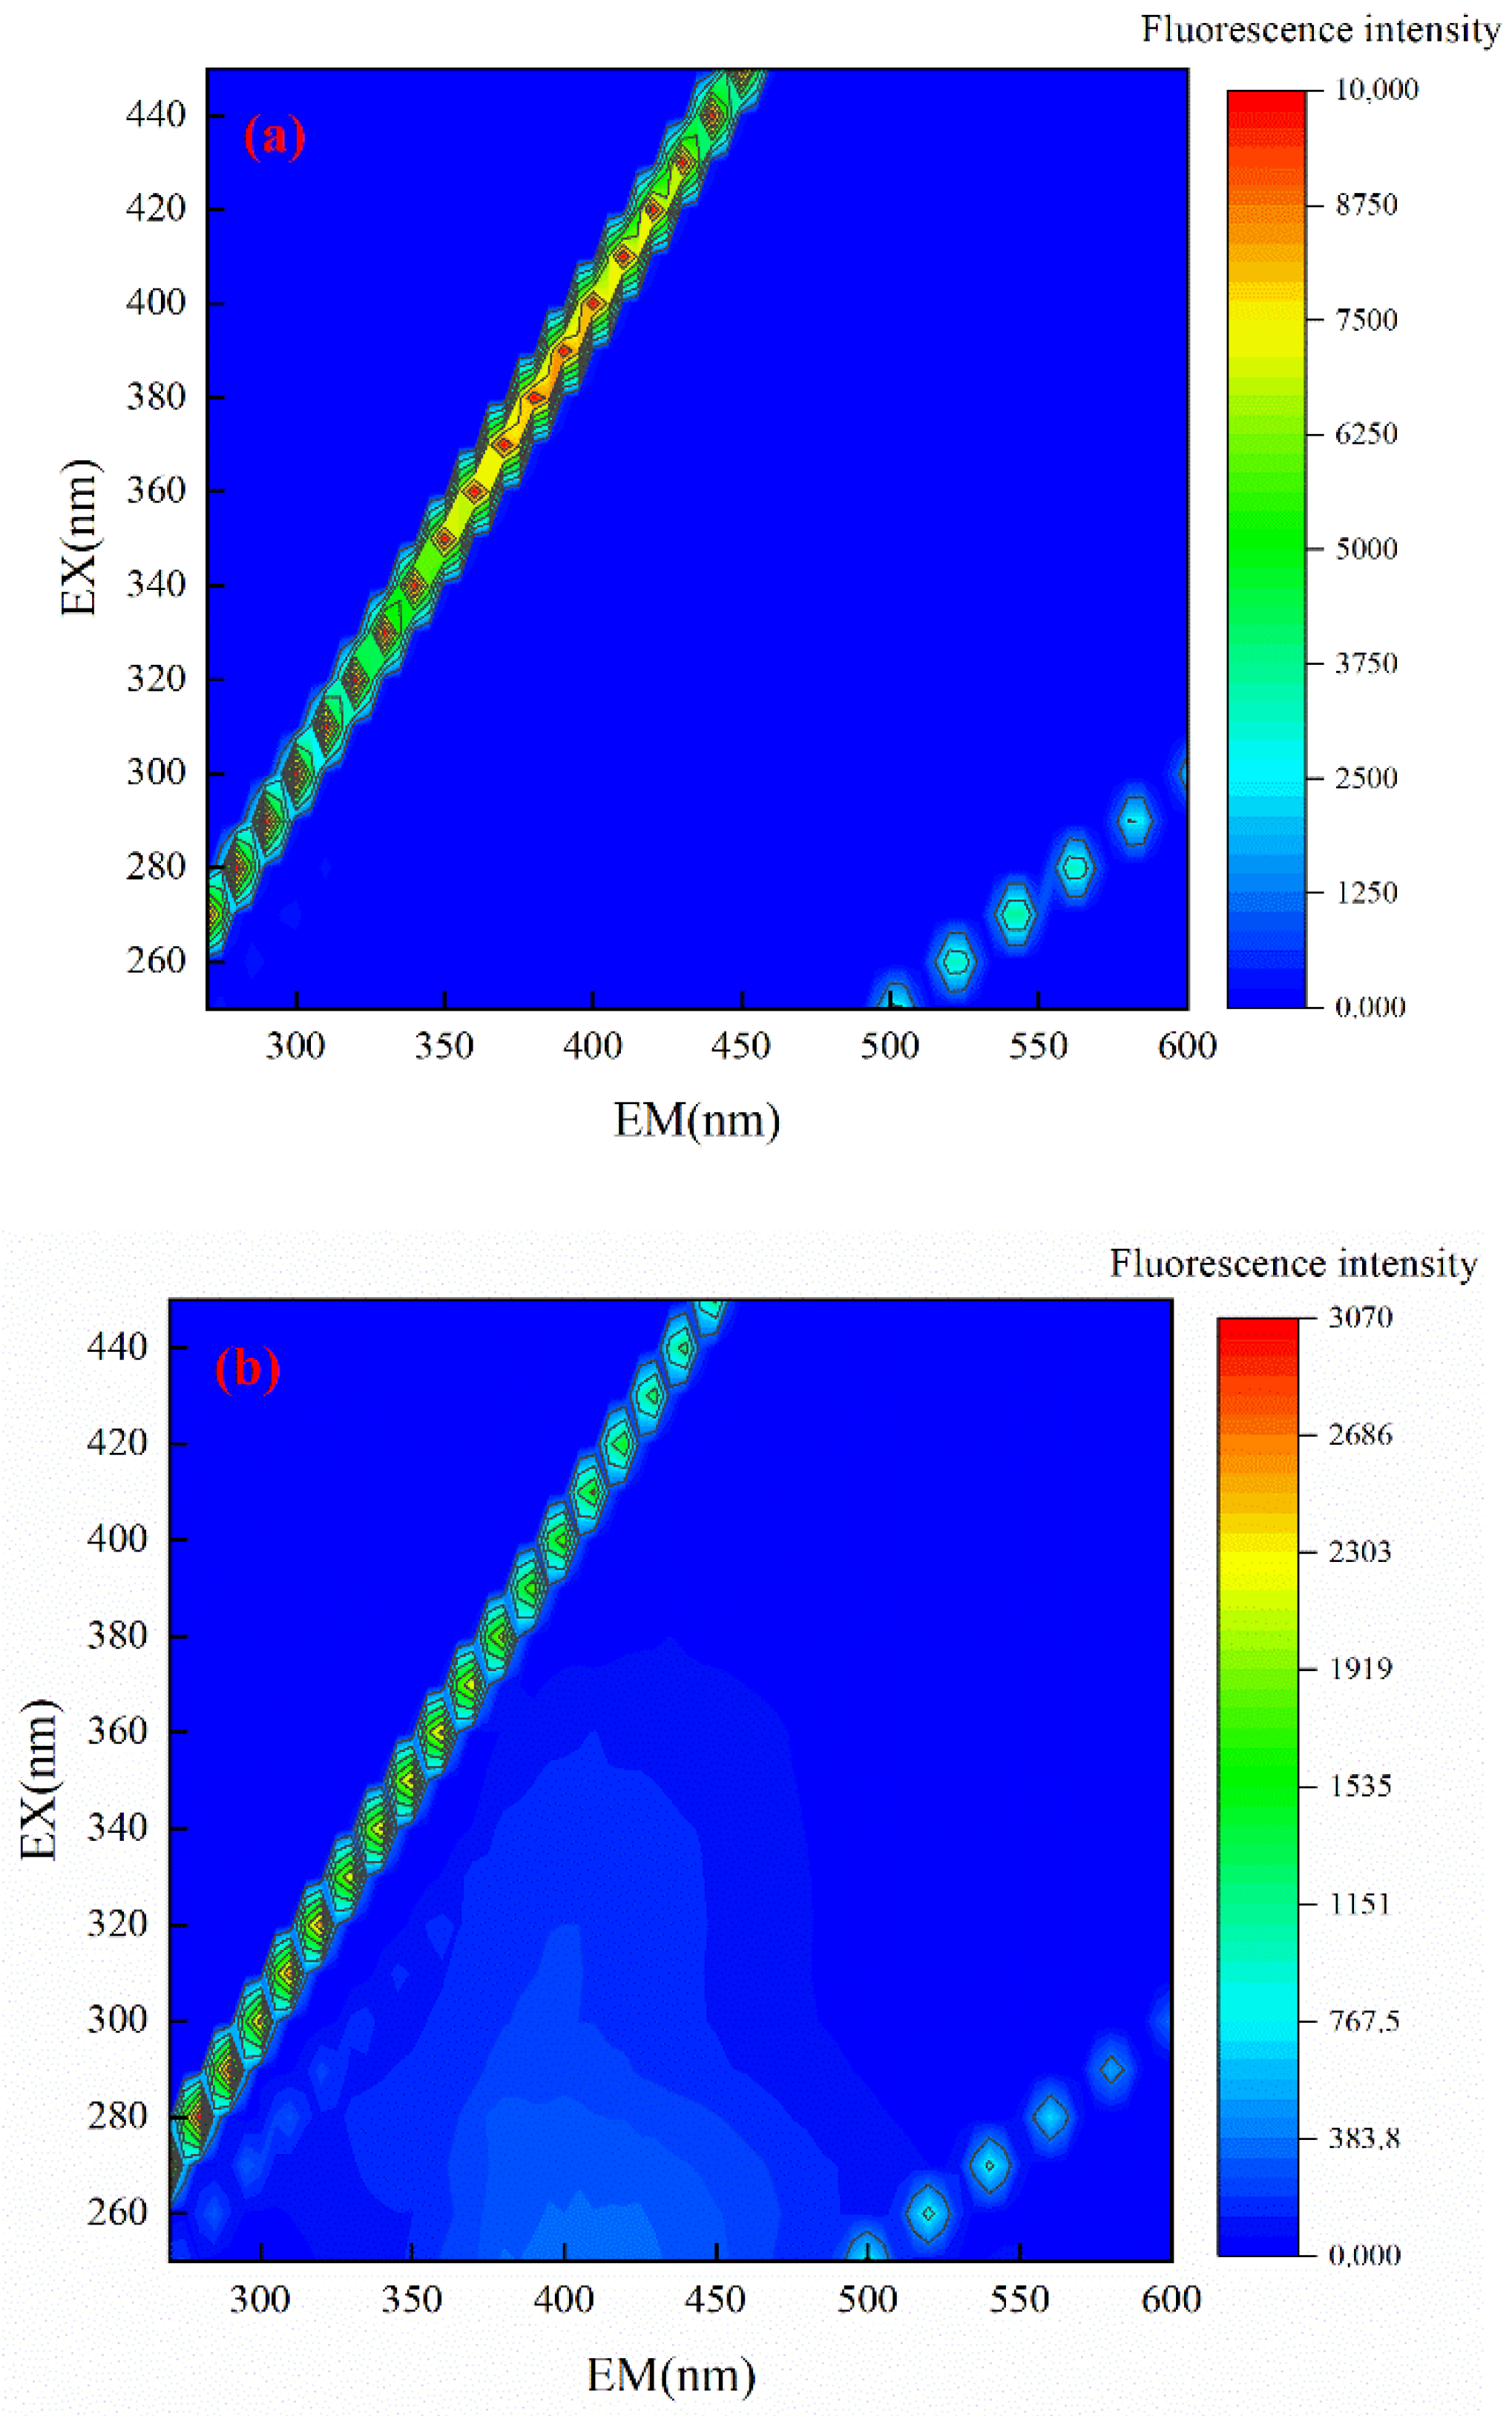
Figure 9 shows that the pollutants in RO concentrated water are mainly tryptophan-like organics and fulvic acid-like and humic-like acids, and the fluorescence intensity of tryptophan-like organics can reach up to 9850. After Cu-Ce @γ-Al2O3 ozone catalytic oxidation treatment of RO concentration for 60 min, fulvic acid-like and humic-like acids were effectively removed, and only tryptophan-like organic compounds remained. The maximum fluorescence intensity value is 3050. It shows that ozone catalytic oxidation has a good removal effect on these three types of substances. The unsaturated bonds of the three species are broken, resulting in a reduction of the fluorescent light peak. The comparison of 3D-EEM of the raw water and the treated water suggests that after the Cu-Ce@γ-Al2O3 ozone catalytic oxidation treatment, in addition to removing most of the pollutants, some weak fluorescence peaks still exist in the spectrum. This is due to the fact that some difficult intermediates are produced during the degradation of the large organic compounds in the RO concentrated water. However, such substances remain in the wastewater because of the limited reaction time [29].
3.7. Cu-Ce@γ-Al2O3 Catalyst Stability
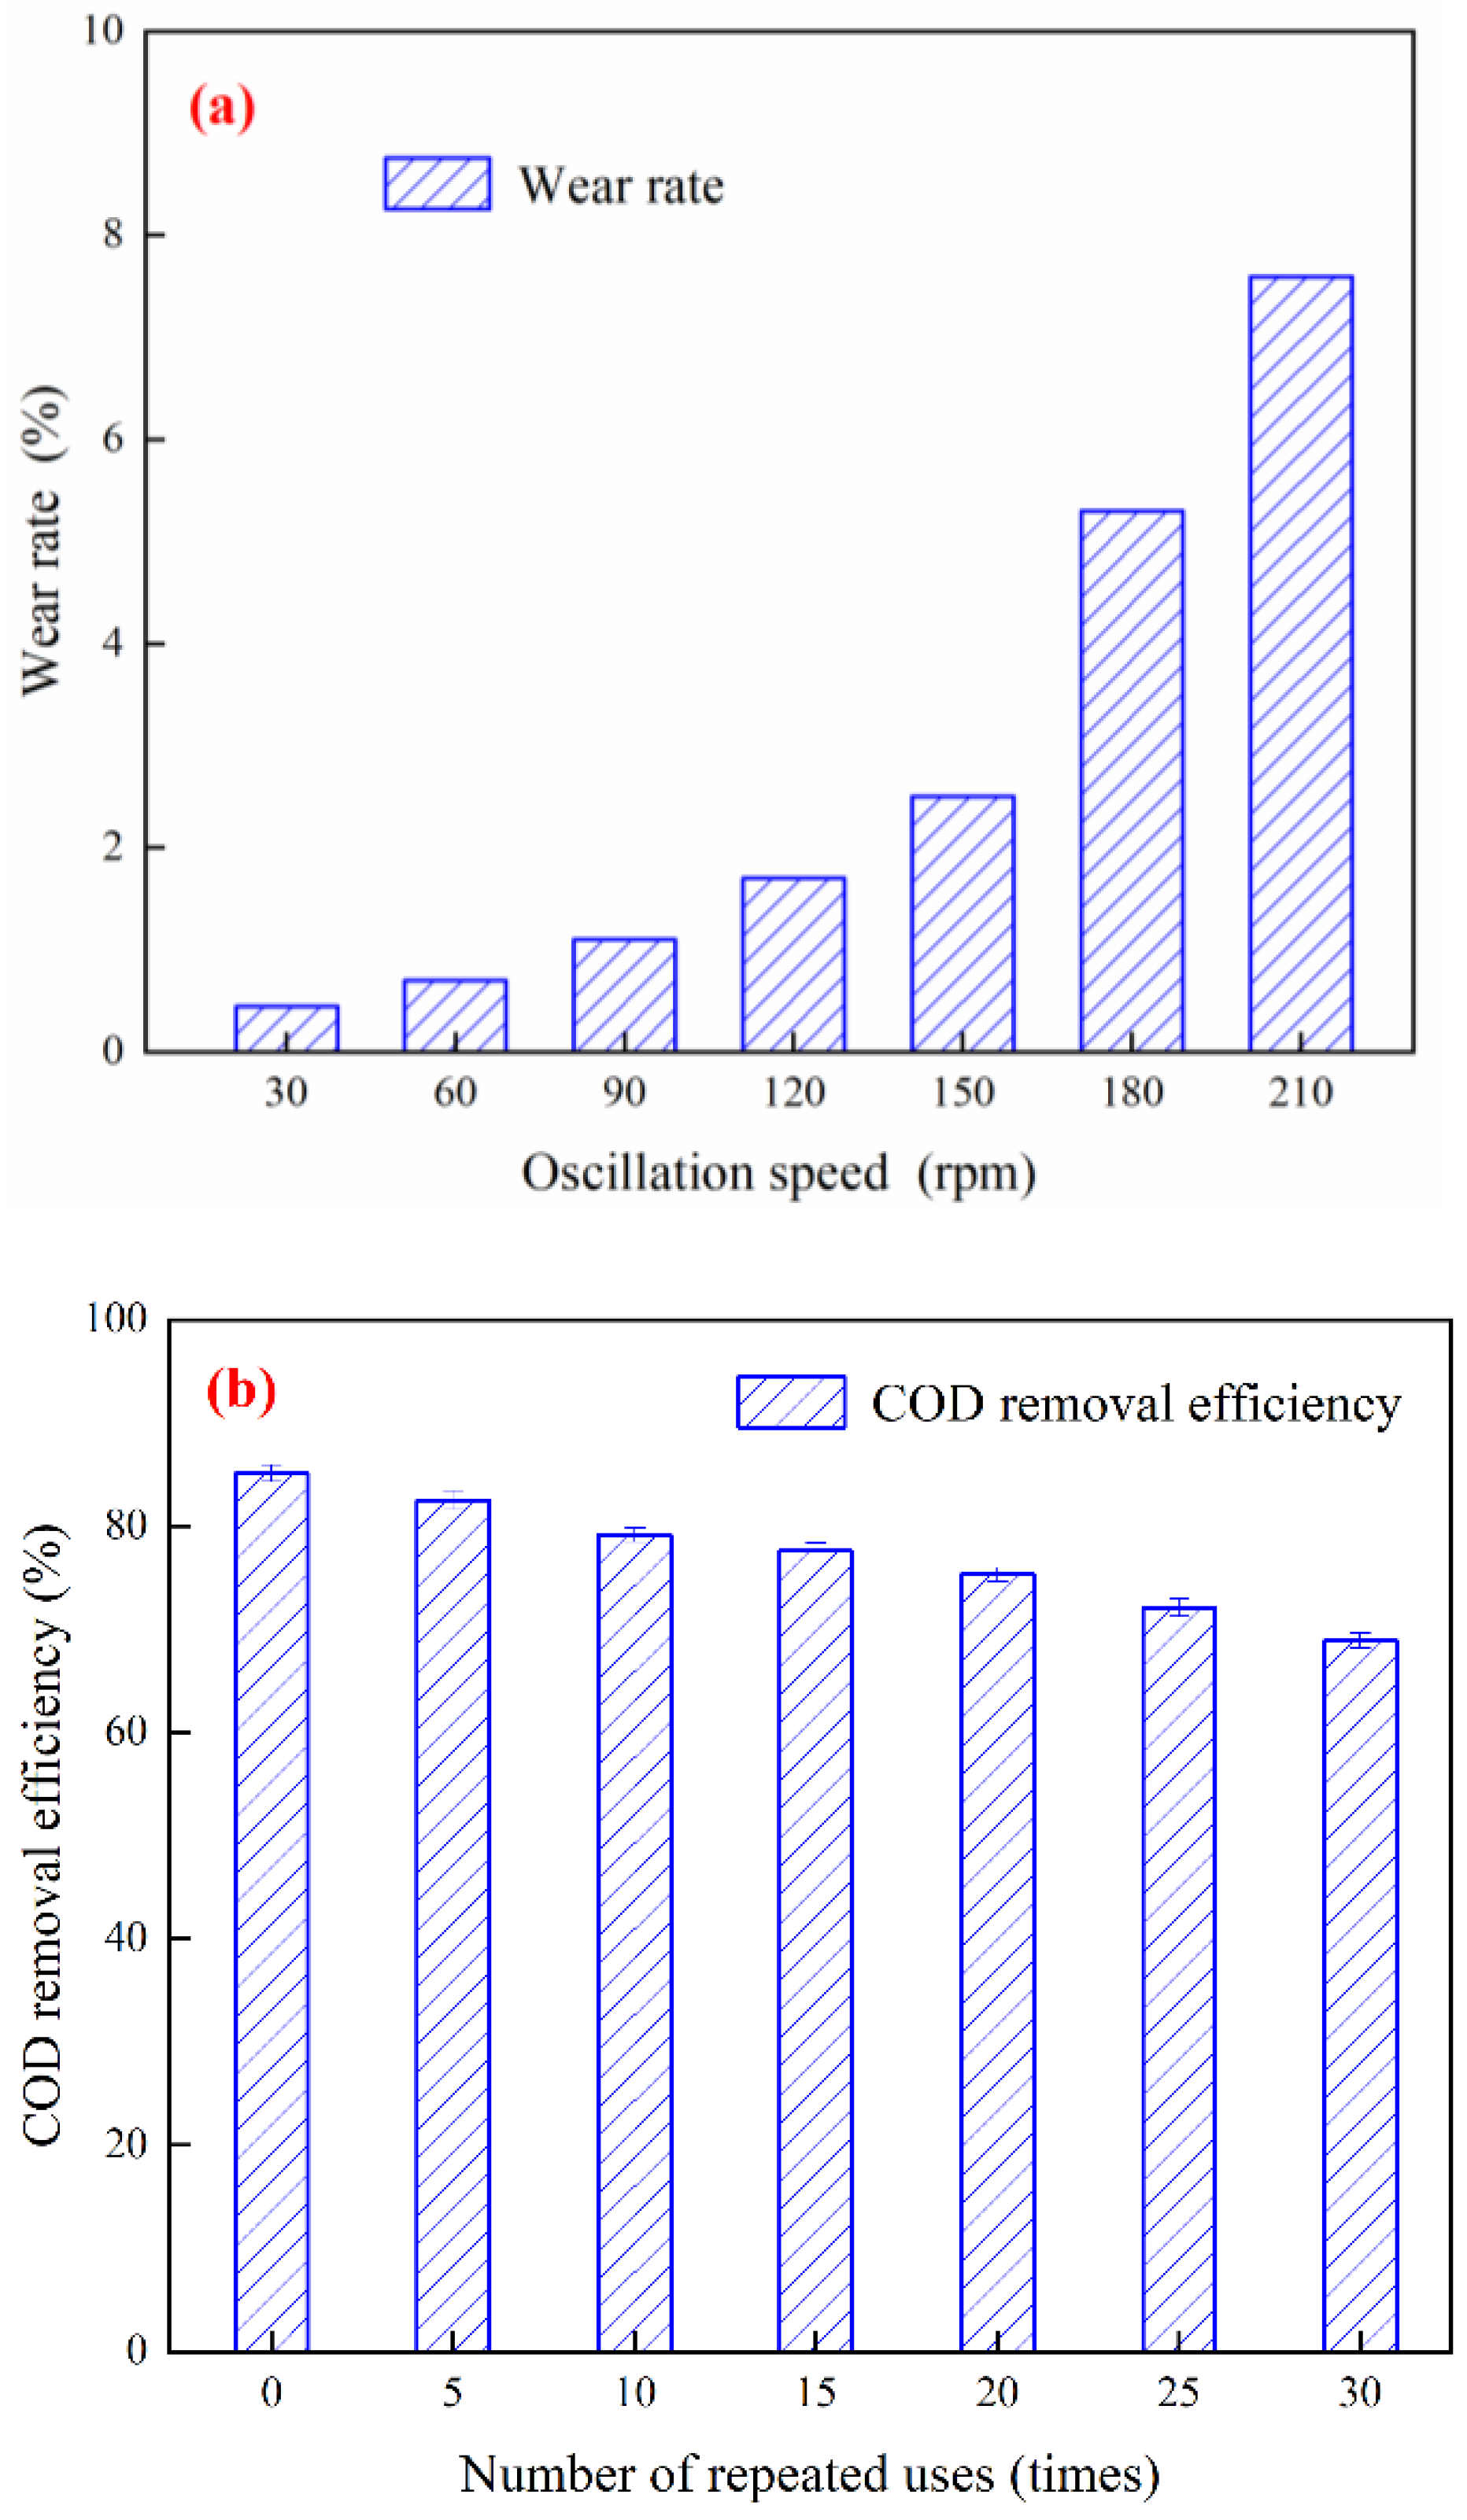
Figure 10a displays that when the dosage of the Cu-Ce@γ-Al2O3 catalyst is constant, the wear rate increases with the shaking speed of the shaker. The experimental results show that when the shaking speed is in the range of 20–150 rpm, the wear rate of the Cu-Ce@γ-Al2O3 catalyst increases slowly with the shaking speed of the shaking table. When the shaking speed was 20 rpm, the wear rate of the Cu-Ce@γ-Al2O3 catalyst was 0.45%, and when the oscillation speed was 150 rpm, the wear rate was 2.5%. When the oscillation speed was in the range of 150–210 rpm, the wear rate of the Cu-Ce@γ-Al2O3 catalyst increased rapidly. When the vibration speed was 180 rpm, the wear rate was 5.3%, and when the vibration speed was 210 rpm, the wear rate was 7.6%. At this time, the loss of Cu-Ce@γ-Al2O3 catalyst was serious, and more damaged catalysts appeared in the conical flask. In the practical application of Cu-Ce@γ-Al2O3 catalyst for the treatment of RO concentrated water, the friction strength of the catalyst caused by the ozone aeration device is weaker than that caused by the shaking speed of the water bath shaking table, and it is far smaller than the friction strength when the shaking speed of the water bath shaker is 150 rpm. Therefore, the loss of Cu-Ce@γ-Al2O3 catalyst in the practical application of RO concentrated water treatment is relatively small, meeting the wear and tear requirements of its practical application. Figure 10b shows that the performance of the Cu-Ce@γ-Al2O3 decreases slightly with the increase of reused times. The first-used Cu-Ce@γ-Al2O3 catalyst has a COD removal efficiency of 85.1% when treating RO concentrated water. After repeated use of Cu-Ce@γ-Al2O3 catalyst for 5 times, the COD removal efficiency of RO concentrated water became 82.5%, and the COD removal efficiency only decreased by 2.6%. After repeated use of Cu-Ce@γ-Al2O3 30 times, the COD removal efficiency of RO concentrated water is 68.9%, which still has a high removal efficiency. This is due to the reduction and separation of the active components on the surface of the Cu-Ce@γ-Al2O3 catalyst due to friction between the particles over a long period of time, and the loss of active components leads to a reduction in the performance of the Cu-Ce@γ-Al2O3 catalyst. However, the catalytic performance of the Cu-Ce@γ-Al2O3 catalyst did not decrease significantly after repeated use for 30 times. Therefore, its mechanical strength and catalytic activity are relatively stable, which has certain practical application significance.
3.8. Multilevel-Fuzzy Analysis Evaluation Model
The six indexes are classified according to quantitative and qualitative indexes. The quantitative indexes include the COD removal efficiency, catalyst dosage, ozone flow rate, height-diameter ratio, and reaction time, and the qualitative indexes include the reaction pH. The calculation of qualitative and quantitative indexes is shown in Text S3, and the summary of the experimental results of the Cu-Ce@γ-Al2O3 catalyst for oxidative degradation of RO concentrated water is presented in Table S10. The scores and ranking of each experimental order in the multilevel-fuzzy comprehensive evaluation can be seen in Table 4. Table 4 shows that the highest score in this evaluation is the 19th group (the experimental conditions are: the catalyst filling rate is 12%, the ozone flow rate is 0.2 L/min, the reaction pH is 9, and the H/D is 5, the reaction time is 60 min, the COD removal efficiency is 85.2%), ranking first. Under this working condition, resource consumption can be low, and the energy consumption and environmental impact are the lowest. Therefore, in the system of Cu-Ce@γ-Al2O3 catalyst for catalytic oxidation and degradation of RO concentrated water, the optimal operation conditions are as follows: the catalyst filling rate is 12%, the ozone flow rate is 0.2 L/min, the reaction pH is 9, the H/D is 5, and the reaction time is 60 min.
In comparison, the performance and degradation of other wastewater by catalytic oxidation processes were evaluated in this study (Table 5). In view of the results and AHP model analysis, it can be seen that the Cu-Ce@γ-Al2O3 catalyst exhibited higher catalytic ozonation capacity, suggesting that the Cu-Ce@γ-Al2O3 catalyst is a promising catalyst for the treatment of RO concentrate.
4. Conclusions
The cu-Ce@γ-Al2O3 catalyst was prepared using activated alumina as a carrier, and the RO concentrated water was treated by heterogeneous ozone catalytic oxidation technology. The optimal working conditions and the degradation mechanism of the Cu-Ce@γ-Al2O3 catalyst catalytic oxidation system were systematically explored to treat RO concentrated water. The optimal preparation conditions of the Cu-Ce@γ-Al2O3 catalyst are presented as follows: the active metal loading ratio is Cu:Ce = 2:1, the calcining temperature is 600 °C, and the roasting time is 5.0 h. Through characterization, activated alumina supported with Cu and Ce in the form of CuO and CeO2 was observed. The optimal working conditions for Cu-Ce@γ-Al2O3 ozone catalytic oxidation treatment of RO concentrated water system was optimized and screened. The decline of COD removal caused by TBA indicated that the degradation process follows the reaction mechanism of •OH. UV spectroscopic analysis and 3D-EEM analysis showed that most organic substances were almost degraded after catalytic ozonation treatment. However, a few organic substances were residual as protein-like fluorophores and fluorophores and tryptophan-like and other new substances. The Cu-Ce@γ-Al2O3 exhibited excellent stability. The mechanical strength and catalytic activity of the Cu-Ce@γ-Al2O3 catalyst are relatively stable. The results of the multilevel-fuzzy analysis evaluation model show that the optimal working conditions of the Cu-Ce@γ-Al2O3 for catalytic oxidation and degradation of RO concentrated water is as follows: the catalyst filling rate is 12%, the ozone flow rate is 0.2 L/min, the reaction pH is 9, the H/D is 5, and the reaction time is 60 min. The Cu-Ce@γ-Al2O3-catalyzed ozone oxidative degradation in the RO concentrated water treatment reaction system has a good treatment effect and stability. It provides theoretical support for the practical treatment of saline wastewater.
Supplementary Materials
The following supporting information can be downloaded at: https://www.mdpi.com/article/10.3390/w14182881/s1, Figure S1: Comprehensive evaluation index system of Cu-Ce@γ-Al2O3 catalysts for catalytic oxidative degradation of RO concentrated water; Figure S2: Effect of different reaction systems on COD removal efficiency; Figure S3: Effect of active component proportion on COD removal efficiency; Figure S4: Effect of calcination temperature on COD removal efficiency; Figure S5: Effect of calcination time on COD removal efficiency; Figure S6: XPS characterization: (a) Cu2p spectrum, (b) Ce2d spectrum, (c) Cu2p spectrum after repeated use 30 times, (d) Ce2d spectrum after repeated use 30 times; Table S1: 1–9 scaling method; Table S2: The judgment matrix of criterion layer to target layer; Table S3: Judgment matrix for environmental impact at the scheme layer; Table S4: Judgment matrix for resource consumption at the scheme layer; Table S5: Judgment matrix for energy consumption at the scheme layer; Table S6: The value standard of RI; Table S7: Consistency test; Table S8: The total ranking weight of each index layer; Table S9: Qualitative index evaluation standard; Table S10: Summary of experimental data; Table S11: BET characterization of Cu-Ce@γ-Al2O3 catalyst; Text S1: Catalyst wear rate; Text S2: Ozone utilization; Text S3: The calculation of index weight and consistency check, the calculation of index membership, and the structure of factor evaluation set R.
Author Contributions
Conceptualization, W.S., L.D., Y.S. and J.Z.; methodology, W.S., Y.S. and J.Z.; software, Z.X. and J.Z.; validation, W.S., Y.S. and J.Z.; formal analysis, W.S. and J.Z.; investigation, W.S. and L.D.; resources, Y.S. and J.Z.; data curation, W.S. and J.Z.; writing—original draft preparation, W.S., Z.X. and J.Z.; writing—review and editing, W.S. and J.Z.; visualization, W.S. and J.Z.; supervision, W.S. and J.Z.; project administration, W.S. and J.Z.; funding acquisition, W.S. and Y.S. All authors have read and agreed to the published version of the manuscript.
Funding
This research was supported by the National Natural Science Foundation of China (No. 51508268), Natural Science Foundation of Jiangsu Province in China (No. BK20201362), and the 2018 Six Talent Peaks Project of Jiangsu Province (JNHB-038).
Data Availability Statement
The data presented in this study are available on request from the corresponding author.
Conflicts of Interest
The authors declare no conflict of interest.
References
- Chen, Y.; Li, S.; Hu, J. Photoelectrocatalytic degradation of organics and formation of disinfection byproducts in reverse osmosis concentrate. Water Res. 2020, 168, 115105. [Google Scholar] [CrossRef] [PubMed]
- Zhang, Z.; Lokare, O.R.; Gusa, A.V.; Vidic, R.D. Pretreatment of brackish water reverse osmosis (BWRO) concentrate to enhance water recovery in inland desalination plants by direct contact membrane distillation (DCMD). Desalination 2021, 508, 115050. [Google Scholar] [CrossRef]
- Song, W.; Li, N.; Ding, S.; Wang, X.; Li, H.; Zhang, Y.; Feng, X.; Lu, J.; Ding, J. Nanofiltration desalination of reverse osmosis concentrate pretreated by advanced oxidation with ultrafiltration: Response surface optimization and exploration of membrane fouling. J. Environ. Chem. Eng. 2021, 9, 106340. [Google Scholar] [CrossRef]
- Zhang, Y.; Tang, W.; Bai, J.; Li, J.; Wang, J.; Zhou, T.; Guan, X.; Zhou, B. Highly efficient removal of total nitrogen and dissolved organic compound in waste reverse osmosis concentrate mediated by chlorine radical on 3D Co3O4 nanowires anode. J. Hazard. Mater. 2022, 424, 127662. [Google Scholar] [CrossRef] [PubMed]
- Wang, X.; Xia, J.; Ding, S.; Zhang, S.; Li, M.; Shang, Z.; Lu, J.; Ding, J. Removing organic matters from reverse osmosis concentrate using advanced oxidation-biological activated carbon process combined with Fe3+/humus-reducing bacteria. Ecotox. Environ. Safe 2020, 203, 110945. [Google Scholar] [CrossRef] [PubMed]
- Umar, M.; Roddick, F.; Fan, L. Effect of coagulation on treatment of municipal wastewater reverse osmosis concentrate by UVC/H2O2. J. Hazard. Mater. 2014, 266, 10–18. [Google Scholar] [CrossRef]
- Gong, C.; Ren, X.; Han, J.; Wu, Y.; Gou, Y.; Zhang, Z.; He, P. Toxicity reduction of reverse osmosis concentrates from petrochemical wastewater by electrocoagulation and Fered-Fenton treatments. Chemosphere 2022, 286, 131582. [Google Scholar] [CrossRef]
- Xiao, H.; Wu, J.; Wang, X.; Wang, J.; Mo, S.; Fu, M.; Chen, L.; Ye, D. Ozone-enhanced deep catalytic oxidation of toluene over a platinum-ceria-supported BEA zeolite catalyst. Mol Catal. 2018, 460, 7–15. [Google Scholar] [CrossRef]
- Zhou, M.; Tan, Q.; Wang, Q.; Jiao, Y.; Oturan, N.; Oturan, M.A. Degradation of organics in reverse osmosis concentrate by electro-Fenton process. J. Hazard. Mater. 2012, 215–216, 287–293. [Google Scholar] [CrossRef]
- Kasprzyk-Hordern, B.; Ziolek, M.; Nawrocki, J. Catalytic ozonation and methods of enhancing molecular ozone reactions in water treatment. Appl. Catal. B Environ. 2003, 46, 639–669. [Google Scholar] [CrossRef]
- Zhao, L.; Sun, Z.; Ma, J. Novel relationship between hydroxyl radical initiation and surface group of ceramic honeycomb supported metals for the catalytic ozonation of nitrobenzene in aqueous solution. Environ. Sci. Technol. 2009, 43, 4157–4163. [Google Scholar] [CrossRef] [PubMed]
- He, Y.; Wang, L.; Chen, Z.; Huang, X.; Wang, X.; Zhang, X.; Wen, X. Novel catalytic ceramic membranes anchored with MnMe oxide and their catalytic ozonation performance towards atrazine degradation. J. Membrane Sci. 2022, 648, 120362. [Google Scholar] [CrossRef]
- Ikhlaq, A.; Brown, D.R.; Kasprzyk-Hordern, B. Catalytic ozonation for the removal of organic contaminants in water on alumina. Appl. Catal. B Environ. 2015, 165, 408–418. [Google Scholar] [CrossRef]
- Li, P.; Miao, R.; Wang, P.; Sun, F.; Li, X. Bi-metal oxide-modified flat-sheet ceramic membranes for catalytic ozonation of organic pollutants in wastewater treatment. Chem. Eng. J. 2021, 426, 131263. [Google Scholar] [CrossRef]
- Xu, Y.; Lin, Z.; Zheng, Y.; Dacquin, J.; Royer, S.; Zhang, H. Mechanism and kinetics of catalytic ozonation for elimination of organic compounds with spinel-type CuAl2O4 and its precursor. Sci. Total Environ. 2019, 651, 2585–2596. [Google Scholar] [CrossRef] [PubMed]
- Pang, L.; Fan, C.; Shao, L.; Song, K.; Yi, J.; Cai, X.; Wang, J.; Kang, M.; Li, T. The Ce doping Cu/ZSM-5 as a new superior catalyst to remove NO from diesel engine exhaust. Chem. Eng. J. 2014, 253, 394–401. [Google Scholar] [CrossRef]
- Chen, C.; Li, Y.; Ma, W.; Guo, S.; Wang, Q.; Li, Q.X. Mn-Fe-Mg-Ce loaded Al2O3 catalyzed ozonation for mineralization of refractory organic chemicals in petroleum refinery wastewater. Sep. Purif. Technol. 2017, 183, 1–10. [Google Scholar] [CrossRef]
- Nemati Sani, O.; Navaei Fezabady, A.A.; Yazdani, M.; Taghavi, M. Catalytic ozonation of ciprofloxacin using γ-Al2O3 nanoparticles in synthetic and real wastewaters. J. Water Process Eng. 2019, 32, 100894. [Google Scholar] [CrossRef]
- Xiao, J.; Xie, Y.; Cao, H. Organic pollutants removal in wastewater by heterogeneous photocatalytic ozonation. Chemosphere 2015, 121, 1–17. [Google Scholar] [CrossRef]
- Qi, F.; Xu, B.; Chen, Z.; Feng, L.; Zhang, L.; Sun, D. Catalytic ozonation of 2-isopropyl-3-methoxypyrazine in water by γ-AlOOH and γ-Al2O3: Comparison of removal efficiency and mechanism. Chem. Eng. J. 2013, 219, 527–536. [Google Scholar] [CrossRef]
- Li, X.; Chen, W.; Tang, Y.; Li, L. Relationship between the structure of Fe-MCM-48 and its activity in catalytic ozonation for diclofenac mineralization. Chemosphere 2018, 206, 615–621. [Google Scholar] [CrossRef]
- Li, Y.; Wu, L.; Wang, Y.; Ke, P.; Xu, J.; Guan, B. γ-Al2O3 doped with cerium to enhance electron transfer in catalytic ozonation of phenol. J. Water Process Eng. 2020, 36, 101313. [Google Scholar] [CrossRef]
- Li, X.; Ma, J.; Zhang, C.; Zhang, R.; He, H. Detrimental role of residual surface acid ions on ozone decomposition over Ce-modified γ-MnO2 under humid conditions. J. Environ. Sci.-China 2020, 91, 43. [Google Scholar] [CrossRef] [PubMed]
- Peng, J.; Lai, L.; Jiang, X.; Jiang, W.; Lai, B. Catalytic ozonation of succinic acid in aqueous solution using the catalyst of Ni/Al2O3 prepared by electroless plating-calcination method. Sep. Purif. Technol. 2018, 195, 138–148. [Google Scholar] [CrossRef]
- Zhu, H.; Ma, W.; Han, H.; Han, Y.; Ma, W. Catalytic ozonation of quinoline using nano-MgO: Efficacy, pathways, mechanisms and its application to real biologically pretreated coal gasification wastewater. Chem. Eng. J. 2017, 327, 91–99. [Google Scholar] [CrossRef]
- Xing, S.; Lu, X.; Liu, J.; Zhu, L.; Ma, Z.; Wu, Y. Catalytic ozonation of sulfosalicylic acid over manganese oxide supported on mesoporous ceria. Chemosphere 2016, 144, 7–12. [Google Scholar] [CrossRef]
- Wang, Y.; Yang, W.; Yin, X.; Liu, Y. The role of Mn-doping for catalytic ozonation of phenol using Mn/γ-Al2O3 nanocatalyst: Performance and mechanism. J. Environ. Chem. Eng. 2016, 4, 3415–3425. [Google Scholar] [CrossRef]
- Khataee, A.; Rad, T.S.; Fathinia, M. The role of clinoptilolite nanosheets in catalytic ozonation process: Insights into the degradation mechanism, kinetics and the toxicity. J. Taiwan Inst. Chem. E 2017, 77, 205–215. [Google Scholar] [CrossRef]
- Li, C.; Jiang, F.; Sun, D.; Qiu, B. Catalytic ozonation for advanced treatment of incineration leachate using (MnO2-Co3O4)/AC as a catalyst. Chem. Eng. J. 2017, 325, 624–631. [Google Scholar] [CrossRef]
- Fang, F.; Han, H. Effect of catalytic ozonation coupling with activated carbon adsorption on organic compounds removal treating RO concentrate from coal gasification wastewater. Ozone Sci. Eng. 2018, 40, 275–283. [Google Scholar] [CrossRef]
- Wang, L.; Liu, A.; Zhang, Z.; Zhao, B.; Xia, Y.; Tan, Y. Catalytic ozonation of thymol in reverse osmosis concentrate with core/shell Fe3O4@SiO2@Yb2O3 catalyst: Parameter optimization and degradation pathway. Chin. J. Chem. Eng. 2017, 25, 665–670. [Google Scholar] [CrossRef]
- Yang, L.; Sheng, M.; Li, Y.; Xue, W.; Li, K.; Cao, G. A hybrid process of Fe-based catalytic ozonation and biodegradation for the treatment of industrial wastewater reverse osmosis concentrate. Chemosphere 2020, 238, 124639. [Google Scholar] [CrossRef]
- Kong, X.; Garg, S.; Chen, G.; Li, W.; Wang, Y.; Wang, J.; Ma, J.; Yuan, Y.; Waite, T.D. Coal chemical industry membrane concentrates: Characterisation and treatment by ozonation and catalytic ozonation processes. Environ Chem. 2022. [Google Scholar] [CrossRef]
- Lin, L.; Wang, H.; Luo, H.; Xu, P. Photocatalytic treatment of desalination concentrate using optical fibers coated with nanostructured thin films: Impact of water chemistry and seasonal climate variations. Photochem. Photobiol. 2016, 92, 379–387. [Google Scholar] [CrossRef] [PubMed]
- Sun, W.; Sun, Y.; Zhu, H.; Zheng, H. Catalytic activity and evaluation of Fe-Mn@Bt for ozonizing coal chemical biochemical tail water. Sep. Purif. Technol. 2020, 239, 116524. [Google Scholar] [CrossRef]
Figure 1.
The schematic diagram of the catalytic ozone oxidation system.

Figure 2.
SEM characterization of catalysts (×5000, ×10,000, ×20,000 from left to right).

Figure 3.
Characterization of the catalyst in different states: (a) XRD, (b) XPS.

Figure 4.
Adsorption and desorption isotherms of Cu-Ce@γ-Al2O3 catalyst: (a) γ-Al2O3, (b) Cu-Ce@γ-Al2O3, (c) Cu-Ce@γ-Al2O3 after utilization 30 times.
Figure 4.
Adsorption and desorption isotherms of Cu-Ce@γ-Al2O3 catalyst: (a) γ-Al2O3, (b) Cu-Ce@γ-Al2O3, (c) Cu-Ce@γ-Al2O3 after utilization 30 times.

Figure 5.
Effects of different conditions on COD removal efficiency: (a) reaction time, (b) pH, (c) ozone aeration, (d) catalyst filling rate, (e) reaction column height-diameter ratio.
Figure 5.
Effects of different conditions on COD removal efficiency: (a) reaction time, (b) pH, (c) ozone aeration, (d) catalyst filling rate, (e) reaction column height-diameter ratio.


Figure 6.
Ozone utilization rate: (a) ozone system, (b) catalytic ozone oxidation system.

Figure 7.
Effect of TBA dosage on COD removal efficiency: (a) ozone system, (b) ozone catalytic oxidation system.
Figure 7.
Effect of TBA dosage on COD removal efficiency: (a) ozone system, (b) ozone catalytic oxidation system.

Figure 8.
UV-Vis analysis results: (a) 190~1100 nm, (b) 190~220 nm.

Figure 9.
3D-EEM: (a) RO concentrated water, (b) effluent after 60 min degradation of RO concentrated water.
Figure 9.
3D-EEM: (a) RO concentrated water, (b) effluent after 60 min degradation of RO concentrated water.

Figure 10.
Catalyst stability (a) wear resistance analysis of Cu-Ce@γ-Al2O3 catalyst, (b) effect of repeated use on COD removal efficiency.
Figure 10.
Catalyst stability (a) wear resistance analysis of Cu-Ce@γ-Al2O3 catalyst, (b) effect of repeated use on COD removal efficiency.


Table 1.
RO concentrated water quality.
| Index | Unit | Content | Method |
|---|---|---|---|
| COD | mg/L | 146.6 | Potassium dichromate method |
| Ammonia nitrogen | mg/L | 2.5 | Nessler’s reagent colorimetry |
| pH | / | 7.49 | pH meter |
| Turbidity | mg/L | 0.25 | Turbidimeter |
| Chroma | NTU | 1.5 | Colorimeter |
| Total nitrogen | mg/L | 10.2 | UV spectrophotometry |
| Total phosphorus | mg/L | 0.95 | UV spectrophotometry |
| Conductivity | us/cm | 1695 | Conductivity meter |
Table 2.
EDS characterization of Cu-Ce@γ-Al2O3 catalyst.
| Sample | γ-Al2O3 | Cu-Ce@γ-Al2O3 | Cu-Ce@γ-Al2O3 after Utilization 30 Times | |||
|---|---|---|---|---|---|---|
| Element | Weight percent (%) | Atomic percent (%) | Weight percent (%) | Atomic percent (%) | Weight percent (%) | Atomic percent (%) |
| OK | 44.48 | 59.82 | 42.58 | 56.83 | 45.21 | 60.73 |
| AlK | 44.18 | 38.42 | 40.32 | 35.19 | 38.08 | 33.75 |
| CK | 10.13 | 1.85 | 9.24 | 3.81 | 8.39 | 3.62 |
| CuK | / | / | 3.42 | 1.16 | 3.23 | 1.04 |
| CeK | / | / | 3.92 | 0.60 | 3.59 | 0.54 |
Table 3.
XRF characterization of Cu-Ce@γ-Al2O3 catalyst (wt.%).
| Sample | Na2O | Al2O3 | SiO2 | CaO | Fe2O3 | SO3 | CuO | CeO2 |
|---|---|---|---|---|---|---|---|---|
| γ-Al2O3 (%) | 0.33 | 98.93 | 0.07 | 0.12 | 0.03 | 0.07 | / | / |
| Cu-Ce@γ-Al2O3 (%) | 0.11 | 87.29 | 0.06 | 0.07 | 0.02 | 0.08 | 6.25 | 6.44 |
| Cu-Ce@γ-Al2O3 after utilization 30 times (%) | 0.29 | 85.53 | 0.21 | 0.29 | 0.02 | 0.50 | 5.85 | 6.36 |
Table 4.
Comprehensive evaluation score and ranking of each experiment order.
| Serial Number | Environmental Impact T1 | Resource Consumption T2 | Energy Consumption T3 | Overall Score | Scoring Order |
|---|---|---|---|---|---|
| 1 | 0.0661 | 0.1626 | 0.1634 | 0.3921 | 17 |
| 2 | 0.2007 | 0.1626 | 0.0812 | 0.4444 | 14 |
| 3 | 0.3726 | 0.1626 | 0.0403 | 0.5755 | 10 |
| 4 | 0.3846 | 0.1626 | 0.0200 | 0.5672 | 11 |
| 5 | 0.0908 | 0.1495 | 0.0403 | 0.2805 | 22 |
| 6 | 0.1025 | 0.1535 | 0.0403 | 0.2963 | 21 |
| 7 | 0.2196 | 0.1603 | 0.0403 | 0.4202 | 16 |
| 8 | 0.4055 | 0.1718 | 0.0403 | 0.6176 | 8 |
| 9 | 0.4164 | 0.1912 | 0.0403 | 0.6179 | 3 |
| 10 | 0.1834 | 0.2055 | 0.0403 | 0.4292 | 15 |
| 11 | 0.4437 | 0.1519 | 0.0403 | 0.6359 | 6 |
| 12 | 0.4604 | 0.1401 | 0.0403 | 0.6408 | 4 |
| 13 | 0.4880 | 0.1331 | 0.0403 | 0.6615 | 2 |
| 14 | 0.1873 | 0.2284 | 0.0403 | 0.4561 | 13 |
| 15 | 0.4604 | 0.1383 | 0.0403 | 0.6390 | 5 |
| 16 | 0.4653 | 0.1185 | 0.0403 | 0.6241 | 7 |
| 17 | 0.4703 | 0.1068 | 0.0403 | 0.6173 | 9 |
| 18 | 0.1685 | 0.1537 | 0.0403 | 0.3626 | 18 |
| 19 | 0.5396 | 0.1422 | 0.0403 | 0.7221 | 1 |
| 20 | 0.3553 | 0.1353 | 0.0403 | 0.5309 | 12 |
| 21 | 0.1694 | 0.1313 | 0.0403 | 0.3410 | 19 |
| 22 | 0.1516 | 0.1289 | 0.0403 | 0.3208 | 20 |
Table 5.
Treatment of wastewater with different catalytic oxidation processes.
| Wastewater Type | Index | Method | Initial Concentration (mg/L) | Removal Efficiency | Reference |
|---|---|---|---|---|---|
| RO concentrate | COD | Catalytic ozonation by Cu-Ce@γ-Al2O3 catalyst | 146.6 | 85.2% | This study |
| RO concentrate | TOC | Catalytic ozonation coupling with activated carbon adsorption | 66 | 58% | [30] |
| RO concentrate | COD | Catalytic ozonation with core/shell Fe3O4@SiO2@Yb2O3 catalyst | 100 (thymol) | 57% | [31] |
| RO concentrate | COD | A hybrid process of Fe-based catalytic ozonation and biodegradation | 108 | 63% | [32] |
| RO concentrate | DOC | Catalytic ozonation by Fe-oxide@Al2O3 catalyst | 30 | 47% | [33] |
| RO concentrate | Rh B | Photocatalytic by Fe-TiO2 mixed-phase nanocomposite thin films | 4.1 | 69% | [34] |
| Coal chemical biochemical tail water | TOC | Catalytic ozonation by Fe-Mn@Bt | 210 | 53.5% | [35] |
Publisher’s Note: MDPI stays neutral with regard to jurisdictional claims in published maps and institutional affiliations. |
© 2022 by the authors. Licensee MDPI, Basel, Switzerland. This article is an open access article distributed under the terms and conditions of the Creative Commons Attribution (CC BY) license (https://creativecommons.org/licenses/by/4.0/).
Share and Cite
MDPI and ACS Style
Sun, W.; Xiao, Z.; Sun, Y.; Ding, L.; Zhou, J. Preparation of Cu-Ce@γ-Al2O3 and Study on Catalytic Ozone Oxidation for the Treatment of RO Concentrate Water. Water 2022, 14, 2881. https://doi.org/10.3390/w14182881
AMA Style
Sun W, Xiao Z, Sun Y, Ding L, Zhou J. Preparation of Cu-Ce@γ-Al2O3 and Study on Catalytic Ozone Oxidation for the Treatment of RO Concentrate Water. Water. 2022; 14(18):2881. https://doi.org/10.3390/w14182881
Chicago/Turabian StyleSun, Wenquan, Zhiqiang Xiao, Yongjun Sun, Lei Ding, and Jun Zhou. 2022. "Preparation of Cu-Ce@γ-Al2O3 and Study on Catalytic Ozone Oxidation for the Treatment of RO Concentrate Water" Water 14, no. 18: 2881. https://doi.org/10.3390/w14182881
Note that from the first issue of 2016, this journal uses article numbers instead of page numbers. See further details here.