
Ecohydrological Variation and Multi-Objective Ecological Water Demand of the Irtysh River Basin

1
School of Hydraulic Engineering, Dalian University of Technology, Dalian 116024, China
2
State Key Laboratory of Simulations and Regulations of Water Cycles in River Basins (SKL-WAC), China Institute of Water Resources and Hydropower Research (IWHR), Beijing 100038, China
*
Author to whom correspondence should be addressed.
Water 2022, 14(18), 2876; https://doi.org/10.3390/w14182876
Submission received: 12 August 2022
/
Revised: 8 September 2022
/
Accepted: 9 September 2022
/
Published: 15 September 2022
(This article belongs to the Special Issue Multi-Objective Water Resources Operations)
Abstract
:Hydrological processes regulate the ecological processes of a basin. Climate change and anthropological activities lead to changes in the natural hydrological process of rivers, whereas variations in hydrological processes can disrupt the stability of ecosystems, resulting in various ecological challenges. Quantitative evaluation of ecological water demand and its key components can play a key role in the sustainable development of ecosystems. The studies of ecohydrological variation and multi-objective ecological water demand are of great significance for ecological protection and remediation due to the unique characteristics of each river basin and diverse ecological protection objectives. This study identified ecohydrological variation in ecosystems, focusing on the Irtysh River Basin as a case study, and improved methods for ecological water demand of valley forests and grasslands in terrestrial ecosystems and for the ecological water level of lake ecosystems. The results demonstrated that: (1) a drastic decrease in the annual average river flow of the basin and significant changes in ecohydrological characteristics can lead to reduced biomass; (2) the ecological water demand of valley forests and grasslands during the critical ecological stage (April–September) was 521 million m³, with 52.4% of total demand occurring in June and July. The minimum ecological water levels of the Burultokay and Jili lakes were 478.66 m and 480.66 m, whereas the maximum levels were 482.80 m and 483.20 m, respectively; (3) ecological regulation based on catchwork irrigation technology can create hydrological processes that meet the water demands of valley forests and grasslands and achieve remediation of the terrestrial ecosystem. The ecological water levels and the ecosystem balance of the Burultokay and Jili lakes can be maintained by optimizing the replenishment flow from the Irtysh River to the Burultokay Lake under different precipitation levels. This study can act as a reference for the ecological protection and remediation of the Irtysh River Basin and similar ecosystems globally.
1. Introduction
The combined effects of climate change and anthropological activities have increased the variation in hydrological processes of various basins [1,2,3], thereby disrupting the ecosystem balance [4,5] and ecosystem communities, causing a decline in community structure and ecological functions and leading to increasingly serious challenges to ecological water use in basins [6,7,8]. The study of hydrological variation and ecological water demand is of great significance for maintaining ecosystems and can act as a key foundation for ecological protection and remediation through water conservancy projects [9,10,11,12]. The concept of ecological water demand was first proposed in the 1940s and can be defined as the provision of the quality and quantity of water to the natural ecological environment needed to minimize changes and protect species diversity and ecological integrity [12]. It has gone through three stages of emergence, promotion and development, and ecohydrological research [13,14], and the introduction of concepts and theoretical approaches to ecological water demand has contributed to the development of ecological water demand research [15,16,17]. Overall, ecological water demand should meet the requirements for gradual improvement in the ecological environment.
Ecological water demand comprises both in-stream and out-of-stream components, and the quantitative evaluation of its key components can play a critical role in achieving the sustainable development of ecosystems [18,19]. A unified research method for studying ecological water demand has not yet been developed due to the variability in characteristics between basins and the diversity of ecological protection objectives. In addition, adapting a single calculation method to different research areas with highly varying characteristics poses a challenge. Recent studies on ecological water demand have mainly focused on meeting in-stream ecological water demand through water conservancy projects [20,21]. The results of these studies have gradually been applied to the remediation and protection of river ecosystems. Baruah et al. [21] applied flow duration curve analysis (FDCA) and flow duration curve (FDC) shift methods to monthly flow data to calculate in-stream ecological flow and computed the flow depth and current speed corresponding to the ecological flow rate using a coupled hydrological and hydrodynamic model. Jiang et al. [22] used three improved dynamic methods to calculate seasonal ecological water demands on runoff. Nikghalb [23] applied the Tennant and Q95 hydrological methods and the PHABSIM model to calculate minimum environmental flow under scarce data. Liu et al. [17] proposed a hydrological-hydrodynamic-habitat model for the classification of ecological water demand of rivers in an arid zone and the study of its key components. Li et al. [24] calculated the ecological water demand of streams related to reservoir regulation required to sustain fish populations. Ma et al. [25] use the improved Tennant method to evaluate ecological water demand and constructed a water quality and quantity coupling model to analyze the effects of a plan to replenish ecological water. The key processes relevant to out-of-stream ecological water demand include vegetation reproduction and growth, ecological lake levels, and the ecological environment. Bo et al. [26] presented an agricultural irrigation intelligent control strategy through introducing spatiotemporal features of ecological water demand to an artificial neural network (ANN) and the radial basis function neural network (RBFNN). Wan et al. [27] calculated the ecological water required to sustain the water quality of Wuliangsu Lake. Ye et al. [28] determined the ecological water demands of Bosten Lake wetlands based on the relationship between the variation in water level and changes in the ecological environment. Wang et al. [29] calculated the ecological water demands for soil and water conservation and for urban public green areas in the Fu River Basin using the quota method. Wu et al. [30] calculated the spatial distribution of ecological water demand in typical inter-peak low-lying areas based on the Penman–Monteith Equation using a geographic information system (GIS) and remote-sensing (RS) technologies. Zhao [31] constructed a model for predicting ecological environment water demand based on big data analysis to reduce the prediction error.
The Irtysh River is a trans-boundary river that originates from the southern slope of the Altai Mountains in northwest China. The Irtysh River joins the Ob River to the northwest, following which it flows into the Arctic Ocean. The middle and lower reaches of the Irtysh River flowing through China are characterized by wide river valleys, winding streams, and annual floods under natural conditions. The unique geographic location, topography, and climate of the basin contribute to diverse ecosystems, mainly including valley forests and grasslands, and the Ulungur Lake ecosystem, which provide unique ecological, economic, and genetic ecosystem services [32]. These ecosystems are relatively independent and collectively act to maintain the balance and stability of the entire basin ecosystem through the hydrological processes of the Irtysh River [33,34]. Groundwater in the basin is recharged through lateral seepage and flood infiltration by the Irtysh River. This process plays an important role in sustaining the reproduction and growth of the valley forests and grasslands. The water level of Ulungur Lake is regulated through the implementation of the Yinejihai Engineering water diversion project, which was constructed to meet the water needs of Ulungur Lake through transferring water from the Irtysh River to the lake. The construction and operation of the upstream water conservancy projects have changed the natural hydrological processes of the basin by reducing stream flow and decreasing the frequency, extent, and duration of flooding. These changes to hydrological processes have resulted in insufficient groundwater replenishment and have had serious impacts on the balance of the valley ecosystem [32]. On the other hand, there remains a lack of understanding of the ecological water level of Ulungur Lake, which contributes to sub-optimal regulation of lake water levels. This sub-optimal lake management can result in the destruction of fish spawning grounds and vegetation succession, leading to the deterioration of the lake environment [35]. Therefore, conducting a systematic study on the multi-objective ecological water demand of the Irtysh River Basin is of great significance for ecological protection and remediation.
The aim of this study was to characterize the ecohydrological variation and ecological water demand of the Irtysh River Basin, and had the following objectives: (1) analyze the ecohydrological variation in the basin before and after the operation of water conservancy projects and its influence on the ecosystem; (2) improve the method for ecological water demands of valley forests and grasslands, and discuss effective measures for ecological remediation; and (3) improve the concepts and methods for ecological lake levels and replenishment flow of the Ulungur Lake under different rainfall conditions. The results of this study can provide theoretical support for the ecological protection and remediation of the Irtysh River Basin and similar ecosystems globally.
2. Study Area and Data Sources
2.1. Study Area
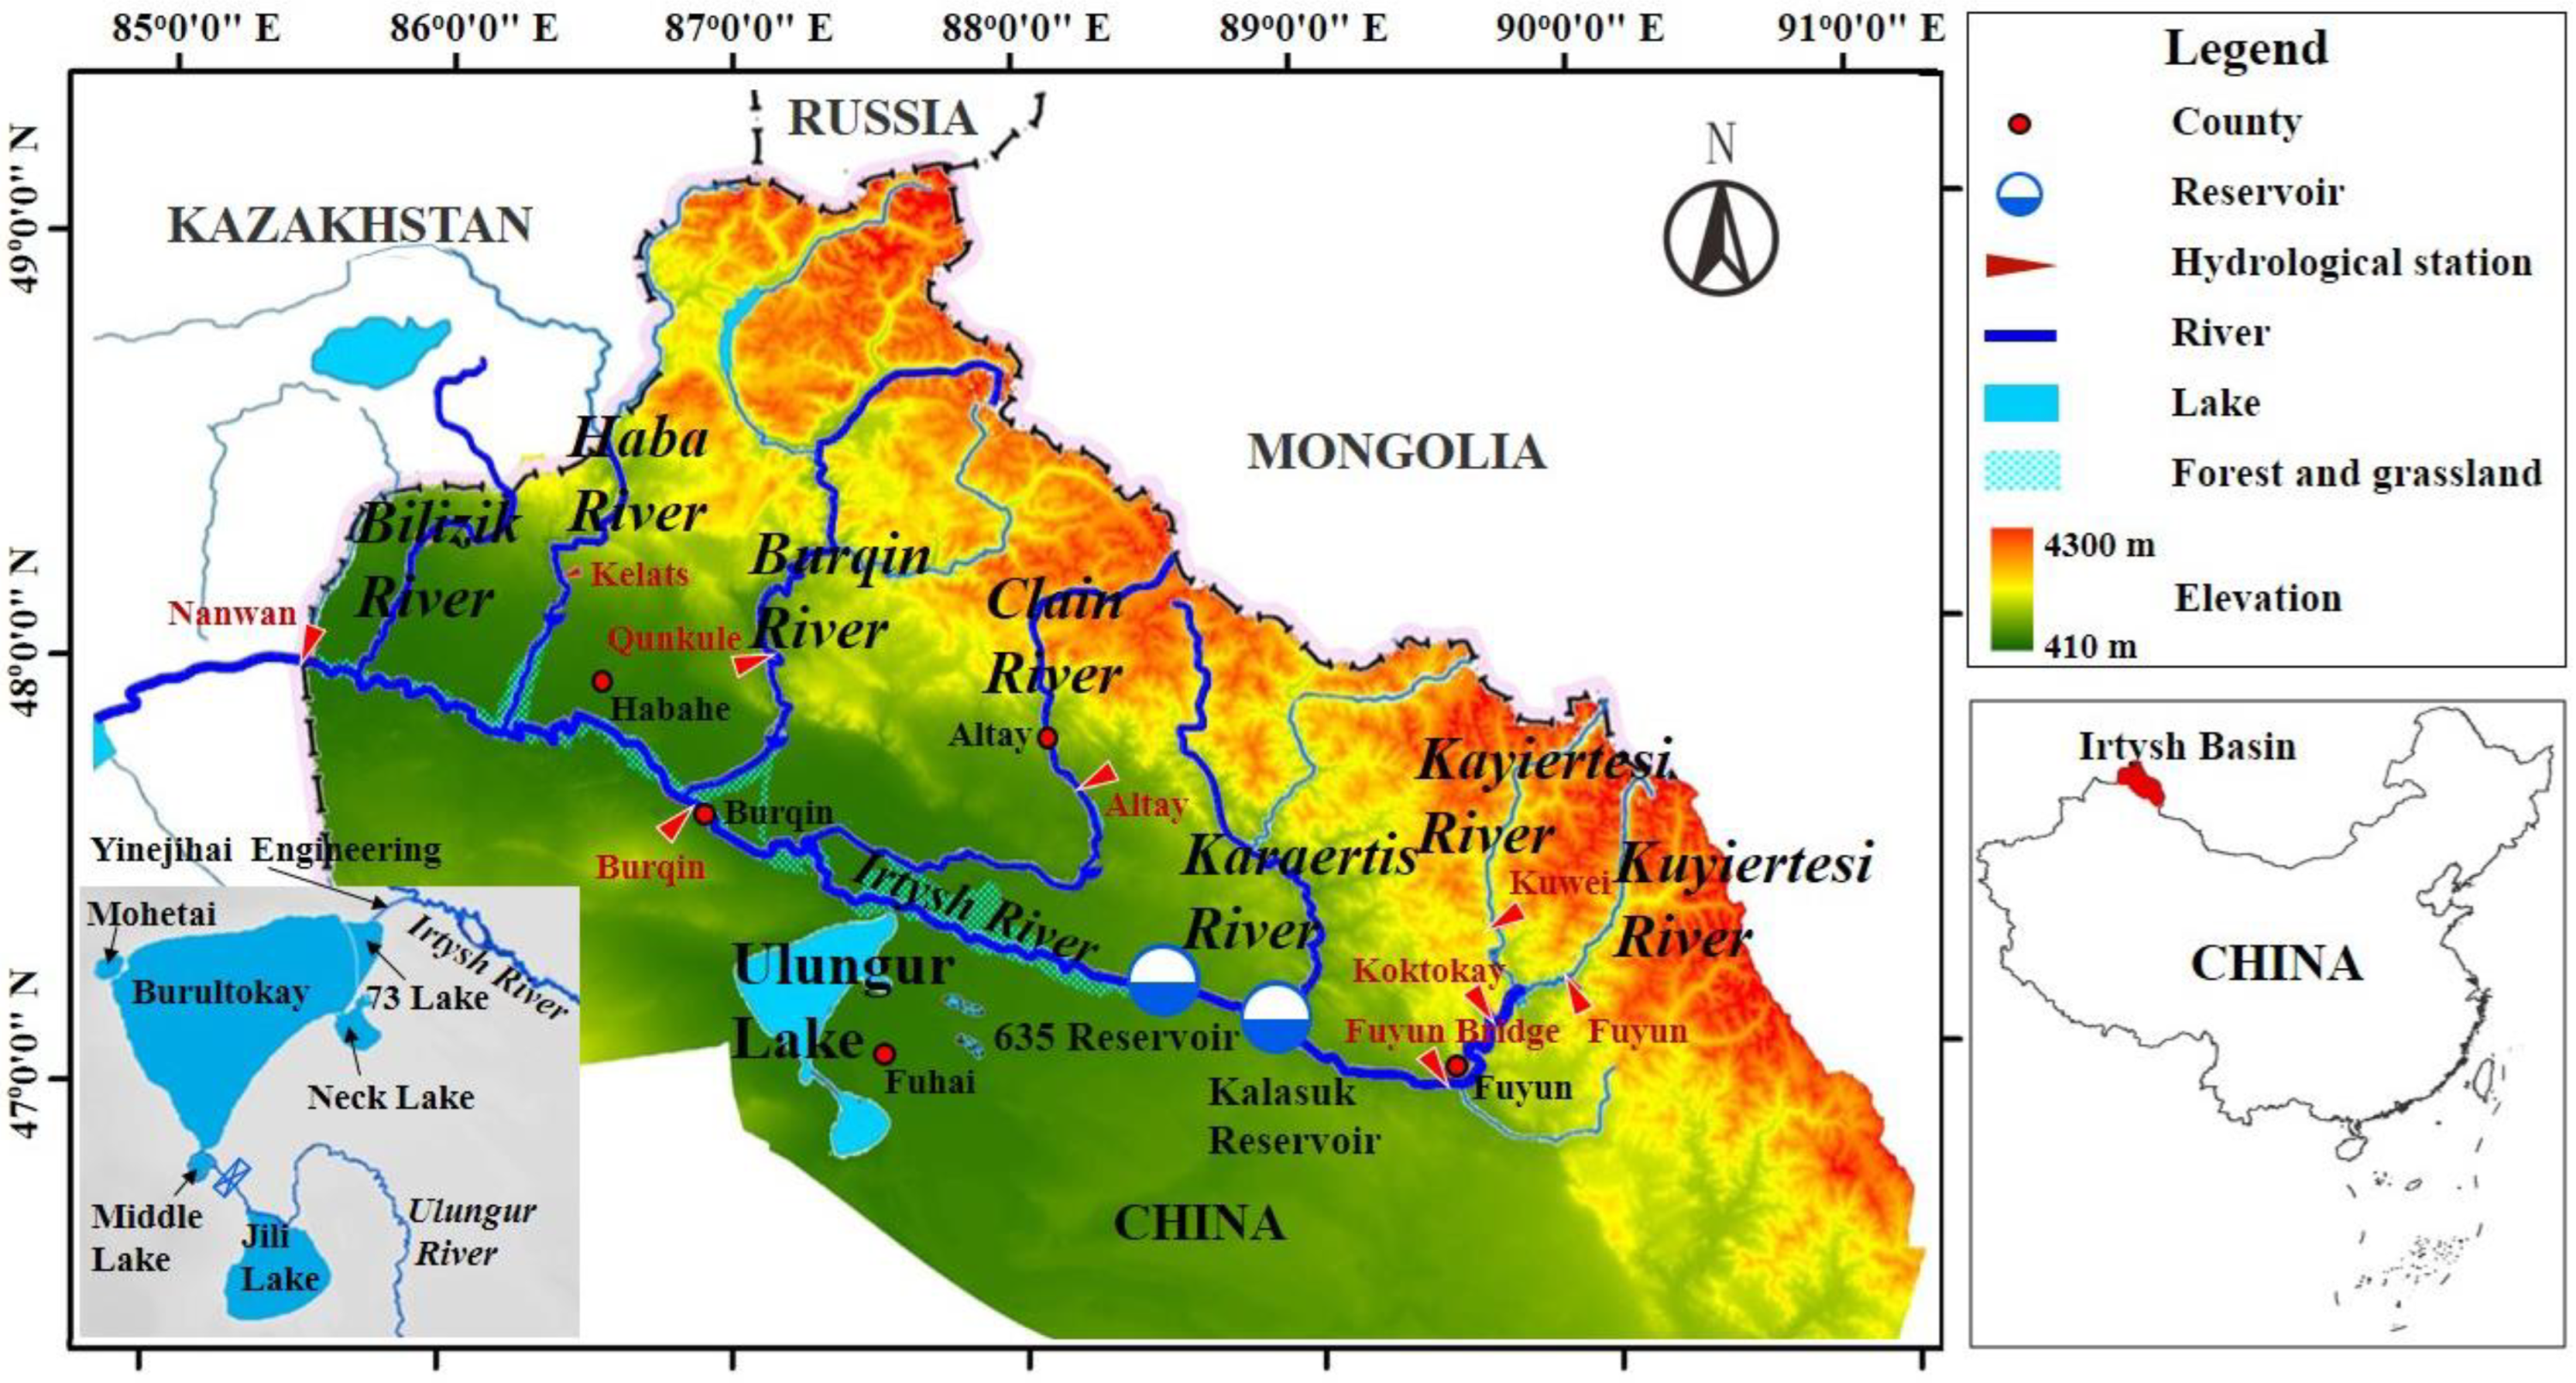
The Irtysh River is the sixth longest river globally (4248 km), with that part flowing through China having a length of 633 km and draining an area of 52,500 km2. The Irtysh River Basin (in China, the same below) has a well-developed river network, with many tributaries joining the mainstem from the right bank. As shown in Figure 1, the main tributaries of the Irtysh River include the Karaertis, Clain, Burqin, and Haba rivers. Two reservoirs, named Kalasuk and 635, have been constructed along the mainstem of the Irtysh River to satisfy water demands for socioeconomic development and the ecological environment. The basin has low precipitation, with an annual average precipitation of ~300 mm, far exceeded by annual average potential evaporation of over 1000 mm. The ecosystems found in the basin include valley forests, grassland, and the aquatic ecosystem of Ulungur Lake. The valley forests and grasslands contain non-zonal vegetation and are mainly distributed in the flooded valley areas on both sides of the main and tributary streams. The total area of forests in the study area is 235.3 km², comprising 107.3 km², 66.0 km² and 62.0 km² of forestland, woodland, and spinney, respectively. The total area of grassland is 840.0 km², comprising 370.0 km², 212.0 km², 104.7 km², and 153.3 km² of meadow grassland, desert grassland, sand grassland, and reed wetland, respectively. The buried depth of groundwater in the Irtysh River Basin is 1–4 m. Flooding of the floodplain during the annual flood season promotes considerable surface water replenishment of groundwater. This flooding process provides an excellent habitat for the growth and reproduction of valley forests and grasslands, forming unique natural landscapes and rich biodiversity, and an associated range of socioeconomic benefits. The Ulungur Lake is recharged from both the Irtysh and Ulungur rivers and consists of two lakes: the low-salinity Burultokay Lake in the north and the freshwater Jili Lake in the south. These two lakes are linked by the Kuyierga River. The Ulungur Lake has clear water and rich fish spawning habitats and acts to stabilize the regional ecological environment. The main spawning grounds of the lake include the Neck, 73, Mohetai, and Middle lakes, with the Middle Lake containing the most important fish spawning ground.
2.2. Data
Two hydrological stations have been constructed along the mainstem of the Irtysh River, namely the Burqin and Nanwan hydrological stations. The Burqin hydrological station is in the middle reaches of the Irtysh River and the flow data collected by this station can reflect hydrological changes in the Irtysh River Basin. The influence of water conservancy projects in the basin are mainly reflected in changes to river flow through regulation by the 635 and Kalasuk reservoirs. Of the two reservoirs, the Kalasuk reservoir was constructed earlier, with water released from the main gate for the first time and the first hydropower generating unit put into operation in 2000. Therefore, this study used flow data from the Burqin hydrological station from 1956 to 1990 to represent basin river flow characteristics under natural conditions, whereas flow data from 2002 to 2015 were used to represent the river flow characteristics under the influence of the water conservancy project. These data were used to analyze the hydrological and ecohydrological changes to the Irtysh River after the operation of the water conservancy project (data from 1991 to 2001 were missing). Due to the position of the meteorological station and available data, this study used meteorological data from 2016 to 2017 and evaporation data from 2008 to 2018 at the Fuhai Station to calculate the ecological water demand of valley forests and grasslands. This study calculated the ecological water level of Ulungur Lake based on historical observation data of the lake collected by the Hydrological Bureau of Xinjiang Uygur Autonomous Region and the Hydrological Bureau of Yellow River Conservancy Commission in 2015, with these data including the water level-capacity-area curve, salinity, and water volume measurements.
3. Methodology
3.1. Analysis of Ecohydrological Change
This study applied Indicators of Hydrologic Alteration (IHA) to characterize the relationship between hydrological processes and the ecological environment using five groups of indicators: (1) the monthly average flow in January–December; (2) the magnitude and duration of annual extreme water conditions represented by the annual maximum and minimum 1-, 3-, 7-, 30-, and 90-day flows and the base flow index; (3) the timing of the annual maximum and minimum 1-day flows; (4) the days and average durations of high and low flows; (5) the mean of all positive and negative differences between consecutive daily values, and the number of hydrologic reversals. The alteration of each indicator was assessed by the Range of Variability Approach (RVA), and the hydrological alteration of each indicator and the improvement in the overall hydrological alteration [36,37] were used to quantify the change in river hydrological processes due to anthropological activities. The hydrological alteration of each indicator was calculated as:
where is the hydrological alteration of the ith IHA, is the number of years during which the indicator falls within the RVA target range after manual intervention, and is the number of years during which the indicator is expected to fall within the RVA target range after manual intervention.
When each IHA has a low alteration,
When at least one indicator has a middle alteration,
where is the alteration of IHA with a middle alteration and is the number of indicators with a middle alteration.
When at least one indicator has a high alteration,
where is the alteration of IHA with a high alteration, and is the number of indicators with a high alteration.
In this method, values of between 0–33%, 33–67%, and 67–100% are considered no or low alteration, middle alteration, and high alteration, respectively [37].
3.2. Calculation of Ecological Water Demand
The ecological water demand of valley forests and grasslands can be calculated based on the reference crop evapotranspiration, ecological water demand coefficient, and area of valley forests and grasslands. In general, vegetation reference crop evapotranspiration can be calculated according to the Penman–Monteith Equation [38] recommended by the Food and Agriculture Organization of the United Nations (FAO). However, the requirement of the Penman–Monteith Equation for a large quantity of meteorological data limits the use of this method for calculating long-sequence reference crop evapotranspiration in many regions with limited data, thereby adversely affecting the reliability of ecological water demand studies [39]. The strong correlation between reference crop evapotranspiration and water surface evaporation [40,41,42] facilitated the determination of a conversion coefficient between the two factors. Consequently, the current study introduced water surface evaporation to compensate for the effects of insufficient data for calculating reference crop evapotranspiration, following which long-sequence reference crop evapotranspiration was calculated based on the observed evaporation data. The short-series meteorological and evaporation data were used to determine the coefficient for converting between reference crop evapotranspiration and water surface evaporation. Long-series reference crop evapotranspiration was then calculated based on the long-series evaporation data. This approach improved the reliability of calculated vegetation ecological water demand. Figure 2 illustrates the sequence of the calculation process.
3.3. Calculation of the Ecological Lake Level
Water-scarcity challenges have contributed to the focus of recent studies on the minimum ecological water levels of lakes [43,44,45]. However, the maximum ecological water level is also important for sustaining the ecosystem of Ulungur Lake. This study used a combination of different methods to calculate the ecological lake level, with this approach offering the possibility of improving the calculation of the ecological water demand of lakes [46,47]. A habitat control method, which combines the lake morphology analysis method and the fish-salinity-water relationship method, along with the highest ecological lake level calculation method, were proposed in the current study to calculate the ecological water level of Ulungur Lake (see Figure 3).
The natural water level data and minimum space requirement methods are commonly used to calculate the minimum ecological lake level. The natural water level data method focuses on the adaptation of the lake ecosystem to the intra- and inter-annual variation in lake level, whereas the natural water level data method adopts the minimum water level over multiple years under natural conditions as the lowest ecological lake level. However, since the natural water level data method requires a long historical data time series, the challenge of insufficient data is often encountered. The minimum space requirement method considers the one-to-one correspondence between the lake water level and the habitat of lake organisms. This method considers the maximum water level required to maintain the diversity of biological communities, while regarding the lowest ecological lake level as the level required to prevent a serious decline in the ecosystem. However, the high diversity of lake organisms poses a challenge to the selection of appropriate indicator organisms within this method. Therefore, the current study proposes a habitat control method by combining the conceptual understanding of both methods. This study determined the lowest ecological lake level to sustain the important spawning ground of Ulungur Lake according to the historical minimum water level.
The lake morphological analysis method [48] was proposed to determine the lowest ecological lake level based on the relationship between hydrology and topography, as well as the water level corresponding to the maximum rate of change in the lake area near the lowest natural water level. Based on the concept behind this method, this study proposed the use of the maximum rate of change in lake area near the highest natural water level for determining the highest ecological lake level, thereby improving the conceptual understanding behind the calculation of the ecological lake level.
The fish-salinity-water relationship method was based on the threshold of salinity, limiting fish survival and reproduction, the lake salinity-water relationship, the capacity-water level relationship based on the accumulation of lake water level and lake salinity, and the lake aquatic ecosystem relationship [49]. The effect of salinization of the Burultokay Lake on fish feeding, survival, and reproduction will be increased due to the historical low-salinity status of the lake. A lake salinity threshold of 5 g/L separates the hypertonic and hypotonic lake salinity statuses. Therefore, the current study used this threshold to set as the upper limit of lake salinity. Since Jili Lake is a freshwater lake, and the upper limit of freshwater lake salinity was set to 1 g/L [50].
The highest minimum ecological water level for Ulungur Lake obtained using the different methods was adopted as the minimum ecological water level. However, the hydraulic connection between the Burultokay and Jili lakes and their differences in salinity will result in backflow of salty water from Burultokay Lake to Jili Lake if the water level of the former exceeds that of the latter. Therefore, there is a need to ensure that the water level of Jili Lake exceeds that of Burultokay Lake to prevent this outcome. The historical water level data indicate that the water level of Jili Lake is at least 2 m higher than that of Burultokay Lake [48]. The maximum ecological water levels of the Burultokay and Jili lakes were determined using the lake morphology analysis method. Similarly, the water level of Jili Lake should be at least 0.4 m higher than that of Burultokay Lake to prevent the backflow of salty water from Burultokay Lake, according to the development plan for ecological protection and sustainable use of resources of Ulungur Lake.
3.4. Calculation of the Ecological Water Demand of Ulungur Lake
The replenishment of the Irtysh River for sustaining the ecological water level of Ulungur Lake was achieved by replenishing Burultokay Lake through the Yinejihai Engineering project and using the regulating gate on the Kuyierga River between Burultokay Lake and Jili Lake to control water exchange between the two lakes. The water balance principle dictates that the ecological replenishment of Ulungur Lake should take into consideration lake water level, evaporation, lake rainfall, and inflow to Ulungur Lake. In addition, the replenishment flow to the lake is regulated to be below the design flow of the Yinejihai Engineering project of 120 m³/s. The equations are as follows:
where W, WB, and WJ are the water demands of Ulungur Lake, Burultokay Lake, and Jili Lake, respectively, E and P are evaporation and rainfall of Ulungur Lake, R is the volume of water from the Ulungur River, Q is the replenishment flow from Irtysh River, and Q’ is the design flow of the Yinejihai Engineering project.
4. Results and Discussions
4.1. Variation in Runoff and Ecohydrological Processes
4.1.1. River Flow Variation
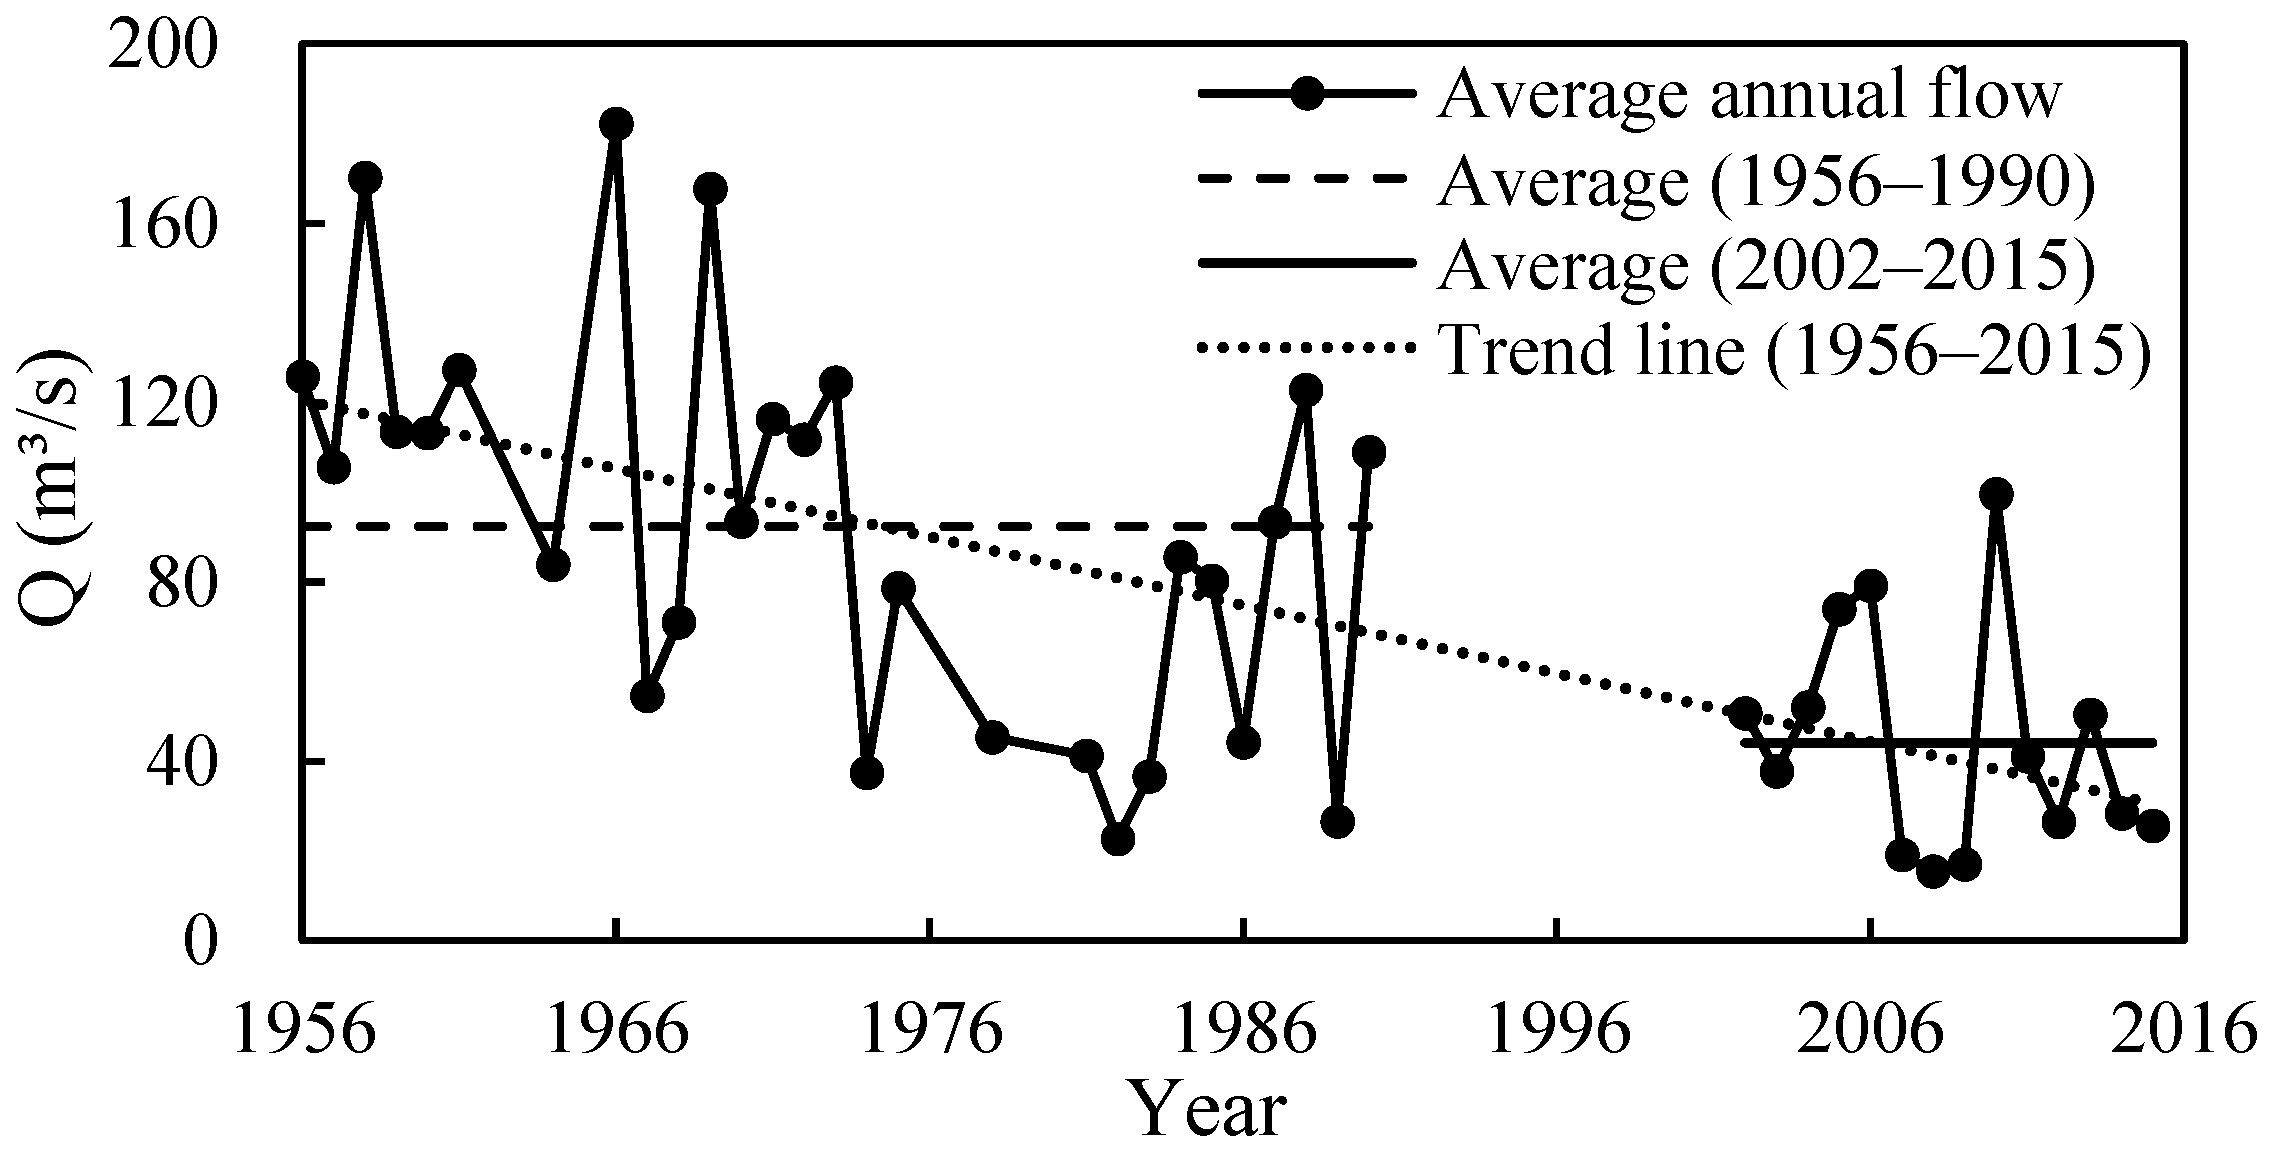
Figure 4 shows the variation in average annual river flow at the Burqin hydrological station on the Irtysh River. The average multi-year flow before the operation of the water conservancy project (1956–1990) was 92.3 m³/s, with an overall decreasing trend. The average multi-year flow from 1956 to 1969 was 120 m³/s, while it was relatively low at 70.7 m³/s from 1970 to 1986, with a minimum of 22.9 m³/s in 1982. There was an increase in river flow between 1987 and 1990, with an average multi-year flow of 87.9 m³/s. The operation of the water conservancy project resulted in a significant decrease in river flow. The results of a Mann–Kendall trend test [51,52] showed a significant decline in river flow (confidence interval = 95%), with a Z = −4.4. The multi-year average flow from 2002 to 2015 was 44.1 m³/s, 26.6 m³/s (37.6%), lower than the historical low water level between 1970 and 1986. In addition, river flow between 2007 and 2009 was lower than the historical minimum annual river flow.
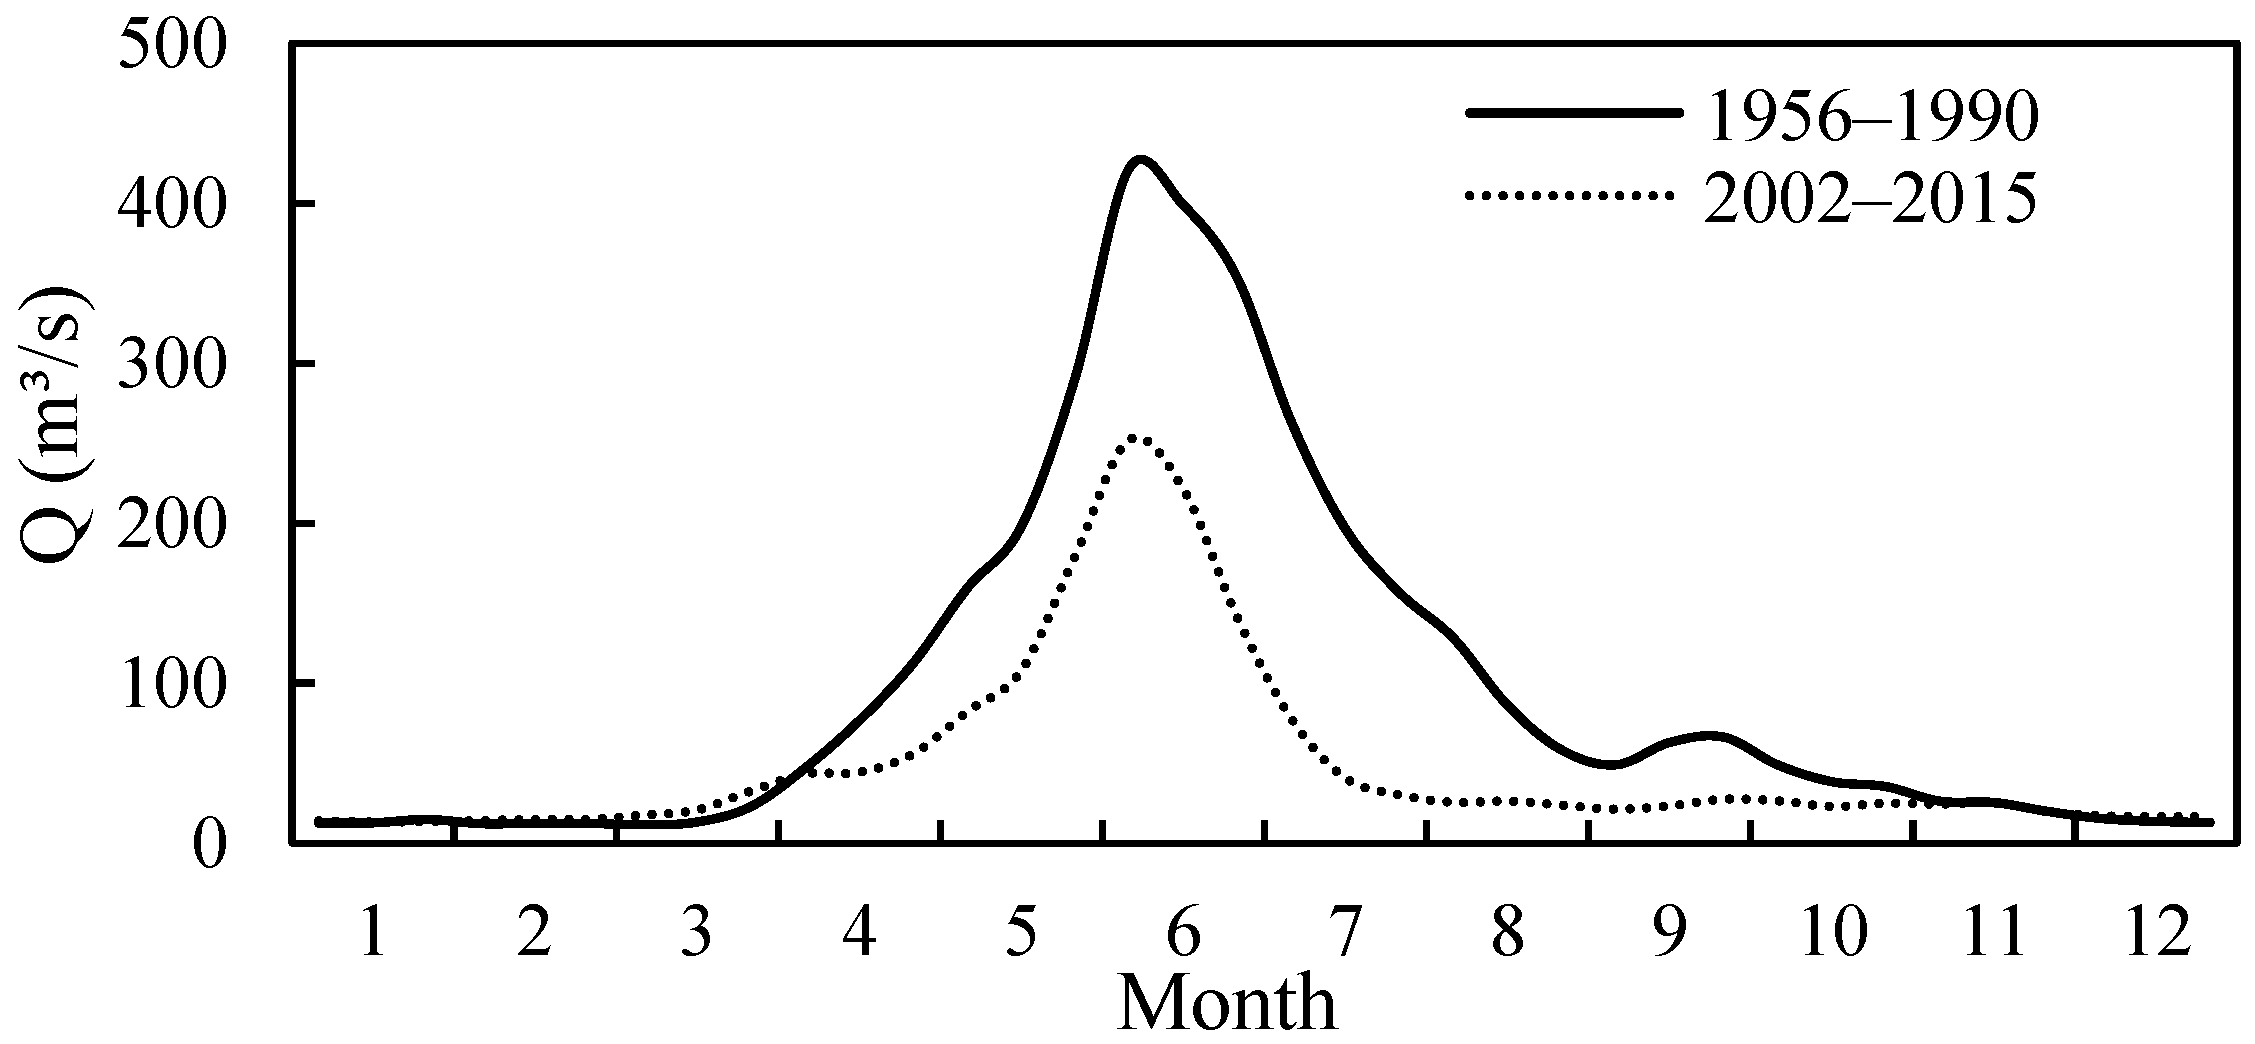
For the intra-annual river flow, there was a clear uneven distribution in the basin. Figure 5 shows the distribution at the Burqin hydrological station before and after the operation of the water conservancy project. The operation of the water conservancy project significantly reduced river flow in June and July, with the river flow decreasing by 193 m³/s (50.5%) and 154 m³/s (79.8%), respectively. Although the water conservancy project resulted in a significant decline the river flow during the flood season, there was a slight increase during the dry season, indicating the flow regulatory role of the water conservancy project.
4.1.2. Ecohydrological Variation
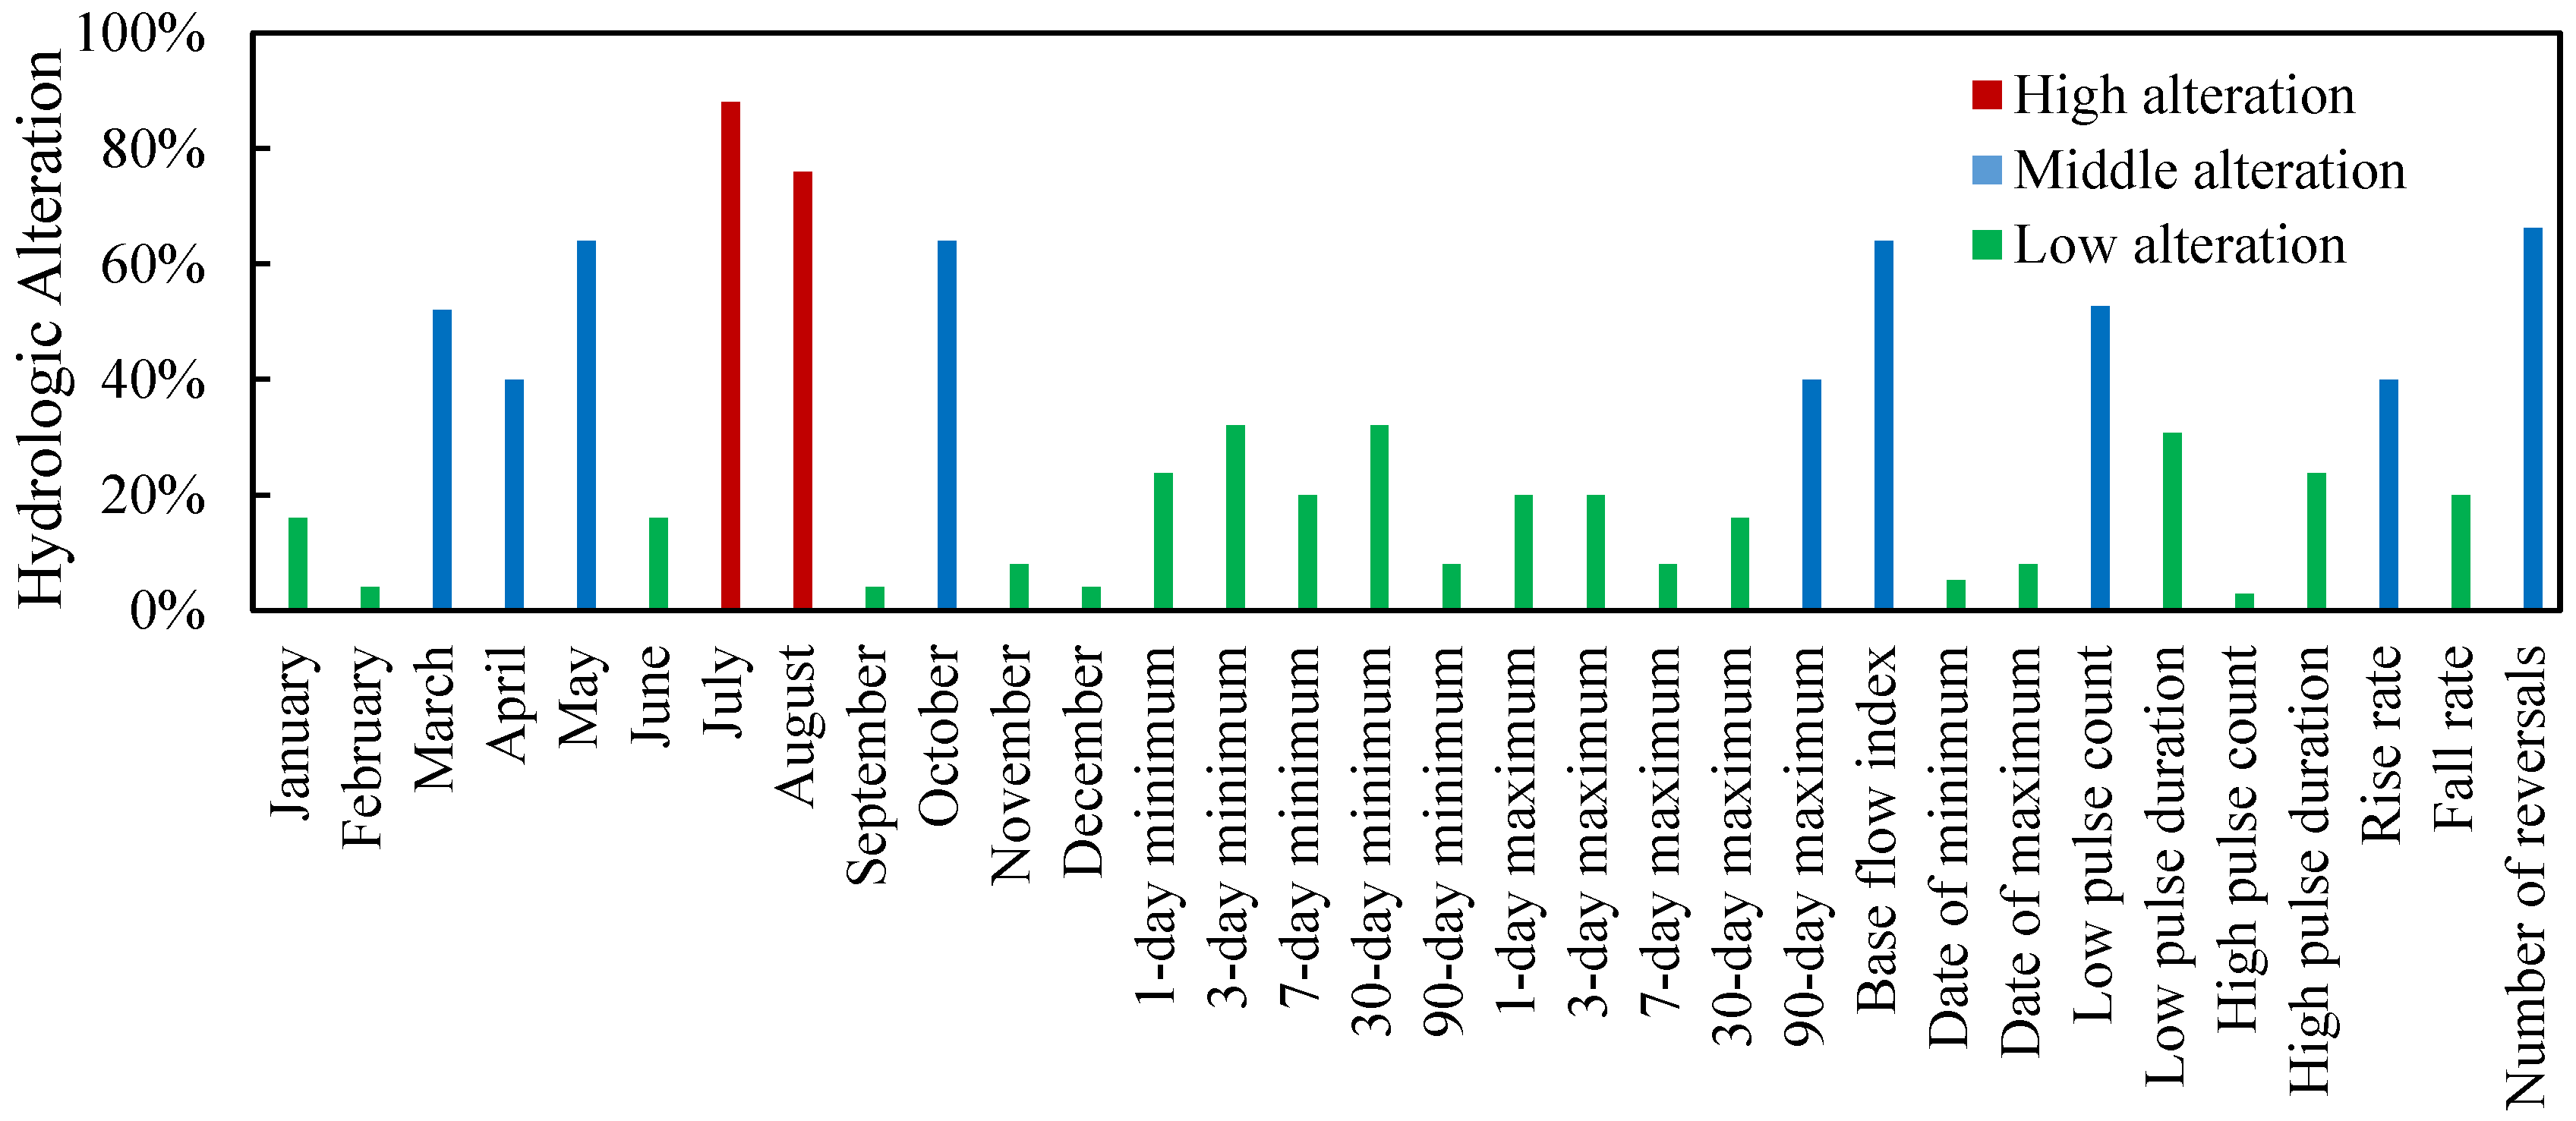
Table 1 and Figure 6 show the hydrological alterations at the Burqin hydrological station. The operation of the water conservancy project resulted in a significant change in monthly average flow, particularly that in July and August, with a high alteration of 88.0% and 76.0%, respectively. There was middle alteration to average flow in March to May and October, with hydrological alterations of 64.0% in both May and October, close to the threshold for high alteration. The water conservancy project resulted in middle–moderate alteration to the frequency of low flows (52.6%), with the frequency increasing slightly and duration decreasing significantly of low flows. The water conservancy had almost no impact on the occurrences of high flows, with a hydrological alteration of only 2.9%, whereas the duration of high flows decreased significantly. Overall, the high alteration in the average flow in June and July indicated a significant change in the flow in the Irtysh River Basin during the flood season. The overall hydrological alteration of 67.9%, which was calculated based on Equation (4), was a high alteration. This result indicates that the operation of the water conservancy project had a significant impact on the ecohydrological characteristics of the river.
4.2. Ecological Water Demand of Forest and Grassland in River Valley
4.2.1. Ecological Water Demand
The water demand of plants is closely related to growth conditions, soil water supply conditions, and other factors. The water demands of valley forests and grasslands drop to zero during winter (November to March) due to weak atmospheric evaporation capacity and snow-covered ground. Therefore, the water demand during the growth period (April to September) was considered in this study.
Correlation analysis indicated an average conversion coefficient between the reference crop evapotranspiration and water surface evaporation at the Fuhai Station between 2016 and 2017 of 0.73. The evaporation data for April to September of 2008 and 2018 allowed the average reference crop evapotranspiration for different periods from 2008 to 2018 to be obtained (Table 2). The average multi-year reference crop evapotranspiration in April and September was 756 mm. Peaks in vegetation evapotranspiration occurred in June and July, with a reference crop evapotranspiration of 327 mm, accounting for 43.5% of total evapotranspiration, and a maximum of 169 mm occurring in June. As shown in Table 3, the ecological water demand during the critical ecological stage could be obtained according to the types and areas of valley forests and grasslands. The total ecological water demand of valley forests and grasslands in April and September was 521 million m³. The water demand of grassland was 399 million m³, with the meadow grassland accounting for the majority (227 million m³). The water demand of forest was 122 million m³, with forestland accounting for the majority (66 million m³). The peak water demands of valley forests and grasslands occurred in June and July at 273 million m³, accounting for 52.4% of the total water demand. Although the maximum vegetation evapotranspiration occurred in June, forests and grasslands were in the flowering and reproduction stage during this period and required less water. In contrast, forests and grasslands entered the peak growth period in July, corresponding with their peak water demand stage at 144 million m³.
4.2.2. Influence of Ecohydrological Variation and Ecological Conservation
The balance and stability of the valley forests and grasslands ecosystems of the Irtysh River are closely related to the hydrological processes of the river. The peak water demands of valley forests and grasslands occur in May and June, coinciding with the flood season. Floodplains not only facilitate the spread of seeds of valley forests, but also meet the water demand of valley forest and grassland growth through groundwater replenishment. The construction of reservoirs has changed the hydrological processes of the Irtysh River, with a high alteration, especially in the flood season. The impoundment of reservoirs has weakened the peak flood flow during the flood season, which has reduced the frequency, intensity, and duration of flooding. Ecological regulation can compensate for or mitigate the resulting ecological issues and is an important non-engineering measure to meet ecological water demand [53,54,55]. The Irtysh River Construction Authority have conducted ecological regulation from 2016 to 2019 based on catchwork irrigation technology. Artificial flood peaks were implemented to facilitate the flooding of floodplains, thereby mitigating the impact of the water conservancy projects on the ecosystem and meeting the water demands for valley forests and grasslands during the growth period.
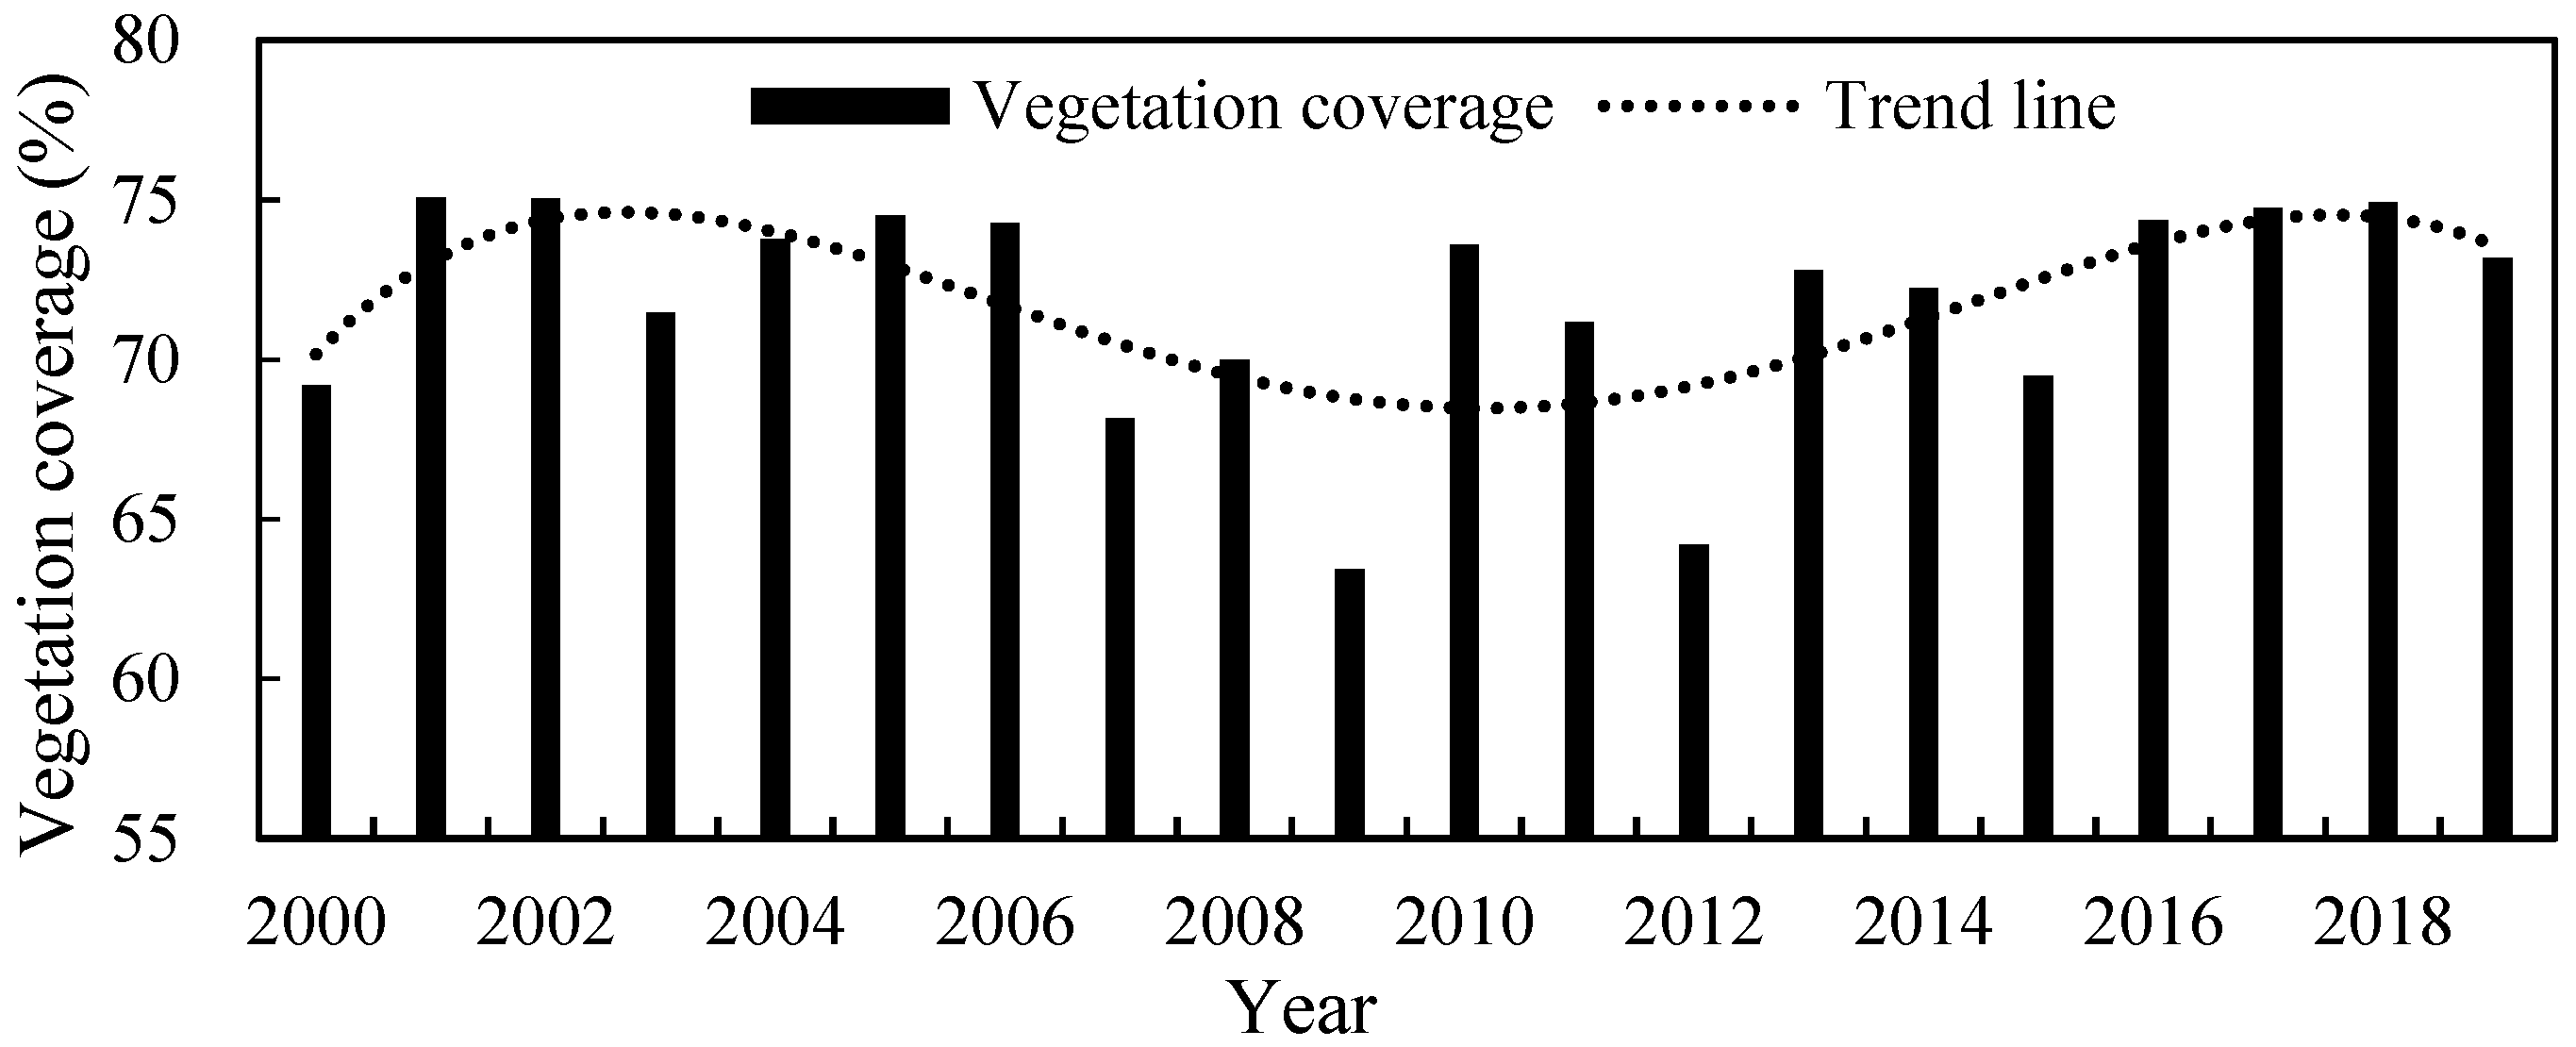
Vegetation coverage and grass yield are effective indicators of the health of the valley forests and grasslands ecosystems and can guide the sustainable development of the livestock industry [56]. Figure 7 shows the vegetation coverage of the study area between 2000 and 2019. Prior to the implementation of ecological regulation, change in hydrological processes resulted in an overall decrease in vegetation coverage. There was relatively low vegetation coverage in 2007 and 2015, with an average coverage of only 69.5%, a reduction of 3.8% compared to that in 2000 and 2006. The lowest vegetation coverage occurred in 2009 at 63.4%. The implementation of ecological regulation resulted in the restoration of vegetation coverage, with vegetation coverage increasing by 4.8% compared with that in 2007 and 2015 and exceeding that in 2000 and 2006, reaching 74.3%. Ecological regulation contributed to the highest vegetation coverage in 2018 of 74.9%. Table 4 shows the growth of pasture in 2013 and 2019. There was an increase in average pasture area, average height, fresh weight, and dry weight compared with that in 2013 and 2015 of 1.5%, 1.5 cm, 6.8%, and 11.3%, respectively. Dry weight is a direct reflection of the ecological and economic values of pasture. The best pasture rehabilitation effect was obtained in 2017, with a dry matter weight of 334.5 thousand kg/km², an increase of 45.0 thousand kg/km² compared with that in 2013 and 2015.
These results showed that the implementation of ecological regulation was successful, thereby providing a reliable means of meeting the water demands of valley forests and grasslands and achieving ecosystem remediation. However, the above analyses did not establish the relationship between ecological water demand and ecological regulation. In addition, water demand was calculated based on E601 evaporating dish data due to the limitations of the test site and data. The use of data collected by evaporation dishes of different sizes can be helpful for improving this analysis [42]. Future research into ecological regulation should also consider ecological water demand of vegetation in the ecological regulation research.
4.3. Ecological Water Level and Demand of the Ulungur Lake
4.3.1. Ecological Water Level
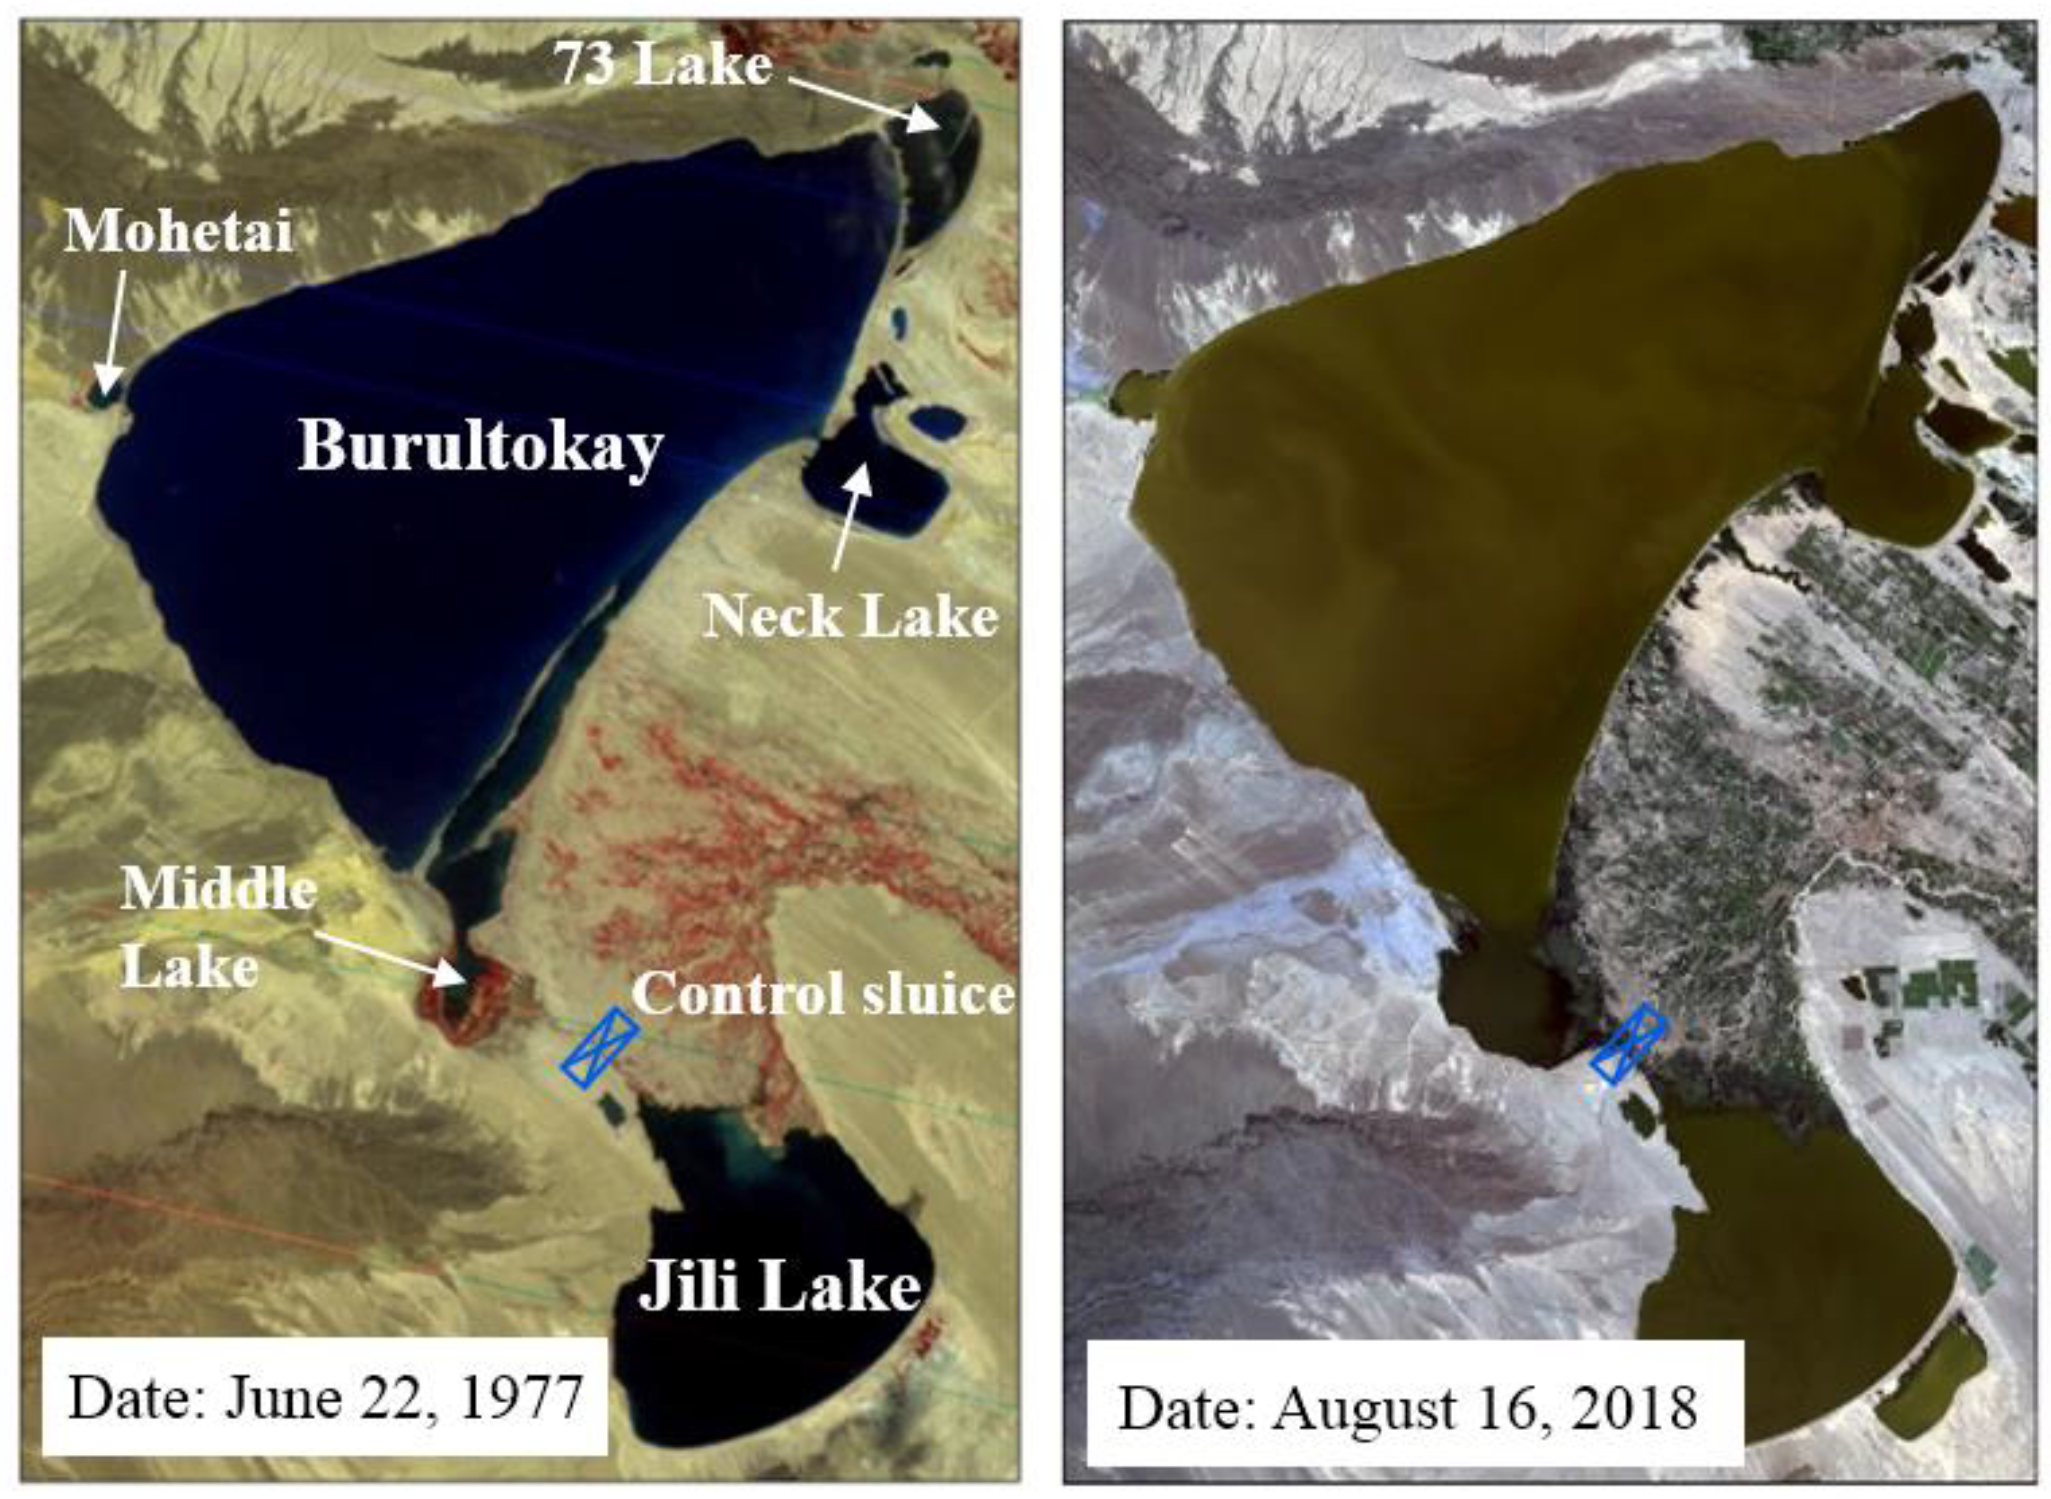
As shown in Table 5, this study calculated the ecological water levels of Ulungur Lake using multiple methods. Combined with the hydraulic connection between the Burultokay and Jili lakes to prevent the backflow of salty water, the minimum ecological water levels of the Burultokay and Jili lakes were 478.66 and 480.66 m, respectively, whereas the maximum ecological water levels were 482.80 and 483.20 m, respectively. These calculations considered minimum ecological water levels for preventing backflow of salty water from Burultokay Lake to Jili Lake. Figure 8 shows the remote sensing images of Ulungur Lake at the lowest and highest ecological water levels. At the lowest water level, there was hydrological separation of the Jili, Mohetai, and Burultokay lakes, whereas the Neck and Burultokay lakes were connected by a narrow channel. During this period, the area of Middle Lake was reduced to less than 33% of its original size, and the width of the channel connecting this lake with Burultokay Lake was reduced to a critical level. A continued drop in water level would seriously affect the ecological function of Middle Lake. The highest water level tended to result in the saturation of the floodplain on both sides of the Middle and Jili lakes, and a further increase in water level led to the loss of the regulating area between the two rivers.
4.3.2. Ecological Water Demand
The threshold of the ecological water level of Burultokay Lake is 478.66–482.80 m, and the historical observation data indicate a minimum water level of 477.00 m. In addition, the basin rarely experiences heavy rainfall since it is in the arid zone of Northwest China. Therefore, this study calculated the ecological water demand and ecological flows of Burultokay Lake at a water level of 477.00 m under three conditions: (1) no rain (daily precipitation [0, 0.1)); (2) light rain (daily precipitation [0.1, 10)); and (3) moderate rain (daily precipitation [10, 25)). The results are shown in Table 6 and Table 7.
In the absence of rain, Burultokay Lake is replenished according to the maximum design flow of the Yinejihai Engineering project of 120 m³/s when its water level drops below 478.40 m. Replenishment is halted when the water level exceeds 483.00 m. Replenishment can be conducted within the range of the minimum and maximum replenishment ecological flows when the water level is between 478.40 m and 483.00 m, according to the water condition of the Irtysh River. For example, replenishment flow is between 53.6 m³/s and 120 m³/when the water level is 478.60 m, whereas it will be between 0 m³/s and 71.2 m³/s when the water level is 482.70 m. Similarly, under the light and moderate rain condition, the lake shall be replenished (flow = 120 m³/s) when the water level of Burultokay Lake drops below 478.00 m and 477.40 m, respectively. The replenishment is halted when the water level exceeds 482.60 m and 482.00 m, respectively. The replenishment can be conducted within the range of the minimum and maximum replenishment ecological flows when the water level is between 478.00–482.60 m and 477.40–482.00 m, according to the water condition of the Irtysh River.
4.3.3. Ecological Conservation
The water quality of lakes is closely related to water level. Maintaining lake water level is beneficial to increasing groundwater outflow, thus avoiding lake salinization [35]. The main challenge facing the ecological conservation of Ulungu Lake is the variation in water quality resulting from the variation in lake water level [57]. Regulating the lake water level to within the range of the ecological water level is important for the ecological protection of lakes [28]. Liang et al. [49] calculated the ecological water deficiency of Ulungu Lake in years of average precipitation frequency. This study calculated replenishment discharge based on different water levels and rainfall conditions, which was more conducive to real-time lake conservation. The Ulungu Lake is mainly replenished by the Ulungu River, and the replenishment of the Irtysh River is regulated by the Yinejihai Engineering project. This study was based on long-term average runoff due to a lack of relevant data and did not consider exchange between lakes and groundwater and the source of fish food in the habitat function. The hydrodynamic model and optical and altimetry data can provide good support for studies on water quality and connectivity of lakes [44,58]. Therefore, future studies can establish the relationship between lake water quality and quantity by considering the response of lake water level to water condition and the food source and water quality requirements of fish. These studies can contribute to the further improvement of lake management.
5. Conclusions
This study analyzed the ecohydrological variation in the Irtysh River Basin under the influence of water conservancy projects, following which the multi-objective ecological water demand and hydrological processes required for protecting and remediating valley forests and grasslands and lake ecosystem were identified. The conclusions are listed below:
- (1)
- There was a significant decreasing trend in the average river flow of the Irtysh River after the operation of water conservancy projects (confidence interval = 95%). Analysis by the IHA/RVA method showed high alterations to the average flows in July and August, as well as significant changes to the basin eco-hydrological characteristics, indicating a change to the balance of the ecosystem and a decrease in biomass.
- (2)
- This study improved the Penman–Monteith Equation for ecological water demand of valley forests and grasslands by considering water surface evaporation, and the improved method was used to calculate the water demands of valley forests and grasslands during the critical ecological stage (April–September). The total ecological water demand of valley forests and grasslands was 521 million m³, of which 273 million m³ (52.4%) was required in June and July. Ecological regulation based on catchwork irrigation technology is an effective means of mitigating the reduction in flood peaks because of water conservancy projects; it can restore hydrological processes to meet the water demand of valley forests and grasslands and is effective for remediating valley forests and grasslands ecosystems.
- (3)
- This study proposed a habitat control method to calculate the minimum ecological lake level and the lake morphology analysis method to calculate the maximum ecological lake level. These innovations can improve the concepts and methods of ecological lake levels. The minimum ecological water levels for the Burultokay and Jili lakes were 478.66 m and 480.66 m, respectively, whereas the maximum ecological water levels were 482.80 m and 483.20 m, respectively. The threshold of ecological replenishment flows of the Irtysh River to Ulungur Lake under different precipitation conditions were determined according to the water balance principle, and these results can be applied to daily lake management.
The results of this study can act as a reference for ecological protection and remediation of the Irtysh River Basin and similar ecosystems globally. Future studies on the relationship between ecological water demand and ecological regulation, water level, and lake water quality are of great significance for developing more detailed guiding strategies.
Author Contributions
Conceptualization, S.Z. and H.W.; methodology, D.W., G.W. and S.Z.; formal analysis and data curation, D.W. and X.C.; writing—original draft preparation, D.W.; writing—review and editing, J.G. and S.Z. All authors have read and agreed to the published version of the manuscript.
Funding
This research was funded by Study on game of environmental flow stakeholders based on river basin water cycle supported by National Natural Science Foundation of China, grant number 52009140.
Institutional Review Board Statement
Not applicable.
Informed Consent Statement
Not applicable.
Data Availability Statement
The initial data for the study and main results may be available upon request to the corresponding author, however, it is with subject to approval from the funding agency.
Acknowledgments
The authors would like to thank all the reviewers who participated in the review.
Conflicts of Interest
The authors declare no conflict of interest. The funders had no role in the design of the study; in the collection, analyses, or interpretation of data; in the writing of the manuscript; or in the decision to publish the results.
References
- Meng, X.; Chang, J.; Wang, X.; Wang, Y. Multi-objective hydropower station operation using an improved cuckoo search algorithm. Energy 2018, 168, 425–439. [Google Scholar] [CrossRef]
- Zhang, Q.; Xu, C.Y.; Zhang, Z.X.; Chen, Y.Q. Changes of atmospheric water vapor budget in the Pearl River basin and possible implications for hydrological cycle. Theor. Appl. Climatol. 2010, 102, 185–195. [Google Scholar] [CrossRef]
- Zhang, R.; Zhang, S.; Xu, W.; Wang, B.; Wang, H. Flow regime of the three outlets on the south bank of Jingjiang River, China: An impact assessment of the Three Gorges Reservoir for 2003–2010. Stoch. Environ. Res. Risk Assess. 2015, 29, 2047–2060. [Google Scholar] [CrossRef]
- Ziegler, A.D.; Sheffield, J.; Maurer, E.P.; Nijssen, B.; Wood, E.F.; Lettenmaier, D.P. Detection of intensification in global and continental-scale hydrological cycles: Temporal scale of evaluation. J. Clim. 2003, 16, 535–547. [Google Scholar] [CrossRef]
- Wang, Y.; Zhang, N.; Wang, D.; Wu, J.; Zhang, X. Investigating the impacts of cascade hydropower development on the natural flow regime in the Yangtze River, China. Sci. Total Environ. 2018, 624, 1187–1194. [Google Scholar] [CrossRef] [PubMed]
- Han, Z.; Di, L.; Fang, Y.; Hou, A.; Hong, Y. Impacts of climate change and human activities on the flow regime of the dammed Lancang River in Southwest China. J. Hydrol. 2019, 570, 96–105. [Google Scholar] [CrossRef]
- Arthington, A.H.; Kennen, J.G.; Stein, E.D.; Webb, J.A. Recent advances in environmental flows science and water management-Innovation in the Anthropocene. Freshw. Biol. 2018, 63, 1022–1034. [Google Scholar] [CrossRef]
- Chen, K.Q.; Tao, J. Research on eco-hydrology of river habitat. Water Resour. Prot. 2015, 31, 52–56. [Google Scholar]
- Li, J.; Zhang, Q.; Chen, X.; Jiang, T. Study of Ecological Instream Flow in Yellow River, Considering the Hydrological Change. Acta Geogr. Sin. 2011, 1, 99–110. [Google Scholar]
- Yan, M.; Fang, G.H.; Dai, L.H.; Tan, Q.F.; Huang, X.F. Optimizing reservoir operation considering downstream ecological demands of water quantity and fluctuation based on IHA parameters. J. Hydrol. 2021, 600, 126647. [Google Scholar] [CrossRef]
- Ai, Y.; Ma, Z.; Xie, X.; Huang, T.; Cheng, H. Optimization of ecological reservoir operation rules for a northern river in China: Balancing ecological and socio-economic water use. Ecol. Indic. 2022, 138, 108822. [Google Scholar] [CrossRef]
- Yu, Y.; Zhao, R.; Zhang, J.; Yang, D.; Zhou, T. Multi-objective game theory optimization for balancing economic, social and ecological benefits in the Three Gorges Reservoir operation. Environ. Res. Lett. 2021, 16, 085007. [Google Scholar] [CrossRef]
- Gleick, P. Water in crisis: Paths to sustainable water use. Ecol. Apppl. 1998, 8, 571–579. [Google Scholar] [CrossRef]
- Fu, Y.; Leng, J.; Zhao, J.; Na, Y.; Zou, Y.; Yu, B.; Fu, G.; Wu, W. Quantitative calculation and optimized applications of ecological flow based on nature-based solutions. J. Hydrol. 2021, 598, 126216. [Google Scholar] [CrossRef]
- Poff, N.L.; Allan, J.D.; Bain, M.B.; Karr, J.R. The natural flow regime-a paradigm for river conservation and restoration. Bioscience 1997, 47, 769–784. [Google Scholar] [CrossRef]
- Poff, N.L.; Richter, B.D.; Arthington, A.H. The ecological limits of hydrologic alteration (ELOHA): A new framework for developing regional environmental flow standards. Freshw. Biol. 2010, 55, 147–170. [Google Scholar] [CrossRef]
- King, J.; Brown, C. Integrated basin flow assessments: Concepts and method development in Africa and South-east Asia. Freshw. Biol. 2010, 55, 127–146. [Google Scholar] [CrossRef]
- Liu, F.; Qin, T.; Yan, D.; Wang, Y.; Dong, B.; Wang, J.; Nie, H.; He, S.; Liu, S. Classification of instream ecological water demand and crucial values in a semi-arid river basin. Sci. Total Environ. 2020, 712, 1–13. [Google Scholar] [CrossRef] [PubMed]
- Gibbs, M.S.; Clarke, K.; Taylor, B. Linking spatial inundation indicators and hydrological modelling to improve assessment of inundation extent. Ecol. Indic. 2016, 60, 1298–1308. [Google Scholar] [CrossRef]
- Yang, Z.; Yu, S.; Chen, H.; She, D. Model for defining environmental flow thresholds of spring flood period using abrupt habitat change analysis. Adv. Water Resour. 2010, 21, 567–574. [Google Scholar]
- Jiang, X.; Zhang, J.; Song, Y.; Lai, Y. Comparative study on the dynamic calculation method of river ecological water demand. IOP Conf. Ser. Earth Environ. Sci. 2020, 569, 012081. [Google Scholar] [CrossRef]
- Baruah, A.; Sarma, A.K. Ecological flow assessment using hydrological and hydrodynamic routing model in Bhogdoi river, India. Model. Earth Syst. Environ. 2021, 7, 2453–2462. [Google Scholar] [CrossRef]
- Nikghalb, S.; Shokoohi, A.; Singh, V.P.; Yu, R. Ecological Regime versus Minimum Environmental Flow: Comparison of Results for a River in a Semi Mediterranean Region. Water Resour. Manag. 2016, 585, 4969–4984. [Google Scholar] [CrossRef]
- Li, Y.; Lin, J.; Liu, Y.; Yao, W.; Zhang, D.; Peng, Q.; Qian, S. Refined operation of cascade reservoirs considering fish ecological demand. J. Hydrol. 2022, 607, 127559. [Google Scholar] [CrossRef]
- Ma, M.; Xiang, L.; Huang, Y.; Gong, H. Water Quality Restoration with Ecological Water Demand Allocation Regulation. IOP Conf. Ser. Earth Environ. Sci. 2020, 585, 012072. [Google Scholar] [CrossRef]
- Bo, Q.; Cheng, W. Intelligent Control of Agricultural Irrigation through Water Demand Prediction Based on Artificial Neural Network. Comput. Intell. Neurosci. 2021, 2021, 7414949. [Google Scholar] [CrossRef] [PubMed]
- Wan, F.; Zhang, F.; Zheng, X.; Xiao, L. Study on ecological water demand and ecological water supplement in Wuliangsuhai Lake. Water 2022, 14, 1262. [Google Scholar] [CrossRef]
- Ye, Z.; Li, W.; Qiu, J.; Aji, D. Investigation of the safety threshold of eco-environmental water demands for the Bosten Lake wetlands, western China. Quat. Int. 2017, 440, 130–136. [Google Scholar] [CrossRef]
- Wang, F.L.; Hu, W. Study on off-stream ecological water demand of fu river basin. Appl. Mech. Mater. 2014, 641–642, 92–96. [Google Scholar] [CrossRef]
- Wu, J.Q.; Guo, J.C.; Tan, J.; Wu, W.; Huang, K.; Bai, Y.; He, L.; Wang, M. Spatial coupling relationship between ecological water demand and landscape pattern in depressions among karst peaks in Guangxi. J. Ecol. Rural Environ. 2017, 33, 800–805. [Google Scholar]
- Zhao, L. Prediction model of ecological environmental water demand based on big data analysis. Environ. Technol. Innov. 2021, 21, 101196. [Google Scholar] [CrossRef]
- Deng, M.; Huang, Q.; Zhang, Y.; Zhang, L. Study on ecological scheduling of multi-scale coupling of reservoir group. J. Hydraul. Eng. 2017, 48, 5–16. [Google Scholar]
- Hayes, D.S.; Brändle, J.M.; Seliger, C.; Zeiringer, B.; Ferreira, T.; Schmutz, S. Advancing towards functional environmental flows for temperate floodplain rivers. Sci. Total Environ. 2018, 633, 1089–1104. [Google Scholar] [CrossRef]
- Fletcher, T.D.; Andrieu, H.; Hamel, P. Understanding, management and modelling of urban hydrology and its consequences for receiving waters: A state of the art. Adv. Water Resour. 2013, 51, 261–279. [Google Scholar] [CrossRef]
- Tong, L.; Liu, Y.; Zhang, S.; Liu, X.; Jia, Q.; Huang, Y.; Ni, G.; Lu, W. Modeling temporal changes in salinity and fluoride concentration of Lake Ulungur in Xinjiang, China. J. Lake Sci. 2022, 34, 134–141. [Google Scholar]
- Richter, B.D.; Baumgartner, J.V.; Braun, D.P.; Powell, J. A spatial assessment of hydrologic alteration within a river network. Regul. Rivers-Res. Manag. 1998, 14, 329–340. [Google Scholar] [CrossRef]
- Shiau, J.T.; Wu, F.C. Compromise programming methodology for determining instream flow under multiobjective water allocation criteria. J. Am. Water Resour. Assoc. 2006, 42, 1179–1191. [Google Scholar] [CrossRef]
- Allen, R.G.; Pruitt, W.O.; Wright, J.L.; Howell, T.A.; Ventura, F.; Snyder, R.; Itenfisu, D.; Steduto, P.; Berengena, J.; Yrisarry, J.B.; et al. A recommendation on standardized surface resistance for hourly calculation of reference ETo by the FAO56 Penman-Monteith method. Agric. Water Manag. 2006, 81, 1–22. [Google Scholar] [CrossRef]
- Fan, J.; Wang, Q.; Hao, M. Estimation of reference crop evapotranspiration by Chinese pan. Trans. CSAE 2006, 22, 14–17. [Google Scholar]
- Chiew, F.H.S.; Kamaladasa, N.K.; Malano, H.M.; Mcmahon, T.A. Penman-Monteith, FAO-24 reference crop evapotranspiration and class-A pan data in Australia. Agr. Water Man. 1995, 28, 9–21. [Google Scholar] [CrossRef]
- Snyder, R.L. Equation for evaporation pan to evapotranspiration conversions. J. Irrig. Drain. Eng. 1992, 118, 977–980. [Google Scholar] [CrossRef]
- Oladele, A.G.; Tunde, A.; Japhet, U.; Busola, A.M. Efficiency of small pan evaporimeter in monitoring evapotranspiration under poly-covered house and open-field conditions in a hot, tropical region of Nigeria. J. Hydrol.-Reg. Stud. 2020, 32, 100735. [Google Scholar]
- Dai, L.; Liu, H.; Li, W.; Tang, Z. Evaluation the ecological water demand of Dongting Lake based on ecological hydrology during the storage period. IOP Conf. Ser. Earth Environ. Sci. 2020, 446, 032105. [Google Scholar] [CrossRef]
- Liu, D.; Wang, X.; Zhang, Y.; Yan, S.; Cui, B.; Yang, Z. A landscape connectivity approach for determining Minimum Ecological Lake level: Implications for lake restoration. Water 2019, 11, 2237. [Google Scholar] [CrossRef]
- Feng, G.; Lin, T.; Guo, H.; Gao, W. New method and application of estimating ecological water level of the Lake Poyang. J. Lake Sci. 2015, 27, 783–790. [Google Scholar] [CrossRef]
- Abbaspour, M.; Nazaridoust, A. Determination of environmental water requirements of Lake Urmia, Iran: An ecological approach. Int. J. Environ. Stud. 2007, 64, 161–169. [Google Scholar] [CrossRef]
- Sajedipour, S.; Zarei, H.; Oryan, S. Estimation of environmental water requirements via an ecological approach: A case study of Bakhtegan Lake, Iran. Ecol. Eng. 2017, 100, 246–255. [Google Scholar] [CrossRef]
- Xu, Z.; Chen, M.; Dong, Z. Researches on the calculation methods of the lowest ecological water level of lake. Acta Ecol. Sin. 2004, 24, 2324–2328. [Google Scholar]
- Liang, L.; Wang, F.; Wang, D.; Wang, H. Research on the lowest ecological water level and ecological water quantity of Ulungur Lake. Adv. Water Sci. 2011, 22, 470–478. [Google Scholar]
- Wang, J.; Wu, J.; Zeng, H.; Long, M. Changes of Water Resources of the Main Lakes in Inner Mongolia. Arid Zone Res. 2015, 32, 7–14. [Google Scholar]
- Mann, H.B. Nonparametric Tests Against Trend. Econometrica 1945, 13, 245–259. [Google Scholar] [CrossRef]
- Kendall, M.G. Rank Correlation Methods; Griffin: London, UK, 1975. [Google Scholar]
- Suen, J.P.; Eheart, J.W. Reservoir management to balance ecosystem and human needs: Incorporating the paradigm of the ecological flow regime. Water Resour. Res. 2006, 42, W03417. [Google Scholar] [CrossRef]
- Zhou, Y.; Guo, S. Incorporating ecological requirement into multipurpose reservoir operating rule curves for adaptation to climate change. J. Hydrol. 2013, 498, 153–164. [Google Scholar] [CrossRef]
- Richter, B.D.; Thomas, G.A. Restoring Environmental Flows by Modifying Dam Operations. Ecol. Soc. 2007, 12, 181–194. [Google Scholar] [CrossRef]
- Deng, M.; HUANG, Q.; Chang, J.; Huang, S. Large-scale ecological operation research and practice. J. Hydraul. Eng. 2020, 51, 757–773. [Google Scholar]
- Wu, J.; Ma, L.; Zeng, H. Water quantity and quality change of Ulungur Lake and its environmental effects. J. Nat. Resour. 2013, 28, 844–853. [Google Scholar]
- Ansper-Toomsalu, A.; Alikas, K.; Nielsen, K.; Tuvikene, L.; Kangro, K. Synergy between Satellite Altimetry and Optical Water Quality Data towards Improved Estimation of Lakes Ecological Status. Remote Sens. 2021, 13, 770. [Google Scholar] [CrossRef]
Figure 1.
Location of Irtysh River Basin in China.

Figure 2.
Process used to calculate ecological water demand. ET0 is the reference crop evapotranspiration, represents the coefficient to convert water surface evaporation to reference crop evapotranspiration, E601 is the water surface evaporation measured by an evaporating dish φ601, ETi is the water requirement quota of different crops, Kt is the ecological water demand coefficient, obtained from the Handbook of Irrigation Technology and related research results, Ai represents the area of vegetation, Wi is the ecological water demand of different vegetation, and W is the total ecological water demand.

Figure 3.
Flow chart of methods used to calculate ecological lake level.

Figure 4.
Change in average annual flow at the Burqin hydrological station.

Figure 5.
Average ten-day river flow at the Burqin hydrological station.

Figure 6.
Indicators of Hydrologic Alteration (IHA) of the Burqin hydrological station.

Figure 7.
Interannual variation in vegetation coverage and grass yield.

Figure 8.
Remote sensing images of Ulungur Lake for two historical periods representing the lowest and highest water levels.
Figure 8.
Remote sensing images of Ulungur Lake for two historical periods representing the lowest and highest water levels.


Table 1.
Indicators of Hydrologic Alteration (IHA) of Burqin hydrological station.
| Indications of HydrologicAlterations | Range of RVA Targets | Mean | D (%) | ||
|---|---|---|---|---|---|
| Lower | Upper | Preconstruction | Postconstruction | ||
| January | 8.7 | 18.0 | 12.3 | 10.7 | 16.0 |
| February | 7.3 | 16.1 | 12.5 | 11.9 | 4.0 |
| March | 7.9 | 18.1 | 13.0 | 19.1 | 52.0 |
| April | 35.4 | 86.4 | 61.9 | 40.7 | 40.0 |
| May | 143.0 | 253.0 | 181.0 | 54.6 | 64.0 |
| June | 144.5 | 512.5 | 408.5 | 166.0 | 16.0 |
| July | 78.8 | 293.0 | 202.0 | 32.3 | 88.0 |
| August | 38.2 | 113.2 | 68.8 | 21.1 | 76.0 |
| September | 20.1 | 83.5 | 48.6 | 20.3 | 4.0 |
| October | 25.0 | 45.3 | 38.1 | 22.1 | 64.0 |
| November | 13.9 | 32.0 | 23.8 | 22.0 | 8.0 |
| December | 8.8 | 18.9 | 12.5 | 16.0 | 4.0 |
| 1-day minimum | 4.9 | 11.2 | 7.5 | 6.7 | 23.8 |
| 3-day minimum | 5.9 | 11.3 | 9.5 | 7.5 | 32.0 |
| 7-day minimum | 6.0 | 11.6 | 9.8 | 7.7 | 20.0 |
| 30-day minimum | 6.8 | 13.6 | 10.3 | 9.6 | 32.0 |
| 90-day minimum | 7.7 | 18.3 | 15.2 | 14.4 | 8.0 |
| 1-day maximum | 328.0 | 778.0 | 632.0 | 448.0 | 20.0 |
| 3-day maximum | 315.3 | 758.3 | 620.3 | 427.3 | 20.0 |
| 7-day maximum | 280.6 | 702.0 | 569.3 | 394.4 | 8.0 |
| 30-day maximum | 199.5 | 539.1 | 477.5 | 245.3 | 16.0 |
| 90-day maximum | 125.8 | 350.6 | 302.8 | 108.8 | 40.0 |
| Base flow index | 0.1 | 0.1 | 0.1 | 0.1 | 64.0 |
| Date of minimum | 51 | 348 | 51 | 117 | 5.3 |
| Date of maximum | 152 | 174 | 161 | 155 | 8.0 |
| Low pulse count | 1 | 3 | 2 | 5 | 52.6 |
| Low pulse duration | 7 | 59 | 16 | 5 | 30.8 |
| High pulse count | 1 | 4 | 3 | 1 | 2.9 |
| High pulse duration | 3 | 52 | 10 | 14 | 23.8 |
| Rise rate | 1.10 | 2.25 | 1.70 | 1.10 | 40.0 |
| Fall rate | −5.80 | −1.10 | −2.10 | −1.35 | 20.0 |
| Number of reversals | 84 | 97 | 91 | 82 | 66.3 |
Table 2.
Annual average reference crop evapotranspiration in the study area for different months between 2008–2018.
Table 2.
Annual average reference crop evapotranspiration in the study area for different months between 2008–2018.
| Reference Crop Evapotranspiration (mm) | ||||||
|---|---|---|---|---|---|---|
| April | May | June | July | August | September | |
| The first ten-day period | 16 | 37 | 56 | 57 | 44 | 36 |
| The second ten-day period | 28 | 49 | 56 | 52 | 41 | 31 |
| The third ten-day period | 33 | 53 | 57 | 49 | 40 | 21 |
| Total | 77 | 139 | 169 | 158 | 125 | 88 |
Table 3.
Ecological water demand of valley forests and grasslands in the study area.
| Month | Ecological Water Demand (million m³) | |||||||
|---|---|---|---|---|---|---|---|---|
| Forestland | Woodland | Spinney | Meadow Grassland | Desert Grassland | Sand Grassland | Reed Wetland | Total | |
| April | 4 | 2 | 2 | 14 | 6 | 2 | 1 | 30 |
| May | 10 | 5 | 4 | 36 | 18 | 4 | 4 | 82 |
| June | 16 | 8 | 6 | 56 | 29 | 6 | 8 | 129 |
| July | 19 | 9 | 6 | 64 | 30 | 7 | 10 | 144 |
| August | 11 | 5 | 4 | 37 | 21 | 5 | 6 | 88 |
| September | 6 | 3 | 2 | 20 | 11 | 3 | 3 | 48 |
| Total | 66 | 32 | 24 | 227 | 115 | 26 | 31 | 521 |
Table 4.
Statistics of grass yield.
| Year | Coverage (%) | Height (cm) | Fresh Matter Weight (thousand kg/km²) | Dry Matter Weight (thousand kg/km²) |
|---|---|---|---|---|
| 2013 | 90 | 52 | 90.9 | 313.5 |
| 2014 | 85 | 55 | 84.3 | 264.0 |
| 2015 | 92 | 49 | 82.4 | 291.0 |
| Average in 2013–2015 | 89 | 52 | 85.9 | 289.5 |
| 2016 | 90 | 55 | 85.7 | 309.0 |
| 2017 | 91 | 54 | 94.7 | 334.5 |
| 2018 | 91 | 53 | 95.0 | 318.0 |
| 2019 | 90 | 52 | 91.4 | 327.0 |
| Average in 2016–2019 | 91 | 53 | 91.7 | 322.1 |
Table 5.
Ecological water levels of Ulungur Lake calculated by different methods.
| The Lowest Ecological Lake Level (m) | The Highest Ecological Lake Level (m) | |||
|---|---|---|---|---|
| Method | Lake morphological analysis | Fish-salinity-water relationship | Habitat control | Lake morphological analysis |
| Burultokay | 469.20 | 475.39 | 478.66 | 483.10 |
| Jili Lake | 467.90 | 477.80 | / | 483.20 |
Note: The symbol of “/” indicates an inapplicable method.
Table 6.
Minimum replenishment ecological flows.
| No Rain | Light Rain | Moderate Rain | |||
|---|---|---|---|---|---|
| Water Level (m) | Flow (m³/s) | Water Level (m) | Flow (m³/s) | Water Level (m³/s) | Flow (m³/s) |
| ≤478.40 | 120 | ≤478.00 | 120 | ≤477.40 | 120 |
| 478.50 | 89.3 | 478.10 | 102 | 477.50 | 117 |
| 478.60 | 53.6 | 478.20 | 67.5 | 477.60 | 82.9 |
| 478.70 | 18.2 | 478.30 | 32.6 | 477.70 | 48.7 |
| ≥478.80 | 0 | 478.40 | 3.62 | 477.80 | 15.1 |
| ≥478.50 | 0 | ≥477.90 | 0 | ||
Table 7.
Maximum replenishment ecological flows.
| No Rain | Light Rain | Moderate Rain | |||
|---|---|---|---|---|---|
| Water Level (m) | Flow (m³/s) | Water Level (m) | Flow (m³/s) | Water Level (m³/s) | Flow (m³/s) |
| ≤482.50 | 120 | ≤482.10 | 120 | ≤481.50 | 120 |
| 482.60 | 104 | 482.20 | 109 | 481.60 | 114 |
| 482.70 | 71.2 | 482.30 | 76.0 | 481.70 | 81.6 |
| 482.80 | 38.1 | 482.40 | 42.9 | 481.80 | 48.9 |
| 482.90 | 4.42 | 482.50 | 12.0 | 481.90 | 17.1 |
| ≥483.00 | 0 | ≥482.60 | 0 | ≥482.00 | 0 |
Publisher’s Note: MDPI stays neutral with regard to jurisdictional claims in published maps and institutional affiliations. |
© 2022 by the authors. Licensee MDPI, Basel, Switzerland. This article is an open access article distributed under the terms and conditions of the Creative Commons Attribution (CC BY) license (https://creativecommons.org/licenses/by/4.0/).
Share and Cite
MDPI and ACS Style
Wang, D.; Zhang, S.; Wang, G.; Gu, J.; Wang, H.; Chen, X. Ecohydrological Variation and Multi-Objective Ecological Water Demand of the Irtysh River Basin. Water 2022, 14, 2876. https://doi.org/10.3390/w14182876
AMA Style
Wang D, Zhang S, Wang G, Gu J, Wang H, Chen X. Ecohydrological Variation and Multi-Objective Ecological Water Demand of the Irtysh River Basin. Water. 2022; 14(18):2876. https://doi.org/10.3390/w14182876
Chicago/Turabian StyleWang, Dan, Shuanghu Zhang, Guoli Wang, Jingjing Gu, Hao Wang, and Xiaoting Chen. 2022. "Ecohydrological Variation and Multi-Objective Ecological Water Demand of the Irtysh River Basin" Water 14, no. 18: 2876. https://doi.org/10.3390/w14182876
Note that from the first issue of 2016, this journal uses article numbers instead of page numbers. See further details here.